Article

The Impact of Regional Socio-Economic Development on Spatial and Temporal Differences in the Distribution Pattern of Top-Tier Education in China

Graduate School, Donghua University, Shanghai 201620, China
*
Author to whom correspondence should be addressed.
Sustainability 2023, 15(21), 15277; https://doi.org/10.3390/su152115277
Submission received: 28 June 2023 / Revised: 13 October 2023 / Accepted: 13 October 2023 / Published: 25 October 2023

Abstract

:
Regional socio-economics has multiple and far-reaching influences on the development of top-tier education, and the development of top-tier education also represents the strength and level of the regional socio-economics to a large extent. The present study investigates the spatial and temporal differences in the distribution pattern of doctoral disciplines of Chinese “double first-class” construction universities between 1996 and 2022 and the influence of regional socio-economics through two perspectives of economic regions and provinces. The study shows that there are differences in the development speed, scale, and level of top-tier education among different economic divisions and provinces, and the overall pattern of “fast in the east and slow in the west”, “more in the east and less in the west”, and “strong in the east and weak in the west” is unbalanced. At the same time, there is a high degree of concentration in different economic regions. The main reasons include the historical problem of the unbalanced allocation of China’s educational resources, as well as the uneven geographical distribution of relevant national policies, and the influence of regional socio-economic development differences, especially GDP and literacy rate. In terms of the influence mechanism, the development mindset of universities themselves, especially the strategy for talent cultivation and introduction, is the fundamental factor for the formation of the top-tier education development gap among different economic regions and provinces.

1. Introduction

In recent years, with the continuous, stable, and rapid development of China’s comprehensive national power, various regions have gradually developed distinctive regional economic, demographic, and cultural characteristics due to different natural, technological, economic, sociopolitical, and geographical factors, whose development has directly affected the progress of China’s high-quality development.
The main functions of higher education include personnel training, scientific research, social services, etc. The status and role of higher education in the social economy, especially in regional economies, are becoming more and more important, and it can be said that serving economic and social development is the starting point of higher education and its ultimate destination. Therefore, the strength and level of higher education in a region largely represents the strength and level of social economy in the region, and the two support each other. In the social context of China’s implementation of an innovation-driven development strategy, it is necessary to further explore the complex relationship between higher education and economic, social, and cultural factors.
The development of “double first-class” universities, which combine first-class universities and disciplines, are a major strategic decision made by the Central Committee of the Communist Party of China and the State Council for the key construction of higher education in the new era. This is one of the important achievements of China’s higher education reform, representing China’s top educational resources and academic strength. On February 14, 2022, the Ministry of Education of China, the Ministry of Finance, and the National Development and Reform Commission of China announced the list of the second round of “double first-class” universities and disciplines, consisting of 147 “double first-class” universities. These universities bring together the best faculty and students, from home and abroad, and have top academic standards, world-class research achievements, and an internationally influenced cultural atmosphere, which not only cultivate a large number of excellent talents for China, but also showcase China’s higher education level and academic strength globally. Therefore, China’s “double first-class” universities can represent the top level of China’s higher education in terms of educational level and academic strength. According to a study, first-class doctoral degree disciplines (hereinafter referred to as “doctoral disciplines “) are concentrated in “double first-class” universities [1]. As of 2022, the average density of doctoral disciplines in “double first-class” universities is 3.8 times of that in non-“double first-class” universities. The average density of doctoral disciplines in “double first-class” construction universities equals 2605 total doctoral disciplines in “double first-class” construction universities/147 total doctoral disciplines in “double first-class” construction universities (excluding military institutions), and the density value of doctoral disciplines in non-”double first-class” construction universities equals 1391 total doctoral disciplines in non-”double first-class” construction universities/293 total doctoral disciplines in non-”double first-class” construction universities (excluding military institutions). The source of data is statistics on the official website of the Ministry of Education. Therefore, the quantity and quality of doctoral disciplines in “double first-class” universities can be used as the explicit data of top-tier education in China.
Although there have been some studies on the relationship between Chinese higher education and regional socio-economics, there have been no reports focusing on the top-tier education represented by the “double first-class”. For the research on “double first-class”, since it is a new term born in China after 2015, the relevant research mainly focuses on the key factors and development orientation of the construction of the “double first-class” [2], case studies on “double first-class” universities from the perspective of talent cultivation mode and reform initiatives [3], and the gap analysis of the Chinese universities failing to enter the “double first-class” [4]; there is also a comparative study between the “double first-class” and foreign discipline construction methods [5]. Therefore, one of the innovations of this article is to perform an in-depth investigation of the spatial and temporal distributions of “double first-class” disciplines in the country, which is a brand-new perspective and a new way to show the development of higher education and regional socio-economics. The research on the influence of socio-economic factors on higher education in China have focused on the qualitative spatial distribution [6] and analyses of influencing factors [7], as well as on the temporal evolution of the number of general institutions of higher education prior to the emergence of the “double first-class” [8]. However, the temporal and spatial distribution of regional socio-economic impacts on top-tier education based on a quantitative analysis has not yet been reported, which reflects the second innovation of this article, namely new methodologies and perspectives that unite quantitative and qualitative analyses.
This article investigates the development of China’s “double first-class” universities’ doctoral disciplines over time by examining the regional layout of the quantity and quality of China’s “double first-class” universities’ doctoral disciplines and exploring the influence of regional socio-economic development factors such as the economy, population, and culture on the development trend of China’s top-tier education and its extent. The present study aims to address the following questions:
Research Question 1: How has the development of the “double first-class” universities’ doctoral disciplines, which best represent China’s top-tier education, evolved in recent years?
Research Question 2: What are the differences in the spatial–temporal distribution pattern of doctoral disciplines in “double first-class” universities among different regions?
Research Question 3: What are the interactions and dependencies between these differences and the development of the regional economy and society?
This article is organized into six sections. The first section presents the introduction, providing the context and objectives of the study. The second section is a literature review, which provides an introduction to the higher education system in China and the connotation of “double first-class”, the interplay between regional socio-economic development and higher education, as well as the research on the distribution pattern of higher education disciplines. The third section presents the methodology, providing an overview of the study area and the data collection and analysis methods. The fourth sections detail the research results, which analyze the dynamic changes and spatial distribution pattern of the number of doctoral disciplines in “double first-class” universities, as well as the spatial distribution differences in the quality of doctoral disciplines in “double first-class” universities; the influence of regional socio-economic development factors on the number of doctoral disciplines in different types of “double first-class” universities and the extent of their influence is also investigated. The fifth section is the discussion, which explores the spatial and temporal distribution patterns of doctoral disciplines and their formation mechanism, as well as the mechanism of regional socio-economic influences on top-tier education and its response. The sixth section contains the conclusion, which summarizes the study and puts forward three recommendations for relevant policies based on the research results and details the shortcomings of the study and the research outlook.
This study fills the gap of quantitative research on the influence of socio-economic factors on the temporal changes in top-tier education in China and provides a reference and basis for the coordinated allocation of resources and sustainable development of China’s top-tier education. More importantly, it can provide a typical case for the development of higher education and improvement of higher education quality for all countries in the world, so as to highlight the value of human cooperation in promoting the modern development of higher education.

2. The Literature Review

2.1. Studies on the Higher Education System in China and the Connotation of “Double First-Class”

In China, higher education refers to education implemented on the basis of the completion of higher secondary education, and it is the level of education that fosters senior specialists with a sense of social responsibility, spirit of innovation, and practical ability. Chinese higher education is divided into four levels: specialist, undergraduate, master’s, and doctoral, of which the specialist level does not confer a degree, while the other three levels confer bachelor’s, master’s, and doctoral degrees, respectively. The formation of the higher education system with Chinese characteristics is a process of historical evolution; it is derived from the Western modern higher education model with China’s own unique contribution. The changing environment is the driving force for the continuous development of the higher education system in China, which strives to adapt to the needs of the environment [9]. A country’s higher education system needs to be strongly supported by a first-class university community, and the level and quality of the first-class university community determines the level and quality of the higher education system. “Double first-class” became a new term in China in 2015, a major strategic decision made by the central government, and another national strategy for China’s higher education sector following the “211 Project” and “985 Project”. On 28 November 2019, the official website of China’s Ministry of Education stated that the key construction projects such as the “211 Project” and the “985 Project” have been integrated into the “double first-class” project. At the core of the “double first-class” is the construction of first-class disciplines, i.e., the aggregation of top academic leaders and high-level academic teams, sufficient academic funding, advanced scientific research equipment, open and orderly power mechanisms, collaborative competition, and innovation mechanisms, as well as outstanding academic output and outstanding quality of talent training [10]. The construction of the “double first-class” is a leapfrog development in China’s higher education development strategy as a post-haircut country; it consists of a synergistic process of promoting universities and disciplines in an integrated manner, which is an innovative move to seek competitiveness from distinctive advantages and creates a holistic system of organic linkages between multiple elements [11].

2.2. Studies on the Impact of Regional Socio-Economic Development on Higher Education

From the historical process of international higher education modernization, the evolution of the spatial layout structure of universities is subject to the joint constraints of regional politics, economy, and culture, and the universities’ own traditions and other factors. For example, due to the economic development and national demand for higher education, the high-quality higher education resources in the United States are mainly concentrated in the northeast region, with New York as the core, and the western region, represented by California. Due to the regional economic, scientific, and technological development, the high-quality higher education resources in France are mainly concentrated in Paris, Lyon, Nantes, and other cities and regions with developed industries, commerce, and science and technology, and profound historical and cultural traditions [12]. Tang et al. [13] concluded that economic development in different areas has a strong promotion effect on higher education. Wang [8] studied the evolution of the spatial distribution pattern of higher education institutions in China from 1984 to 2019, and concluded that socio-economic factors, especially GDP and population, have the greatest influence on the development of higher education. Liu [14] argued that historical foundation, cultural tradition, and population quality have an important influence on the evolution of the spatial layout of higher education. Hu [15] believed that the level of regional economic development directly affects the investment of society, government, and individuals in higher education, which, in turn, affects and restricts the structure and development of higher education. Wang et al. [16] believed that the development of regional economy is conducive to improving the quality of higher education, which is also an important support for enabling scientific and technological innovation. Xie [17] pointed out that the development of the local economy determines the investment and layout of higher education and also affects the employment of college graduates. Xu et al. [18] concluded that economic transformation and industrial upgrading drive further structural reforms in higher education. In addition, many scholars have also paid attention to the interaction between regional socio-economic development and higher education [19]. For example, Yang et al. [20] found that regional economic development is the primary determinant of regional higher education development, providing a material basis for regional higher education development by restricting the scale, speed, and structure of regional higher education development; at the same time, regional higher education development affects the regional economy, and regional higher education can achieve sustainable development only by adapting to the development requirements of regional economy. Yang [21] believed that regional economy provides scientific research money for graduate education, and graduate education provides high-level talents and technical support for regional economic development. In general, various studies have conducted relatively extensive research on the influence of regional socio-economic development on higher education. There have also been in-depth studies on the interaction between the two and the influencing factors have been described. However, the exploration of the specific mechanisms mediating these interactions is still insufficient.

2.3. The Socio-Economic Impact of Higher Education

In recent years, with the increasing scale of higher education, its contribution to economic growth has begun to attract widespread scholarly attention. Wintel et al. [22] argued that graduate education focuses on developing critical thinking and fostering innovation in the creation of a stable economic process at the level of providing students with advanced knowledge and skills. Schultz [23] argued that educational human capital performs its economic function mainly by increasing the labor productivity of educated people. Chellaraj et al. [24] analyzed the contribution of international graduate students to innovation in the United States. Filippetti et al. [25] controlled for the size of graduate education as a sub-indicator of human capital. Valero et al. [26] found that colleges and universities provide higher levels of human capital locally and promote scientific and technological activity, acting as a mediating mechanism for the direct and spillover effects of economic growth. Johansen et al. [27] concluded that the development of higher education can raise the level of human capital, which, in turn, contributes to the long-term improvement of the level of regional economic development. Emilia et al. [28] investigated the impact of funding levels for higher education on the socio-economic environment. Rolf et al. [29] explored the total (measured and unmeasured) impact of education on some of the main socio-economic outcomes (i.e., employment opportunities, job security, and wages) among school leavers who finished upper secondary or tertiary education in the Netherlands. Other scholars have shown that the importance of higher education for economics mainly stems from its ability to create and/or accumulate human capital and increase the aggregate productivity level of the economy [30,31,32]. Li et al. [33] analyzed the impact of postgraduate education on the economic growth measured by unit labor output and showed that postgraduate education can promote economic growth through multiple approaches, and that an effective approach is to indirectly promote economic growth by means of boosting innovative capacity. Li et al. [34] introduced time trends into the nonlinear regression model of panel data from 30 provinces in China to quantitatively analyze whether and how postgraduate education can effectively promote local economic growth and found that postgraduate education not only has a direct positive effect on economic growth, but also an indirect positive effect through technological innovation. In addition, a few scholars have explored the contribution of graduate education to economic growth in China. Huang et al. [35] analyzed the impact of graduate education on economic growth using a provincial panel data from 1996 to 2009 in China and found that graduate education has a significant positive impact on economic growth. Li et al. [36] calculated the contribution value and rate of postgraduate education to regional economic growth and found that they are quite different between different regions of China. In general, the influence of regional socio-economic development on higher education is complex and diverse; higher education is affected by regional political factors, such as government investment, employment opportunities, research platforms, research funding, etc., and also by the regional economy, such as GDP, per capita GDP, etc., in addition to the regional culture, including cultural traditions, historical foundations, the quality of the population. In addition, the size of the population also has a certain impact on higher education. Overall, studies have shown a positive contribution of higher education to economic growth and explored the related mechanisms, but most of them have been analyzed from a directional perspective or involved a quantitative analysis of a single factor and there are fewer comprehensive quantitative analyses of multiple factors.

2.4. Studies on the Distribution Pattern of Higher Education Disciplines

In recent years, research on the distribution of higher education disciplines has also attracted extensive attention from scholars. In the study of foreign discipline distribution, Qian [37] studied the common patterns of three levels of college discipline settings in several well-known American universities and made specific suggestions for reforming the discipline classification in China. Wang et al. [38] explored the discipline distributions and characteristics of 12 world-class universities, which are divided into traditional comprehensive universities, polytechnics developed from single-subject technical colleges, and full-service universities. Based on the classification of discipline functions and attributes, Wu [39] took 10 top global young universities as case studies and analyzed them from the perspectives of layout structure, development model, strategy characteristics, and performance, which reflect the academic strategy that these universities used to realize leapfrog development. In addition, there are also comparative studies on the distribution of disciplines in foreign countries and China; for example, Shen et al. [40] discussed the level and distribution of 29 first-class universities in China and the United States and found that American universities pay more attention to the construction of basic disciplines and the trend of comprehensive disciplines is obvious. Based on the systematic analysis of the discipline distribution of the two rounds of “double first-class” construction, Liu et al. [41] analyzed the general situation, main characteristics, and problems of the discipline distribution in “double first-class” universities and provided corresponding measures for the next optimization path. Zou et al. [42] analyzed the number, types, and construction cycles of disciplines in the construction programs of 28 provinces and reflected on how to further promote the construction of “double first-class” universities effectively by combining policies and specific practices. Song et al. [43] explored the discipline distribution of 42 first-class university universities in China through quantitative analysis and made suggestions for future discipline construction. Li et al. [44] measured and explained the macro quality of higher education in each province of China using the weighting method and the university ranking of major Chinese institutions as the basic data and pointed out that the development and implementation of preferential talent introduction policies is the key to improving the quality of higher education and narrowing the gap in educational development. Gao et al. [45] conducted a multidimensional analysis of the distribution structure of doctoral disciplines in Chinese universities and pointed out that the problem of regional imbalances in the distribution of doctoral disciplines is serious. Yu et al. [46] analyzed the growth differences in the Doctoral Degree Authorization System between 31 regions in China using the longitudinal data analysis method. However, on the whole, most of the studies on the discipline distribution of higher education in China are limited to the analysis of the current situation, but there are relatively few studies on the changes over time and the relevant studies are limited to ten years ago, especially for the changes in the distribution in time and space.

3. Materials and Methods
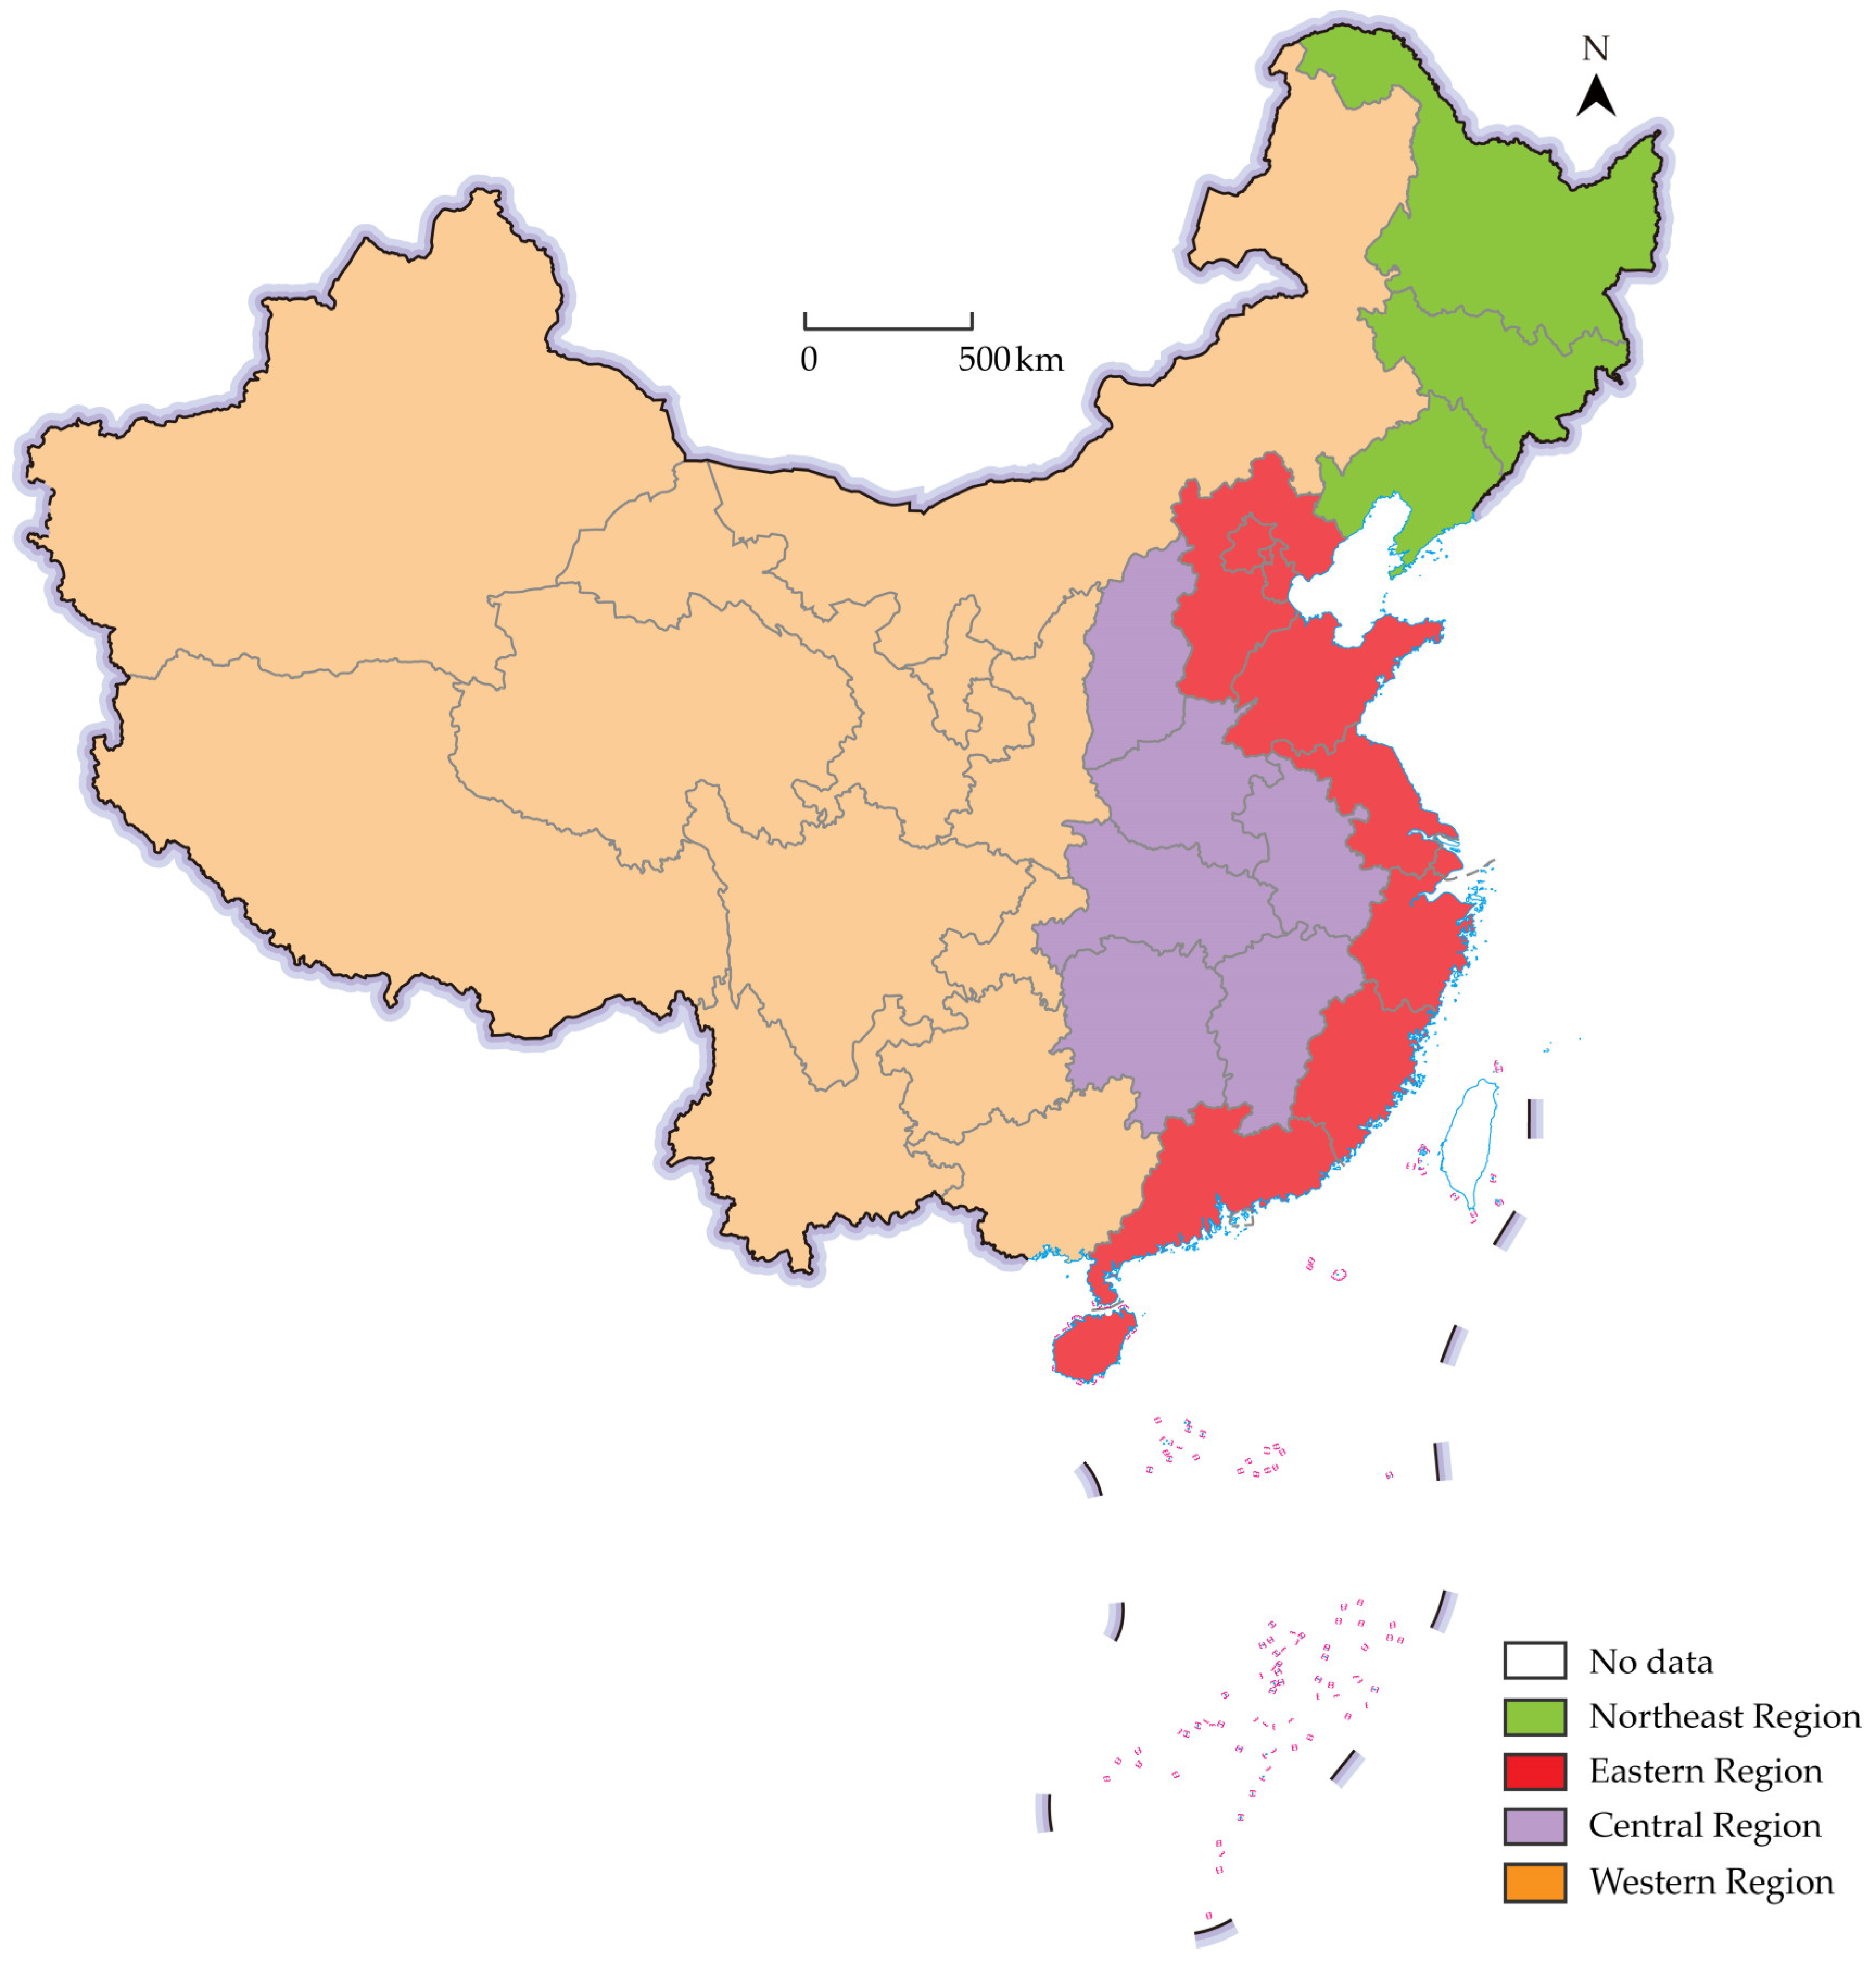
3.1. Study Area

In order to scientifically respond to and comprehensively understand the temporal evolution of the distribution of doctoral disciplines in universities in China as a whole and by region, the present study divided the 31 provinces in mainland China into four economic divisions, namely, the eastern region, the central region, the western region, and the northeastern region, based on the Notice of the State Council on Implementing Certain Policies and Measures for the Development of the Western Region [47] (Figure 1, Table 1).

3.2. Data Sources

The data used in the present study include (1) the administrative boundaries of the study area taken from the standard map service website of the Ministry of Natural Resources of China (http://bzdt.ch.mnr.gov.cn/; accessed on 20 May 2023); (2) the data on doctoral programs and A-class disciplines during 1996–2022 derived from internal statistics provided by the Ministry of Education of China. Since 1996, China has had a large-scale audit of the authorization of first-level doctoral disciplines; the data on doctoral disciplines in this paper starts from 1996; (3) information on ministry-affiliated universities and local universities, as well as the data on “double first-class” disciplines from the website of the Ministry of Education of China (http://www.moe.gov.cn/; accessed on 12 May 2023); and (4) economic, cultural, and demographic data derived from the official website of the National Bureau of Statistics of China (http://www.stats.gov.cn/; accessed on 20 April 2023).

3.3. Indicator Selection

Regional society often affects higher education comprehensively due to demographic, economic, and cultural aspects [8]. In view of the complexity and diversity of regional socio-economic indicators, this article focuses on the regional socio-economic development, i.e., the comprehensive strength of the region, as well as the quality of higher education, following the principles of comparability, availability, and scientificity in the selection of indicators. From a large number of indicators, GDP, per capita GDP, total population [48], the number of university (college and above) students per 100,000 population (hereafter referred to as “literacy”) [14,49], and the education expenditure [15,50] were selected as the factors influencing the economic and social development of the region, and correlation analyses were carried out through multivariate linear regression. GDP and per capita GDP data were obtained from the official website of the National Bureau of Statistics (NBS) [51].
Given that the interval between population censuses in China is ten years, this study used data from the sixth (2010) and seventh (2020) national population censuses to select the population and determine the literacy in each province. Additionally, the data for this paper were derived mainly from the Ministry of Education of China (MOE) statistics on doctoral disciplines and data on “double first-class” universities, as well as the round three and four discipline evaluations conducted in China.

3.4. Data Analysis

The data analysis in this paper can be categorized into the following three types:
Type 1: The most reliable and simple mathematical and statistical software, Microsoft Excel (version 2021, software for mathematical statistics, Microsoft: Redmond, WA, USA, 2021), was used to analyze the dynamic changes and spatial distribution patterns of doctoral disciplines in “double first-class” universities.
Type 2: The multiple linear regression module in R software (version 4.3.1, software for data analysis, R Foundation: Vienna, Austria, 2023) was used to analyze the correlation between the number of doctoral programs and regional economic and social factors in this paper. To examine the driving forces behind the number of doctoral disciplines in 2010 and 2020, multiple linear regression models were used to test if independent variables (GDP, per capita GDP, population, literacy, and education expenditure) significantly predicted the total number of doctoral disciplines, total number of doctoral disciplines in ministry-affiliated universities, or total number of doctoral disciplines in local universities. First, to harmonize the dimensions of the variables, the independent variables were normalized and centered. Only one of the variables was kept in the model if the correlation coefficient between independent variables was more than 0.85 in order to prevent collinearity between variables. After the model was built, the variance inflation factor (VIF) was examined, and variables with VIF > 5 were gradually removed from the model until all variables’ VIF ≤ 5 [52,53,54]. Using the StepAIC function in the MASS package, stepwise regression was performed to find the best model for each group of doctoral disciplines [55].
Type 3: Arcgis Pro 3.1 software (version 3.1, software for spatial analysis, Esri:Redlands, CA, USA,2023) was used to create the maps in this paper.

4. Results

4.1. Dynamic Changes in the Number of Doctoral Disciplines in “Double First-Class” Universities

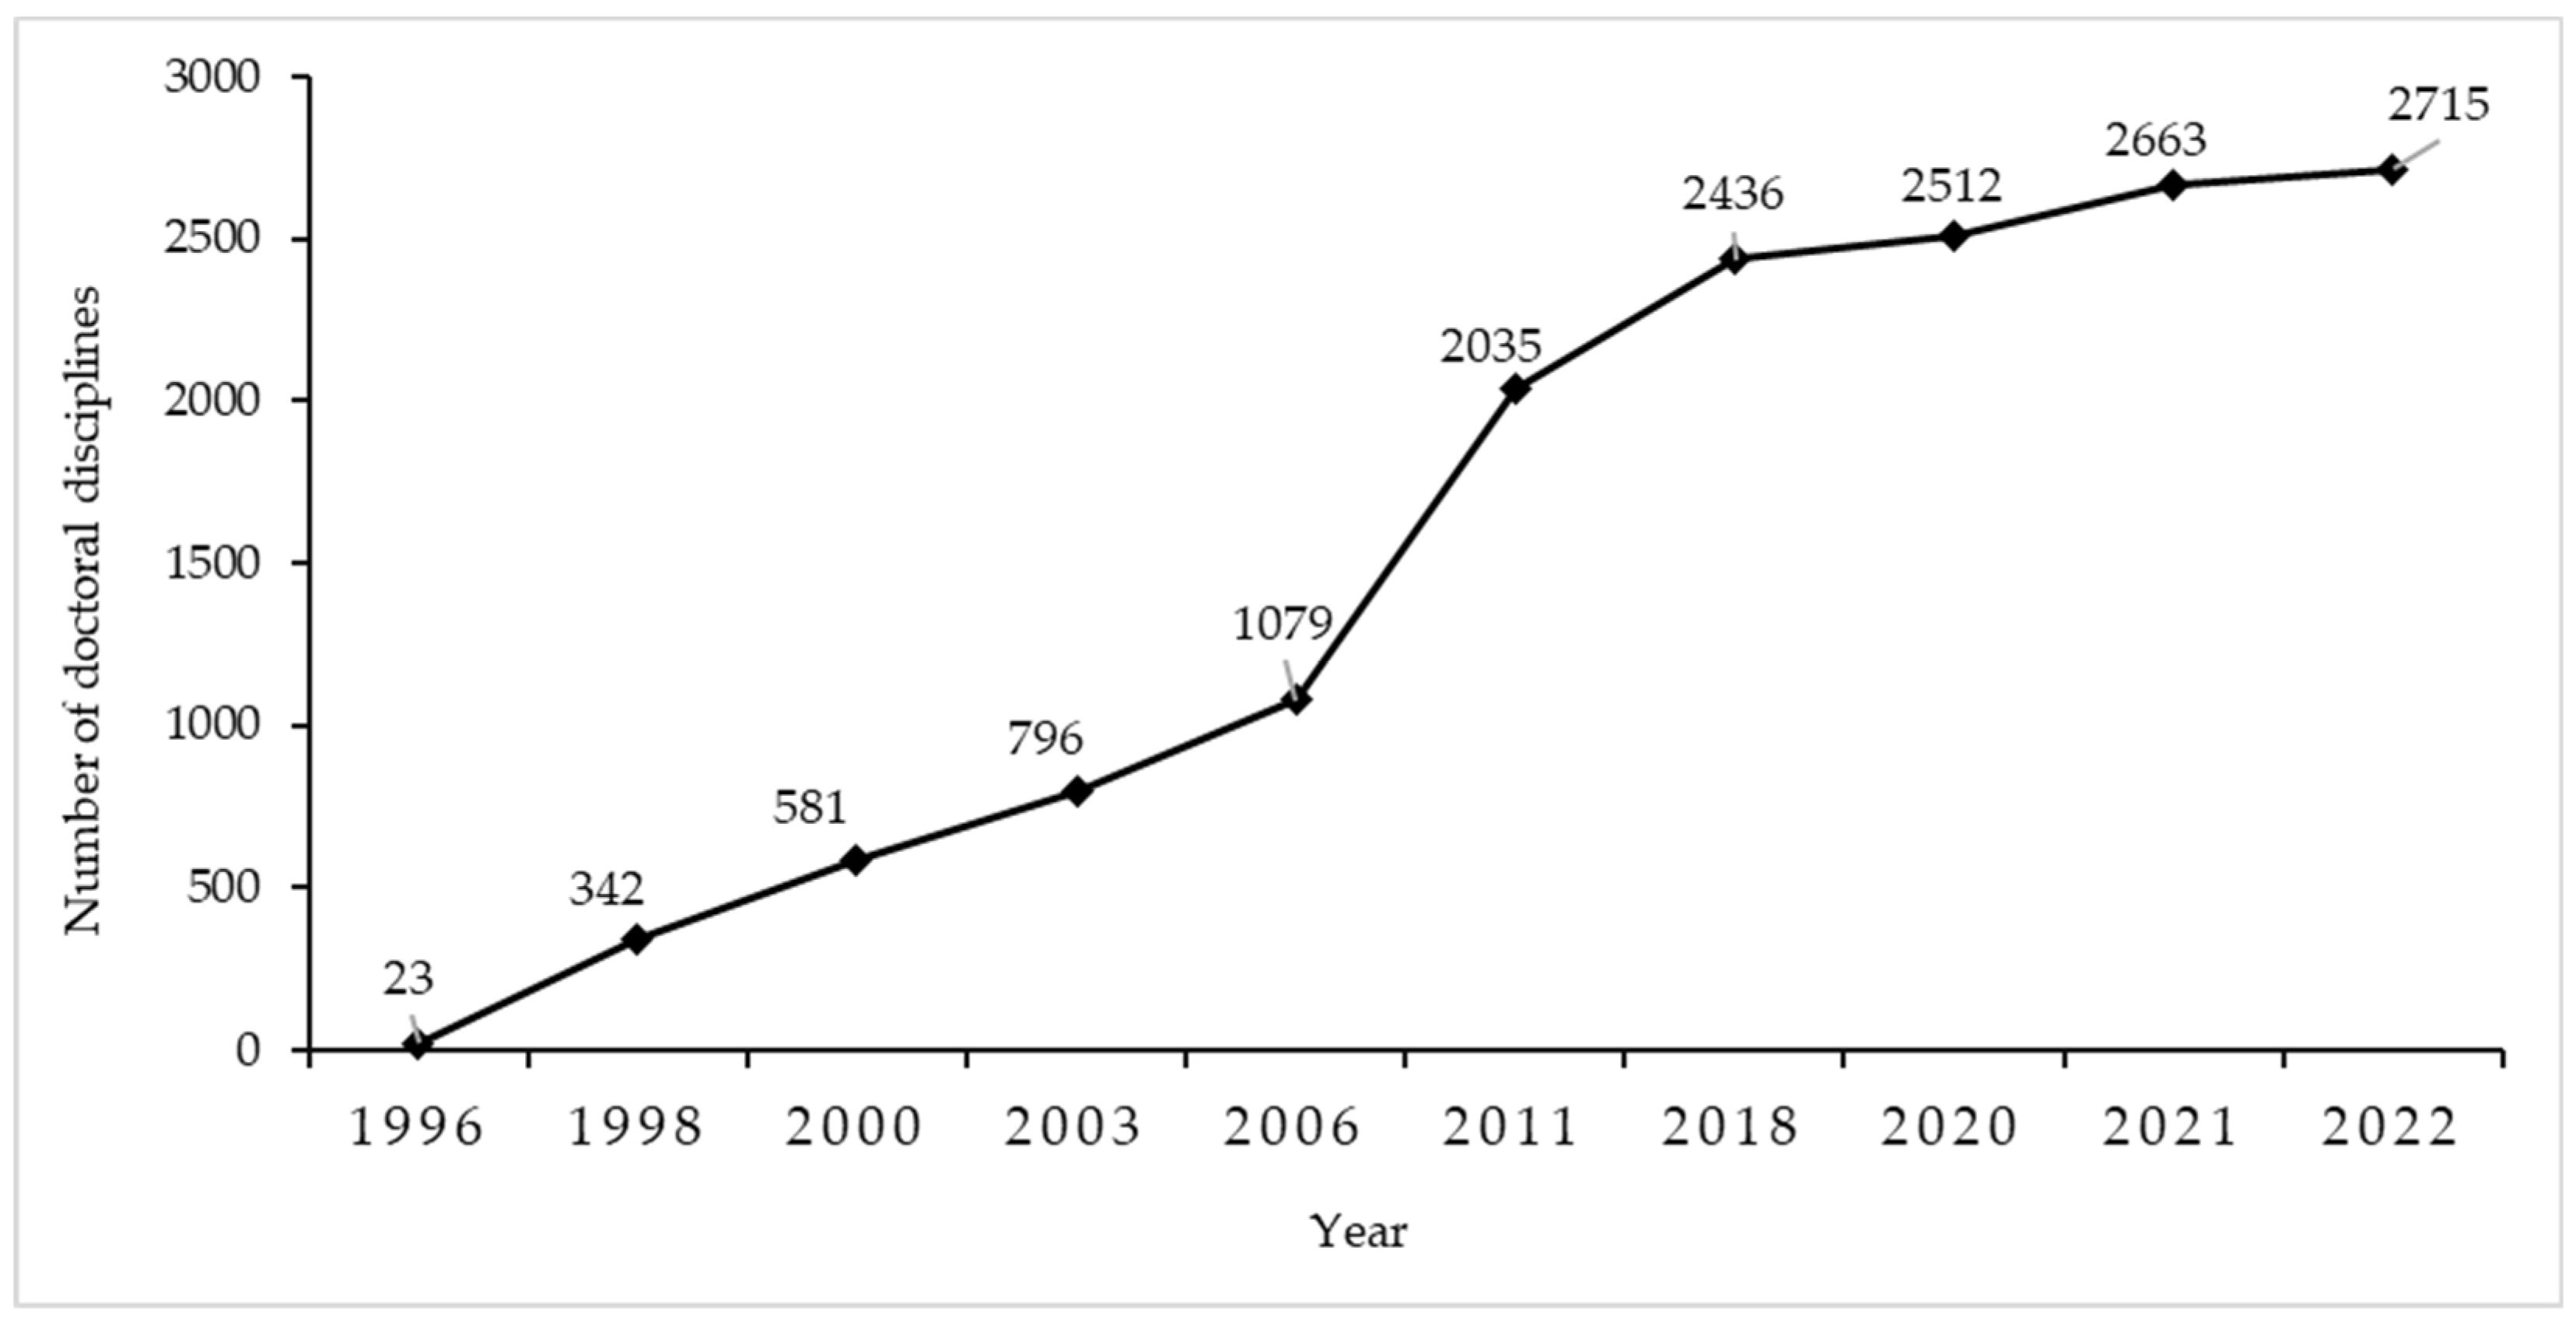
4.1.1. Temporal Changes in the Number of Doctoral Disciplines in China

Note: Statistics are from the main years of China’s degree authorization audit (the same below).
Figure 2 shows the number of doctoral disciplines in each province from 1996 to 2022. The figure shows that the overall scale is increasing, and the increase in individual years is large. A total of 23 doctoral disciplines were constructed in 1996, and the number increased to 2715 in 2022, with an average annual growth rate of 450.2%. It is noteworthy that 2011 and 2018 are important years for the development of doctoral disciplines, and the number of doctoral disciplines had markedly increased, while the other years were stable with small increases.

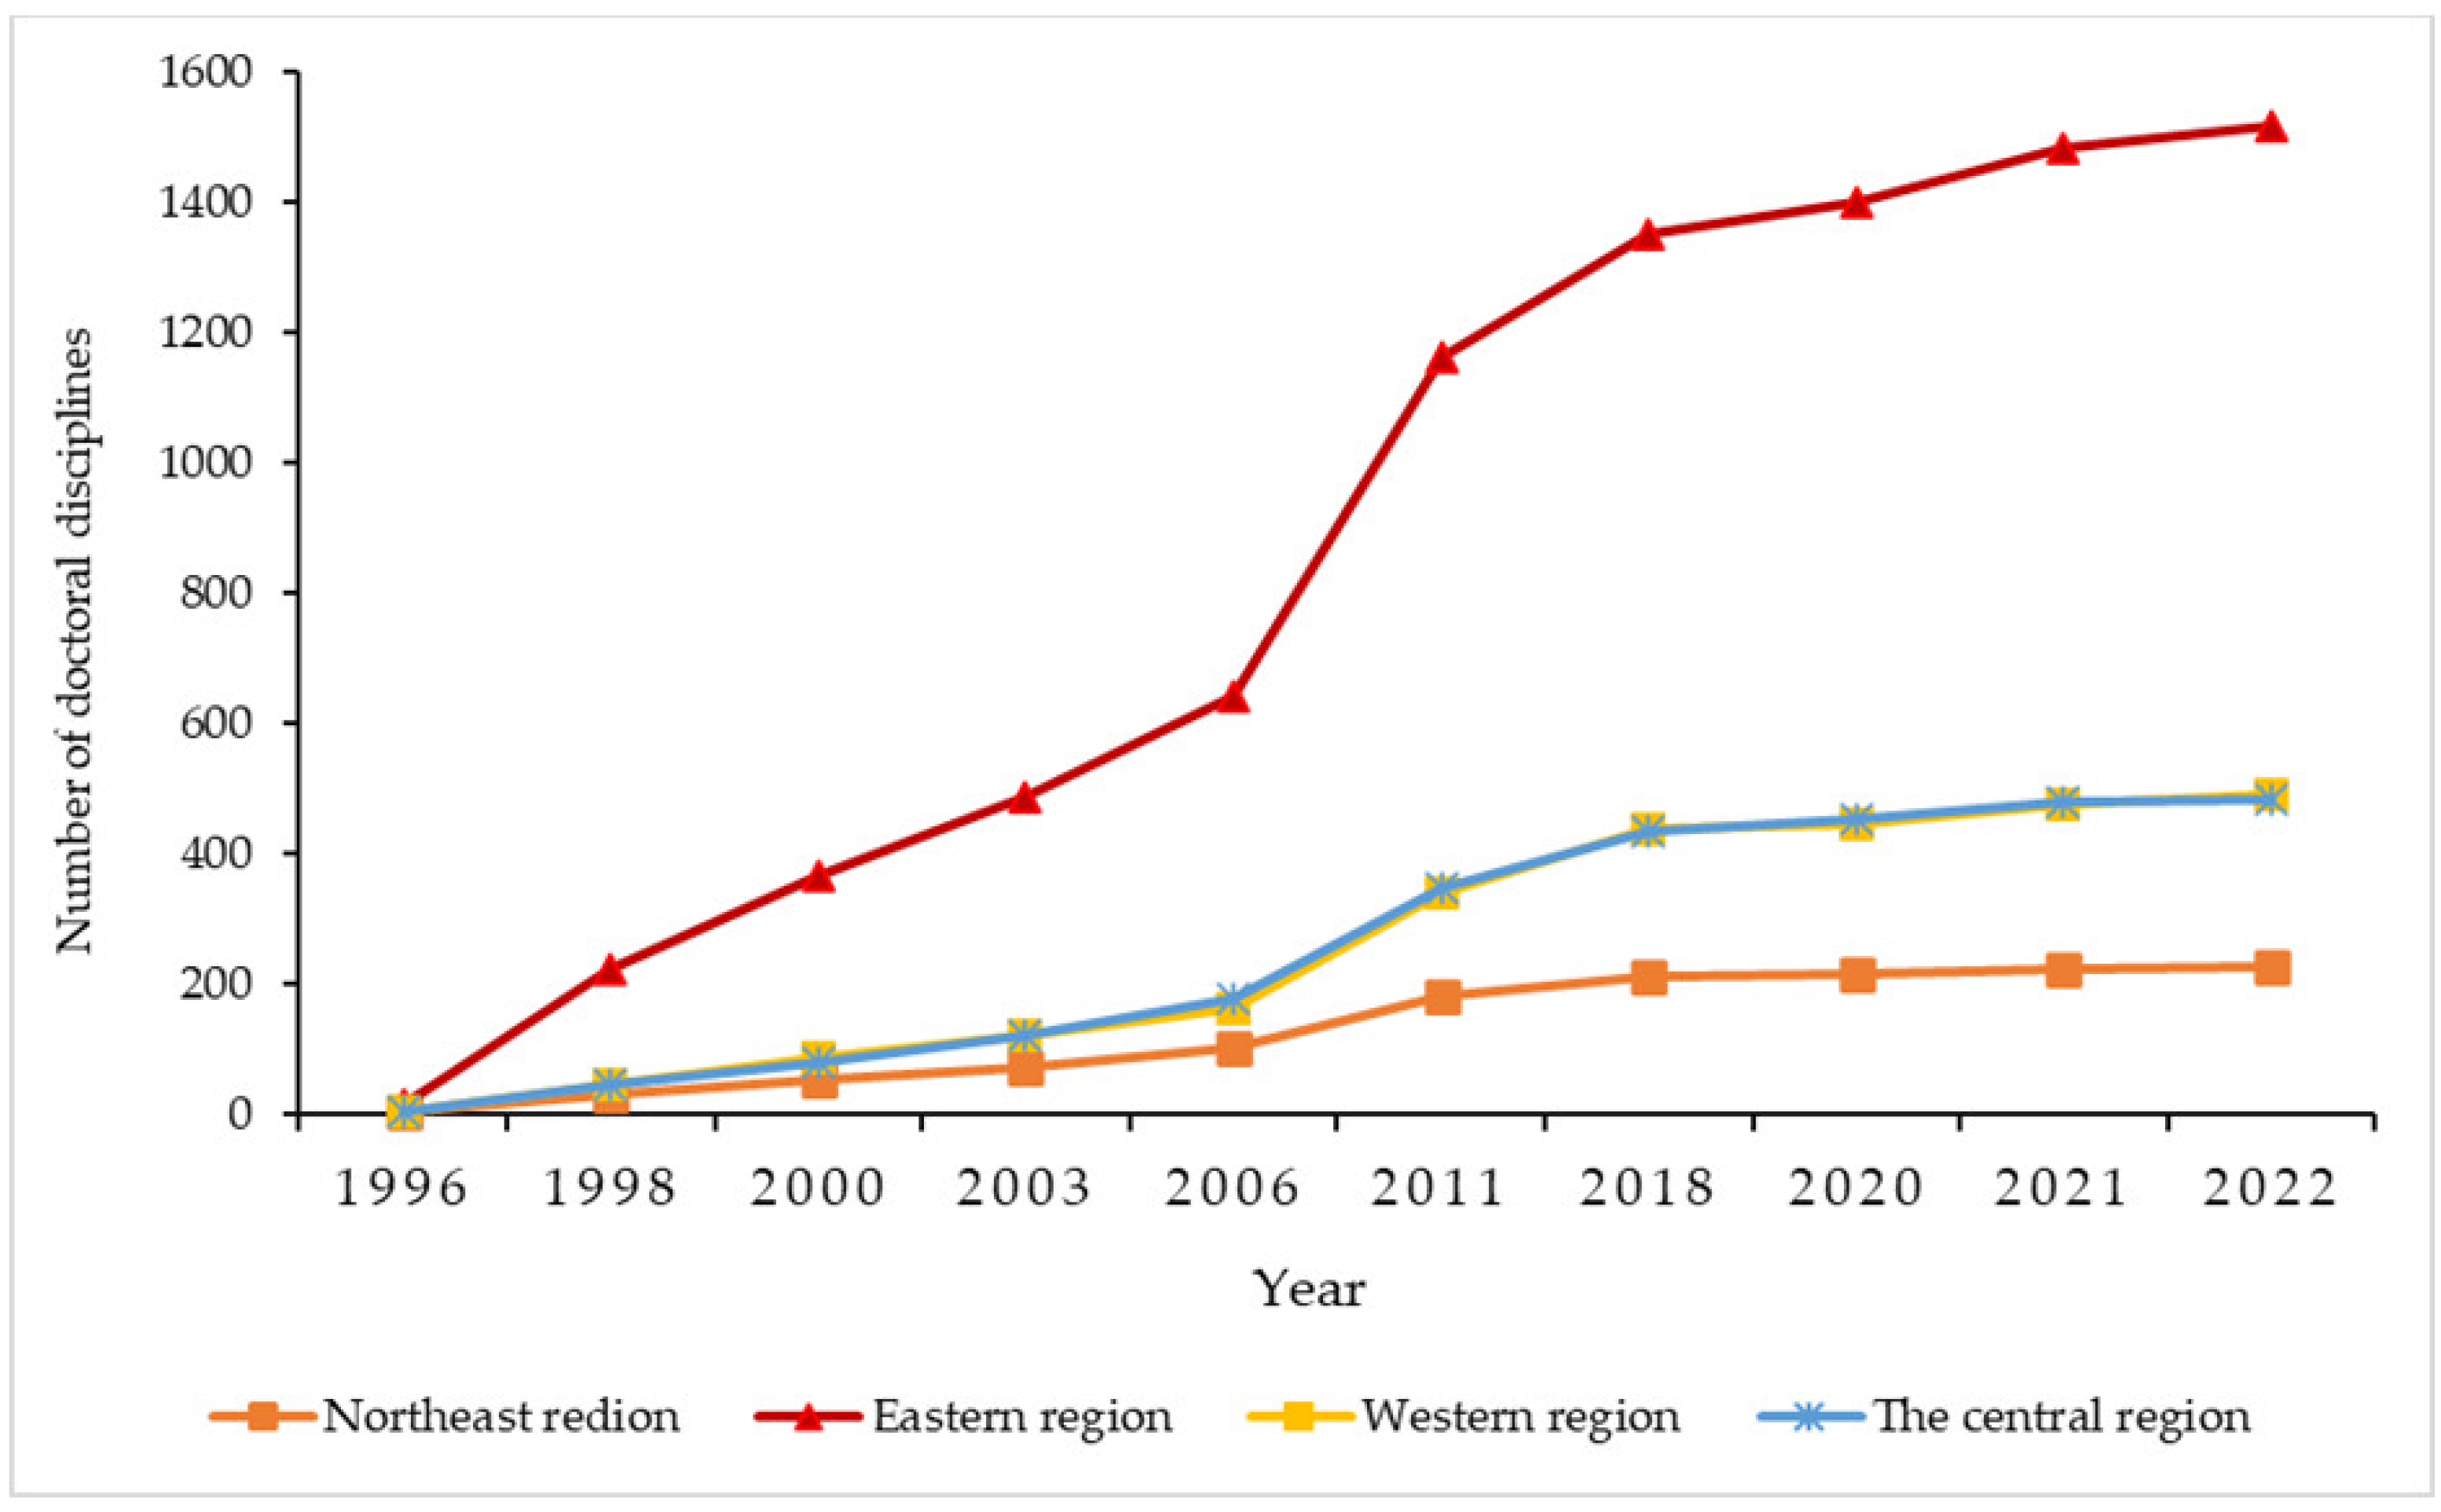
4.1.2. Temporal Changes in the Number of Doctoral Disciplines in Different Economic Divisions

The economic regions have the characteristic of “fast in the east and slow in the west” in terms of temporal trends. From the overall change, the number of doctoral disciplines in the eastern region was much higher and the rate of increase was the fastest; the number of doctoral disciplines in the central and western regions is basically the same as the trend of change; and the number of doctoral disciplines in the northeastern region was the lowest and the increase was slow (Figure 3). The national average annual growth was 103.5, of which 57.8 are in the eastern region, accounting for 55.8% of the country, 18.5 and 18.7 in the central and western regions, respectively, with the same increasing trend, and 8.6 in the northeast region, accounting for only 8.3% of the country (Table 2). The average provincial growth in the eastern region was the highest at 5.8 per year, while the average provincial annual growth differed from their respective overall trends at the division level, and the average provincial growth in the western region was the lowest at only 1.6 per year. Therefore, in terms of the temporal patterns, the overall characteristic of “double first-class” universities in China is “fast in the east and slow in the west”.

4.1.3. Temporal Changes in the Number of Doctoral Disciplines in Different Provinces

The changes in the number of doctoral disciplines in different provinces were basically consistent with the number of “double first-class” universities, and the clustering phenomenon by economic region was obvious. In terms of the number of doctoral disciplines, although all provinces showed an increase in different years, there are obvious disparities between provinces (Figure 4). The provinces with the highest average annual growth in the number of doctoral disciplines between 1996 and 2022 are Beijing, Jiangsu, and Shanghai, with nearly 10 or even more than 10, and all three provinces belong to the eastern region; the provinces with the lowest average annual growth were Tibet, Qinghai, and Ningxia, with less than 0.5, and these three provinces belong to the western region. It is worth noting that the average annual growth of Hebei in the eastern region was also low at 0.4. In addition to the northeastern region with provinces with a slower average annual growth, the average annual growth of the provinces of the remaining three economic regions had large differences, ranging from less than 1 to more than 5 (Table 3). Specifically, in the eastern region, the main growth was in Beijing, Jiangsu, and Shanghai, but there was less growth in Hebei and Hainan; in the central region, the main growth was in Hubei and Hunan, while there was less growth in Jiangxi; in the western region, the main growth was in Shaanxi and Sichuan, while there was less growth in Tibet, Qinghai, Ningxia, and Inner Mongolia.
In contrast, Beijing, Jiangsu, and Shanghai are the top three provinces with the largest number of “double first-class” universities, while Tibet, Qinghai, and Ningxia only have one “double first-class” university each. It can be seen that the differences between provinces in the number of doctoral disciplines is due to differences in the number of “double first-class” universities. There are also differences in the number of doctoral disciplines among the different provinces in the same economic region, which are mainly concentrated in the traditional advantageous provinces where “double first-class” universities are concentrated.

4.2. Spatial Distribution Pattern of the Number of Doctoral Disciplines in “Double First-Class” Universities

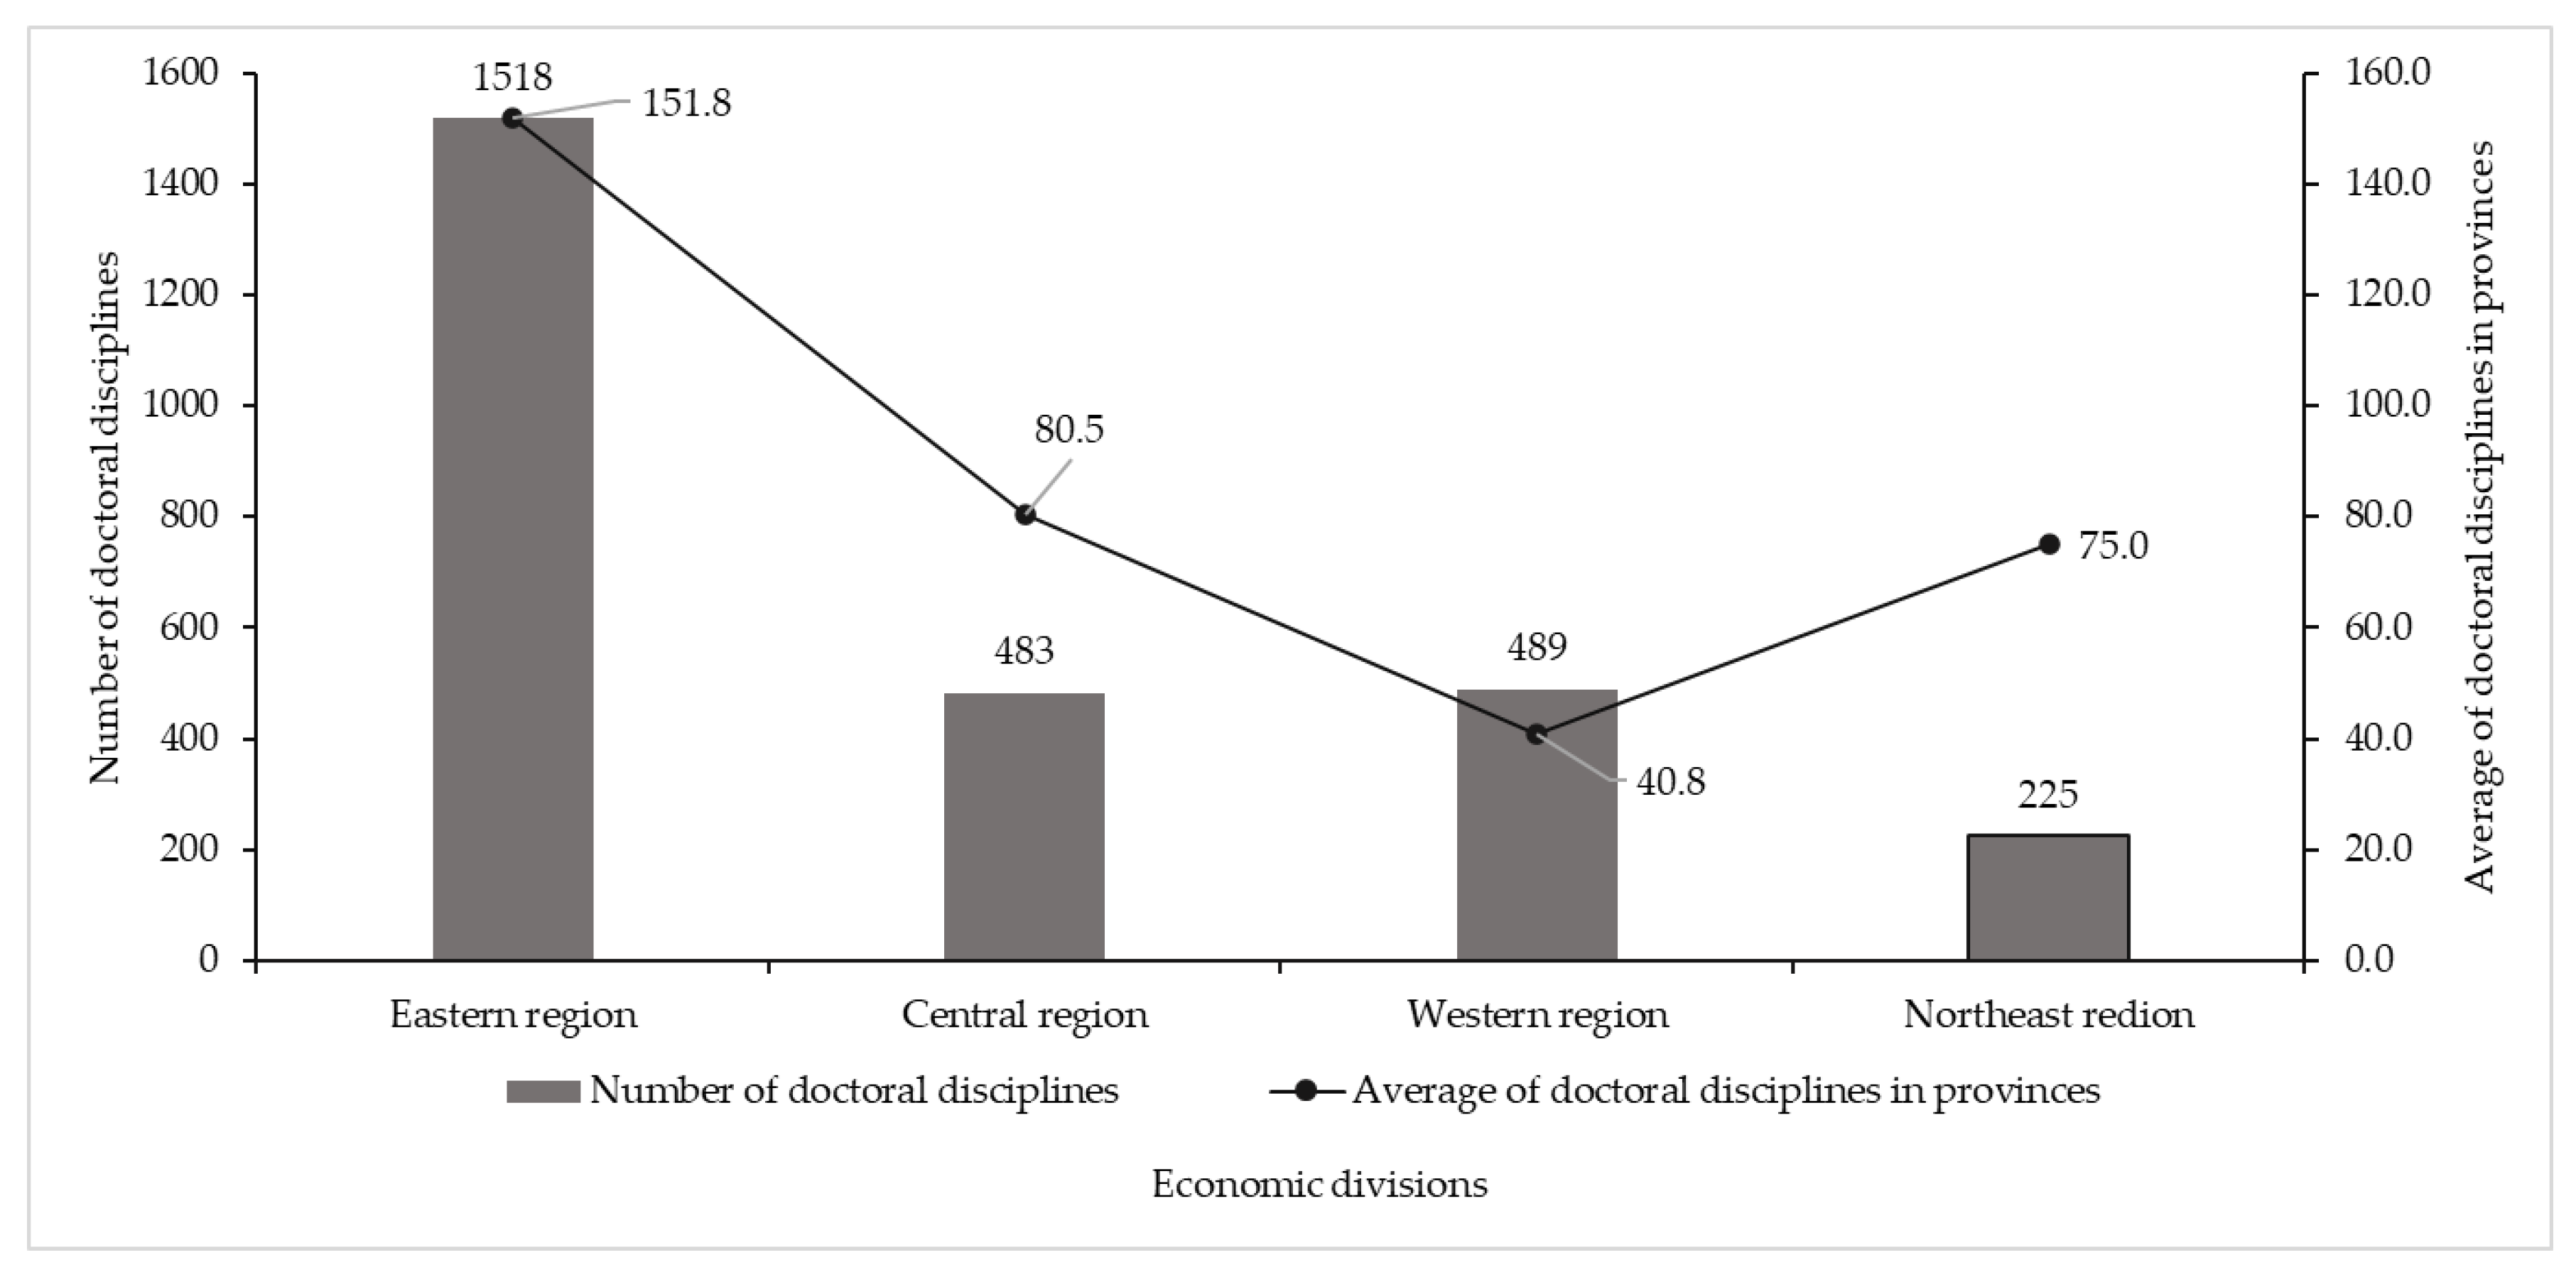
4.2.1. Spatial Changes in the Number of Doctoral Disciplines in Different Economic Divisions

The spatial distribution pattern of doctoral disciplines in “double first-class” universities by economic region was “more in the east and less in the west”. In 2022, the number of doctoral disciplines in “double first-class” universities reached 2715. The highest number of doctoral disciplines in the eastern region was 1518, accounting for 55.9% of the national number. The numbers in the western and central regions were basically the same at nearly 500. The lowest number of doctoral disciplines was in the northeastern region, with only 225 (Figure 5).
In terms of the average number of doctoral disciplines per province, the average of provinces in the eastern region was the highest, reaching 151.8 per province; the average of provinces in the central region and the northeastern region were similar at 80.5 per province and 75.0 per province, respectively; the lowest average number was in the western region at only 40.8 per province. It can be seen that the spatial distribution of the number of doctoral disciplines shows a characteristic of “more in the east and less in the west” (Figure 5).

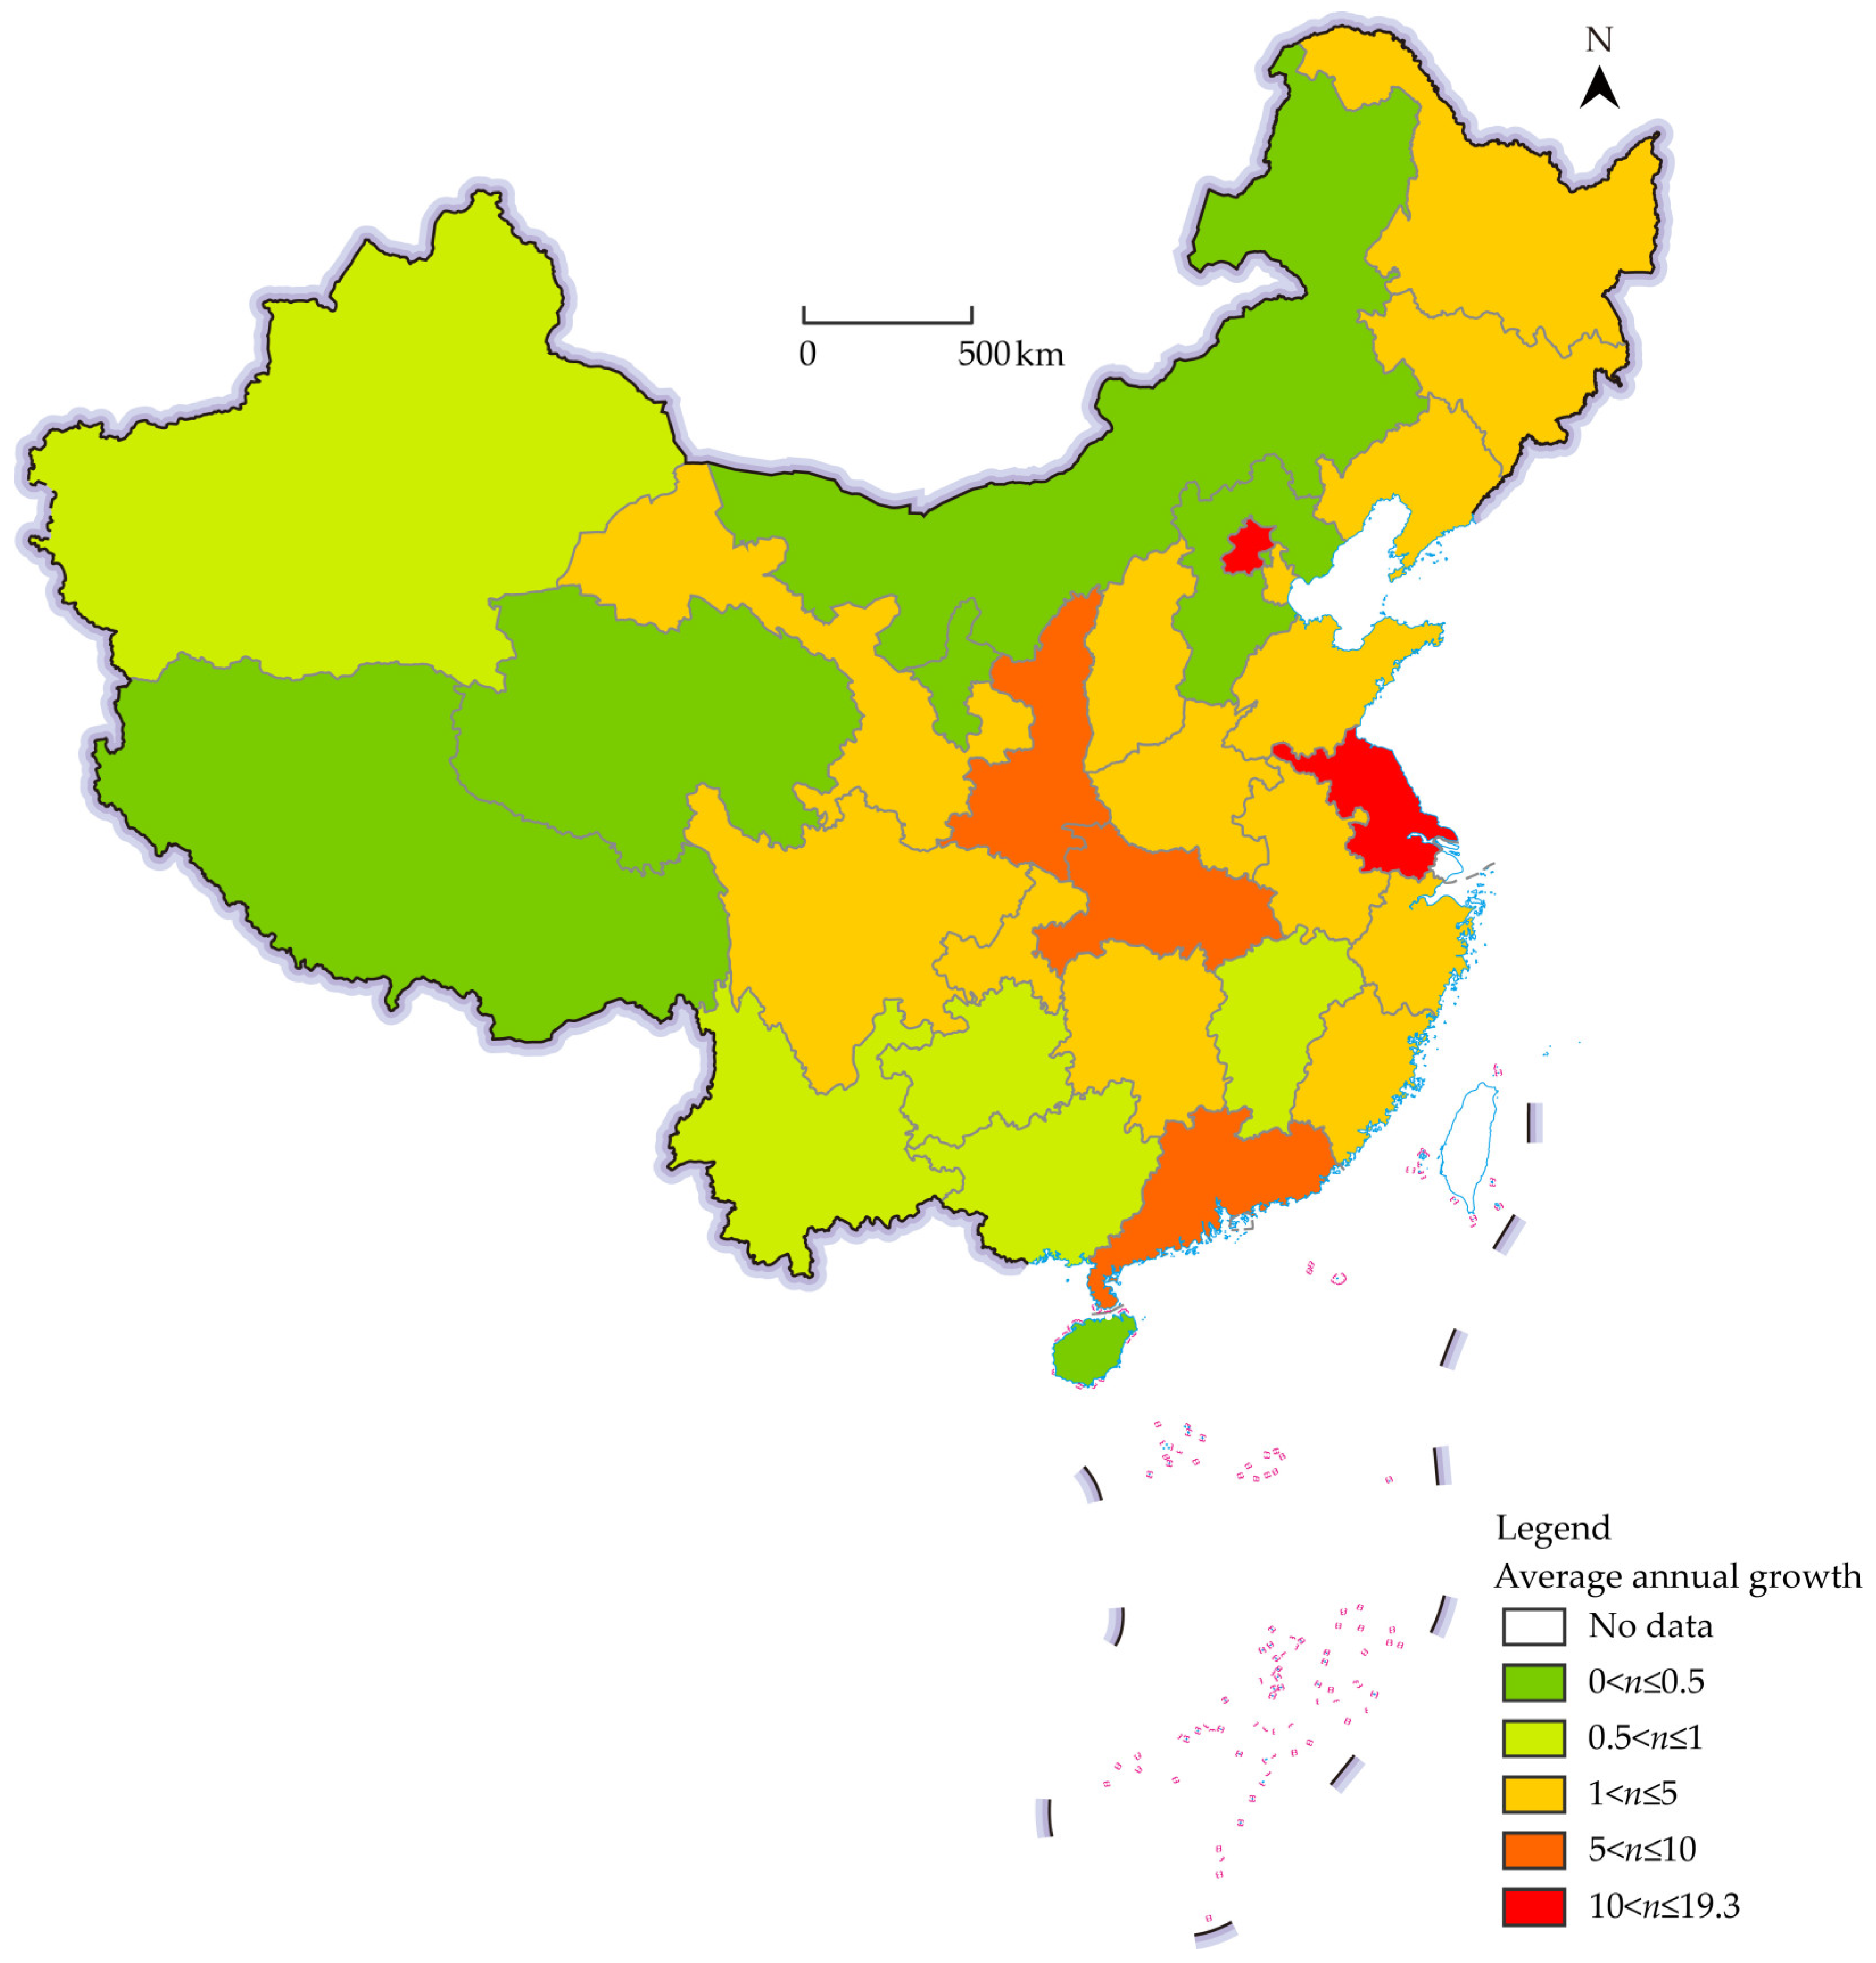
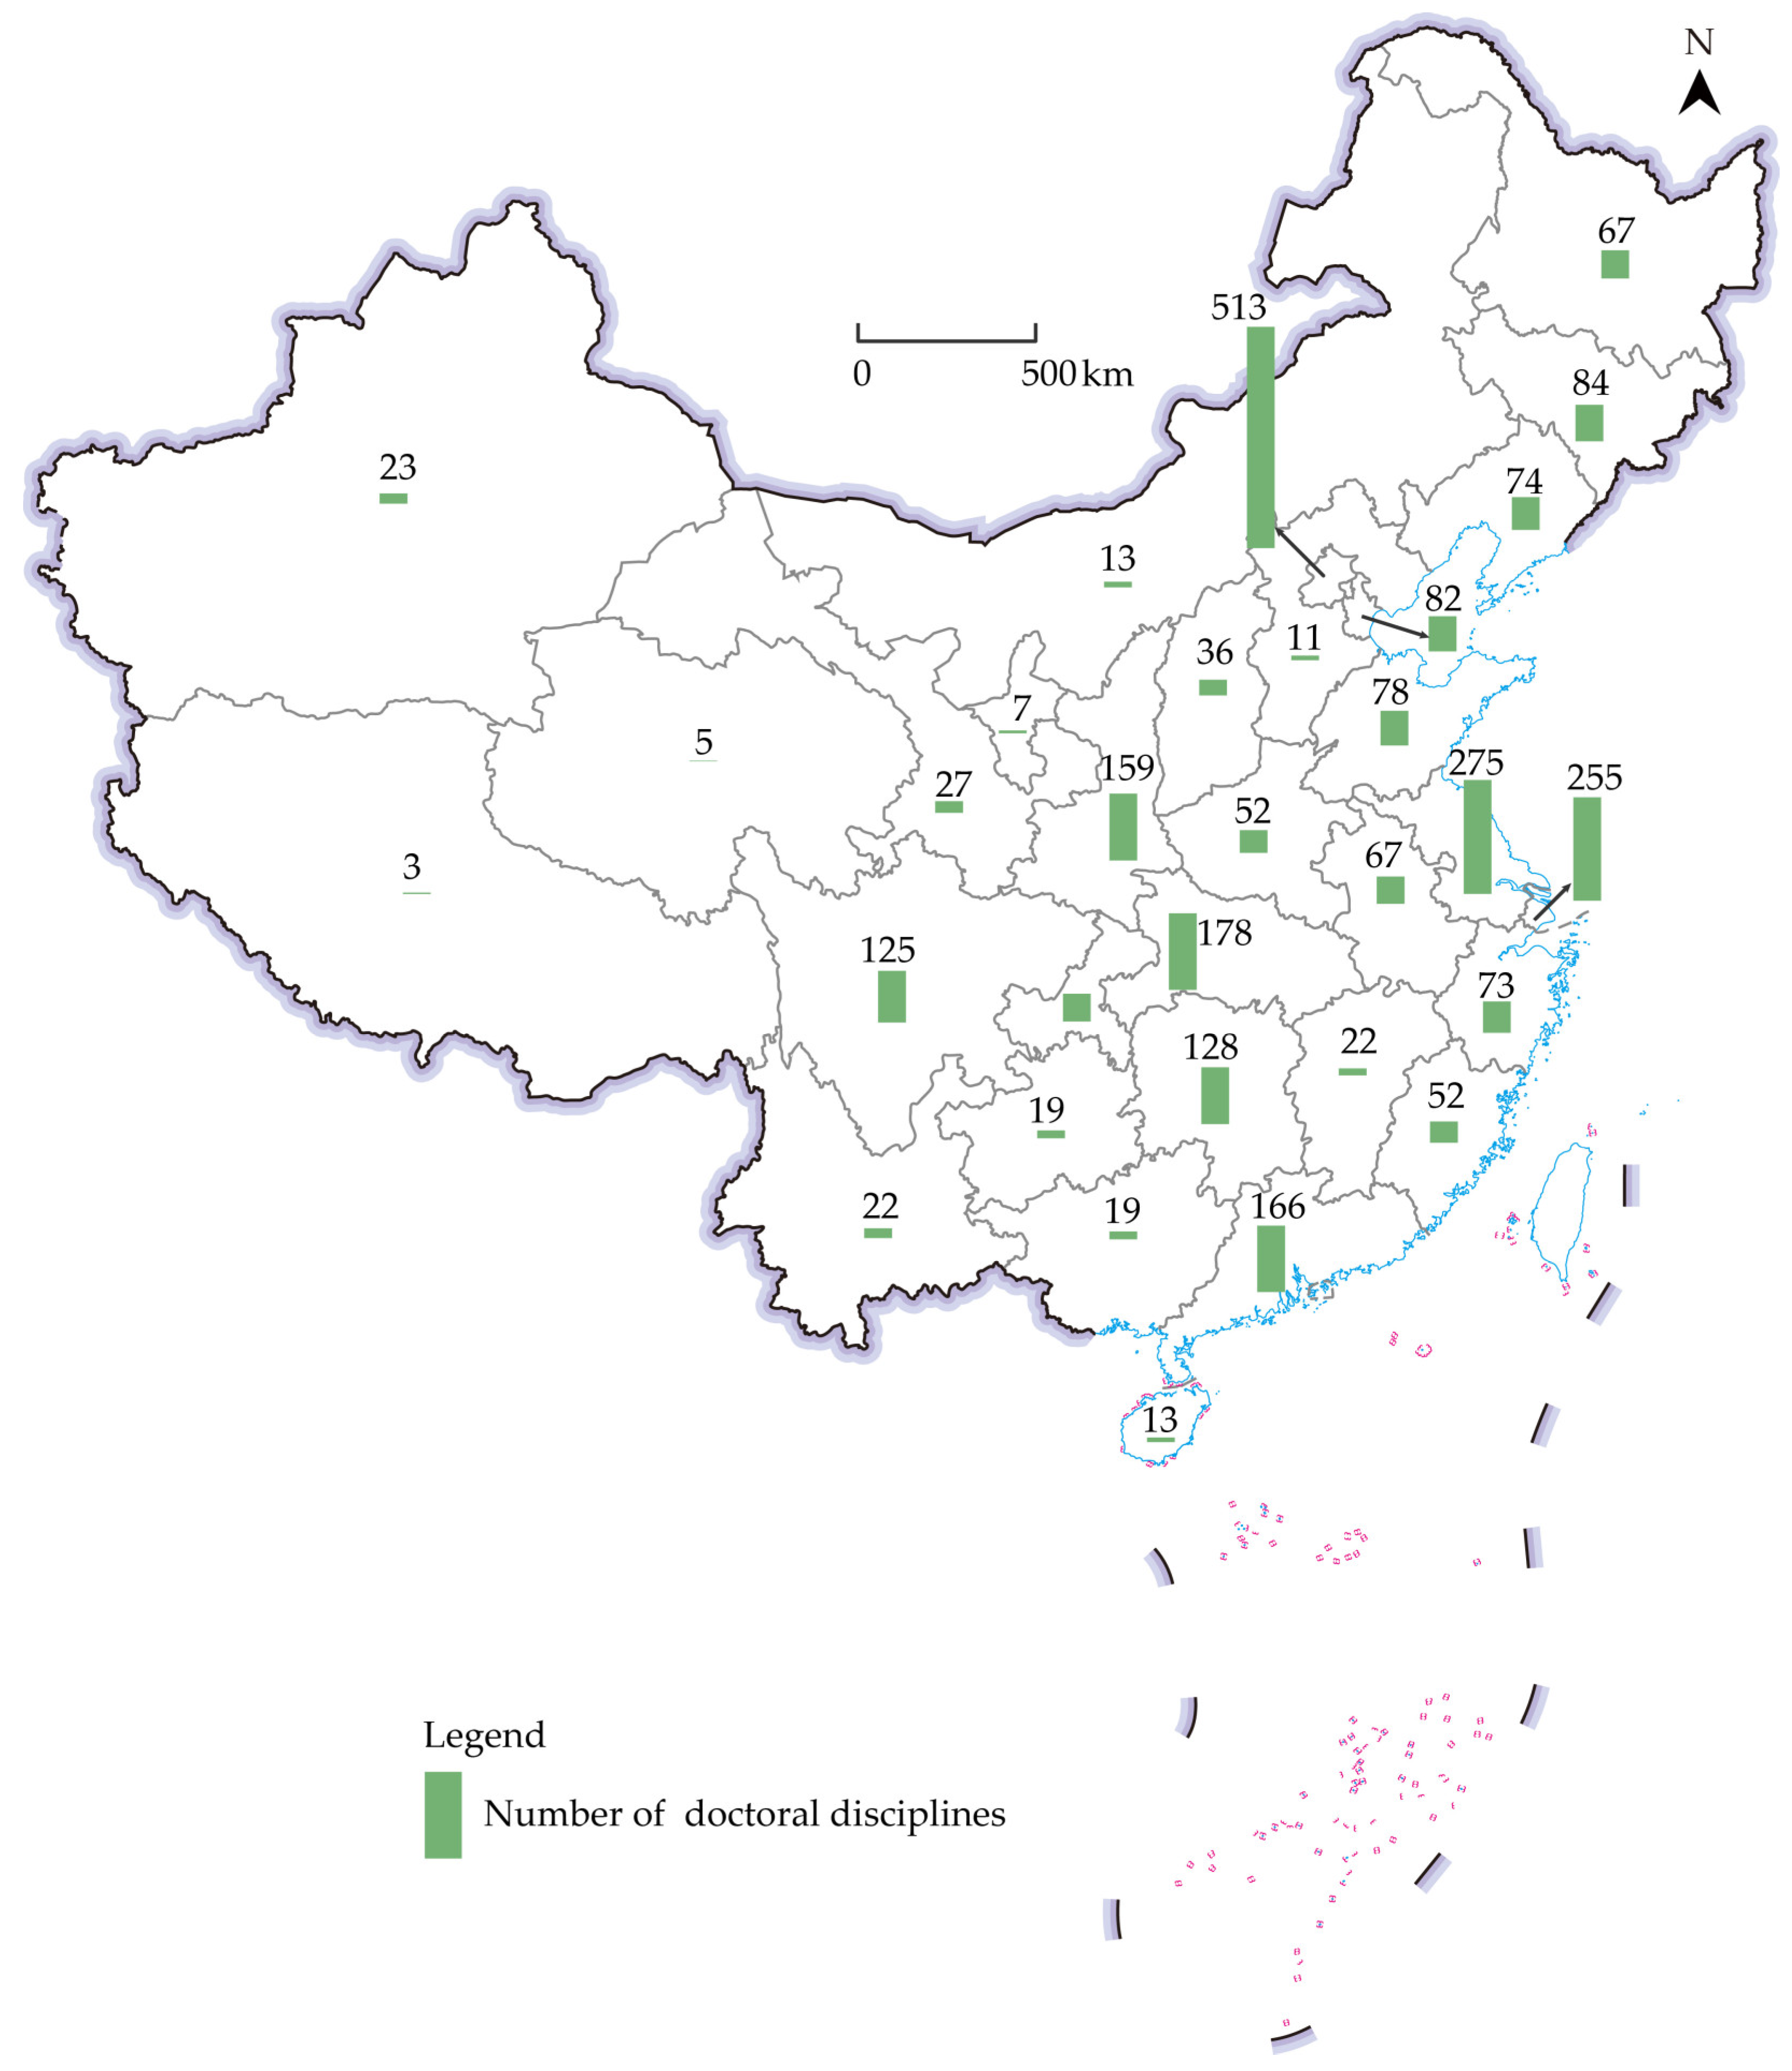
4.2.2. Spatial Changes in the Number of Doctoral Disciplines in Different Provinces

The distribution of the number of doctoral disciplines in different provinces was basically consistent with the number of “double first-class” universities, and there was a clustering phenomenon by province in economic region. From the perspective of inter-provincial imbalances (Table 3), there were three provinces with more than 200 doctoral disciplines, namely, Beijing, Jiangsu, and Shanghai, all of which are located in the eastern region; the three provinces with the lowest number of doctoral disciplines were Tibet, Qinghai, and Ningxia, all of which are located in the western region. Similar to the temporal change patterns, all the provinces with a high number of doctoral disciplines coexist with provinces with a low number of doctoral disciplines in three of the economic regions, while the northeast region had little difference among the different provinces although the total number was low. In the eastern region, although there were provinces with a very high number of doctoral disciplines (Beijing, Jiangsu, and Shanghai), there were also provinces with a very low number of doctoral disciplines (Hainan, Hebei, etc.). In the western region, Shaanxi and Sichuan had a high number of doctoral disciplines, with more than 120, while nine provinces had less than 30 doctoral disciplines. In the central region, doctoral disciplines were mainly concentrated in Hubei and Hunan, while Jiangxi and Shanxi had only 22 and 36. Also, in line with temporal patterns, the spatial distribution of the number of doctoral disciplines in each province was highly consistent with the number of “double first-class” universities. The number of doctoral disciplines in the same economic region was concentrated in the traditionally advantaged provinces where the “double first-class” universities were concentrated (Figure 6).

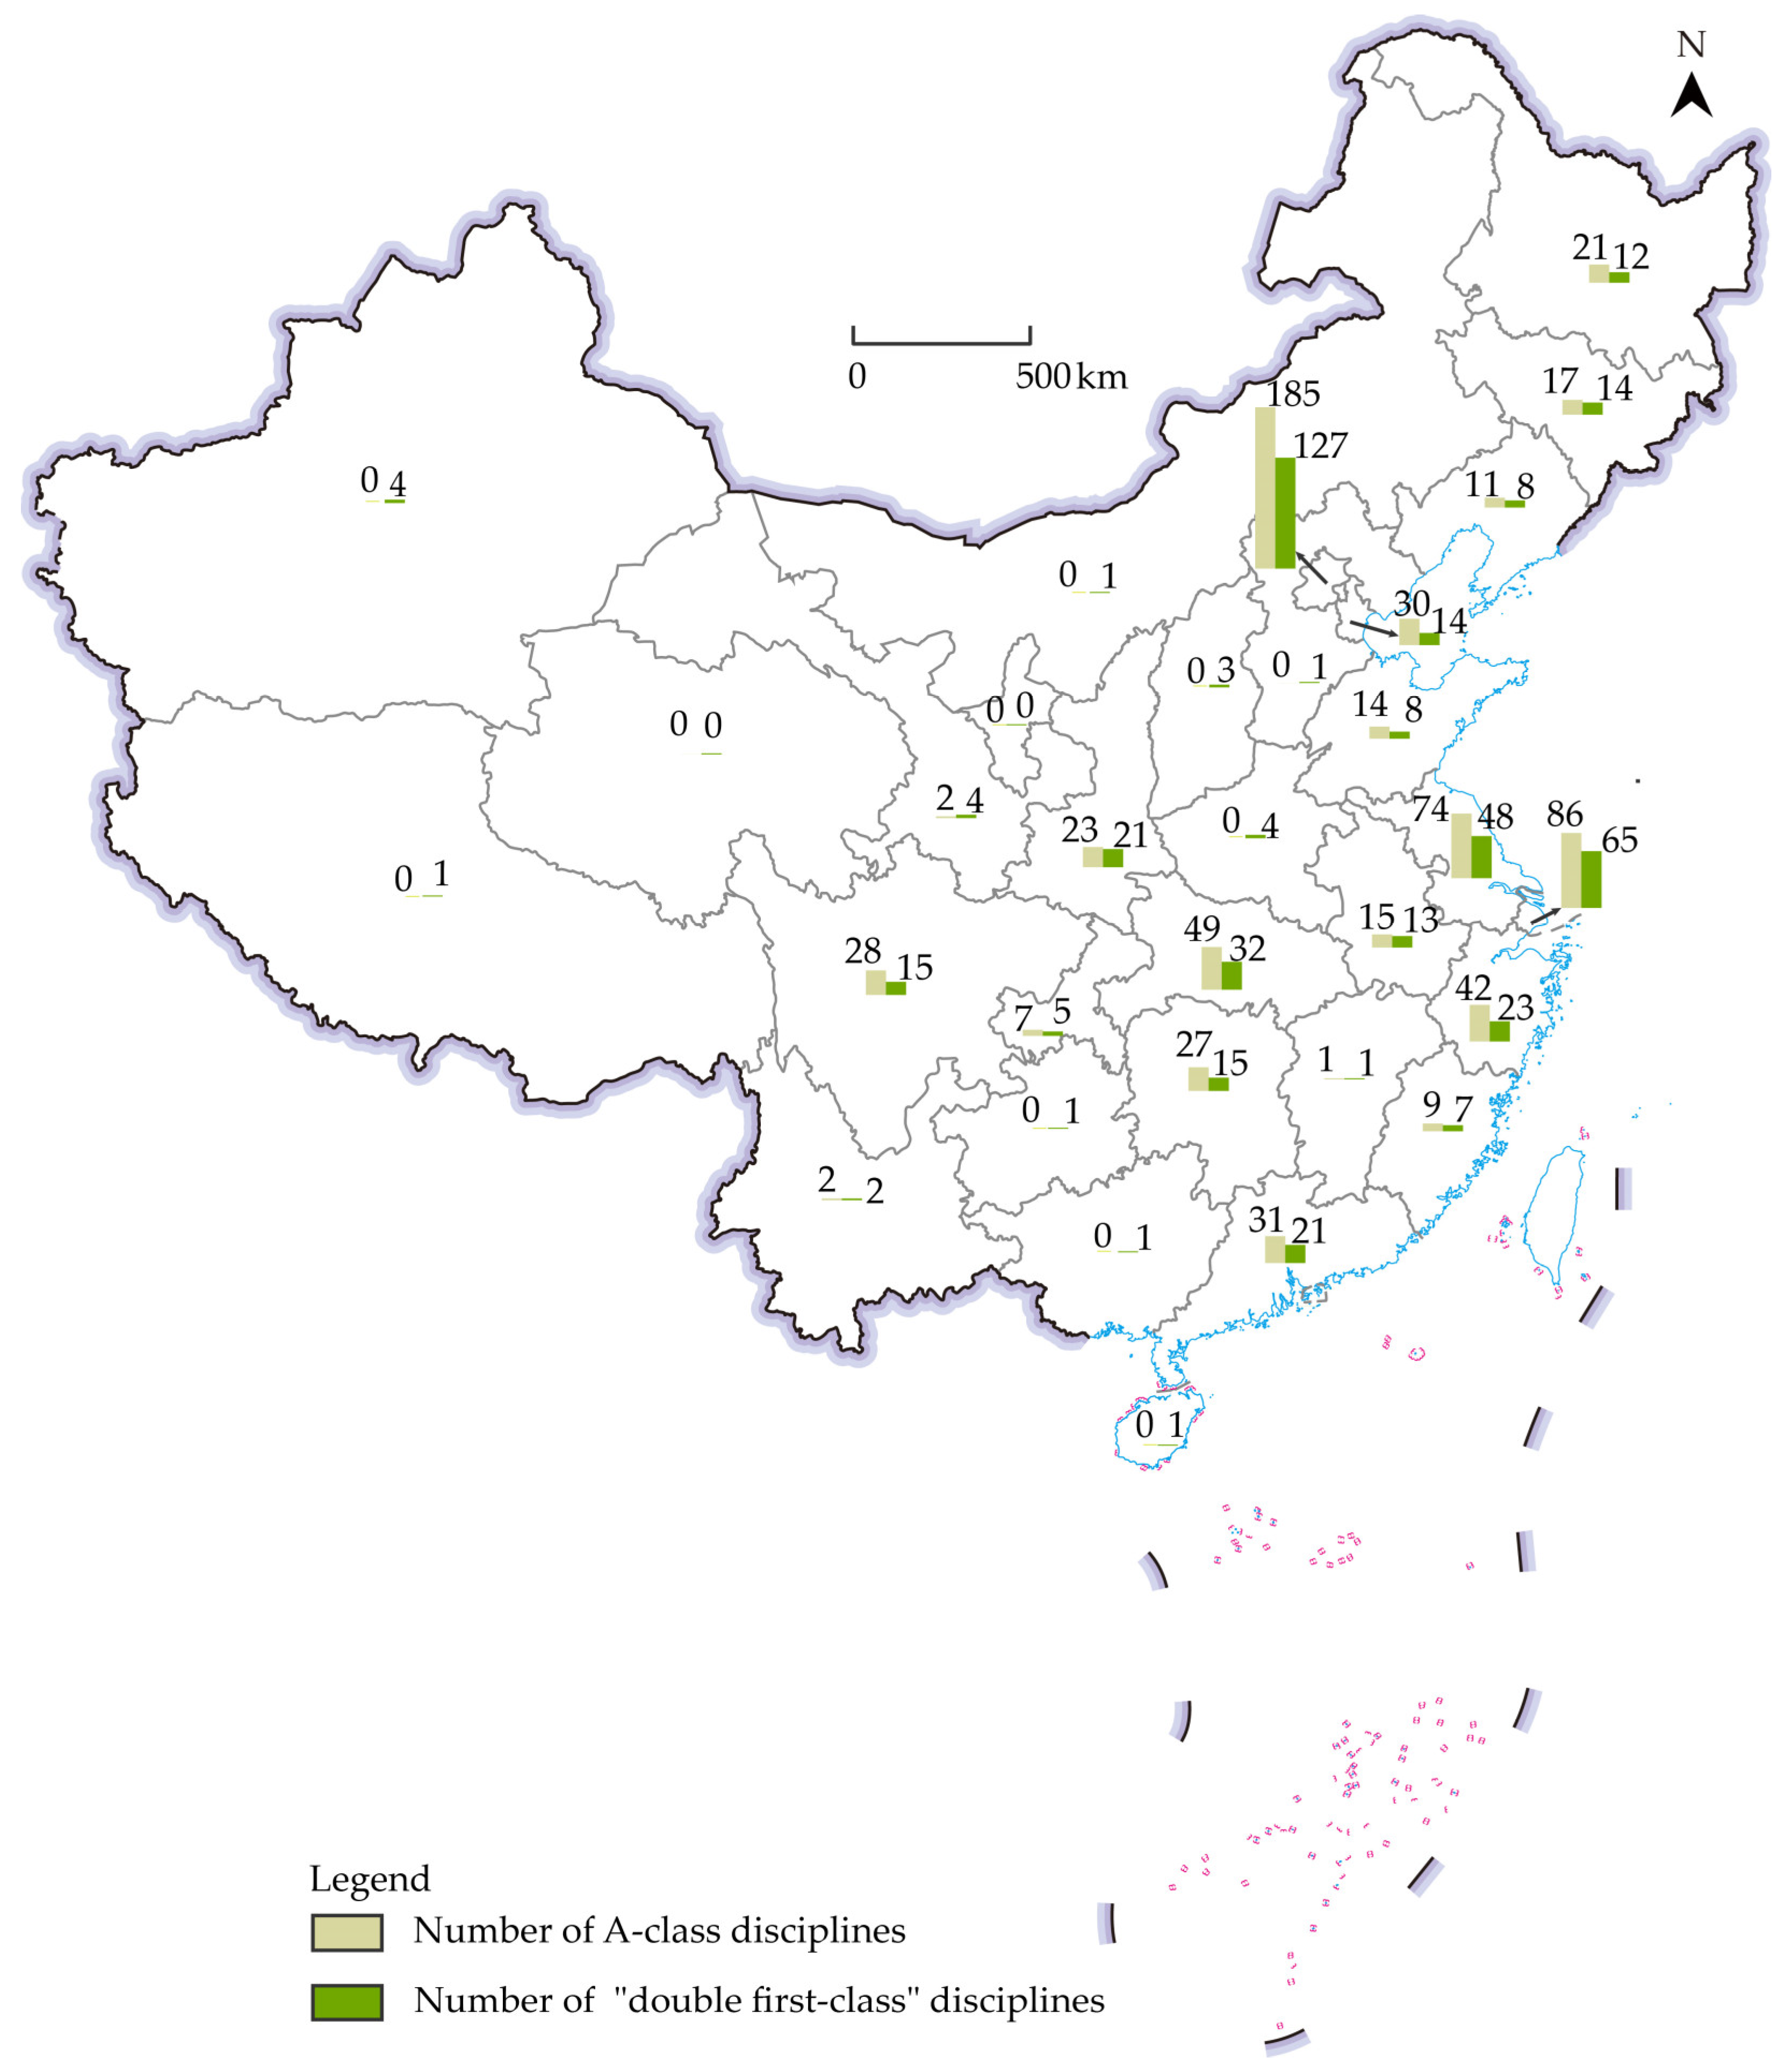
4.3. Spatial Distribution Differences in the Quality of Doctoral Disciplines in “Double First-Class” Universities

According to the national statistics, there were 745 A-class disciplines in the third and fourth rounds of discipline evaluation of all the universities in China; 674 A-class disciplines were in “double first-class” universities, accounting for 90.5% of the total, which can be said to represent the high-quality disciplines in China. Therefore, in this paper, the quality of doctoral disciplines was analyzed by studying A-class discipline evaluation results and “double first-class” disciplines.

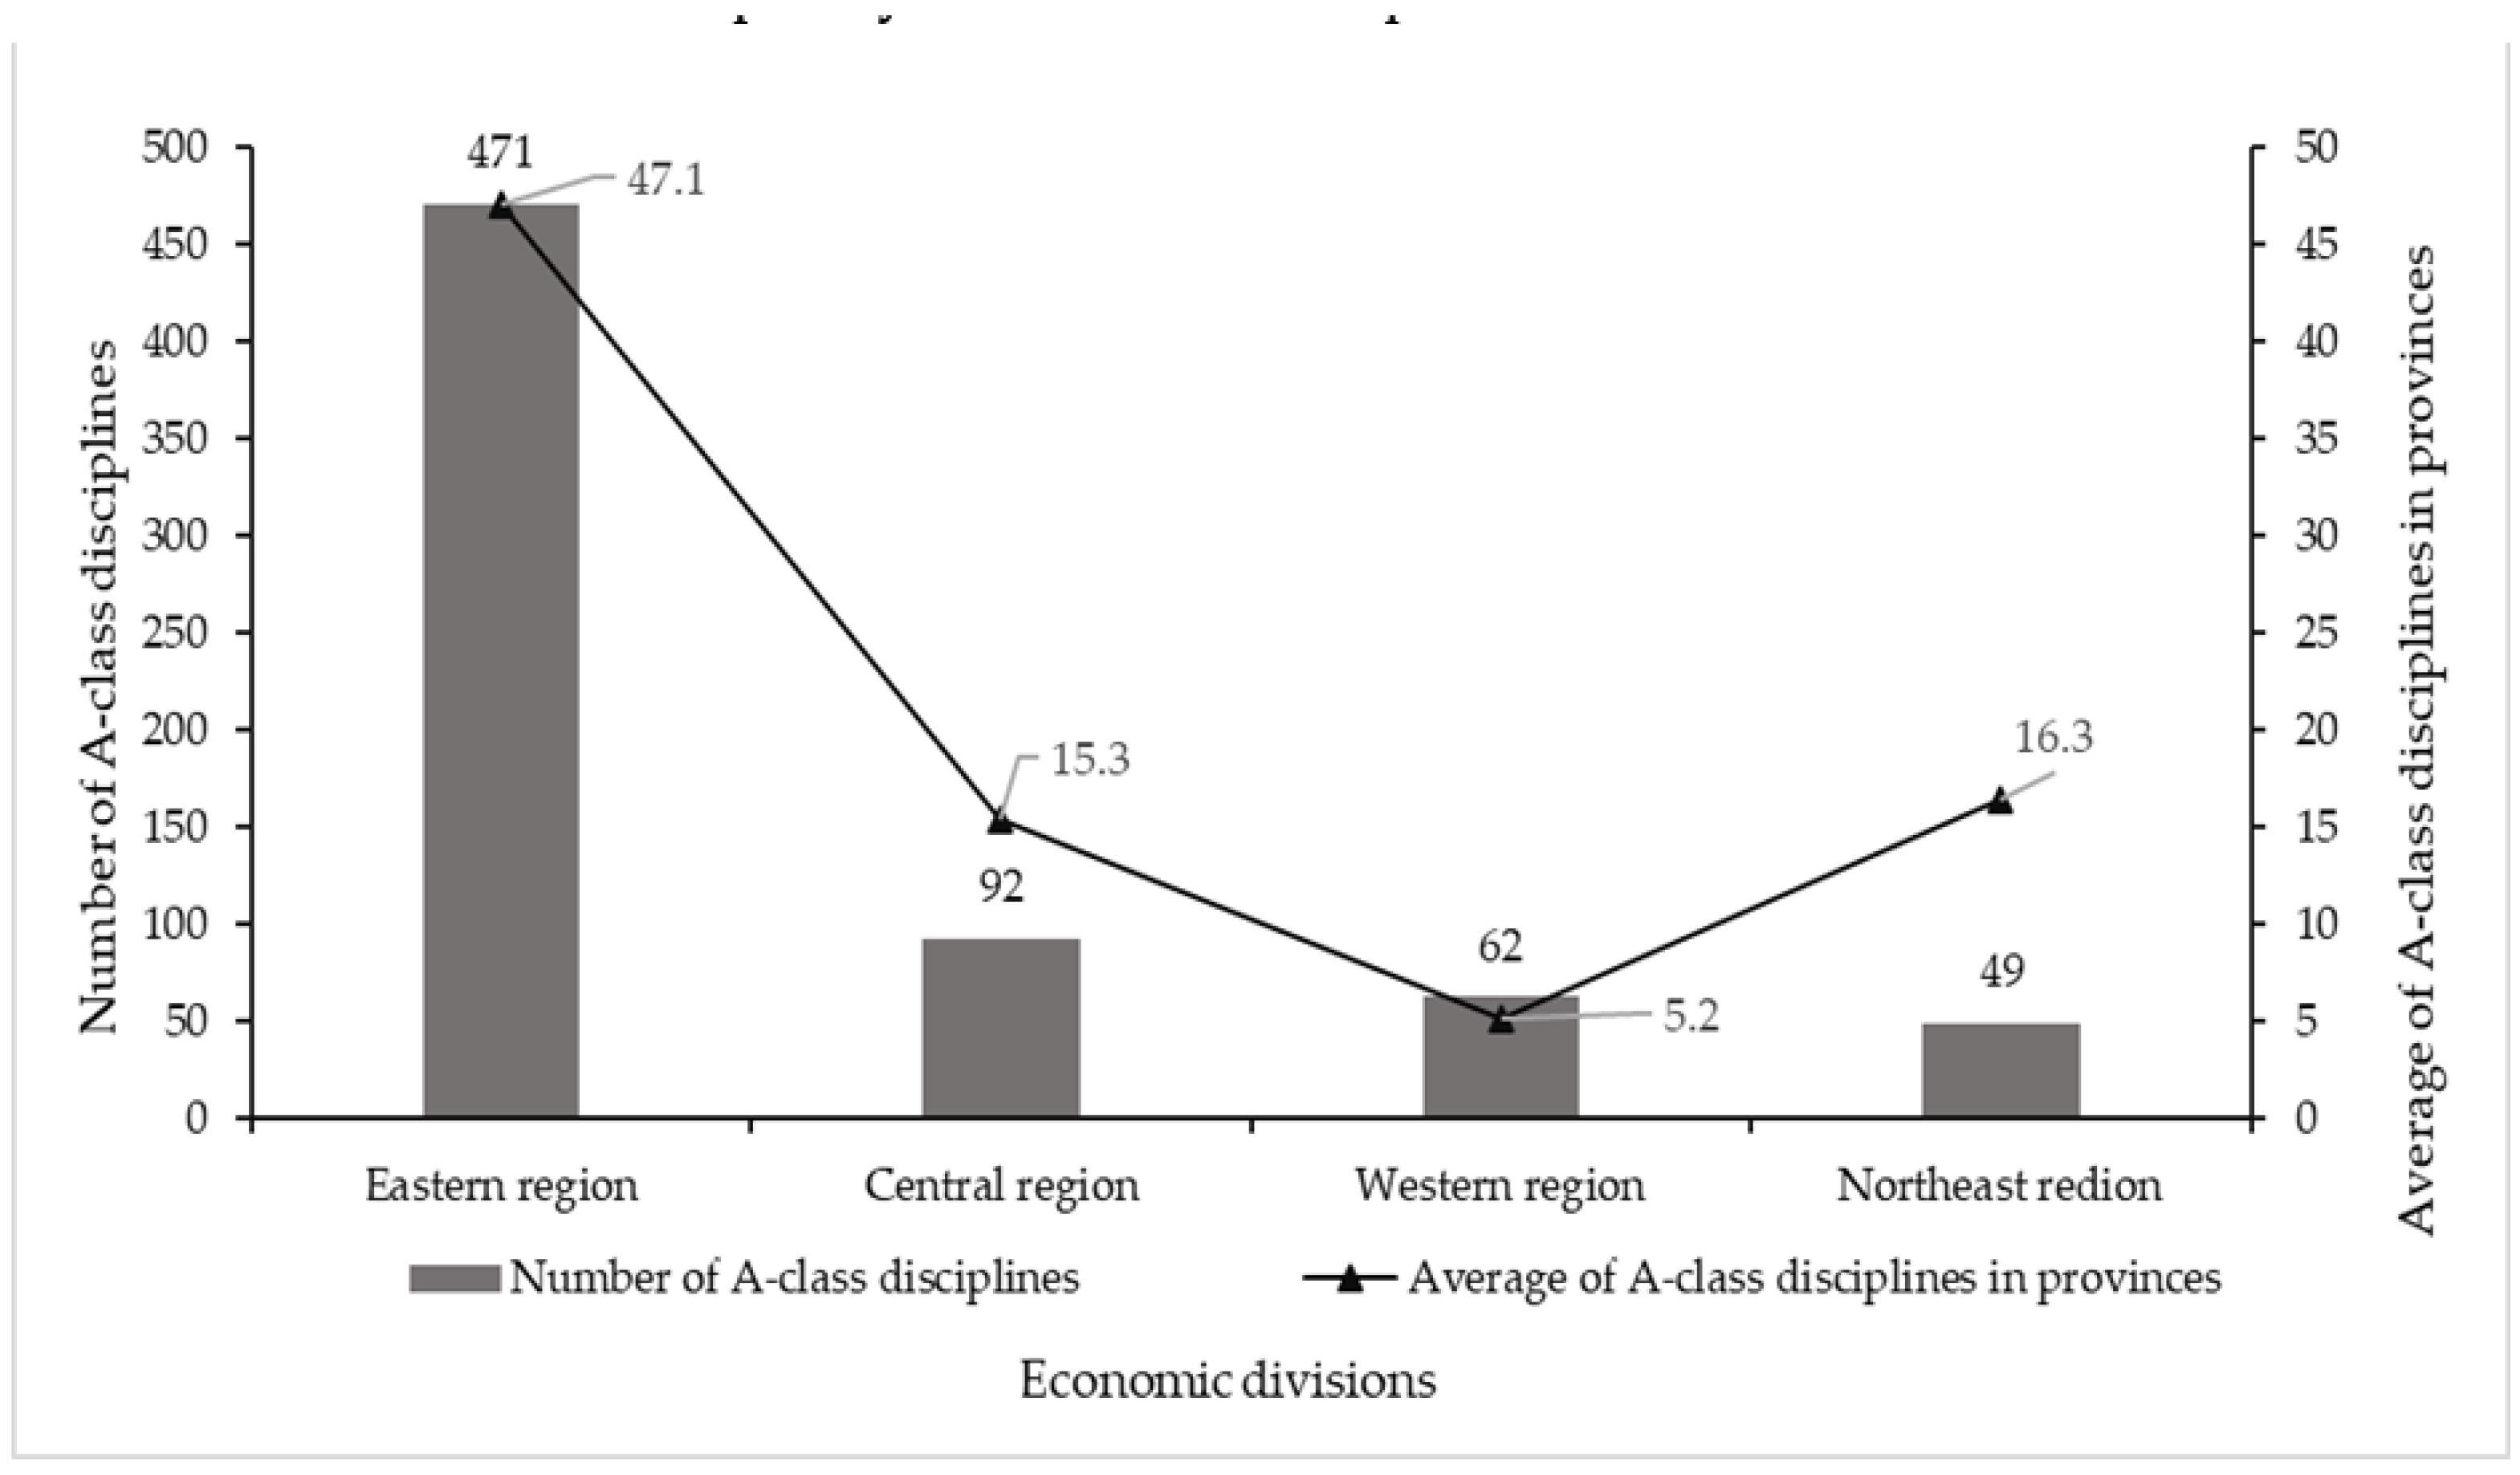
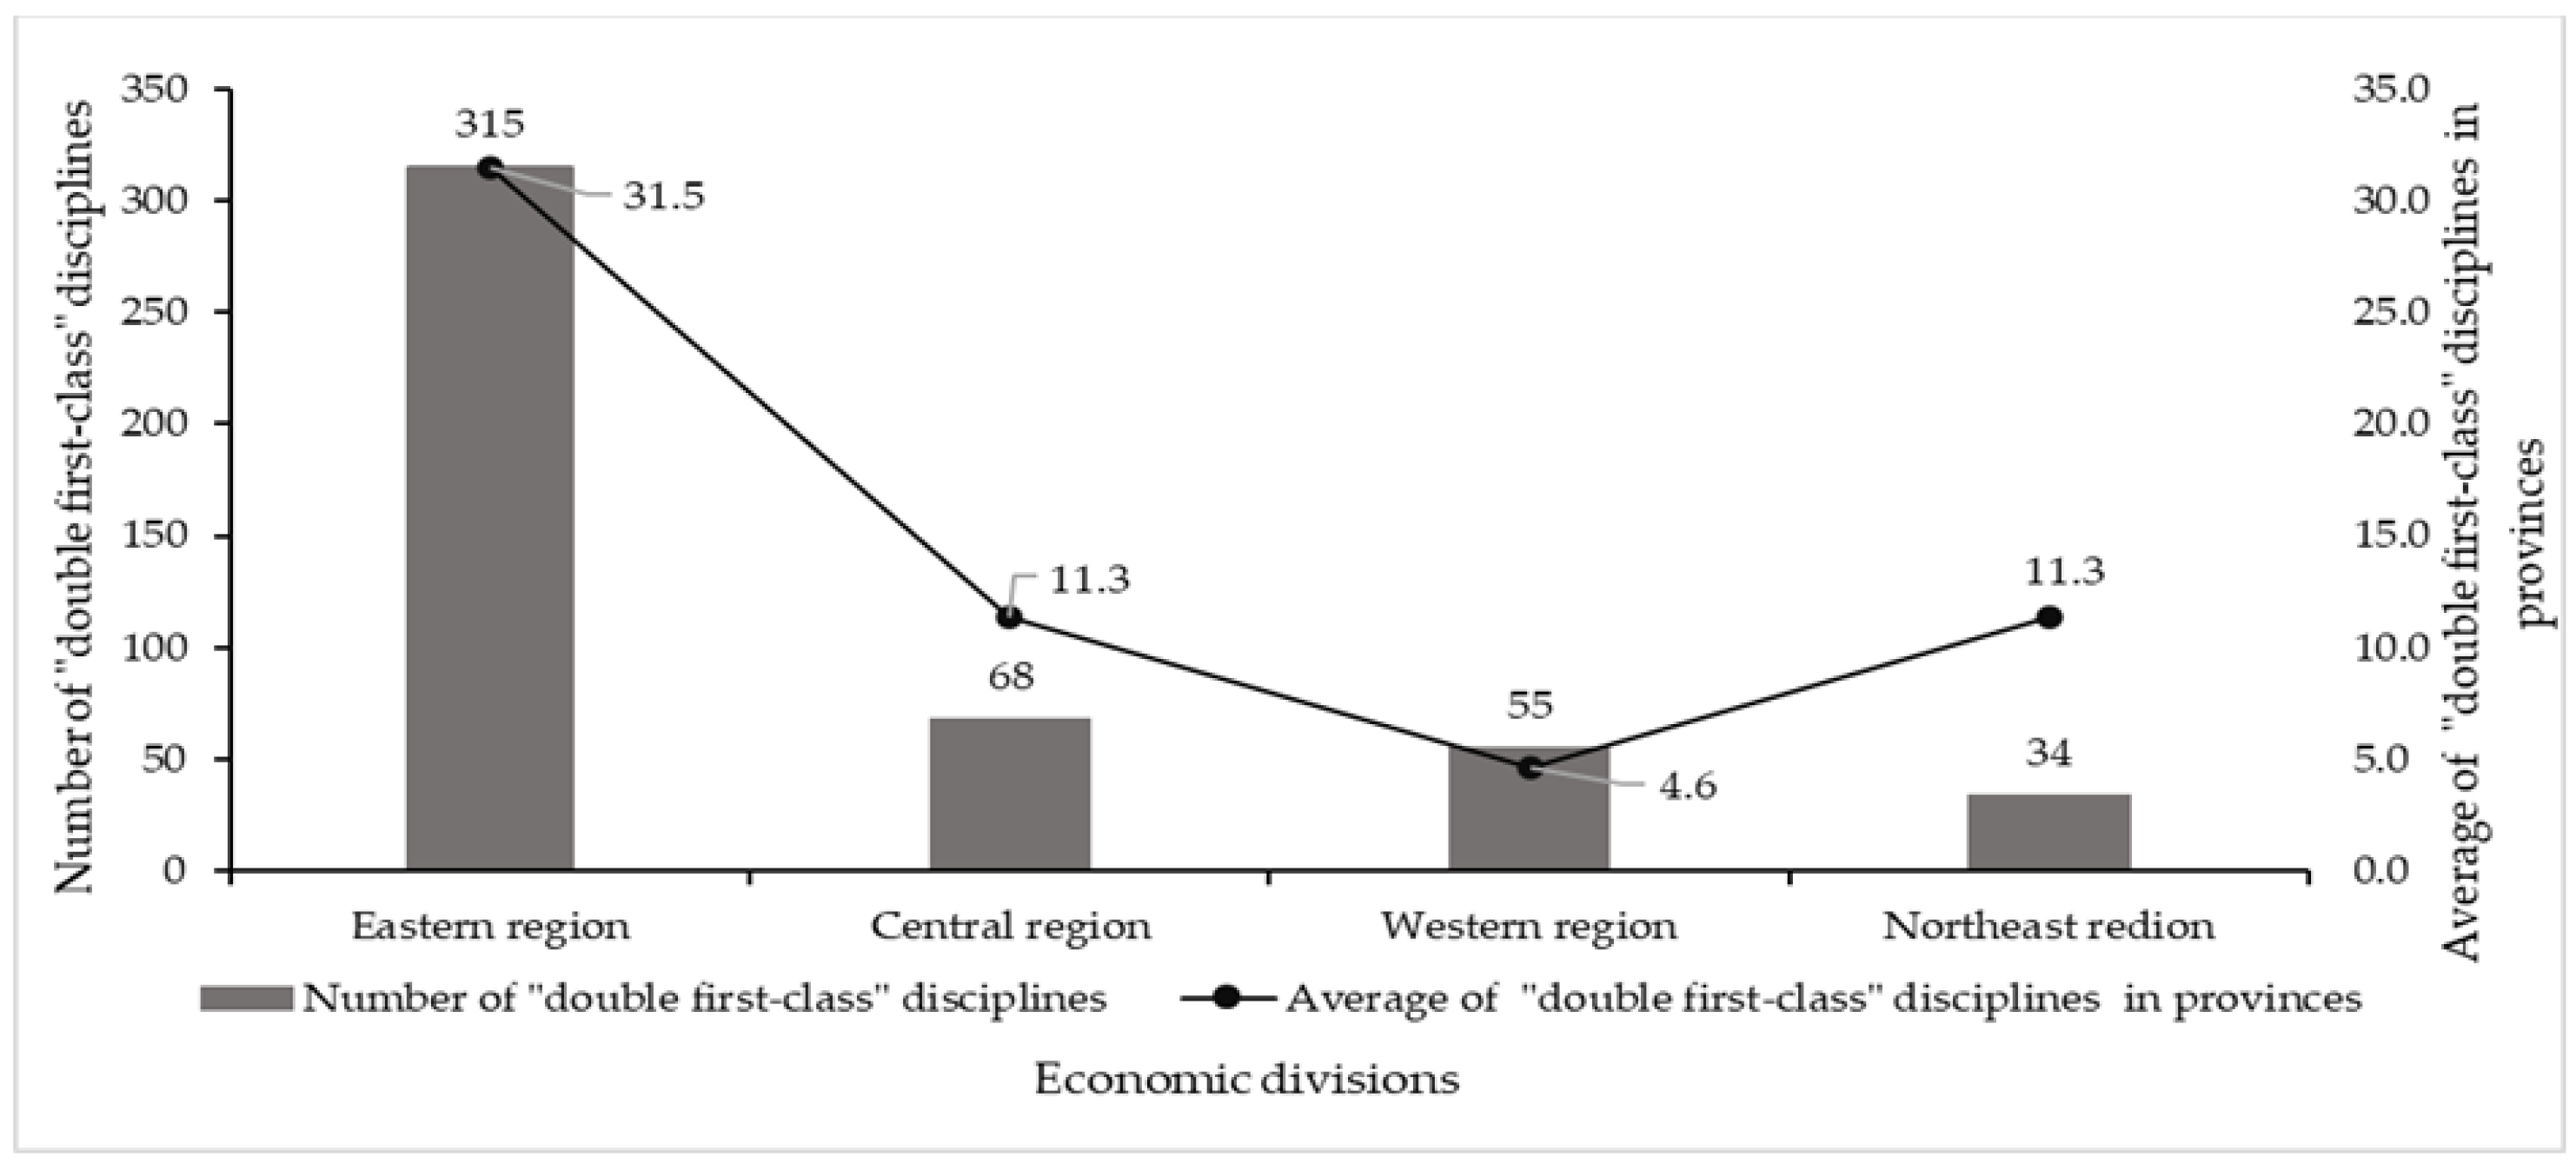
4.3.1. Distribution of the Quality of Doctoral Disciplines in Different Economic Divisions

There was a distribution pattern of “strong in the east and weak in the west” among the economic regions. In terms of the number of A-class disciplines, the eastern region had the largest number of A-class disciplines with 471, accounting for 69.9% of the total; the central region had 92, accounting for 13.6%; the western region had 62, accounting for 9.2%; and the northeastern region had the least number of disciplines with 49, accounting for 7.3%. From the viewpoint of the average number of A-class disciplines by province, the average in the eastern region was still the highest with 47.1; the number in the northeastern region and the central region were basically the same, at 16.3 and 15.3, respectively; and the average in the western region was the lowest with 5.2. See Figure 7 for details.
The differences in the number of “double first-class” disciplines and the average number of “double first-class” disciplines in the different economic regions were basically the same. The overall number was highest in the eastern region, followed by the central and western regions, and the northeastern region had the lowest number. The average number of “double first-class” disciplines per province was also highest in the eastern region, followed by the northeastern and central regions, and the western region had the lowest number. See Figure 8 for details.
In general, the spatial distributions of the two indicators that characterize the quality of doctoral disciplines in this study (A-class disciplines and “double first-class” disciplines) were similar, and the quality of the disciplines in the eastern region was higher than that of other regions, especially the western region, and so there was an overall spatial pattern of “strong in the east and weak in the west”.

4.3.2. Distribution of the Quality of Doctoral Disciplines in Different Provinces

The quality distribution of doctoral disciplines by province was consistent with the distribution of “double first-class” universities, and there is a clustering phenomenon by economic region. The differences in the number of A-class disciplines and “double first-class” disciplines between different provinces are obvious (Table 4). The provinces with more than 50 A-class disciplines and “double first-class” disciplines are all in the eastern region, and there were less than 10 in all of the economic regions; however, most of these provinces are in the western region, and the provinces without A-class disciplines are mainly concentrated in the western region. Specifically, the number of A-class disciplines was highest in Beijing, with 185, and there were 11 provinces without A-class disciplines in “double first-class” universities. In the eastern region, Beijing, Jiangsu, and Shanghai had the highest total number of A-class disciplines, which was more than 50; Zhejiang, Guangdong, and Tianjin were next, reaching 30 and above. Shandong and Fujian had 14 and 9, respectively. The three provinces in the northeast region had comparable numbers and more balanced development. In the central region, A-class disciplines were mainly concentrated in Hubei, Hunan, and Anhui, with only one in Jiangxi Province. In the western region, Sichuan and Shaanxi had better discipline development, with 28 and 23 A-class disciplines, respectively; Chongqing, Gansu, and Yunnan had less than 10 A-class disciplines.
The distribution of “double first-class” disciplines was generally consistent with that of A-class disciplines (Table 4). The number of “double first-class” disciplines was also highest in Beijing with 127, accounting for 26.9% of the total, followed by Shanghai and Jiangsu with 65 and 48, respectively, and then Hubei, Shaanxi, Zhejiang, and Guangdong, with more than 20. The number in Ningxia and Qinghai was 0 (note: the two first-class disciplines of Qinghai University and Ningxia University are master’s level disciplines).
Within the same economic region, there were obvious differences among provinces. In the eastern region, the higher quality doctoral disciplines were mainly located in Beijing, Shanghai, and Jiangsu, while Hainan and Hebei had very few. In the northeast region, the three provinces were relatively balanced, among which Liaoning had relatively few. In the central region, the main concentration was in Hubei, while Shanxi, Henan, and Jiangxi had very few. In the western region, the main concentration was in Sichuan and Shaanxi, while the rest of the provinces had very few.
Except for the special case that there were only three “double first-class” universities in Zhejiang, the quality index of doctoral points was high and the quality distribution of doctoral points in each province was highly consistent with the quantity distribution pattern, and the quality distribution of doctoral disciplines in each province was also highly consistent with the distribution of “double first-class” universities. The high-quality doctoral disciplines in the same economic region were concentrated in provinces that had a high concentration of “double first-class” universities (Figure 9).

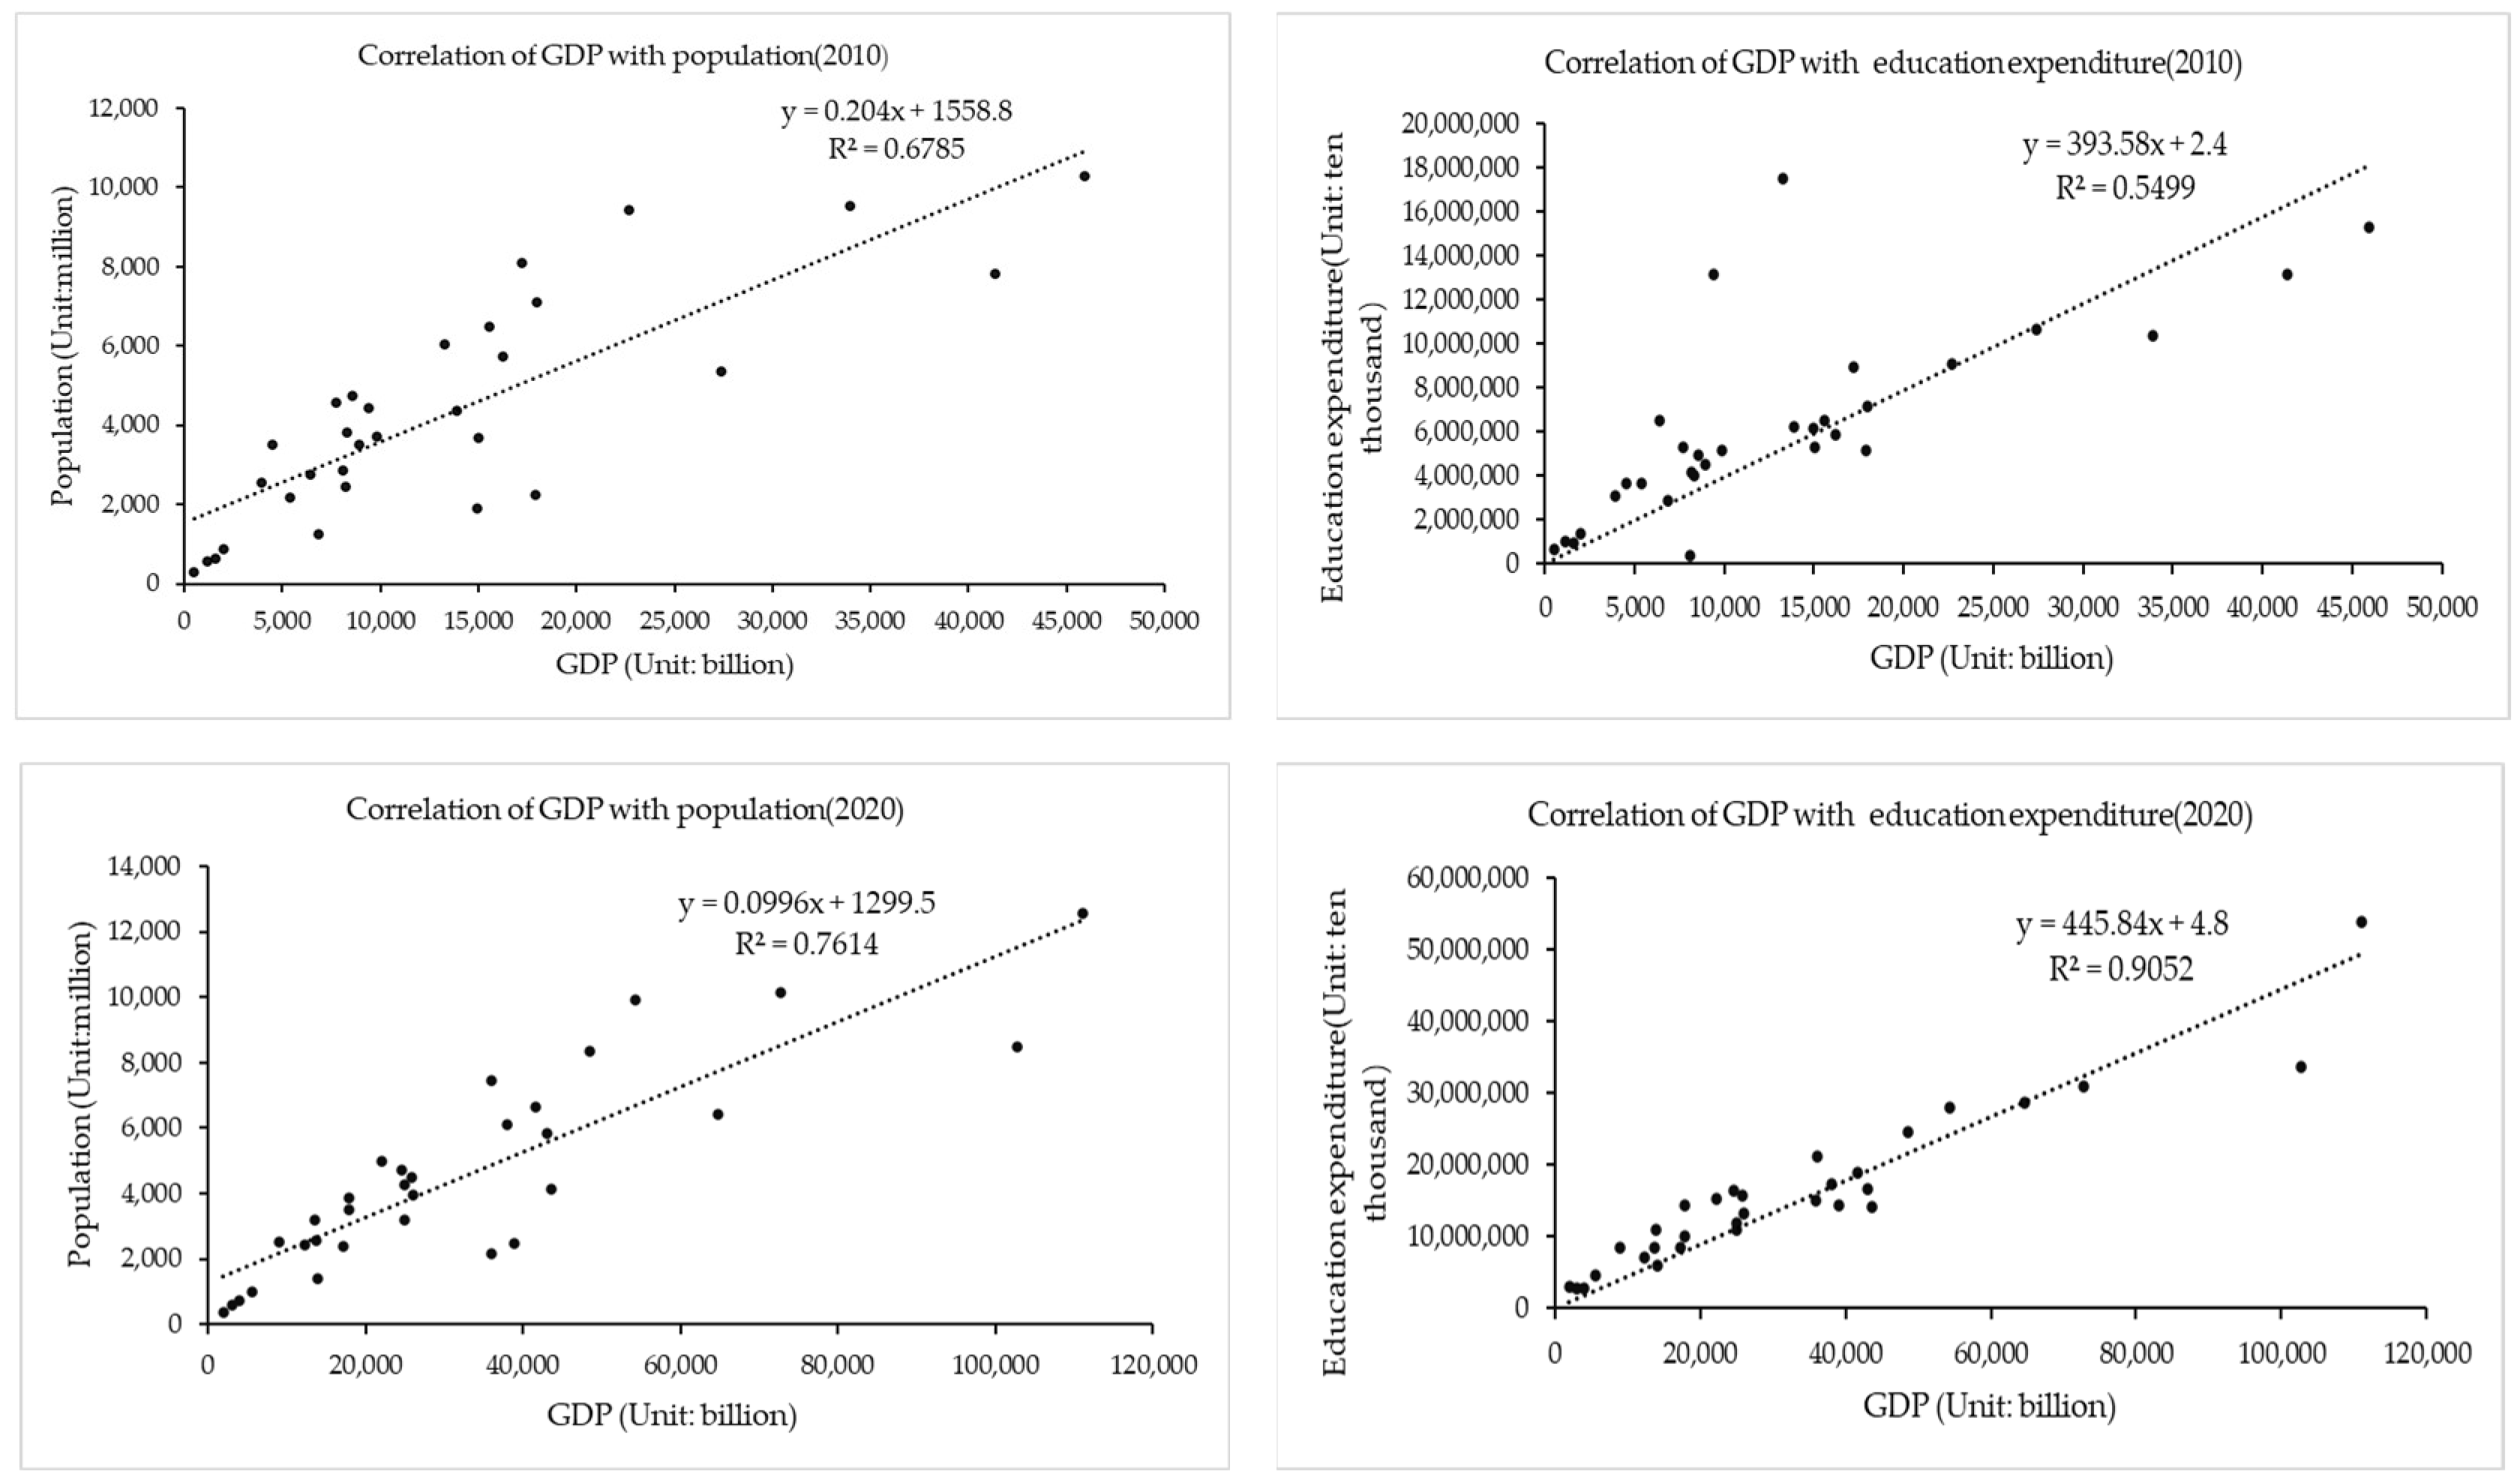
4.4. Influence of Regional Socio-Economics on the Number of Doctoral Disciplines in “Double First-Class” Universities

4.4.1. The Impact of Regional Socio-Economics on Top-Tier Education in the Region

Given that the interval between population censuses in China is ten years, this study used data from the sixth (2010) and seventh (2020) national population censuses to determine the population size and literacy rate in each province; GDP, per capita GDP, and education expenditure were considered as influencing factors on regional economic and social development, and the correlation analysis was conducted using multiple linear regression. The results show that the number of doctoral disciplines in 2010 and 2020 was significantly correlated with the population size and literacy rate. Specifically, the number of doctoral disciplines in 2010 showed a highly significant positive correlation with the population size and literacy rate (p < 0.01); the number of doctoral disciplines in 2020 showed a significant positive correlation with the population size (p < 0.05) and a highly significant positive correlation with literacy rates. The adjusted R2 values of the two years are 0.569 and 0.613, respectively.
The “double first-class” universities were divided into two categories: ministry-affiliated universities and local universities, and the multiple linear regression analysis was conducted again. Ministry-affiliated universities refer to colleges and universities directly managed by the constituent departments of the State Council of the People’s Republic of China. Local universities refer to universities affiliated with provinces under the central government, most of which are supported by local funds and allocated funds from local administrative departments. The results show that the number of doctoral disciplines in both categories of universities had a highly significant correlation with the literacy rates in both years, and slightly different correlations with other influencing factors in different years. Specifically, in terms of the ministry-affiliated universities, the number of doctoral disciplines in 2010 showed a highly significant positive correlation with both GDP and literacy rates. However, the number of doctoral disciplines in 2020 showed a highly significant positive correlation with both population size and literacy rate. The adjusted R2 values of the two years are 0.459 and 0.385, respectively.
The number of doctoral disciplines in local universities showed highly significant positive correlations with both population size and literacy rate in 2010. However, the number of doctoral disciplines in local universities showed a highly significant positive correlation with education expenditure in 2020. The adjusted R2 values of the two years are 0.321 and 0.124, respectively. Thus, the influence of socio-economic influence factors in each region affected ministry-affiliated universities more, while the influence on local institutions was relatively weak (Table 5).
The results of the linear correlation analysis between GDP and the factors of population size, per capita GDP, literacy rate, and education expenditure show a highly significant linear correlation between GDP and population and education expenditure in both years, with R2 values greater than 0.5 and even as high as 0.9, as shown in Figure 10; there was no significant correlation with per capita GDP or literacy rate. Therefore, it can be said that the number of doctoral disciplines is significantly influenced by GDP in addition to the highly significantly correlated factor of literacy rate, which is, in turn, highly correlated with population size and education expenditure.

4.4.2. The Impact of Regional Socio-Economics on Universities

In order to analyze the impact mechanism of regional socio-economics on universities, this paper analyzed the correlation between the average number of doctoral disciplines per university and each regional socio-economic factor. The results are shown in Table 6.
The results show that, as a whole, the number of doctoral disciplines per university was correlated with the two factors of population size and literacy rate. Specifically, the average number of doctoral disciplines per university in 2010 showed a highly significant positive correlation with population size and literacy rate. The average number of doctoral disciplines in 2020 showed a significant positive correlation with population size (p < 0.05), and the adjusted R2 values for the two years are 0.327 and 0.201, respectively.
For ministry-affiliated universities, the average of doctoral disciplines in both years had highly significant positive correlations with GDP and also showed significant positive correlations with literacy rate, with adjusted R2 values of 0.256 and 0.234 in the two years, respectively. For local universities, there was no significant correlation except for a significant positive correlation between the average of number doctoral disciplines in 2010 and population size and literacy rate.

5. Discussion

5.1. Spatial and Temporal Distribution Patterns of Doctoral Disciplines and Their Formation Mechanisms

At present, the scale of doctoral disciplines in China’s “double first-class” universities is expanding, but the problem of inadequate and unbalanced development between different economic regions and different universities is still very prominent, and this difference is reflected in the development speed, scale, and level of doctoral disciplines. The overall pattern of “East is fast and West is slow”, “East is more and West is less”, and “East is strong and West is weak” is unbalanced, and there are many factors that caused these spatial and temporal distribution patterns.
First of all, there is an unbalanced allocation of educational resources in China, which leads to the unbalanced development of the number of “double first-class” universities and doctoral disciplines. At the same time, the setting of doctoral disciplines needs to meet certain standards and conditions. For a long time, some central and western regions lacked high-quality higher education resources, and so it was difficult to meet the requirements to set up doctoral disciplines, while the eastern regions have relatively abundant educational resources and a better foundation, and so the scale of their doctoral disciplines is relatively larger and the quality is relatively higher [56].
Secondly, the unbalanced development of doctoral disciplines is closely related to the existence of skewed national policies in terms of geographical distribution. In particular, after the reform and opening up, to give full play to the comparative advantages of the eastern coastal region, the state has implemented a key development strategy. As the frontier region of China’s reforms and opening-up-driven strategy, the eastern coastal region has received preferential national policies on postgraduate education and the distribution of doctoral disciplines and has strongly supported postgraduate education in the region to achieve leapfrog development. However, this national strategy of prioritizing the development of the eastern region may have further widened the development gap of doctoral disciplines between different regions.
Finally, the differences in social development status in different economic divisions are another important reason. Compared with the western region, the eastern region is developing relatively fast, particularly in science and technology, talents, and environments, and has a relatively higher GDP level and culture. To a certain extent, this provides the basic conditions for the development of doctoral disciplines. At the same time, with the deepening of economic, scientific, and technological exchanges and collaboration between the east and the west, the eastern region has attracted a large number of talents from higher education institutions in the west, forming a trend of “peacocks flying to the southeast” [57]. This phenomenon has led to the loss of a large number of PhD supervisors from western higher education institutions to the eastern region, making it more difficult for western higher education institutions to add new doctoral disciplines and these may even face the situation where the existing doctoral disciplines are canceled due to the loss of key teachers. As a result, the Ministry of Finance and the Ministry of Education have issued a document to prohibit “poaching” from universities in the central and northeastern regions [58].

5.2. The Mechanism of Regional Socio-Economic Influence on Top-Tier Education and Its Response

The factors influencing the development of top-tier education are more complex, and, in terms of causes, historical culture (literacy factor), geographical location (different economic divisions), economic development (GDP factor), and national policies are objective factors that lead to spatial and temporal differences in the size and quality of top-tier education. Although these factors can explain the differences in the development of doctoral disciplines between economic regions, they do not fully explain the mechanisms at work in such differences. Top-tier education shows a high degree of concentration within certain economic regions. The quantity and quality of doctoral disciplines in each economic region are mainly concentrated in a few large provinces or central cities, such as Beijing, Shanghai, Nanjing, Wuhan, Xi’an, and Chengdu.
From a national perspective, although there was a significant positive relationship between regional GDP and the number of doctoral disciplines, it had no obvious influence on the average number of doctoral disciplines per university, and the distribution of the number and quality of doctoral disciplines is basically the same as the distribution of “double first-class” universities in the provinces, which shows that, to a certain extent, the regional economic level has no direct influence on universities. It can be seen that, to a certain extent, the regional economic level has no direct influence on universities, but it does attract talents to enhance the strength of schools and promote the construction of platforms, thus promoting the number of doctoral disciplines. Therefore, the better the regional economic development is, the more income compensation and public service the teachers in colleges and universities can obtain, and the resulting improvement of teachers’ quality of life is conducive to attracting more high-quality teachers. In addition, the higher level of economic development means more complete industrial structures and richer employment platforms and opportunities, which can attract more high-quality students and thus promote the development of doctoral disciplines to a certain extent. Mega-cities or transportation hubs, such as Beijing, Shanghai, and Nanjing in the eastern region, Wuhan in the central region, and Chengdu and Xi’an in the western region, are more capable of attracting talents and have better conditions for the development of top-tier education due to their rich cultural heritage, as well as their superior economic level, per capita income level, public service provision level, and employment opportunities. Generally speaking, the overall strength and level of ministry-affiliated universities in China are usually higher than local universities, while the influence of regional GDP on regional universities mainly manifests in the ability to attract top talents. This effect is stronger for ministry-affiliated universities, while local universities are more influenced by the regional education expenditure. In particular, in 2020, the investment in education funding was significantly and positively correlated with the number of doctoral disciplines in local universities, indicating that local education investment has also exerted a very strong influence on local universities in recent years. Therefore, it can be said that universities’ own development ideas, especially for attracting talents, are the fundamental factors for the formation of top-tier education development gaps between different economic divisions and provinces. This is also the real reason for the “war for talents” between provinces and universities in recent years.
Top-tier education is influenced by the regional economy and culture, but it also profoundly affects the regional economy and culture, promoting economic growth and cultural improvement in many ways. Specifically, on the one hand, doctoral students, as the highest level of education, can greatly improve the average education level of the labor force, enhance the literacy and skills of the working population, and promote economic growth. As high-level talents, PhDs can provide strong human and scientific resources for local communities, thus promoting urbanization. In addition, as a high-income and high-consumption group in China, doctoral graduates can enhance the consumption ability, optimize the consumption structure, and increase consumption willingness, thus promoting economic growth. On the other hand, doctoral graduates usually stay in the cities where universities are located or in the surrounding areas, or in cities with a more developed economy, especially those with famous Chinese universities, and improve the level of doctoral disciplines in these universities, which to a certain extent also causes Zhejiang (with Zhejiang University) and other regions to have a lower number of “double first-class” universities, but the quality of doctoral disciplines is higher. This is also the reason why the quality of doctoral disciplines in Shanghai (with Shanghai Jiaotong University and Fudan University) is higher than that in Jiangsu. At the same time, the economic level and cultural level of the place of employment are improved, and there is a “siphon effect” on the areas around the big cities; for example, the development of Hebei is relatively lagging behind because of its proximity to Beijing. This is also one of the reasons for the high concentration in different economic regions. The current development strategy of the Beijing–Tianjin–Hebei integration is also avoiding this effect.

6. Conclusions

The present study aimed to examine the spatial and temporal variations in the distribution patterns of doctoral disciplines across Chinese “double first-class” universities from 1996 to 2022. It also explored the influence of regional socio-economic factors on these patterns, focusing on economic subregions and provinces as two perspectives for the analyses. The findings indicate noticeable disparities in the speed, scale, and quality of top-tier education among different economic regions and provinces in China. Specifically, the overall trend reveals an imbalance, characterized by rapid development in the eastern region of China and slower progress in the western region, as well as a higher concentration of doctoral programs in the east compared with the west. Moreover, there is a considerable degree of agglomeration of top-tier education within various economic subregions. The primary factors contributing to these disparities include historical issues about the unequal allocation of educational resources in China, as well as the geographical bias of related national policies and the impact of socio-economic development discrepancies across regions, particularly in terms of GDP and literacy rates. Notably, the development strategies adopted by universities, particularly in terms of talent cultivation and recruitment, have emerged as fundamental factors influencing the formation of gaps in top-tier education development between different economic subregions and provinces.
In view of this, the following suggestions are put forward for China’s future policy on the distribution of doctoral disciplines: first, we need to change the traditional passive mode of increasing or decreasing the number of doctoral disciplines, to expand the autonomy of the region as well as of the universities in the adjustment of disciplines, and to avoid over-administration, so that the establishment of disciplines can be more adapted to the socio-economic development of the region, and the talents cultivated by the disciplines adapted to the regions will be more likely to stay in the local area. In fact, over the past 40 years, Chinese provincial governments have been increasingly empowered in this regard, especially in recent years, and some universities have been authorized to carry out the adjustment of disciplines independently, which is a manifestation of this proposal. Second, from the perspective of service demand, a diversified funding system should be established. In the past, the funding for the construction of new doctoral disciplines was supported by the state; in order to increase the participation of local governments, the establishment and construction of doctoral disciplines can be included in the framework of the construction of local high-level universities so that the local governments provide the financial support for new doctoral disciplines and the cultivation of doctoral students. Of course, universities are also encouraged to raise their own funds in order to guarantee sufficient funds for the training of doctoral students. At the same time, for universities or doctoral disciplines that can better serve local economic and social development, special support policies should be considered to improve their ability to serve the social economy. Third, we need to deepen the reform of the management mechanism of university teachers. Behind the vicious competition for the introduction of talents is the problem of China’s educational resource allocation system. It is recommended that the relevant state departments and local governments coordinate the introduction of talents and expand the autonomy of income distribution of university teachers to prevent, as much as possible, the emergence of disordered competition for high-level talents in universities and to positively guide the introduction of high-level talents to avoid vicious competition. This aspect has also been gradually implemented, such as prohibiting eastern universities from “poaching” from western universities and encouraging top teachers from eastern universities to participate in the competition for talent programs in western universities.
This study has certain limitations. On the one hand, the article represents the quality of doctoral disciplines by defining “A” disciplines and “double first-class” disciplines as high quality, which is representative and feasible but does not fully reflect the overall quality of doctoral disciplines. At the same time, due to the problem of data availability, the socio-economic impact factors in this paper are not very adequate. In view of the above problems, the follow-up study will continue to pay attention to various data resources to obtain more comprehensive and complete data; we will also further explore the indicators that can reflect the quality of doctoral disciplines and socio-economics more comprehensively so as to conduct a more detailed investigation into the impact of regional socio-economic development on top-tier education. On the other hand, “double first-class” universities are a special group of universities in China, which are more affected by Chinese policies and actual national conditions, and the distribution and development of foreign disciplines will also be an important reference value for China’s research. However, due to the length of the study, this article focused on the distribution pattern of top-tier education in China, and a cross-country comparative study is too extensive for a single dissertation. Therefore, in the future, we will carry out relevant comparative studies based on the present study to explore the differences in the influences on and characteristics of top-tier education in different countries and societies.

Author Contributions

Conceptualization, X.C.; H.S. and H.Y.; methodology and calculation, H.S.; X.C. and H.Y.; data collection and the result analysis, X.C. and M.D.; writing original draft, X.C.; writing—review and editing, M.D. and X.C. All authors have read and agreed to the published version of the manuscript.

Funding

This research was funded by Project of Association of Chinese Graduate Education (Grant No. 2020MSA154); General Project of Education in Shanghai Philosophy and Social Science Planning (Grant No. A2014); Special Project of Education Policy for Decision-making Consultation of Shanghai Municipal People’s Government (Grant No. 2022-Z-R01).

Institutional Review Board Statement

Not applicable.

Informed Consent Statement

Not applicable.

Data Availability Statement

Data are contained within this article.

Conflicts of Interest

The authors declare no conflict of interest.

References

  1. Chen, H.; He, A.; Wang, D. Reforming the doctoral degree authorization audit to promote the development of local high-level university. J. High. Educ. 2019, 40, 59–66. [Google Scholar]
  2. Ye, M.; Wu, C. Logical roads and practice strategies of the talent cultivation in “double first-class” construction universities. Mod. Educ. Manag. 2023, 9, 64–75. [Google Scholar] [CrossRef]
  3. Wu, L.; Zhang, Y.; Wang, J.; Lu, Y. Scrutinizing and constructing world-class discipline construction: A case study based on the discipline of atmospheric science in Nanjing university of information engineering. Acad. Degrees Grad. Educ. 2020, 11, 37–43. [Google Scholar] [CrossRef]
  4. Zou, Y. Reflection and enlightenment on the “double first-class” construction in local universities. J. Henan Polytech. Univ. (Soc. Sci.) 2023, 24, 58–63. [Google Scholar] [CrossRef]
  5. Chen, W.; Sun, J.; Lin, J. Experience and enlightenment of developing first-class disciplines in foreign entrepreneurial universities: Cases study based on Massachusetts institute of technology, Stanford university and university of Warwick. J. Hefei Univ. Technol. (Soc. Sc.) 2021, 5, 125–132. [Google Scholar]
  6. Xiao, Y. The distribution characteristics and attribution of degree points of higher education in China: A GIS-based method. Rev. High. Educ. 2020, 5, 47–55. [Google Scholar]
  7. Song, X.; Wu, Y. An analysis of features and factors of universities’ flagship disciplines in China. J. South China Univ. Technol. (Soc. Sci. Ed.) 2014, 16, 111–115. [Google Scholar] [CrossRef]
  8. Wang, Y. The evolution of the spatial distribution pattern of higher education institutions in China and its influencing factors. Jiangsu High. Educ. 2022, 12, 39–47. [Google Scholar] [CrossRef]
  9. Zhou, G. Building a system of higher education with Chinese characteristics: From the perspective of national strategy. China High. Educ. Res. 2020, 7, 5–13. [Google Scholar] [CrossRef]
  10. Pan, J. Connotation and action framework of “double first-class” construction. Jiangsu High. Educ. 2016, 5, 24–27. [Google Scholar] [CrossRef]
  11. Yang, L.; Bi, X. On the connotation and characteristics of “double world-class” construction. Univ. Educ. Sci. 2017, 4, 24–30. [Google Scholar]
  12. Zhou, H. The lineage, strategy and inspiration of international higher education spatial layout structure development. Educ. Career 2015, 25, 17–20. [Google Scholar] [CrossRef]
  13. Tang, Z.; Hu, X. Research on influence of regional economy development on higher education based on panel data models. J. Univ. Sci. Technol. Liaoning 2009, 32, 488–493. [Google Scholar]
  14. Liu, G. The evolution characteristics of China higher education spatial distribution and its development trends. J. High. Educ. 2019, 40, 1–9. [Google Scholar]
  15. Hu, G. Research on the Coordinated Development of Regional Economy and Higher Education. Ph.D. Thesis, Tianjin University, Tianjin, China, 2015. [Google Scholar]
  16. Wang, Y.; Xu, W.; Zhang, L. Interaction mechanism and coupling strategy of higher education, scientific and technological innovation ability and regional economy. J. Natl. Acad. Educ. Adm. 2023, 51–59. [Google Scholar]
  17. Xie, F. A re-recognition of the relationship between local higher education and socio-economic development. Jiangsu High. Educ. 2023, 3, 69–73+79. [Google Scholar] [CrossRef]
  18. Xu, X.; Xin, Y.; Ni, H. On China’s higher education structure reform in the context of economic transformation and upgrading. Educ. Res. 2017, 38, 64–71. [Google Scholar]
  19. Liu, S.; Wand, N. Trends of research topics on the relationship between higher education and regional economy—A cites pace-based visualized analysis. J. Hainan Norm. Univ. (Soc. Sci.) 2020, 33, 76–85. [Google Scholar] [CrossRef]
  20. Yang, Z.; Li, D. A study on the relationship between regional higher education development and regional economic development. Acad. Forum 2009, 4, 202–205. [Google Scholar] [CrossRef]
  21. Yang, Y. An analysis of the contradictory nature of the structure of postgraduate majors and regional economic development in China. High. Agric. Educ. 2014, 4, 20–23. [Google Scholar] [CrossRef]
  22. ResearchGate. Available online: https://www.researchgate.net/publication/234656539 (accessed on 15 June 2023).
  23. Schultz, T. The Economic Value of Education; Columbia University Press: New York, NY, USA, 1964. [Google Scholar]
  24. Chellaraj, G.; Maskus, K.; Mattoo, A. The contribution of international graduate students to us innovation. Rev. Int. Econ. 2008, 16, 444–462. [Google Scholar] [CrossRef]
  25. Filippetti, A.; Archibugi, D. Innovation in times of crisis: National systems of innovation, structure, and demand. Res. Policy 2011, 40, 179–192. [Google Scholar] [CrossRef]
  26. Valero, A.; Van Reenen, J. The economic impact of universities: Evidence from across the globe. Econ. Educ. Rev. 2019, 68, 53–67. [Google Scholar] [CrossRef]
  27. Johansen, T.; Arano, K. The long-run economic impact of an institution of higher education: Estimating the human capital contribution. Econ. Dev. Q. 2016, 30, 203–214. [Google Scholar] [CrossRef]
  28. Emilia, C.; Dalina, D.; Ionela, C.; Iustina, B. The impact of higher education funding on socio-economic variables: Evidence from EU countries. J. Econ. Issues 2017, 3, 748–781. [Google Scholar]
  29. Rolf, K.; Maarten, H. How much does education matter and why? Eur. Soc. Rev. 2007, 23, 65–80. [Google Scholar] [CrossRef]
  30. Syeda, M.; Liu, Z. Exploring the relationships between socioeconomic indicators and student enrollment in higher education institutions of Pakistan. PLoS ONE 2021, 16, e0261577. [Google Scholar] [CrossRef]
  31. Capozza, C.; Divella, M. Human capital and firms’ innovation: Evidence from emerging economies. Econ. Innov. New Technol. 2019, 28, 741–757. [Google Scholar] [CrossRef]
  32. Nuñez, I.; Livanos, I. Higher education and unemployment in Europe: An analysis of the academic subject and national effects. High. Educ. 2010, 59, 475–487. [Google Scholar] [CrossRef]
  33. Li, F.; Wang, Y. The role of postgraduate education in the innovation-driven promotion of economic growth. Educ. Res. 2021, 5, 23–29. [Google Scholar]
  34. Li, M.; Sun, Y. Can postgraduate education facilitate regional economic growth: Based on the penal data from 30 provincial-level regions. J. Grad. Educ. 2021, 4, 1–9. [Google Scholar] [CrossRef]
  35. Huang, H.; Li, L. The impact of graduate education on economic growth in China: An empirical analysis on a provincial panel data from1996 to 2009. J. High. Educ. 2012, 33, 57–64. [Google Scholar]
  36. Li, L.; Du, F. Regional differences in the contribution rate of postgraduate education to economic growth and optimization of layout and structure. Educ. Dev. Res. 2020, 21, 28–36. [Google Scholar] [CrossRef]
  37. Qian, Y. Reflections on the organization of academics in the university. Tsinghua J. Educ. 2003, 24, 1–11. [Google Scholar] [CrossRef]
  38. Wang, X.; Peng, Z. World-class universities’ disciplinary selection and distribution: Based on the 2015 QS university subject rankings. J. Soochow Univ. (Educ. Sci. Ed.) 2015, 3, 81–88. [Google Scholar] [CrossRef]
  39. Wu, J. Disciplinary layout and strategic choices of the world’s top young universities—Discussion on the institutional space of the world-class discipline in the developing countries. China High. Educ. Res. 2017, 5, 68–75. [Google Scholar] [CrossRef]
  40. Shen, J.; Hu, J. Preponderant disciplines and world class universities: Evidences from Chinese and American top universities. China High. Educ. Res. 2013, 9, 61–67. [Google Scholar] [CrossRef]
  41. Liu, Z.; Li, Y. An analysis of the optimization path of discipline layout for the construction of “double first-class”. China High. Educ. 2022, Z2, 54–56. [Google Scholar]
  42. Zou, Y.; Yuan, J. Textual analysis of “double first-class” construction programs in 28 provinces: The structural layout characteristics and development trend of first-class disciplines construction as an example. China Univ. Sci. Technol. 2020, 10, 9–12. [Google Scholar] [CrossRef]
  43. Song, Y.; Wang, S.; Qie, H. The discipline layout and generation mechanism of China’s first-class university construction universities. Jiangsu High. Educ. 2018, 9, 9–15. [Google Scholar] [CrossRef]
  44. Li, Z.; Wei, C. The macro-measurement and time-space difference of higher education quality: An empiric study with the data of Chinese university ranking. Educ. Econ. 2018, 34, 61–68. [Google Scholar]
  45. Gao, L.; Kong, L. Driven dually by competition and planning: An optimization strategy in doctorate authorization programs structural layout of colleges and universities in western China. J. Kunming Univ. Sci. Technol. 2020, 20, 86–93. [Google Scholar] [CrossRef]
  46. Yu, X.; Wu, Y.; Fan, W.; Lei, Q. The research of doctorate degree authorization system in different regions and its trend --a longitudinal study based on data of 2005–2011. J. Natl. Acad. Educ. Adm. 2013, 73–77. [Google Scholar]
  47. Central People’s Government of the People’s Republic of China. Available online: https://www.gov.cn/gongbao/content/2001/content_60854.htm (accessed on 25 June 2023).
  48. Ran, L. Development of Regional Higher Education: Historical Changes, Realistic Characteristics and Future Prospects—A Case Study of Shandong Province. Master’s Thesis, East China Normal University, Shanghai, China, 2022. [Google Scholar]
  49. Liu, J. Study on the Provincial Difference of Educational Attainment and Influential Factors in China. Master’s Thesis, East China Normal University, Shanghai, China, 2015. [Google Scholar]
  50. Jin, S.; Fan, M. Efficiency of higher education in China’s region and its development trend. Heilongjiang Res. High. Educ. 2013, 11, 5–8. [Google Scholar] [CrossRef]
  51. National Bureau of Statistics of China. Available online: https://data.stats.gov.cn/index.htm (accessed on 5 June 2023).
  52. Menard, S. Applied Logistic Regression Analysis; Sage: Los Angeles, CA, USA, 2001. [Google Scholar]
  53. Vittinghoff, E.; Glidden, D.; Shiboski, S.; McCulloch, C. Regression Methods in Biostatistics: Linear, Logistic, Survival, and Repeated Measures Models; Springer: Berlin/Heidelberg, Germany, 2007. [Google Scholar]
  54. Gareth, J.; Daniela, W.; Trevor, H.; Robert, T. An Introduction to Statistical Learning: With Applications in R; Springer: Berlin/Heidelberg, Germany, 2013. [Google Scholar]
  55. Venables, W.; Ripley, B. Modern Applied Statistics with S, 4th ed.; Springer: New York, NY, USA, 2002. [Google Scholar]
  56. Guo, C.; Fang, C.; He, F. The impact of doctoral education on the economic growth—From the perspective of the regional differences in doctoral degree authorization. Educ. Res. 2022, 5, 124–138. [Google Scholar]
  57. Chen, B. Thoughts on the regional differences of China’s graduate education. J. Xuzhou Inst. Technol. (Soc. Sci. Ed.). 2012, 27, 93–97. [Google Scholar]
  58. Central People’s Government of the People’s Republic of China. Available online: https://www.gov.cn/zhengce/zhengceku/2022-12/09/content_5730949.htm (accessed on 25 May 2023).
Figure 1. The four economic divisions in China.
Sustainability 15 15277 g001
Figure 2. Changes in the number of doctoral disciplines from 1996 to 2022 in China.
Sustainability 15 15277 g002
Figure 3. Changes in the number of doctoral disciplines in different economic divisions from 1996 to 2022.
Sustainability 15 15277 g003
Figure 4. Changes in the number of doctoral disciplines in “double first-class” universities in each province from 1996 to 2022.
Sustainability 15 15277 g004
Figure 5. Total number of doctoral disciplines in different economic divisions and average number of doctoral disciplines in provinces, 2022.
Sustainability 15 15277 g005
Figure 6. Distribution of the number of doctoral disciplines in “double first-class” universities in each province in 2022.
Sustainability 15 15277 g006
Figure 7. Total number and provincial average of A-class disciplines in each economic division of “double first-class” universities. The data here are the sum of the number of A-class disciplines (including A+, A, and A− from the results of the third and fourth rounds of discipline evaluations, where the number of A-class disciplines was obtained in the third round using the calculation method of the fourth round.
Sustainability 15 15277 g007
Figure 8. Total number and provincial average of “double first-class” disciplines in each economic division. The data here are the sum of the number of “double first-class” disciplines in the two rounds.
Sustainability 15 15277 g008
Figure 9. The distribution of A-class disciplines and “double first-class” disciplines in each province.
Sustainability 15 15277 g009
Figure 10. Correlation between GDP and population size and education expenditure.
Sustainability 15 15277 g010
Table 1. List of the four economic divisions in China.
Economic DivisionProvincesNumber of Provinces
Eastern
Region
Beijing, Tianjin, Hebei, Shanghai, Jiangsu, Zhejiang, Fujian, Shandong, Guangdong, and Hainan10
Central
Region
Shanxi, Anhui, Jiangxi, Henan, Hubei, and Hunan6
Western
Region
Inner Mongolia, Guangxi, Chongqing, Sichuan, Guizhou, Yunnan, Tibet, Shaanxi, Gansu, Qinghai, Ningxia, and
Xinjiang
12
Northeast RegionLiaoning, Jilin, and Heilongjiang3
Table 2. Changes in the number of doctoral disciplines in different economic divisions from 1996 to 2022.
Economic Division1996199820002003200620112018202020212022Average Annual GrowthNumber of ProvincesAverage Provincial Growth in the Region
Eastern region162233654856401163135314001485151857.8105.8
Central region3447812117734843545247848318.563.1
Western region2468612016134143844647748918.7121.6
Northeast region22952701011832102142232258.632.9
Table 3. Changes in the number of doctoral disciplines in different provinces of “double first-class” universities from 1996 to 2022.
Economic
Division
Province1996199820002003200620112018202020212022Average Annual GrowthNumber of “Double First-Class” Universities
Eastern regionBeijing1110415118623641846848750451319.334
Jiangsu031608411021224725127127510.616
Shanghai23661821021842172272472559.715
Guangdong0142240561071411461591666.48
Tianjin21222294168747780823.15
Shandong0714213463747676783.03
Zhejiang11727304059686973732.83
Fujian026101740444751522.02
Hainan001115101013130.51
Hebei001237101011110.41
Central regionHubei1244162851411641681741786.87
Hunan111203446941161251281284.95
Anhui1915202548586066672.53
Henan0000833505052522.02
Shanxi00141024323436361.42
Jiangxi001138151522220.81
Western regionShaanxi2244053711251421471561596.08
Sichuan015293955961141141211254.88
Chongqing0411202447606164672.62
Gansu0355719232525271.01
Xinjiang0000012222223230.92
Yunnan0012213212122220.81
Guangxi000008171719190.71
Guizhou000018171719190.71
Inner Mongolia000117121213130.51
Ningxia00000566770.31
Qinghai00000111550.21
Tibet00000033330.11
Northeast regionJilin1613193569788083843.23
Liaoning1917243360727274742.84
Heilongjiang01422273354606266672.64
National23342581796107920352436251226632715103.5147
Table 4. A-class disciplines and “double first-class” disciplines in different economic zones by province.
Economic DivisionProvinceNumber of A-Class DisciplinesNumber of “Double First-Class” DisciplinesNumber of “Double First-Class” Universities
Eastern regionBeijing18512734
Shanghai866515
Jiangsu744816
Zhejiang42233
Guangdong31218
Tianjin30145
Shandong1483
Fujian972
Hainan011
Hebei011
Central regionHubei49327
Hunan27155
Anhui15133
Jiangxi111
Henan042
Shanxi032
Western regionSichuan28158
Shaanxi23218
Chongqing752
Gansu241
Yunnan221
Guangxi011
Guizhou011
Inner Mongolia011
Ningxia001
Qinghai001
Tibet011
Xinjiang042
Northeast regionHeilongjiang21124
Jilin17143
Liaoning1184
National674472147
Table 5. Multiple linear regression results.
Total Number of Doctoral
Disciplines (log)
Total Number of Doctoral
Disciplines in Ministry-Affiliated
Universities (log)
Total Number of Doctoral
Disciplines in Local Universities (log)
201020202010202020102020
Population0.920 ***(0.208)0.797 **(0.149) 0.970 ***(0.333)0.505 ***(0.163)
GDP 0.845 ***(0.263)
Literacy rate1.143 ***(0.208)0.877 ***(0.149)0.968 ***(0.263)1.385 ***(0.333)0.513 ***(0.163)0.331 (0.208)
Education expenditure 0.426 **(0.208)
Constant2.552 *** (0.200)3.763 *** (0.141)2.150 *** (0.256)2.647 *** (0.315)1.150 *** (0.157)2.465 *** (0.204)
Observation313131313131
R20.5970.6390.4950.4260.3670.182
Adjusted R20.5690.6130.4590.3850.3210.124
Residual std. Error (df = 28)1.1130.7871.4271.7520.8721.136
F statistic (df = 2;28)20.768 ***24.753 ***13.726 ***10.377 ***8.101 ***3.121 *
Note: Bolded numbers indicate significant correlations; * p < 0.1, ** p < 0.05, *** p < 0.01.
Table 6. Multiple linear regression results.
Average of Doctoral Disciplines Per Universities (log)Average of Doctoral Disciplines
in Ministry-Affiliated Universities (log)
Average of Doctoral Disciplines in Local Universities (log)
201020202010202020102020
GDP −0.465 (0.345)0.565 **(0.209)0.697 **(0.260)
per capita GDP −0.257 (0.169)
Population0.482 ***(0.139)0.662 **(0.309) 0.264 **(0.128)
Literacy rate0.390 ***(0.139) 0.390 *(0.209)0.485 *(0.260)0.227 *(0.128)
Constant1.626 *** (0.134)2.786 *** (0.092)1.490 *** (0.204)1.973 *** (0.255)0.852 *** (0.123)2.110 *** (0.177)
Observation313131313131
R20.3720.2810.3050.2850.1810.000
Adjusted R20.3270.2010.2560.2340.1220.000
Residual std. Error0.744 (df = 28)0.514 (df = 27)1.136 (df = 28)1.421 (df = 28)0.684 (df = 28)0.985 (df = 28)
F statistic8.298 *** (df = 2;28)3.509 ** (df = 2;27)6.150 *** (df = 2;28)5.590 *** (df = 2;28)3.093 * (df = 2;28)
Note: Bolded numbers indicate significant correlations; * p < 0.1, ** p < 0.05, *** p < 0.01.
Disclaimer/Publisher’s Note: The statements, opinions and data contained in all publications are solely those of the individual author(s) and contributor(s) and not of MDPI and/or the editor(s). MDPI and/or the editor(s) disclaim responsibility for any injury to people or property resulting from any ideas, methods, instructions or products referred to in the content.

