Article

Can Grassroots Governments’ Environmental Attention Effectively Improve Air Pollution? Empirical Evidence from Satellite Remote Sensing Technology

School of Business, Shandong Normal University, Jinan 250358, China
*
Author to whom correspondence should be addressed.
Sustainability 2023, 15(21), 15309; https://doi.org/10.3390/su152115309
Submission received: 12 September 2023 / Revised: 14 October 2023 / Accepted: 20 October 2023 / Published: 26 October 2023
(This article belongs to the Special Issue Innovation and Sustainable Development of Remote Sensing Technology)

Abstract

:
Air pollution poses a global challenge, prompting governments worldwide to implement environmental policies aimed at its mitigation. However, grassroots management is key to the effectiveness of pollution management. Traditional air monitoring, ranging from a specific point to broader areas, has inherent limitations. In contrast, satellite remote sensing technology offers extensive spatial and temporal coverage, enabling real-time monitoring of data transmission. Can the amalgamation of grassroots governance and satellite remote sensing technology significantly enhance air pollution control? This article leverages satellite remote sensing data and county-level economic and social data from China spanning the period 2008 to 2019 to empirically explore the impact and mechanism of government environmental constraints on air pollution in grassroots areas. The following results were found: (1) Grassroots government environmental constraints exert a significant inhibitory effect on air pollution, and this conclusion remains valid after a series of robustness tests. (2) Mechanism tests reveal that grassroots government environmental constraints reduce county-level air pollution by fostering urbanization, enhancing industrial structures, and promoting innovation in green technologies. (3) There exists heterogeneity in the inhibitory effect of grassroots environmental constraints on air pollution, with a more pronounced impact in areas focusing on environmental protection, facing no economic constraints, large-scale, and located in central and western regions. The green governance awareness of a higher-level government shows an interaction effect on the reduction in environmental constraints at the grassroots government level, collectively contributing to the decrease in regional air pollution. The conclusion of this article underscores the vital role of satellite remote sensing technology in pollution control and provides insights into the direction of environmental regulation.

1. Introduction

Being the world’s most industrialized nation, China faces severe air pollution [1]. Globally, air pollution poses a grave governance challenge and represents a severe threat to both socioeconomics and public health [2,3,4]. In recent years, air pollution has been controlled to some extent due to a series of nationwide environmental regulatory policies introduced one after another by the Chinese central government, which has attached great importance to air pollution [5]. Nevertheless, the majority of prior research has validated the direct suppressive impact of environmental regulations on pollution as a whole, or the displacement effect on corporate green technologies [1,6], with only limited attention being given to the influence of grassroots environmental governance objectives on air pollution.
The unitary state structure and the system of territorial responsibility have established a clear division of powers and responsibilities between the central and local levels in the realm of environmental governance. This means that environmental laws, regulations, and policies are primarily crafted by the central government. The primary challenge in the communication of policies at higher levels of the state lies in the substantial information asymmetry between the objectives of the central government and the actions of local governments [7]. The decentralization of power from the central government to lower levels of government needs to be accompanied by accurate and timely information on the handling of projects under the autonomy of lower levels of government in order to address moral hazards at the local level and to further strengthen the monitoring of local government autonomy. However, with the increasing financial demands, issues like higher-level governments’ blocking of financial funds at lower levels have gradually emerged, which has seriously hampered the development of the grass-roots economy and made the county-level governments unable to fully fulfill the requirements of higher-level policies according to the actual situation. As the national environmental governance system and institutional framework continue to develop, the importance of practical initiatives for environmental governance by local governments, especially at the grassroots level, is becoming increasingly prominent in improving environmental performance. Grassroots governance embodies the immediate execution of environmental policies and serves as the bedrock of national governance.
In late 2005, the Chinese government incorporated local environmental performance in the evaluation criteria for officials, aiming to motivate officials to better synchronize economic and green governance [8]. Studies have revealed that incorporating environmental performance in the annual assessment of local governments can substantially enhance high-quality economic development through environmental target constraints [9]. Nevertheless, based on actual pollution data cases, this promotion incentive gives local governments the tendency to manipulate the data, showcasing improved pollution control performance [10]. Historically, China has primarily relied on traditional point-based monitoring techniques, demanding substantial human and material resources while suffering from inherent limitations. Remote sensing technology has the ability to cover a wide range of times, spaces and spectra, and has the advantages of precision, speed and real-time advancement, which can be more effective in environmental pollution detection. Consequently, remote sensing technology can depict regional air pollution levels and expand the influence of environmental monitoring [11]. So, can grassroots regional environmental constraints, in conjunction with remote sensing technology, effectively mitigate air pollution? In light of this, the paper investigates the impact of government environmental regulations on air pollution in grassroots communities and delves into the underlying mechanisms using satellite remote sensing data and county-level economic and social data spanning from 2008 to 2019. Compared with the existing literature, this paper’s unique contributions can be summarized as follows: firstly, it diverges from previous studies focusing on the micro-level of environmental regulation on corporate emission reduction [12], corporate green innovation [6], and macro-policy indicators such as coal consumption within regions [13]. Starting from the perspective of grassroots environmental governance behavior and leveraging satellite remote sensing technology, this paper empirically investigates the influence of grassroots government environmental regulations on air pollution, pointing out the development direction for enhancing government environmental regulation. Secondly, it explores the intrinsic mechanism of grassroots government environmental regulations on air pollution, analyzing how these regulations promote urbanization, optimize industrial structures, and foster green technology innovation, all of which have implications for refining environmental governance and supporting energy conservation and emissions reduction. Thirdly, from the multidimensional perspectives of governmental governance direction and geographic location, we verify the heterogeneous effects of grassroots environmental constraints on air pollution governance and clarify the focus of grassroots pollution governance tools. Fourthly, from the perspective of collaboration between higher-level government green governance awareness and grassroots governments, we provide an extended study to examine the impact of higher-level government green governance awareness on achieving emissions reduction through environmental constraints at the grassroots government level.
The remainder of the paper is organized as follows: Section 2 analyzes the impact of the relevant literature affecting local environmental governance behaviors and air pollution and formulates the research hypotheses. Section 3 presents data sources, model construction and indicator design. Section 4 reports the baseline test, endogeneity treatment and robustness test of the impact of environmental constraints on air pollution by grassroots governments. Section 5 examines the mechanism of the role of grassroots government environmental constraints on air pollution. Section 6 discusses the heterogeneity effects. Section 7 presents a further discussion. Section 8 summarizes the basic conclusions and provides policy implications.

2. Literature Review and Research Hypotheses

2.1. Environmental Target Constraints and the Impact of Remote Sensing Technologies

Government work reports serve as guidelines and constraints for local governments to recapitulate previous work and delineate future governance priorities. Some local governments have established annual environmental governance targets in their initial government work reports for the year, which not only follow the policy guidelines of the central and higher levels of government, but also take into account local economic, social, environmental and even political factors, and are subject to spillover effects among peer local governments [14]. Once declared, local environmental governance targets are subject to supervision from the central government, higher-level governments, peer local governments, and public scrutiny, so environmental target constraints can effectively enhance the regulatory behavior of local governments [15]. Local governments will also passively take environmental constraint measures to improve the level of environmental constraints. In contrast to the environmental regulations in other regions, local governments are incentivized and compelled by political competition to augment environmental protection investment in their jurisdictions, which in turn leads to the reduction in sulfur dioxide emissions in a performance-oriented manner [16]. The escalation in environmental regulatory stringency can lead to a significant reduction in pollution emissions before the socio-economic structure and production technology reach high levels [12,17]. In addition, the “cost of compliance hypothesis” argues that firms are forced to fight pollution under the pressure of strict government environmental regulation, especially for heavily polluting firms such as industries, which can crowd out firms’ environmentally friendly investments due to the higher costs they have to pay for environmental governance [18,19].
However, the rough development process, with economic performance as the main criterion for local officials’ assessment, has led to a tendency for officials’ governance focus to be on performance assessment, even at the expense of the ecological environment in pursuit of short-term economic growth [20,21]. However, when environmental performance is integrated into the annual assessment of local governments, environmental target constraints can significantly contribute to high-quality economic development [9]. Nevertheless, according to the actual pollution data cases, the environmental incentives make local governments have a tendency to manipulate data in order to show improved pollution control performance [10]. Satellite remote sensing technology offers the capability to cover a wide range of times, spaces and spectra relative to traditional measurement technology, and has the advantages of precision, speed and real-time monitoring, enabling macro-ecological environmental surveillance. It has a broad application prospect in environmental monitoring, which can directly obtain the concentration of sulfur dioxide in space and the changes occurring along with time in real time, which will greatly improve the quantification and refinement level of environmental monitoring and management, and promote the construction of ecological civilization in the world [11,22]. This means that satellite remote sensing technology can reflect the real changes in regional air pollution, thus avoiding behaviors such as data tampering at the local level for environmental performance assessment and further expanding the enforcement of environmental constraints. Based on this, this paper proposes the following hypotheses:
H1. 
There is an inhibitory effect of grassroots government environmental target constraints on county  S O 2  concentrations.

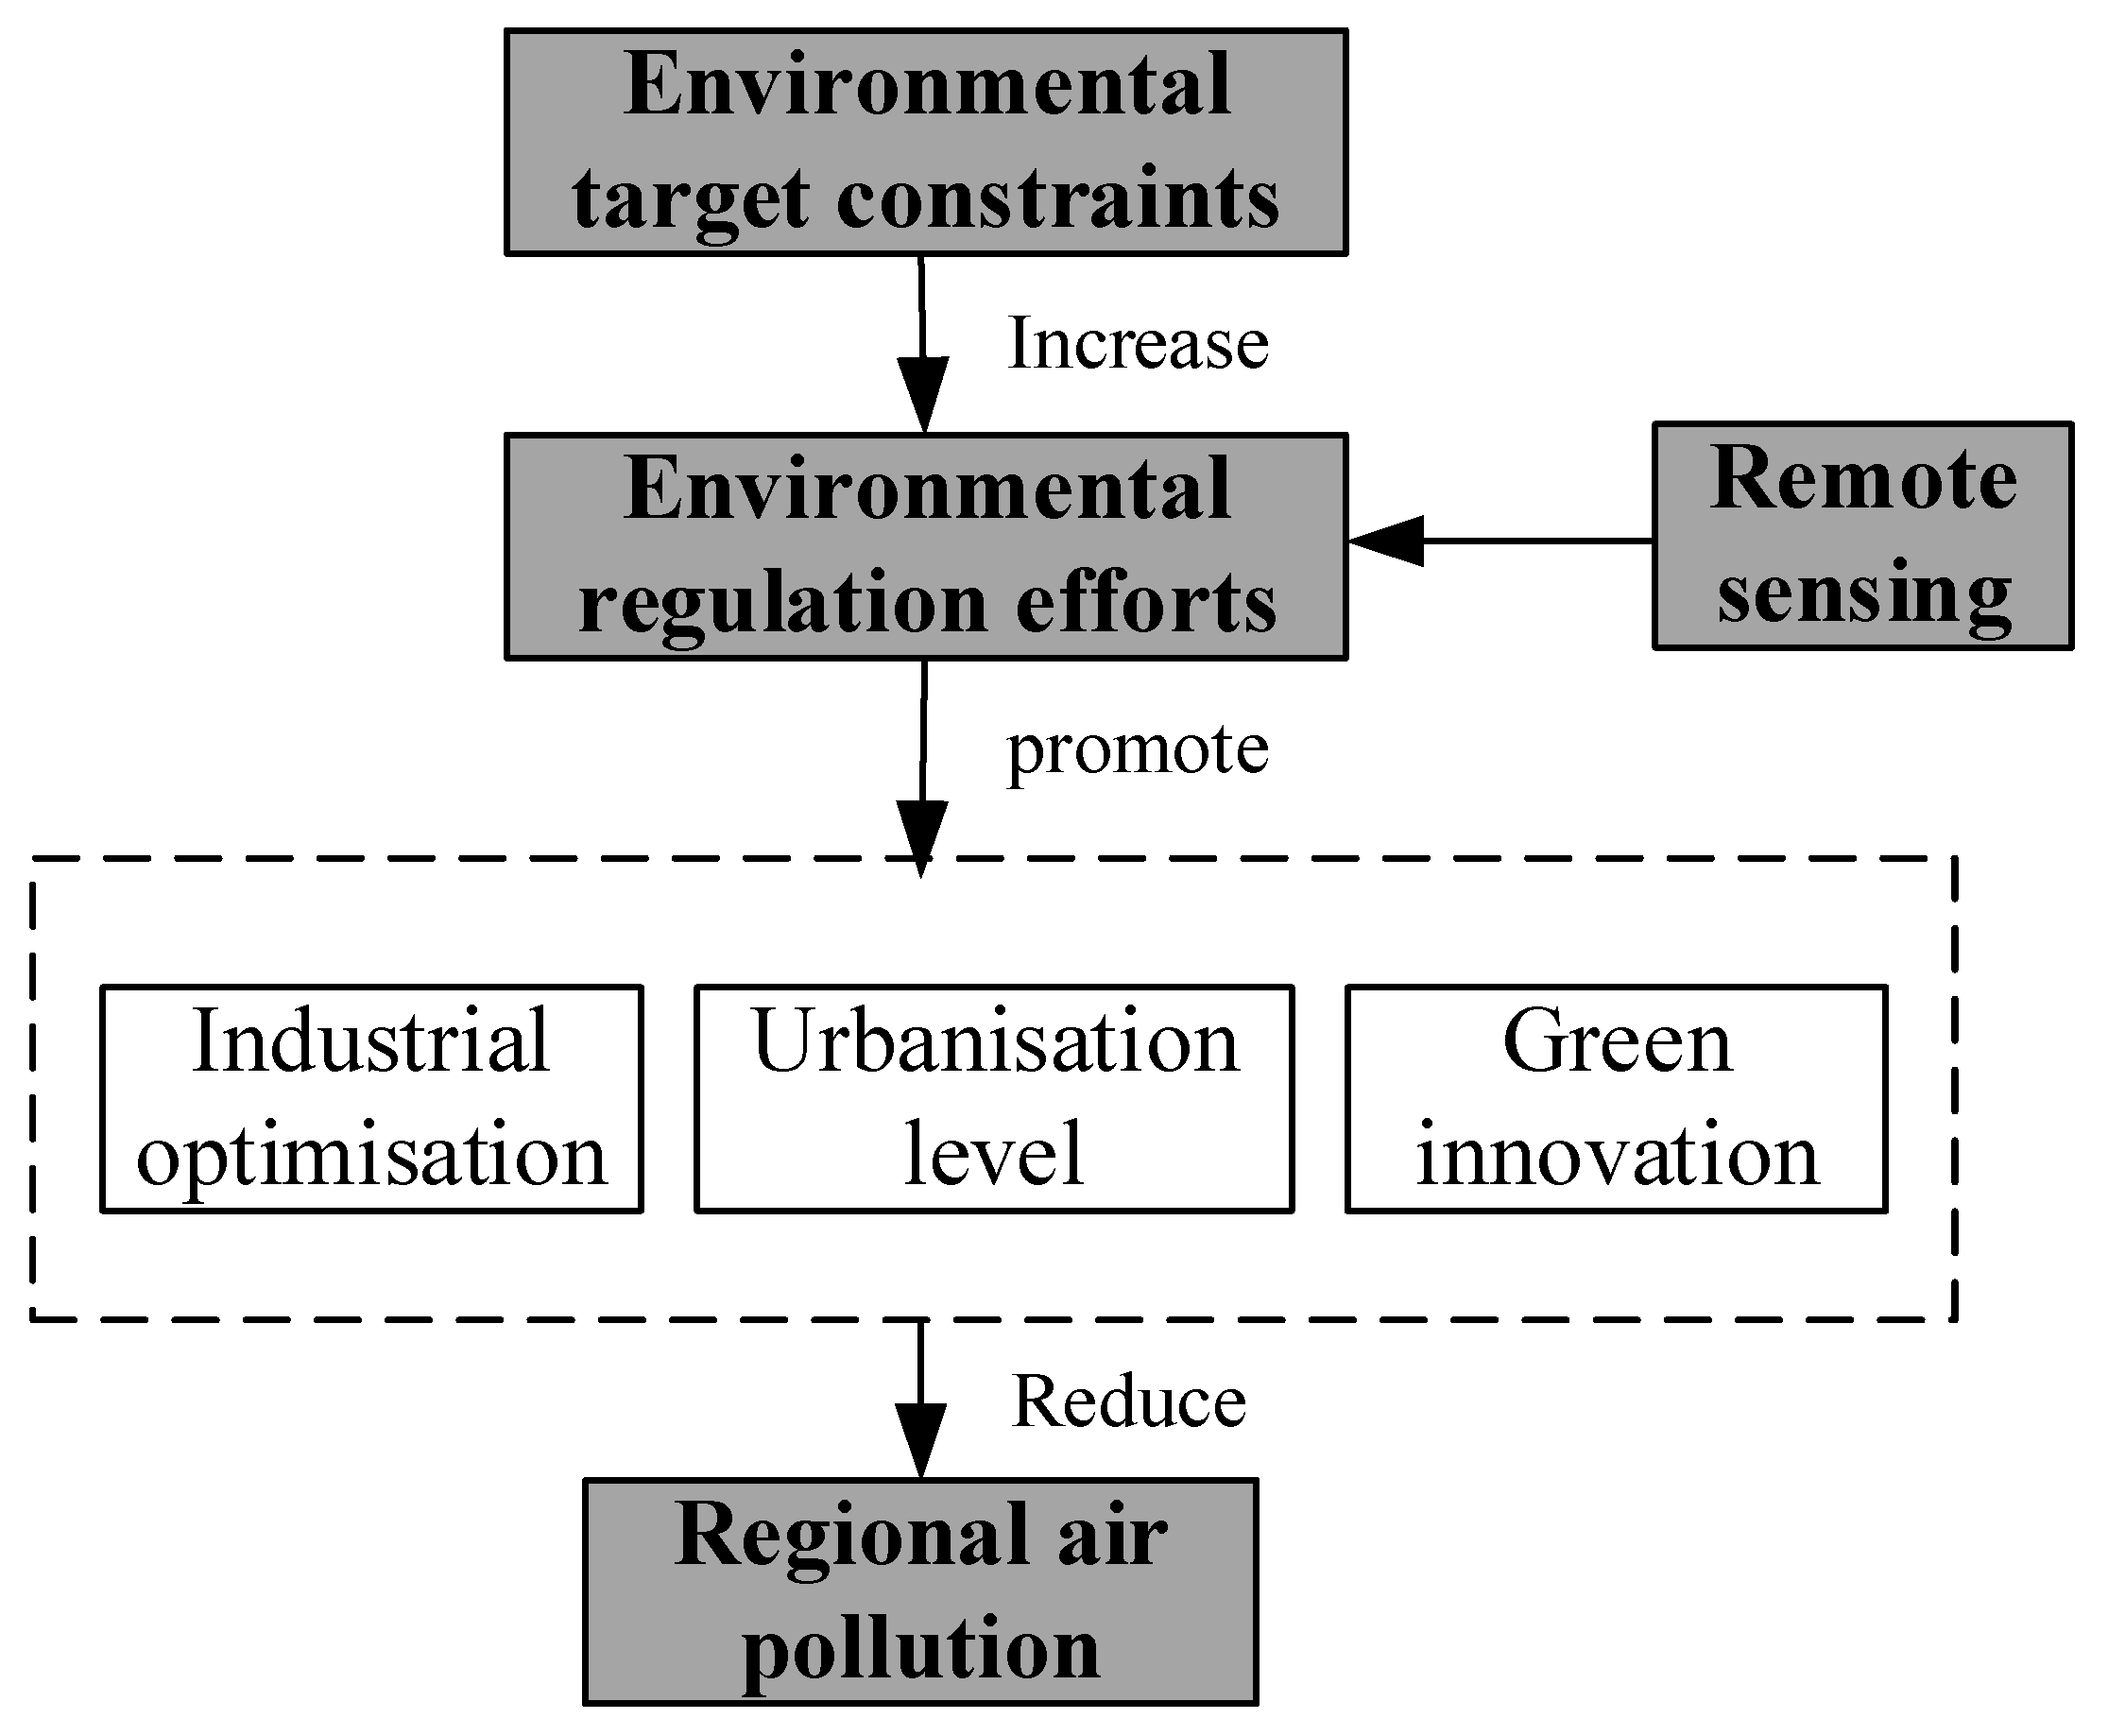
2.2. Transmission Mechanisms

This paper explores the impact of the combination of grassroots government environmental constraints and satellite remote sensing technology on regional S O 2 concentrations that may come from the following sources:
(1) Promoting urbanization. As the level of urbanization continues to increase, it allows air pollution to be improved to a certain extent. Urbanization allows coordinated emission reduction measures in terms of land use, technological innovation and industrial structure, which in turn reduces air pollution levels [23]. Furthermore, green consumption and the adoption of renewable energy sources play a vital role in energy conservation and emission reduction, and urbanization serves as a catalyst for economic quality enhancement, which is able to influence production and consumption patterns [24], provide sufficient labor for the development of the service sector and tertiary industry and lead to changes in energy demand, and ultimately drive the overall economy forward. Therefore, enhancing urban construction efficiency is pivotal in reducing air pollution [23]. Nonetheless, governmental environmental target constraints will strengthen environmental regulation, which can enhance sustainable development capacity by promoting regional urbanization levels and hence sustainable development capacity [25].
(2) Industrial structure optimization. Research indicates that an increase in the proportion of secondary industries exacerbates air pollution [26]. Optimization of industrial structures can improve the intensity of air pollution emissions from regional economic development, which is the primary way to mitigate the impact of fossil energy pollution [27,28,29]. Local governments may be inclined to close down heavily polluting firms in order to reduce sulfur dioxide production [26]. Therefore, environmental regulations can achieve governance effects by adjusting the share of the secondary industry in the economic structure, leading to notable reductions in emissions like sulfur dioxide and nitrogen oxides [28,30]. The government, through environmental target constraints, can restrict emissions from industries, pushing them towards the tertiary sector and consequently lowering air pollution levels.
(3) Promote green technological innovation. Green technological innovation is crucial for achieving a low-carbon economy and mitigating air pollution [31], and can have a significant inhibiting effect on air pollution by improving production technology [32]. Environmental regulation can promote green technological innovation through both increased government subsidies and foreign direct investment [33]. Scientific and effective environmental regulation can attract more investment in R&D and innovation to promote the improvement of energy efficiency [34], promote the advancement of production technology, increase the research of end-of-production treatment, further reducing air pollution emissions [35]. When local environmental regulation reaches the required intensity, it can further improve the effectiveness of pollution control and emission reduction in heavy pollution enterprises by promoting the level of enterprise innovation and R&D [36].
H2. 
Grassroots government environmental target constraints can reduce county  S O 2  concentration by increasing urbanization level, optimizing industrial structure and promoting green technology innovation.
In summary, the assumptions and mechanism of the impact of grassroots environmental constraints on air pollution in this paper are shown in Figure 1.

3. Research Design and Data Sources

3.1. Policy Background

Promoting economic growth is the primary objective of regional development and a crucial factor for stabilizing social employment and improving infrastructure. In 2005, the central government of China incorporated environmental performance into the assessment criteria for the promotion of local officials, aiming to incentivize better coordination between economic development and environmental concerns at the grassroots level [8]. Presently, China follows a policy framework that combines central political authority with local economic decentralization. By devolving economic and environmental governance authority to local governments, the intention is to diversify policy implementation and foster flexible market development [37]. The interpretation of environmental policies by local governments may be influenced by their self-interest, ultimately leading to deviations in the enforcement and governance outcomes. Moral hazards at the local government level are a primary concern in environmental governance.
A local government work report first reviewed the accomplishments of the previous year, providing detailed insights into various initiatives and achievements. Subsequently, it synthesized the goals for the upcoming year, considering both higher-level policy directives and the local development context. This means that the report formulated the year’s plan based on a comprehensive assessment of actual circumstances, ensuring feasibility and authenticity. It serves as a guiding document for grassroots work. Furthermore, local government work reports are made available on official government websites, subject to public scrutiny. This fosters public accountability and supports the government in advancing its subsequent efforts, fully harnessing the functions of local government.

3.2. Sample and Data

This article collects annual government environmental targets from the official websites of various prefecture-level city governments. Using Python text analysis, it applies a filter to determine if there are clear environmental governance objectives. Once the annual government environmental governance targets are announced, they come under scrutiny from the central government, higher-level authorities, peers at the same level of government, and public opinion. Therefore, environmental target constraints can effectively reinforce government environmental oversight actions. In recent years, there has been a gradual increase in the importance of environmental governance at the grassroots level. Regions that are shifting their governance focus from the economy to the environment have been on the rise annually, as illustrated in Figure 2. However, grassroots governance priorities can be influenced by higher-level policies and specific development circumstances. At different times, the focus of grassroots governments may fluctuate, with some years placing a greater emphasis on economic benefits. Figure 3 depicts the regions within the sample period that have, at some point, prioritized environmental governance.
The use of satellite remote sensing technology allows for the rapid acquisition of extensive data over a relatively short period, significantly reducing data collection time. It also lowers the costs associated with both human resources and materials, thus demonstrating its efficiency. Furthermore, satellite remote sensing technology provides data at various scales and resolutions, ranging from high-resolution satellite images to global remote sensing data at medium to low resolutions. This versatility enables cost-effective data acquisition with a high degree of precision and cost-efficiency. Satellite remote sensing data typically encompass information from multiple spectral bands, allowing the monitoring of various types of pollutants such as particulate matter, aerosols, and ozone. In addition, thanks to its numerous advantages, such as the ability to collect extensive data and perform dynamic monitoring, satellite remote sensing technology has found wide applications in atmospheric monitoring. It offers a genuine and direct reflection of local meteorological, environmental, and economic conditions, enhancing the effectiveness of environmental pollution detection. Therefore, satellite remote sensing technology provides a global, high-resolution monitoring tool that can accurately depict the real levels of air pollution in a region. This, in turn, assists governments and research institutions in gaining a better understanding of and managing air pollution, while also extending the impact of environmental monitoring [11].
Building on this, our study selected panel data from 2008 to 2019, which combines satellite remote sensing data with county-level economic indicators to examine the influence of grassroots government environmental constraints on air pollution. The satellite remote sensing data, including surface sulfur dioxide concentrations and nighttime light levels, were obtained from the Goddard Earth Sciences Data and Information Services Center (GES DISC) database, while meteorological data were sourced from the China Meteorological Data Network. GES DISC is primarily responsible for providing data and information services in the field of Earth science. It offers a diverse range of Earth science data, including meteorological, atmospheric, Earth observation, and space weather data, enabling researchers to conduct extensive environmental studies. As a NASA data center, GES DISC meticulously processes and validates data, ensuring its high quality and reliability. Additionally, it provides data access tools, facilitating effective utilization of this data for research in environmental economics.

3.3. Model Setting

In order to test the impact of grassroots government environmental constraints on air pollution, this paper constructs the following empirical model:
l n s o 2 i t = α + β C o n s t r a i n i t + γ C o n t r o l s i t + C o u n t y i + Y e a r t + ε i t
where subscripts i and t represent county and year, respectively. l n s o 2 i t denotes the S O 2 concentration in county i in year t . C o n s t r a i n i t denotes whether the government at the level where county i is located in year t issued a specific environmental constraint in that year, with 1 if a specific indicator exists, and 0 if it does not. C o n t r o l s i t denotes the county-level control variable. C o u n t y i denotes individual county fixed effects, controlling for county characteristics that do not vary over time at the county level. Y e a r t denotes year-fixed effects, controlling for macroeconomic characteristics that do not vary by county but only over time. ε i t is a random error term clustered at the county level.

3.4. Variable Measurement

3.4.1. Explained Variables ( l n s o 2 )

Remote sensing technology is a potent tool for acquiring environmental information due to its ability to cover a wide area in time, space and spectrum. In this paper, based on the satellite remote sensing data released by NASA, the China-wide raster data with the resolution of 0.625 ° × 0.5 ° are cropped and summarized according to districts and counties, and finally, the annual panel data of surface S O 2 concentrations in each district and county are obtained from Goddard Earth Sciences Data and Information Services Center (GES DISC) database.

3.4.2. Core explanatory Variables ( C o n s t r a i n )

Air pollution emissions serve as an intuitive straightforward metric that mirrors the extent of air pollution within a particular area. Conversely, pollution emission reduction can serve as an effective gauge of the region’s commitment to pollution control. The economic growth indicators represent the level of emphasis a region places on economic development. Therefore, this study employed text analysis to screen local government work reports for the presence of specific pollution reduction targets and economic growth indicators. Variables were generated based on this analysis. If a local government’s work report for a particular year explicitly stated numerical pollution reduction targets but lacked rigid economic growth indicators, the region was considered to have placed additional emphasis on environmental governance for that year. In this case, the variable was assigned a value of 1; otherwise, it was assigned a value of 0.

3.4.3. Mediating Variables

In this paper, urbanization level, industrial agglomeration and green technology innovation are selected as mediating variables. Among them, the urbanization level ( C i t y ) is measured by the natural logarithm of the ratio of the total value added by the secondary and tertiary industries to the value added by the primary industry, industrial agglomeration ( I n d u s t r y ) is measured by the ratio of the total value of industrial output to the gross regional product, and green technological innovation ( I n n o v a t i o n ) is measured by the natural logarithm of the average number of green patent applications filed by counties and districts within the same prefectural-level city each year.

3.4.4. Other Control Variables

Referring to the studies of [1,38], this paper tries to control the meteorological variables that have a greater influence on the estimation of S O 2 concentrations as much as possible, specifically including barometric pressure ( l n p r e s s u r e ), precipitation ( l n r a i n ), wind speed ( w i n d ), air temperature ( l n t e m p ) and humidity ( l n h u m i d ) influence factors. In addition, since the grassroots government environmental constraints receive the influence of regional economic development, this paper further controls for economic variables, specifically nighttime light brightness ( l n l i g h t ) and population density ( l n p o p ). Before conducting regression analyses, this paper conducts correlation tests on all the variables and finds that although the correlation coefficients between the variables are significant, none of the values of the VIF test for multicollinearity is greater than 5, indicating that there is no multicollinearity in the regression model. Table 1 shows the descriptive statistics of the main variables.

4. Empirical Analysis

4.1. Baseline Regression

Table 2 presents the results of the baseline regressions of grassroots environmental constraints on air pollution. Column (1) displays the regression outcomes without the incorporation of any control variables, while column (2) shows the regression results with the inclusion of meteorological control variables only, and column (3) shows the regression results with the inclusion of both meteorological and economic control variables. The results show that grassroots environmental constraints have a significant negative effect on S O 2 concentrations, which is consistent with the direction of the core findings of this paper. This suggests that grassroots government attention to the environment can significantly reduce air pollution, and Hypothesis H1 of this paper is verified.

4.2. Endogeneity Test

4.2.1. Instrumental Variable Approach

The assessment in this paper regarding the relationship between grassroots environmental constraints and regional S O 2 concentrations might be influenced by endogeneity issues. To mitigate endogenous estimation bias resulting from reverse causation, this paper employs the mean frequency of environmental protection-related terms in government work reports from other regions within the same province as the instrumental variable (IV). The correlation is valid because there is a local incentive effect of environmental protection emphasis in other regions of the same province. The pollution control in other regions does not have a direct relationship with the S O 2 concentrations in the region, which meets the exogeneity requirement, indicating that the instrumental variable aligns with the selection criteria, and the results are elaborated in Table 3.
Column (1) shows the results of the first stage regression, and the IV estimated coefficients are 0.1641, respectively, and are significantly positive at the 1% level, indicating that the higher the environmental protection importance of the rest of the local government in the province where the region is located, the higher the probability of the region implementing environmental constraints. The F-value in the first stage is 131.98, significantly exceeding the empirical threshold of 10. The Cragg–Donald Wald F-statistic is 512.417, significantly surpassing the critical value of 16.38 at the 10% level, indicating the absence of a weak instrumental variable issue, as per the Stock–Yogo criteria. Furthermore, from column (2), the regression coefficient of grassroots environmental constraints on regional S O 2 concentrations is −0.0332, which is larger than the estimated coefficient in the baseline regression results in Table 2 of this paper, suggesting that endogeneity problems have caused grassroots environmental constraints to seriously underestimate the impact of air pollution.

4.2.2. Propensity Score Matching

Secondly, this paper utilizes the propensity score matching method to address the endogeneity problem by finding regions without environmental constraints as a control group for the grassroots government with environmental constraints, which has the same characteristics as the grassroots government with environmental constraints. In Table 4, (1)–(3) display the test results of the proximity matching, radius matching, and kernel matching methods within the propensity score matching approach, respectively. The results demonstrate that grassroots environmental constraints have a significant inhibitory effect on regional S O 2 concentrations, affirming the robustness of this paper’s central findings.

4.3. Robustness Tests

4.3.1. Replacement of Explanatory Variables

To eliminate the possibility of the inhibitory effect of grassroots environmental constraints on regional air pollution occurring by chance, this section substitutes the explanatory variable from S O 2 concentrations to P M 2.5 concentrations in the regression analysis. The results are elaborated in Table 5. The results demonstrate that grassroots environmental constraints significantly inhibit regional concentrations. This underscores the robustness of the paper’s core conclusions.

4.3.2. Excluding Samples

Based on the agglomeration effect, the huge difference in economic level and industrial structure among different regions may seriously disturb the grassroots government’s attention to the environment. Therefore, in this section, samples at the grassroots level within 100 kilometers of the Beijing-Tianjin-Hebei, the Yangtze River Delta, the Pearl River Delta regions, first-tier cities, district-controlled counties, as well as those located within directly-administered municipalities and provincial capital cities have been sequentially excluded. Regression analysis was conducted using the processed data. Table 6, columns (1)–(4) present the regression results of removing the above samples in turn, and the results show that after removing the disturbing areas, the inhibition effect of grassroots environmental constraints on the regional S O 2 concentrations is still significant, indicating that the core conclusions of this paper are robust.

4.3.3. Exclusion of Other Policies

Since there are multiple environmental regulatory policies and they are concurrently implemented in different places in China, the inhibitory effect of grassroots environmental constraints on air pollution may be interfered with by other related policies. To minimize the impact of random factors on the test results, this paper refers to the study of [1] to identify environmental policies that have a certain impact on regional air pollution and exclude the samples located in pilot areas. Specific policies include the following: ① Ten air policies, which promulgate ten specific initiatives aimed at reducing air pollution, see column (1) of Table 7 for details. ② Carbon Emissions Trading Pilot Policy, which aims to promote the transformation of energy consumption structure and reduce greenhouse gas emissions, as shown in column (2) of Table 7. ③ Environmental Protection Inspection Programme, aiming at regulating ecological environmental protection inspections and promoting the construction of ecological civilization, please refer to column (3) in Table 7 for details. ④ Automatic air quality monitoring stations, which aim to analyze the various pollutants present in the atmosphere in a fixed and continuous manner, as detailed in column (4) of Table 7. The results indicate that after removing the samples within the pilot areas of the above policies in turn, the grassroots environmental constraints continue to exert a significant dampening effect on regional S O 2 concentrations, indicating the robustness of the core findings of this paper.

4.3.4. Placebo Test

To further validate that the trend in S O 2 concentrations between the treatment and control groups is the actual effect of grassroots environmental constraints and not affected by other policies or random factors. Therefore, this paper refers to [39] to validate the baseline results of this paper using a placebo test to ensure the robustness of the core findings. In this section, the results are detailed in Figure 4 by randomly assigning county areas adopting environmental constraints in order to conduct a placebo test. The results reveal that the distributions of the estimated coefficients cluster around 0, and the p-values of most of the estimated values are greater than 0.1, indicating that the inhibitory effect of grassroots environmental constraints on regional S O 2 concentrations is not the result of interference from other factors and that the core conclusions of this paper are robust.

5. Mediating Mechanism

Table 8 presents the results of the mediation test on the impact of grassroots environmental constraints on regional S O 2 concentrations. The results indicate that grassroots environmental constraints in column (1) show a facilitating effect on the level of regional urbanization ( C i t y ). While urbanization is a significant driver of economic growth, it can influence production and consumption patterns [24], leading to shifts in energy demand, which in turn reduces air pollution emissions. Grassroots environmental constraints in column (2) show an inhibitory effect on regional industrial agglomeration ( I n d u s t r y ). This indicates that grassroots environmental constraints can encourage the optimization of the regional industrial structure and reduce the proportion of secondary industries such as manufacturing. In column (3), grassroots environmental constraints stimulate green technological innovation ( I n n o v a t i o n ). This indicates that grassroots environmental constraints can motivate the region to actively carry out green technology research and development, enhancing innovation and production efficiency, and ultimately reducing the S O 2 concentrations. Hypothesis H2 is confirmed.

6. Heterogeneity Analysis

6.1. Government Governance Orientation

This section takes into account that there may be significant differences in the jurisdictional priorities of governments in different regions. In regions designated as critical environmental protection areas, the government pays more attention to monitoring pollution control and rigorously enforcing environmental regulations environmental regulation [1]. Furthermore, economic development, as the main measure of regional performance, may weaken grassroots governance priorities in favor of stimulating economic development by weakening specific environmental indicator constraints if there is economic pressure on the government. For this reason, in this section, based on the “Eleventh Five-Year Plan for National Environmental Protection” issued by the State Council of China, the sample is divided into environmentally focused cities and non-environmentally focused cities, and into regions with and without economic pressure based on the presence or absence of specific economic indicators in the annual work report of the local government, the results of which are shown in Table 9: the inhibitory effect of grassroots environmental constraints on regional S O 2 concentrations is more significant in environmentally focused cities and regions without economic pressure.

6.2. Urban Location Characteristics

Variations in city size give rise to disparities in economics, society, culture, infrastructure, and the environment. Larger metropolitan areas typically accommodate greater populations and a broader spectrum of economic activities and possess more advanced infrastructure and environmental conditions. Consequently, larger counties tend to be more amenable to government environmental governance initiatives, whereas smaller counties may experience a weaker governance effect. Furthermore, substantial disparities exist in the regional economic development of China. Eastern coastal regions exhibit significantly higher technological innovation capacity and productivity compared to the central and western inland regions [37]. The regions analyzed above may undermine the effectiveness of grassroots government environmental constraints on air pollution. Therefore, this paper categorizes the sample into large-scale areas and other areas based on the average household population, and at the same time divides the sample into eastern coastal and central and western areas and conducts regression tests separately. The results are presented in Table 10. The results indicate that grassroots environmental regulations have a more pronounced inhibitory effect on the regional concentration of sulfur dioxide in large-scale areas and central and western areas.

7. Further Discussion

China adopts a governance model of centralized political power at the central level and decentralized economic power at the local level. Local governments have autonomous jurisdiction over various environmental resources and financial directions, including fiscal subsidies, administrative approvals, and energy extraction, granting them substantial intervention capabilities in local economic development. Key officials, as the primary authorities of local government actions, exert diverse actual governance behaviors influenced by personal capabilities such as their experiential background and cognitive patterns [40]. This implies that the actual governance effectiveness of a region largely depends on local government officials [41,42]. As subordinate administrative units of prefectural governments, county-level governments are responsible for the implementation and grassroots governance of local governments. This necessitates cooperation with superiors in economic coordination, infrastructure construction, and resource allocation. So, can the environmental consciousness and emphasis on green development of key officials at the local government level promote the restraining effect of local environmental constraints on air pollution? Based on this, the following model is constructed in this paper:
l n s o 2 i t = α + β 1 ( C o n s t r a i n i t × G r e e n O i ) + γ C o n t r o l s i t + C o u n t y i + Y e a r t + ε i t
l n s o 2 i t = α + θ 1 ( C o n s t r a i n i t × E n v i i ) + γ C o n t r o l s i t + C o u n t y i + Y e a r t + ε i t
G r e e n O i represents whether the principal officials in the government of county i , located in the municipal level city j , have a green background. The definition of “green officials” is based on the research methodology outlined in [43]. It involves manually compiling the names of former mayors and party secretaries from local government official websites across the country. Subsequently, their educational and professional backgrounds are gathered from Baidu Baike, a platform affiliated with China’s largest search engine, Baidu. If a prominent local official has studied environmental sciences, environmental engineering, environmental economics, or related fields during their academic career, they are classified as a “green official”, and the value assigned is 1; otherwise, it is marked as 0. E n v i i represents the comprehensive utilization rate of industrial solid waste in county i , located in the municipal level city j . This variable is used because, when environmental regulations are stringent, local businesses are less likely to emit excessive pollutants, leading to a higher waste utilization rate. Conversely, when regulations are less strict, the utilization rate is lower. Other variable designs are consistent with Model (1).
Table 11 displays the results of the interaction effects test between grassroots government environmental constraints and environmental consciousness, as well as the emphasis on green development by higher-level governments. From columns (2) and (4), it is evident that the regression coefficients are significantly negative, and both coefficients are larger than the baseline regression coefficient (−0.0066) presented in Table 2. This indicates that the environmental consciousness and emphasis on green development by higher-level governments have a positive impact on the emission reduction effects of grassroots government environmental constraints. There is an interactive effect between these factors, collectively reducing regional air pollution.

8. Conclusions and Implications

8.1. Conclusions

Based on the practical application of satellite remote sensing technology, this paper empirically investigates the influence of grassroots government environmental constraints on air pollution and its mechanism of action using satellite remote sensing and county economic and social data from 2008 to 2019 in China. On this basis, robustness tests are conducted by eliminating interfering samples, replacing explanatory variables and placebo tests, and endogeneity problems are controlled using external instrumental variables and propensity score matching. The findings are as follows: (1) Grassroots government environmental constraints exert a substantial mitigating influence on air pollution, which is still true after a series of robustness tests. (2) The mechanism test reveals that grassroots government environmental constraints will not only expedite the urbanization process and foster high-quality economic development, but also optimize the industrial structure and accelerate green technological innovation, which will in turn contribute to the control of air pollution at the production source. (3) Further research found that in the environmental protection priority, no economic constraints, large-scale, and the central and western regions, the environmental constraints of the grassroots government have a more pronounced mitigating impact on regional air pollution. Furthermore, from the perspective of collaboration between higher-level government and grassroots governments, we have conducted an extended study. Empirical findings reveal a positive impact of higher-level government’s green governance awareness and emphasis on green development on the reduction in environmental constraints at the grassroots government level. Additionally, there is evidence of an interaction effect between these factors, collectively contributing to the reduction in regional air pollution.

8.2. Policy Recommendations

While global environmental issues persist, the combination of grassroots government initiatives and satellite remote sensing technology is particularly important in order to better manage and accurately monitor environmental pollution. The research in this paper has the following policy implications: (1) As the grassroots level is directly facing the ecological forefront, county governments’ actual operations play a pivotal role in pollution management. Therefore, the higher-level government should intensify their oversight of grassroots governance practices, and combine with satellite remote sensing technology to monitor the progress of pollution control in real time and accurately, so as to avoid data tampering by the grassroots government in order to meet the policy standards. (2) Environmental target constraints should be both reasonable and tailored to local conditions. Heterogeneity exists in the suppression effect of grassroots environmental constraints on air pollution, and the higher-level government should pay attention to regional differences and other issues when dividing the governance targets for the grassroots, and comprehensively assess the degree of industrial dependence and the difficulty of economic transformation in different regions, and the degree of match between energy-saving and emission reduction targets. (3) In the governance model of local economic decentralization, it is essential to deepen the commitment of local officials to environmental governance and enhance their environmental awareness and skill set. When it comes to the deployment of administrative personnel at various government levels, there should be a focus on the professional background and learning experiences of these officials. This would help match the work assignments and professional experiences of administrative leaders according to the region’s resources, financial situation, and industry characteristics, facilitating a “specialized” synergy in both social green governance and economic development. Furthermore, informal institutions should play a role in intervening in local environmental governance. This involves ensuring the implementation and efficiency of support policies for green governance, such as subsidies for technological innovation. These policies are crucial for promoting environmentally friendly practices and making sure they are effectively executed. By taking these steps, it is possible to create a governance model that not only empowers local governments but also ensures they are equipped with the knowledge, skills, and resources necessary to effectively address environmental issues and promote sustainable economic development.

Author Contributions

Conceptualization, K.L.; Investigation, H.X.; Writing—original draft, K.L.; Writing—review & editing, K.L.; Visualization, Y.S. All authors have read and agreed to the published version of the manuscript.

Funding

This research received no external funding.

Institutional Review Board Statement

Not applicable.

Informed Consent Statement

Not applicable.

Data Availability Statement

The dependent variable data is sourced from the Goddard Earth Sciences Data and Information Services Center, while the primary independent variables are derived from the annual work reports of various prefecture-level city government official websites in China. The meteorological data for the control variables are obtained from the China Meteorological Data Network, and the fiscal data is sourced from the China Urban Statistical Yearbook.

Conflicts of Interest

The authors declare no conflict of interest.

References

  1. Lin, W.; Lin, K.; Du, L.; Du, J. Can regional joint prevention and control of atmospheric reduce border pollution? Evidence from China’s 12th Five-Year Plan on air pollution. J. Environ. Manag. 2023, 342, 118342. [Google Scholar] [CrossRef]
  2. Fu, S.; Viard, V.B.; Zhang, P. Air Pollution and Manufacturing Firm Productivity: Nationwide Estimates for China. Econ. J. 2021, 131, 3241–3273. [Google Scholar] [CrossRef]
  3. He, G.; Wang, S.; Zhang, B. Watering Down Environmental Regulation in China. Q. J. Econ. 2020, 135, 2135–2185. [Google Scholar] [CrossRef]
  4. Svechkina, A.; Portnov, B.A. Spatial Identification of Environmental Health Hazards Potentially Associated with Adverse Birth Outcomes. Environ. Sci. Pollut. Res. 2019, 26, 3578–3592. [Google Scholar] [CrossRef] [PubMed]
  5. Zhu, J.; Xu, J. Air Pollution Control and Enterprise Competitiveness—A Re-examination Based on China’s Clean Air Action. J. Environ. Manag. 2022, 312, 114968. [Google Scholar] [CrossRef]
  6. Du, L.; Lin, W.; Du, J.; Jin, M.; Fan, M. Can Vertical Environmental Regulation Induce Enterprise Green Innovation? A New Perspective from Automatic Air Quality Monitoring Station in China. J. Environ. Manag. 2022, 317, 115349. [Google Scholar] [CrossRef] [PubMed]
  7. Breuillé, M.L.; Gary-Bobo, R.J. Sharing Budgetary Austerity under Free Mobility and Asymmetric Information: An Optimal Regulation Approach to Fiscal Federalism. J. Public Econ. 2007, 91, 1177–1196. [Google Scholar] [CrossRef]
  8. Li, H.; Zhou, L.A. Political Turnover and Economic Performance: The Incentive Role of Personnel Control in China. J. Public Econ. 2005, 89, 1743–1762. [Google Scholar] [CrossRef]
  9. Fu, Y.; Zhuang, H.; Zhang, X. Do Environmental Target Constraints of Local Government Affect High-quality Economic Development? Evidence from China. Environ. Sci. Pollut. Res. 2023, 30, 56620–56640. [Google Scholar] [CrossRef] [PubMed]
  10. Greenstone, M.; He, G.; Jia, R.; Liu, T. Can Technology Solve the Principal-Agent Problem? Evidence from China’s War on Air Pollution. Am. Econ. Rev. Insights 2022, 4, 54–70. [Google Scholar] [CrossRef]
  11. Zhang, J.; Zhao, T.; Zhai, X. Green City Air Measurement and Health Exercise Big Data Monitoring Based on Remote Sensing Images and Sensors. Environ. Technol. Innov. 2021, 23, 101679. [Google Scholar] [CrossRef]
  12. Fan, H.; Zivin, J.S.G.; Kou, Z.; Liu, X.; Wang, H. Going Green in China: Firms’ Responses to Stricter Environmental Regulations; National Bureau of Economic Research: Cambridge, MA, USA, 2019. [Google Scholar]
  13. Xu, H.; Liu, B.; Qiu, L.; Liu, X.; Lin, W.; Liu, B. Does the New Energy Demonstration Cities Construction Reduce CO2 Emission? Evidence from A Quasi-natural Experiment in China. Environ. Sci. Pollut. Res. 2022, 29, 50408–50426. [Google Scholar] [CrossRef]
  14. Fredriksson, P.G.; Millimet, D.L. Strategic Interaction and the Determination of Environmental Policy Across US States. J. Urban Econ. 2002, 51, 101–122. [Google Scholar] [CrossRef]
  15. Zhou, X.Y.; Lei, K.; Meng, W.; Khu, S.T. Industrial Structural Upgrading and Spatial Optimization Based on Water Environment Carrying Capacity. J. Clean. Prod. 2017, 165, 1462–1472. [Google Scholar] [CrossRef]
  16. Zhang, Z.; Jin, T.; Meng, X. From Rrace-to-the-bottom to Strategic Imitation: How Does Political Competition Impact the Environmental Enforcement of Local Governments in China? Environ. Sci. Pollut. Res. 2020, 27, 25675–25688. [Google Scholar] [CrossRef]
  17. Shapiro, J.S.; Walker, R. Why is Pollution from US Manufacturing Declining? The Roles of Environmental Regulation, Productivity, and Trade. Am. Econ. Rev. 2018, 108, 3814–3854. [Google Scholar] [CrossRef]
  18. Antoine, D.; Misato, S. The Impacts of Environmental Regulations on Competitiveness. Rev. Environ. Econ. Policy 2017, 11, 183–206. [Google Scholar]
  19. Tobias, S.; Woerter, M.; Arvanitis, S.; Peneder, M.; Rammer, C. How Different Policy Instruments Affect Green Product Innovation: A Differentiated Perspective. Energy Policy 2018, 114, 245–261. [Google Scholar]
  20. Chen, Z.; Kahn, M.E.; Liu, Y.; Wang, Z. The Consequences of Spatially Differentiated Water Pollution Regulation in China. J. Environ. Econ. Manag. 2018, 88, 468–485. [Google Scholar] [CrossRef]
  21. Jia, R.; Nie, H. Decentralization, Collusion, and Coal Mine Deaths. Rev. Econ. Stat. 2017, 99, 105–118. [Google Scholar] [CrossRef]
  22. Zhao, S.; Wang, Q.; Li, Y.; Liu, S.; Wang, Z.; Zhu, L.; Wang, Z. An Overview of Satellite Remote Sensing Technology Used in China’s Environmental Protection. Earth Sci. Inform. 2017, 10, 137–148. [Google Scholar] [CrossRef]
  23. Yang, S.; Liu, S.; Wu, T. Does New-type Urbanization Curb Haze Pollution? A Case Study from China. Environ. Sci. Pollut. Res. 2023, 30, 20089–20104. [Google Scholar] [CrossRef] [PubMed]
  24. Hanlon, W.W. Coal Smoke and the Costs of the Industrial Revolution; National Bureau of Economic Research: Cambridge, MA, USA, 2016. [Google Scholar]
  25. Chen, L.; Zhang, X.; He, F.; Yuan, R. Regional Green Development Level and Its Spatial Relationship Under the Constraints of Haze in China. J. Clean. Prod. 2019, 210, 376–387. [Google Scholar] [CrossRef]
  26. Ye, B.; Lin, L. Environmental Regulation and Responses of Local Governments. China Econ. Rev. 2020, 60, 101421. [Google Scholar] [CrossRef]
  27. Cheng, Z.; Li, L.; Liu, J. Industrial Structure, Technical Progress and Carbon Intensity in China’s Provinces. Renew. Sustain. Energy Rev. 2018, 81, 2935–2946. [Google Scholar] [CrossRef]
  28. Zheng, Y.; Peng, J.; Xiao, J.; Su, P.; Li, S. Industrial Structure Transformation and Provincial Heterogeneity Characteristics Evolution of Air Pollution: Evidence of a Threshold Effect from China. Atmos. Pollut. Res. 2020, 11, 598–609. [Google Scholar] [CrossRef]
  29. Zhang, S.; Collins, A.R.; Etienne, X.L.; Ding, D. The Environmental Effects of International Trade in China: Measuring the Mediating Effects of Technology Spillovers of Import Trade on Industrial Air Pollution. Sustainability 2021, 13, 6895. [Google Scholar] [CrossRef]
  30. Yu, Y.; Liu, H. Economic Growth, Industrial Structure and Nitrogen Oxide Emissions Reduction and Prediction in China. Atmos. Pollut. Res. 2020, 11, 1042–1050. [Google Scholar] [CrossRef]
  31. Shan, S.; Genç, S.Y.; Kamran, H.W.; Dinca, G. Role of Green Technology Innovation and Renewable Energy in Carbon Neutrality: A Sustainable Investigation from Turkey. J. Environ. Manag. 2021, 294, 113004. [Google Scholar] [CrossRef]
  32. Zhou, J.; Zhou, Y.; Bai, X. Can Green-Technology Innovation Reduce Atmospheric Environmental Pollution? Toxics 2023, 11, 403. [Google Scholar] [CrossRef]
  33. Zhang, C.; Li, H.; Gou, X.; Feng, J.; Gao, X. CEO Educational Attainment, Green Innovation, and Enterprise Performance: Evidence from China’s Heavy-polluting Enterprises. Front. Environ. Sci. 2022, 10, 1042400. [Google Scholar] [CrossRef]
  34. Liu, Y.; Failler, P.; Liu, Z. Impact of Environmental Regulations on Energy Efficiency: A Case Study of China’s Air Pollution Prevention and Control Action Plan. Sustainability 2022, 14, 3168. [Google Scholar] [CrossRef]
  35. Xu, S. Analysis of the Influencing Factors of Industrial Air Pollution in Shenzhen. IOP Conference Series: Earth and Environmental Science. IOP Publ. 2020, 450, 012094. [Google Scholar]
  36. Cui, J.; Zhang, J.; Yang, Z. Carbon Pricing Induces Innovation: Evidence from China’s Regional Carbon Market Pilots. AEA Pap. Proc. 2018, 108, 453–457. [Google Scholar] [CrossRef]
  37. Li, G.; Guo, F.; Di, D. Regional Competition, Environmental Decentralization, and Target Selection of Local Governments. Sci. Total Environ. 2021, 755, 142536. [Google Scholar] [CrossRef]
  38. Xue, S.; Zhang, B.; Zhao, X. Brain Drain: The Impact of Air Pollution on Firm Performance. J. Environ. Econ. Manag. 2021, 110, 102546. [Google Scholar] [CrossRef]
  39. Cai, X.; Lu, Y.; Wu, M.; Yu, L. Does Environmental Regulation Drive Away Inbound Foreign Direct Investment? Evidence from A Quasi-Natural Experiment in China. J. Dev. Econ. 2016, 123, 73–85. [Google Scholar] [CrossRef]
  40. Heyes, A.; Kapur, S. Community Pressure for Green Behavior. J. Environ. Econ. Manag. 2012, 64, 427–441. [Google Scholar] [CrossRef]
  41. Chen, Y.J.; Li, P.; Lu, Y. Career concerns and multitasking local bureaucrats: Evidence of a target-based performance evaluation system in China. J. Dev. Econ. 2018, 133, 84–101. [Google Scholar] [CrossRef]
  42. Karplus, V.J.; Zhang, J.; Zhao, J. Navigating and evaluating the labyrinth of environmental regulation in China. Rev. Environ. Econ. Policy 2021, 15, 300–322. [Google Scholar] [CrossRef]
  43. Fang, H.; Ren, H.; Song, D.; Xu, N. Environmentally-Inclined Politicians and Local Environmental Performance: Evidence from Publicly Listed Firms in China; National Bureau of Economic Research: Cambridge, MA, USA, 2023. [Google Scholar]
Figure 1. Influencing Mechanisms.
Sustainability 15 15309 g001
Figure 2. Variations in regions prioritizing environmental governance.
Sustainability 15 15309 g002
Figure 3. Regions emphasizing environmental governance.
Sustainability 15 15309 g003
Figure 4. Placebo test.
Sustainability 15 15309 g004
Table 1. Descriptive statistics.
VariableNMinMaxMeansd
lnso233,8070.0454.2452.8120.984
Constrain33,807010.0370.189
lnlight33,807−12.3204.346−1.6872.455
lnpop33,807−2.18510.7805.5631.737
lnpressure33,8076.3716.9256.8490.101
lnrain33,8073.1328.0446.7510.516
wind33,8070.6016.4322.1030.597
lntemp33,807−1.5673.2432.5480.419
lnhumid33,8073.3174.5064.1960.170
Table 2. Baseline results.
(1)(2)(3)
lnso2lnso2lnso2
Constrain−0.0065 ***−0.0065 ***−0.0066 ***
(0.0013)(0.0013)(0.0013)
lnpressure 0.1350 **0.1461 **
(0.0583)(0.0556)
lnrain 0.0063 **0.0065 **
(0.0021)(0.0021)
wind 0.00010.0011
(0.0013)(0.0013)
lntemp 0.0264 ***0.0228 ***
(0.0040)(0.0038)
lnhumid 0.00230.0010
(0.0068)(0.0067)
lnlight −0.0025 ***
(0.0004)
lnpop 0.0382 ***
(0.0077)
_cons2.8123 ***1.7681 ***1.4867 ***
(0.0000)(0.3988)(0.3820)
Individual FEYESYESYES
Year FEYESYESYES
N33,80733,80733,807
R-sq0.9990.9990.999
Note: **, *** denote significance at the 5%, and 1% levels, respectively. Standard errors in parentheses are clustered at the county level.
Table 3. Instrumental variable approach.
(1)(2)
Constrainlnso2
IV0.1641 ***
(0.0143)
Constrain −0.0332 **
(0.0105)
Control variablesYESYES
Individual FEYESYES
Year FEYESYES
N 33,807
R-sq 0.119
The 1st stage F131.98
Kleibergen–Paap rk LM 124.144 ***
(0.000)
Cragg–Donald Wald F 512.417
Kleibergen–Paap rk Wald F 131.982
Note: **, *** denote significance at the 5%, and 1% levels, respectively. Standard errors in parentheses are clustered at the county level.
Table 4. Propensity score matching.
(1)(2)(3)
lnso2lnso2lnso2
Constrain−0.0096 ***−0.0066 ***−0.0066 ***
(0.0027)(0.0013)(0.0013)
_cons0.90551.4858 ***1.4867 ***
(1.7198)(0.3819)(0.3820)
Control variablesYESYESYES
Individual FEYESYESYES
Year FEYESYESYES
N283133,80433,807
R-sq0.9990.9990.999
Note: *** denote significance at the 1% levels, respectively. Standard errors in parentheses are clustered at the county level.
Table 5. Replacement of explained variables.
(1)(2)
lnpm25lnpm25
Constrain−0.0164 ***−0.0150 ***
(0.0025)(0.0024)
_cons3.6805 ***6.2569 ***
(0.0001)(1.6549)
Control variablesNOYES
Individual FEYESYES
Year FEYESYES
N33,80733,807
R-sq0.9820.984
Note: *** denote significance at the 1% levels, respectively. Standard errors in parentheses are clustered at the county level.
Table 6. Exclusion of samples.
(1)(2)(3)(4)
lnso2lnso2lnso2lnso2
Constrain−0.0063 ***−0.0042 **−0.0063 ***−0.0112 ***
(0.0015)(0.0017)(0.0015)(0.0020)
_cons1.7518 ***1.6137 ***1.5350 ***2.2009 ***
(0.3963)(0.3942)(0.3985)(0.5010)
Control variablesYESYESYESYES
Individual FEYESYESYESYES
Year FEYESYESYESYES
N28,10830,95128,39621,196
R-sq0.9990.9980.9990.999
Note: **, *** denote significance at the 5%, and 1% levels, respectively. Standard errors in parentheses are clustered at the county level.
Table 7. Exclusion of other policies.
(1)(2)(3)(4)
lnso2lnso2lnso2lnso2
Constrain−0.0077 ***−0.0057 ***−0.0075 ***−0.0061 ***
(0.0015)(0.0015)(0.0015)(0.0015)
_cons1.5377 ***1.5112 ***1.3816 ***1.2654 **
(0.3874)(0.3783)(0.3932)(0.4016)
Control variablesYESYESYESYES
Individual FEYESYESYESYES
Year FEYESYESYESYES
N29,72231,61630,97928,332
R-sq0.9990.9990.9990.999
Note: **, *** denote significance at the 5%, and 1% levels, respectively. Standard errors in parentheses are clustered at the county level.
Table 8. Mediating mechanism.
(1)(2)(3)
CityIndustryInnovation
Constrain0.0399 ***−0.0520 **0.0712 ***
(0.0119)(0.0177)(0.0112)
_cons−8.7281 *−4.6390−7.5295
(4.6472)(5.6747)(4.9343)
Control variablesYESYESYES
Individual FEYESYESYES
Year FEYESYESYES
N26,71320,35532,012
R-sq0.9620.7770.945
Note: *, **, *** denote significance at the 10%, 5%, and 1% levels, respectively. Standard errors in parentheses are clustered at the county level.
Table 9. Direction of government governance.
(1)(2)(3)(4)
Environmental priority CitiesNon-environmental priority citiesEconomic ConstraintsNon-Economic Constraints
lnso2lnso2lnso2lnso2
Constrain−0.0081 ***−0.0024−0.0040 **−0.0121 ***
(0.0018)(0.0018)(0.0020)(0.0023)
_cons2.5474 **1.2277 **1.7271 **1.5992 ***
(0.7814)(0.4054)(0.7004)(0.4511)
Control variablesYESYESYESYES
Individual FEYESYESYESYES
Year FEYESYESYESYES
N13,18720,62021,41912,388
R-sq0.9990.9980.9980.999
Note: **, *** denote significance at the 5%, and 1% levels, respectively. Standard errors in parentheses are clustered at the county level.
Table 10. Urban location characteristics.
(1)(2)(3)(4)
Large-scaleSmall and medium-scaleEastern RegionCentral and Western Region
lnso2lnso2lnso2lnso2
Constrain−0.0087 ***−0.0019−0.0035 *−0.0085 ***
(0.0016)(0.0023)(0.0021)(0.0016)
_cons1.8348 **1.4488 ***0.75621.6227 ***
(0.7911)(0.4079)(1.3197)(0.4036)
Control variablesYESYESYESYES
Individual FEYESYESYESYES
Year FEYESYESYESYES
N16,35817,44911,66422,143
R-sq0.9980.9990.9980.999
Note: *, **, *** denote significance at the 10%, 5%, and 1% levels, respectively. Standard errors in parentheses are clustered at the county level.
Table 11. Moderating effect.
(1)(2)(3)(4)
lnso2lnso2lnso2lnso2
Constrain×GreenO−0.0218 ***−0.0248 ***
(0.0035)(0.0037)
Constrain×Envi −0.0103 *−0.0096 *
(0.0054)(0.0055)
Constrain−0.0059 ***−0.0059 ***0.00200.0014
(0.0014)(0.0014)(0.0044)(0.0045)
GreenO0.0113 ***0.0104 ***
(0.0032)(0.0031)
Envi 0.00030.0011
(0.0019)(0.0019)
_cons2.8590 ***1.4623 **2.9014 ***0.7093
(0.0001)(0.5388)(0.0015)(0.5642)
Control variablesNOYESNOYES
Individual FEYESYESYESYES
Year FEYESYESYESYES
N29,58729,58728,39828,398
R-sq0.9990.9990.9980.998
Note: *, **, *** denote significance at the 10%, 5%, and 1% levels, respectively. Standard errors in parentheses are clustered at the county level.
Disclaimer/Publisher’s Note: The statements, opinions and data contained in all publications are solely those of the individual author(s) and contributor(s) and not of MDPI and/or the editor(s). MDPI and/or the editor(s) disclaim responsibility for any injury to people or property resulting from any ideas, methods, instructions or products referred to in the content.

