Article

Optimization of Accurate Spacing for Gas Extraction from Damaged Coal Seams Based on a Dual-Penetration Model

1
School of Resource and Security Engineering, Wuhan Institute of Technology, Wuhan 430074, China
2
Security Department, University of International Business and Economics, Beijing 100029, China
*
Author to whom correspondence should be addressed.
Sustainability 2023, 15(21), 15339; https://doi.org/10.3390/su152115339
Submission received: 28 September 2023 / Revised: 18 October 2023 / Accepted: 23 October 2023 / Published: 26 October 2023

Abstract

:
In order to develop precise hole placement technology for gas extraction, this paper combines industrial testing, the evolution law of coal rock damage permeability, and the coal double-pore double-permeability model; establishes a coupling model of the coal damage deformation field and matrix-fracture double diffusion seepage field; and determines precise hole placement spacing for a coal seam gas by using the COMSOL Multiphysics 5.6 numerical simulation software. This study shows that the effective radius of gas extraction is 4.8 m after 180 d of extraction, which is a power function of the extraction time. The permeability of the coal body is affected by matrix adsorption, and contraction and effective stress, and the influence range between the boreholes under multi-hole extraction increases with the increase in spacing; at the same time, we took into account the positive effect of the permeability change on the extraction effect and ultimately determined the optimal spacing of boreholes in Dashucun Mine to be 6 m, which was arranged in the square area. The extraction effect was good after the on-site test, and the results of this study can provide guidance for the optimal arrangement of the spacing of boreholes in the underground areas of coal mines.

1. Introduction

As shallow coal resources are gradually being mined out, most coal mining has entered the ranks of deep mining [1]. Deep coal seams are not only characterized by high geostress, high geothermal temperature, high gas pressure, and low permeability, but also by strong plastic deformation and strong timeliness, which makes the dynamic phenomenon of gas protrusion more obvious during the process of extraction and further increases the possibility of accidents, such as coal and gas protrusion, gas explosion, poisoning, etc. [2,3,4]. As the main means of gas disaster prevention and control in deep mines, coal seam gas extraction technology can reduce environmental pollution while reducing the risk of deep coal mining, and it is an important technology to guarantee the sustainable development of energy.
Coal is a porous medium containing a solid skeleton and a pore–slit system, in which the pore–slit system is the main place and channel for gas storage and transport in the coal seam. When the coal seam is disturbed by excavation, the original gas pressure balance in the coal seam is broken and the gas starts to move [3]. Coal seam gas flow is a very complex process; at present, scholars are mainly studying the theory of coal seam gas flow from four aspects, namely, the linear diffusion of gas, linear seepage, nonlinear seepage, and diffusion seepage theory. Wang et al. [5] believed that a single diffusion coefficient could not accurately express the adsorption kinetic parameter of coal; classified pores into a double-pore structure consisting of macropores and micropores; and regarded macropores and small pores as a tandem structure, dividing the pores into two pore structures. The dual pore diffusion BM1 and BM2 models were established by introducing the double diffusion equation with fast and slow diffusion coefficients. Zhao [6] developed a gas seepage model based on the gas mass conservation equation, Darcy’s law, Langmuir’s analytical equation for adsorption, Klinkenberg’s equation, the effective stress equation, and the kinetic equation for pore permeability. Liu [7] constructed a coal–rock damage model based on the DP criterion and a coal–rock body elastic–plasticity constitutive model, based on which a nonlinear unloading seepage equation based on the influence of mining fissures on gas flow was proposed. Yang [8] found that the gas in the fissure not only showed Darcy and No-Darcy seepage behavior under pressure but also showed diffusion behavior under the action of the concentration field, and concluded that the process of coalbed methane transport in the fissure was desorption–diffusion–seepage. Therefore, the establishment of a reasonable gas seepage–diffusion model to reveal the gas transport law can provide a reasonable theoretical basis for the prediction of extraction volume and the design of extraction engineering.
Numerous scholars have carried out experimental research on gas extraction technology and explored the application of the gas multi-field coupling model based on the research results [4]. Tan [9] and Karbownik [10] studied the double-dispersion model in depth on the basis of single-hole diffusion, and the results of their study achieved better results than single-hole diffusion. Gu and Zhang [11,12] considered the creep characteristics of the coal body around a borehole, combined with the gas seepage diffusion equation, coal body deformation equation, and coal seam permeability evolution equation, to establish a coupled flow–solid model considering the creep effect of the coal body. Hu et al. [13] combined the partial differential equation of gas-containing coal transport, a mathematical model of coal permeability, and porosity dynamic evolution to establish a coupled flow–solid model of gas-containing coal seams and simulated the coupled numerical solution under the condition of negative-pressure pumping using COMSOL. Duan et al. [14] carried out mechanical and seepage experiments on laminated coal seams in order to study the effects of structural anisotropy and stress state on permeability evolution, derived a dynamic anisotropy (D-A) permeability model, and investigated the effects of different initial permeability anisotropy ratios on the effect of gas extraction. Liu et al. [15] established a solid–flow coupled two-phase flow model, investigated the effects of residual filtrate water on the deformation and permeability evolution of a coal body after hydraulic fracturing, used COMSOL to simulate the coupled numerical solution under negative pressure pumping conditions and permeability evolution, and analyzed the evolution mechanism of relative permeability and intrinsic permeability. Based on the softening model and diffusion–permeability theory, Wang et al. [16] established the permeability and gas flow equations of penetrating borehole cavern-making and optimized the borehole cavern-making unloading and penetration enhancement technology using COMSOL simulation.
In summary, coal is a complex porous medium, but many scholars’ current CBM seepage models are established on the premise of single pore–single permeability or double pore–single permeability, which do not conform to the double pore–double permeability characteristics and, thus, cannot fully understand the transport law of CBM in the mining process. In addition, most of the permeability models in the existing studies use elastic deformation characteristics for characterization, and there is a lack of studies on the permeability evolution in the plastic damage zone of coal bodies. Moreover, the geological conditions and coal seam gas storage are different in different mining areas, and the required design parameters for extraction are also different relative to the actual requirements for the extraction effect in coal mine production, which should be analyzed according to specific problems. In view of this, this paper analyzes the industrial test on coal samples of the 172,403 working faces of Dashucun Mine, which is located in the eighth gas geological unit; the gas content of the 2# coal seam is 10.2–12.4 m3/t, and the coal seam is facing the danger of protrusion. In this paper, coal is treated as a multiple medium with a double pore and crack structure and double permeability; combined with the change in permeability caused by the roadway excavation, a coupled model of coal seam damage flow and solid is established and solved by COMSOL. The parameters of drilling extraction and reasonable sealing depth are determined. Finally, the extraction situation of the working face in the field is verified in order to provide guidance for accurate gas extraction work.

2. Test Analysis

2.1. Coal Sample Preparation and Analysis

In order to study the microstructural characteristics of deep coal seams, raw coal was collected from the deep mine area of Dashucun Mine in Fengfeng Mining District of Jizhong Energy, and sampling was carried out in accordance with the “Methods of Taking Coal Samples from Coal Seams” [7] and “Methods of Taking Samples from Coal Rocks” [9].
Once the bulk coal samples were gathered, they were labeled, sealed, and stored in ziplock bags before being sent to the lab for experimental examination. The shattered coal samples were divided into tiny 1 cm3 square pieces, as per the laboratory’s specifications. For experimental observation, the smoother side of the sliced sample was profiled, dried, ground, and electrically conducted.
Each component of coal has a certain influence on the gas adsorption capacity; the greater the moisture of the coal, the smaller the gas adsorption capacity. The degree of ash in coal can directly affect the coal storage content and the nature of the reservoir, and impede the process of gas transport between the pores and fissures. The lower the ash content, the higher the degree of coal deterioration and the stronger the gas adsorption capacity. As shown in Table 1, the average moisture content in the coal samples is 1.31%, the average ash content in the dry basis coal is 18.15%, the average volatile matter in the dry ashless basis coal is 6.43%, and the volatile matter in the coal samples is 4.38%. The 2# coal has a high air-drying basis with a fixed carbon content of 61.15%. Therefore, the coal sample from Dashucun Mine belongs to anthracite coal with a high degree of coalization and high level of gas adsorption.

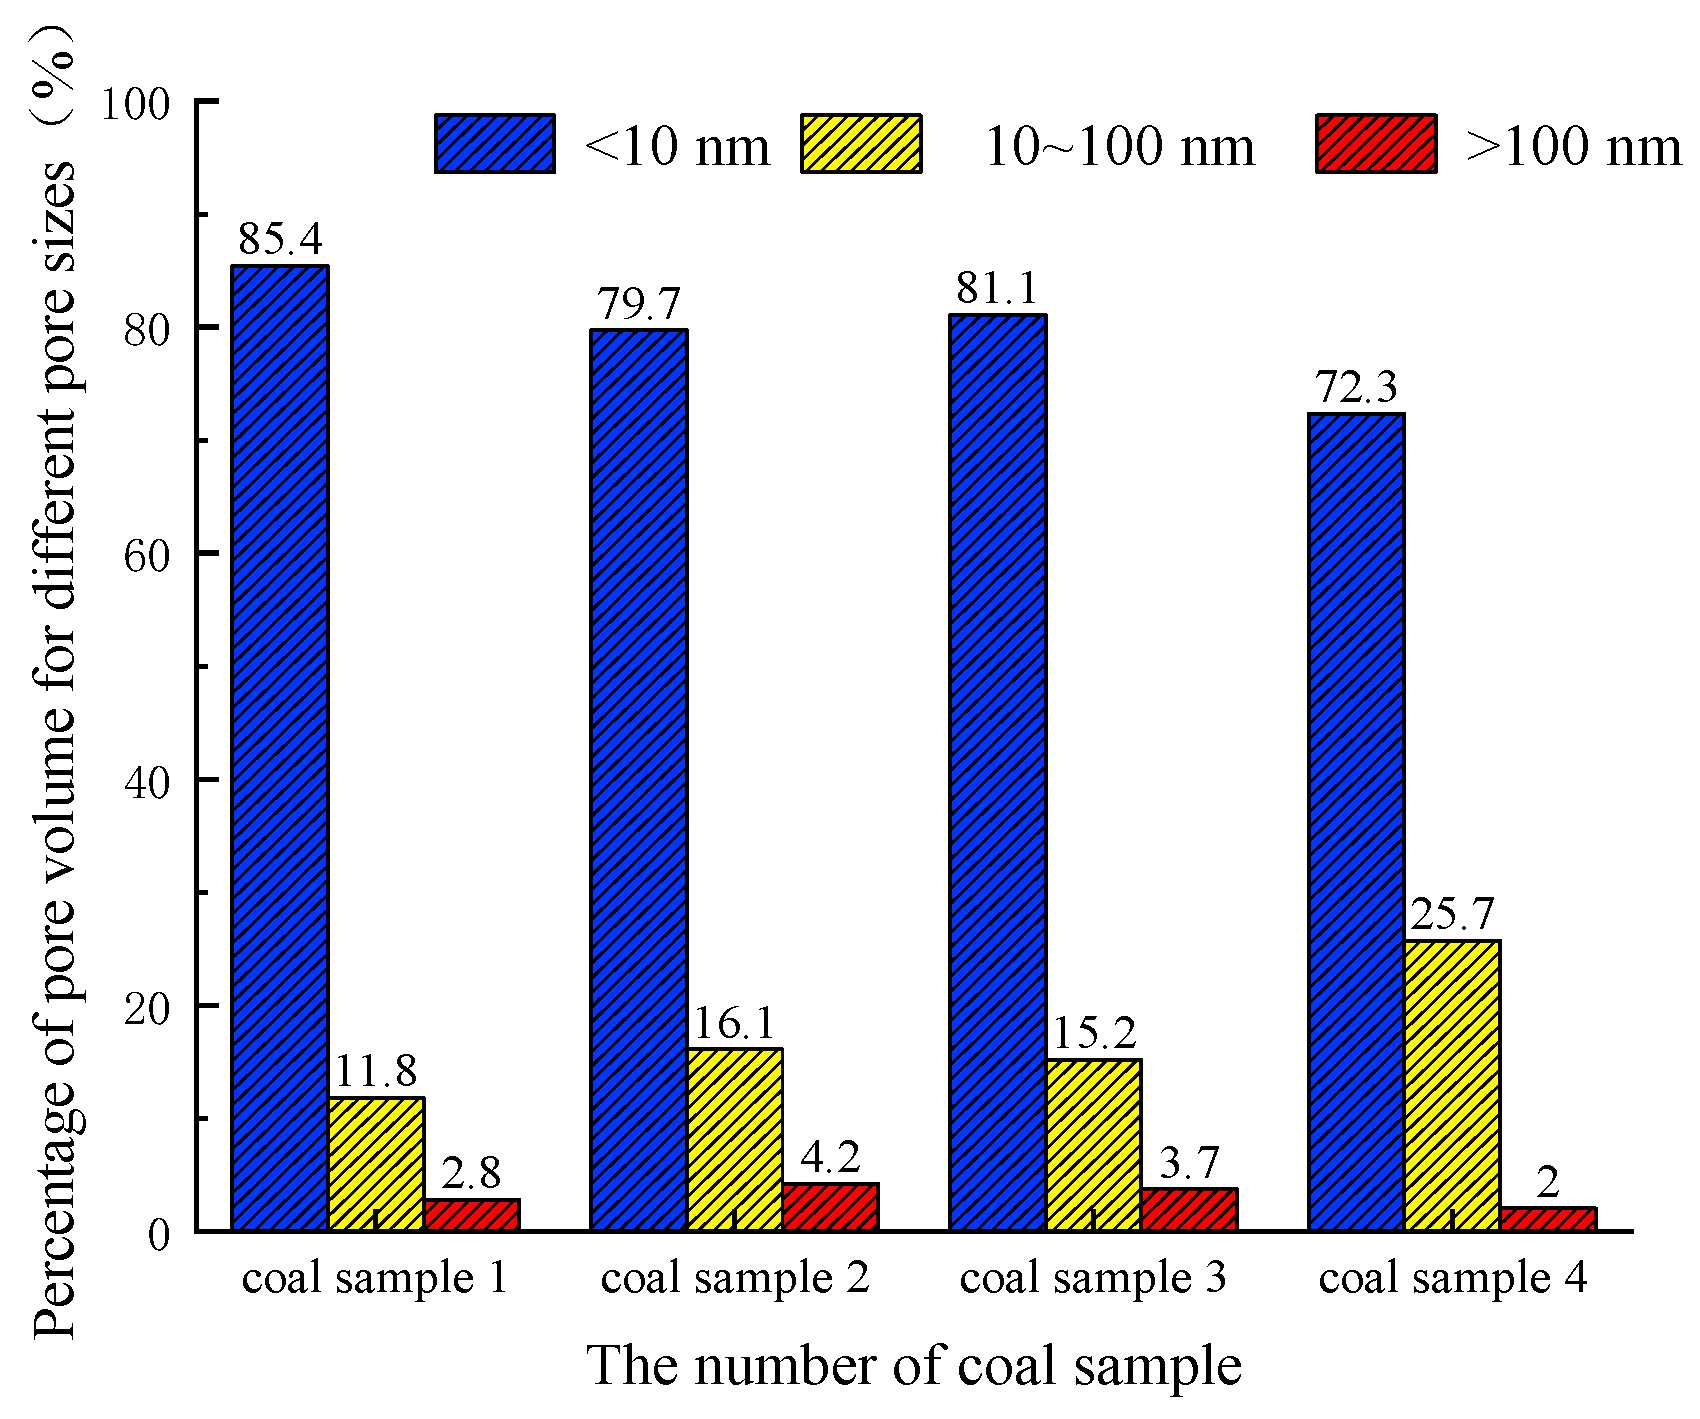
2.2. Specific Surface Area and Pore Volume Analysis

Coal is a solid in a porous medium and the specific surface area is an indicator of its ability to adsorb gases. Its adsorption capacity is directly proportional to the specific surface area. The specific surface area can be calculated using a variety of models, but the results obtained from different models vary. The most common method for calculating the specific surface area is the BET calculation model, and the BET equation is used to characterize the specific surface area in this paper, as shown in Equation (1).
1 W ( p 0   / p ) 1 = 1 W m C + C 1 W m C ( p p 0 )
where W is the adsorbed gas volume; p/p0 is the relative pressure; Wm is the monolayer gas adsorption capacity; and C is the adsorption force constant.
Figure 1 shows the changes in BET-specific surface area and BJH pore volume as well as the changes in BET-specific surface area and average pore diameter, respectively. It can be seen that the BET-specific surface area and BJH pore volume of coal samples are positively correlated: the larger the BJH pore volume, the larger the specific surface area. Conversely, the average pore diameter of coal samples and the specific surface area are negatively correlated: the larger the average pore diameter, the smaller the specific surface area, indicating that the larger the average pore diameter of coal samples, the smaller the number of micropores and the smaller the adsorption of gas content of the samples.
As can be seen from Figure 2, the pore volume of different pore size sections of the four groups of coal samples is dominated by micropores, the pore size distribution is not uniform, and micropores have the greatest contribution to the pore volume. The pore volumes of micropores, small pores, and mesopores accounted for 53.7~67.4%, 14.2~20.4%, and 18.4~25.9% of the total pore volume, respectively. In the specific surface area of the four groups of coal samples, the porosity pattern of different pore size segments was the same as the pore volume pattern, with the highest proportion of micropores and the lowest proportion of mesopores, of which 72.3–85.4% were micropores, 11.8–25.7% were small pores, and the proportion of mesopores ranged from 2.0% to 4.2%. This indicates that micropores dominate the specific surface area and contribute most to the specific surface area, and the higher the percentage of micropores, the larger the specific surface area of the coal samples and the stronger the gas adsorption capacity of the coal. The uneven distribution of the pore size of the coal samples leads to high gas flow resistance, and the adsorbed gas in the micropores is difficult to pump out through the complex and high-resistance pores after desorption.

3. Mathematical Modeling of Coal Seam Gas Transportation and Flow–Solid Coupling

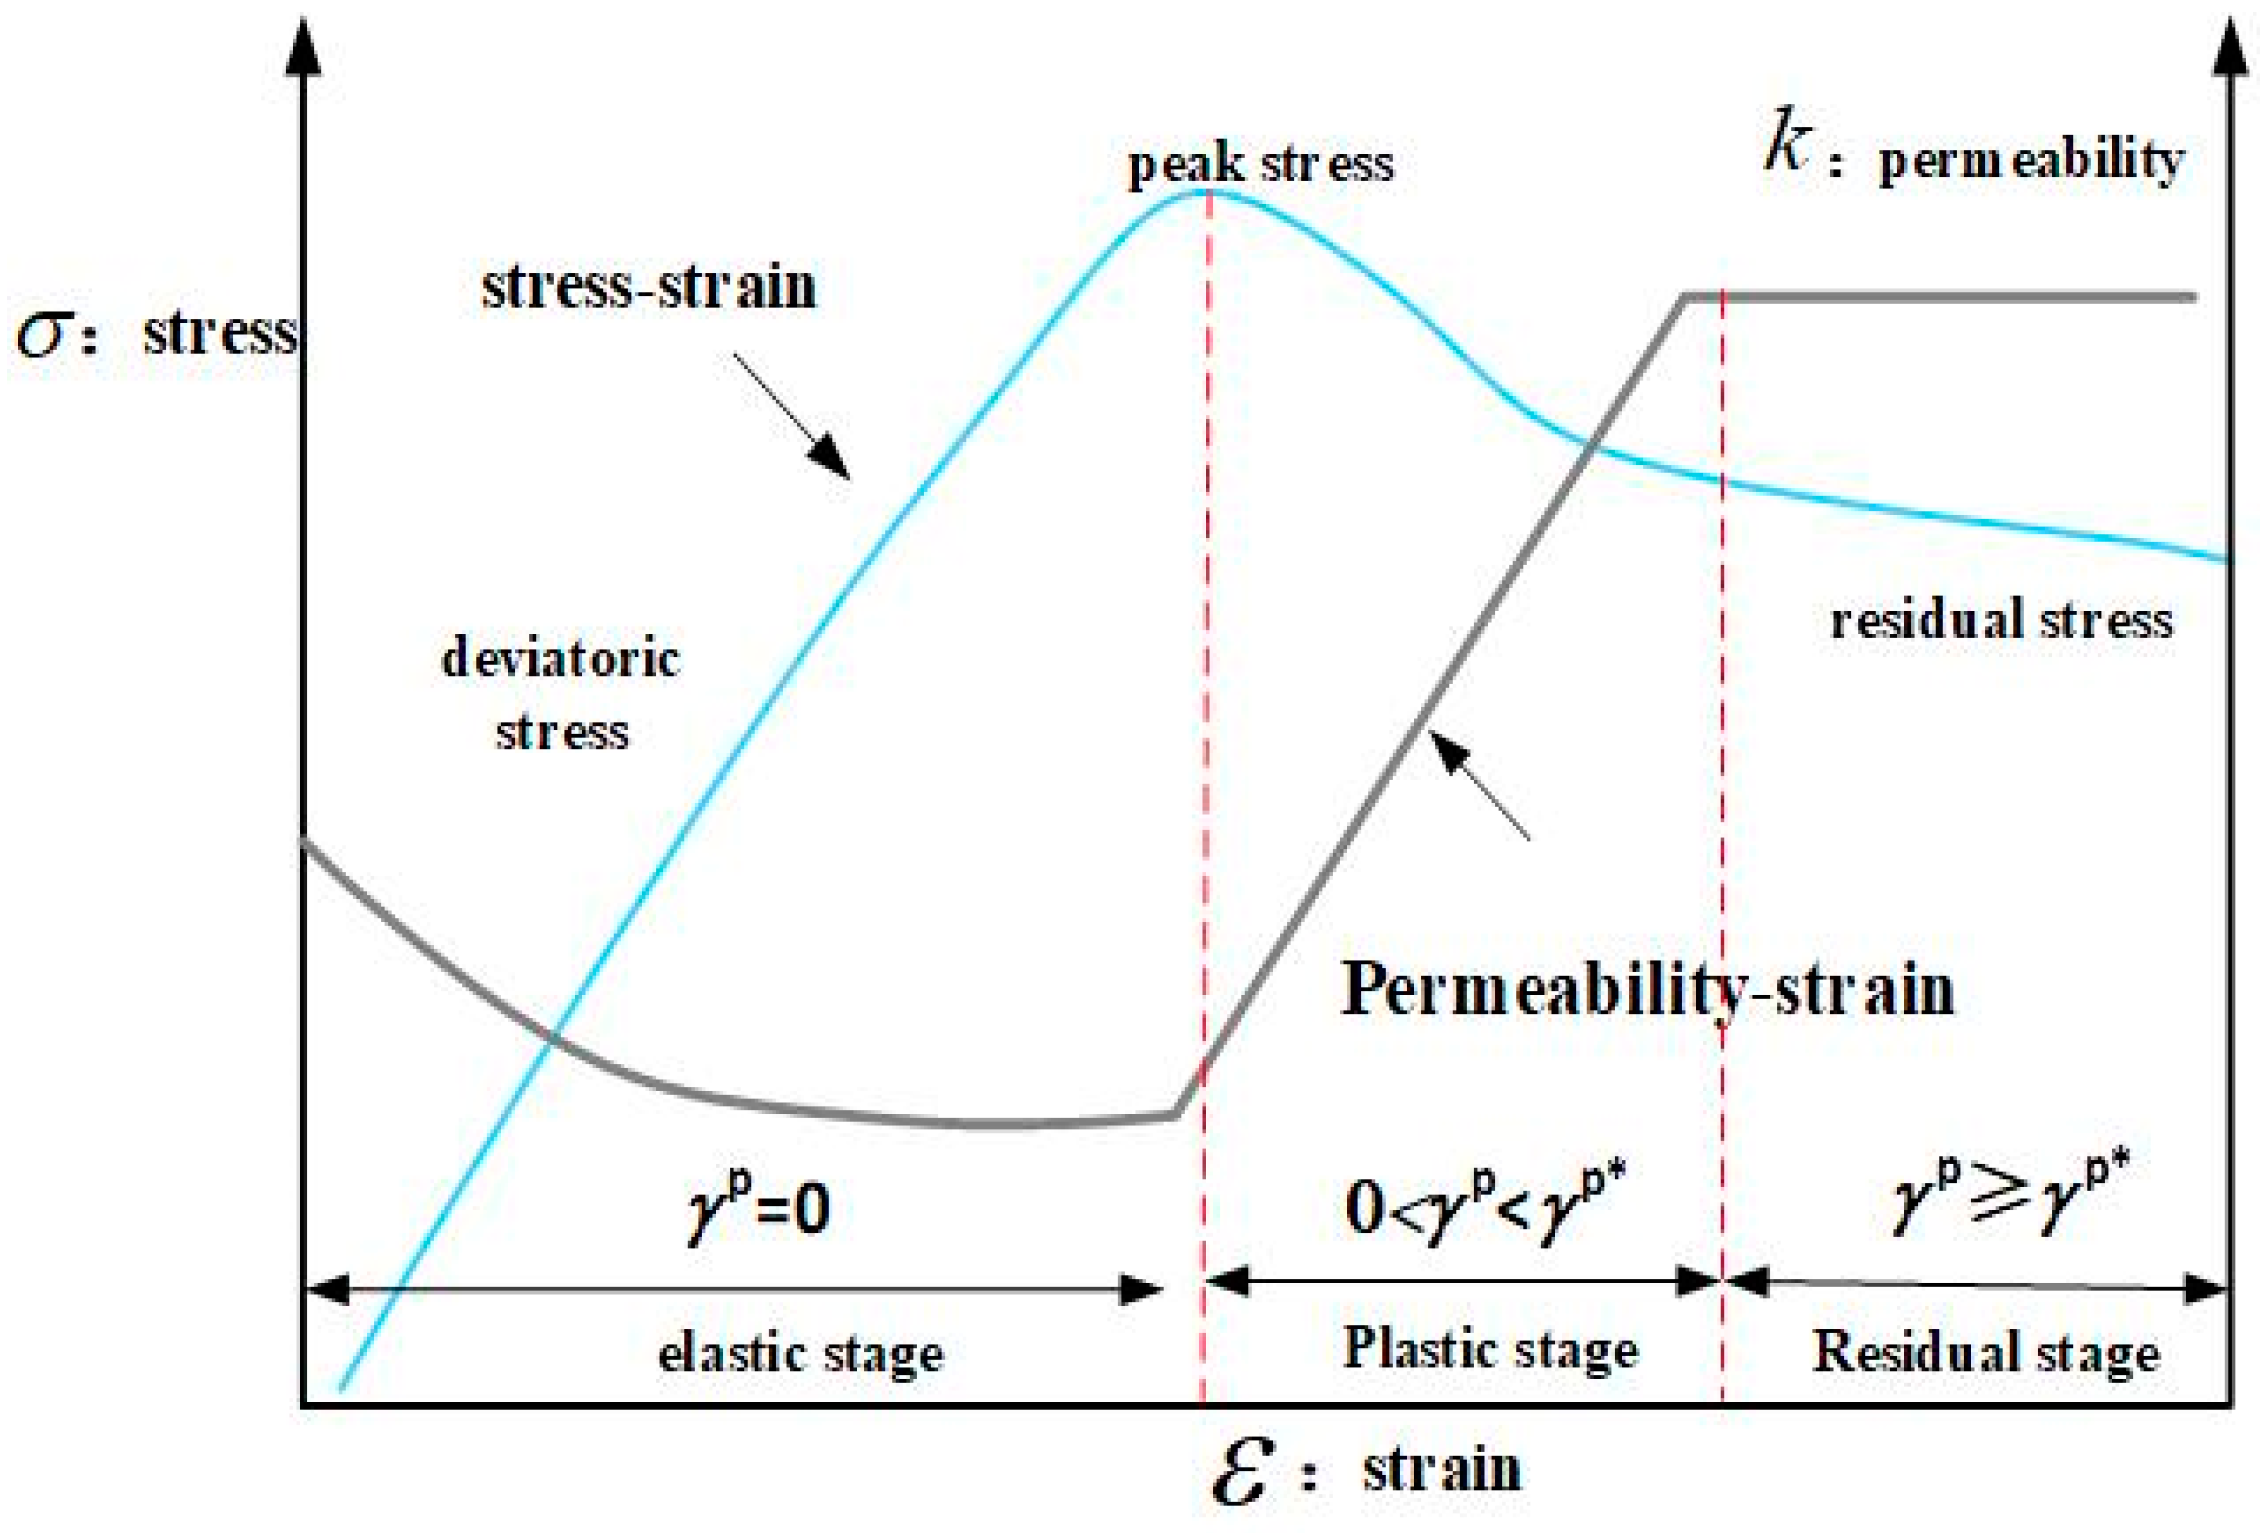
3.1. Ontological Relationships and Destruction Criteria for Coal

The controlling equation for the deformation of a gas-bearing coal body is as follows [17,18]:
G u i , j j + G 1 2 v u j , j i β f p f , i β m p m , i K ε L P L p + P L 2 p , i + F i = 0
where G is the shear modulus of the coal body, MPa; uj,ji is the displacement components in different directions, m; ν is Poisson’s ratio of the coal body; βf, βm are the Biot coefficients of the fracture and matrix; pf,i and pm,i are gas pressures in different directions for the fissure and matrix, respectively; K is the bulk modulus of coal, MPa; pi is the gas pressure, MPa; εL is the strain tensor of the coal body; PL is the Langmuir pressure, MPa; and Fi is the bulk force of the coal body, MPa.
The D-P criterion with the Molr–Coulomb criterion plasticity model was selected under plane strain conditions [19], and it was determined that the damage equation can be expressed in terms of the cohesion and angle of internal friction as
F = sin φ 3 3 + sin 2 φ I 1 + 3 C cos φ 3 3 + sin 2 φ J 2
where C is the cohesive force, MPa; φ is the angle of internal friction; I1 is the first invariant of the stress tensor; and J2 is the second invariant of the stress tensor.
The cohesion is calculated as shown below:
c = c 0 c 0 c r γ p / γ p * , γ p < γ p * c r , γ p γ p *
where c0 is the original cohesion before the peak stress point, MPa; cr is the cohesion in the residual stage, MPa; γp is the equivalent plastic strain; and γp* is the equivalent plastic strain at the beginning of the residual strength.

3.2. Evolution Equation of Porosity and Permeability of Damaged Coal Rock Body

The coal body permeability in the entire stress–strain process can be loosely divided into three stages, as shown in Figure 3.
The first stage occurs prior to the peak stress point; the deformation of the coal body during this stage is primarily elastic, and the permeability may be described using an elastic model, as shown below [20,21].
k a = exp C f σ ¯ k 0
where k0 and ka are the initial permeability and instantaneous permeability in the elastic deformation stage, mD, respectively; Cf is the permeability influence coefficient, Mpa−1; and σ ¯ is the amount of change in body stress, MPa.
The second stage is the plastic damage strain stage, which increases both the permeability and the plastic strain of the coal; therefore, the permeability is approximated as increasing linearly with plastic strain, and the permeability in this stage can be defined as follows [10]:
k b = 1 + γ p γ p * ξ exp C f σ ¯ k 0
where kb is the permeability surge coefficient, mD, and ξ is the equivalent plastic strain.
The third stage is the residual stress stage, in which the plastic deformation of the coal body is sluggish and the permeability rises slowly or even remains relatively constant. The permeability in this stage can be expressed as
k c = 1 + ξ exp C f σ ¯ k 0
where kc is the permeability of the coal body at the residual stress stage, mD.

3.3. Matrix Gas Diffusion and Seepage Equation

The total fugacity of gas in the matrix pore system is shown in the following equation [22,23,24]:
m m = V L p m p m + P L ρ a M c V M + ϕ m M c R T p m
where mm indicates the gas content in the coal matrix, kg/m3; VL is Langmuir volume, m3/kg; pm is the substrate gas pressure, Mpa; Mc is the molar mass of methane, kg/mol; ρa is the pseudodensity of coal, kg/m3; R is the gas constant, J/(mol·K); T is the coal seam temperature, K; VM is the molar volume of gas at standard conditions, L/mol; and ϕm is the fracture porosity, %.
The gas diffusion coefficient is an important metric that reflects the medium’s diffusion resistance. Li [25] used the data fitting method to develop a high-precision diffusion coefficient model with a negative exponential change with time based on an examination of the gas diffusion process. The dynamic diffusion coefficient is given as follows:
D t = D 0 exp ( λ t )
where Dt is the dynamic diffusion coefficient of gas, m2/s; D0 is the initial diffusion coefficient of the gas, m2/s; λ is the attenuation coefficient, s−1; and t is the extraction time, s.
The process of drilling holes to extract gas disrupts the coal seam’s pressure equilibrium, causing the adsorbed gas in the pore space to desorb and become free gas, and the entire process to be transmitted to the fissure system via diffusion–seepage [26,27,28]. The volume of gas exchange per unit volume between the coal matrix and the fissure can be estimated as follows:
Q s = D t σ c c m c f
where Qs is the mass exchange rate of coal matrix and fissure, kg/m3; cm is the matrix gas concentration, kg/m3; σc is the matrix shape factor, m−2; and cf is the fissure gas concentration, kg/m3.
In linked Equations (8)–(10), the diffusion and seepage equations of gas in matrix pores can be obtained as shown below.
t V L p m P L + p m M g R T s ρ s P s + t ϕ m M g R T p m + p m M g k m μ R T m = M g D 0 χ exp ( λ t ) R T p f p m
where ϕm is the porosity of the coal matrix, %; km is the permeability of the coal matrix, mD; μ is the gas dynamic viscosity, Pa·s; ρs is the density of the coal matrix, kg/m3; χ is the matrix shape factor, m−2; Ps is the standard atmospheric pressure, kPa; Ts is the standard temperature, K; ∇ is the Ha density operator; and pf is the fissure gas pressure, Mpa.

3.4. Fractured Gas Seepage Characteristics

The free gas in the coal fracture system exists in a gaseous state, and the mass of free gas in the coal fracture system per unit volume is calculated as follows [29]:
m f = ϕ f ρ f
where mf is the free gas content in the fissure, kg/m3; ρf is the free gas density in the fissure, kg/m3; and ϕf is the fissure porosity, %.
The gas exchange process in the matrix and fracture system is in dynamic equilibrium, while drilling extraction will break the gas equilibrium in the coal seam, and the gas in the matrix system is equivalent to the internal mass source of the fracture system. The change in gas in the fissure is equivalent to the difference in the gas flowing into the extraction borehole [28,29,30]:
ϕ f ρ f t = ρ f V + Q s 1 ϕ f
where V is the Darcy velocity, m/s.
Equation (11) is substituted into Equation (12) and simplified to yield the following equation:
t ϕ f M g R T p f + M g k f μ R T p f = 1 ϕ f D 0 χ exp ( λ t ) M g R T p m p f
where ∇pf is the free gas gradient, MPa, and kf is the permeability of the coal fissure, mD.
In summary, the relationship between the multi-field physical coupling models of damaged coal seam gas based on double pore and double permeability is shown in Figure 4.

4. Numerical Simulation of Gas Seepage

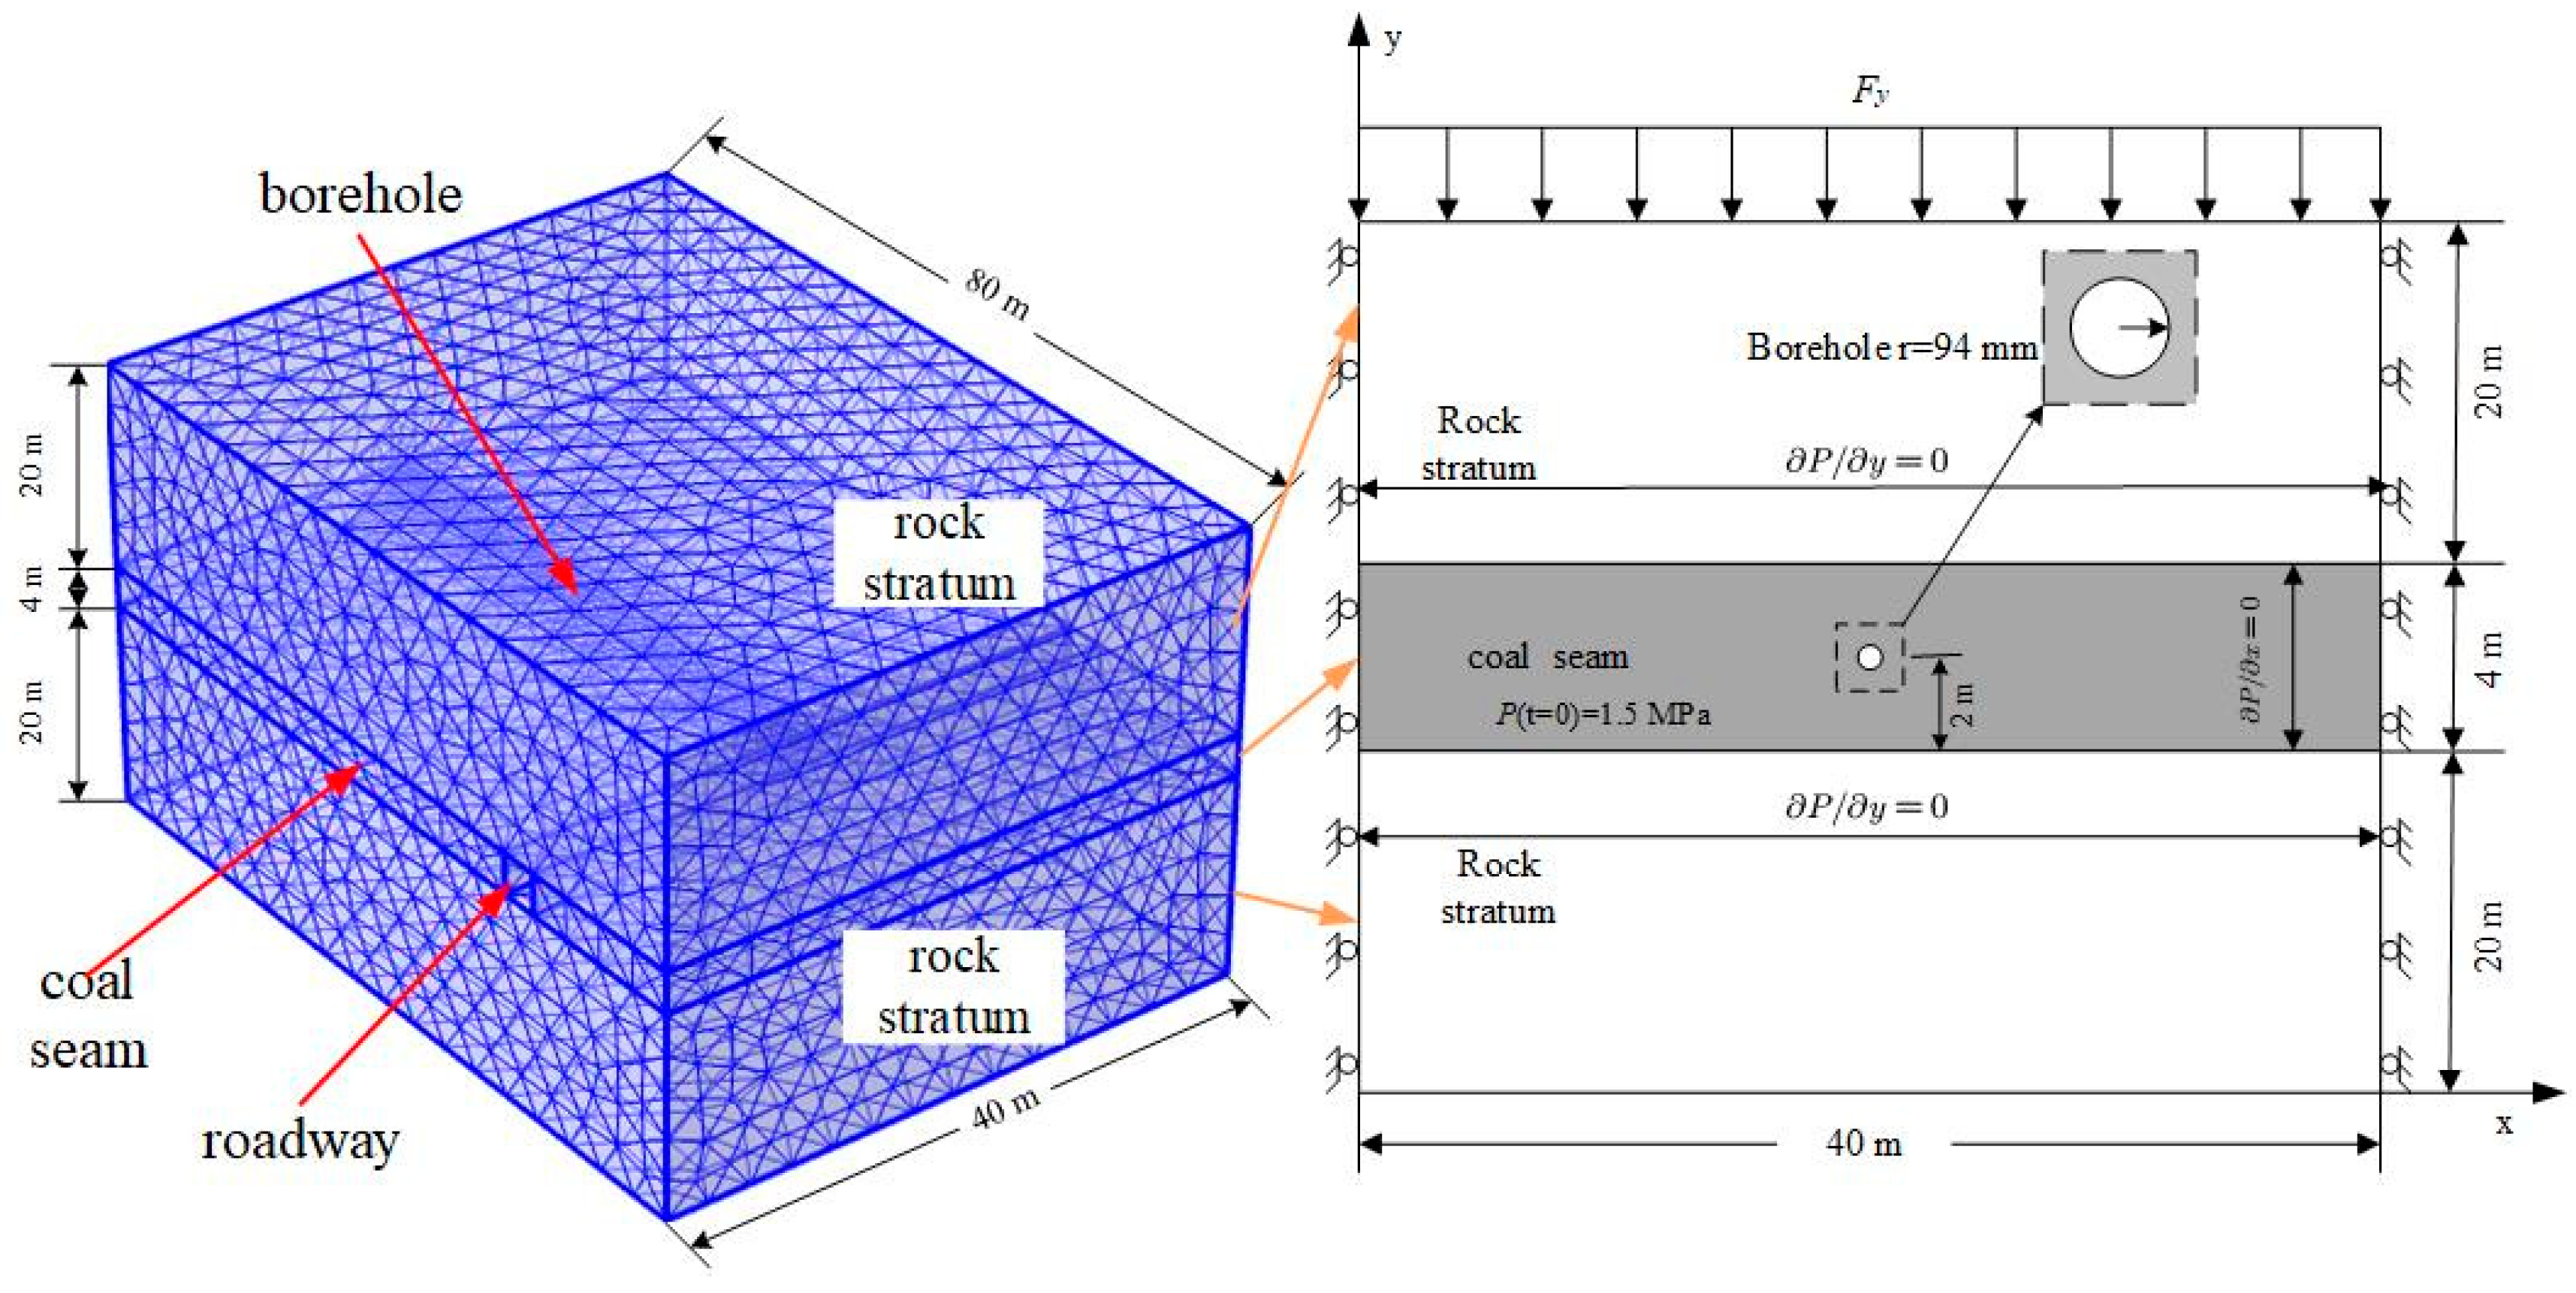
4.1. Numerical Model and Parameters

This paper uses the Dashucun coal mine as an engineering example for numerical simulation. The model has dimensions of 40 × 80 × 44 m, and the bottom of the upper and lower 20 m thick parts of the top and bottom plates are impermeable rocks, the middle 4 m is coal seam, the width of the roadway is 3 m, the height of the roadway is 4 m, the borehole is located in the middle of the coal seam, and the length of the borehole is 60 m. The details are shown in Figure 5. As gas extraction proceeds, the negative pressure boundary within the borehole is exchanged with the outside system for the gas transport process. The upper part of the model is the stress boundary; the lower part is the fixed boundary; the left, right, and rear sides are the rolling boundaries; and the absolute pressure of the roadway is 0.1 MPa in the coal seam. To better study the change in gas pressure in the borehole, a two-dimensional reference plane was intercepted on the cross-section YZ with X as the 30 m coordinate, and the yellow arrows in Figure 5 correspond to the transformation relationship between the two-dimensional cross-section and the three-dimensional model.
The parameters used in the numerical simulation are mainly from field engineering measurements and refer to some quantitative research papers [31,32,33,34], as shown in Table 2.

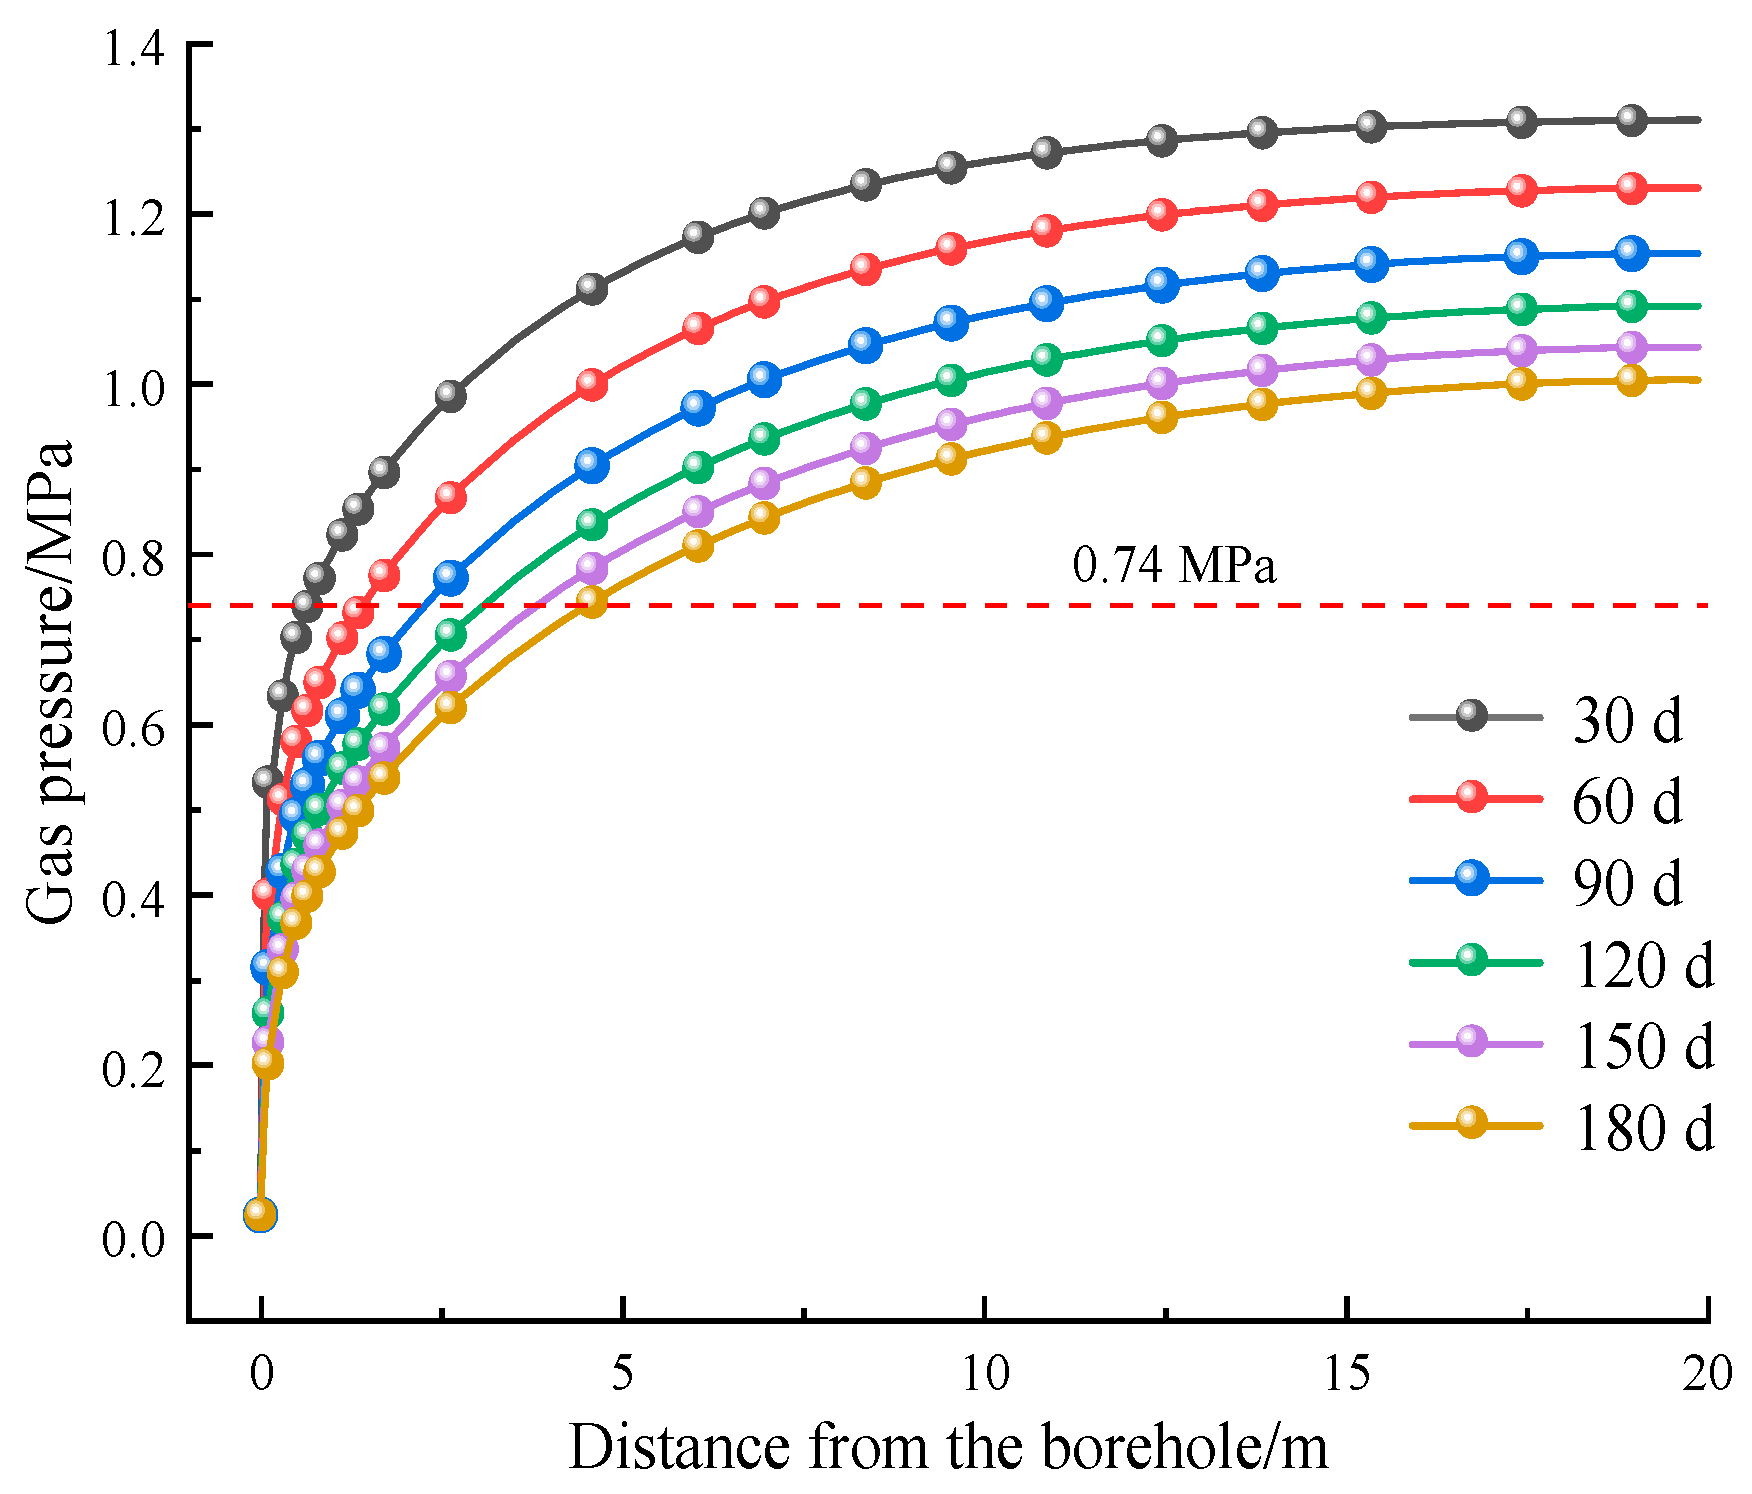
4.2. Effective Radius of Gas Extraction for Extraction Cycle

According to the “Basic Indicators of Gas Extraction in Coal Mines”, the area where the gas pressure around the borehole is less than 0.74 MPa within a certain extraction time is the extraction standardized area [6,35,36]. It can be seen from Figure 6 that the gas extraction time has a significant effect on the effective extraction radius. The effective extraction radius is 0.8 m for 30 d of drilling gas extraction and 1.56 m for 60 d of extraction, which is a twofold increase in the extraction range; the effective radius is 3.09 m for 120 d of extraction and the effective radius of the extraction range increased by 2.29 m; the effective radius is 4.5 m for 180 d of extraction, which is an increase of 1.41 m compared with that for 120 d of extraction. With an interval of 30 d, the increase in effective radius of extraction in 180 d is 0.76 m, 0.78 m, 0.75 m, 0.73 m, and 0.68 m. It is illustrated that the growth rate of the effective extraction radius first increases and then decreases with the extraction process.
The effective extraction radius is plotted against extraction time in Figure 7. After fitting, the effective extraction radius of gas is approximated to the power function relationship with the extraction time and the correlation coefficient is 99.96%. The specific mathematical relationship is shown as follows:
y = 0.030 t 0.969
where y is the effective radius of gas extraction, m, and t is the extraction time, d.

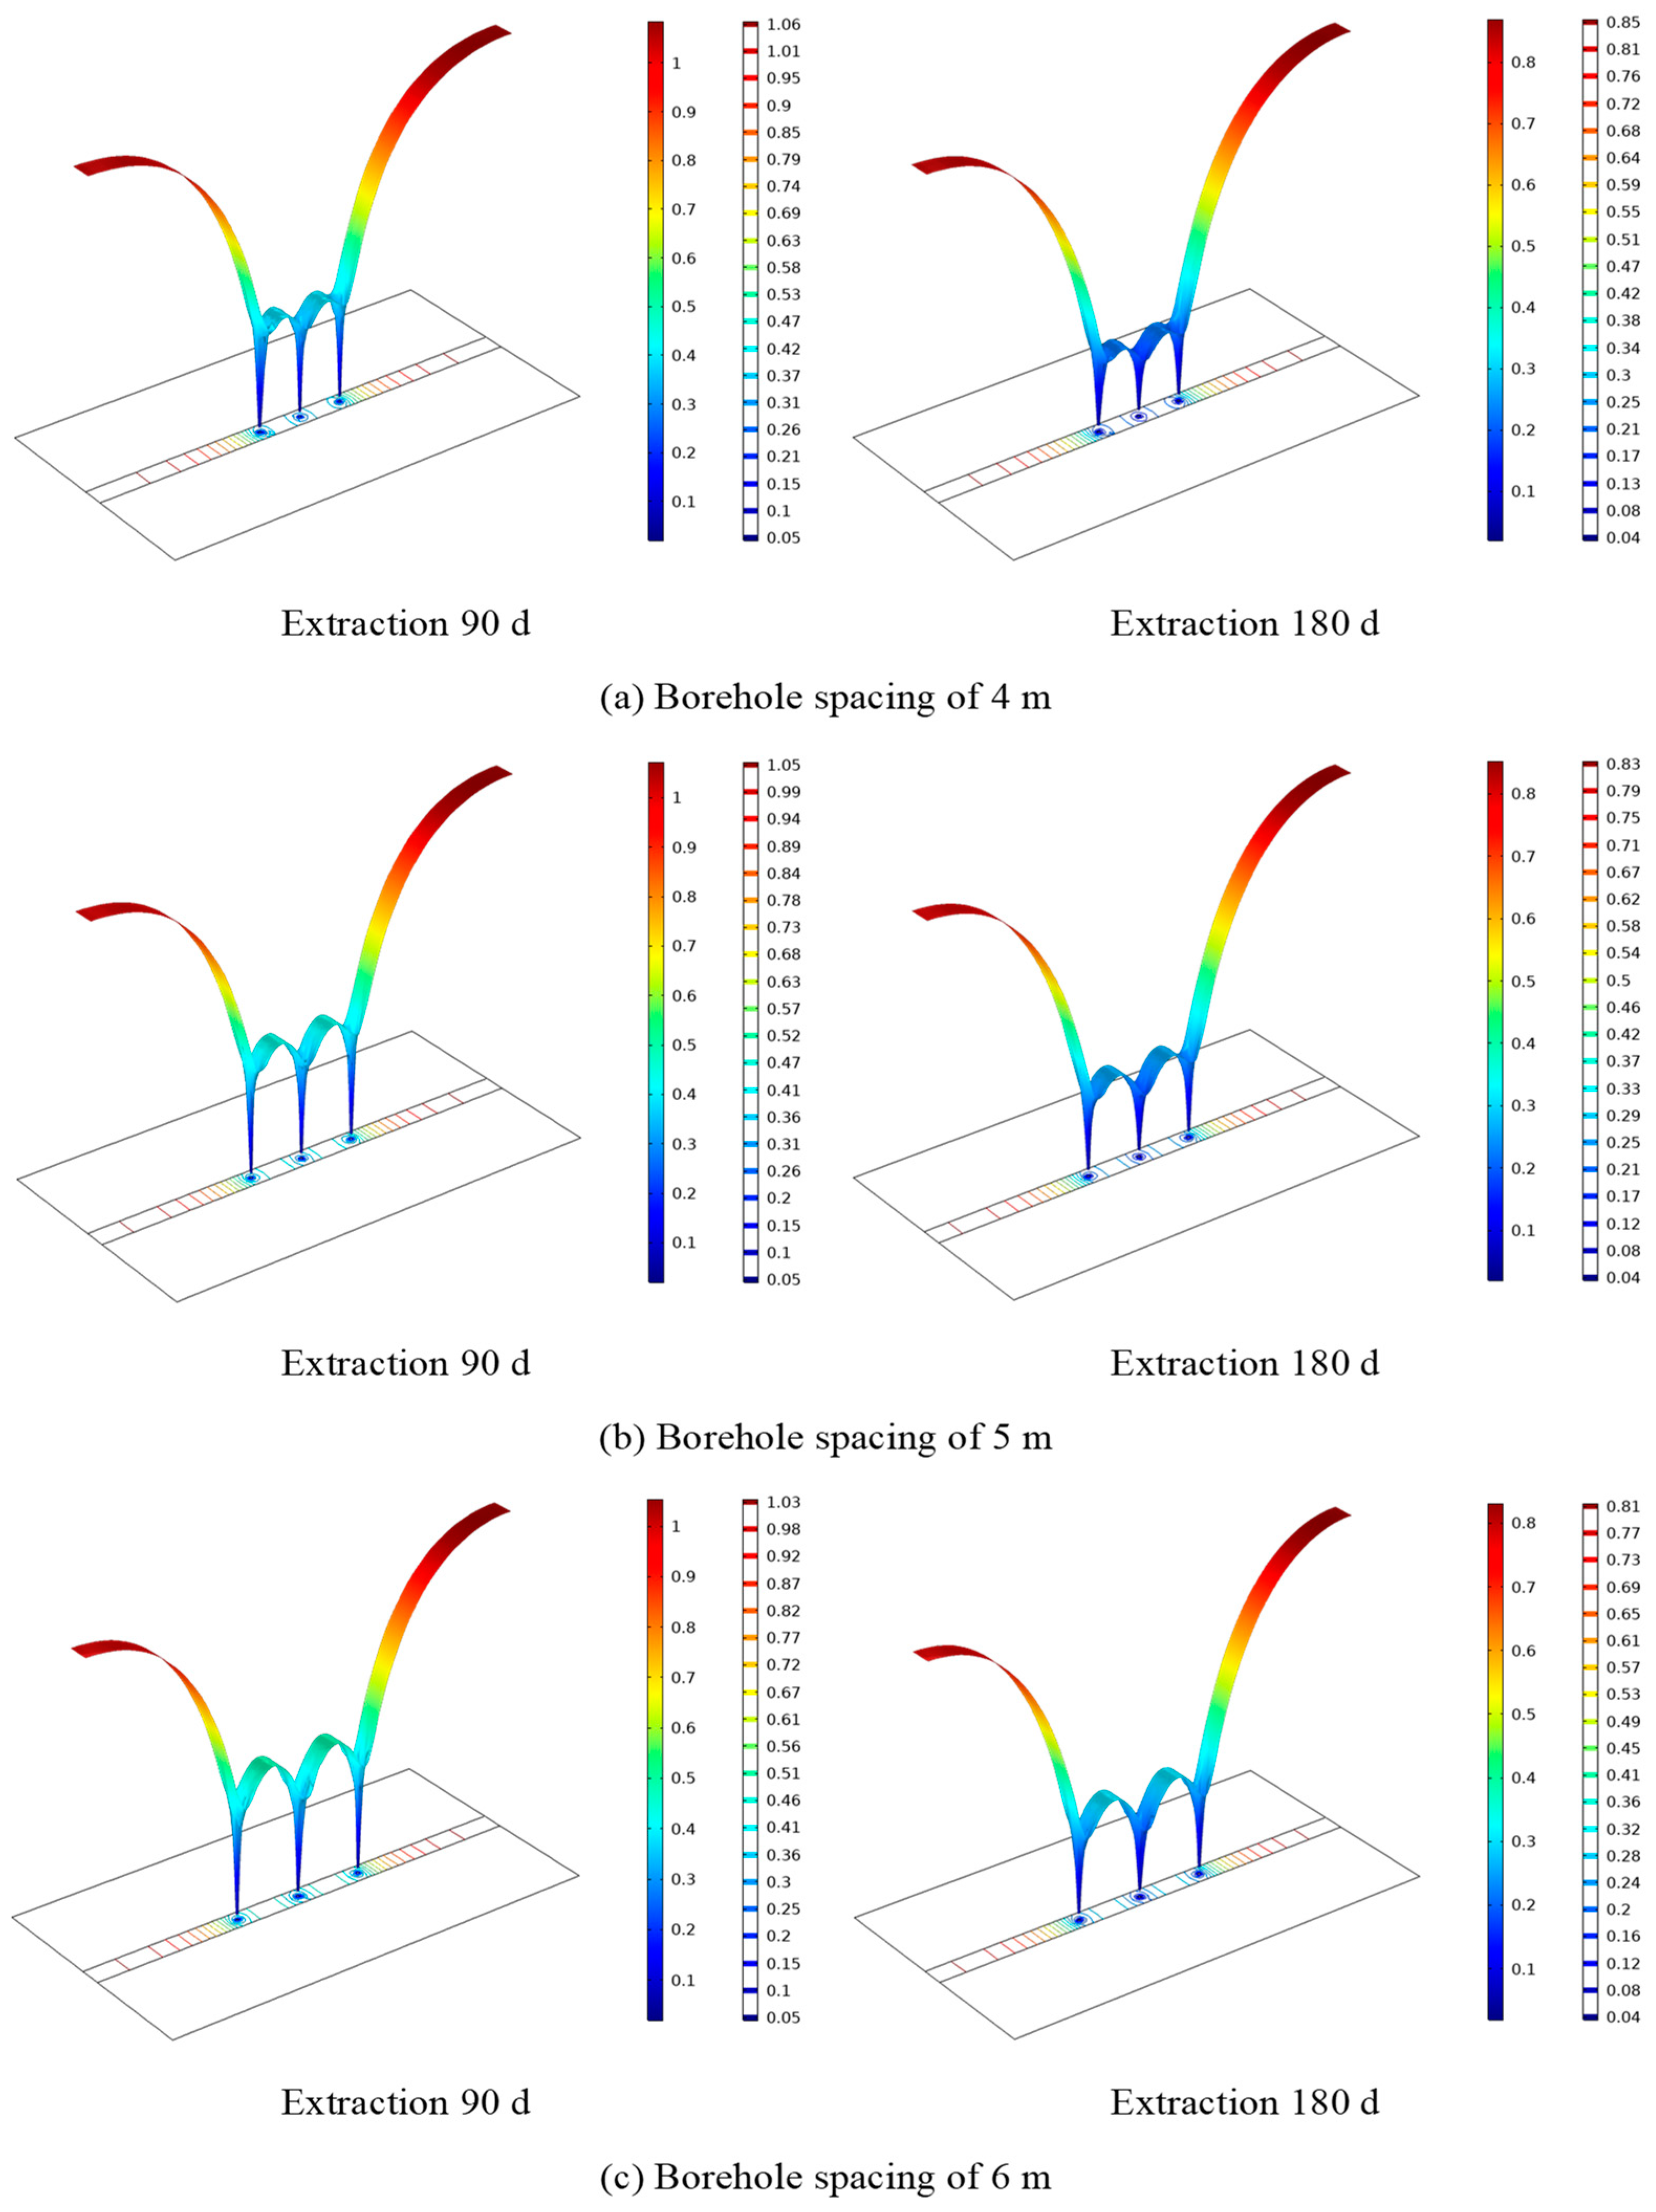
4.3. The Effect of Different Borehole Spacings on Gas Transportation

Figure 8 shows a cloud plot of the fluctuation of matrix gas pressure with different drilling spacings. It can be seen that under the influence of the superposition effect of multi-hole extraction, the gas pressure at the center of any two holes is much lower than that at the same place on the other side of the hole. When the extraction time is 90 d, the gas pressure at the reference surface is 1.06 MPa, 1.05 MPa, 1.03 MPa, 1.01 MPa, and 0.99 MPa for the spacings of 4 m, 5 m, 6 m, 7 m, and 8 m; when the extraction time is 180 d, the maximum gas pressure at the reference surface with different spacings is 0.85 MPa, 0.83 MPa, 0.81 MPa, 0.79 MPa, and 0.76 Mpa.
After the same extraction period, the maximum gas pressure decreases as the boreholes spacing grows. The reason for this is because the larger the hole spacing, the greater the impact of the borehole extraction and, thus, the more gas can be extracted from the borehole; yet, the gas pressure value between adjacent boreholes grows as the spacing increases. The smaller the hole spacing, the higher and faster the drop in gas pressure in the effective extraction radius of the borehole. This is because there is a superposition effect between neighboring boreholes when the effective extraction range of two boreholes is more than the hole spacing, and the smaller the hole spacing, the stronger the superposition effect. The gas in the superimposed area of adjacent boreholes will be transported to the left and right adjacent boreholes simultaneously, which is equivalent to increasing the gas transport channel without changing its power, making it easier for the gas to flow out of the coal seam into the extraction borehole, resulting in the rapid extraction of gas within the borehole’s effective extraction range.

4.4. Coal Permeability Change Pattern

As gas extraction proceeds, matrix adsorbed gas is continuously desorbed and a small amount of free gas moves into the fissure, which is subsequently continuously discharged from the coal seam. In this process, the increase in effective stress leads to a decrease in the permeability of the coal body and the matrix contraction leads to an increase in matrix gas diffusion, which makes the permeability of the coal body increase. The change in permeability of the coal body is the result of the competition between the adsorption expansion and deformation of the coal matrix and the effective stress. As can be seen from Figure 9, the permeability near the borehole is much higher than that far away from the borehole location, and with the increase in distance, the permeability of the coal seam shows a sharp decline. When the decrease reaches a certain value, the permeability begins to rise slowly and then decreases gradually until it levels off at a sufficient distance from the borehole. Due to the large amount of gas diffused from the matrix pores into the fissure at the early stage of extraction, the gas in the fissure is continuously discharged to the borehole, the pressure drop is large, and the effective stress in the coal body is elevated, which leads to a decrease in the permeability of the coal body. In the late stage of extraction, the resistance to gas diffusion increases, the amount of gas flowing into the fissure system decreases, the rate of pressure drop gradually decreases, and the effect of gas extraction tends to be stabilized. At this time, the decrease in the pressure of the gas in the fissure gradually decreases to a stable value, which corresponds to the increase in the effective stress in the coal body, resulting in an increase in the permeability of the coal body. In the area near the drill hole at any time of extraction, the coal body will have different degrees of stress concentration, resulting in an increase in effective stress, so the permeability of the coal body near the drill hole is lower than in the surrounding area.
Comparing Figure 9a,b, when the borehole spacing is increased from 4 m to 5 m, the difference in the pressure drop area between the boreholes is small, and the permeability near the center of the boreholes is 1.05 mD and 0.81 mD, respectively, with an increase in the effective stress, leading to a decrease in the permeability of the coal seam of 0.24 mD. It can be seen that by comparing Figure 9b,c, the spacing of the boreholes is increased from 5 m to 8 m, and the values of permeability near the center are 0.81 mD and 0.69 mD, respectively. At this time, the permeability of the coal seam decreases by 0.12 mD, which is half of the decrease in the first set of comparisons. The decrease in permeability indicates that the influence of adsorption contraction and effective stress on the permeability of the coal matrix is in a relatively balanced state; so, the permeability of the coal body should be at a suitable level in order to achieve a better extraction effect. If the permeability of the coal body exceeds the standard—that is, the matrix contraction caused by gas desorption dominates—it will lead to the gas not being able to be discharged to the outside of the borehole and will have a negative impact on the extraction effect. If the permeability of the coal body is lower than this level, the distance between the drill holes must be more than 8 m, and it is known from the previous study that the value of gas pressure between neighboring drill holes increases with the increase in distance, the effective influence area between the drill holes decreases, and the downward trend of the gas pressure in the coal seam slows down, which leads to a poor gas extraction effect.

4.5. Effect of Drill Hole Spacing on Gas Extraction

Figure 10 shows the curve of gas pressure change under different hole spacings. It can be seen from Figure 10a that when the spacing of the drill holes is 4 m, the gas pressure at the reference surface decreases with the increase in extraction time. At 10 d of extraction, the maximum gas pressure at the reference face is 1.445 MPa and the gas pressure in the middle of the two adjacent drill holes is 1.15 MPa. At 60 d of extraction, the maximum gas pressure is 1.19 MPa and the gas pressure in the middle of the two adjacent drill holes is 0.515 MPa. At the early stage of extraction, the gas content of the seam decreases greatly and the gas pressure in the middle of the two adjacent drill holes decreases dramatically. At 60 d, the gas pressure in the middle of the two adjacent drill holes decreases drastically. Over 60 d of extraction, the gas pressure between the two neighboring boreholes decreased by 1.0 MPa; over 180 d of extraction, the maximum pressure between the two boreholes is only 0.22 MPa, making the effect of gas extraction obvious. As can be seen from Figure 10b, when the distance between the drill holes is 5 m, the change in gas pressure in the coal seam is similar to that when the distance between the holes is 4 m. The gas pressure in the middle of the neighboring holes is 0.80 MPa after 30 d of extraction, and the maximum gas pressure after 180 d of extraction is reduced to 0.27 MPa. Compared with the maximum gas pressure after 180 d of extraction when the distance between the holes is 4 m, although the gas pressure in the middle of the holes is greater when the distance between the holes is 5 m, the decrease in the gas pressure is more obvious for the overall gas pressure. From Figure 10c–e, it can be seen that the gas pressure in the middle of the neighboring holes after 90 d of extraction is 0.49 MPa, 0.54 MPa, and 0.59 MPa when the hole spacing is 6 m, 7 m, and 8 m, respectively, and the gas pressure in the middle of the neighboring holes after 180 d of extraction is 0.31 MPa, 0.34 MPa, and 0.38 MPa, respectively. It can be seen that the gas pressure in the low-pressure area of the borehole with the same extraction time decreases with the reduction in hole spacing.
According to the specific requirements of the Dashucun Mine, the gas pressure drop after extraction is 0.32 MPa or less, which is considered to be up to the standard, so the spacing of the holes should be less than 7 m. If the superposition effect of multiple holes is not taken into account at all, if the holes are laid out in a square area, and if there is no blind zone in the extraction area, the spacing of holes needs to be less than or equal to √2r. As can be seen in Section 4.2, the maximum effective radius of a single hole is around 4.8 m. If a hole spacing of 4 m or 5 m is selected, the gas extraction will produce a great superposition effect on the drilling holes, resulting in great waste. Therefore, taking into consideration various factors, the optimal spacing of the holes in Dashucun Mine is selected to be 6 m. Figure 11 and Figure 12 show the layout of the gas extraction downhole at the site.

5. Practical Verification of Coalbed Methane Mining

5.1. Overview of the Mining Area

Dashucun coal mine is located in the north-east of Fengfeng mining area. This coal seam is relatively stable and belongs to the Permian Shanxi Group strata. The average coal thickness is 5.8 m. The average length of the strike of 172,403 working faces is 293 m; the average length of the inclination is 191 m, with an area of about 55,000 m2; and the recoverable reserve is 500,000 t. Due to the arrangement of mining succession and the simulation results of this paper, the optimal spacing of drilling holes is obtained.
According to the mining succession arrangement and simulation results, the optimal spacing of holes is obtained, and optimization is carried out on the basis of the original extraction parameters to determine the pre-extraction drilling arrangement of gas in the coal mining face: (1) Regional drilling arrangement: 1# drill hole is located in the upper trench of 172,403 (azimuth 128.1°), 4 m outside the 25# point; one drill hole is arranged inwardly at intervals of 1 m (1–8# drill holes); one drill hole is arranged inwardly at intervals of 6 m (1–8 holes); and one hole is arranged inwardly at intervals of 6 m (1–8 holes). (2) The extraction drill holes are sealed by “two plugs and one injection”, and the drill holes are sealed by no less than 16 m. The grouting pressure is no less than 3 MPa, and the pressure change is no more than 0.5 MPa within 30 minutes after the injection is stopped.

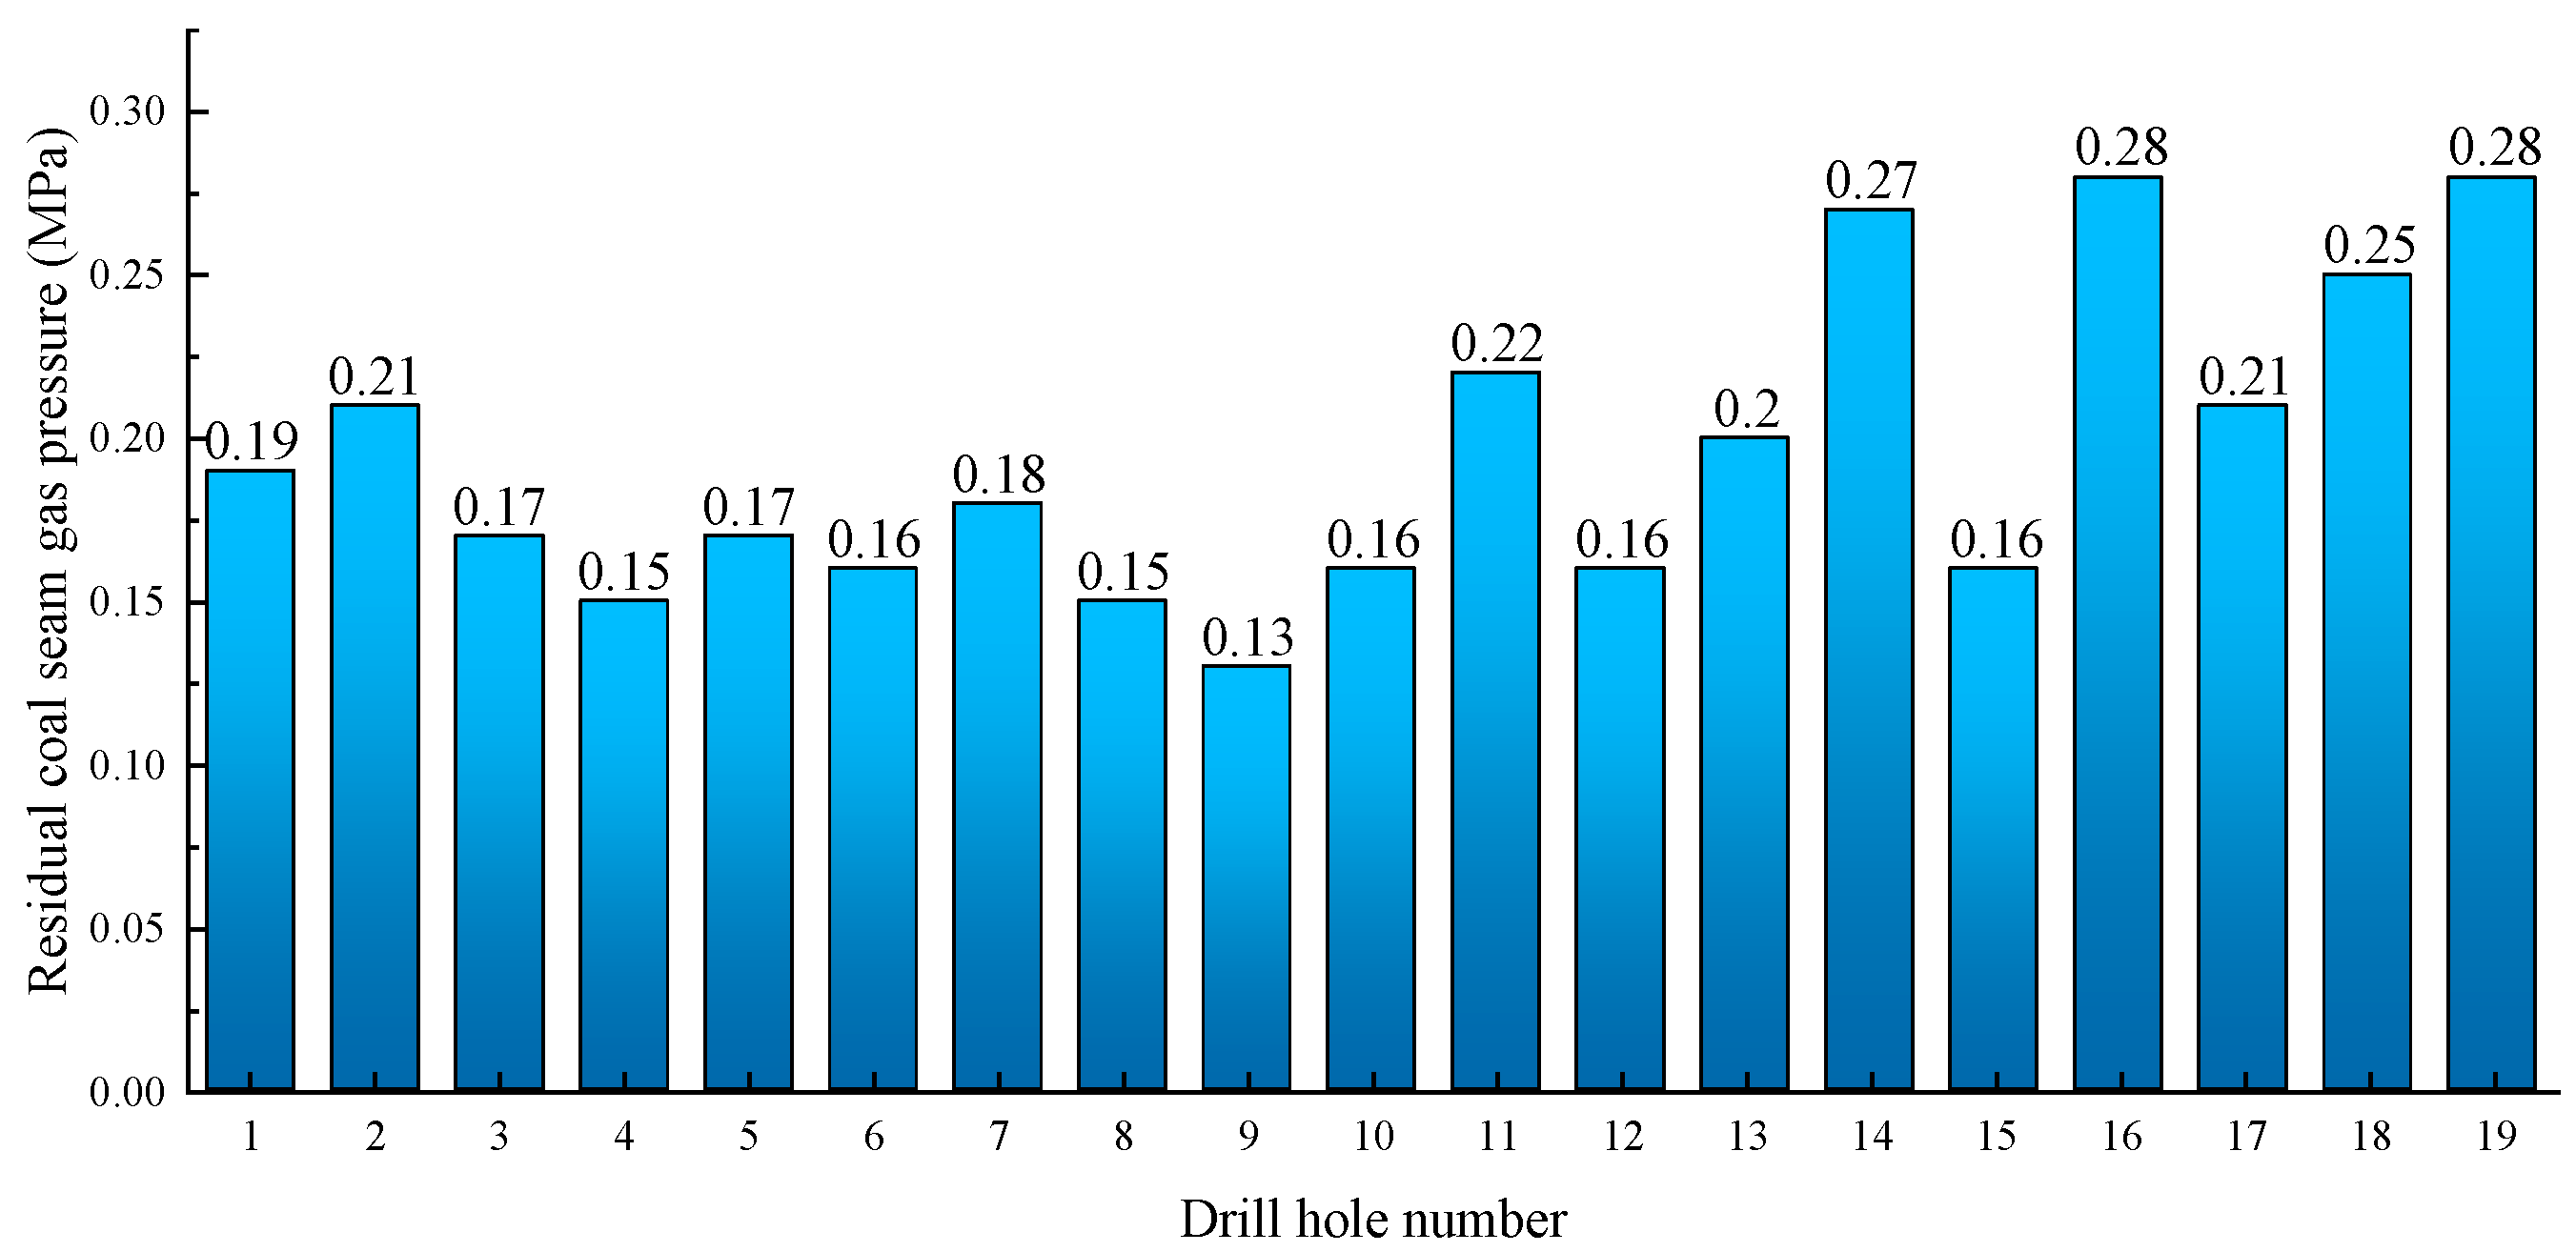
5.2. Validation of the Effectiveness of Gas Extraction

The effective extraction radius of 4.8 m after 180 d of single-hole extraction is taken as a standard, and the coordinate point (4.8,0) is arranged as a monitoring point to verify the residual gas pressure value of the coal seam under optimized spacing and single-hole extraction, as shown in Figure 13. At the early stage of extraction, due to the small influence between the drill holes, after 20 d of extraction, the superimposed effective extraction area between the drill holes becomes more and more obvious. At 20–100 d of extraction, the rate of pressure drop in the coal seam accelerates sharply, and the difference with the single-hole increases. After 100 d of extraction, the decrease in the gas pressure is gradually stabilized to a stable value. After 180 d of extraction, the residual pressure of the coal seam before and after optimization is 0.46 MPa and 0.045 MPa, respectively, which matches the on-site verification, meaning a good extraction effect has been achieved to prevent and control coal and gas protrusion.
Statistical calculation of parameters such as gas extraction volume, extraction pure volume, and extraction concentration in the working face (OPQRS) area of test 172,403 was conducted. Since the extraction started on 18 March 2022 and ended on 13 September 2022, the total extraction volume of 727,814.5 m3 was measured online and the total extraction volume of 719,379.2 m3 was measured manually, and the data from the automatic measurement and the manual measurement were compared. The error is less than 5%, as stipulated in the Measures for Comprehensive Management of Coal Mine Gas in Hebei Province. The total extraction volume is based on online measurements.
The residual gas pressure of the coal seam was monitored in the pre-pumping region of the 172,403 working faces (OPQRS) area in accordance with the criteria of the Measures for Comprehensive Management of Coal Mine Gas in Hebei Province. The slurry sealing hole pressure measurement method was employed for observation, together with the active pressure measurement method. As indicated in Figure 14 and Table 3, the measured coal seam residual gas pressure is p = 0.13–0.28 MPa, which is less than the critical limit of 0.7 MPa in Dashucun Mine.
The partial results of the residual gas content of the coal after gas extraction are shown in Table 4. The gas content of the (OPQRS) area before pre-extraction was between 5.23 and 7.52 m3/t, with a maximum gas content of 7.52 m3/t and an average gas content of 6.74 m3/t. After pre-extraction of the boreholes, the gas content of the (OPQRS) area was in the range of 2.3 m3/t to 3.76 m3/t. The maximum gas content was 3.76 m3/t, and the average gas content was 2.97 m3/t. After pre-extraction of each borehole, the gas content was substantially reduced, basically to 50% of the pre-extraction gas content, which meets the requirements for pre-pumping of the OPQRS area of the Dashucun Mine’s 172,403 working faces.

6. Discussion

In this paper, a combination of theoretical analysis, experimental research, numerical simulation, and field experimentation is used to study the gas transport law and extraction technology of pre-pumped boreholes in deep coal seams in an in-depth and systematic way. From the basic experiments, the relationship between the microscopic pore and fracture structure characteristics of the coal body and gas transport is studied, a coal damage permeability evolution model is established based on the damage and deformation of coal rock caused by roadway excavation, and a gas-containing coal seam damage flow–solid coupling model is established by combining the coal bed deformation equation and the double-hole and double-permeability equations. COMSOL was used to optimize some of the gas pre-extraction design parameters, and Dashucun Mine was used as a test mine for on-site application. The validation results showed that the extraction effect of the optimized parameters was in line with the standards and regulations, and the workload of working face extraction works was reduced.
Sealing depth is an important part of gas extraction in coal mines, and the sealing depth of coal seams for gas extraction in China generally refers to the “Provisions on Prevention and Control of Coal and Gas Outbursts”, i.e., it should not be less than 8 m. However, the geological and mining conditions of different mines are different, the complexity of the seams is not the same, and the reasonable sealing depths are also very different. Therefore, determining the reasonable minimum sealing depth for the actual conditions of the mine can not only help coal mining enterprises meet a high efficiency of gas extraction but also reduce the construction difficulty and the cost of drilling and sealing technology, which has a positive effect on the gas extraction of the mine.
After the formation of the working face coal seam roadway, the original stress balance is disrupted and the areas around the roadway and drill holes will form different areas of impact damage. Among them, the damage zone has the most serious coal body damage and a large number of fissures. If the sealing depth of the hole is too short, part of the extraction section will be located in the broken zone. In the process of extraction, a large number of pores and fissures are very likely to make the negative pressure of the borehole and the air in the roadway connect to form a circuit, thus allowing the roadway air to be “sucked” into the borehole and resulting in short-circuiting of the airflow, as shown in Figure 15, resulting in a sharp decline in the concentration of gas extraction. The coal body in the elastic zone is subjected to high ground stress, and the permeability of the coal body is low, especially in the coal rock body near the stress peak. The permeability will be reduced to its lowest under the action of high stress, almost blocking the flow of gas in the coal body at both ends, forming a pressure barrier. If the depth of the sealed hole is deeper than the stress peak point, it will lead to the gas inside the coal body from the boundary of the loosening circle to the end of the sealed hole section not being pumped out so as to form a blind zone of extraction, as shown in Figure 16.
After the unloading pressure of the roadway excavation, the initial stress state of the coal seam is destroyed; the stress is redistributed; and the indexes, such as the strength of the rock body, will also change. The two sides of the roadway form different impact damage zones in sequence, showing three kinds of changes from the center of the borehole outwards: the pressure relief zone (crushing zone), stress concentration zone (elastic zone, plastic softening zone), and original rock stress zone, whose distribution cloud diagram is shown in Figure 17. The stress distribution data were imported into the Origin 2018 64Bit software to draw the stress distribution, and the results are shown in Figure 18 and Figure 19. The distribution law of tangential stress around the roadway shows that the tangential stress of the coal body at the initial stage shows a stable upward trend with the increase in distance from the roadway, and the tangential stress at 12 m from the roadway is equal to the stress of the original rock. This shows that the boundary of the fracture zone is 12 m, and the peak stress occurs at 16 m from the roadway gang entrance, which indicates that the range of the plastic zone at this time is from 12 to 16 m. The stress decreases rapidly after reaching the peak, and the stress state is basically stable at 24 m from the roadway gang entrance, i.e., the range of the elastic zone is from 16 m to 24 m, and the stress zone is the original rock after 24 m. The stress distribution pattern around the roadway indicates that the tangential stress of the coal body at the initial stage increases steadily with the increase in distance from the roadway. When the sealing depth is greater than this area, the negative-pressure airflow from the drill hole and the circulation channels of a large number of pores and fissures in the area are blocked and the influence of air leakage from the drill hole on gas extraction is reduced, which is conducive to the extraction of gas from the coal seam.
According to the mining situation of the 2# coal seam in Dashucun Mine, the drilling holes were arranged in the wall of the roadway near the working face, with the diameter of the holes being 92 mm, and the distance between the neighboring holes being 6 m. The drilling chip sampling holes were arranged in the middle of the downstream gas extraction drilling holes, with the two drilling holes at the same level and at a distance of 3 m from the bottom plate of the roadway, and the five drilling holes were arranged in the test site, with the numbering of drilling holes ranging from 1# to 5#. The depth of each sampling hole was 30 m.
As can be seen from Figure 20, the change rule of the amount of drill cuttings per meter of the five groups of drill holes along the direction of the depth of the hole is almost the same, which can launch the distribution of stress in the coal body: At the drilling depth of 1~5 m, the amount of drill cuttings discharged from the sampling holes is very small and almost unchanged. The main reason is that the coal body in this area is in the unpressurized area (crushed area), which bears less stress, and the amount of drill cuttings discharged is small and basically remains stable. At the drilling depth of 5~8 m, the amount of drill cuttings gradually increases, which indicates that the coal body in this area is in the unloading zone; the stress on the coal body is greater than that in the crushing zone; and the amount of drill cuttings discharged from the drilling holes increases rapidly. At the drilling depth of 8~24 m, the amount of drill cuttings shows a trend of increasing and then decreasing, which indicates that the coal body in this area is in the stress concentration zone. The stress concentration zone can be divided into two sections: the pre-peak stress concentration zone and the post-peak stress concentration zone. The pre-peak stress concentration zone is at the depth of 12~16 m, and 16 m is the peak stress point of the coal body. The post-peak stress concentration zone of the coal body is at the depth of 16~24 m, and the stress state of the coal body in the region transitions from the stress concentration zone to the original rock stress zone. At the drilling depth of 25~30 m, the amount of drill cuttings is basically stable but still larger than the amount of drill cuttings in the area of 1~12 m. The coal body after 25 m is in the original stress area, and the stress value in the original rock stress area is smaller than the concentration area and larger than the stress value in the pressure relief area. Comparing with the analysis results of numerical simulation, it can be seen that the stress distribution of the surrounding rock of the roadway determined by the field test of the drilling chip volume method is basically consistent with the results of numerical simulation; therefore, the reasonable sealing depth of the No.2 coal seam in Dashucun coal mine is determined to be 16 m.

7. Conclusions

(1)
The distribution of pore volume and pore-specific surface area in each pore size section of Dashucun Mine coal samples follows the law of microporous > small pore > mesopore; the pore distribution is extremely unbalanced, with more development of tiny pores and less development of mesopores and macropores, and the 2–20 nm micropores determine the capacity of gas adsorption.
(2)
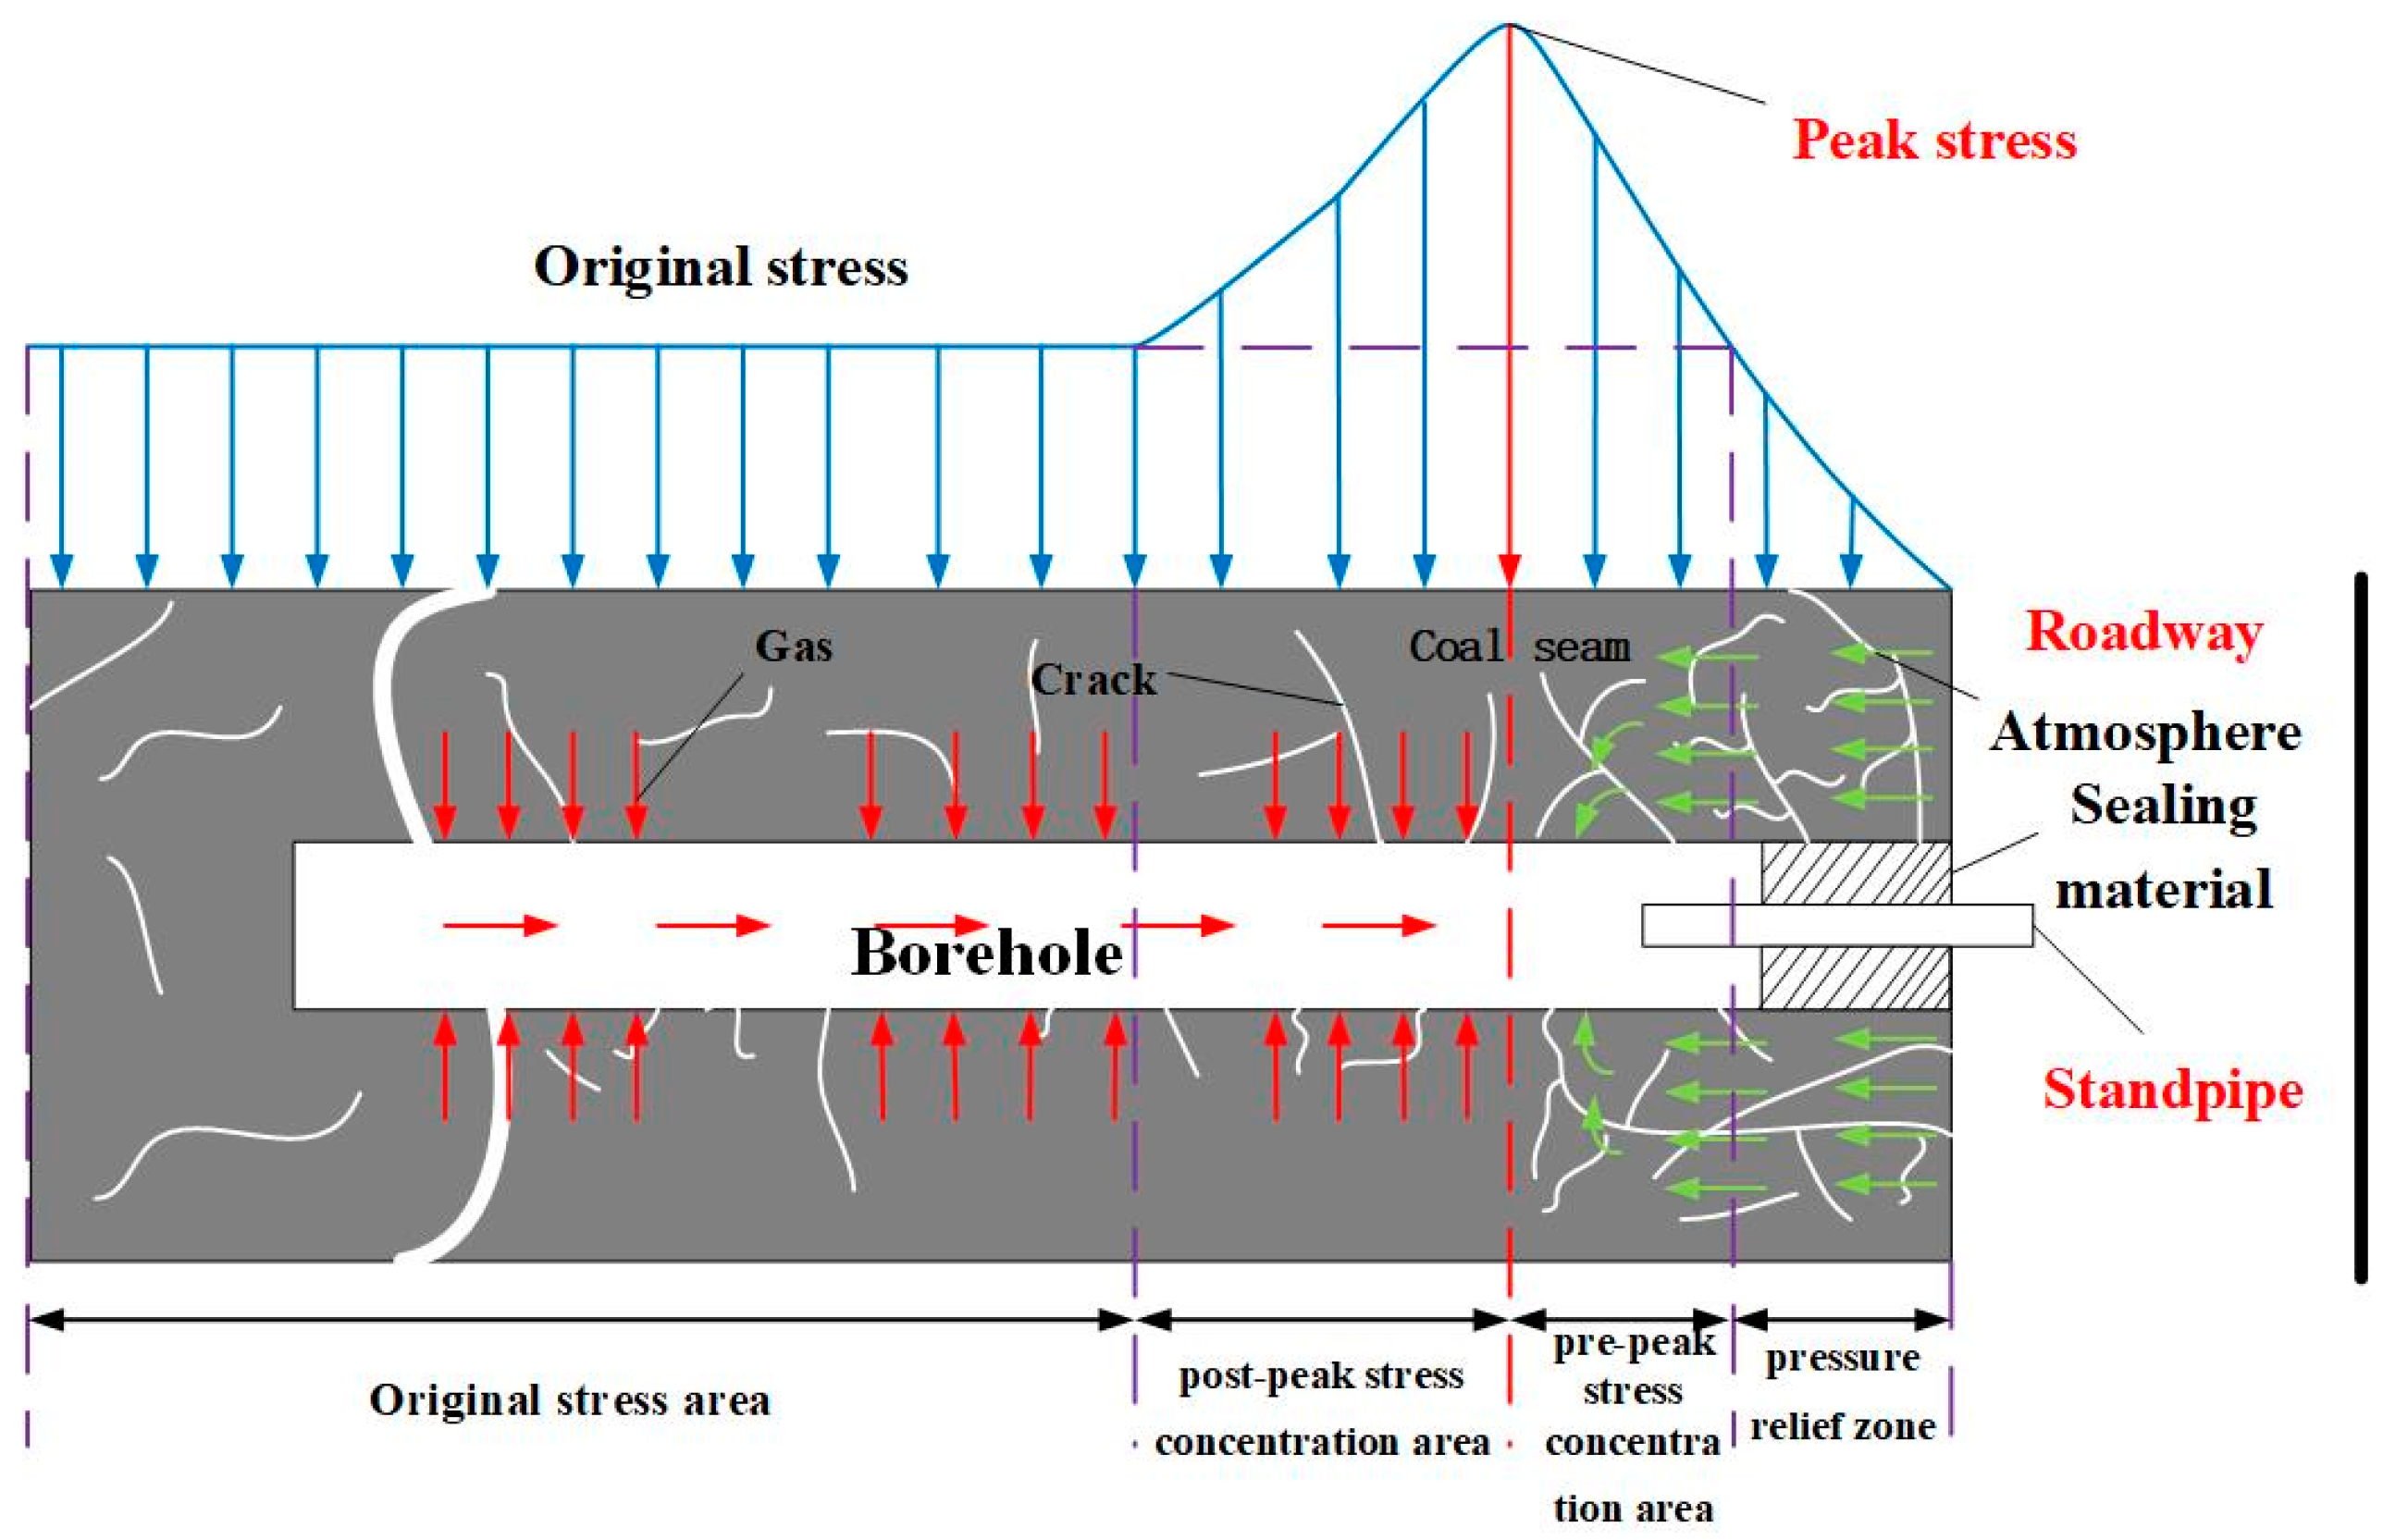
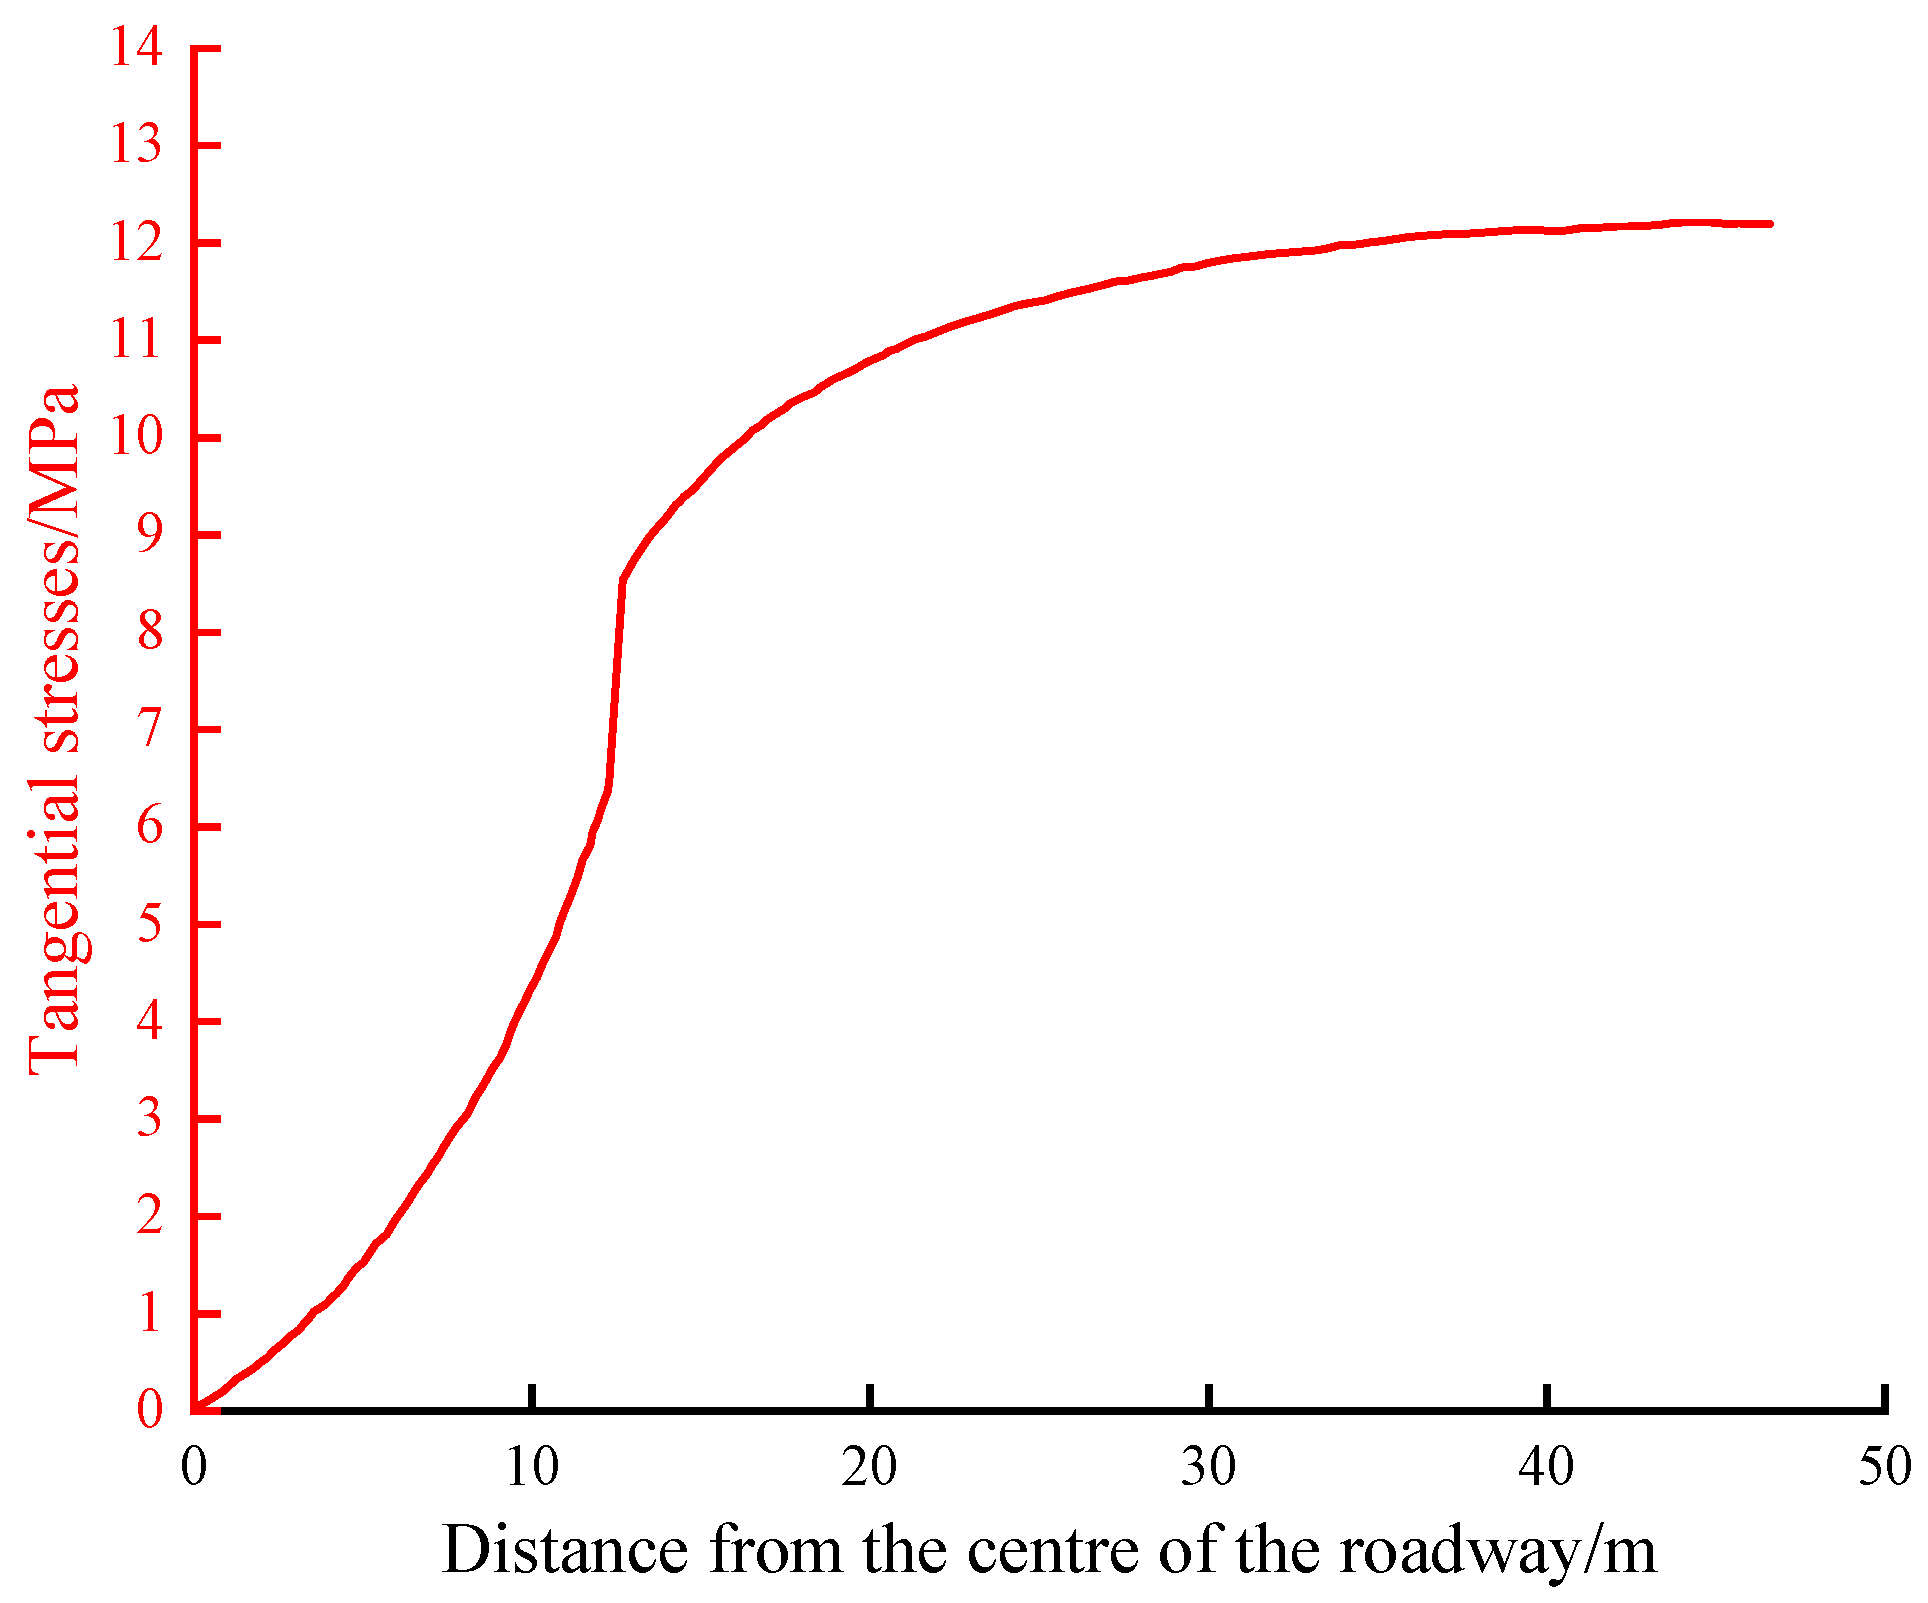
Considering the coal-rock body as a “double-hole-double-permeability” system, the transport control equations of the gas diffusion and seepage fields were established; a three-stage coal-rock damage permeability evolution model was established based on the changes caused by the roadway excavation and drilling construction; and, finally, the double-hole double-permeability coal-bed damage flow–solid coupling model was solved using COMSOL.
(3)
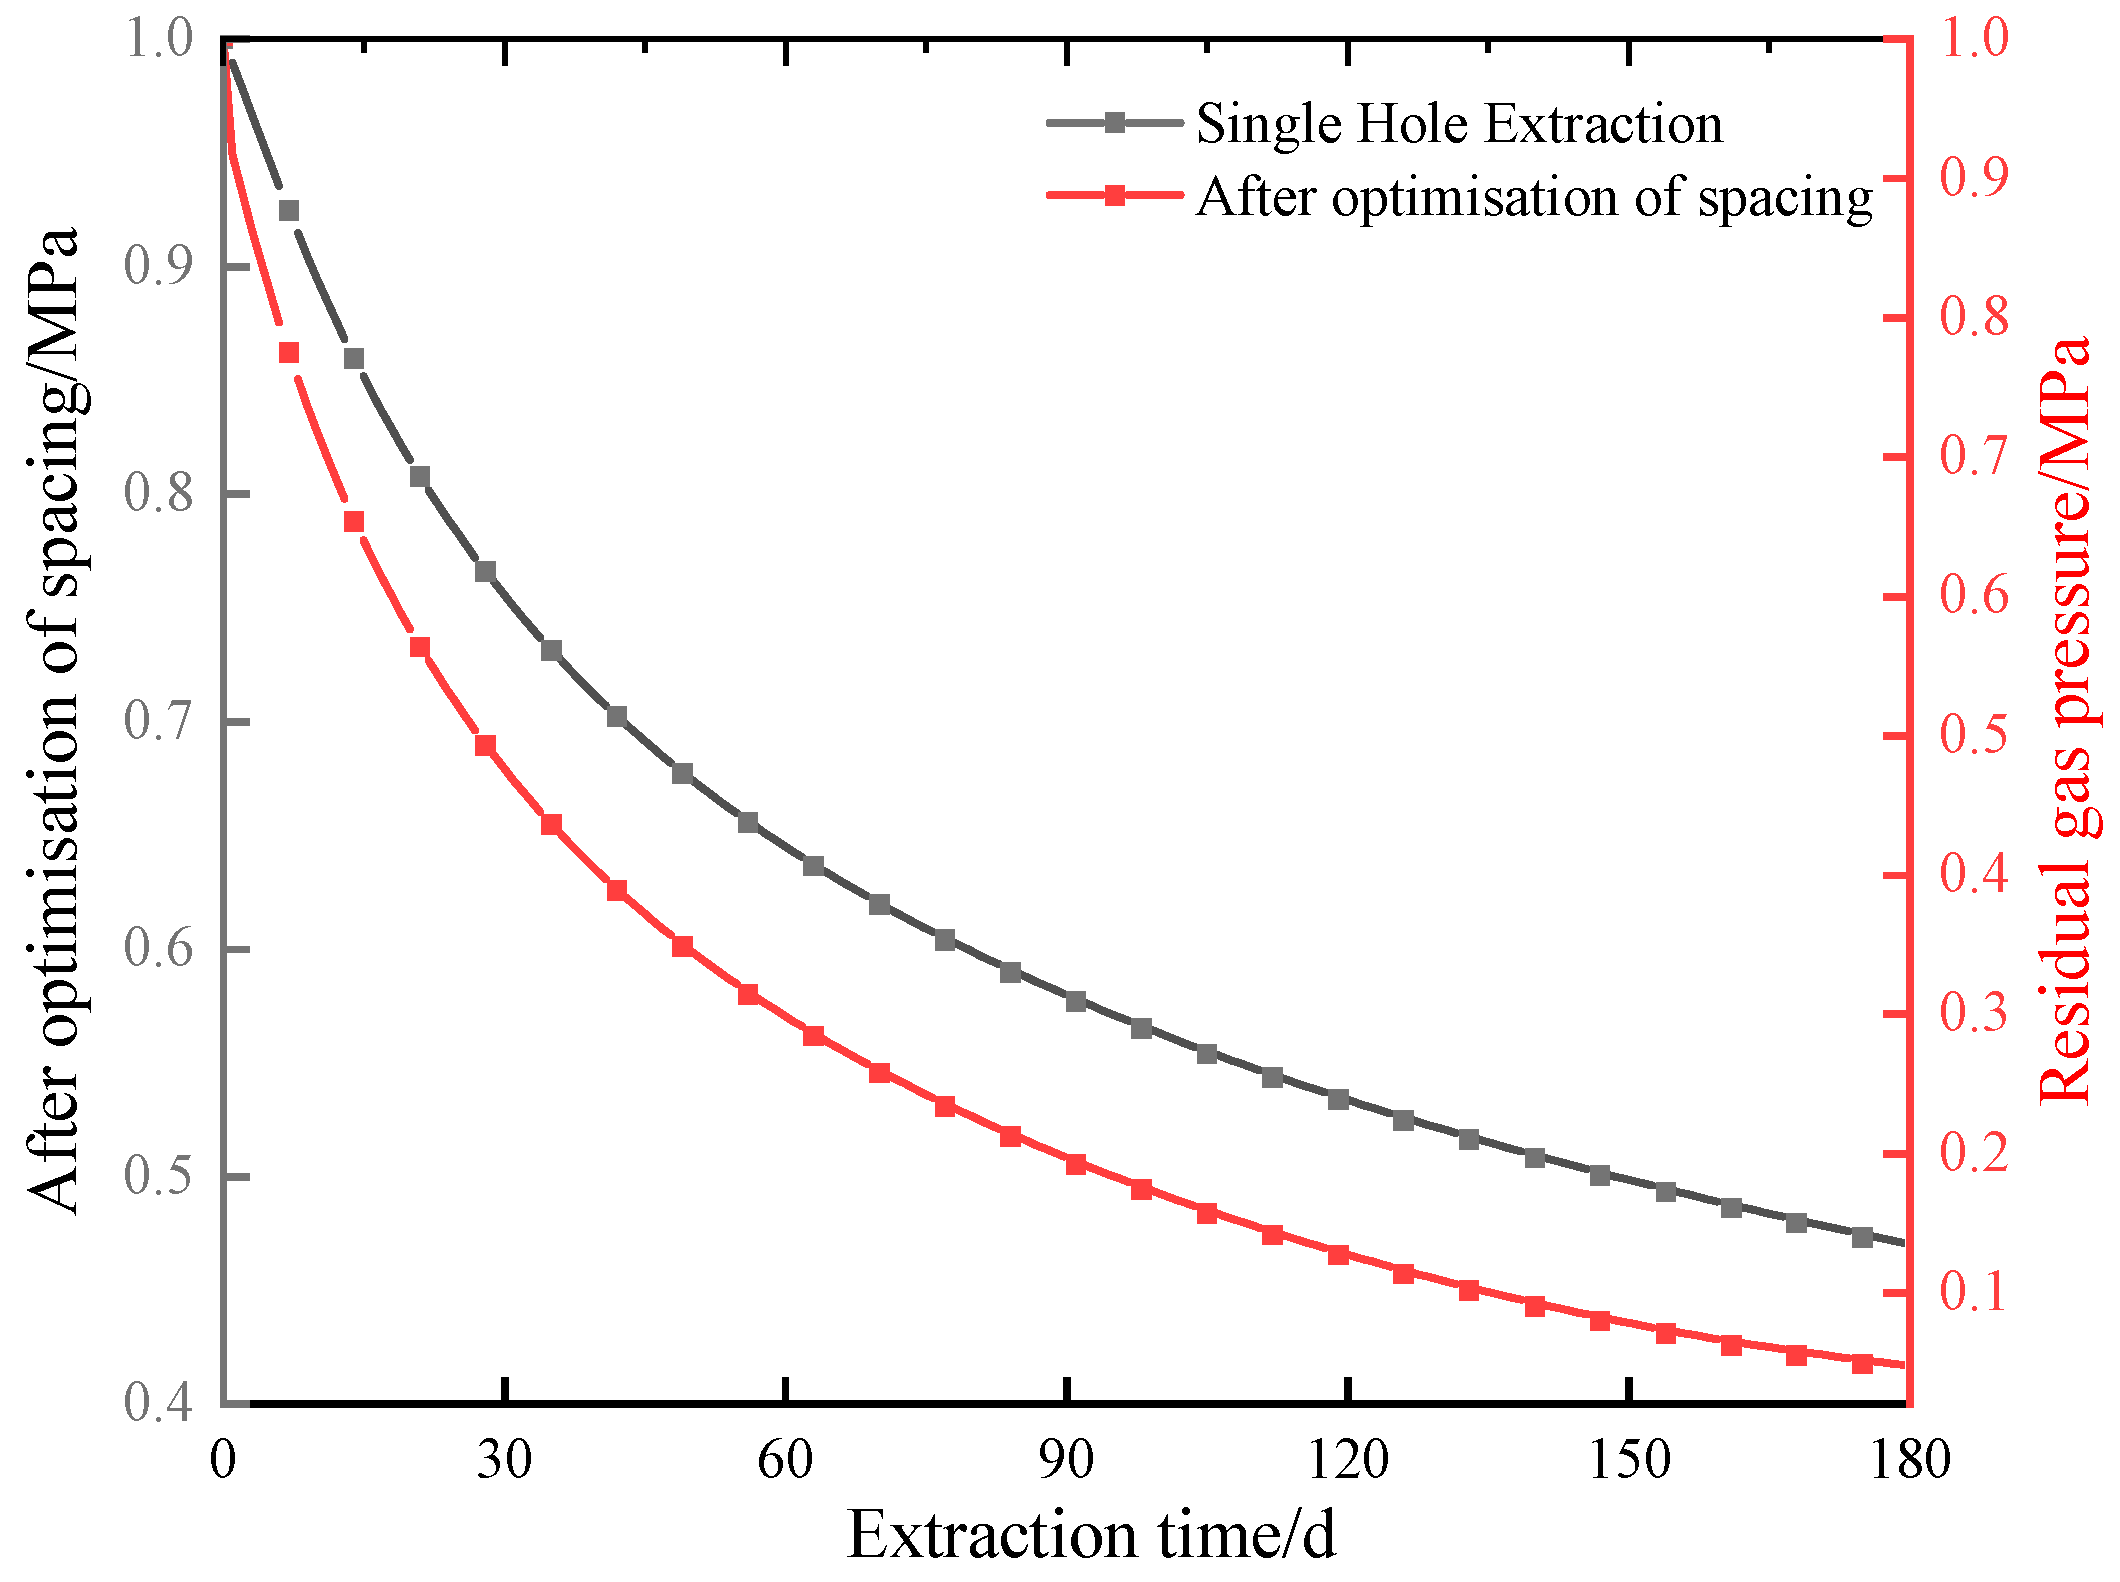
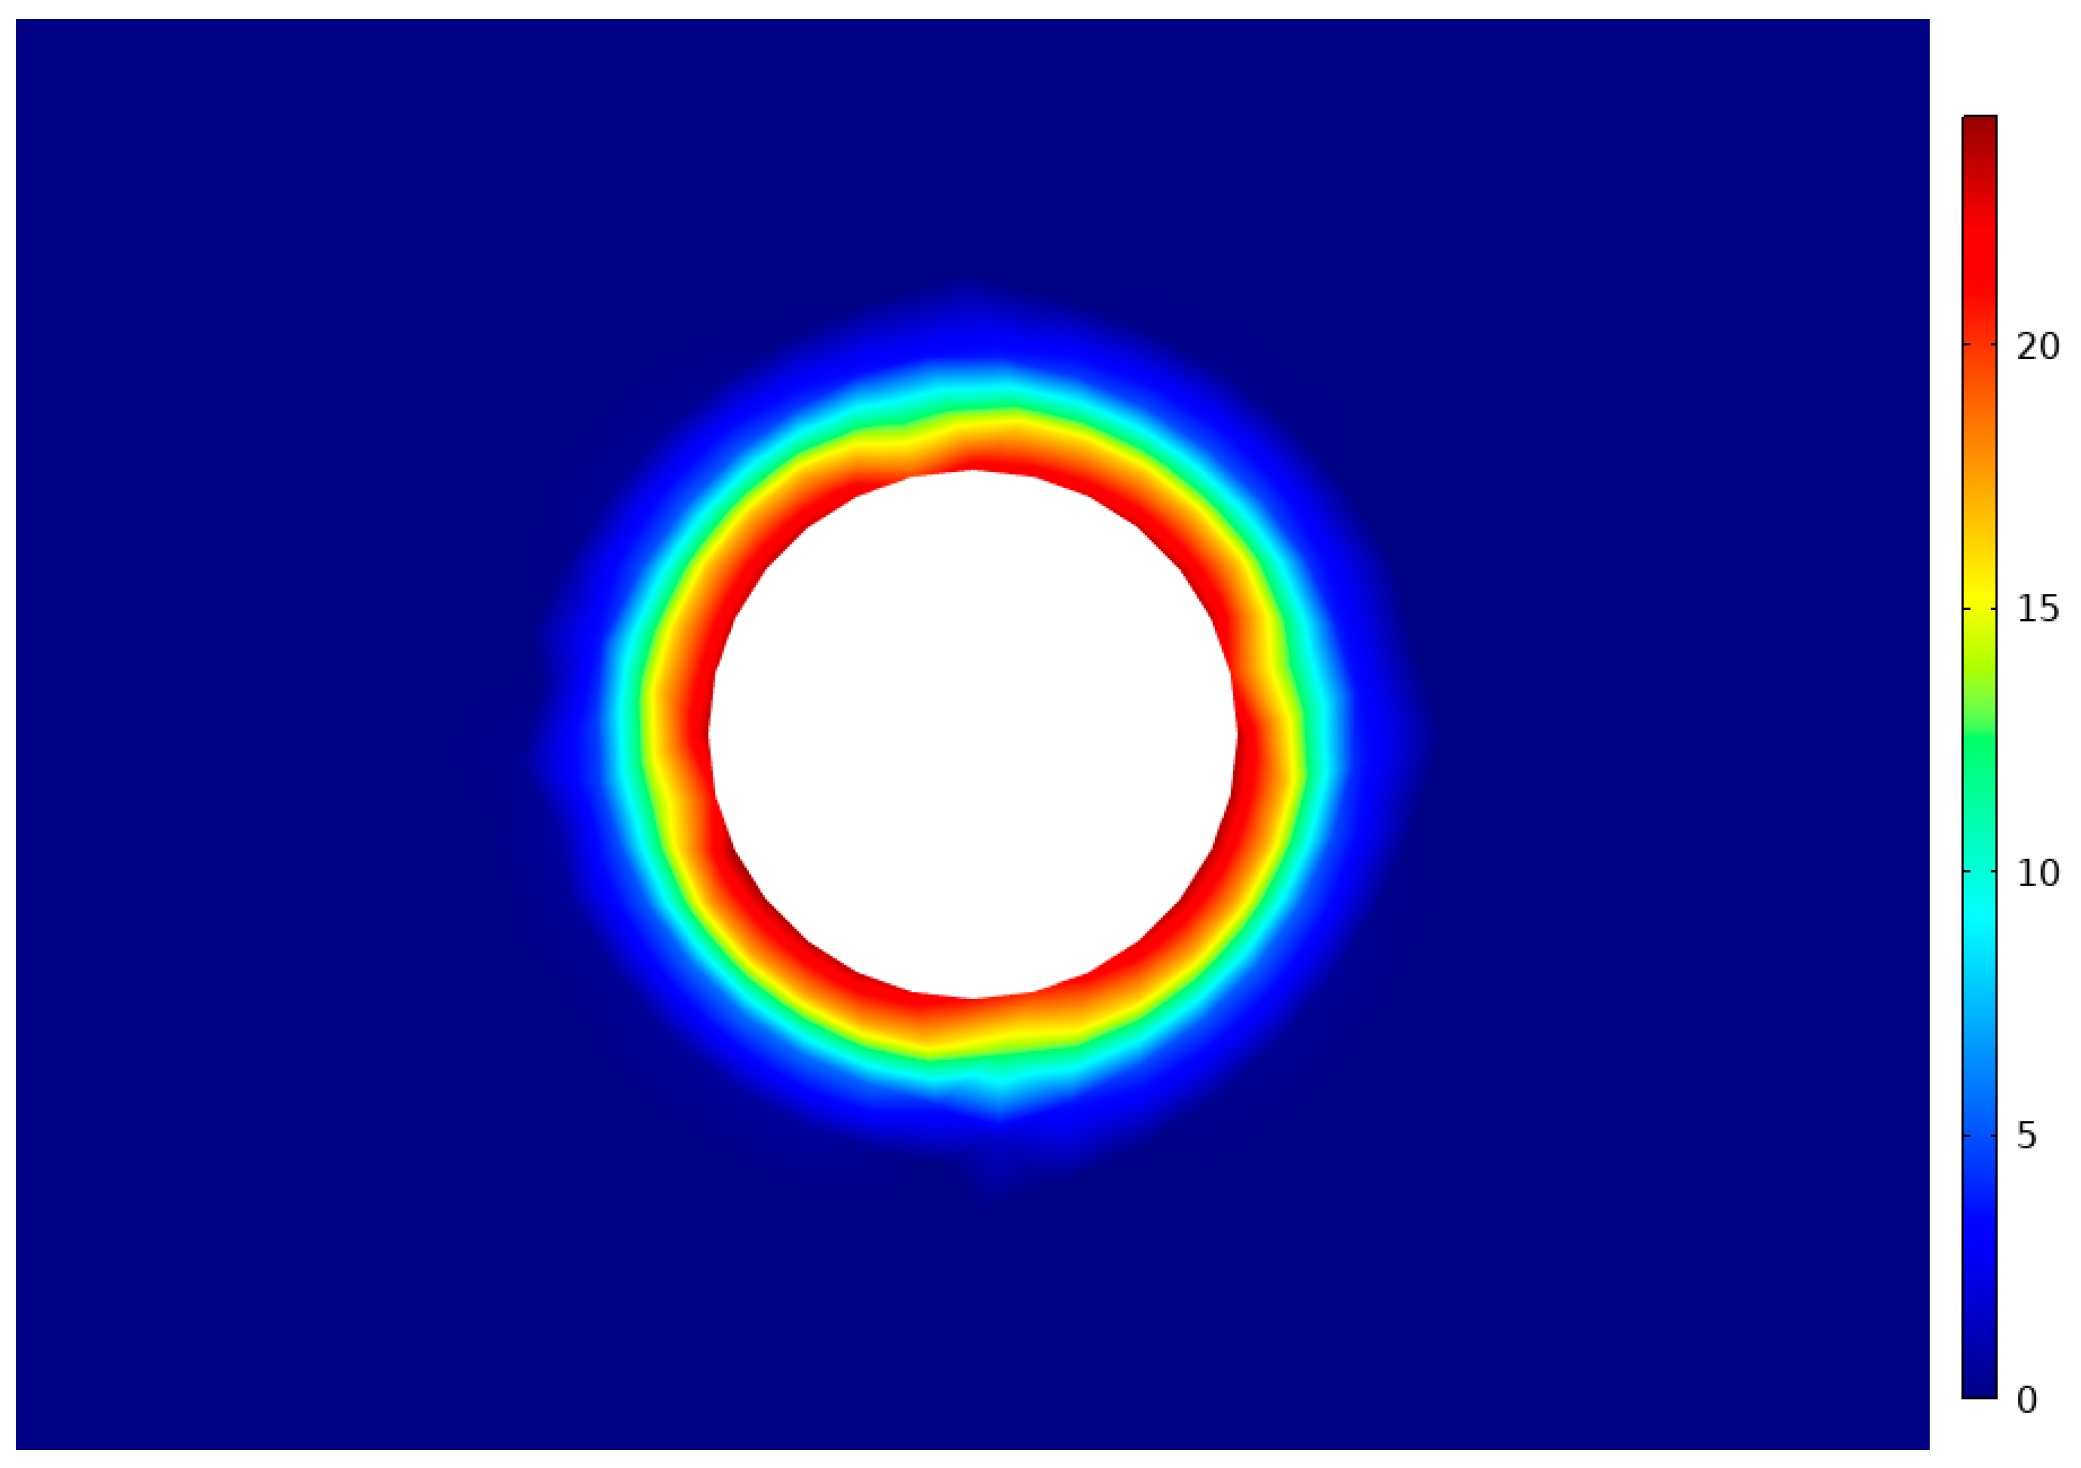
The maximum effective extraction radius of single-hole pumping is 4.8 m. The permeability change in the pre-pumping process is the result of the competition between the matrix contraction effect and the skeleton deformation effect. In order to improve the efficiency of pumping, the permeability should be kept at a suitable and stable level in the process of gas pumping to ensure that the permeability change is within the range of stable borehole spacing for the 4 m < d < 8 m.
(4)
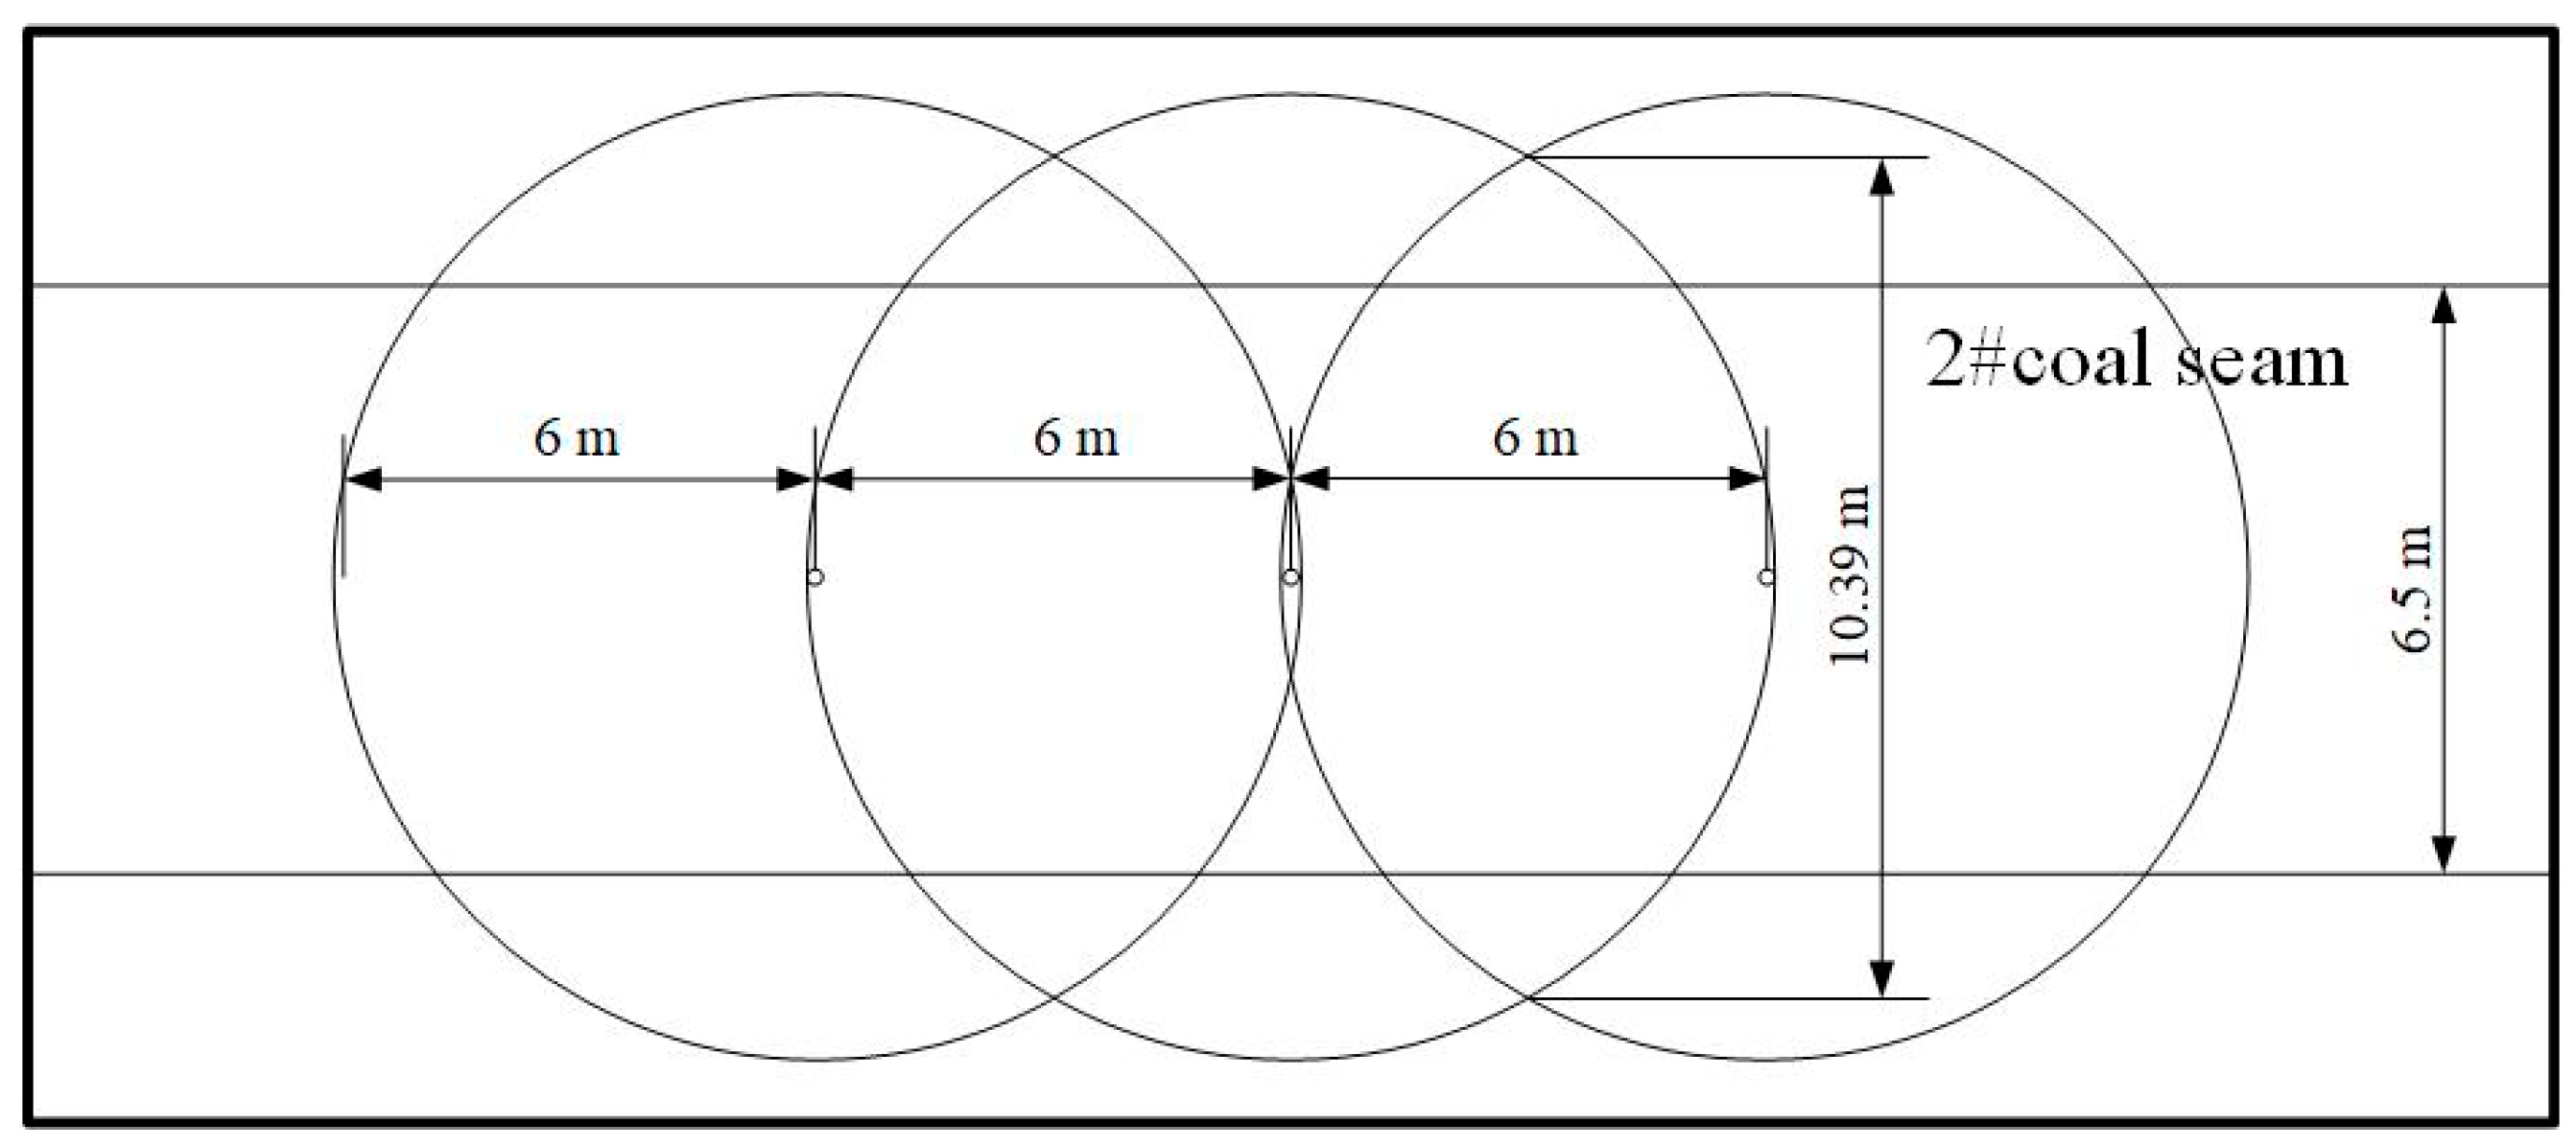
In multi-hole extraction, the pressure value in the center of adjacent holes increases with the increase in spacing and the superposition effect of holes becomes stronger with the decrease in hole spacing. To avoid the superposition effect and the blind zone of extraction, the hole spacing range is 5 m < d < 7 m, the optimal hole spacing of Dashucun Mine is 6 m, the reasonable depth of the sealing hole is 16 m, and the effect of on-site engineering verification is good.

Author Contributions

Writing—original draft preparation and conceptualization, J.Y.; methodology and investigation, K.L.; investigation and writing—review and editing, Y.J.; formal analysis, M.Z.; visualization, W.Z.; data curation, H.Y. All authors have read and agreed to the published version of the manuscript.

Funding

This research was funded by the National Natural Science Foundation of China (52174086), the National Natural Science Foundation of China Youth Fund (51804222), the 14th Graduate Innovative Fund of the Wuhan Institute of Technology (CX2022577), the 2022 Hubei Master Teacher Studio, and the Key Project of Hubei Province Education Department (D20201506).

Institutional Review Board Statement

Not applicable.

Informed Consent Statement

Not applicable.

Data Availability Statement

Not applicable.

Conflicts of Interest

The authors declare no conflict of interest.

References

  1. Xu, J.; Zhou, R.; Song, D.; Li, N.; Zhang, K.; Xi, D. Deformation and damage dynamic characteristics of coal–rock materials in deep coal mines. Int. J. Damage Mech. 2019, 28, 58–78. [Google Scholar] [CrossRef]
  2. Marinina, O.; Nechitailo, A.; Stroykov, G.; Tsvetkova, A.; Reshneva, E.; Turovskaya, L. Technical and Economic Assessment of Energy Efficiency of Electrification of Hydrocarbon Production Facilities in Underdeveloped Areas. Sustainability 2023, 15, 9614. [Google Scholar] [CrossRef]
  3. Zhang, M.; Lin, M.; Zhu, H.; Zhou, D.; Wang, L. An experimental study of the damage characteristicsof gas-containing coal under the conditions of different loading and unloadingrates. J. Loss Prevent Proc. 2018, 55, 338–346. [Google Scholar]
  4. Rong, H.; Zhang, H.; Zhu, Z.; Lu, Y.; Song, W.; Jia, C. Analysis of the mechanism for coal and gas outburst and measures for optimizing the risk relief. J. Saf. Environ. 2020, 20, 530–538. [Google Scholar]
  5. Wang, G.; Ren, T.; Qi, Q.; Zhang, L.; Liu, Q. Prediction of coalbed methane (CBM) production considering bidisperse diffusion: Model development, experimental test, and numerical simulation. Energy Fuels 2017, 31, 5785–5797. [Google Scholar] [CrossRef]
  6. Zhao, D.; Liu, J.; Pan, J.-T. Study on gas seepage from coal seams in the distance between boreholes for gas extraction. J. Loss Prevent. Proc. Ind. 2018, 54, 266–272. [Google Scholar]
  7. Liu, H. Fully coupled model and engineering application for deformation and pressure-relief gas flow of remote coal and rock mass due to mining. J. China Coal Soc. 2010, 36, 1243–1244. [Google Scholar]
  8. Yang, L. Numerical Simulation Method and Theory for Coalbed Methane Desorption-Diffusion-Seepage Problem. Ph.D. Thesis, Shandong University, Jinan, China, 2015. [Google Scholar]
  9. Tan, Y.; Pan, Z.; Liu, J.; Kang, J.; Zhou, F.; Connell, L.D.; Yang, Y. Experimental study of impact of anisotropy and heterogeneity on gas flow in coal. Part I: Diffusion and adsorption. Fuel 2018, 232, 444–453. [Google Scholar]
  10. Karbownik, M.; Krawczyk, J.; Godyń, K.; Schlieter, T.; Ščučka, J. Analysis of the Influence of Coal Petrography on the Proper Application of the Unipore and Bidisperse Models of Methane Diffusion. Energies 2021, 14, 8495. [Google Scholar]
  11. Gu, W.; Lu, Y.; Shi, S.; Wu, K.; Yin, H.; Huang, L.; Peng, S. Optimization on plastic zone scope of borehole based on gas extraction effect and its application. J. Saf. Sci. Technol. 2021, 17, 25–30. [Google Scholar]
  12. Zhang, J.; Liu, Y.; Ren, P.; Han, H.; Zuo, W. Optimization and experimental study on sealing parameters of crossing borehole based on creep effect. China Saf. Sci. J. 2021, 31, 97–104. [Google Scholar]
  13. Hu, S.; Liu, X.; Li, X. Fluid–solid coupling model and simulation of gas-bearing coal for energy security and sustainability. Processes 2020, 8, 254. [Google Scholar] [CrossRef]
  14. Duan, M.; Jiang, C.; Gan, Q.; Zhao, H.; Yang, Y.; Li, Z. Study on permeability anisotropy of bedded coal under true triaxial stress and its application. Transport Porous Med. 2020, 131, 1007–1035. [Google Scholar] [CrossRef]
  15. Liu, Y.; Zhang, Z.; Xiong, W.; Shen, K.; Ba, Q. The Influence of the Injected Water on the Underground Coalbed Methane Extraction. Energies 2020, 13, 1151. [Google Scholar] [CrossRef]
  16. Wang, L.; Liao, X.; Chu, P.; Zhang, X.; Liu, Q. Study on mechanism of permeability improvement for gas drainage by cross-steam cavitation borehole. Coal Sci. Technol. 2021, 49, 75–82. [Google Scholar]
  17. Li, S.; Zhou, Y.; Hu, B.; Qin, X.; Kon, X.; Bai, Y.; Zhang, J. Structural characteristics of adsorption pores in low-rank coals and their effects on methane adsorption performance. Coal Geol. Explor. 2023, 51, 127–136. [Google Scholar]
  18. Wang, H.; Wang, E.; Li, Z.; Wang, X.; Zhang, Q.; Li, B.; Ali, M. Study on sealing effect of pre-drainage gas borehole in coal seam based on air-gas mixed flow coupling model. Process Saf. Environ. Protect. 2020, 136, 15–27. [Google Scholar] [CrossRef]
  19. Yan, J.; Zhang, M.; Zhang, W.; Kang, Q. Simulation Study on the Characteristics of Gas Extraction from Coal Seams Based on the Superposition Effect and Hole Placement Method. Sustainability 2023, 15, 8409. [Google Scholar] [CrossRef]
  20. Kong, X.; Li, S.; Wang, E.; Wang, X.; Zhou, Y.; Ji, P.; Shuang, H.; Li, S.; Wei, Z. Experimental and numerical investigations on dynamic mechanical responses and failure process of gas-bearing coal under impact load. Soil Dyn. Earthq. Eng. 2021, 142, 106579. [Google Scholar] [CrossRef]
  21. Sidorenko, A.A.; Dmitriev, P.N.; Alekseev, V.Y.; Sidorenko, S.A. Improvement of technological schemes of mining of coal seams prone to spontaneous combustion and rock bumps. J. Min. Inst. 2023. [Google Scholar]
  22. Qi, L.; Qi, M.; Chen, X. Theoretical analysis of coal seam gas pressure distributionaround drainage hole and its application. China Saf. Sci. J. 2018, 28, 102–108. [Google Scholar]
  23. Wang, H. Research on the Outburst Elimination Effect Evaluation and Dynamic Inversion Model of Gas Parameters While Drilling for the Outburst Coal Seam Based on Directional Drilling. Ph.D. Thesis, China University of Mining and Technology, Beijing, China, 2020. [Google Scholar]
  24. Wei, J.; Wang, H.; Wang, D. An improved model of gas flow in coal based on the effect penetration and diffusion. J. China Univ. Min. Technol. 2016, 45, 873–878. [Google Scholar]
  25. Li, Z.Q.; Liu, Y.; Xu, Y.P.; Song, D.Y. Gas diffusion mechanism in multi-scale pores of coal particles and new diffusion model of dynamic diffusion coefficient. J. China Coal Soc. 2016, 41, 633–643. [Google Scholar]
  26. Xu, G.; Zhang, K.W.; Fan, Y.F. Numerical simulation of effective drainage radius and optimization of hole spacing under the influence of stack effect. Min. Saf. Environ. Prot. 2021, 48, 91–96. [Google Scholar]
  27. Lu, Y.N. Research on Numerical Simulation of Fluid-Solid and Field Application for Coalbed Methane Recovery. Master’s Thesis, Xi’an University of Science and Technology, Xi’an, China, 2018. [Google Scholar]
  28. Li, S.; Zhang, H.; Fan, C.; Tao, M. Coal seam dual media model and its application to the proper interpolation among the boring-holes in gas extraction. J. Saf. Environ. 2018, 18, 1284–1289. [Google Scholar]
  29. Taheri, A.; Sereshki, F.; Ardejani, F.D.; Mirzaghorbanali, A. Simulation of macerals effects on methane emission during gas drainage in coal mines. Fuel 2017, 210, 659–665. [Google Scholar] [CrossRef]
  30. Shichao, Z.O.U.; Song, X.I.N. Effective extraction radius of gas drilling in coal seam. China Saf. Sci. J. 2020, 30, 53–59. [Google Scholar]
  31. Zhou, A.; Wang, K.; Fan, L.; Kiryaeva, T.A. Gas-solid coupling laws for deep high-gas coal seams. Int. J. Min. Sci. Technol. 2017, 27, 675–679. [Google Scholar] [CrossRef]
  32. Ilyushin, Y.V.; Kapostey, E.I. Developing a Comprehensive Mathematical Model for Aluminium Production in a Soderberg Electrolyser. Energies 2023, 16, 6313. [Google Scholar] [CrossRef]
  33. Hu, S.; Wang, E.; Kong, X. Damage and deformation control equation for gas-bearing coal and its numerical calculation method. J. Nat. Gas. Sci. Eng. 2015, 25, 166–179. [Google Scholar] [CrossRef]
  34. Ji, M.; Sun, Z.-g.; Sun, W. A case study on the gas drainage optimization based on the effective borehole spacing in Sima coal mine. Geofluids 2021, 2021, 5510566. [Google Scholar]
  35. Liu, T.; Lin, B.; Yang, W.; Liu, T.; Kong, J.; Huang, Z.; Wang, R.; Zhao, Y. Dynamic diffusion-based multifield coupling model for gas drainage. J. Nat. Gas. Sci. Eng. 2017, 44, 233–249. [Google Scholar]
  36. Wang, X.; Zhou, H.; Zhang, L.; Preusse, A.; Xie, S.; Hou, W. Research on damage-based coal permeability evolution for the whole stress–strain process considering temperature and pore pressure. Geomech. Geophys. Geo-Energy Geo-Resour. 2022, 8, 149. [Google Scholar]
Figure 1. Variation in BET-specific surface area versus BJH pore volume and average pore size.
Sustainability 15 15339 g001
Figure 2. Pore volume and specific surface area percentage of each pore size section of coal samples.
Sustainability 15 15339 g002aSustainability 15 15339 g002b
Figure 3. Characteristic permeability change curves for the whole process of coal rock stress–strain.
Sustainability 15 15339 g003
Figure 4. Multi-physical field coupling relationship.
Sustainability 15 15339 g004
Figure 5. Three-dimensional geometric model and cross-section of gas extraction.
Sustainability 15 15339 g005
Figure 6. Matrix pore pressure distribution at different extraction times.
Sustainability 15 15339 g006
Figure 7. Effective extraction radius over time.
Sustainability 15 15339 g007
Figure 8. Variation in gas pressure with different drill hole spacings.
Sustainability 15 15339 g008
Figure 9. Variation in permeability of coal body with different hole spacings.
Sustainability 15 15339 g009
Figure 10. Variation curve of gas pressure with different hole spacings.
Sustainability 15 15339 g010
Figure 11. Cross-section of downhole arrangement.
Sustainability 15 15339 g011
Figure 12. Cross-section of a downhole.
Sustainability 15 15339 g012
Figure 13. Residual gas pressure in optimized coal seam.
Sustainability 15 15339 g013
Figure 14. (OPQRS) Regional gas residual pressure map.
Sustainability 15 15339 g014
Figure 15. Short-circuiting of airflow due to short sealing depths.
Sustainability 15 15339 g015
Figure 16. Pumping blindness due to long sealing depths.
Sustainability 15 15339 g016
Figure 17. Distribution of plastic zones around drill holes.
Sustainability 15 15339 g017
Figure 18. Radial stress distribution around the roadway.
Sustainability 15 15339 g018
Figure 19. Tangential stress distribution around the roadway.
Sustainability 15 15339 g019
Figure 20. Variation curve of drill cuttings volume with drilling depth.
Sustainability 15 15339 g020
Table 1. Results of industrial analyses of raw coal from Dashucun Mine.
Coal SampleMad (%)Aad (%)Vdaf (%)Vad (%)FCad (%)
heavy coal0.9318.156.434.3861.15
Table 2. Simulation parameters.
Parameter NameNumerical ValueParameter NameNumerical Value
Initial substrate porosity, φ00.05Langmuir volume product, VL/(m3/t)38.59
Initial cohesion, C0/MPa0.8Apparent density of coal, ρs/(kg/m3)1500
Initial Fracture permeability, per_c0/m21 × 10−17Negative pressure of extraction, pb/MPa30
Permeability impact factor, Cf/MPa−10.1Poisson’s ratio of coal, ν0.35
Internal friction angle, φc35Modulus of elasticity of coal, E/GPa1
Coefficient of kinetic viscosity, mu/Pa·s1.08 × 10−12Modulus of elasticity of coal matrix, Em/GPa0.75
Langmuir pressure, PL/MPa1.25Initial gas diffusion coefficient, D0/(m2/s)5.48 × 10−12
Attenuation coefficient, λ/s−15 × 10−17Limit adsorption deformation, εL0.012
Coal seam temperature, T/K315.15The Klinkenberg factor, Kb/MPa0.76
Table 3. (OPQRS) Regional gas residual pressure measurements.
Construction LocationDrill NumberNEInclination (°)Sealing Length (m)Residual Pressure (MPa)
172,403 upper shunts at point 25#138.2−12160.19
6 m before point 25# on 172,403238.1−12160.21
15.8 m before point 25# on 172,403338.1−12160.17
37.8 m before point 25# on 172,403438.1−12160.15
54.8 m before point 25# on 172,403538.1−12160.17
23.8 m before point 27# on 172,403638.1−15160.16
39.8 m before point 27# on 172,403738.1−15160.18
61.8 m before point 27# on 172,403838.1−15160.15
1.6 m before point 31# on 172,403938.1−15160.13
22.6 m before point 31# on 172,4031038.1−14160.16
39.6 m before point 31# on 172,4031138.1−14160.22
60.6 m before point 31# on 172,4031238.1−14160.16
77.6 m before point 31# on 172,4031338.1−14160.20
12.8 m before point 33# on 172,4031438.1−14160.27
28.8 m before point 33# on 172,4031538.1−15160.16
50.8 m before point 33# on 172,4031638.1−15160.28
71.8 m before point 33# on 172,4031738.1−15160.21
1.3 m before point 35# on 172,4031838.1−15160.25
20.3 m before point 35# on 172,4031938.1−15160.28
Table 4. (OPQRS) Regional residual gas content determinations.
Construction LocationDrill NumberNEInclination (°)Sampling Depth (m)Gas Content (m3/t)
(OPQRS)
region
172,403 upper shunts at point 25#1(1)38.2−12232.88
1(2)38.2−12293.38
6 m before point 25# on 172,4032(1)38.1−12343.76
2(2)38.1−12403.04
15.8 m before point 25# on 172,4033(1)38.1−12443.11
3(2)38.1−12502.53
37.8 m before point 25# on 172,4034(1)38.1−12222.29
4(2)38.1−12272.68
54.8 m before point 25# on 172,4035(1)38.1−12343.11
5(2)38.1−12402.20
23.8 m before point 27# on 172,4036(1)38.1−15232.74
6(2)38.1−15292.98
39.8 m before point 27# on 172,4037(1)38.1−15452.70
7(2)38.1−15513.30
61.8 m before point 27# on 172,4038(1)38.1−15232.71
8(2)38.1−15292.09
1.6 m before point 31# on 172,4039(1)38.1−15352.36
9(2)38.1−15412.30
22.6 m before point 31# on 172,40310(1)38.1−14232.26
10(2)38.1−14292.85
39.6 m before point 31# on 172,40311(1)38.1−14353.10
11(2)38.1−14413.87
60.6 m before point 31# on 172,40312(1)38.1−14232.76
12(2)38.1−14282.94
77.6 m before point 31# on 172,40313(1)38.1−14342.69
13(2)38.1−14403.59
12.8 m before point 33# on 172,40314(1)38.1−14233.05
14(2)38.1−14283.52
28.8 m before point 33# on 172,40315(1)38.1−15452.21
15(2)38.1−15502.96
50.8 m before point 33# on 172,40316(1)38.1−15223.75
16(2)38.1−15273.03
71.8 m before point 33# on 172,40317(1)38.1−15363.01
17(2)38.1−15413.68
1.3 m before point 35# on 172,40318(1)38.1−15243.57
18(2)38.1−15293.36
20.3 m before point 35# on 172,40319(1)38.1−15423.28
19(2)38.1−15473.35
Disclaimer/Publisher’s Note: The statements, opinions and data contained in all publications are solely those of the individual author(s) and contributor(s) and not of MDPI and/or the editor(s). MDPI and/or the editor(s) disclaim responsibility for any injury to people or property resulting from any ideas, methods, instructions or products referred to in the content.

