Article

How to Promote the Development of Industrial Wastewater Treatment Technological Innovation in China: A Tripartite Evolutionary Game Analysis

1
School of Management Science and Engineering, Chongqing Technology and Business University, Chongqing 400067, China
2
Wealth Management School, Chongqing Finance and Economics College, Chongqing 400067, China
*
Author to whom correspondence should be addressed.
Sustainability 2023, 15(21), 15359; https://doi.org/10.3390/su152115359
Submission received: 23 September 2023 / Revised: 12 October 2023 / Accepted: 25 October 2023 / Published: 27 October 2023

Abstract

:
As a priority in the water treatment field, industrial wastewater treatment has attracted much attention in China. Although previous studies have pointed out the importance of technological innovation in industrial wastewater treatment, they have not taken into account the complex relationships involved in the subject, resulting in ineffectiveness. To solve this problem, this study innovatively introduces a wastewater treatment service provider and constructs a three-party evolutionary game model by simultaneously considering the penalty mechanism and public participation. An evolutionary stability analysis of each subject was performed, and the initial strategy and sensitivity analysis of the key parameters were explored through numerical simulation. The results of the study are as follows: (1) there was a positive interaction between the behaviors and strategies of the three parties of wastewater treatment; (2) subsidies and penalties can effectively encourage wastewater enterprises and wastewater treatment service providers to choose green behavior; (3) technological innovation in wastewater treatment is the key to reducing additional costs; (4) public supervision and media monitoring have a more obvious impact on governmental strategic decisions. The results of this study can provide a reference for the government to improve incentives and for stakeholders to adjust their strategies for decision support.

1. Introduction

Since the onset of the 21st century, there has been a substantial increase in the global population and economic scale, consequently leading to an escalated demand for water resources. Projections anticipate a 50–80% increase in global water usage over the next three decades [1]. Nonetheless, the adverse impacts of worldwide climate change, water pollution, and ecological water degradation have significantly affected the water supply, leading to an expanding gap in water resources [2,3,4]. Under the dual pressure of climate change and explosive population growth, the rapid expansion of the global industry has exacerbated water scarcity [5,6]. To achieve sustainable development, the primary approaches to alleviating water scarcity include reducing wastewater discharge, mitigating water pollution, and enhancing water resource recycling. Technological innovation in industrial wastewater treatment plays a key role in addressing water scarcity and achieving sustainable development, as emphasized by [7].
In contemporary China, the government assumes a central role as a key participant and leading force in environmental problems [8]; governmental intervention has an irreplaceable role in addressing environmental problems [9], but water environment governance requires high professionalism and involves substantial costs [10]. Therefore, solely relying on the government to undertake water environment governance is challenging. The government must engage and mobilize various stakeholders, including enterprises and the public, given their presence and the complexity they introduce, which contributes to the difficulty in treating environmental pollution. When the government is involved in environmental governance, policy implementation is closely related to cost-effectiveness, which largely influences decision making [11]. Enterprises always prioritize profit maximization as their primary goal, despite the associated social risks [12]. The implementation of environmental policies can impose additional production costs on enterprises. Consequently, if the revenues generated by these enterprises do not exceed the corresponding costs, they lack the necessary incentive to comply with the prescribed environmental policies [13,14]. Thus, the government often employs environmental regulatory policies to address the cost barriers and mitigate the inherent conflicts of interest [15].
In addition to the cost barriers faced by enterprises, efficient, stable, moderately priced, and scalable wastewater treatment methods are also urgently needed [16,17]. Research findings indicate that the existing water sustainability challenges primarily center around wastewater treatment technologies [7]. In China’s current wastewater treatment practices, it is crucial to address key issues such as technical deficiencies, inadequate efficiency, and limited coordination [7]. Developing an effective incentive mechanism can offer assistance in addressing these issues [18]. However, the current research on the incentive mechanism of wastewater treatment only targets some of the relevant stakeholders, such as the government, enterprises, and the public, ignoring the incentive needs of technological innovation. Currently, the majority of industrial enterprises in China lack specialized wastewater treatment technologies that are tailored for enhanced water quality treatment, and they most predominantly rely on conventional technologies characterized by low efficiency and high costs [19]. Technological innovation has emerged as a crucial factor for industrial enterprises to effectively promote pollution treatment and achieve sustainable development, and the government should enhance the innovation incentive mechanism across various aspects [20]. Therefore, the introduction of wastewater treatment service providers (WTSPs) as the stakeholders of technological innovation is important for mechanism construction.
The heterogeneity of needs and diverse interests among stakeholders involved in wastewater governance underscores the importance of examining the behavioral strategies of the key stakeholders [21]. The existing literature focuses on conflicts of interest between governments and polluting enterprises and the inclusion of the public as a stakeholder [22,23]. In practice, stakeholders in wastewater management often form potential cooperative relationships, and their decision-making processes are mutually influenced by one another [11,24,25]. Notably, some local governments display negative behavior in pollution treatment and may collude with polluting enterprises [26]. Cai [27] demonstrated a further game equilibrium between the regulator and the polluting enterprise. Chin [28] analyzed water symbiosis networks in industrial parks, pointing out that the government plays a leading role among stakeholders and can effectively address the distribution of benefits. Furthermore, the government must consistently adapt the incentive strategy in response to the evolution of the wastewater treatment industry, resulting in varying rewards for both the government and the recipients of incentives. This aspect is crucial for driving changes in stakeholder strategies and facilitating the design and enhancement of incentives [29]. However, environmental governance in chemical parks currently lacks public participation [30]. Nevertheless, with sufficient governmental support, public monitoring can help alleviate the burden on local governments [31,32]. Despite researchers’ interest in wastewater management agents such as governments and companies, there remains a relative scarcity of studies on the behavior and decision making of industrial wastewater technology innovation agents. Additionally, examining the factors that impact cooperation and conflict among stakeholders and their decision-making processes can aid in optimizing incentive policies [33].
During the implementation of an incentive policy, public participation can not only dynamically influence policy implementation and the strategic choices of other participants, forcing the government to take responsibility for environmental regulation, but also encourage enterprises to improve their environmental performance [31,34]. The government can provide subsidies to support technological innovation, but subsidies are a “double-edged sword” and need to consider the appropriate scope for decision-makers [35]. The introduction of punishment mechanisms can also effectively mitigate individual uncooperative behavior, and such mechanisms are commonly observed in both social and biological systems [36]. In long-term evolution, punishment mechanisms greatly promote cooperation, and punishment benefits all participants in the system [37]. Incorporating punishment into incentive mechanisms not only effectively suppresses system fluctuations but also serves as an optimal strategy for evolutionary stabilization [38]. However, there are even fewer studies on the incentive mechanism of technological innovation in wastewater treatment that consider both public participation and punishment mechanisms, and the impact of these two factors on the evolution of technological innovation behavior and strategies in wastewater treatment is unclear.
Therefore, this paper presents three research objectives:
(1)
To establish a three-party game model of the government, wastewater enterprises, and WTSPs considering factors such as public participation and penalty mechanisms and to analyze the strategies of each party;
(2)
To investigate the reciprocal impact and evolutionary trend of each party’s strategy and elucidate the effects of diverse factors on the conduct and decisions of participants in the game;
(3)
To propose countermeasure suggestions for stakeholders’ promotion of technological innovation development in wastewater treatment, drawing on the findings of this research.

2. Literature Review

2.1. Industrial Wastewater Treatment Technology

In the past forty years, wastewater has persistently been an inherently challenging issue, constraining the sustainable advancement of society and posing a threat to the ecological environment [7]. In China, industrial wastewater treatment technology primarily emulates the model used for treating urban domestic wastewater [39], which typically comprises three primary treatment systems: pretreatment, biochemical treatment, and advanced treatment [40,41]. Advanced treatment methods are primarily categorized into three main groups: physical separation methods, chemical treatment methods, and biochemical methods. But they all face different challenges: physical separation methods, represented by magnetic separation [42] and membrane separation processes [43], face the accumulation of pollutants and delayed diffusion in filtration [44]; chemical treatment methods, represented by ozone treatment [45] and supercritical water oxidation [46], face many limitations in economic terms and large-scale applications [47]; and biochemical methods, represented by constructed wetlands [48] and biological activated carbon [49], are currently at the forefront of industrial wastewater treatment research [50,51]. While these technologies have advanced to a certain extent, challenges such as high costs, energy consumption, and limited applicability hinder their widespread adoption [52,53]. In summary, the existing wastewater treatment technologies are deficient to a certain extent, and there is still a need to enhance their treatment capacities to meet increasingly stringent wastewater discharge standards [17,54]. The research on wastewater technology innovation is also a key concern for everyone and attracts a lot of attention [55].

2.2. Incentive Mechanism under Evolutionary Game

Through the lens of game theory, incentive mechanisms are developed as responsive game rules to achieve an equilibrium that maximizes benefits for all participants [56]. Game theory provides a versatile model applicable to diverse contexts, transcending specific geographical limitations [37,57]. Because of the dynamic advantages inherent in evolutionary game theory and considering the limited rationality of game participants, some researchers have chosen to use evolutionary game theory to construct incentive mechanisms [9]. For instance, Long [58] elucidated optimal strategies in varying conditions by investigating the influence of green development performance and government reward and punishment mechanisms on enterprises’ decision making. Yuan [59] established a model encompassing the government, developers, and consumers within prefabricated residential buildings, analyzed sensitivity factors, and proposed incentive mechanisms. Liu [60] developed a three-way evolutionary game model involving the government, developers, and suppliers to investigate the incentive mechanisms and decision-making behavior of stakeholders in a green building supply market.
At present, scholars are mainly studying the incentives associated with environmental governance by developing two-party or three-party evolutionary game models. For example, André and Gabriel [24] developed a two-party game model that encompassed policymakers and enterprises to address pollution sources, considering review costs for both parties. Sun [11] devised a model between the central government and local governments, exploring the impact of a central environmental monitoring system on the latter. Kou [32] built a two-sided game model between environmental inspectors and enterprises, analyzing corrupt behavior in environmental tax collection regarding upward accountability and highlighting the role of higher government power in public supervision. Some studies have explored three-party evolutionary games, such as Chu [31], who investigated government, enterprise, and public interactions from the perspective of public participation and proposed a new public participation mechanism to improve the incentive mechanism for standard discharge.
The above literature shows that there have been several studies on industrial wastewater treatment technology, stakeholders in pollution treatment, and incentive mechanisms. Among them, evolutionary games are considered a potent tool for designing incentive mechanisms and scrutinizing stakeholders’ decision-making behavior given their dynamic advantages [21]. Although some scholars have contributed to environmental governance incentive mechanisms using evolutionary game theory, there are still the following shortcomings: first, most studies primarily focus on two or three stakeholders within the spectrum of the government, enterprises, and the public, often overlooking the substantial impact of technological innovation, which is demonstrably important in advancing wastewater treatment. Secondly, although implementing punishment mechanisms can influence the strategy choice of game subjects, there is a dearth of studies that have comprehensively examined the methods or the extent of the influence of this mechanism in depth. Hence, this paper endeavors to build a three-party evolutionary game model of the government, wastewater enterprises, and WTSPs to fill this gap in WTSPs, taking into account public participation and reward and punishment mechanisms and exploring the interplay, evolutionary trends, and mechanisms of each party.

3. Game Modeling and Analysis

Evolutionary game theory is a good way to test the effectiveness of mechanisms and regulation [61,62]. The origins of evolutionary game theory can be traced back to the biological theory of evolution [38]. It differs from traditional game theory, as it considers the finite rationality of decision-makers, offering a powerful framework to analyze the evolution of perspectives and norms over time and predict competition outcomes in a dynamic environment [57]. In complex real-world situations, players’ rationality is limited, and players may fail to make the most rational choices in the initial stages of the game, but as the game progresses, players can optimize their strategies through imitation or learning [63]. Unlike mixed strategies in traditional game theory, individuals in evolutionary game theory choose between pure strategies with different probabilities, and it finds extensive applications in the analysis of decisions made by diverse subjects [64]. Therefore, the results of evolutionary game theory are chosen in this study to be more realistic. This study formulates a tripartite evolutionary game model comprising the government, wastewater enterprises, and WTSPs, with these three stakeholders referred to as players within the game.

3.1. Model Assumptions

Given the purpose of this study and the requirements of evolutionary game theory, and after referring to some existing literature and the Water Pollution Prevention and Control Action Plan [65] issued by China, the subsequent fundamental assumptions were established, along with the corresponding interpretations of the parameters, as illustrated in Table 1.
Assumption 1.
All three players in the game are finitely rational. In other words, each agent cannot precisely assess its costs and revenues, instead experimenting with diverse strategies over time before ultimately converging on a stable strategy [31].
Assumption 2.
Each player has two distinct strategies: active government participation in wastewater management or passive government participation in wastewater management with action set A1 (active participation, passive participation) [27]. Wastewater enterprises decide to engage in green production, which, in turn, determines whether they cooperate with WTSPs with action set A2 (green production, ordinary production) [21,38]. WTSPs choose whether to cooperate with wastewater enterprises to conduct technological innovation research and develop and provide services to treat the wastewater to be discharged by the wastewater enterprises with action set A3 (cooperation, no cooperation) [66,67]. In the initial stage, the probabilities that the government, wastewater enterprises, and WTSPs choose active participation, green production, and cooperation strategies are X, Y, and Z, respectively, and the probabilities that they choose passive participation, ordinary production, and no-cooperation strategies are 1 − X, 1 − Y, and 1 − Z, respectively; X, Y, and Z ∈ [0, 1] and X, Y, and Z are all functions of time t.
Assumption 3.
The government’s payment mainly includes environmental benefits, W, brought about by the green production of wastewater enterprises; the environmental management cost, Ce, that needs to be invested in the ordinary production of wastewater enterprises; the policy cost, Cs, paid by actively participating in sewage management, such as assessments, audits, and supervision; and the policy costs, γCs (γ ∈ [0, 1]), paid by negatively participating in sewage management [11]. In cases where the government chooses passive participation in sewage treatment, public supervision and media disclosure cause a certain amount of reputation loss to the government, which is denoted by Cf [31]. According to the Environmental Protection Tax Law [68], which officially came into effect in China on 1 January 2018, taxes are imposed on four primary pollutants, that is, air, water, solid waste, and noise, to motivate enterprises to reduce emissions. In sewage treatment, technologically advanced solutions are usually the ones with a larger amount of capital, and providing partial financial support is currently a necessary means for our government to guarantee effective sewage treatment. Therefore, this paper assumes that the government choosing to actively participate in sewage treatment implements incentives and penalties for wastewater enterprises and WTSPs. The incentives given to wastewater enterprises refer to green subsidies issued for successful green production, denoted by I1. The subsidies given to WTSPs are denoted by I2, and regardless of whether the government chooses active participation in sewage treatment, as long as WTSPs choose the cooperation strategy, the government continues to provide subsidies [35]. The tax penalty for wastewater enterprises that cannot discharge wastewater according to standards is set to S1, and the tax penalty for WTSPs that are unwilling to provide wastewater treatment services is set to S2 [24].
Assumption 4.
For wastewater enterprises, payments primarily consist of the base cost, C11, associated with regular production and the base revenue, V11. When wastewater enterprises choose green production, the discharged wastewater complies with the government’s regulations, the products can be labeled as green because of the green behavior of wastewater enterprises in the production process, and the green preference of consumers can lead to a green premium. The additional cost incurred by wastewater enterprises for green production is denoted by C12, while the additional revenue generated by selling green products is denoted by V12. When wastewater enterprises cooperate with WTSPs, if the cooperating party suffers a betrayal, a certain degree of sunk-cost loss will be recorded as T1 or T2, respectively.
Assumption 5.
For WTSPs, payments mainly consist of the base revenue, V21, and the cost of providing services, C21, when cooperating with wastewater enterprises, and the revenue is equal to the additional costs, C12, incurred by the enterprises’ green production.

3.2. Model Establishment

Based on the above assumptions, the payoff matrix for the government, wastewater enterprises, and WTSPs across different strategies can be deduced, as shown in Table 2.
Game players achieve a dynamic replication process in evolutionary game theory by continuously adjusting their strategies. This process is encapsulated by a dynamic differential equation that essentially governs the frequency of adopting or accepting a specific strategy within the population [25,60,69]. Based on the payoff matrix, the expected payoffs, average expected payoffs, and replication dynamics equations for the players can be obtained as follows.
Assuming that the government’s expected payoff for the active participation strategy is U11, the expected payoff for the passive participation strategy is U12, and the government’s average payoff is U1.
U 11 = y z W C s I 1 I 2 + y 1 z S 2 C s C e + 1 y z S 1 C e C s I 2 + 1 y 1 z S 1 + S 2 C e C s
U 12 = y z W I 2 C f γ C s + y 1 z C e C f γ C s + 1 y z C e I 2 C f γ C s + 1 y 1 z C e C f γ C s
U 1 = x U 11 + 1 x U 12
Assuming that the wastewater enterprises’ expected payoff for the green production strategy is U21, and the expected payoff for the ordinary production strategy is U22, the average payoff for wastewater enterprises is U2.
U 21 = x z ( V 11 + V 12 C 11 C 12 + I 1 ) + x 1 z ( V 11 C 11 + F C 12 T 1 ) + 1 x z ( V 11 + V 12 C 11 C 12 ) + 1 x 1 z V 11 C 11 + F C 12 T 1
U 22 = x z ( V 11 C 11 F S 1 ) + x 1 z V 11 C 11 S 1 ) + 1 x z ( V 11 F C 11 + 1 x 1 z V 11 C 11
U 2 = y U 21 + 1 y U 22
Similarly, assuming that the expected payoff of WTSPs for the cooperation strategy is U31, and the expected payoff for the no-cooperation strategy is U32, the average payoff for WTSPs is U3.
U 31 = x y ( V 21 + C 12 C 21 + I 2 ) + x 1 y ( V 21 + F C 21 T 2 ) + 1 x y ( V 21 + C 12 C 21 ) + 1 x 1 y ( V 21 + F C 21 T 2 )
U 32 = x y ( V 21 S 2 F ) + x 1 y ( V 21 S 2 ) + 1 x y ( V 21 F ) + 1 x 1 y ( V 21 )
U 3 = z U 31 + 1 z U 32

3.3. Analysis of Evolutionary Equilibrium Strategies

Strategy stability analysis identifies the enduring equilibrium strategy of each player within a dynamic system over the long term. The dynamics of strategic probability are the key to evolutionary game theory [70]. The rate of change is important because it represents the direction of change in probability, with a positive sign indicating that the probability is increasing and a negative sign indicating that the probability is decreasing. This method can find the steady state and the possible equilibrium of the model.

3.3.1. Evolutionary Equilibrium Strategy Analysis of the Government

In the replication dynamics equation, parameter t denotes time, and dx/dt is the rate of change in the proportion regarding the government choosing active participation over time. From Equations (1)–(3), the dynamic replication equation for the government can be derived, as in Equation (10).
F x = d x / d t = x ( U 11 U 1 ) = x 1 x U 11 U 12 = x x 1 C f C s + S 1 + S 2 + γ C s S 1 y S 2 z I 1 y z
The derivative of F(x) with respect to x is provided by the following expression:
( F ( x ) ) x = 1 2 x C f C s + S 1 + S 2 + γ C s S 1 y S 2 z I 1 y z
Let
H z = C f C s + S 1 + S 2 + γ C s S 1 y S 2 z I 1 y z
From the stability discrimination of the differential equation, it follows that the government’s active participation in the sewage treatment strategy needs to satisfy F(x) = 0 and ( F ( x ) ) x < 0 to reach a stable state. Because ( H ( z ) ) z = I 1 y S 2 , I 1 y S 2 < 0 such that ( H ( z ) ) z < 0 , and H(z) is a decreasing function of z. When z = C f C s + S 1 + S 2 + γ C s S 1 y I 1 y + S 2 = z * , H(z) = 0 and F(x) ≡ 0 when any x keeps the government in an evolutionarily stable state. When z < z* and H(z) > 0, x = 1 is the government’s strategy for reaching an evolutionary steady state; conversely, when z > z* and H(z) < 0, x = 0 is the government’s strategy for reaching an evolutionary steady state. That is, the government tends to choose passive participation when the probability of WTSPs choosing cooperation is high. The replicated dynamic phase diagram of the government is shown in Figure 1.
In Figure 1, the probability of the government choosing active participation in sewage treatment within the evolutionary game stabilization strategy corresponds to the volume delineated in the P1 section, which is denoted by VP1, indicating that this is the government’s evolutionary game stabilization strategy at that time. In other words, active participation in sewage treatment is the evolutionary strategy of the government, and the volume of the probability of active participation, VP1, is calculated as follows:
V P 1 = 0 1 0 1 C f + S 1 + S 2 S 1 y C s + γ C s I 1 y + S 2 d y d x
Inference 1: The probability of the government choosing active participation in sewage treatment exhibits a negative correlation with the policy cost, Cs, of the government choosing active participation in sewage treatment; that is, the higher the cost of implementing and enforcing the policy, the more unfavorable it is for the government to adopt the active participation policy. Active participation in sewage treatment is positively correlated with tax penalty S1 incurred by wastewater enterprises for not engaging in green production and penalty S2 for WTSPs; this is positively correlated with the public and media reputation loss Cf, suffered because of passive participation in sewage treatment and negatively correlated with the government subsidy, I1, given to wastewater enterprises.
Based on the probability formula, VP1, representing the government’s active participation in sewage treatment, the partial derivatives of VP1 with regard to Cs, S1, S2, Cf, and I1 can be derived as follows:
V P 1 C s < 0 , V P 1 S 1 > 0 , V P 1 S 2 > 0 , V P 1 C f > 0 , V P 1 I 1 < 0
Thus, the probability of active participation in sewage treatment is negatively related to Cs. Active participation in sewage treatment is positively related to S1 and S2 and negatively related to I1. This indicates that the higher the Cs, the lower the government’s motivation to actively participate in sewage treatment; the higher the Cf, the higher the government’s motivation to actively participate in sewage treatment; the higher the S1, the higher the government’s motivation to actively participate in sewage treatment; the higher the S2, the higher the probability of the government’s active participation in sewage treatment; and the higher the I1, the lower the probability of active government participation in sewage treatment.
Inference 2: The probability of the government choosing active participation, x, exhibits a negative correlation with the probability of WTSPs choosing cooperation, z. When z < z* and H(z) < 0, x = 1 is the government’s evolutionarily stable strategy. Conversely, when z > z* and H(z) > 0, x = 0 is the government’s evolutionary stabilization strategy, indicating that the greater z is, the more likely it is that the government will choose to passively participate in sewage treatment. Conversely, a reduction in z corresponds to an increase in x.

3.3.2. Evolutionary Equilibrium Strategy Analysis of Wastewater Enterprises

Here, dy/dt is the rate of change in the proportion of wastewater enterprises that choose green production over time. Likewise, with Equations (4)–(6), the dynamic replication equation for wastewater enterprises can be derived, as in Equation (13):
F y = d y / d t = y U 21 U 2 = y 1 y U 21 U 22 = y y 1 S 1 x C 12 z T 1 + T 1 z + V 12 z + I 1 x z
The derivative of F(y) with respect to y is provided by the following expression:
( F ( y ) ) y = 1 2 y ( S 1 x C 12 z T 1 + T 1 z + V 12 z + I 1 x z )
Let
H x = S 1 x C 12 z T 1 + T 1 z + V 12 z + I 1 x z
From the stability discrimination of the differential equation, it follows that wastewater enterprises’ green production in the sewage treatment strategy needs to satisfy F(y) = 0 and ( F ( y ) ) y < 0 to reach a stable state. Because ( H ( x ) ) x = I 1 + S 1 and I 1 + S 1 > 0 such that ( H ( x ) ) x > 0 , H(x) is an increasing function of x. When x = C 12 z + T 1 ( V 12 + T 1 ) z I 1 z + S 1 = x * , H(x) = 0, and F(y) ≡ 0, then y can keep the wastewater enterprises in an evolutionarily stable state. When x < x* and H(x) < 0, y = 0, and the strategy of the wastewater enterprises reaches an evolutionarily stable state; conversely, when x > x* and H(x) > 0, y = 1, and the strategy of the wastewater enterprises also reaches an evolutionarily stable state. In other words, a higher probability of the government choosing active participation in sewage treatment tends to coincide with wastewater enterprises leaning toward a green production strategy. The replicated dynamic phase diagram of wastewater enterprises is shown in Figure 2.
In Figure 2, the probability of wastewater enterprises choosing the green production strategy in sewage treatment within the evolutionary game stabilization strategy corresponds to the volume delineated in the P1 section, designated as VP1, which indicates that this is a stable evolutionary game strategy for wastewater enterprises at that time. The calculation is as follows:
V P 2 = 0 1 0 1 C 12 z + T 1 ( V 12 + T 1 ) z I 1 z + S 1 d z d y , V P 1 = 1 V P 2
Inference 3: The probability of green production exhibits a positive correlation with the government’s tax penalty imposed on wastewater enterprises for ordinary production (S1), the government’s subsidy provided for wastewater enterprises’ green production (I1), and the additional revenue derived from the sale of green production products by wastewater enterprises (V12). The probability of green production exhibits a negative correlation with the additional cost incurred by wastewater enterprises for green production (C12) and the sunk-cost loss for suffering a cooperative betrayal (T1).
Based on the probability formula for the choice of green production strategy by the wastewater enterprise (VP1), the partial derivatives of the formula with respect to S1, I1, V12, C12, and T1 can be obtained as follows:
V P 1 S 1 > 0 , V P 1 I 1 > 0 , V P 1 V 12 > 0 , V P 1 C 12 < 0 , V P 1 T 1 < 0
Therefore, increasing I1 and S1 may result in an elevation of the probability of wastewater enterprises choosing a green production strategy. A decrease in C12 and an increase in V12 will also increase the probability of wastewater enterprises choosing a green production strategy. Meanwhile, an increase in T1 suffered by wastewater enterprises in cooperation will force them to choose an ordinary production strategy.
Inference 4: The probability of wastewater enterprises choosing green production, y, is positively correlated with the probability of the government choosing active participation in sewage treatment. When x < x* and H(x) < 0, y = 0 is the wastewater enterprises’ evolutionary stabilization strategy, indicating that the greater the probability of the government choosing an active participation strategy (x), the more likely that wastewater enterprises will choose green production in sewage treatment. Conversely, when x > x* and H(x) > 0, the strategy leading to evolutionary stability for wastewater enterprises is y = 1. ( H ( x , z ) ) x > 0 implies that, as the probability of the government choosing active participation in sewage treatment increases, the probability of wastewater enterprises choosing green production strategies also increases. Therefore, active participation by the government can serve as an incentive, fostering the adoption of green production practices among wastewater enterprises.

3.3.3. Evolutionary Equilibrium Strategy Analysis of Wastewater Technology Service Providers

Here, dz/dt is the rate of change in the proportion of WTSPs that choose cooperation over time. Likewise, with Equations (7)–(9), the dynamic replication equation for WTSPs can be derived, as in Equation (16):
F z = d z / d t = z U 31 U 3 = z 1 z U 31 U 32 = z 1 z I 2 T 2 + C 12 y C 21 y + S 2 x + T 2 y
The derivative of F(z) with respect to z is provided by the following expression:
( F ( z ) ) z = 1 2 z ( I 2 T 2 + C 12 y C 21 y + S 2 x + T 2 y )
Let
H ( y ) = I 2 T 2 + C 12 y C 21 y + S 2 x + T 2 y
From the stability discrimination of the differential equation, it follows that WTSPs need to satisfy F(z) = 0 and F’(z) < 0 to reach a stable state by choosing the cooperation strategy. Because ( H ( y ) ) y = C 12 C 21 + T 2 and C12 − C21 + T2 > 0 such that ( H ( y ) ) y > 0 , H(y) is an increasing function of y. When y = T 2 I 2 S 2 x C 12 C 21 + T 2 = y * , H(y) = 0, and F(z) ≡ 0, then any z can keep WTSPs in an evolutionarily stable state. When y < y* and H(y) < 0, z = 0 is the strategy that WTSPs use to reach an evolutionarily stable state; conversely, when y > y* and H(y) > 0, z = 1 is the strategy that WTSPs use to reach an evolutionarily stable state. In other words, a higher probability of wastewater enterprises choosing a cooperative strategy tends to align with WTSPs favoring cooperation. A replication dynamic phase diagram of WTSPs is shown in Figure 3.
Figure 3 shows that the volume depicted in the P2 part signifies the probability of WTSPs choosing cooperation within the stable evolutionary game strategy. This specific volume is labeled VP2, signifying the evolutionary game’s stable strategy for WTSPs at that time. The calculation is as follows:
V P 1 = 0 1 0 1 T 2 S 2 x I 2 C 12 C 21 + T 2 d z d y , V P 2 = 1 V P 1
Inference 5: The probability of WTSPs choosing the cooperation strategy is positively related to the government’s tax penalty for WTSPs choosing no cooperation (S2), the government’s subsidy for WTSPs choosing cooperation (I2), and the additional cost of wastewater enterprises choosing green production (C12); it is negatively related to the cost C21 of the WTSPs’ cooperation and the sunk-cost loss T2 for suffering a cooperative betrayal.
Based on the probability equation for the choice of cooperation strategy of WTSPs (VP2), the partial derivatives of the equations regarding S2, I2, C12, the default payment (F), C21, and T2 can be obtained as follows:
V P 2 S 2 > 0 , V P 2 I 2 > 0 , V P 2 C 12 > 0 , V P 2 C 21 < 0 , V P 2 T 2 < 0
Therefore, an increase in C12 can lead to higher revenue for WTSPs and increase the probability of WTSPs choosing cooperation. Additionally, increasing I2 and S2 will also increase the probability of wastewater enterprises choosing green production. Conversely, an increase in C21 and T2 will compel WTSPs to choose the no-cooperation strategy.
Inference 6: The probability of WTSPs choosing the cooperation strategy is positively correlated with the probability of the wastewater enterprises choosing the green production strategy (y). When y < y* and H(y) < 0, z = 0 is the evolutionarily stable strategy for wastewater enterprises. Conversely, when y > y* and H(y) > 0, z = 1 is the evolutionary stability strategy for wastewater enterprises. ( H ( y , z ) ) y > 0 indicates that the greater the probability of wastewater enterprises choosing a green production strategy, the greater the probability of WTSPs choosing a cooperation strategy. Therefore, the green production of wastewater enterprises can increase the probability of WTSPs cooperating.

3.4. Analysis of Evolutionary Stability Points

The model reaches a steady state and stops evolving when the dynamic equation equals zero [62]. The stability points can be determined by solving the equations. This study employed the dynamic equilibrium concept from evolutionary game theory [57] and used Lyapunov’s method [71] to analyze the potential equilibrium points of the following three differential equations: (10), (13), and (16).
By setting F ( x ) = 0 , F ( y ) = 0 , and F ( z ) = 0 , eight possible equilibrium points were obtained: Q1(1,1,1), Q2(1,1,0), Q3(1,0,1), Q4(1,0,0), Q5(0,1,1), Q6(0,1,0), Q7(0,0,1), and Q8(0,0,0). Based on Equations (10), (13), and (16), the Jacobian matrix of the model can be derived:
J = F x x F x y F x z F y x F y y F y z F z x F z y F z z = 1 2 x ( C f C s + S 1 + S 2 + γ C s S 1 y S 2 z I 1 y z ) x S 1 + I 1 z x 1 x S 2 + I 1 y x 1 y S 1 + I 1 z y 1 1 2 y * S 1 x C 12 z T 1 + T 1 z + V 12 z + I 1 x z y y 1 T 1 C 12 + V 12 + I 1 x S 2 z z 1 z z 1 C 12 C 21 + T 2 1 2 z I 2 T 2 + C 12 y C 21 y + S 2 x + T 2 y
Based on the Jacobian matrix and the equilibrium points, the associated characteristics can be determined. The conditions that need to be satisfied to determine the stable state of the evolutionary game are as follows: if all three eigenvalues of the Jacobian matrix are less than zero, the equilibrium is asymptotically stable, and it is an evolutionarily stable strategy; if all three eigenvalues are greater than zero, the equilibrium is unstable, and it is an unstable point; if at least one of the eigenvalues is greater than zero and one is less than zero, the equilibrium is unstable and is a saddle point. The results are shown in Table 3.
In Table 3, since V 12 > C 12 > C 21 , the equilibrium points (1,1,0), (1,0,1), (0,1,0), and (0,0,1) are unstable or saddle points. When C s C f + I 1 γ C s < 0 is satisfied, the equilibrium point (1,1,1) is a stable point, and the equilibrium point (0,1,1) is a saddle point. In contrast, (1,1,1) is a saddle point, and (0,1,1) is a stable point. When C f + S 1 + S 2 ( 1 γ ) C s and I 2 T 2 < 0 are satisfied, the equilibrium point (0,0,0) is a stable point. However, considering the reality, the policy cost case, C f + S 1 + S 2 ( 1 γ ) C s , will rarely happen, and (0,0,0) cannot be a stable point. When C s C f S 1 S 2 γ C s < 0 and S 1 < T 1 are satisfied, the equilibrium point (1,0,0) is a stable point.

4. Numerical Simulation Analysis

Given the challenges associated with acquiring empirical data within a limited timeframe, this study adopted the numerical simulation analysis method to perform quantitative analysis. Given its powerful iterative and interactive quantitative analysis capabilities, the numerical simulation analysis method has found extensive applications in resolving game-related issues among various stakeholders in multiple contexts [60].
Thus, based on the model assumptions and analysis, MATLAB 2022a was used to rigorously test the model’s outcomes and explore the impact of the initial strategies and parameters. The relevant initial parameter assignment data were obtained from the China Statistical Yearbook [72], the China Statistical Yearbook on Environment [73], and a Chongqing wastewater treatment company. Since some of the variables are interval values, the average values were used in consideration of the model calculation. The initial parameter values, as delineated in Table 1, are enumerated in Table 4, as depicted below.

4.1. Impact of Different Initial Strategies

Assuming, in the initial state, that the corresponding probability values of the three parties’ strategies are x = 0.2, y = 0.2, and z = 0.2, this analysis explores the impact of the initial probabilities of each party’s strategy on the probabilities of the remaining two parties’ strategies.
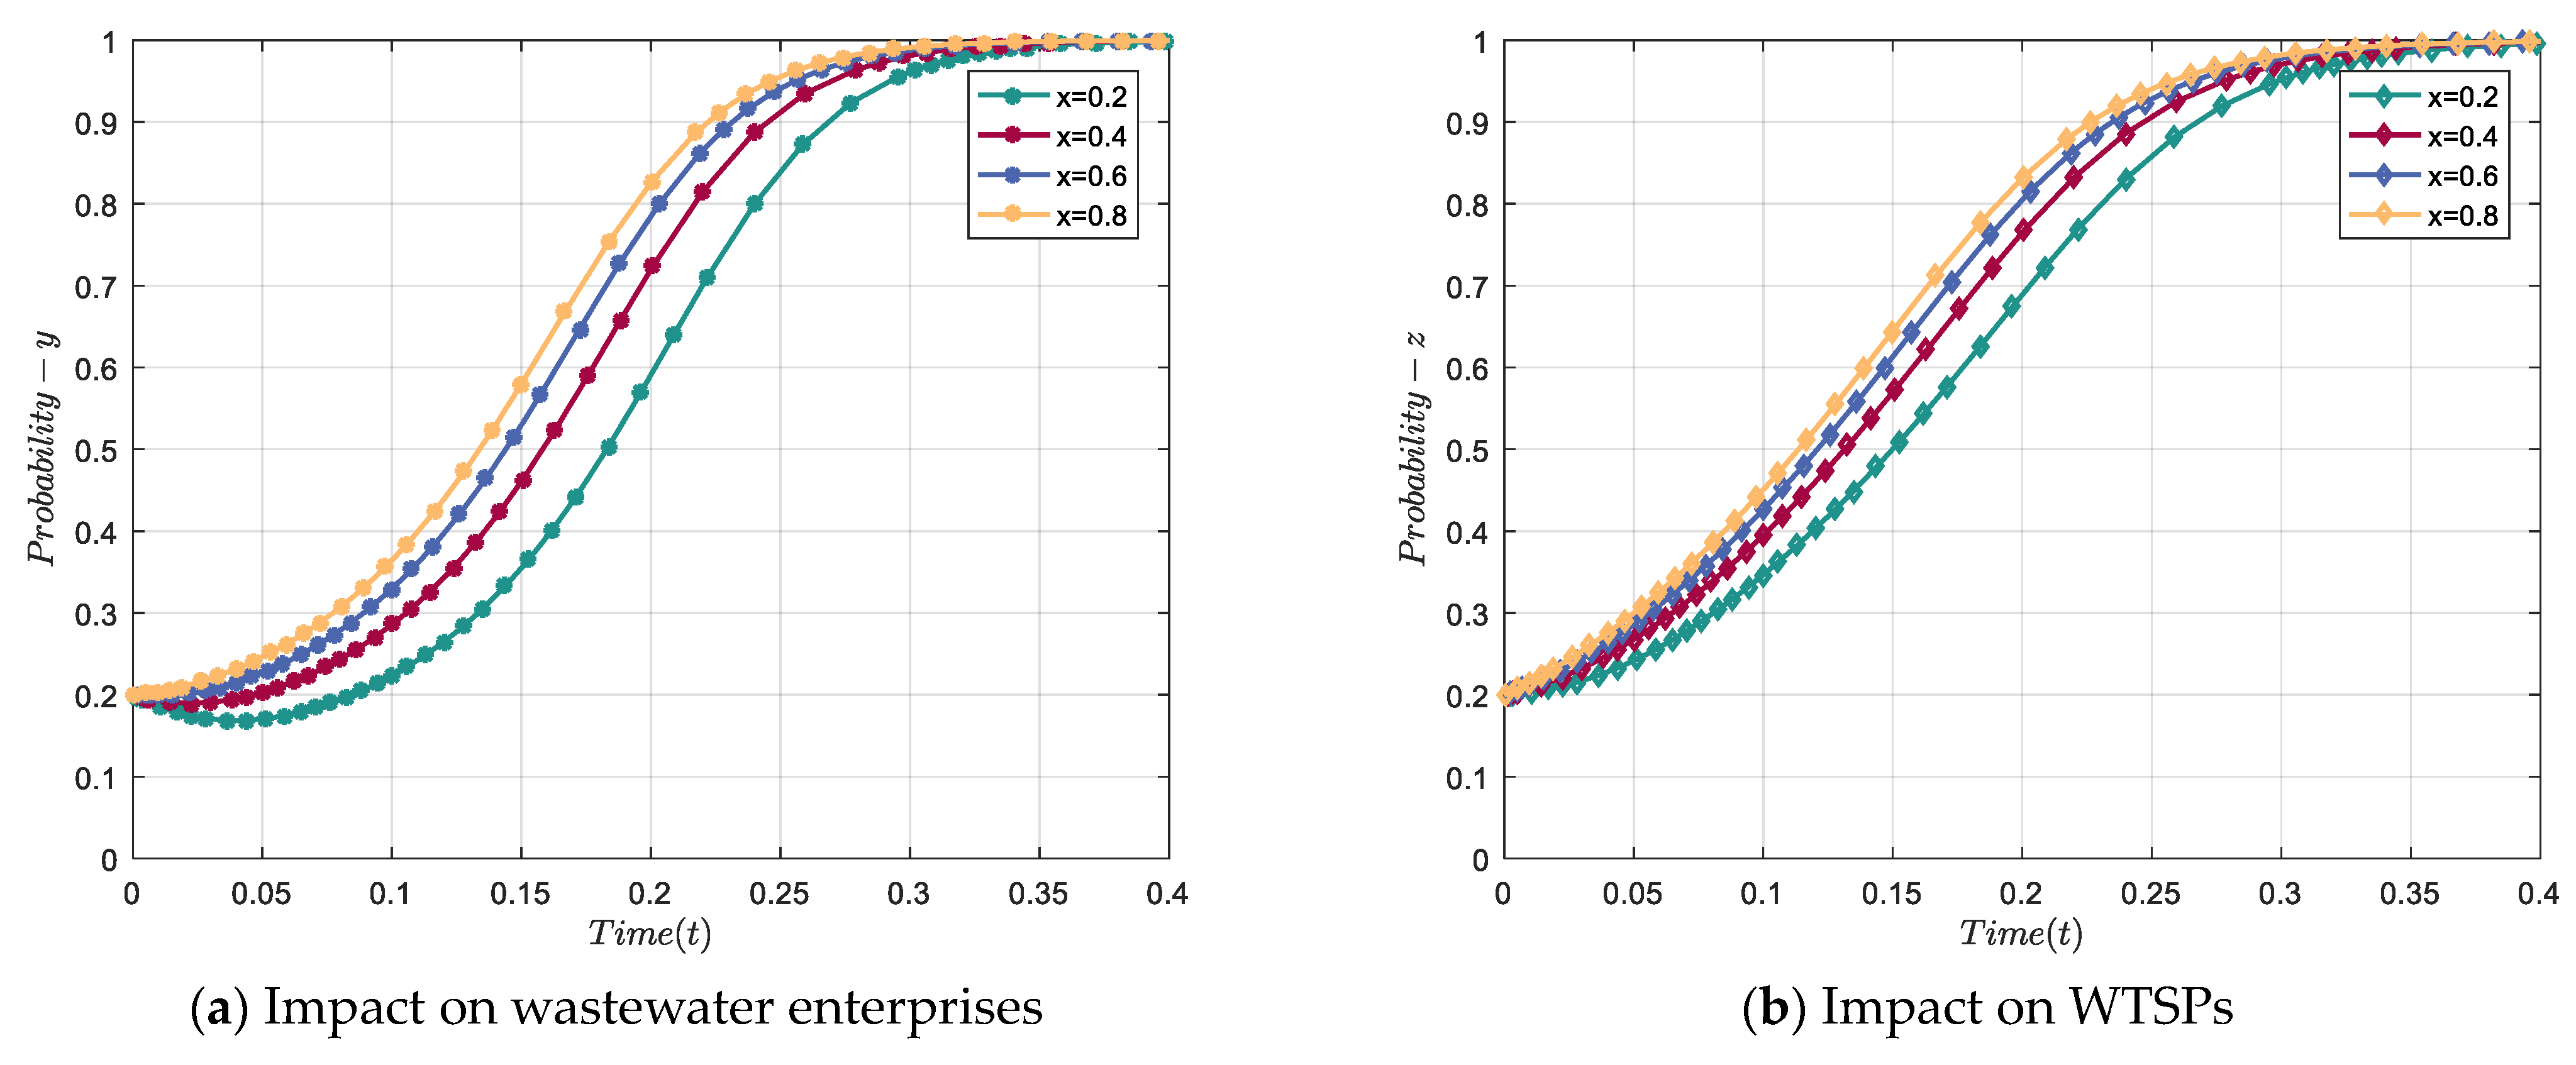
Maintaining the y = 0.2 and z = 0.2 constants, the government’s initial strategy of active participation (x) increases sequentially from 0.2 to 0.4 to 0.6 to 0.8. Figure 4a demonstrates that a higher probability attributed to the government’s initial strategy notably promotes the engagement of wastewater enterprises in green production; when x = 0.2, y first decreases and then increases, and the evolution rate is significantly smaller than in other cases. This could be attributed to the early phase of sewage treatment: the government’s preference for active participation is not strong, green production technology is not yet mature, and the high cost of introducing new technology makes wastewater enterprises tend not to engage in green production. However, with the continuous development of the market, wastewater enterprises will comply with the market orientation and choose to carry out green production. In Figure 4b, it becomes evident that the marginal impact of enhancing the initial government strategy probability on the strategic evolution of WTSPs is relatively minor. Over time, wastewater enterprises will eventually choose green production, and WTSPs will ultimately choose cooperation.
Maintaining the x = 0.2 and z = 0.2 constants, the initial strategy of wastewater enterprises for green production (y) increases sequentially from 0.2 to 0.4 to 0.6 to 0.8. Figure 5a shows that a rise in the initial strategy probability of wastewater enterprises moderately impedes the government’s evolution toward a positive regulatory stance. Notably, when y = 0.8, there is a certain degree of deceleration in the evolution curve of the government’s strategy compared with the other cases. The reason for this may be that when wastewater enterprises have a higher probability of green production, sewage treatment can be effective, and the government tends to reduce the subsidy expenditure and the cost of policy implementation, but as time evolves, the government will follow the social trend and choose active participation in sewage treatment. The findings in Figure 5b demonstrate that the initial probability associated with the wastewater enterprises’ strategies exerts a more pronounced impact on the evolution of WTSP strategies. Since the demand for green production from wastewater enterprises will provide market demand and bring additional revenue to WTSPs, at this time, WTSPs will actively adopt cooperation strategies.
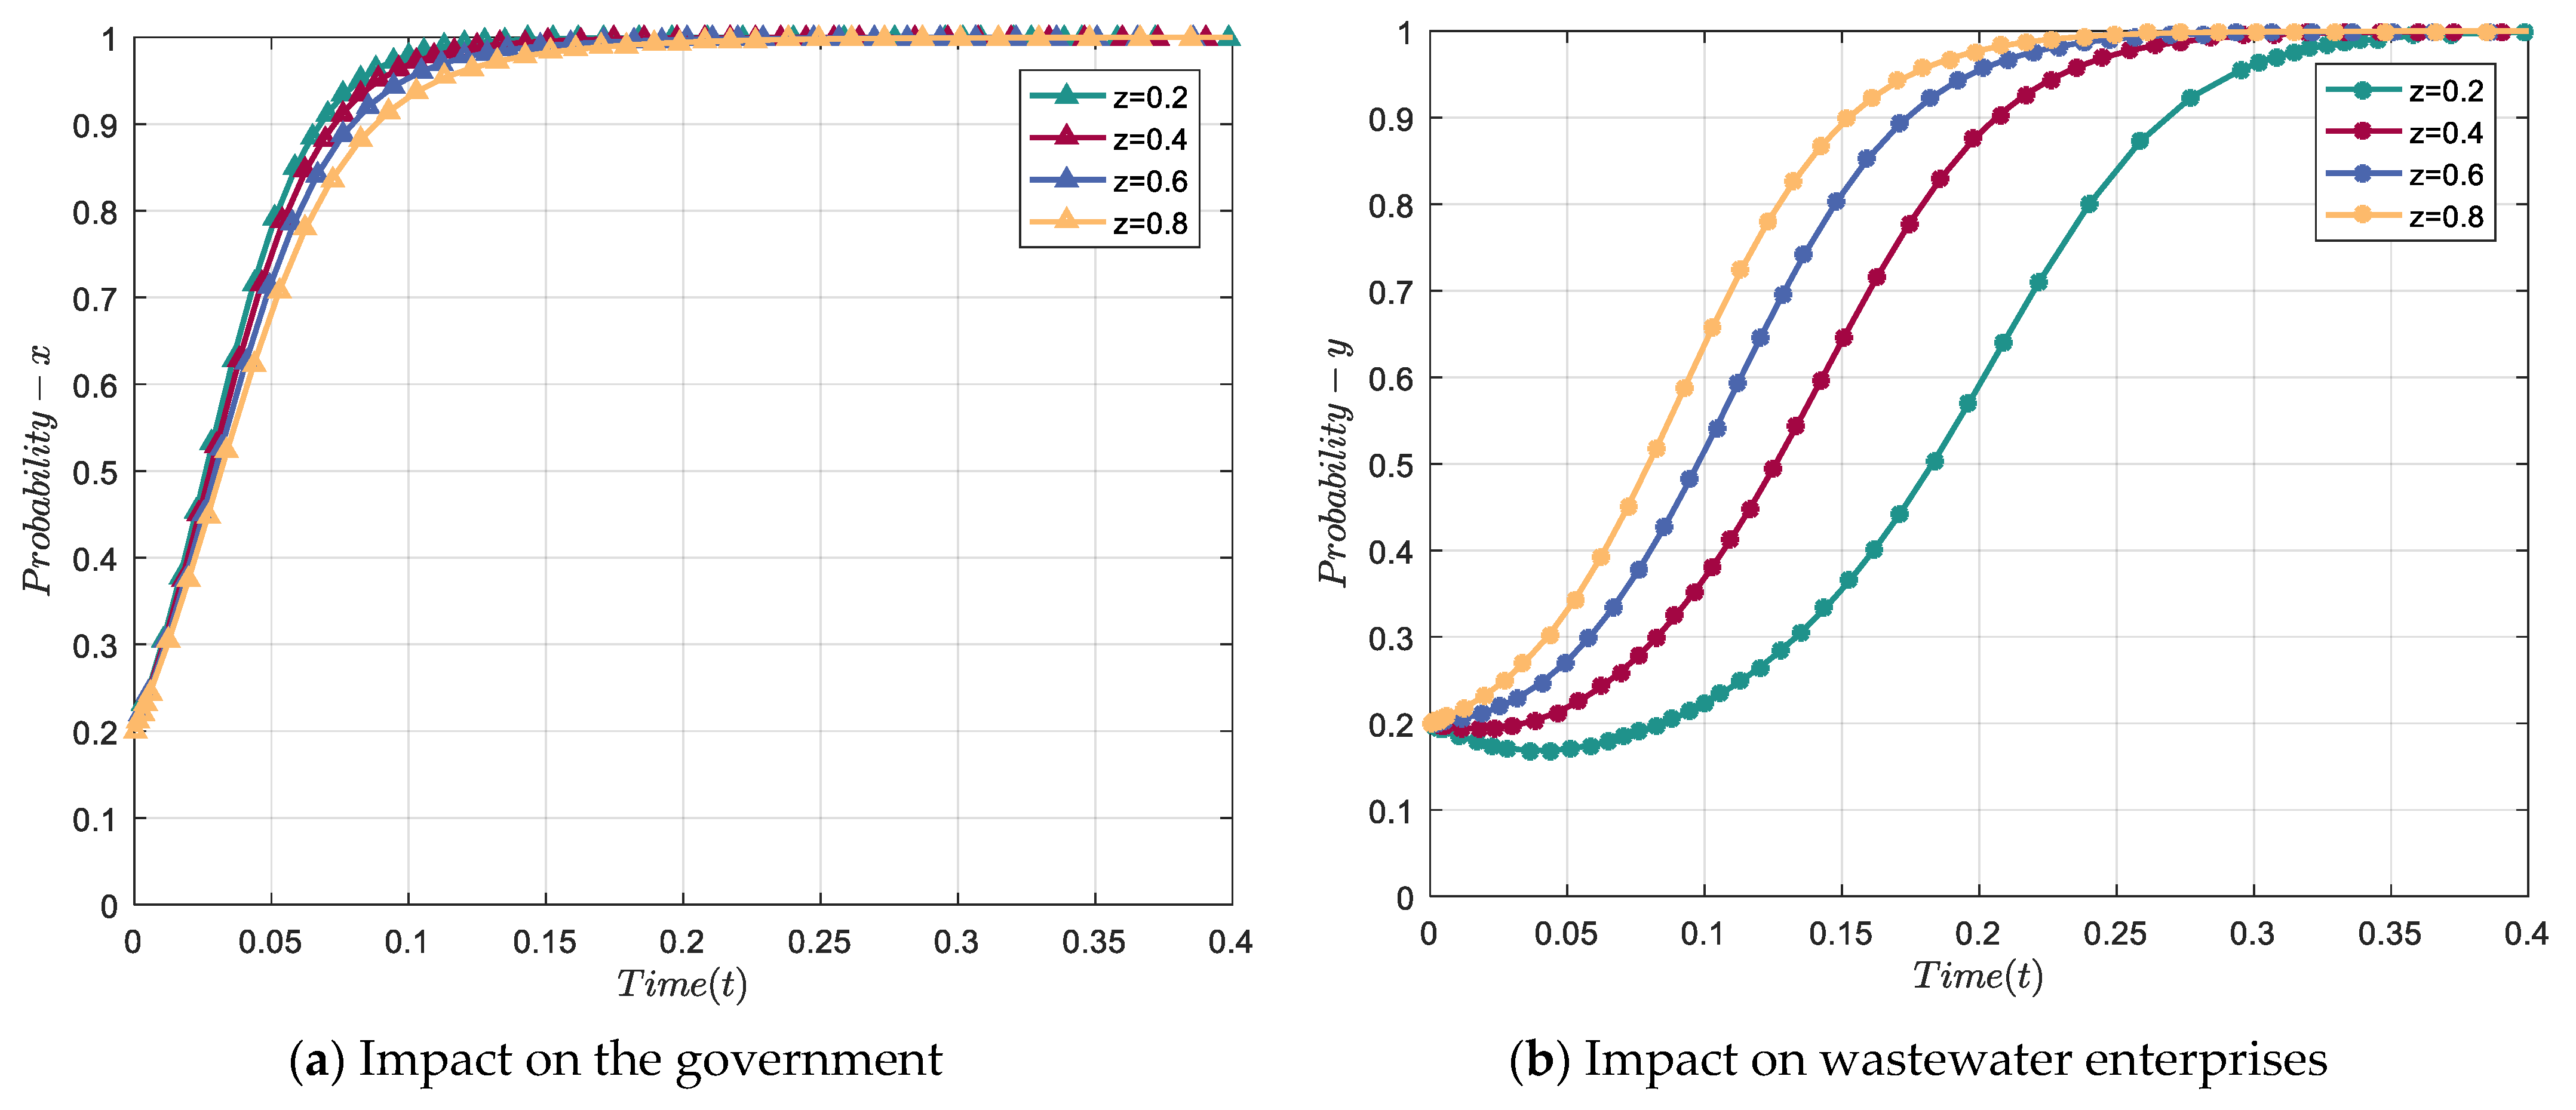
Maintaining the x = 0.2 and y = 0.2 constants, the initial strategy of WTSPs for cooperation (z) increases sequentially from 0.2 to 0.4 to 0.6 to 0.8. Figure 6a shows that the initial strategy of the WTSPs holds minimal sway over the government’s strategy evolution, further demonstrating the dominance of the government in sewage treatment. Figure 6b shows that the increase in the probability of the initial strategy of WTSPs can significantly increase the probability of wastewater enterprises choosing green production. This phenomenon can be attributed to the inadequate dissemination of innovations in wastewater treatment technologies and equipment within the market environment, coupled with a lack of substantial additional revenue. Consequently, wastewater enterprises are inclined to reject green production.

4.2. Sensitivity Analysis of Related Factors

4.2.1. The Impact of the Penalty Parameters, S1 and S2

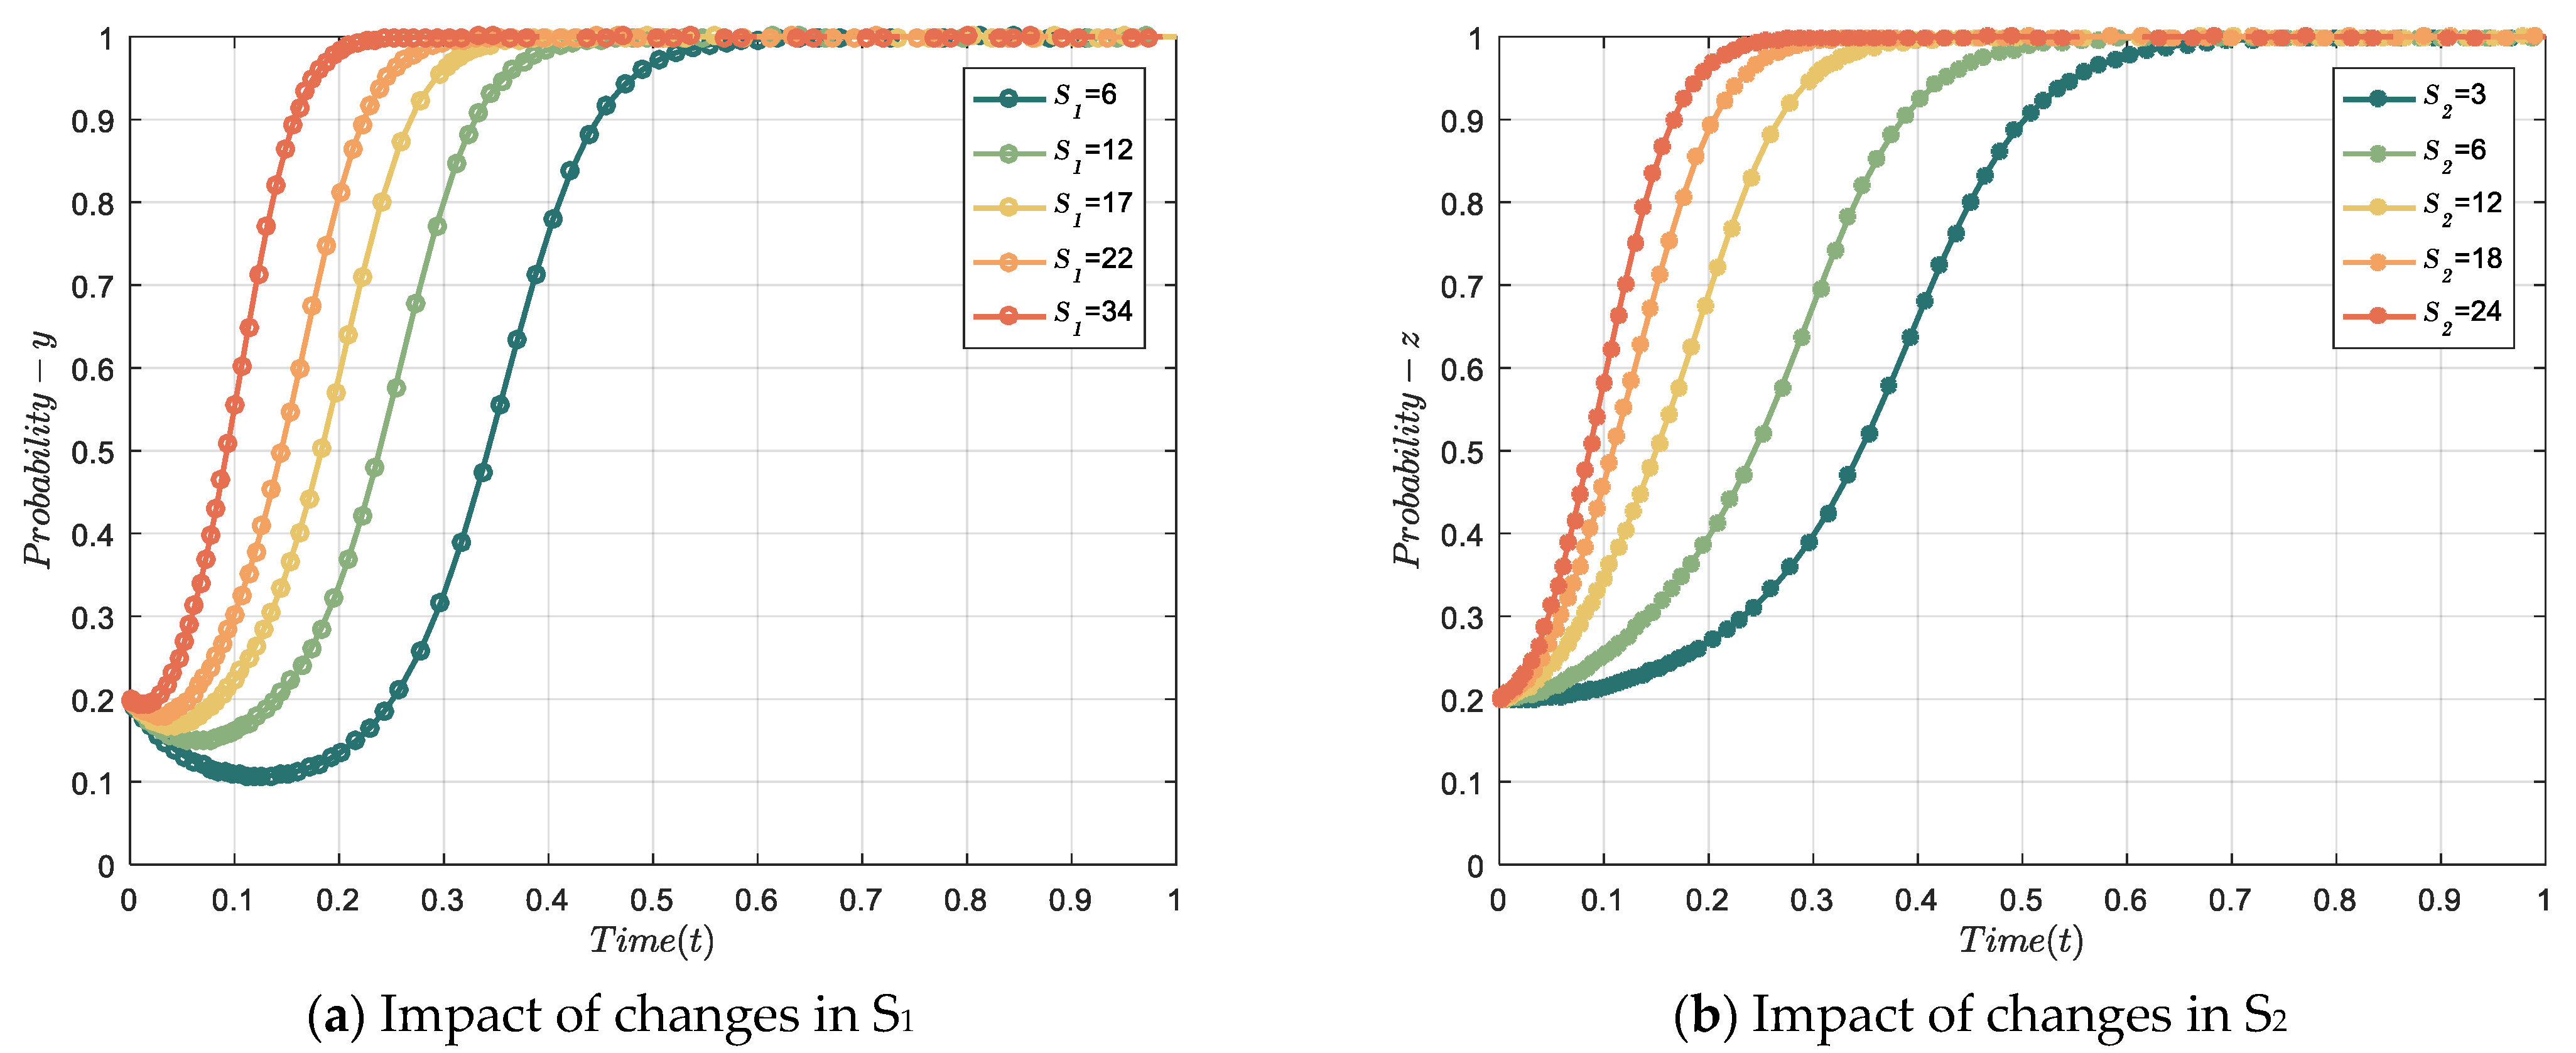
With other parameters held constant, Figure 7a provides the evolutionary results of wastewater enterprises’ strategic evolution when the values of S1 are 6, 12, 17, 22, and 34. The figure shows that there is a consistent increase in the evolution rate with the elevation of S1, resulting in shorter evolution periods. This can indicate that an increase in the government’s penalty can motivate wastewater enterprises to choose green production more actively. During the initial phase of evolution, there is a decline in the probability of wastewater enterprises choosing green production. This can be attributed to limited additional revenue derived from green production, given the low probability of the government’s active participation in the early stages of sewage treatment. However, as time passes, wastewater enterprises will choose a green production strategy to respond to policies and pursue additional revenue.
With other parameters held constant, Figure 7b provides the evolutionary results of the strategic evolution of WTSPs when the values of S2 are 3, 6, 12, 18, and 24. The figure shows that there is a consistent upward trend in the evolution rate with the progressive increment in S2, and the evolution rate is fastest when S2 = 24. This indicates that an increase in government penalties can motivate WTSPs to be more active in cooperating with wastewater enterprises. During the initial phase of evolution, because the probability of wastewater enterprises choosing green production is not high, the additional revenue that WTSPs can obtain by choosing cooperation is limited, and the evolution rate grows slowly; as the probability of wastewater enterprises choosing green production increases, WTSPs choose cooperation in pursuit of additional revenue.

4.2.2. The Impact of the Subsidy Parameters, I1 and I2

With other parameters held constant, Figure 8a provides the evolutionary results of the strategic evolution of wastewater enterprises when the values of I1 are 3, 6, 9, 13.5, and 18. The figure shows that the evolution rate increases continuously, leading to shorter evolution periods as I1 increases. This indicates that an increase in government subsidies can motivate wastewater enterprises to actively choose green production and achieve evolutionary stability. During the initial phase of evolution, the probability of wastewater enterprises choosing a green production strategy initially decreases to a certain extent over time and then experiences a rapid increase. This phenomenon can be attributed to the relatively subdued enthusiasm of the government for active participation in sewage treatment during the early stages. The additional revenue obtained by wastewater enterprises from this is not high, but with time, after the willingness of all parties to participate rises, wastewater enterprises will choose green production to pursue additional revenue.
With other parameters held constant, Figure 8b provides the evolutionary results of the strategic evolution of WTSPs when the values of I2 are 2, 4, 7, 10, and 14. The figure shows that, with an increase in I2, the evolution speed is slowest at I2 = 2 and fastest at I2 = 14. The difference in evolution speed is more obvious with a low-subsidy policy. This indicates that an increase in government subsidies can effectively enhance the probability of WTSPs choosing cooperation, and the marginal utility of subsidies is greater at the early stage of wastewater service technology development, which plays a crucial role in the effective promotion of sewage treatment.

4.2.3. The Impact of the Cost Parameters, C12 and C21

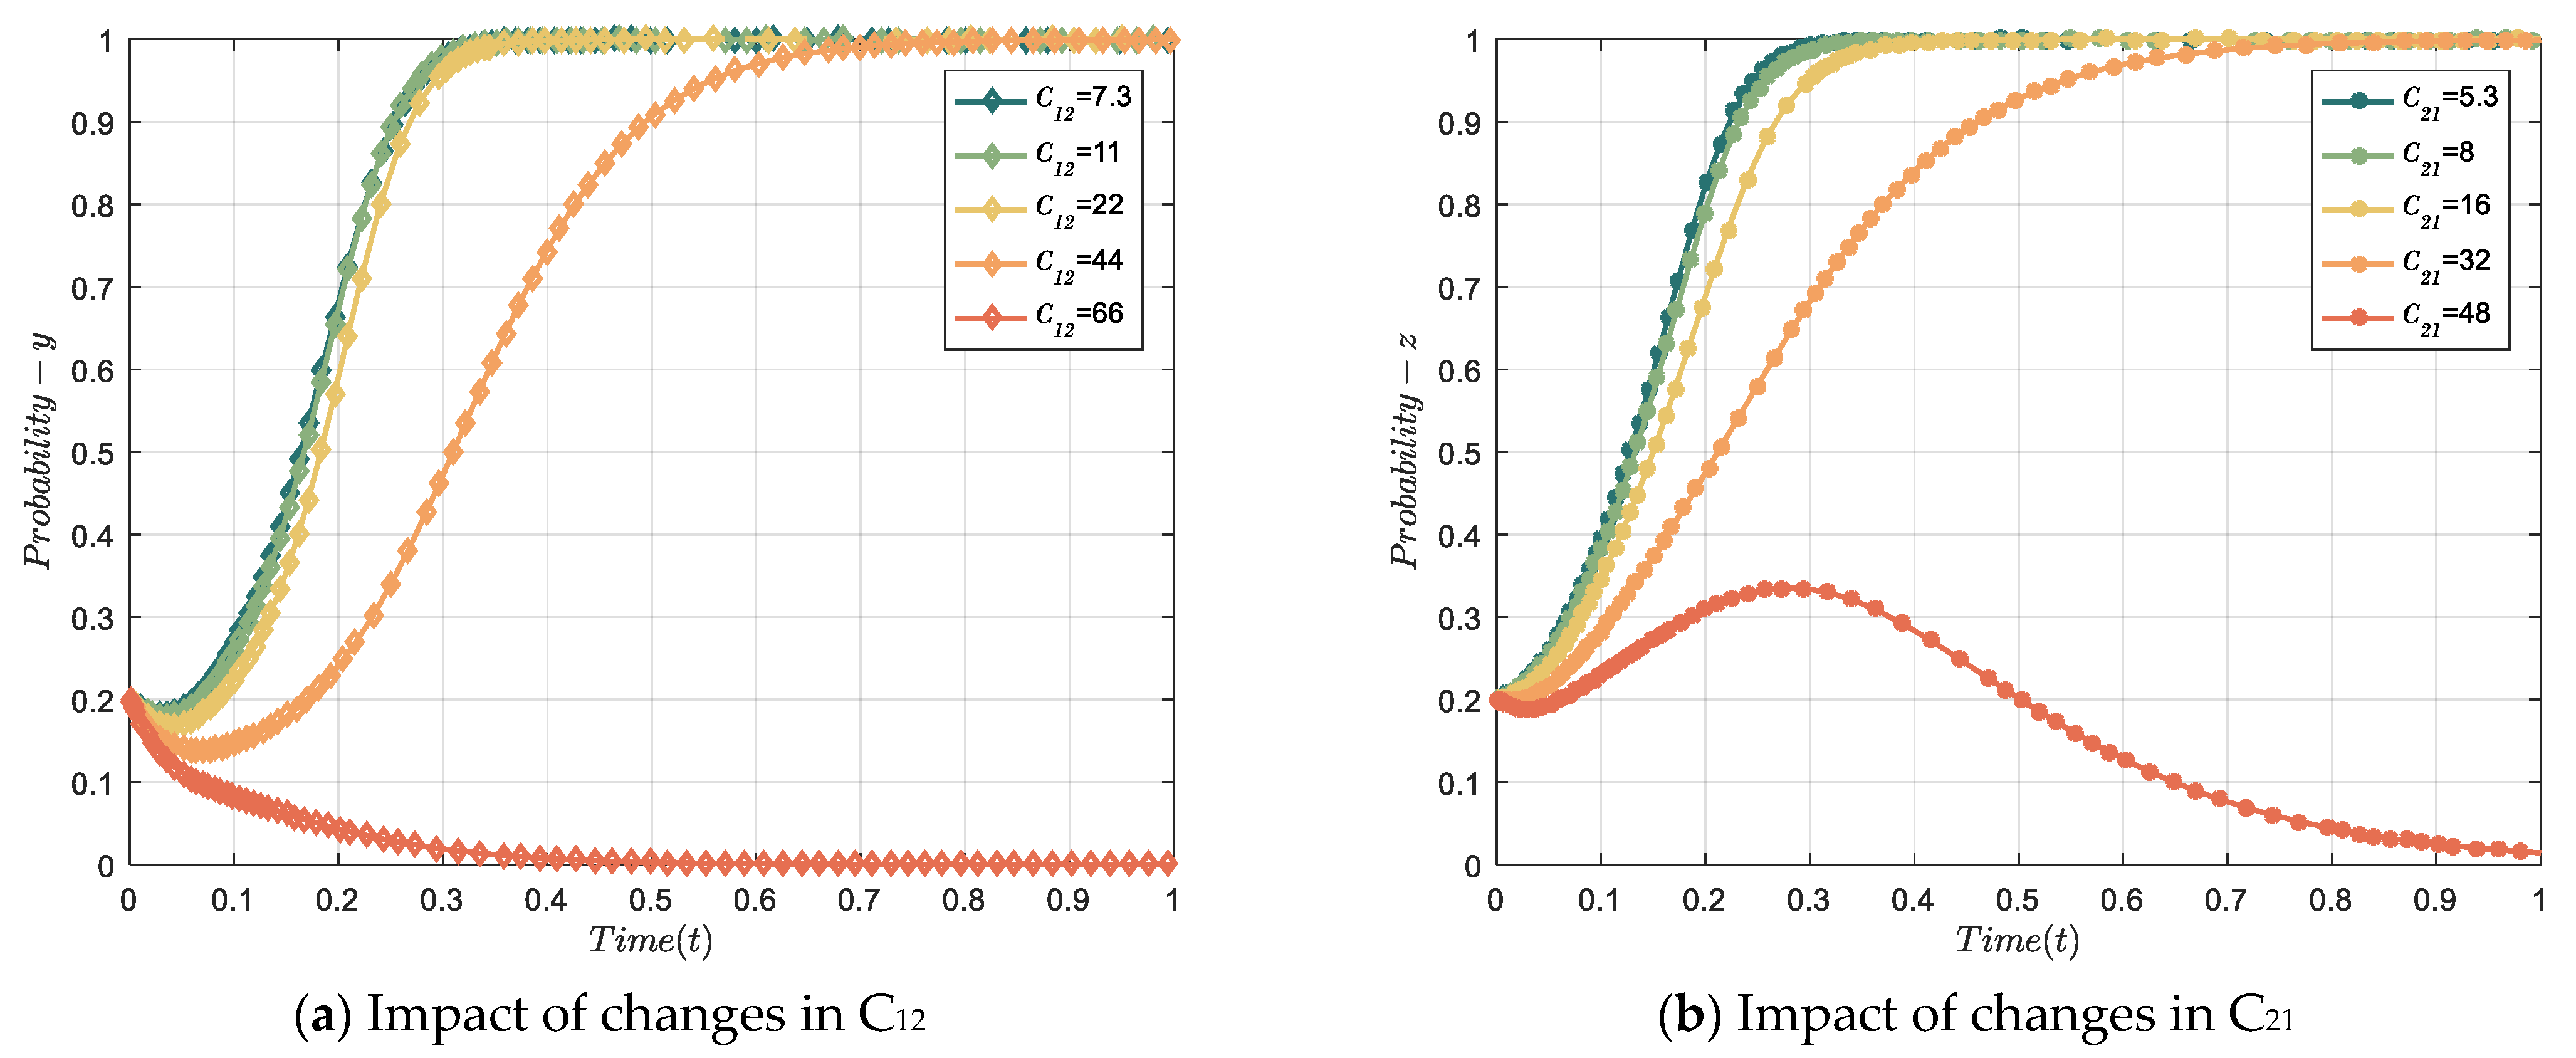
In this paper, it is assumed that V21 > C21 and V12 > C12, indicating that both C21 and C12 have inhibiting effects on promoting sewage treatment. Figure 9a demonstrates that as C12 increases, the motivation for wastewater enterprises to choose green production decreases. When C12 = 44, the probability of wastewater enterprises choosing green production significantly decreases; when C12 = 66, wastewater enterprises will choose ordinary production to avoid facing losses.
Figure 9b reveals that WTSPs are also sensitive to costs, as the evolution of their strategies slows down with an increase in C21. When C21 = 48, the evolutionary strategy probability of WTSPs will first decrease, increase, and then decrease, and finally, they will choose no cooperation. In the early stages of evolution, the probability of WTSPs choosing cooperation decreases because of the low willingness of the government and wastewater enterprises. However, as the government more actively participates, WTSPs will increase their probability of choosing a cooperation strategy in response to policies and the pursuit of additional revenue. Eventually, they choose no cooperation because the additional revenue from providing the service cannot compensate for the associated additional costs. In this case, the level of government subsidies becomes crucial in determining the strategic outcomes.

4.2.4. The Impact of the Policy Cost Parameter, Cs

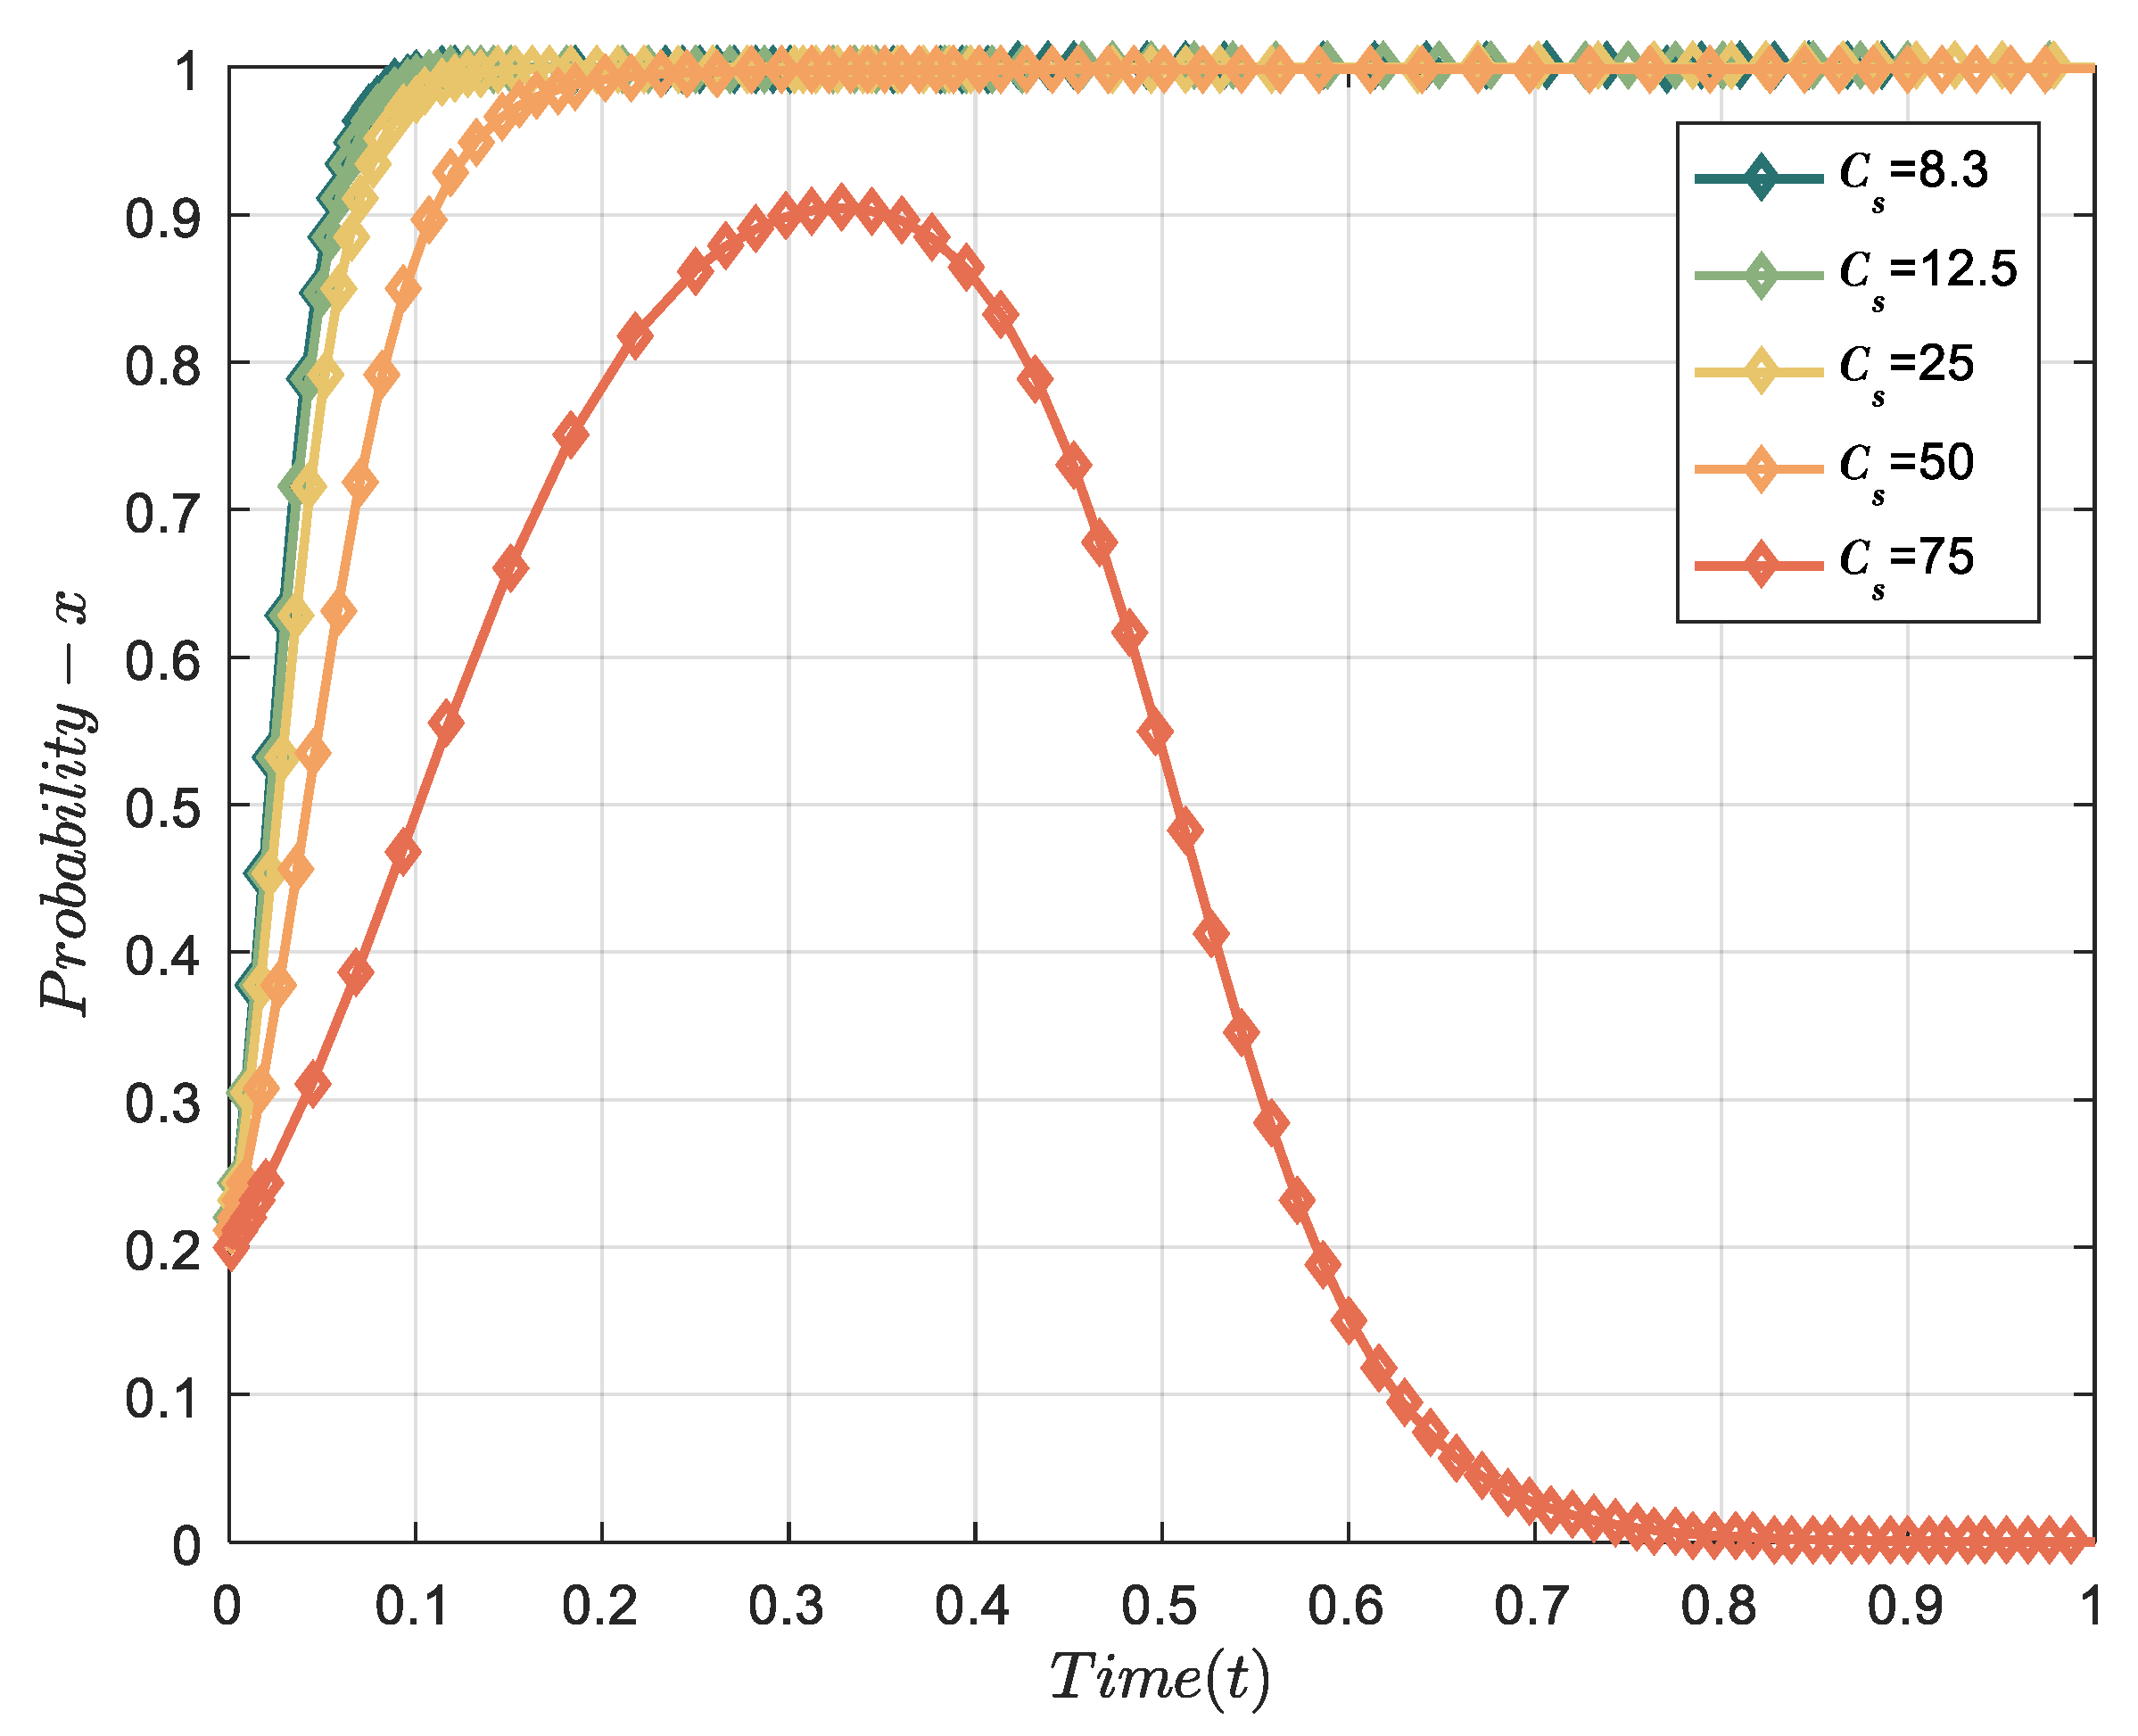
Figure 10 demonstrates the impact of the government policy implementation cost on the probability of the government’s evolutionary strategy. Holding other parameters constant, the values of Cs are 8.3, 12.5, 25, 50, and 75. The figure illustrates that as Cs increases, the evolutionary rate of the government’s choice to actively participate decreases. When Cs = 75, the government ultimately chooses negative participation. This indicates that an elevated policy implementation cost corresponds to a decreased probability of the government choosing active participation.

4.2.5. The Impact of the Loss-of-Reputation Parameter, Cf

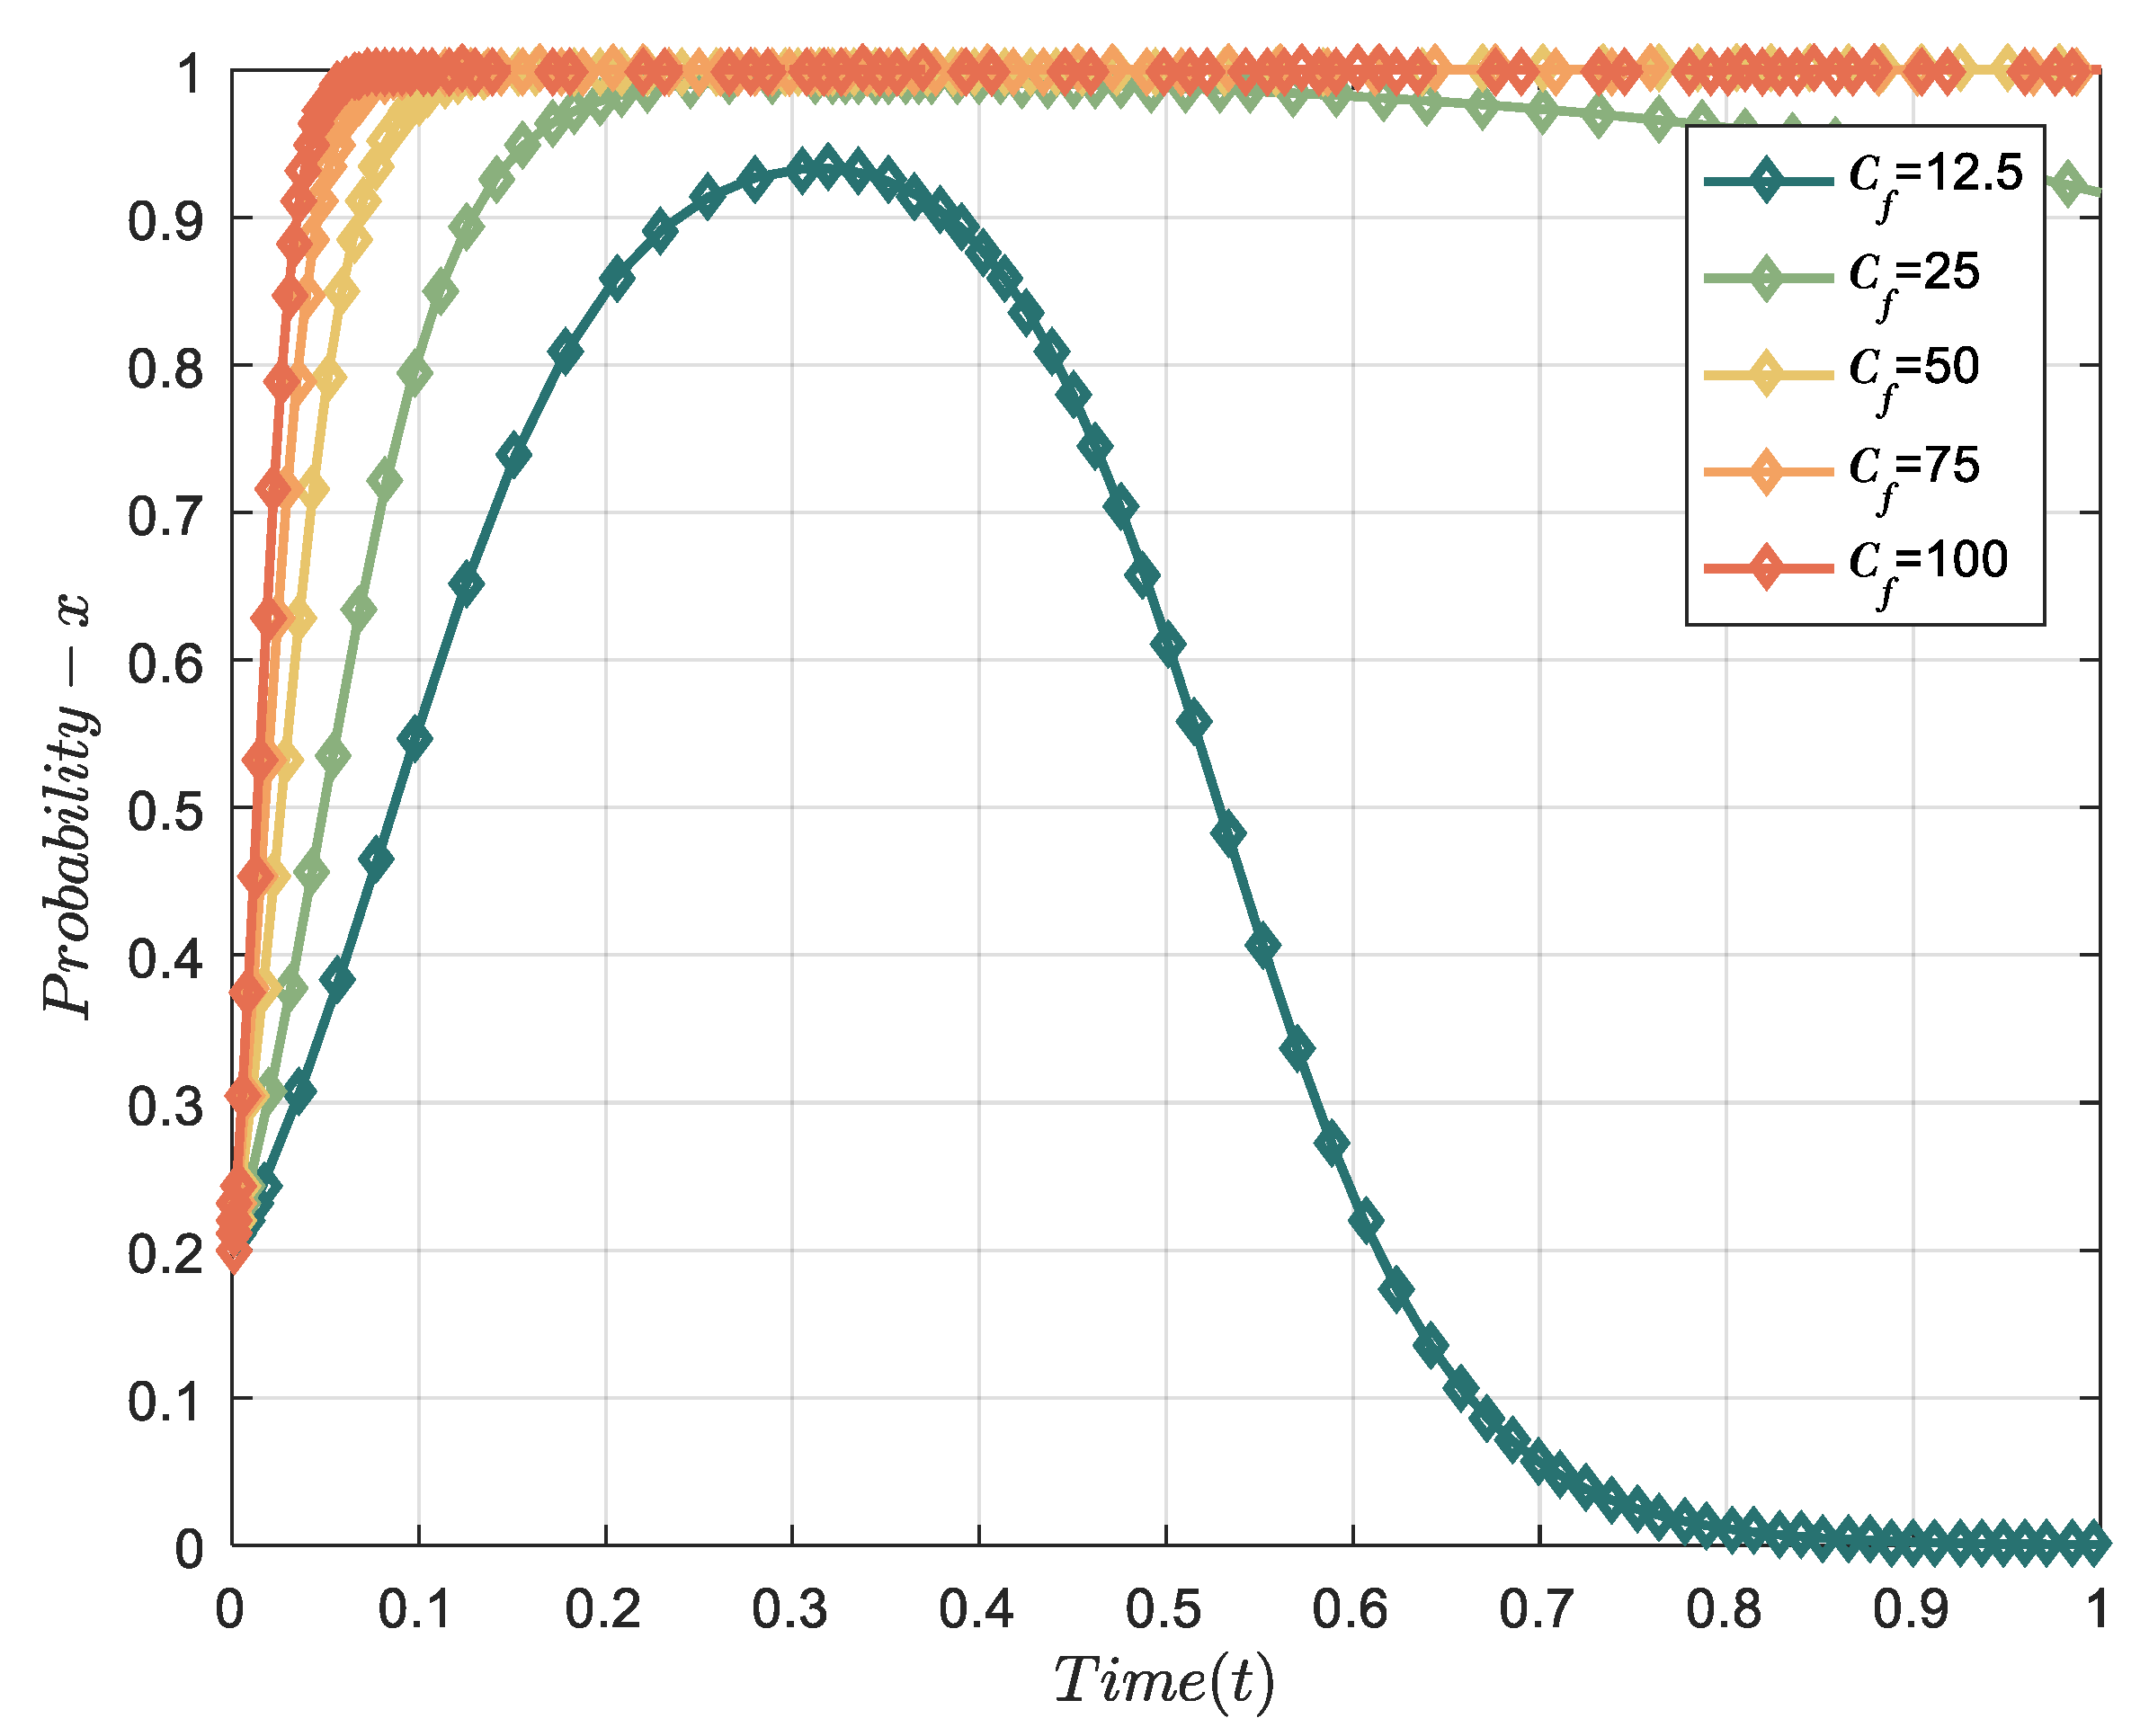
Considering that the government should maximize social welfare as part of its strategy considerations, when environmental pollution is generated and the government does not choose active participation, it will suffer opposition from the public and media and potential losses in reputation and trust. Figure 11 shows that a decrease in Cf leads to a deceleration in the evolutionary progression of the government’s active participation. Specifically, when Cf = 25, the government’s final evolutionary strategy begins to deviate from active participation. When Cf = 12.5, the government initially chooses active participation but later realizes the limited motivation and awareness of the public toward sewage treatment. Consequently, the government deems that negative participation will not result in significant losses, thus gradually inclining toward choosing negative participation. This indicates that maintaining higher social concern can motivate the government to choose active participation in sewage treatment and fulfill its responsibilities.

5. Discussion

To encourage active participation in sewage treatment by the government, wastewater enterprises, and WTSPs, subsequent countermeasures and recommendations are put forward, building upon the findings of the above research.

5.1. Strengthening Government Intervention and Optimizing Market Mechanisms

The interplay between the green actions of the government, wastewater enterprises, and wastewater service providers, as depicted in Figure 4, Figure 5 and Figure 6, showcases mutual enhancement in their evolutionary strategies. Their collaborative synergy is crucial for sustainable sewage treatment. In contrast to Chu [31], the initial probability of a strategy alteration by one game player exerts an influence on the strategies adopted by the other players in the game. Notably, a significant influence is observed in the interaction between wastewater enterprises and WTSPs, while the government’s decision-making behavior displays a lower level of sensitivity to the initial state of the other players. In situations where the market mechanism fails, the government can intervene and regulate the market through a policy-oriented approach [21]. Currently, in China, the regulation and promotion of wastewater governance predominantly rely on government actions, while other players are generally active. Zhang [25] pointed out that the development of government environmental strategies has a direct impact on the motivation of diverse stakeholders to engage in sewage treatment. Consequently, the government must advance the innovation and dissemination of sewage treatment technologies, intensify the publicity and oversight of sewage treatment practices, and incentivize active participation from all relevant parties. Secondly, the progress of emerging technologies, such as the Internet of Things and the digital economy, can help the government strengthen the market mechanism of sewage treatment. This includes the establishment of a common stakeholder platform to facilitate cooperation between various stakeholders. Furthermore, the government could refine the market-access mechanism for sewage treatment, fostering an environment that is both open and equitable. This approach will serve as a foundation for effective supervision and decision-making processes.

5.2. Creating an Appropriate System of Incentives and Penalties

Effectively implementing sewage treatment requires not only the presence of laws, industry standards, and norms to regulate the conduct of all stakeholders but also the rigorous enforcement of government policies [32]. Figure 7 and Figure 8 show that the government’s subsidy policy and penalty policy can effectively incentivize stakeholders to engage in sewage treatment. Specifically, the degree of cooperation between the involved parties increases in correlation with the intensity of the policy when other factors are not taken into account. Wang [8] argued that rational participants, when faced with significant decision costs and minimal revenues, are inclined to choose uncooperative behavior, even in the presence of penalties. Conversely, substantial subsidies may lead to higher government expenditures, while excessive penalties could potentially hinder the productivity of existing enterprises. Thus, the government must establish appropriate parameters for subsidies and penalties according to the model. By adjusting reward and punishment mechanisms to align with the current developmental status, the government can achieve better results through limited financial allocations.

5.3. Promoting Technological Innovation and Providing Additional Support

Figure 9 demonstrates that additional cost plays a pivotal role in affecting the decision-making processes of both wastewater enterprises and WTSPs. Notably, there is a considerable delay in achieving the evolutionary stabilization strategy when C21 increases from 16 to 32. Wang and Li [74] pointed out that, for a more effective promotion of industrial green transformation, there should be an increase in financial investment and a change in policy philosophy. Similarly, Doran [75] argued that government regulations and policies have a significant influence on promoting green innovation within enterprises. Figure 5 and Figure 6 show that the influence of WTSPs on wastewater enterprises is greater than the influence of wastewater enterprises on WTSPs, which helps the government to determine the sequence of incentives. To this end, the government must commence by delineating the primacy of technological innovation in sewage treatment; enhancing policies and specifications related to sewage treatment technology; and guiding the innovation, promotion, and application of such technologies. Following this, the government can proceed to leverage economic and administrative mechanisms, extending financial support, tax incentives, and other measures to WTSPs. These measures encourage technological innovation, thereby reducing the additional cost incurred by WTSPs and wastewater enterprises.

5.4. Promote Public Participation and Strengthen Government Internal Construction

Figure 10 and Figure 11 show that the policy cost and loss of reputation to the government caused by the public and media can significantly affect its strategy choice. Chu [31] pointed out that public participation serves an oversight function, enhances policy flexibility, promotes a more balanced allocation of political power, and contributes to the stability of democratic governance. Hence, the government must strengthen public awareness about sewage treatment and actively educate the public on this matter. Additionally, the government needs to be cautious about the potential reputational damage resulting from its passive involvement in sewage treatment. When the perceived reputational risk is low, the government may be inclined to adopt a passive stance toward sewage treatment. To prevent such situations and ensure effective regulation, the government must establish an internal restraint mechanism coupled with public oversight that addresses this concern and avoids lax oversight. Only in this way can problems be avoided as much as possible and the government be motivated to choose active participation in sewage treatment to maintain the sustainability of water resources within society’s development framework.

6. Conclusions

The exploration of sewage treatment incentive mechanisms and stakeholder decision making holds significance not only for environmental governance but also for promoting the sustainable development of urban water resources. This study innovatively included WTSPs as one of the game participants; introduced public participation and reward and punishment mechanisms as influencing factors to the evolutionary game model; and analyzed the evolutionary stabilization strategy. Secondly, the fundamental parameters were set in Matlab 2022a, and numerical simulations were conducted to analyze the initial strategy selection and the influence of different factors on stakeholder behaviors and strategies. Finally, drawing upon the simulation outcomes, recommendations for encouraging stakeholders to advance the effective development of sewage treatment were proposed.
This paper has revealed the following: (1) A positive interplay exists between the behaviors and strategies of the three sewage treatment parties. Within the market environment, the decisions of wastewater enterprises and WTSPs influence each other significantly, while the government’s decisions are less significant for the initial strategies of wastewater enterprises and WTSPs. (2) Subsidies and penalties can effectively encourage wastewater enterprises and WTSPs to choose green behavior. Drawing from the game model and parameter analysis, the government dynamically determines suitable subsidies and penalties, which can achieve a mutually beneficial scenario for all three parties involved in sewage treatment. (3) Technological innovation in sewage treatment is the key to the effective development of sewage treatment and a reduction in additional costs. This aspect demands the focus of all stakeholders, and the government should support various means in the innovation research process. (4) Public and media oversight exert a more pronounced influence on the government’s strategic decisions because the lesser of these may result in reputational damage or may lead to negative government involvement in sewage treatment. Consequently, the introduction of a public monitoring mechanism becomes imperative to regulating government behavior.
Drawing from a dynamic standpoint, this study comprehensively examined the outcomes of strategy evolution for the three parties in sewage treatment—the government, wastewater enterprises, and WTSPs—under diverse conditions. The findings of this research offer guidance for stakeholders in refining and adapting their strategies. Furthermore, they equip the government with insights into anticipating enterprise decision-making behavior, enhancing incentive mechanisms, and effectively promoting sewage treatment endeavors. Moreover, this study delved into the specific roles of various influencing factors, establishing a theoretical foundation for the incentive mechanism of technological innovation in sewage treatment. However, this study exhibited certain limitations and avenues for future research: (1) From the perspective of technological innovation in sewage treatment, this study only considered three stakeholders: the government, wastewater enterprises, and WTSPs. Future research may consider more stakeholders in more complex contexts for a more comprehensive and in-depth discussion. (2) Uncertainty is an important factor affecting stakeholder decisions, and to enhance the accuracy of role identification within the evolutionary system, future research may include them in the evolutionary game model for incentive mechanism design. (3) Future research could conduct empirical studies with actual cases to validate and corroborate the outcomes of the theoretical model and make the findings more accurate and reliable.

Author Contributions

Conceptualization, X.M.; Methodology, S.L.; Validation, X.M., S.L. and Q.L.; Writing—original draft, S.L.; Writing—review & editing, X.M., S.L. and Q.L.; Visualization, S.L.; Supervision, X.M.; Project administration, X.M.; Funding acquisition, X.M. All authors have read and agreed to the published version of the manuscript.

Funding

This research was funded by Chongqing Education Commission, grant number KJZD-M202300801.

Institutional Review Board Statement

Not applicable.

Informed Consent Statement

Informed consent was obtained from all subjects involved in the study.

Data Availability Statement

The data presented in this study are available on request from the corresponding author. The data are not publicly available due to privacy.

Conflicts of Interest

The authors declare no conflict of interest.

References

  1. He, C.; Liu, Z.; Wu, J.; Pan, X.; Fang, Z.; Li, J.; Bryan, B. Future global urban water scarcity and potential solutions. Nat. Commun. 2021, 12, 4667. [Google Scholar] [CrossRef] [PubMed]
  2. Liu, S.; Huang, S.; Xie, Y.; Wang, H.; Leng, G.; Huang, Q.; Wei, X.; Wang, L. Identification of the Non-stationarity of Floods: Changing Patterns, Causes, and Implications. Water Resour. Manag. 2018, 33, 939–953. [Google Scholar] [CrossRef]
  3. Chang, J.; Guo, A.; Wang, Y.; Ha, Y.; Zhang, R.; Xue, L.; Tu, Z. Reservoir Operations to Mitigate Drought Effects with a Hedging Policy Triggered by the Drought Prevention Limiting Water Level. Water Resour. Res. 2019, 55, 904–922. [Google Scholar] [CrossRef]
  4. Lu, S.; Zhang, X.; Liang, P. Influence of drip irrigation by reclaimed water on the dynamic change of the nitrogen element in soil and tomato yield and quality. J. Clean. Prod. 2016, 139, 561–566. [Google Scholar] [CrossRef]
  5. Tong, Y.; Zhang, Q.; Cai, J.; Gao, C.; Wang, L.; Li, P. Water consumption and wastewater discharge in China’s steel industry. Ironmak. Steelmak. 2018, 45, 868–877. [Google Scholar] [CrossRef]
  6. Liu, J.; Yang, H.; Gosling, S.N.; Kummu, M.; Florke, M.; Pfister, S.; Hanasaki, N.; Wada, Y.; Zhang, X.; Zheng, C.; et al. Water scarcity assessments in the past, present and future. Earth Future 2017, 5, 545–559. [Google Scholar] [CrossRef]
  7. Zhang, C.; Quan, B.; Tang, J.; Cheng, K.; Tang, Y.; Shen, W.; Su, P.; Zhang, C. China’s wastewater treatment: Status quo and sustainability perspectives. J. Water Process. Eng. 2023, 53, 103708. [Google Scholar] [CrossRef]
  8. Wang, R.; Wijen, F.; Heugens, P.P.M.A.R. Government’s green grip: Multifaceted state influence on corporate environmental actions in China. Strateg. Manag. J. 2017, 39, 403–428. [Google Scholar] [CrossRef]
  9. Wu, B.; Liu, P.; Xu, X. An evolutionary analysis of low-carbon strategies based on the government–enterprise game in the complex network context. J. Clean. Prod. 2017, 141, 168–179. [Google Scholar] [CrossRef]
  10. An, X.; Li, H.; Wang, L.; Wang, Z.; Ding, J.; Cao, Y. Compensation mechanism for urban water environment treatment PPP project in China. J. Clean. Prod. 2018, 201, 246–253. [Google Scholar] [CrossRef]
  11. Sun, X.; Wang, W.; Pang, J.; Liu, X.; Zhang, M. Study on the evolutionary game of central government and local governments under central environmental supervision system. J. Clean. Prod. 2021, 296, 126574. [Google Scholar] [CrossRef]
  12. Husted, B.W.; Salazar, J.d.J. Taking Friedman Seriously: Maximizing Profits and Social Performance. J. Manag. Stud. 2006, 43, 75–91. [Google Scholar] [CrossRef]
  13. Liu, M.; Shadbegian, R.; Zhang, B. Does environmental regulation affect labor demand in China? Evidence from the textile printing and dyeing industry. J. Environ. Econ. Manag. 2017, 86, 277–294. [Google Scholar] [CrossRef]
  14. Song, H.; Zhao, C.; Zeng, J. Can environmental management improve financial performance: An empirical study of A-shares listed companies in China. J. Clean. Prod. 2017, 141, 1051–1056. [Google Scholar] [CrossRef]
  15. Sheng, J.; Zhou, W.; Zhu, B. The coordination of stakeholder interests in environmental regulation: Lessons from China’s environmental regulation policies from the perspective of the evolutionary game theory. J. Clean. Prod. 2020, 249, 119385. [Google Scholar] [CrossRef]
  16. Maizel, A.C.; Remucal, C.K. The effect of advanced secondary municipal wastewater treatment on the molecular composition of dissolved organic matter. Water Res. 2017, 122, 42–52. [Google Scholar] [CrossRef]
  17. Li, X.; Chen, W.; Ma, L.; Wang, H.; Fan, J. Industrial wastewater advanced treatment via catalytic ozonation with an Fe-based catalyst. Chemosphere 2018, 195, 336–343. [Google Scholar] [CrossRef]
  18. Liu, J.; Yi, Y.; Wang, X. Exploring factors influencing construction waste reduction: A structural equation modeling approach. J. Clean. Prod. 2020, 276, 123185. [Google Scholar] [CrossRef]
  19. Zhang, J.; Wu, Q.; Zhou, Z. A two-stage DEA model for resource allocation in industrial pollution treatment and its application in China. J. Clean. Prod. 2019, 228, 29–39. [Google Scholar] [CrossRef]
  20. Miao, C.L.; Meng, X.N.; Duan, M.M.; Wu, X.Y. Energy consumption, environmental pollution, and technological innovation efficiency: Taking industrial enterprises in China as empirical analysis object. Environ. Sci. Pollut. Res. 2020, 27, 34147–34157. [Google Scholar] [CrossRef]
  21. Zhou, K.; Wang, Q.; Tang, J. Evolutionary game analysis of environmental pollution control under the government regulation. Sci. Rep. 2022, 12, 474. [Google Scholar] [CrossRef] [PubMed]
  22. de Frutos, J.; Martín-Herrán, G. Spatial effects and strategic behavior in a multiregional transboundary pollution dynamic game. J. Environ. Econ. Manag. 2019, 97, 182–207. [Google Scholar] [CrossRef]
  23. Li, L.; Chen, W. The impact of subsidies in a transboundary pollution game with myopic players. Omega 2021, 103, 102383. [Google Scholar] [CrossRef]
  24. André, B.d.S.R.; Gabriel, M.S. Environmental policy regulation and corporate compliance in evolutionary game models with well-mixed and structured populations. Eur. J. Oper. Res. 2019, 279, 486–501. [Google Scholar]
  25. Zhang, L.; Song, Y.; Zhang, M.; Wu, W. Evolutionary game analysis of strategic interaction of environmental regulation among local governments. Environ. Dev. 2023, 45, 100793. [Google Scholar] [CrossRef]
  26. Li, B.; Wu, S. Effects of local and civil environmental regulation on green total factor productivity in China: A spatial Durbin econometric analysis. J. Clean. Prod. 2016, 153, 342–353. [Google Scholar] [CrossRef]
  27. Cai, L.; Cai, W.; Zhu, C.; Chen, S.; Mengting, Z.; Rocha, Á. An optimal penalty in an environmental pollution game with the suspension of production. J. Intell. Fuzzy Syst. 2016, 31, 2321–2333. [Google Scholar] [CrossRef]
  28. Chin, H.H.; Varbanov, P.S.; Klemeš, J.J.; Bandyopadhyay, S. Subsidised water symbiosis of eco-industrial parks: A multi-stage game theory approach. Comput. Chem. Eng. 2021, 155, 107539. [Google Scholar] [CrossRef]
  29. Shang, S.; Chen, Z.; Shen, Z.; Salman Shabbir, M.; Bokhari, A.; Han, N.; Klemeš, J.J. The effect of cleaner and sustainable sewage fee-to-tax on business innovation. J. Clean. Prod. 2022, 361, 132287. [Google Scholar] [CrossRef]
  30. Wang, Y.; Zhang, R.; Worden, S.; Cao, H.; Li, C. Public participation in environmental governance initiatives of chemical industrial parks. J. Clean. Prod. 2021, 305, 127092. [Google Scholar] [CrossRef]
  31. Chu, Z.; Bian, C.; Yang, J. How can public participation improve environmental governance in China? A policy simulation approach with multi-player evolutionary game. Environ. Impact Assess. Rev. 2022, 95, 106782. [Google Scholar] [CrossRef]
  32. Kou, P.; Han, Y.; Li, Y. An evolutionary analysis of corruption in the process of collecting environmental tax in China. Environ. Sci. Pollut. Res. Int. 2021, 28, 54852–54862. [Google Scholar] [CrossRef] [PubMed]
  33. Cheng, B.; Wei, Y.; Zhang, W.; Zhou, X.; Chen, H.; Huang, L.; Huang, J.; Kang, X.; Uddin, M.I. Evolutionary Game Simulation on Government Incentive Strategies of Prefabricated Construction: A System Dynamics Approach. Complexity 2020, 2020, 8861146. [Google Scholar] [CrossRef]
  34. Zhang, X.; Guo, X.; Zhang, X. Collaborative strategy within China’s emission trading scheme: Evidence from a tripartite evolutionary game model. J. Clean. Prod. 2023, 382, 135255. [Google Scholar] [CrossRef]
  35. Hao, X.; Liu, G.; Zhang, X.; Dong, L. The coevolution mechanism of stakeholder strategies in the recycled resources industry innovation ecosystem: The view of evolutionary game theory. Technol. Forecast. Soc. Chang. 2022, 179, 121627. [Google Scholar] [CrossRef]
  36. Wang, Q.; Meng, H.; Gao, B. Spontaneous punishment promotes cooperation in public good game. Chaos Solitons Fractals 2019, 120, 183–187. [Google Scholar] [CrossRef]
  37. Sasaki, T. The Evolution of Cooperation Through Institutional Incentives and Optional Participation. Dyn. Games Appl. 2014, 4, 345–362. [Google Scholar] [CrossRef]
  38. Wang, M.; Li, Y.; Cheng, Z.; Zhong, C.; Ma, W. Evolution and equilibrium of a green technological innovation system: Simulation of a tripartite game model. J. Clean. Prod. 2021, 278, 123944. [Google Scholar] [CrossRef]
  39. Qu, J.; Wang, H.; Wang, K.; Yu, G.; Ke, B.; Yu, H.-Q.; Ren, H.; Zheng, X.; Li, J.; Li, W.-W.; et al. Municipal wastewater treatment in China: Development history and future perspectives. Front. Environ. Sci. Eng. 2019, 13, 88. [Google Scholar] [CrossRef]
  40. Gopal, R.; Chinnapan, M.M.; Bojarajan, A.K.; Rotte, N.K.; Ponraj, J.S.; Ganesan, R.; Atanas, I.; Nadarajah, M.; Manavalan, R.K.; Gaspar, J. Facile synthesis and defect optimization of 2D-layered MoS2 on TiO2 heterostructure for industrial effluent, wastewater treatments. Sci. Rep. 2020, 10, 21625. [Google Scholar] [CrossRef]
  41. Jia, X.; Yuan, S.; Li, B.; Miu, H.; Yuan, J.; Wang, C.; Zhu, Z.; Zhang, Y. Carbon Nanomaterials: Application and Prospects of Urban and Industrial Wastewater Pollution Treatment Based on Abrasion and Corrosion Resistance. Front. Chem. 2020, 8, 600594. [Google Scholar] [CrossRef] [PubMed]
  42. Guselnikova, O.; Barras, A.; Addad, A.; Sviridova, E.; Szunerits, S.; Postnikov, P.; Boukherroub, R. Magnetic polyurethane sponge for efficient oil adsorption and separation of oil from oil-in-water emulsions. Sep. Purif. Technol. 2020, 240, 116627. [Google Scholar] [CrossRef]
  43. Wang, S.; Xiao, K.; Huang, X. Characterizing the roles of organic and inorganic foulants in RO membrane fouling development: The case of coal chemical wastewater treatment. Sep. Purif. Technol. 2019, 210, 1008–1016. [Google Scholar] [CrossRef]
  44. Kim, S.; Chu, K.H.; Al-Hamadani, Y.A.J.; Park, C.M.; Jang, M.; Kim, D.-H.; Yu, M.; Heo, J.; Yoon, Y. Removal of contaminants of emerging concern by membranes in water and wastewater: A review. Chem. Eng. J. 2018, 335, 896–914. [Google Scholar] [CrossRef]
  45. Qi, W.; Zhang, H.; Liu, R.; Liu, H.; Qu, J. Effects of different secondary biological treatment processes followed by flocculation and sand-filtration on subsequent DBPs control from sewage treatment plants. Sep. Purif. Technol. 2019, 211, 81–89. [Google Scholar] [CrossRef]
  46. Pinkard, B.R.; Shetty, S.; Stritzinger, D.; Bellona, C.; Novosselov, I.V. Destruction of perfluorooctanesulfonate (PFOS) in a batch supercritical water oxidation reactor. Chemosphere 2021, 279, 130834. [Google Scholar] [CrossRef] [PubMed]
  47. Mao, G.; Hu, H.; Liu, X.; Crittenden, J.; Huang, N. A bibliometric analysis of industrial wastewater treatments from 1998 to 2019. Environ. Pollut. 2021, 275, 115785. [Google Scholar] [CrossRef]
  48. Wang, M.; Zhang, D.Q.; Dong, J.W.; Tan, S.K. Constructed wetlands for wastewater treatment in cold climate—A review. J. Environ. Sci. 2017, 57, 293–311. [Google Scholar] [CrossRef]
  49. Wang, W.; Cai, Y.; Hu, H.; Chen, J.; Wang, J.; Xue, G.; Wu, Q. Advanced treatment of bio-treated dyeing and finishing wastewater using ozone-biological activated carbon: A study on the synergistic effects. Chem. Eng. J. 2019, 359, 168–175. [Google Scholar] [CrossRef]
  50. Zhou, L.; Zhuang, W.-Q.; De Costa, Y.G. In situ and short-time anaerobic digestion coupled with alkalization and mechanical stirring to enhance sludge disintegration for phosphate recovery. Chem. Eng. J. 2018, 351, 878–885. [Google Scholar] [CrossRef]
  51. Zhou, X.; Zhang, Q.; Sun, H.; Zhao, Q. Efficient nitrogen removal from synthetic domestic wastewater in a novel step-feed three-stage integrated anoxic/oxic biological aerated filter process through optimizing influent flow distribution ratio. J. Environ. Manag. 2019, 231, 1277–1282. [Google Scholar] [CrossRef]
  52. Gutierrez, A.M.; Dziubla, T.D.; Hilt, J.Z. Recent advances on iron oxide magnetic nanoparticles as sorbents of organic pollutants in water and wastewater treatment. Rev. Environ. Health 2017, 32, 111–117. [Google Scholar] [CrossRef]
  53. Miklos, D.B.; Remy, C.; Jekel, M.; Linden, K.G.; Drewes, J.E.; Hubner, U. Evaluation of advanced oxidation processes for water and wastewater treatment—A critical review. Water Res. 2018, 139, 118–131. [Google Scholar] [CrossRef] [PubMed]
  54. Dereli, R.K.; Wang, X.; van der Zee, F.P.; van Lier, J.B. Biological performance and sludge filterability of anaerobic membrane bioreactors under nitrogen limited and supplied conditions. Water Res. 2018, 137, 164–172. [Google Scholar] [CrossRef] [PubMed]
  55. Crini, G.; Lichtfouse, E. Advantages and disadvantages of techniques used for wastewater treatment. Environ. Chem. Lett. 2018, 17, 145–155. [Google Scholar] [CrossRef]
  56. He, L.; Chen, L. The incentive effects of different government subsidy policies on green buildings. Renew. Sustain. Energy Rev. 2021, 135, 110123. [Google Scholar] [CrossRef]
  57. Newton, J. Evolutionary Game Theory: A Renaissance. Games 2018, 9, 31. [Google Scholar] [CrossRef]
  58. Long, H.; Liu, H.; Li, X.; Chen, L. An Evolutionary Game Theory Study for Construction and Demolition Waste Recycling Considering Green Development Performance under the Chinese Government’s Reward-Penalty Mechanism. Int. J. Environ. Res. Public Health 2020, 17, 6303. [Google Scholar] [CrossRef]
  59. Yuan, M.; Li, Z.; Li, X.; Li, L.; Zhang, S.; Luo, X. How to promote the sustainable development of prefabricated residential buildings in China: A tripartite evolutionary game analysis. J. Clean. Prod. 2022, 349, 131423. [Google Scholar] [CrossRef]
  60. Liu, Y.; Zuo, J.; Pan, M.; Ge, Q.; Chang, R.; Feng, X.; Fu, Y.; Dong, N. The incentive mechanism and decision-making behavior in the green building supply market: A tripartite evolutionary game analysis. Build. Environ. 2022, 214, 108903. [Google Scholar] [CrossRef]
  61. Wang, G.; Chao, Y.; Chen, Z. Promoting developments of hydrogen powered vehicle and solar PV hydrogen production in China: A study based on evolutionary game theory method. Energy 2021, 237, 121649. [Google Scholar] [CrossRef]
  62. Zhu, G.; Pan, G.; Zhang, W. Evolutionary Game Theoretic Analysis of Low Carbon Investment in Supply Chains under Governmental Subsidies. Int. J. Environ. Res. Public Health 2018, 15, 2465. [Google Scholar] [CrossRef] [PubMed]
  63. Chen, L.; Gao, X.; Hua, C.; Gong, S.; Yue, A. Evolutionary process of promoting green building technologies adoption in China: A perspective of government. J. Clean. Prod. 2021, 279, 123607. [Google Scholar] [CrossRef]
  64. Yang, X.; Zhang, J.; Shen, G.Q.; Yan, Y. Incentives for green retrofits: An evolutionary game analysis on Public-Private-Partnership reconstruction of buildings. J. Clean. Prod. 2019, 232, 1076–1092. [Google Scholar] [CrossRef]
  65. Water Pollution Control Action Plan. Available online: https://www.gov.cn/zhengce/content/2015-04/16/content_9613.htm (accessed on 9 October 2023). (In Chinese)
  66. Amaral, A.L.; Martins, R.; Dias, L.C. Efficiency benchmarking of wastewater service providers: An analysis based on the Portuguese case. J. Environ. Manag. 2022, 321, 115914. [Google Scholar] [CrossRef]
  67. Amaral, A.L.; Martins, R.; Dias, L.C. Operational drivers of water reuse efficiency in Portuguese wastewater service providers. Util. Policy 2023, 83, 101591. [Google Scholar] [CrossRef]
  68. Environmental Protection Tax Law of the People’s Republic of China. Available online: https://cjjg.mee.gov.cn/xxgk/zcfg/201906/t20190629_715174.html (accessed on 8 October 2023). (In Chinese)
  69. Meng, L.; Liu, K.; He, J.; Han, C.; Liu, P. Carbon emission reduction behavior strategies in the shipping industry under government regulation: A tripartite evolutionary game analysis. J. Clean. Prod. 2022, 378, 134556. [Google Scholar] [CrossRef]
  70. Liu, B.; Li, T.; Tsai, S.-B. Low Carbon Strategy Analysis of Competing Supply Chains with Different Power Structures. Sustainability 2017, 9, 835. [Google Scholar] [CrossRef]
  71. Friedman, D. On economic applications of evolutionary game theory. J. Evol. Econ. 1998, 8, 15–43. [Google Scholar] [CrossRef]
  72. China Statistical Yearbook. Available online: http://www.stats.gov.cn/sj/ndsj/2022/indexch.htm (accessed on 9 October 2023). (In Chinese)
  73. Environment, National Bureau of Statistics, Ministry of Ecology and Environment. China Statistical Yearbook on Environment; China Statistics Press: Beijing, China, 2023.
  74. Wang, C.; Li, J. The Evaluation and Promotion Path of Green Innovation Performance in Chinese Pollution-Intensive Industry. Sustainability 2020, 12, 4198. [Google Scholar] [CrossRef]
  75. Doran, J.; Bigliardi, B.; Ryan, G. Regulation and firm perception, eco-innovation and firm performance. Eur. J. Innov. Manag. 2012, 15, 421–441. [Google Scholar] [CrossRef]
Figure 1. Diagram of the evolution of the government’s stabilization strategy.
Sustainability 15 15359 g001
Figure 2. Diagram of the evolution of wastewater enterprises’ stabilization strategy.
Sustainability 15 15359 g002
Figure 3. Diagram of the evolution of the WTSP stabilization strategy.
Sustainability 15 15359 g003
Figure 4. Graphs of the impact of changes in probability (x).
Sustainability 15 15359 g004
Figure 5. Graphs of the impact of changes in probability (y).
Sustainability 15 15359 g005
Figure 6. Graphs of the impact of changes in probability (z).
Sustainability 15 15359 g006
Figure 7. Graphs of the impact of changes in S1 and S2.
Sustainability 15 15359 g007
Figure 8. Graphs of the impact of changes in I1 and I2.
Sustainability 15 15359 g008
Figure 9. Graphs of the impact of changes in C12 and C21.
Sustainability 15 15359 g009
Figure 10. Graphs of the impact of changes in Cs.
Sustainability 15 15359 g010
Figure 11. Graphs of the impact of changes in Cf.
Sustainability 15 15359 g011
Table 1. Summary of main parameters.
ParametersDescription
CeEnvironmental treatment cost for the ordinary production of wastewater enterprises
CsCost of the government’s active participation
CfThe reputation loss experienced by the government because of public supervision when the government chooses passive participation
C11Wastewater enterprises’ cost for ordinary production
C12Wastewater enterprises’ additional cost for green production
C21Cost of providing services for WTSPs
V11Wastewater enterprises’ base revenue for ordinary production
V12Wastewater enterprises’ additional revenue for green production
V21The base revenue of WTSPs
T1Wastewater enterprises’ sunk-cost loss for suffering a betrayal
T2WTSP’s sunk-cost loss for suffering a betrayal
WEnvironmental benefits brought about by the green production of wastewater enterprises
I1Government subsidies when wastewater enterprises choose green production
I2Government subsidies when WTSPs choose cooperation
S1Government penalties when wastewater enterprises choose ordinary production
S2Government penalties when WTSPs choose no cooperation
Table 2. The tripartite evolutionary game payoff matrix.
The Government
Active Participation (x)Passive Participation (1 − x)
Wastewater enterprisesGreen production (y)WTSPsCooperation (z)W − Cs − I1 − I2W − I2 − Cf − γCs
V11 + V12 − C11 − C12 + I1V11 + V12 − C11 − C12
V21 + C12 − C21 + I2V21 + C12 − C21 + I2
No cooperation (1 − z)S2 − Cs − Ce−Ce − Cf − γCs
V11 − C11 − T1V11 − C11 − T1
V21 − S2V21
Ordinary production (1 − y)WTSPsCooperation (z)S1 − Ce − Cs − I2−Ce − I2 − Cf − γCs
V11 − C11 − S1V11 − C11
V21 − T2 + I2V21 + I2 − T2
No cooperation (1 − z)S1 + S2 − Ce − Cs−Ce − Cf − γCs
V11 − C11 − S1V11 − C11
V21 − S2V21
Table 3. Stability analysis of equilibrium points.
Equilibrium PointsEigenvaluesEigenvalue SymbolStability
Q1(1,1,1)λ1 = Cs − Cf + I1 − γCsESS
λ2 = C12 − I1 − S1 − V12
λ3 = C21 − C12 − I2 − S2
Q2(1,1,0)λ1 = Cs − Cf − S2 − γCsSaddle point
λ2 = T1 − S1
λ3 = C12 − C21 + I2 + S2+
Q3(1,0,1)λ1 = Cs − Cf − S1 − γCsSaddle point
λ2 = I1 − C12 + S1 + V12+
λ3 = T2 − S2 − I2
Q4(1,0,0)λ1 = Cs − Cf − S1 − S2 − γCsSaddle point
λ2 = S1 − T1+
λ3 = I2 + S2 − T2+
Q5(0,1,1)λ1 = Cf − Cs − I1 + γCs+Saddle point
λ2 = C12 − V12
λ3 = C21 − C12 − I2
Q6(0,1,0)λ1 = Cf − Cs + S2 + γCs+Unstable point
λ2 = T1+
λ3 = C12 − C21 + I2+
Q7(0,0,1)λ1 = Cf − Cs + S1 + γCs+Unstable point
λ2 = V12 − C12+
λ3 = T2 − I2+
Q8(0,0,0)λ1 = Cf − Cs + S1 + S2 + γCs+Saddle point
λ2 = −T1
λ3 = I2 − T2
Table 4. Parameter settings.
Name of ParameterInitial ValueName of ParameterInitial Value
Cf50S212
Cs25I19
γ0.2I27
C1222V1230
C2116T119
S117T211
Disclaimer/Publisher’s Note: The statements, opinions and data contained in all publications are solely those of the individual author(s) and contributor(s) and not of MDPI and/or the editor(s). MDPI and/or the editor(s) disclaim responsibility for any injury to people or property resulting from any ideas, methods, instructions or products referred to in the content.