Abstract
The global commercial fishing industry, which employs approximately 159,800 seafarers worldwide (as reported by the Food and Agriculture Organization of the United Nations), faces a significant challenge in terms of safety. According to estimates by the International Labour Organization, approximately 24,000 seafarers lose their lives each year in fishing-related accidents. However, most existing guidelines for preventing maritime accidents primarily target vessels involved in international navigation, often inadequately addressing the unique risks faced by small-scale boats operating in coastal areas. This study focuses on trap fishery, a widely practiced fishing method globally, analyzing quantitative data from 1790 maritime accidents and conducting a survey involving 101 seafarers in South Korea. Utilizing Bayesian network analysis, aligned with Formal Safety Assessment protocols, the authors developed preventive guidelines aiming to reduce the rate of fatal accidents. The guidelines, derived from the data analysis, are anticipated to provide invaluable assistance to seafarers engaged in trap fishery not only in South Korea but also across various countries worldwide. By enhancing safety measures in this critical sector, this research will contribute to the overarching goal of sustainability within the global commercial fishing industry.
1. Introduction
Fishery is an occupation with a very low level of safety [1], and on average, approximately 24,000 deaths are estimated to occur every year [2]. In addition, the rate of fatal accidents in the fishing sector is 115 times higher than those of other fatal accidents in the UK and 25 times higher than the national averages of Australia and USA [3]. In South Korea, the target country of this study, the rate of accidents in the fishing sector in 2021 was 2.37 times higher compared to the total mean rate of industrial accidents (1.49% vs. 0.63%) [4].
While there may be slight variations in accident occurrence rates among different countries, it is evident that accidents in the fishing industry have significantly higher rates compared to most other industries. Furthermore, the majority of accidents within the fishing sector occur on fishing vessels, and human error is widely recognized as a predominant factor contributing to the accidents. As a result, numerous studies aligned with this objective are currently underway. To delve into this further, notable preceding research studies can be categorized and examined according to their research methodologies.
Certain studies analyze the causes of accidents by associating them with human factors and subsequently propose preventive measures accordingly. For example, a study analyzed the causes of fishing vessel capsizing and correlated them with worker education to propose methods for reducing accident rates [5], and another study delved into the impact of human activities and environment factors on maritime accidents to lower fatality rates [6].
Some studies have gathered fishing vessel maritime accident data from national institutes and quantitatively analyzed factors such as vessel length and occurrence patterns to assess the risk of accidents within the fishing industry [1,7]. Additionally, other studies have utilized techniques such as FTA (fault tree analysis), checklists, or preventive manuals to analyze maritime accidents on fishing vessels and proposed measures to prevent them [8].
Studies on such varied themes have been continuously conducted; on a global scale, the International Maritime Organization (IMO) and the Food and Agriculture Organization (FAO) of the United Nations have made continuous efforts to reduce the rate of maritime accidents in fishing vessels through the development of regulations and safety measures.
However, despite the ceaseless efforts of international organizations, the outcomes of which include the International Convention on Standards of Training, Certification and Watchkeeping for Fishing Vessel Personnel (STCW-F), Torremolinos Convention, and the Code for Responsible Fishing, the rate of accidents in the fishing sector remains relatively high compared to other industrial sectors [9]. While there are various reasons for the consistently high rate of accidents, the most representative ones are discussed below.
First, most policies on maritime safety suggested by the IMO have been developed and revised for vessels involved in international navigation, with the majority of such vessels being merchant ships [8]. Thus, it is necessary to modify the specific parts of the suggested preventive polices to reflect the operational environment and scale of fishing vessels. For instance, the crashing and capsizing of merchant ships are accidents that directly lead to critical environmental pollution and significant financial loss, which is not the case for fishing vessels. In fishing vessels, owing to the characteristics of the operational environment, the same maritime accidents (crashing, capsizing, etc.) far more frequently lead to the injury, disease, and death of an individual fisher, but they rarely cause environmental pollution or significant financial loss. Hence, accident analysis, management, and preventive guidelines should be specifically designed according to the type of vessel, even in cases identical forms of maritime accidents.
Second, for merchant ships that show a high proportion of international navigation, accidents often occur in regions outside the ship’s native country, leading to relevant international laws being continuously developed or revised. In contrast, the number of domestic fishing vessels far exceeds that of deep-sea fishing vessels, and maritime accidents are managed by respective countries in most cases, with a strong tendency to develop their own specific preventive measures. Hence, the rate of accidents and preventive measures in fishery significantly vary across countries.
Based on this background, this study was conducted to develop subdivided marine accident prevention guidelines that can be applied to types of fishing vessels. As described above, since the working method and characteristics are different depending on the type of vessel, in this study, the trap boat was selected for the first step of the study for the following reasons. First, since trap fishery is well known around the world, it was judged that this would make it easy to share our study results. In addition, as the number of seafarers is high, the accident rate is also high, so it was judged that the priority development of prevention guidelines is necessary. The study flow is as follows.
First, 1780 data points on accidents were collected to perform a reliable cause–effect analysis, based on which marine accidents involving seafarers were quantitatively classified. Second, a survey was conducted among 101 seafarers to ascertain the direct and indirect causes of fatal accidents, and the data were analyzed. Third, preventive measures were prepared using the results of 1790 quantitatively analyzed accidents and survey results derived from 101 seafarers. Fourth, preventive measures were used as nodes in the Bayesian network, a method suggested in the Formal Safety Assessment (FSA), to deduce the rate of fatal accidents [10], and the reduction rate of deaths was inferred. This approach, unlike previous studies conducted separately for each component, maintained the continuity of the research, enhancing the interrelation between each research process and thus improving their reliability.
2. Materials and Methods
2.1. Target Country and Type of Fishery
2.1.1. Target Country (South Korea)
The Port of Busan (latitude 35°05′ N and longitude 129°03′ E) is located in South Korea (Figure 1). Numerous vessels pass through the Port of Busan as it is among the global top ten ports in terms of traffic for international trade. Moreover, fishery is highly developed and active in South Korea, with ≥65,000 fishing vessels registered annually (≥85% of all registered vessels) [11]. In addition, as a result of analysis based on the maritime casualties and incidents module of the Global Integrated Shipping Information System, it was found that the greatest number of accidents occurred on the coasts of East Asian countries (China, South Korea, and Japan) next to the Mediterranean Sea [12]. As the main sites of fishing mostly overlap with the courses used by merchant ships, there is an urgent need to develop guidelines to prevent maritime accidents in fishing vessels.
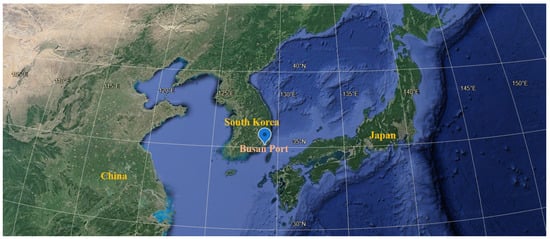
Figure 1.
Busan Port and the coasts of East Asian countries.
2.1.2. Trap Fishery
For this study, we selected trap fishery, which has the third-highest rate of maritime accidents (12%) and the highest rate of death [13]. In addition, trap fishery is performed across many countries worldwide; hence, selecting it for analysis allows for the efficient sharing of research data. The following is a schematic figure of a trap boat (Figure 2).
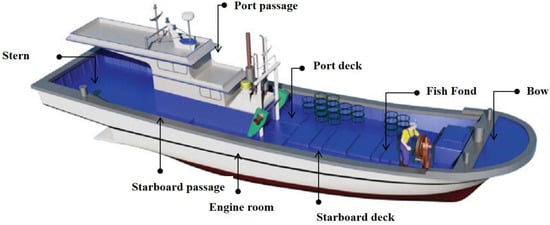
Figure 2.
Schematic figure of a trap boat.
2.2. Data on Maritime Accidents (Data on Approved Payment of Accident Compensation Insurance)
Despite its association with human life, which should be the top priority, maritime accidents that occur mainly in fishing vessels rarely lead to a maritime accident inquiry, as the impact of the outcome on the global economy and environment is insignificant. In many cases, therefore, the payment of compensation is the only independent solution. As a result, there is a lack of data on the detailed cause and effect of maritime accidents in fishing vessels, which could have a negative impact on the development of necessary guidelines.
The authors of this study obtained cooperation from various institutions to collect reliable data regarding maritime accidents among maritime accidents in fishing vessels. This led to the acquisition of data from the National Federation of Fisheries Cooperatives (NFFC) of South Korea [14] on the approved payment of accident compensation based on the Seafarers’ and Fishing Vessel’s Accident Compensation Act [13]. The data obtained were from 2016 to 2020, and contained the records of payments of accident compensation made to seafarers in accidents. The records indicated the sum of the payment and the cause and effect of the accident. As all seafarers must have accident compensation insurance to work in trap fishery, such data were adequately reliable with respect to the cause, effect, and rate of accidents.
2.3. Survey Data
A survey was conducted among 101 seafarers working in trap fishery for eels, crabs, and other fish, and data on the indirect causes of accidents were obtained [15]. Data were analyzed and verified, as described in Section 2.2. For instance, while such data may confirm that an injury (effect) was due to a trip (direct cause), what caused the trip (indirect cause) cannot be identified. An analysis of such data can only be achieved through a field investigation or survey.
To develop a guideline to reduce the rate of accidents, a process to reduce the probability of direct causes must precede; to this aim, data obtained through the survey were analyzed.
2.4. Formal Safety Assessment
Analytical studies in the field of maritime safety and accidents employ various methodologies to better understand the characteristics and causes of maritime accidents, and these studies encompass a range of research approaches.
For instance, some studies are based on established databases in the literature, while others involve a phased approach comprising visual analysis, analysis of the literature, and discussions, as outlined in reference [16]. In addition, certain studies utilize the weighted association rule mining technique to explore the relationships between various characteristics of maritime traffic accidents [17].
In the realm of maritime safety, the International Maritime Organization (IMO) has developed a structured and systematic methodology known as the FSA (Formal Safety Assessment) for enhancing maritime safety. The FSA achieves this by using risk analysis and cost–benefit assessment to protect life, health, the maritime environment, and property [10].
As for the studies to which FSA is applied, there are many types of merchant ships that apply this methodology, such as studies explaining the development of the shipping industry through the analysis of cruise ship accident statistics [18], studies discussing container ship accident statistics [19], studies on the potential risks of crude oil tankers [20], etc.
However, as the FSA concerns the overall field of maritime industry in addition to the protection of life, in this study, only necessary parts of it related to the analysis of maritime accidents in fishing vessels were selectively applied. The Bayesian network technique, which is prescribed in the standard test procedure 2.1 (STP 2.1) for risk analysis methods, was used to deduce the rate of fatal accidents in fishing vessels.
2.5. Bayesian Network Technique
The Bayesian network technique is widely used as an approach based on conditional probability for modeling and interpreting events with uncertainty [21]. The Bayesian model expresses the conditional probability across variables composed of cause and effect nodes. It is a directed acyclic graph expressing dependency across variables as directional edges, and has advantages as predictions are made through prior probability and backward chaining. Recently, the technique has received increased attention for the modeling of phenomena related to personal and organizational factors [22].
To detail studies that have applied the Bayesian network to maritime accidents that involved ships, one study proposed a scenario to minimize ship–ice collisions in the Arctic Ocean based on a Bayesian network [23], another study applied a Bayesian network to minimize the potential risk of ship collisions in narrow waters [24], a third inferred the potential behavior of vessels in a port [25], one analyzed fishing boat collision and sinking accidents based on the Bayesian network and the chi-square method [3], another analyzed unreported fishing boat accidents based on the Bayesian network and association rule mining hybrid models [26], and one final study analyzed information flow among fishing vessels through a behavior model based on the Bayesian network [27]. As described above, Bayesian networks have been used in many studies.
In this study, the Bayesian network was applied to infer the reduction rate of maritime accidents on fishing vessels. In other words, the aim was to infer how much the accident rate decreases when the preventive measures developed by the authors through accident data analysis and survey results are applied as nodes. The reason this technique was applied to this study is that maritime accidents on fishing vessels, like merchant ships, require systematic management through standardized analysis techniques.
To apply the Bayesian network, the first step is to understand the logic of conditional probability. Conditional probability is the probability of an event leading to another event. Hence, the probability of Event A during the incidence of Event B is referred to as the “conditional probability of Event A given that Event B has occurred”, which is expressed as P(A|B) (note: P(A|B) may vary under the influence of Event B, and P(A|B) and P(B|A) are generally different). As such, the relationship between prior probability and posterior probability for two probability variables can be expressed in defining the relationship between the conditional and marginal probabilities as follows:
where is the prior probability calculated for an event preceding Event B; is the prior probability for Event B; is the crossover probability that satisfies both events; A occurs given that B has occurred; is the posterior probability for Event A given that Event B has occurred; and is the conditional probability that Event B will occur given that prior probability A has occurred [28].
On the other hand, to have confidence in Bayesian network inference, it is necessary to confirm the causal relationships within the structure of the Bayesian network. In this study, Judea Pearl’s causal theory, with a specific focus on the concept of association, was employed to validate the causal relationships [29].
3. Quantitative Classification of the Status of Maritime Accidents in Trap Fishery
The cause and effect of maritime accidents were classified in multiple dimensions using data on the payments of accident compensation. Here, the terms related to accidents such as trip, stuck, etc., are the official codes in the Guide of Records and Classification for Industrial Accidents provided by the Korean Occupational Safety Health Agency (KOSHA) [30].
3.1. Status of Maritime Accidents by Type of Fishing
Data on the approved payment of accident compensation based on the Seafarers’ and Fishing Vessel’s Accident Compensation Act [13] showed that the rate of maritime accidents across the five studied years (2016–2020) in trap fishery was the third-highest across all types of fishing, at 1790 out of 14,873 accident victims (12.0%) (Figure 3).
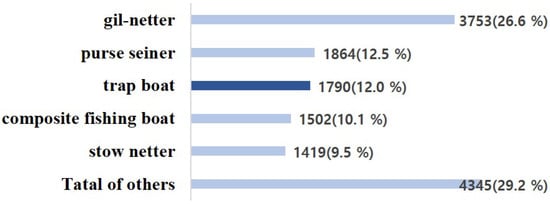
Figure 3.
Status of maritime accidents by type of fishing.
In addition, it held the highest death rate in trap fishery among the five main types of fishing, at 87 out of 1790 (4.86%) (Table 1).

Table 1.
Status of rate of death. Unit: number (%).
As previously mentioned, trap fishery, a passive type of fishing compared to active types such as gill-net and purse-seine fishery, was selected in this study because it displays the highest rate of death and has the highest proportion of seafarers. The purpose of choosing trap fishery was to prevent discordance in the sharing of procedures used and results obtained with other researchers worldwide.
3.2. Status of Maritime Accidents in Trap Fishery
The number of victims of maritime accidents in the five studied years was 1790. The number of injured was the highest (n = 1578; 88.2%), followed by disease (n = 125; 7.0%) and death (n = 87; 4.9%) (Table 2).
Table 2.
Status of maritime accidents each year. Unit: number (%).
Here, disease is a condition inflicted by repeated movements caused by long-term living on board, which is regarded as equivalent to injury and other transient outcomes of an accident. This is recognized in the classification of occupational diseases in Article 37 (2) of the Industrial Accident Compensation Insurance Act [31].
3.3. Status of Approved Payments of Accident Compensation for Death
The seriousness of a maritime accidents can be determined based on the payment of compensation. Table 3 and Figure 4 show the payments of accident compensation and their trends. Compared to injury or disease, the payments for compensation of death are markedly higher.
Table 3.
Status of approved payments of accident compensation for injury, disease, and death. Unit: USD.
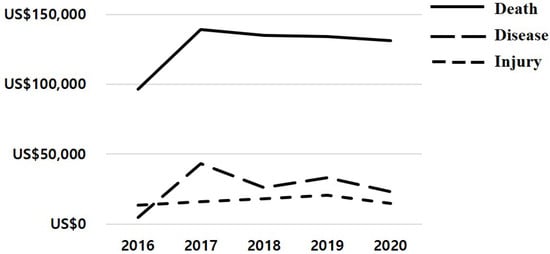
Figure 4.
Status of payments of accident compensation for injury, disease, and death.
Only 4.9% (87 out of 1790 cases) of accidents led to death in the five studied years, but the approved insurance payments were 3-fold higher than the sum of payments for accidents that led to injury and disease. It was thus determined that preventive measures should be taken predominantly for maritime accidents leading to death in fishing vessels, as they cause a far higher financial loss compared to those leading to injury or disease, apart from the loss of human lives.
3.4. Status of Maritime Accidents by Area of Fishing
Among the 1790 accidents in the five studied years, 919 were coastal and 871 were offshore. The numbers of injury, disease, and death for coastal accidents were 166 (90.3%), 11.2 (6.1%), and 6.6 (3.6%). The respective numbers for offshore accidents were 149.6 (85.9%), 13.8 (7.9%), and 10.8 (6.2%) (Table 4).
Table 4.
Status of maritime accidents according to area of fishing. Unit: number (%).
Data indicated that coastal accidents led to an outcome of injury with a high probability, whereas offshore accidents led to disease or death with a high probability. The deviation may be attributed to various causes, and is most likely to be the difference in sea areas that allow fishing operations. Hence, even for identical accidents, the time required for treatment could be shorter in offshore accidents, compared to coastal accidents, due to the difference in the distance from land. The probability of an offshore accident leading to death may also be higher than that of a coastal accident due to the unpredictable maritime climate.
3.5. Status of Maritime Accidents According to Fishery Process
The fishery process was broadly classified into fishing and boat maintenance. Analysis revealed that the number of maritime accidents was 1717 (95.9%) during fishing and 73 (4.1%) during boat maintenance. Most accidents were shown to occur during fishing (Table 5).
Table 5.
Status of maritime accidents according to process of fishery. Unit: number (%).
Additionally, for both fishing and boat maintenance, the number of accidents leading to injury was the highest. In the five studied years, no deaths occurred during boat maintenance (Table 6).
Table 6.
Status of accident outcomes according to the process of fishery. Unit: number (%).
3.6. Status of Maritime Accidents According to Direct Causes
The Seafarers’ and Fishing Vessel’s Accident Compensation Act specifies that insurance should be paid according to the classification of the type of industrial accident based on the respective codes designated by KOSHA (referred to as “direct causes” hereinafter) [27]. These direct causes of accidents include trip/slip, stuck (e.g., in a net hauler), bump/hit (e.g., by fishing gear), falling from height (e.g., to the storage chamber or outside the vessel), crumble (e.g., from fishing gear), crushed, unnatural posture (e.g., single repeated posture), exposure to extreme temperatures (e.g., long-term exposure to sunlight), exposure to chemicals, and disease (due to long-term operation in fishery).
In the five studied years, the following direct causes exhibited a far higher number of accidents among the 1790 accident victims: trip/slip (n = 511; 28.5%), bump/hit (n = 390; 21.8%), and stuck (n = 319; 17.8%). For others, the records did not indicate accurate causes (Table 7).
Table 7.
Status of maritime accidents according to direct causes. Unit: number (%).
3.7. Status of Maritime Accidents According to Direct Causes Based on Fishery Process
The analysis of direct causes indicated that during fishing, the number of accidents was the highest for trip/slip (n = 494; 28.7%), followed by bump/hit (n = 382; 22.2%) and stuck (n = 305; 17.7%). During boat maintenance, the number of accidents was the highest for trip/slip (n = 17; 23.3%), followed by stuck (n = 14; 19.2%) and exposure to chemicals (n = 10; 13.7%) (Table 8). Direct causes varied slightly between fishing and boat maintenance. Results revealed specific direct causes of accidents in each fishery process, and accordingly, a suitable preventive guideline can be developed.
Table 8.
Status of maritime accidents according to direct causes of fishery processes. Unit: number (%).
4. Analysis of Survey Data
In this section, the background of direct causes (indirect causes) was confirmed through a questionnaire survey and an interview. The indirect cause is the background that caused the direct cause of the accident, and when this part is analyzed, more reliable preventive measures can be established.
4.1. Questionnaire Survey and Interview
The survey received responses from a total of 101 seafarers, comprising 92 males (91.1%) and 9 females (8.9%). The distribution of seafarers’ positions was as follows: 84 captains, 16 deck hands, and one ship owner. Among the 101 seafarers, 89 seafarers had a career spanning 10 years or more. This substantial number of experienced individuals strongly implies that the survey participants are indeed seasoned experts in their field, and their insights can be deemed both reliable and trustworthy.
4.1.1. Questionnaire Survey
The contents of the questionnaire were written based on the payment details of accident compensation and the decision of the Maritime Tribunal, and consisted of 15 multiple-choice questions and 1 subjective question depending on the process of fishing. Here, the process of fishing was divided into a total of seven steps: boat maintenance, preparation for departure, departure and preparation for fishing, fishing, processing and stowage of catches, preparation for arrival and landing, and landing of catches.
Multiple-choice questions were composed regarding the direct causes of the accidents shown in the payment details of accident compensation. These can be broadly divided into two formats. The first format involved presenting, for each of the seven steps mentioned earlier, the five most frequently occurring accident types (direct causes), as well as an additional category labeled “Other” where seafarers could provide their own descriptions. This approach allowed us to gather responses from seafarers regarding their views on accident causes within the defined process of fishing. The second format involved categorizing the indirect causes of accidents into factors (human, machine, management, environment) and constructing each question in a multiple-choice format to present these factors.
The subjective question inquired about the seafarers’ opinions regarding the urgent measure to prevent the most frequently occurring accidents on trap boats. For this question, seafarers were asked to express their views on the most pressing action required to prevent accidents that commonly take place on trap boats.
The survey results from 16 questions obtained from 101 seafarers were quantitatively analyzed using Microsoft Excel and were utilized as data for the development of prevention guidelines.
4.1.2. Interview
Through the questionnaire survey, the responses of seafarers regarding the direct causes of accidents and the factors can be obtained using multiple-choice questions. However, as the questionnaire survey content was primarily composed of multiple-choice questions, it was difficult to ascertain the reasons behind seafarers’ choices for each question.
To address this limitation, the authors conducted interviews to gather opinions from seafarers about the reasons behind their responses to each question in the questionnaire survey. Furthermore, the responses were categorized in descending order of response rates. These results were then utilized as a basis for formulating preventive measures in conjunction with the questionnaire survey. However, it is important to note that biased responses or responses from a minority were kept as reference points for future studies rather than being included in the development of preventive measures.
4.2. Analysis of Questionnaire Survey
The analysis of the survey for each of the factors (human, management, machine, environment) resulted in the following findings.
First, among the human factors of indirect causes leading to direct causes, personal carelessness was the highest, at 32.0%, followed by “loss of concentration by repetitive work”, at 22.0% (Figure 5), indicating that seafarers were aware of the importance of carefulness in preventing accidents, and that an improvement can be achieved through safety education.
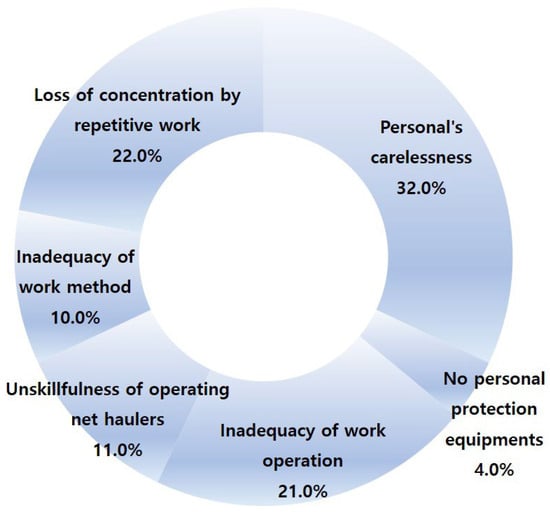
Figure 5.
Human factors of indirect causes.
Among the management factors of indirect causes, work practice of poor safety precautions was the highest, at 37.0%, followed by “inadequacy of education on hazard factors”, at 28.0% (Figure 6). The human and management factors shared similar contexts, and there is a high possibility of improvement.
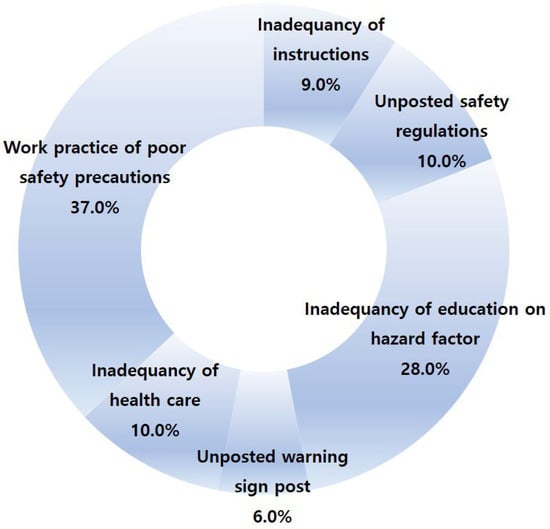
Figure 6.
Management factors of indirect causes.
Among the machine factors of indirect causes, decrepit equipment or poor maintenance was the highest, at 29.0%, followed by “systematic error of fishing equipment”, at 20% (Figure 7). As these factors are directly associated with financial aspects, improvements are likely to be a challenge, even though seafarers are aware of the risk of accidents. Nonetheless, these causes are not completely beyond control, and continuous efforts toward prevention are expected to lead to improvements.
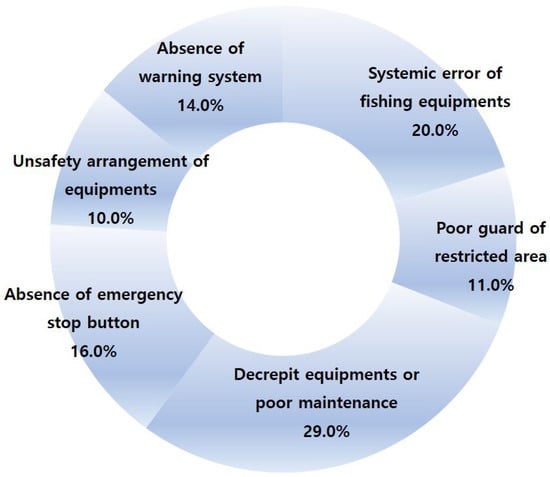
Figure 7.
Machine factors of indirect causes.
Among the environmental factors of indirect causes, poor environment such as waves (water depth) was the highest, at 27.0%, followed by “high tensile strength and enormous amount of rope (fishing gear)”, at 23.0% (Figure 8). The environmental factors are an unavoidable part of the fishing operation and are mostly beyond control. Environmental and human factors are closely associated, and improvements can be achieved with the determination of the ship owner or captain to prioritize safety.
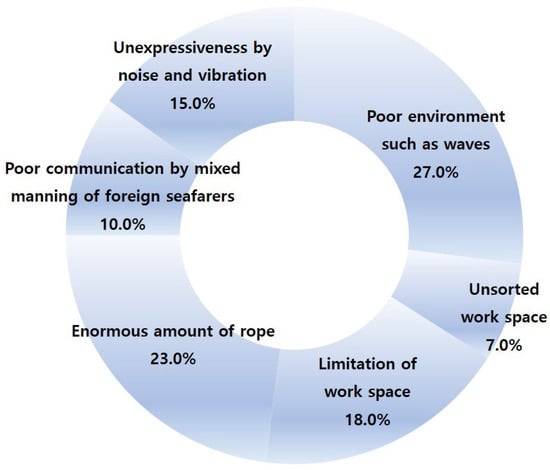
Figure 8.
Environment factors of indirect causes.
4.3. Analysis of Interviews
Based on the results of the interviews conducted using the responses from the questionnaire surveys, the authors were able to identify the indirect causes of accidents as perceived by the seafarers. The authors integrated these findings with actual accident cases, presenting the information as follows. Here, the actual accident cases were constructed based on the details found in the “payments of accident compensation” records, and presented the three most frequently occurring accident cases.
4.3.1. Trip/Slip
- Accident case
- Trip on the deck due to the loss of balance during fishing caused by poor weather conditions or waves from neighboring vessels;
- Slip caused by a fishing product such as mucus;
- Trip during preparation for sail caused by the collision of the vessel with the dock;
- Slip in the engine room caused by substances such as oil due to wearing slippery shoes.
- Indirect causes
- Slippery deck with sea water, mucus from fish, etc.;
- Various uneven structures on the deck floor and narrow passages;
- Sudden movement of the vessel due to wind, vessel traffic, etc.;
- No protective equipment (safety helmet or shoes);
- Personal carelessness.
4.3.2. Bump/Hit
- Accident case
- Bump into a structure due to sudden vessel movements caused by poor weather conditions or waves from neighboring vessels;
- Hit by a rope detached by fishing gear during fishing due to excessive tension or vessel movements;
- Hit by a cut rope due to high tension;
- Hit by fishing gear that is stuck in the middle of release or misconnected;
- Bump into heavy cargo during maintenance work in the engine room due to the movement of cargo.
- Indirect causes
- Sudden vessel movement and slippery deck;
- Narrow passage and engine room;
- Continuous fluctuation of tension in fishing gear during retrieval due to the movement of the vessel;
- Speedy operation and narrow workspace during the release of fishing gear;
- Unskillful rope operation and inappropriate site of operation;
- Cutting a worn-out rope on fishing gear;
- Becoming insensitive to environment changes due to long hours of repetitive work;
- Device error or misjudgment on a boat with one or two seafarers, who simultaneously perform(s) ship steering, catch manipulation, and the separation of fishing gear;
- No protective equipment (safety helmet or shoes);
- Personal carelessness.
4.3.3. Stuck
- Accident case
- Body part (e.g., hand) stuck due to unskillful or careless handling of catch equipment;
- Body part stuck in the hauler as a glove or part of the work suit is pulled into the machine;
- Body part (e.g., foot) stuck during anchoring;
- Body part (e.g., hand) stuck in the engine room during vessel maintenance.
- Indirect causes
- Long hours of repetitive work;
- Ignorance of safety during work;
- Unskillful handling of catch equipment and poor work performance;
- Inadequate management by the field supervisor;
- No protective equipment (safety helmet or shoes);
- Personal carelessness.
5. Bayesian Network Analysis of Fatal Accidents in Trap Fishery
As described in Section 1, fatal accidents are the most critical among maritime accidents in fishing vessels, and despite ceaseless efforts, the rate of fatal accidents has not been reduced. A Bayesian network was constructed based on the results of accident classification for trap boats (see Section 3 and Section 4), which were incorporated as nodes. The primary goal of the Bayesian network in this study was to deduce the rate of death on trap boats, while the final goal was to verify the change in rate of death according to the application of the preventive guidelines developed in this study. Here, Bayesian network software (version 2.3.4, 2023) from SpiceLogic™ Inc., located at 800 Steeles Ave W, Thornhill, ON, Canada, was used [32].
5.1. Construction of a Bayesian Network of Fatal Accidents
A Bayesian network was constructed by selecting various causes of accidents based on data classified in Section 3. Each node was mutually correlated.
As shown in Figure 9, the network development was limited to fatal accidents that occur in fishing vessels in trap fishery. The conditions were set to maximally resemble the actual work environment by assuming that accidents occur between coastal and offshore regions and between fishing and boat maintenance activities.
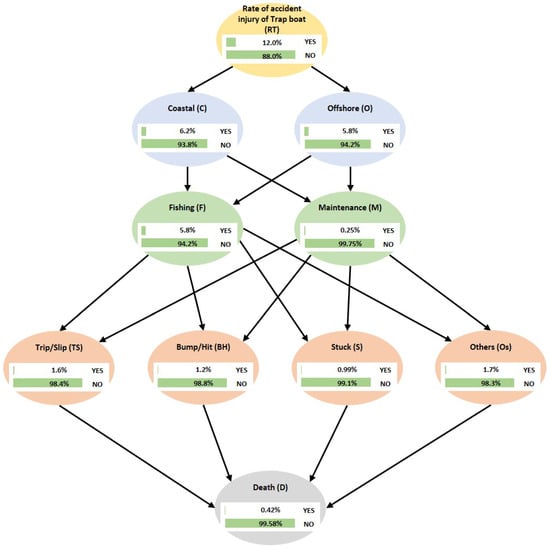
Figure 9.
Bayesian network of fatal accidents.
The nodes (pink) of direct causes of death incorporated only the three most frequent causes (trip/slip, stuck, and bump/hit), while the remaining causes were represented by “others”. Direct causes were limited to three because these accounted for approximately 70% of the total, representing the predominant need for guidelines. In addition, the rate of accidents for other causes was relatively low and the inadequacy of quantitative/qualitative data on these causes of accidents were unsuitable for the development of guidelines. The analysis of causes other than the three main causes will be performed in the future, after adequate data accumulation.
The calculation for each node was based on the logic of conditional probability. The deduced rate of fatal accidents leading to death in trap fishery in fishing vessels was 0.42%.
5.2. Deduction of Rate of Fatal Accidents According to Direct Causes
As shown in Figure 9, the calculation based on conditional probability indicated that the probabilities of trip/slip, bump/hit and stuck were 1.6, 1.2, and 0.99%, respectively. The rate of death on the final node can be reduced by reducing the probability of the three main direct causes through the elimination of indirect causes leading to them.
A preventive guideline was developed based on the results of a field investigation and survey to reduce the three main direct causes. All seafarers considered a safety checklist (CL) and protective equipment (PE) to be essential preventive measures.
Table 9 and Figure 10 show the composition of nodes. It was assumed that CL was followed and PE was applied to reduce the probability of direct causes. If , the conventional probability of direct causes without adherence to a guideline is 100%; the rates of reduction are 20, 10, and 25% for the use of PE and CL and the concurrent use of PE and CL, respectively. Here, at 50% adherence to the two measures simultaneously, the changed can be calculated through Bayesian logic using Equation (1) as follows:
Table 9.
An example of the rate of accidents while adhering to the preventive guideline. Unit: %.
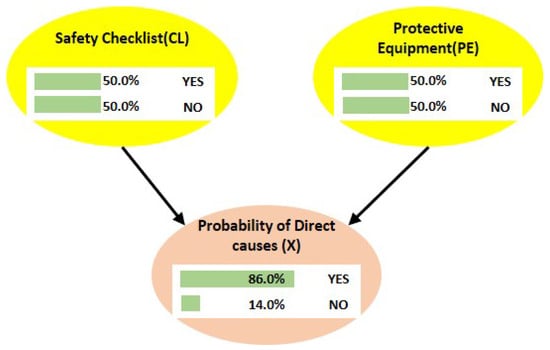
Figure 10.
An example of rate of accidents while adhering to the preventive guideline.
Hence, the probability of direct causes can be reduced by 14.0% at 50% adherence to both CL and PE.
5.2.1. Deduction of Rate of Death Due to Trip/Slip
Trip/slip is the most frequent cause leading to injury in trap fishery. Table 10 presents the rate of death with adherence to each or both preventive measures. In the absence of a preventive measure (0% adherence), the rate of death by trip/slip was 0.0064%. However, with adherence to each or both preventive measures, the rate of death reduced marginally.
Table 10.
Variations in the rate of death based on adherence to the preventive guideline. Unit: %.
Assuming 50% adherence to both CL and PE, the rate of death decreased by 14.1% to 0.0055%. Assuming 100% adherence, the rate of death decreased by 25.0% to 0.0048%. Figure 11 shows the Bayesian network indicating the rate of death due to trip/slip (left) and at 50% adherence to both CL and PE (right).
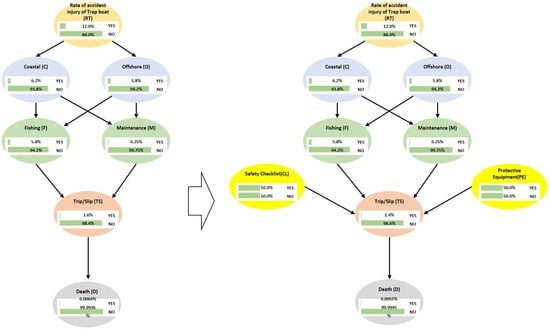
Figure 11.
Reduction in the rate of death at 50% adherence to the preventive guideline. Unit: %.
5.2.2. Deduction of Rate of Death Due to Bump/Hit
Bump/hit is the second most frequent direct cause of accidents after trip/slip in trap fishery. As shown in Table 11, in the absence of a preventive measure (0% adherence), the rate of death by bump/hit was 0.012%, which indicated that, while the rate of bump/hit accidents was lower compared to trip/slip accidents, the rate of death was comparatively higher.
Table 11.
Variations in the rate of death according to the adherence to the preventive guideline. Unit: %.
As specified in Section 5.2.1, assuming 50% adherence to both CL and PE, the rate of death decreased by 8.3% to 0.011%, and assuming 100% adherence, the rate of death decreased by 23.3% to 0.0092%. Figure 12 shows the rate of death due to bump/hit (left) and the rate of death at 50% adherence to both CL and PE (right) in the Bayesian network.
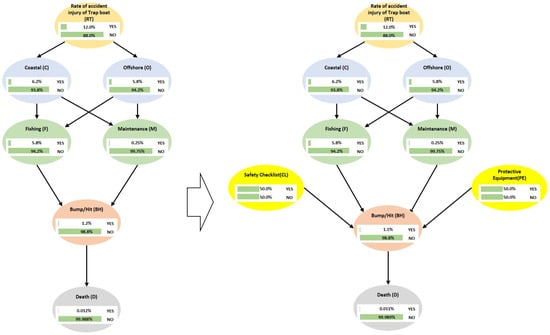
Figure 12.
Reduction in the rate of death at 50% adherence to the preventive guideline. Unit: %.
5.2.3. Deduction of Rate of Death Due to Stuck
Stuck is the third most frequent direct cause of accidents in trap fishery. As shown in Table 12, in the absence of a preventive measure (0% adherence), the rate of death by being stuck was 0.013%, the highest among the three direct causes to indicate a need for suitable preventive measures.
Table 12.
Variations in the rate of death according to the adherence to the preventive guideline. Unit: %.
As with other causes, assuming 50% adherence to both CL and PE, the rate of death decreased by 15.4% to 0.011%; assuming 100% adherence, the rate of death decreased by 26.2% to 0.0096%. Figure 13 shows the rate of death due to being stuck (left), and the rate of death at 50% adherence to both CL and PE (right) in the Bayesian network.
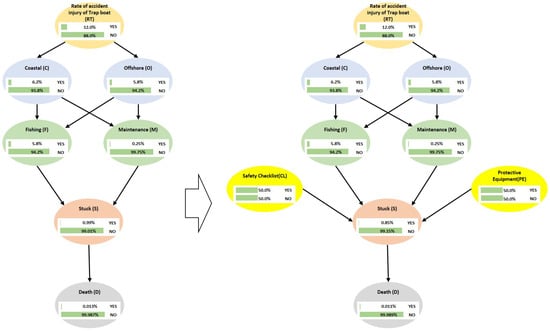
Figure 13.
Reduction in the rate of death at 50% adherence to the preventive guideline. Unit: %.
5.3. Validation the Bayesian Network
In the process of validating the validity of Bayesian networks, the primary focus lies in verifying causality. At this stage, it is essential to examine the relationships between variables, particularly probabilistic relationships.
The probability of accidents resulting in death occurring due to the three most frequent causes, trip/slip (0.4%), bump/hit (1.0%), and stuck (1.3%), were taken as the actual data. Each data point was set to the actual value (100%), and changes in the death rate were examined by increasing and decreasing them by 25% each to validate causality (Table 13).
Table 13.
The change in death rates due to the adjustment of the probability of accidents resulting in death for the three most frequent causes. Unit: %.
6. Preventive Guidelines
The multiple dimensions of maritime accidents in trap fishery were thoroughly examined. The findings unveiled that, when quantified, the three most recurrent direct causes of accidents were trip/slip, bump/hit, and stuck. However, the Bayesian network analysis demonstrated that the death rate did not necessarily correspond proportionally to the accident occurrence rate. This underscores the potential inefficiency of applying identical preventive measures for all accidents. This suggests that a one-size-fits-all approach to accident prevention might not be optimal.
For instance, accidents like trip/slip, which had a high occurrence rate but a relatively low death rate, would benefit from preventive measures that place emphasis on human and management factors. Conversely, accidents like stuck, with a higher death rate compared to their occurrence rate, require preventive measures that address not only the reduction in accident occurrence but also the mitigation of death when accidents do occur. This would entail focusing on machine and environment factors, as well as human and management factors, to prevent accidents more effectively.
6.1. Preventive Measures for Each Direct Cause
The authors proposed preventive measures for the three most frequently occurring accidents within trap fishery, as analyzed in Section 4. These measures were tailored to be more effective for each specific accident by considering both the accident occurrence rate and the death rate in case of an accident. In essence, these measures were designed to address the unique characteristics of each accident.
For instance, in the case of trip/slip, the preventive measures primarily emphasized changes in seafarers’ behavior, focusing on the human factor. On the other hand, for stuck, the preventive measures assigned greater emphasis to the machine factor, ensuring the safety and reliability of machinery. This approach aimed to enhance the overall effectiveness of the preventive measures based on the specific dynamics of each type of accident.
The preventive measures presented in this subsection are derived from the results of the quantitative analysis conducted in Section 3 and the survey conducted in Section 4 (Section 4.3). Most of the accidents that occurred in trap fisheries were a result of not implementing the following measures.
6.1.1. Trip/Slip
- Safety shoes with hard soles and high friction should be used despite discomfort instead of light and comfortable shoes;
- Risk factors on the deck should be removed by cleaning away neglected and unnecessary fishing gear;
- Sudden ship movements should be anticipated and risky movements should be avoided;
- While moving heavy cargo, the frequency of movement rather than the distance moved should be increased;
- Risk awareness should be increased and risk factors should be removed through the implementation of safety regulations and checklists.
6.1.2. Bump/Hit
- The presence of a rotating or heated device in the vicinity should be checked during movement;
- The change in rope tension should be carefully monitored during the retrieval of fishing gear to prevent hits;
- The safety distance from fishing gear during release should be adequately wide;
- The state of abrasion of the rope attached to fishing gear should be carefully monitored, and maintenance should be performed periodically;
- A cushion to reduce shock should be installed with a warning sign in areas of frequent bumping;
- The unstable operation of catch equipment should be prevented using components with set specifications;
- A facility to fix fishing gear in place should be installed to prevent crumble during ship movement;
- Risk awareness should be increased and risk factors should be removed through the implementation of safety regulations and checklists.
6.1.3. Stuck
- An emergency stop button should be installed with a warning sign to minimize the intensity of the accident;
- A safety bar should be installed around a device in operation to improve the work environment;
- Right-sized work suits should be worn to prevent them from being pulled into a machine;
- Fishing should not be performed during poor weather conditions;
- The location of work during fishing should be rotated to refresh the fisher’s attention;
- Risk awareness should be increased and risk factors should be removed through the implementation of safety regulations and checklists.
6.2. Safety Regulations and Safety Checklists
In this study, it was evident that maritime accidents occurring on fishing vessels were mostly of a simple nature, and the seafarers were indeed aware of the prevalence of such accidents. Nonetheless, the average occurrence of over 300 accidents annually within the 5 studied years remained persistent without significant decline. The results of the survey (Section 4) indicated several reasons for this, the primary ones being that the seafarers were preoccupied with fishing and the physically demanding nature of their work. As a result, they lacked the capacity to focus on accident prevention measures, and an element of complacency towards accidents also played a role.
The authors believe that if the risks and safety concerns associated with potential accidents before, during, or after fishing operations, or prior to departure, were obligatorily brought to mind and adhered to, the accident occurrence rate would certainly decrease. For these reasons, the authors have proposed safety regulations and safety checklists containing simple yet essential content for preventing maritime accidents on fishing vessels. These materials are currently under the copyright of the National Institute of Fisheries Science in South Korea and are officially provided to seafarers [15].
It is believed that utilizing the preventive measures for each cause presented in Section 6.1 in conjunction with the safety regulations and safety checklists outlined in Section 6.2 would be even more effective.
6.2.1. General Safety Regulations
- A designated work suit and protective gear should be worn during work;
- The work suit should always be tidy without any flappy parts;
- Protective gear such as gloves, safety shoes, and safety helmets should be worn appropriately according to their respective purposes of use;
- A life vest should be worn during poor weather conditions and during work that requires the body to be exposed to an area outside the ship;
- A safety belt should be worn with an attached safety rope during work at height;
- The fishing facility and work tools should be inspected prior to use;
- The vicinity of the workplace and the passage should be kept clean and tidy at all times;
- Care should be taken during walking:
- (a)
- The guard rail should be used while climbing up and down the stairs;
- (b)
- A ladder should be used for work at height;
- (c)
- Jumping from a height should be avoided;
- (d)
- Slipping can occur on the deck at any time; hence, running should be avoided and carefulness should be practiced;
- (e)
- Stepping or crossing over places where fishing nets or buoy lines are stationed should be avoided;
- (f)
- Passage through the space under heavy operating equipment in the workplace, such as cranes used for lifting fishing products, should be avoided.
- Chats and pranks should be avoided;
- One should not be overconfident about skills and be careless;
- Machines should be handled only by authorized persons;
- The catch facility should not be operated or controlled after consuming alcohol;
- The areas marked as hazardous should increase alertness and should be accessed only by authorized persons;
- Safety regulations and warning signs should be placed around hazardous substances;
- Work should be stopped upon detecting instability while performing a high-risk task;
- The captain should provide adequate education on safety regulations to seafarers prior to engaging them in operations.
6.2.2. Safety Regulations for Catch Equipment
- Prior to work, the supervisor should provide education on work methods, risk factors, and signaling to all seafarers;
- The hauler should be controlled by a designated fisher, who should check the lever position and operational status prior to use;
- The safety of connections of all ropes, loops, and hooks should be checked;
- The hauler should be operated according to the instructions of the coordinator;
- The fisher close to the hauler should keep a safe distance from rotating parts and rope and avoid approaching the interior of a device with protective railing;
- The hauler should be stopped immediately with ropes untied when normal operation cannot proceed due to the entanglement of fishing gear;
- Stepping over fishing gear that is released or retrieved should be avoided;
- If the person controlling the hauler has to leave the control station, they should notify another fisher and switch off the power;
- The hauler should never be accelerated or stopped suddenly (except in an emergency);
- Periodic maintenance such as checking hydraulic oil should be strictly implemented.
6.2.3. Pre-Sailing Checklist
| Ship Name: | Date: | Person in Charge: | Signature: | |
| 1. Wearing a suitable work suit | ㅁ | |||
| 2. Wearing a safety helmet and safety shoes with high friction | ㅁ | |||
| 3. Wearing a life vest during deck work | ㅁ | |||
| 4. Use of designated mooring such as a safe ladder while entering and exiting the ship | ㅁ | |||
| 5. Tidying up materials (hose, mooring rope, fishing gear, etc.) on the passage and deck | ㅁ | |||
| 6. Use of paint to mark danger in a caved-in area or a bump to cause a fall on the deck | ㅁ | |||
| 7. Immediate elimination or alleviation of wet or slippery passage or deck | ㅁ | |||
6.2.4. Pre-Fishing Checklist
| Ship Name: | Date: | Person in Charge: | Signature: | |
| 1. Suitable health status check of those participating in fishing | ㅁ | |||
| 2. Education on the catch facility and training on methods of use | ㅁ | |||
| 3. Tidy work suit without flappy sleeves | ㅁ | |||
| 4. Safety helmet and safety shoes with high friction | ㅁ | |||
| 5. Checking objects that can come between the operational lever and the workplace on the deck | ㅁ | |||
| 6. Checking hand signals with the deck supervisor | ㅁ | |||
| 7. Checking the operational direction of the lever | ㅁ | |||
| 8. Checking the position and methods of use of the emergency stop button on catch equipment | ㅁ | |||
| 9. Checking ropes and fishing gear connected to catch equipment | ㅁ | |||
| 10. Inspection of viscosity and volume of hydraulic oil | ㅁ | |||
| 11. Adequate rest to allow a high level of concentration during fishing | ㅁ | |||
7. Conclusions
The outcome of maritime accidents can be broadly classified into human, environmental, and financial aspects. Maritime accidents in commercial fishing vessels rarely cause critical environmental pollution or significant financial losses; however, the rate of fatal accidents has remained consistently high despite continuous efforts to prevent them. This study was conducted to reduce fatal accidents in fishing vessels through the use of an independent prevention manual for each cause of accident. Trap fishery was selected as the representative type of fishery.
Relevant data were analyzed quantitatively and qualitatively, and based on the findings, preventive measures of accidents were proposed.
Although the process of investigation was intense, the preventive guidelines may appear universal and simple. The contents of the measures were drawn from results of quantitative data analysis and a field investigation involving a survey among 101 seafarers to ensure adequately reliable evidence. Furthermore, the rate of accidents deduced using the Bayesian network comprising nodes representing the identified aspects suggested that the probability of reduction in fatal accidents in fishing vessels increased significantly based on the level of adherence to preventive measures.
In a follow-up study, we will compare the rate of reduction in accidents and results of the Bayesian network analysis to refine details of the developed prevention measures. In addition, the application of the developed measures to all types of fisheries will be explored. In accordance with the recommendations of this study, it is expected that the maritime accident rate on fishing vessels will decrease through the active participation of seafarers, and such efforts will contribute to the sustainability of the fishing industry.
Author Contributions
Conceptualization, S.-H.K. (Su-Hyung Kim); methodology, K.-J.R.; software, S.-H.L.; analysis, S.-H.K. (Seong-Hun Kim); writing—original draft preparation, Y.-W.L.; writing—reviewing and editing, K.-H.L.; supervision, S.-H.K. (Su-Hyung Kim). All authors have read and agreed to the published version of the manuscript.
Funding
This research received no external funding.
Institutional Review Board Statement
Not applicable.
Informed Consent Statement
Not applicable.
Data Availability Statement
The data used to support the findings of this study are available from the corresponding author upon request.
Acknowledgments
This research was supported by the “Development and demonstration of data platform for AI-based safe fishing vessel design (20220210)” of the Ministry of Oceans and Fisheries, Republic of Korea.
Conflicts of Interest
The authors declare no conflict of interest.
References
- Jin, D.; Thunberg, E. An Analysis of Fishing Vessel Accidents in Fishing Areas off the Northeastern United States. Saf. Sci. 2005, 43, 523–540. [Google Scholar] [CrossRef]
- FAO, Food and Agriculture Organization of the United Nations. Fisheries Department. The State of World Fisheries and Aquaculture. 2000, Volume 3. Available online: https://www.fao.org/3/X8002E/X8002E00.htm (accessed on 17 September 2023).
- Uğurlu, F.; Yıldız, S.; Boran, M.; Uğurlu, Ö.; Wang, J. Analysis of Fishing Vessel Accidents with Bayesian Network and Chi-square Methods. Ocean. Eng. 2020, 198, 106956. [Google Scholar] [CrossRef]
- KOSIS Korea Statistical Information Service. Statistic Database for Fisheries Production. 2023. Available online: https://kosis.kr/statHtml/statHtml.do?orgId=101&tblId=DT_1EW0003&vw_cd=MT_ZTITLE&list_id=K2_7&scrId=&seqNo=&lang_mode=ko&obj_var_id=&itm_id=&conn_path=MT_ZTITLE&path=%252FstatisticsList%252FstatisticsListIndex.do (accessed on 20 April 2023).
- Davis, B.; Colbourne, B.; Molyneux, D. Analysis of fishing vessel capsizing causes and links to operator stability training. Saf. Sci. 2019, 118, 355–363. [Google Scholar] [CrossRef]
- Pitman, S.J.; Wright, M.; Hocken, R. An analysis of lifejacket wear, environmental factors, and casualty activity on marine accident fatality rates. Saf. Sci. 2019, 111, 234–242. [Google Scholar] [CrossRef]
- Wang, J.; Pillay, A.; Kwon, Y.S.; Wall, A.D.; Loughran, C.G. An analysis of fishing vessel accidents. Accid. Anal. Prev. 2005, 37, 1019–1024. [Google Scholar] [CrossRef]
- Piniella, F.; Fernández-Engo, M.A. Towards a system for the management of safety on board artisanal fishing vessels: Proposal for check-lists and their application. Saf. Sci. 2009, 47, 265–276. [Google Scholar] [CrossRef]
- Blanc, M. Tools for Improved Fishing Vessel Safety: The Torremolinos Protocol and the STCW-F Convention. Fish. Newsl. S. Pac. Comm. 2006, 116, 30. Available online: http://www.spc.int/DigitalLibrary/Doc/FAME/InfoBull/FishNews/116/FishNews116_30_Blanc.pdf (accessed on 17 September 2023).
- IMO. Guidelines for Formal Safety Assessment (FSA) for Use in the IMO Rule-Making Process. MSC/Circ.1023-MEPC/Circ.392. 2002, pp. 1–54. Available online: https://wwwcdn.imo.org/localresources/en/OurWork/HumanElement/Documents/1023-MEPC392.pdf (accessed on 17 September 2023).
- KMST Korea Maritime Safety Tribunal. Statistics of Marine Accident. 2023. Available online: https://www.kmst.go.kr/web/stcAnnualReport.do?menuIdx=126 (accessed on 17 September 2023).
- Huang, D.-Z.; Hu, H.; Li, Y.-Z. Spatial analysis of maritime accidents using the geographic information system. Transp. Res. Rec. 2013, 2326, 39–44. [Google Scholar] [CrossRef]
- Accident Compensation Insurance Act for Fishing Vessel Members and Fishing Vessels. Enforcement on 16 December 2021, Law No. 18290, Partially Revised on 15 June 2021. Available online: https://www.law.go.kr/%EB%B2%95%EB%A0%B9/%EC%96%B4%EC%84%A0%EC%9B%90%EB%B0%8F%EC%96%B4%EC%84%A0%EC%9E%AC%ED%95%B4%EB%B3%B4%EC%83%81%EB%B3%B4%ED%97%98%EB%B2%95 (accessed on 17 September 2023).
- NFFC. National Federation of Fisheries Cooperatives. 2023. Available online: http://www.suhyup.co.kr (accessed on 17 September 2023).
- NIFS National Institute of Fisheries Science. Safety Accident Prevention Guideline. 2023. Available online: https://www.nifs.go.kr/board/actionBoard0047View.do?MENU_ID=M0000179&BBS_ID=20230328145209150NOC (accessed on 17 September 2023).
- Huang, D.; Liang, T.; Hu, S.; Loughney, S.; Wang, J. Characteristics analysis of intercontinental sea accidents using weighted association rule mining: Evidence from the Mediterranean Sea and Black Sea. Ocean. Eng. 2023, 287, 115839. [Google Scholar] [CrossRef]
- Cao, Y.; Wang, X.; Yang, Z.; Wang, J.; Wang, H.; Liu, Z. Research in marine accidents: A bibliometric analysis, systematic review and future directions. Ocean. Eng. 2023, 284, 115048. [Google Scholar] [CrossRef]
- Lois, P.; Wang, J.; Wall, A.; Ruxton, T. Formal safety assessment of cruise ships. Tour. Manag. 2004, 25, 93–109. [Google Scholar] [CrossRef]
- Wang, J.; Foinikis, P. Formal safety assessment of containerships. Mar. Policy 2001, 25, 143–157. [Google Scholar] [CrossRef]
- Vidmar, P.; Perkovič, M. Safety assessment of crude oil tankers. Saf. Sci. 2018, 105, 178–191. [Google Scholar] [CrossRef]
- Yang, Z.; Bonsall, S.; Wang, J. Fuzzy Rule-Based Bayesian Reasoning Approach for Prioritization of Failures in FMEA. IEEE Trans. Reliab. 2008, 57, 517–528. [Google Scholar] [CrossRef]
- Trucco, P.; Cagno, E.; Ruggeri, F.; Grande, O. A Bayesian belief network modelling of organisational factors in risk analysis: A case study in maritime transportation. Reliab. Eng. Syst. Saf. 2008, 93, 845–856. [Google Scholar] [CrossRef]
- Khan, B.; Khan, F.; Veitch, B. A Dynamic Bayesian Network model for ship-ice collision risk in the Arctic waters. Saf. Sci. 2020, 130, 104858. [Google Scholar] [CrossRef]
- Aydin, M.; Akyuz, E.; Turan, O.; Arslan, O. Validation of risk analysis for ship collision in narrow waters by using fuzzy Bayesian networks approach. Ocean. Eng. 2021, 231, 108973. [Google Scholar] [CrossRef]
- Wen, Y.; Zhang, Y.; Huang, L.; Zhou, C.; Xiao, C.; Zhang, F.; Peng, X.; Zhan, W.; Sui, Z. Semantic modelling of ship behavior in harbor based on ontology and dynamic bayesian network. ISPRS Int. J. Geo-Inf. 2019, 8, 107. [Google Scholar] [CrossRef]
- Özaydin, E.; Fışkın, R.; Uğurlu, Ö.; Wang, J. A hybrid model for marine accident analysis based on Bayesian Network (BN) and Association Rule Mining (ARM). Ocean. Eng. 2022, 247, 110705. [Google Scholar] [CrossRef]
- Little, L.R.; Kuikka, S.; Punt, A.E.; Pantus, F.; Davies, C.R.; Mapstone, B.D. Information flow among fishing vessels modelled using a Bayesian network. Environ. Model. Softw. 2004, 19, 27–34. [Google Scholar] [CrossRef]
- Kitson, N.K.; Constantinou, A.C.; Guo, Z.; Liu, Y.; Chobtham, K. A survey of Bayesian network structure learning. Artif. Intell. Rev. 2023, 56, 8721–8814. [Google Scholar] [CrossRef]
- Pearl, J.; Mackenzie, D. The Book of Why: The New Science of Cause and Effect; Basic Books: New York, NY, USA, 2018; pp. 1–30. [Google Scholar]
- Korean Occupational Safety Health Agency (KOSHA). Guide of Records and Classification for Industrial Accident. 2016, pp. 1–64. Available online: https://www.kosha.or.kr/kosha/data/guidanceW.do (accessed on 17 September 2023).
- Article 37 (2) of the Industrial Accident Compensation Insurance Act. 2023. Available online: https://www.law.go.kr/LSW/lsSideInfoP.do?joBrNo=00&docCls=jo&lsiSeq=243043&urlMode=lsScJoRltInfoR&joNo=0037 (accessed on 17 September 2023).
- SpiceLogic™ Inc. Bayesian Network Software 2.3.4 (Released on 18 February 2023). 2023. Available online: https://www.spicelogic.com/Products/Bayesian-network-software-20 (accessed on 17 September 2023).
Disclaimer/Publisher’s Note: The statements, opinions and data contained in all publications are solely those of the individual author(s) and contributor(s) and not of MDPI and/or the editor(s). MDPI and/or the editor(s) disclaim responsibility for any injury to people or property resulting from any ideas, methods, instructions or products referred to in the content. |
© 2023 by the authors. Licensee MDPI, Basel, Switzerland. This article is an open access article distributed under the terms and conditions of the Creative Commons Attribution (CC BY) license (https://creativecommons.org/licenses/by/4.0/).