Article

Optimizing Green Strategy for Retired Electric Vehicle Battery Recycling: An Evolutionary Game Theory Approach

1
School of Computer and Information Engineering, Harbin University of Commerce, Harbin 150028, China
2
Institute of Systems Engineering, Harbin University of Commerce, Harbin 150028, China
*
Author to whom correspondence should be addressed.
Sustainability 2023, 15(21), 15464; https://doi.org/10.3390/su152115464
Submission received: 19 September 2023 / Revised: 17 October 2023 / Accepted: 25 October 2023 / Published: 31 October 2023

Abstract

:
As the global new energy vehicle (NEV) industry rapidly expands, the disposal and recycling of end-of-life (EOL) power batteries have become imperative. Efficient closed-loop supply chain (CLSC) management, supported by well-designed regulations and strategic investments, plays a crucial role in sustainable waste power battery recycling. In this study, an evolutionary game theory (EGT) methodology is used to construct a tripartite game model to investigate the interactions among manufacturers, recyclers, and the government to study the decision-making dynamics of green investments. In addition, numerical simulations are performed to evaluate the sensitivity of the relevant parameters on the stability of the evolution of the system. The results reveal that government green subsidies can stimulate early period investments in advanced recycling technologies. However, as the battery recycling industry matures, a ‘free-rider’ behavior emerges among enterprises, which can be mitigated through the imposition of a carbon tax. Eventually, as the industry reaches maturity, manufacturers and recyclers autonomously invest for enhanced profitability. This research provides valuable insights for government policy formulation, facilitating the formal recycling of retired batteries and fostering sustainability in the NEV sector.

1. Introduction

It is well known that the transportation sector is a significant contributor to carbon emissions and environmental degradation, approximately accounting for 8–10% of total emissions [1]. Globally, the United States and China are the two primary emitters of CO2 from road transportation. In response to the environmental challenges, China has undertaken ambitious initiatives to promote new energy vehicles (NEVs), with a specific focus on electric vehicles (EVs) as a means to achieve carbon peak and carbon neutrality goals [2,3].
With the booming development of the NEV industry, the decommissioning of power batteries is approaching its peak. Generally, EV batteries (EVBs) reach their end of life (EOL) in 5–8 years or when they are reduced to 70–80% of their original capacity [4]. In such circumstances, recycling and echelon utilization of new energy vehicle batteries (NEVBs) have become essential to securing NEV lifecycle low-carbon emissions. Improper disposal of waste EVBs will cause environmental hazards such as heavy metal and electrolyte contamination. Moreover, waste power batteries contain substantial quantities of rare elements such as cobalt, lithium, and nickel, which may face supply shortages in the future. It is indicated that by 2040, recycling copper, lithium, nickel, and cobalt from waste batteries could reduce the demand for primary supply from natural resources by 8% [5]. Consequently, increasing natural resource shortages and stricter environmental regulations have driven the automotive manufacturing industry to focus on closed-loop remanufacturing.
Recycling is a means of green production which provides environmental, economic, and social benefits. Recycling a vehicle reduces greenhouse gas emissions by 545.1–683.1 kg compared to direct production [6]. However, as a core component of NEVs, emissions from the production of power batteries account for about 19–20% t from a purely electric vehicle (PEV). Since the scarcity of electrode materials and the increasing concern of environmental pollution from spent batteries, EVB recycling has become a global issue in the field of NEVs. Therefore, the recycling of retired batteries to achieve zero carbon emission in the lifecycle of NEVs has also become an essential scope of green supply chain management [2]. By 2020, China had accumulated more than 200,000 t of waste EVBs and it is expected to reach 780,000 t by 2025 [7]. However, the global recycling rate of power batteries is less than 5% [8]. To cope with the spent EVBs recycling issue, China has announced a series of policies in line with the practices of the EU, the United States, and Japan. For instance, the ‘Interim Measure for the Administration of Recycling and Utilization of New Energy Vehicles’ Power Batteries’ established the extended producer responsibility (EPR), which requires EV manufacturers to take the responsibility of recycling waste power batteries [9].
However, waste battery recycling still encounters some challenges. On the one hand, there are technical obstacles to EVB recycling. It is still necessary for CLSC enterprises to improve their green investment even though the higher cost of green investment has limited the establishment of formal power battery recycling channels. Therefore, a huge number of spent batteries have gone to informal channels of unqualified enterprises, which brings workers safety and environmental dangers and material waste issues. On the other hand, there is an absence of government incentives for waste battery CLSCs, especially for investment for green technology. Disposal of spent EVBs generates a large amount of greenhouse gases (GHGs) and toxic chemicals, which is contrary to the goal of promoting green and low-carbon NEVs. Therefore, it is necessary to pay attention to green technology investment in CLSCs, and encourage recycling enterprises to actively innovate the green disposal of waste batteries through investment subsidies and carbon emission policies.
In light of the above background, we intend to apply the evolutionary game theory (EGT) method to explore green investment in EVB recycling issues of stakeholders in different phases. The use of an EGT method in the context of waste EV battery recycling within a green CLSC offers several advantages and insights: Primarily, green investment in waste EV battery recycling involves multiple stakeholders, including manufacturers, recyclers, and policy makers. These stakeholders tend to have complex interactions, and evolutionary game methods can capture the complexity of their interactions and decision-making processes [10,11]. Consequently, green investment in CLSC is a dynamic process that is influenced by changing markets, regulations, and technological advances. EGT methods can simulate how strategies evolve over time in response to changing circumstances.
Furthermore, evolutionary game theory considers how stakeholders adjust their strategies based on past actions, which is particularly consistent with investment decisions on waste battery recycling. In other words, unlike the completely rational hypothesis in traditional game theory, the stakeholders are finitely rational in adjusting their optimal options in a constantly repeated game rather than reaching optimality in a single game. Ultimately, due to the complexity of the interaction of EVB recycling stakeholders, both cooperation and competition exist between them, such as the cooperation between manufacturers and recyclers to build power battery recycling channels, also involved in the competition for market share and resources [12]. So EGT can simulate equilibrium between these dynamics.
Overall, this study not only develops an evolutionary game model for green decision making of EVB recycling to explore the effects of critical parameters on the CLSC stakeholder, but also gives some advice for policymakers, which sheds practical light on the realization of carbon neutrality in the NEV industry.
The potential contributions are as follows: (1) This study takes the policy implications of a green and circular economy for investment in power battery recycling into consideration. Specifically, we will investigate the potential impact of policy measures on green investment in EVB recycling. These policies may include incentive measures and tax policies that are designed to encourage CLSC stakeholders to engage in driving sustainable development in this field. (2) This paper constructs a tripartite evolutionary game model of green investment in CLSC. With the context of an extended producer responsibility (EPR) system, it explores the green behaviors with dual-channel recycling between manufacturers and recyclers, which expands the research scope of the green supply chain. (3) This study examines the impact of major parameters related to green regulation on the evolution of corporate strategies in closed-loop supply chains. The simulation results reveal policy effects, such as green subsidies and carbon taxes, which contribute to the initial promotion of green recycling channels, and simulate the gradual recession of government green regulation.
The remainder of this study is structured as follows. Section 2 reviews the relevant literature. Section 3 gives the problem description and tripartite evolutionary game model construction. Section 4 replicates the dynamic equation solving and results in the optimal decision. Section 5 performs numerical simulations of the effects of different parameter changes on the evolutionary direction. Section 6 presents a review of the main findings and discusses the policy implications and practical significance.

2. Literature Review

2.1. Power Battery Recycling Model

Recovery of used EV batteries has drawn concern from industry to academia in recent years. Current research mainly concentrates on the two aspects of spent power battery disposal modes or recycling channels decision making [13,14]. Power battery recycling refers to the process of recovering and material refining from used or end-of-life batteries that were originally designed to provide power for NEVs. Accordingly, there are two ways to dispose of the collected EOL batteries, i.e., secondary use and rare metal recycling.
On the one hand, Harper et al. [15] points out that refurbishing and reusing used power batteries are more environmentally friendly than recycling as direct reuse can effectively avoid environmental pollution caused by the flow of metals into the soil. Consequently, refurbished battery modules can be used in less demanding applications like short-distance vehicle energy storage when they meet performance requirements [16,17]. Besides this, a few power batteries with a capacity of less than 80% are not suitable for EVs and can still be utilized in energy storage and other fields. On the other hand, the boom of EVs poses severe pressure on the supply of LIBs while recycling of metal materials from spent batteries can alleviate that issue [18], so it is widely recognized that recycling technology innovations have both economic and environmental benefits [19,20]. Power battery cathodes contain metals such as cobalt, so used batteries that cannot be used in a step-down process need to be collected and dismantled to recover the metals [21]. Typically, EVB recovery is divided into two stages: pretreatment and metal recovery. In the first stage, the main purpose of pretreatment is to remove inorganic materials from the metal materials to provide more valuable and pure recyclable materials for the next stage of resource recovery [22]. Metal recycling is the second stage; due to the complexity of the recycling treatment process, the current mainstream metal recycling methods can be divided into pyrometallurgy, hydrometallurgy, and direct recycling [22,23].
In addition, selecting and establishing recycling channels are the research focus of the used EVB recycling CLSC. In this regard, Zhang et al. [24] discover that the optimal recycling model is the mixed channel where retailers, recyclers, and echelon utilization companies join the reverse supply chain. Yu et al. [25] propose an alternative recycling model for wasted EV lithium batteries, in which the LIB manufacturers, the EV manufacturers, or a utilization company take responsibility for the collection of used power batteries. The advantage of this model is that it saves transport costs and improves the efficiency of dismantling and recycling lithium batteries, as well as making the dismantling of used batteries safer. Zhao and Ma [26] discuss EVB recycling CLSC optimal price decisions with the influence of the external environment and coordination contract of battery manufacturers, automobile manufacturers, and recyclers. Sun et al. [27] introduce the carbon trading and advertising policies for recycling channel selection, which indicate that profits of manufacturers and retailers are positively correlated with the advertising effect. Scholars have also introduced collectors into the examination of reverse supply chains, considering recycling investments and technology levels under a cooperative model consisting of collectors, manufacturers, and recyclers [28,29].

2.2. Research on Government Subsidies for Power Battery Recycling

As the global environmental challenges grow more severe, governments worldwide have been formulating policies aimed at reducing carbon emissions [30]. Meanwhile, academics have conducted ample studies about the government intervention on EV battery recycling. In terms of EPR mechanism, governments’ dynamic reward–fine policy is more effective in carbon emissions for NEV manufacturers to participate in recycling [7]. Government subsidies to NEV manufacturers have contributed to improving enterprise profits and social benefits when battery suppliers encroach on the recycling channels [31]. Besides this, various subsidies have also been proposed to incentivize the formation of formal recycle channels and production of recycled materials [32]. Furthermore, Jiao et al. [33] reveal that pollution fines and carbon trading costs help carbon emission reduction in power battery recycling enterprises, but subsidies inhibit carbon emission reduction. And due to the learning effect, they can make the power battery recycling enterprises take the initiative to improve R&D investment to reduce emission without regulation. Consequently, with government subsidy policy gradually phasing out, manufactures can also make higher profits by remanufacturing and echelon utilizing spent power batteries [3]. The impacts of the government’s recycling policy such as subsidy [34], deposit refunding [35], and punishment in reverse supply chain are examined. The results show that the subsidy policy can promote economic profits and create consumer surplus, and the deposit–refund policy could relieve the government’s fiscal pressure [36]. Beyond that, blockchain technology is also used to precisely track the lifecycle of retired batteries, deterring unqualified recyclers [37,38]. However, excessive processing fees reduce overall margins, as an alliance model between EV manufacturers and EVB manufacturers would result in overall profit optimization [39].

2.3. Green CLSC Carbon Policy

With the increasing acclamation of environmental problems and the insight of the carbon emission concept, carbon trading policy has become an important strategy for environmentally sustainable development. Consequently, green CLSC decision making has become a hotspot for academics [40,41,42].
Generally, governments impose three types of carbon policies in order to constrain carbon emissions over the lifecycle of production: carbon caps, carbon tax, and cap-and-trade [43]. In terms of cap-and-trade, Mondal and Giri [30] examine retailer and manufacturer competition and cooperation in CLSCs. The results indicate that incentive and cap-and-trade policy is beneficial to channel members. In addition, it can also set a reasonable proportion of free carbon quotas and a higher carbon price to mobilize enterprises to reduce emissions [44]. For example, Jiao, Pan and Li [31] investigated the carbon trading scheme on the decision of retired EV battery recycling CLSC, which illustrated that higher free carbon quotas discourage recycling and echelon utilization. Zhang et al. [45] further researched the relationship between competition coefficients, market returns, and low-carbon standards and carbon emission reductions in the NEVB recycling channels. De and Giri [29] examine carbon reductions in the transportation sector of CLSC, which sheds light on the optimal performance of heterogeneous fleets under different carbon policies.

2.4. Evolutionary Game Theory

Evolutionary game theory initially introduced the concept of fitness to study the competition and cooperation of different species or populations in an ecosystem. Since its emergence, evolutionary game theory has been widely used in the social sciences and philosophy to analyze interdependent decision problems faced by bounded rational individuals [46,47]. Wan et al. [48] constructed an evolutionary game model of the government and an online car-hailing platform to study the dilemma of efficient regulation in the development of the online car-hailing industry. Yuan et al. [49] constructed a tripartite evolutionary game model of government-owned nonprofit organizations (GNPOs), hospitals, and the government to examine the allocation of medical supplies in a public health emergency. Zhang et al. [50] adopted an evolutionary game model to explore the evolutionary mechanism of haze collaborative management between central and local governments. The results show that haze collaborative management is mainly influenced by performance evaluation systems, policy cost, financial subsidy, environmental inspection costs, environmental responsibility, and public participation.
The present broad research provides an important theoretical foundation for this research; however, there are still some gaps in the academic study. The current research on power battery recycling mostly concentrates on recycling pricing and channel selection, and there are some studies on the impact of recycling cost on the price of recycled products. Nevertheless, few studies have taken notice of the cooperation and competition between manufacturers and recyclers regarding investment in power battery recycling channels. There is uncertainty about the relationship between manufacturers, recyclers, and governments on green behaviors. In addition, it deserves further analysis as to whether carbon policies are conducive to green investments in EVB recycling CLSC.

3. Methods

3.1. Model Descriptions

In a three-party game, each player makes a strategy selection with the aim of optimizing their own interests, and constantly adjusts their solutions according to the results of each game to ultimately reach a strategic equilibrium. One of the players, NEV manufacturers, tries to improve its competitive advantage through green innovation, so it wants the government to provide incentives and infrastructure development to expand its market share. Meanwhile, recyclers’ objective is to promote battery recycling. They want to collaborate with manufacturers to establish a more eco-friendly recycling system for used power batteries, in which old batteries are recycled and reused, which is not only good for the environment but also potentially profitable for them. Moreover, the government’s carbon emission policy also has a positive effect on the green recycling investment of collectors.
Finally, the government, due to its social and environmental responsibilities, wants to reduce emissions and promote environmentally sustainable development. Therefore, through mandatory regulation and providing incentives, it steers enterprises to take the initiative to innovate so as to realize the purpose of socio-economic green development.
The recycling of waste EV batteries is crucial for promoting a circular economy and enabling green development. Green investment in the CLSC of power batteries is closely tied to economic and environmental development. Hence, the government must implement green regulations on the disposal of used power batteries. In the environmentally EVB recycling game, manufacturers, recyclers, and the government represent groups of agents. Manufacturers and recyclers have two decision-making options to choose between: GI and “NI”. Green investment can enhance the level of stepwise usage and harmless processing of used power batteries, curbing environmental pollution and resource depletion, and gaining green subsidies from the government. NI recycling technology can result in environmental pollution and depletion of metal resources. Moreover, such investments will not receive government subsidies. Green investments by manufacturers can lead to the production of high-performance power batteries that can be easily dismantled and disposed of. This can be achieved through technological innovation and the use of environmentally friendly raw materials. On the other hand, recyclers can establish power battery recycling facilities with the necessary qualifications to improve the power battery recycling network [51]. As the supervisor, the government can choose between green and non-green regulation strategies. Both options can stimulate manufacturers and recyclers to adopt green behavior strategies and levy a carbon tax on the excess carbon emissions generated by waste power batteries. Figure 1 shows the three-party evolutionary game model.

3.2. Model Assumptions

Based on EGT, individuals are perceived as limited rational beings who repeatedly adapt and modify their strategies according to the payoffs of the game. In order to analyze the evolutionary process of the green strategy selection of agents, the following assumptions are made on the basis of the practice of EVB recycling.
Assumption 1. 
Manufacturers of NEVs gain the green benefits of the reverse supply chain for power batteries by using raw materials that are easy to recycle and low in pollution. When the manufacturer chooses a green investment (GI) strategy, the green performance of power batteries will be improved, and the government will get positive environmental and social benefits. When an NI strategy is adopted, there is no need to invest in high R&D costs to find more environmentally friendly raw materials for batteries, manufacturing processes, and green degradation technologies for used batteries. Therefore, when the government’s green regulation is low, manufacturers and recyclers will be driven by profit maximization and prefer the NI strategy. Only when the negative externalities of government green regulations and carbon taxes on excess carbon emissions outweigh the cost savings for manufacturers and recyclers will companies be willing to take the initiative to adopt a GI strategy. When the manufacturer chooses a non-green investment (NI) strategy, it will not receive green subsidies from the government, and may pay carbon tax for the excess emissions generated by retired power batteries.
Likewise, recyclers only have the choice between GI and NI strategies. When recyclers choose a GI strategy, they need to construct recycling channels for power batteries and innovate recycling technologies to improve the level of green recycling. In this case, the government will also receive positive environmental benefits.
There is a free-riding effect of GI between manufacturers and recyclers, i.e., when only one party chooses a GI strategy, the other party will share in the corresponding green benefits as well. For example, when a manufacturer innovates by using more environmentally friendly raw materials and processes to manufacture batteries, it is less difficult for the recycler to dispose of the batteries at the decommissioning stage, and some of the disposal costs are saved. In addition, if the recycler adopts a GI strategy, innovates dismantling and disposal technologies for used batteries, increases the recovery rate of metal raw materials, and effectively reduces the price of recycled materials, then the manufacturer can enjoy lower prices for recycled raw materials, thus reducing the cost of manufacturing new batteries. When recyclers adopt an NI strategy, they may get the “free-rider” benefit from the manufacturers’ GI, but they will also pay additional carbon tax. At the same time, the government has to pay for pollution, so it also support recyclers to adopt GI strategies.
Assumption 2. 
There are two options for governments in the waste EVB recycling market: “green regulation” (GR) and “non-green regulation” (NR). When the government adopts a GR strategy, manufacturers and recyclers have risks of negative returns compared to an NR strategy, and the government will obtain positive social benefits. When the government adopts an NR strategy, recyclers will be exempt from carbon tax (assuming  γ Q M < C G ; γ Q M < C G ). The cost of green regulation is  C G , and the negative social effect when either the manufacturer or the recycler chooses NR is  A [30].
Assumption 3. 
It is assumed that when both the manufacturer and the recycler choose a GI strategy, they will generate green synergistic benefits, i.e., a 1 + 1 > 2 effect. In this paper,  β b  represents the synergistic benefits, where  β [ 0 , 1 ]  is the synergistic coefficient,  β = 0  represents the lowest synergistic effect, and  β = 1  represents the highest synergistic effect. And  b ( b > 0 )  is the synergistic benefit base,  η  is the allocation coefficient so that  η β b  is the synergistic benefit of the manufacturer, and  1 η  is the synergistic benefit of the recycler.
Assumption 4. 
The probability that manufacturers adopt GI in the battery recycling CLSC is  x , and the probability that they choose an NI strategy is  1 x . The probability that recyclers choose GI in the recycling and disposal of power batteries is  y , and the probability that a recycler chooses NI is  1 y . Likewise, the probability that the government imposes GR is  z , and the probability that the government implements NR is  1 z .
In line with the above assumptions, a description of symbols is illustrated in Table 1.
Based the above definitions, the payoff matrix of manufacturers, recycler, and governments is shown in Table 2:

4. Results

4.1. Replication Dynamic Equations

Manufacturers, recyclers, and governments could adopt the optimal strategy based on their payoffs.
The average benefit of manufacturers choosing a green invest strategy:
E M 1 = y ( Π M C M + α C M + η β b ) + ( 1 y ) ( 1 + μ ) Π M C M + α C M
The average benefit of manufacturers choosing a non-green invest strategy:
E M 2 = y z ( Π M + P M γ Q M ) + ( 1 y ) z ( Π M γ Q M ) + y ( 1 z ) ( Π M + P M ) + ( 1 y ) ( 1 z ) Π M
The average expected benefits of the manufacturer:
E M ¯ = x E M 1 + ( 1 x ) E M 2
Replication dynamic equation of manufacturers:
H 1 ( x , y , z ) = x ( E M 1 E M ¯ ) = x ( 1 x ) μ Π M + α C M C M + γ Q M z + ( η β b μ Π M P M ) y
Turning to recyclers, the expected income of the recycler when they adopt a green invest strategy:
E R 1 = x Π R + α C R C R + ( 1 η ) β b + ( 1 x ) ( 1 + θ ) Π R + α C R C R
The expected income to the recycler when they choose a non-green invest strategy:
E R 2 = x z ( Π R + P R γ Q R ) + ( 1 x ) z ( Π R γ Q R ) + x ( 1 z ) ( Π R + P R ) + ( 1 x ) ( 1 z ) Π R
Therefore, the average payoffs of recyclers:
E R ¯ = y E R 1 + ( 1 y ) E R 2
The replication dynamic equation H 2 ( x , y , z ) of the recycler can then be expressed as:
H 2 ( x , y , z ) = y ( E R 1 E R ¯ ) = y ( 1 y ) μ Π M + α C M C M + γ Q M z + ( η β b μ Π M P M ) y
Finally, we set the expected payoffs of the government implementing green regulation and NR as E G 1 and E G 2 . The expected average benefit is E G ¯ :
Green regulation:
E G 1 = x y ( φ C G ) + x ( 1 y ) ( φ 2 C G A + γ Q R ) + ( 1 x ) y ( φ 2 C G A + γ Q M ) + ( 1 x ) ( 1 y ) ( γ Q M + γ Q R C G 2 A )
NR:
E G 2 = x y φ + x ( 1 y ) ( φ 2 A ) + ( 1 x ) y ( φ 2 A ) + ( 1 x ) ( 1 y ) ( 2 A )
Expected average payoff:
E G ¯ = z E G 1 + ( 1 z ) E G 2
H 3 ( x , y , z ) = z ( E G 1 E G ¯ ) = z ( 1 z ) γ ( Q M + Q M ) C G γ Q M x γ Q R y
Replication dynamic of the government:
H 3 ( x , y , z ) = d z d t = z ( 1 z ) γ ( Q M + Q M ) C G γ Q M x γ Q R y
Thus a three-dimensional dynamical system is obtained, which can be written as:
H 1 ( x , y , z ) = d x d t = x ( 1 x ) μ Π M + α C M C M + γ Q M z + ( η β b μ Π M P M ) y H 2 ( x , y , z ) = d y d t = y ( 1 y ) θ Π R + α C R C R + γ Q R z + ( ( 1 η ) β b P R θ Π R ) x H 3 ( x , y , z ) = d z d t = z ( 1 z ) γ ( Q M + Q M ) C G γ Q M x γ Q R y

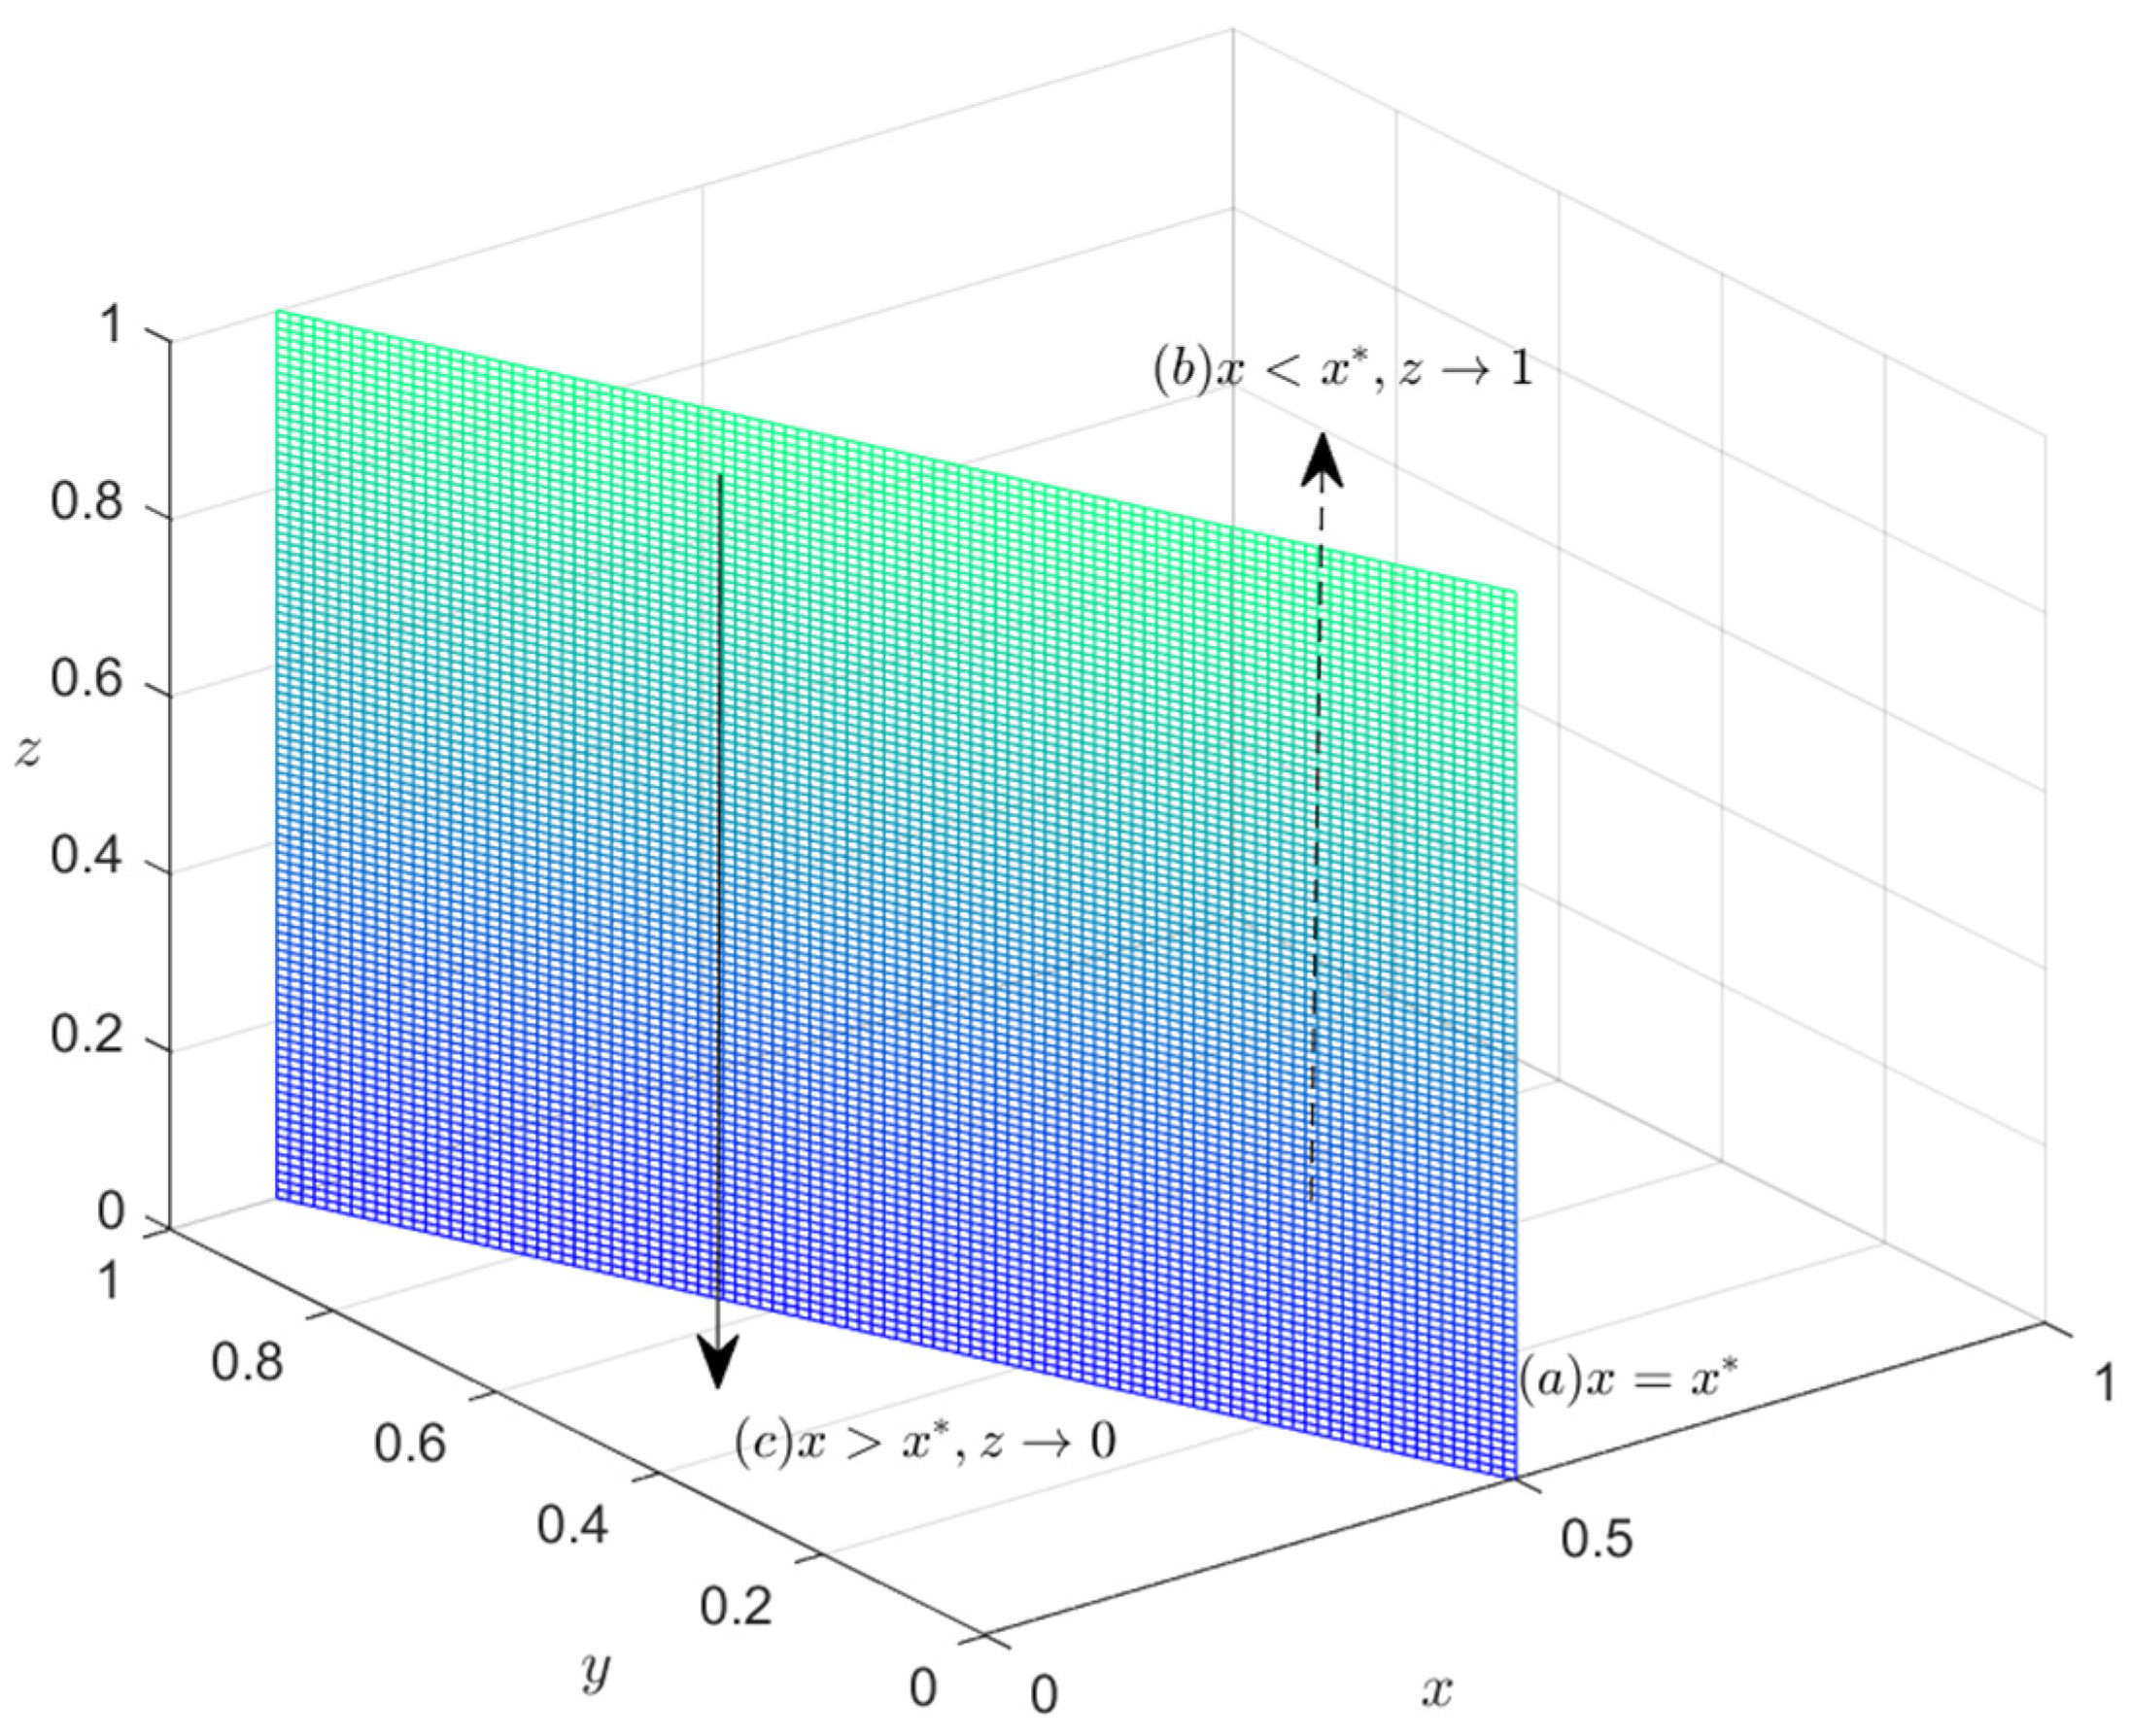
4.2. Manufacturer ESS Stability Analysis

For Equation (4), let I ( y , z ) = μ Π M + α C M C M + γ Q M z + ( η β b μ Π M P M ) y , so that Equation (4) can be written as H 1 ( x , y , z ) = x ( 1 x ) I ( y , z ) . And let I ( y , z ) = 0 have z * = ( μ Π M + P M η β b ) y μ Π M α C M + C M γ Q M .
Proposition 1. 
When  z * = ( μ Π M + P M η β b ) y μ Π M α C M + C M γ Q M , then  H 1 ( x , y , z ) 0 , which means that regardless of the initial percentage of green or NI by manufacturers, the strategies of manufacturers will not change over time; in other words, the system is always stable.
z * = ( μ Π M + P M η β b ) y μ Π M α C M + C M γ Q M
when  z = z * , I ( y , z ) = 0 , H 1 ( x , y , z ) = 0 .
If  0 < z < z * I ( y , z ) < 0 , H 1 ( x , y , z ) x = ( 1 2 x ) I ( y , z )  and  H 1 ( x , y , z ) x x = 0 < 0 , H 1 ( x , y , z ) x x = 1 > 0 , then  x = 0  is the equilibrium stable strategy.
If  z * < z < 1 I ( y , z ) > 0  and  H 1 ( x , y , z ) x x = 0 > 0 , H 1 ( x , y , z ) x x = 1 < 0 , then  x = 1  is the equilibrium stable strategy.
The evolution stability strategy of the manufacturer is shown in Figure 2.

4.3. Recycler ESS Stability Analysis

For Equation (8), let G ( x , z ) = θ Π R + α C R C R + γ Q R z + [ ( 1 η ) β b P R θ Π R ] x , so that Equation (8) can be written as H 2 ( x , y , z ) = y ( 1 y ) G ( x , z ) . And let G ( x , z ) = 0 have z * * = [ θ Π R + P R ( 1 η ) β b ] x μ Π R α C R + C R γ Q R .
Proposition 2. 
When  z = z * * = [ θ Π R + P R ( 1 η ) β b ] x μ Π R α C R + C R γ Q R , then  H 2 ( x , y , z ) 0 , which means that regardless of the initial percentage of green or NI by recyclers, the strategies of recyclers will not change over time; in other words, the system is always stable.
If  0 < z < z * * G ( x , z ) < 0 , H 2 ( x , y , z ) y = ( 1 2 y ) G ( x , z )  and  H 2 ( x , y , z ) y y = 0 < 0 , H 2 ( x , y , z ) y y = 1 > 0 , then  y = 0  is the  equilibrium  stable strategy.
If  z * * < z < 1 G ( x , z ) > 0  and  H 2 ( x , y , z ) y y = 0 > 0 , H 2 ( x , y , z ) y y = 1 < 0 , then  y = 1  is the equilibrium stable strategy.
The evolution stability strategy of the manufacturer is shown in Figure 3.

4.4. Government ESS Stability Analysis

For Equation (12), let F ( x , y ) = γ ( Q M + Q M ) C G γ Q M x γ Q R y , so that Equation (12) can be written as H 2 ( x , y , z ) = z ( 1 z ) F ( x , y ) . And let F ( x , y ) = 0 have x * = γ ( Q M + Q M ) C G γ Q R y γ Q M .
Proposition 3. 
When  x = x * = γ ( Q M + Q M ) C G γ Q R y γ Q M , then  F ( x , y ) = 0 , H 3 ( x , y , z ) 0 , which means that regardless of the initial state, the strategies of local governments will not change; in other words, the system is always stable.
If  0 < x < x * F ( x , y ) > 0 , H 3 ( x , y , z ) z = ( 1 2 z ) F ( x , y ) , and  H 3 ( x , y , z ) z z = 0 > 0 , H 3 ( x , y , z ) z z = 1 < 0 , then  z = 1  is the equilibrium stable strategy.
If  x * < x < 1 F ( x , y ) < 0  and  H 3 ( x , y , z ) z z = 0 < 0 , H 3 ( x , y , z ) z z = 1 > 0 , then  z = 0  is the equilibrium stable strategy.
The evolution stability of the government is shown in Figure 4.

4.5. Stability Analysis of the System ESS

From the analysis, we can solve for the three-dimensional dynamical system (Equation (14)). Let H 1 ( x , y , z ) = 0 , H 2 ( x , y , z ) = 0 , and H 3 ( x , y , z ) = 0 . Since for an asymmetric game, if the evolutionary game equilibrium is asymptotically stable, then the equilibrium must be satisfied as a strict Nash equilibrium. Therefore, we can obtain eight local equilibrium points:
E 1 ( 0 , 0 , 0 ) , E 2 ( 1 , 0 , 0 ) , E 3 ( 0 , 1 , 0 ) , E 4 ( 0 , 0 , 1 ) , E 5 ( 1 , 1 , 0 ) , E 6 ( 1 , 0 , 1 ) , E 7 ( 0 , 1 , 1 ) , E 8 ( 1 , 1 , 1 ) . As GI in the power battery CLSC evolves, individuals continuously adjust their strategy for their own interests.
According to Lyapunov’s law, if the eigenvalues only have negative real parts [52], i.e., λ i < 0 , then the equilibrium point is the asymptotically stable point of the evolutionary game system; if the eigenvalues only have positive real parts, i.e., λ i > 0 , then the equilibrium point is the unstable point; and if the eigenvalues have both negative and positive real parts, then the equilibrium point is the saddle point [53]. Then a Jacobian matrix can be constructed as shown in Equation (15).
J = H 1 ( x , y , z ) x H 1 ( x , y , z ) y H 1 ( x , y , z ) z H 2 ( x , y , z ) x H 2 ( x , y , z ) y H 2 ( x , y , z ) z H 3 ( x , y , z ) x H 3 ( x , y , z ) y H 3 ( x , y , z ) z = ( 1 2 x ) [ μ Π M + α C M C M + γ Q M z + ( η β b μ Π M P M ) y ] x ( 1 x ) ( η β b μ Π M P M ) x ( 1 x ) γ Q M y ( 1 y ) [ ( 1 η ) β b P R θ Π R ] ( 1 2 y ) [ θ Π R + α C R C R + γ Q R z + ( ( 1 η ) β b P R θ Π R ) x ] y ( 1 y ) γ Q R z ( z 1 ) γ Q M z ( z 1 ) γ Q R ( 1 2 z ) [ γ ( Q M + Q R ) C G γ Q M x γ Q R y ]
The eigenvalues corresponding to each equilibrium point were obtained by substituting the equilibrium points E 1 ~ 8 into Equation (15) separately, as shown in Table 3.
By observing, we could know that the eigenvalues λ 3 of E 6 ( 1 , 0 , 1 ) , E 7 ( 0 , 1 , 1 ) , and E 8 ( 1 , 1 , 1 ) are positive under the assumption γ Q M < C G ; γ Q M < C G . Therefore, it is just required to analyze the conditions when the rest of the five points are ESS; the stability conditions are shown in Table 4.
According to the eigenvalues of the Jacobian matrix, there are the following five scenarios:
Scenario 1. 
When  μ Π M + α C M < C M ; θ Π R + α C R < C R ; γ Q M + γ Q M < C G , the replication of the dynamic system presents stability point  E 1 ( 0 , 0 , 0 ) . The manufacturer will choose non-green investment when the sum of green subsidy  α C M  received from the government and the additional benefits it receives from its single GI is more than the manufacturer’s GI cost  C M , i.e.,  μ Π M + α C M < C M . According to the inequality  θ Π R + α C R < C R , when the cost  C R  of a recycler’s GI is greater than the sum of the government’s subsidy  α C R  for its GI and the additional benefits  θ Π R , the recycler will choose a “non-green investment” strategy. At the same time, when the cost of government green regulation  C G  is higher than the sum of carbon tax  γ Q M + γ Q R  paid by the manufacturer and recycler, who do not make green investments under the government green regulation condition, i.e., when condition  γ Q M + γ Q M < C G  is satisfied, the government will choose an NR strategy.
Scenario 2. 
When  α C M + μ Π M > C M , α C R + ( 1 η ) β b < C R + P R , the replication of the dynamic system presents stability point  E 2 ( 1 , 0 , 0 ) . The manufacturer will choose a GI strategy if the investment cost  C M  of the manufacturer is less than the sum of the green subsidy  α C M  it receives from the government and the additional benefits it receives from its single GI, i.e.,  C M < α C M + μ Π M . According to the inequality  α C R + ( 1 η ) β b < C R + P R , when the cost  C R  of a recycler’s GI is greater than the sum of the subsidy  α C R  for its GI and the synergistic benefit  ( 1 η ) β b  of both sides making green investments, the recycler will choose a “non-green investment” strategy. At the same time, if the green regulation cost  C G  is higher than the carbon tax  γ Q R  paid by recyclers not making green investments under the government green regulation condition, i.e., when condition  γ Q R < C G  is satisfied, the government will adopt an NR strategy.
Scenario 3. 
When  α C M + η β b < C M + P M , C R < α C R + θ Π R , the replication of the dynamic system presents stability point  E 3 ( 0 , 1 , 0 ) . If the cost of investment for the manufacturer  C M  is higher than the sum of the green subsidy  α C M  it receives from the government and the green synergistic  η β b , i.e.,  α C M + η β b < C M + P M , then the manufacturer will choose a “non-green investment” strategy. At the same time, if the cost of GI for the recycler  C R  is less than the sum of the green subsidy  α C R  and the additional benefits  θ Π R  it would receive if it were to adopt GI alone, i.e.,  C R < α C R + θ Π R , then the recycler will choose a “green investment” strategy. On this basis, if the cost of government green regulation  C G  is higher than the carbon tax  γ Q M  and the manufacturer would pay if it did not invest in green, i.e.,  γ Q M < C G , then the government will choose an NR strategy.
Scenario 4. 
When  μ Π M + α C M + γ Q M < C M , θ Π R + α C R + γ Q R < C R , C G < γ Q M + γ Q R , the replication of the dynamic system presents stability point  E 4 ( 0 , 0 , 1 ) . If the cost of the manufacturer to adopt a GI strategy is above the sum of the additional benefits  μ Π M  and government green subsidies  α C M  due to GI and the carbon tax  γ Q M  paid by the manufacturer for “non-green investment”, i.e.,  μ Π M + α C M + γ Q M < C M , the manufacturer will choose an NI strategy. Similarly, if the cost of GI for the recycler  C R  is higher than the sum of the additional benefits  θ Π R  and government green subsidies  α C R  due to GI and the carbon tax  γ Q R  paid by the recycler for not green investing, i.e.,  θ Π R + α C R + γ Q R < C R , the recycler will choose a non-green investment strategy. On the other hand, when the cost of government to green regulate  C G  is less than the sum of the carbon taxes  γ Q M + γ Q R  paid by the manufacturer and the recycler for not investing green, i.e.,  C G < γ Q M + γ Q R , the government will choose a green regulation strategy.
Scenario 5. 
When  C M + P M < α C M + η β b , C R + P R < α C R + ( 1 η ) β b , the replication the of dynamic system presents stability point  E 5 ( 1 , 1 , 0 ) . If the sum of the subsidy that the manufacturer received for GI  α C M  and synergy benefits  η β b  is greater than the sum of the manufacturer’s GI cost  C M  and the free-rider benefits  P M  of choosing an NI strategy, i.e.,  C M + P M < α C M + η β b , the manufacturer will adopt a GI strategy. Similarly, the recycler will choose a “green investment” strategy if the sum of the government subsidy to the recycler for GI  α C R  and the synergy benefits  ( 1 η ) β b  is greater than the sum of the recycler’s GI cost  C R  and the free-rider benefit  P R , i.e.,  C R + P R < α C R + ( 1 η ) β b .
As shown in Table 3, Scenario 1 is similar to the initial stage of a green CLSC. Each target is not sufficiently green conscious and therefore not motivated to participate in the GI and management of the CLSC. Scenarios 2–4 are similar to the development stage of a green CLSC. Each agent starts to participate in GI and green regulation. Scenario 5 is similar to the maturity stage of a green CLSC. At this point, even if government regulation is not mandatory, manufacturers and recyclers are consciously implementing GIs in the CLSC, which maximize the synergy between the development of the CLSC and the cost of government regulation.

5. Simulation Analysis

In this section, simulation experiments have been performed with MATLAB 2016a. Since the focus of the EGT is to explore the evolutionary trend, the specific parameters of different scenarios of the study are set according to the principle of simulation [10], as shown in Table 5. Moreover, to simplify the analysis, here let η = 0.5 , β = 1 .

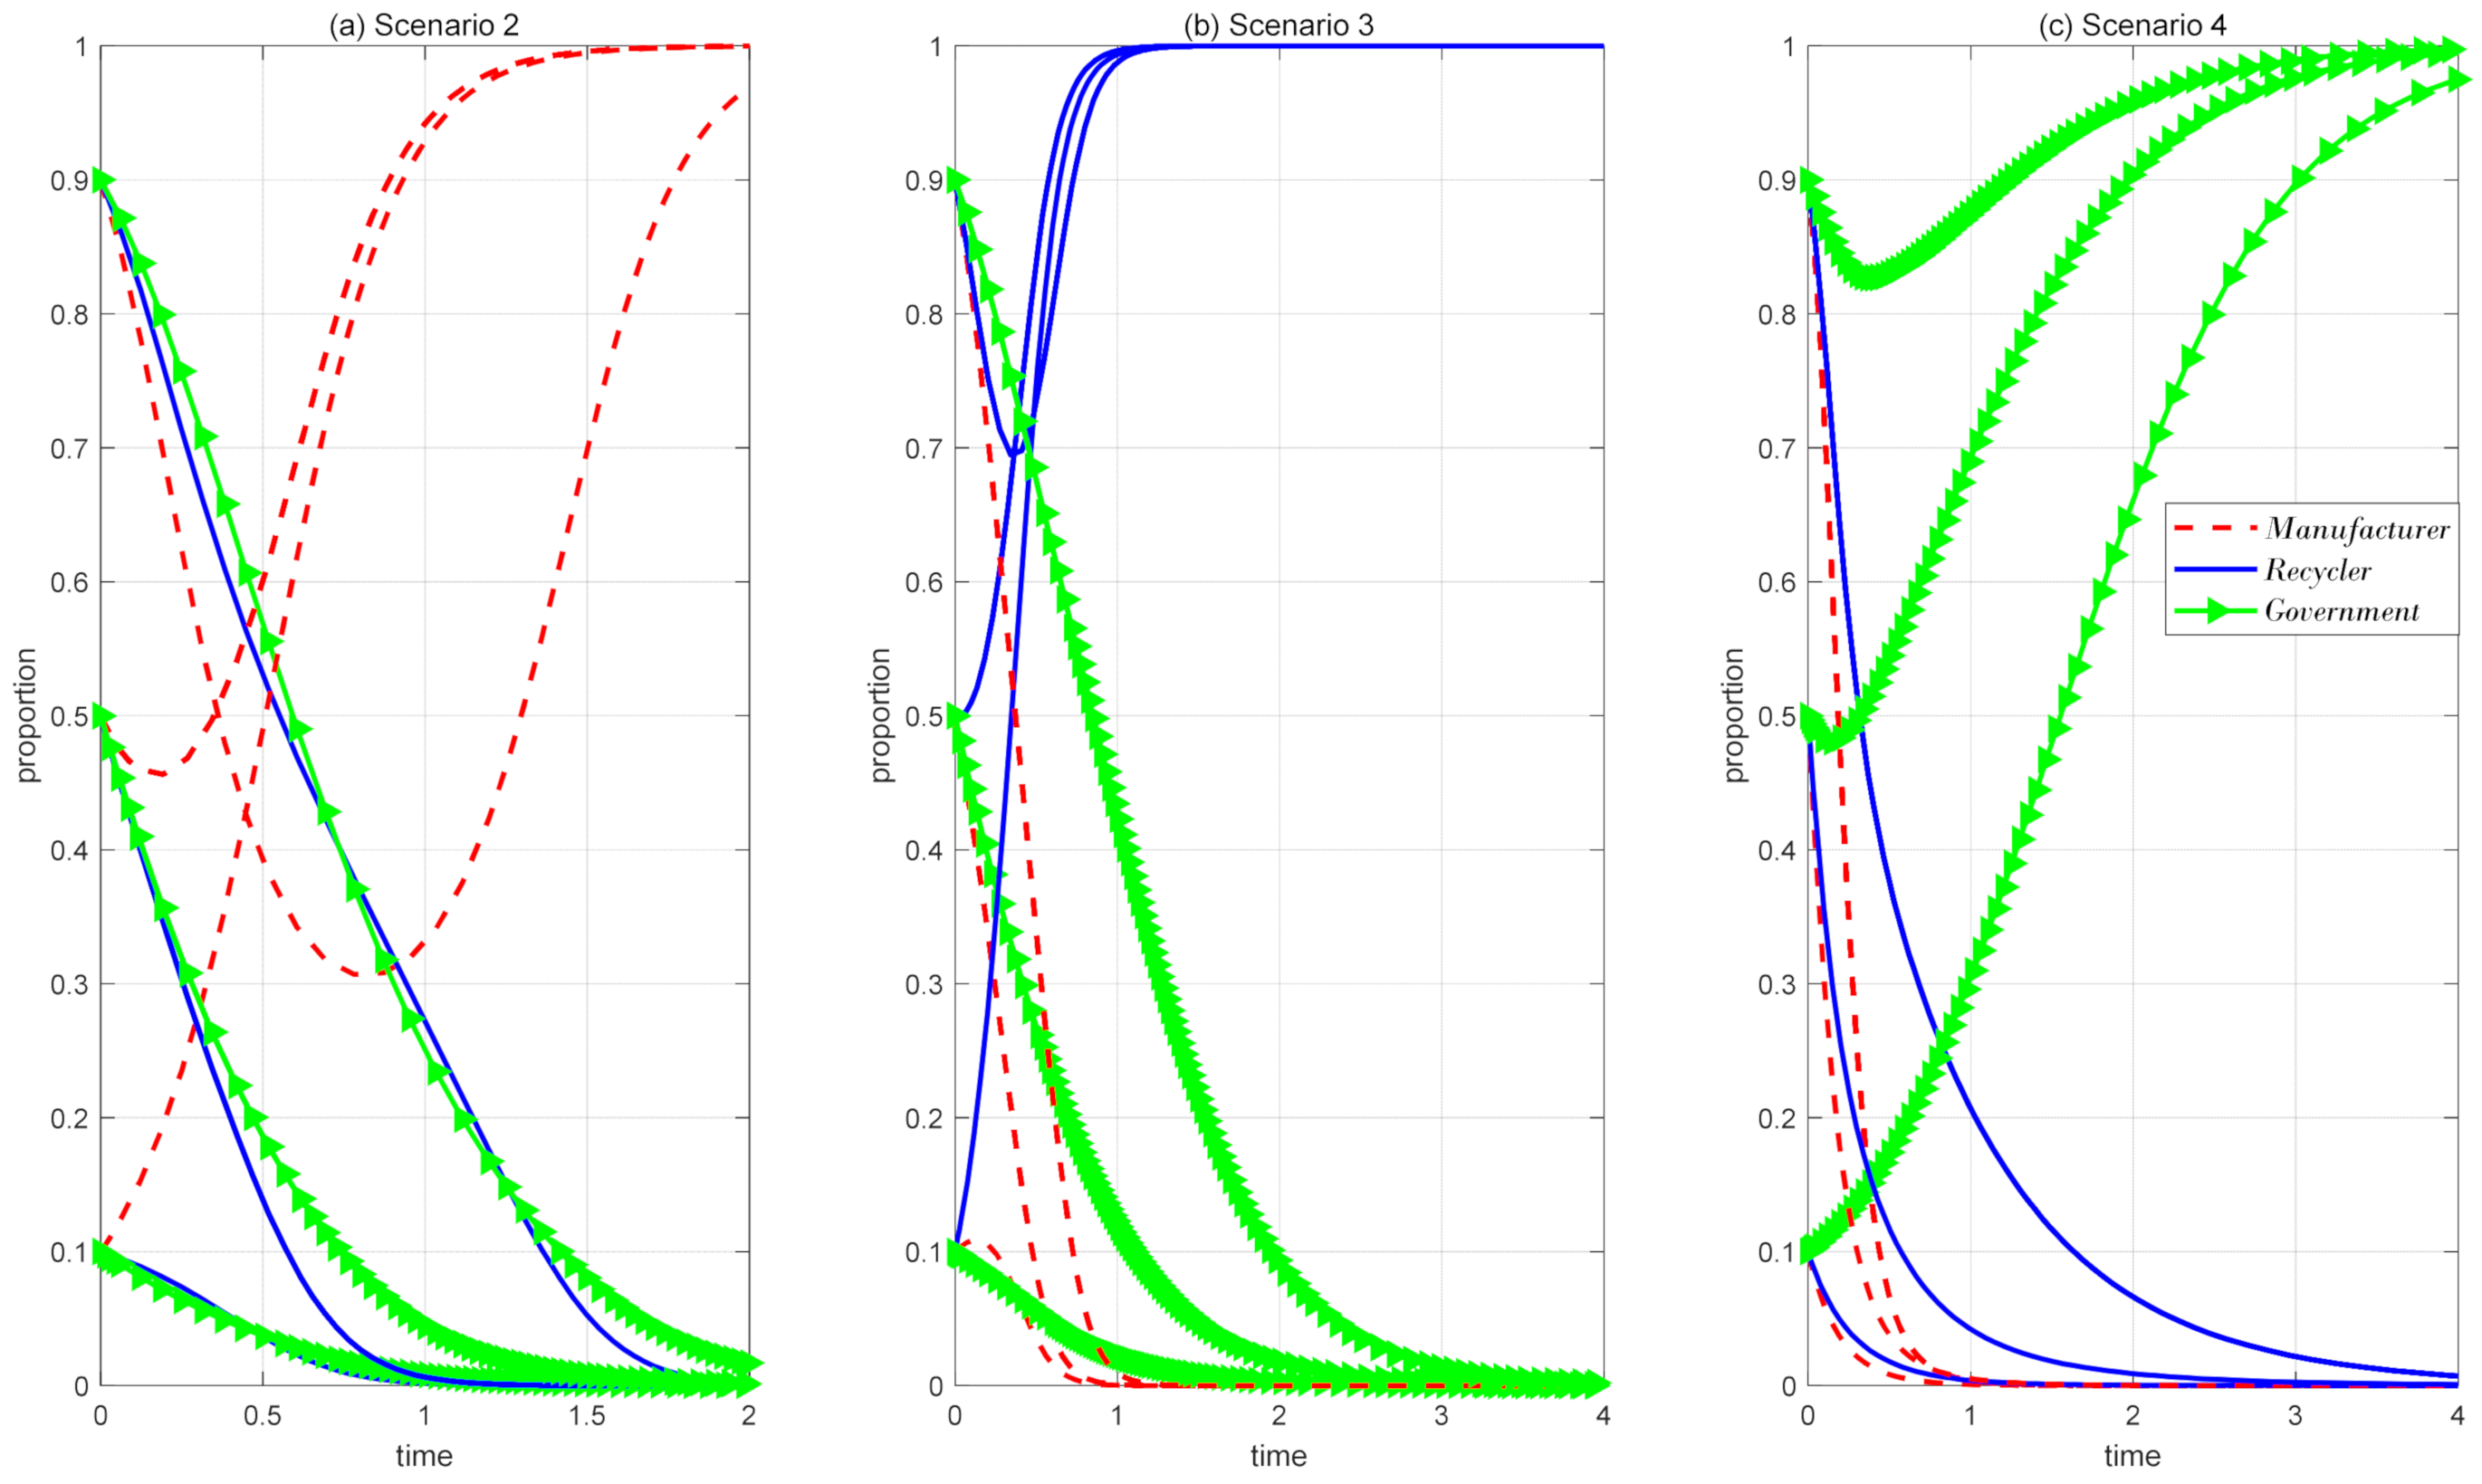
5.1. Analysis of Each Period

In the early period, the parameter values are set to Scenario 1 in Table 5. In order to ensure the stability of the simulation results, the initial probability of the evolutionary game analysis is taken as ( 0.1 ,   0.5 ,   0.9 ) , and the numerical simulation is shown in Figure 5.
As shown in Figure 4, regardless of the initial probability of the ternary system, the equilibrium state E 1 ( 0 , 0 , 0 ) will be finally reached in Scenario 1. The result indicates that the manufacturer and recycler tend to choose NI, while the government tends to prefer NR, when the cost of GI in power battery recycling is higher than the government subsidy and investment benefit, and when the cost of green regulation by the government is higher than the green benefit. In addition, it can be observed that the manufacturer’s decision reaches a steady state the fastest, the probability that the recycler chooses NI evolves to 0 at a faster rate, and the government takes the longest time to choose NR because it needs to act against the impacts of the recycler’s and the manufacturer’s decisions before the government’s decision evolves to stability.
In the transition period, with the implementation of government green subsidies and carbon tax policies gradually making up for the cost of GI costs and reducing the burden of government green regulation, manufacturers, recyclers, and the government will gradually change their strategies to choose GI and regulation. The parameter values of the evolutionary paths for the tripartite decisions in the transition phase are set as Scenario 2–4 in Table 5, respectively. As in the simulation test analysis of Scenario 1, the three values of the initial probability of the evolutionary game analysis in different scenarios are chosen ( 0.1 ,   0.5 ,   0.9 ) , and the evolutionary paths are presented as a, b, and c in Figure 6.
Figure 6a shows that at the initial probabilities of 0.5 and 0.9, the probability of green regulation by the manufacturer decreases and then increases, and finally evolves to 1. The recycler quickly evolves and reaches 0, and the government chooses NR green at a relatively slow speed.
Figure 6b shows that at the initial probability of ( 0.1 ,   0.5 ,   0.9 ) in the decision-making process, the manufacturer does not hesitate to choose an NI strategy; the recycler’s decision making ultimately chooses GI, but it is worth noting that in the initial probability of 0.9, the recycler’s likelihood of choosing GI is first reduced and then increased to stabilize to 1. The government’s green regulation probability depends on the evolution of the manufacturer and recycler to a steady state. The probability of government green regulation is 0 after the manufacturer and recycler evolve to a steady state.
Figure 6c shows that at initial probabilities of ( 0.1 ,   0.5 ,   0.9 ) , the probability of the manufacturer’s green regulation decreases and then increases to 1. The recycler’s decision quickly evolves to a steady state of 0, while the probability of the government’s green regulation gradually stabilizes to 1.
In the mature period, the deepening of the government’s green subsidies and the implementation of policies such as carbon tax promote the initiative of manufacturers and recyclers to invest in green, which makes the power battery recycling supply chain gradually improve. At this point, even if the government gradually phases out of regulation, manufacturers and recyclers still have enough initiative to choose GI to improve technology to reduce carbon emissions in the closed-loop recycling environment. In this period, the parameter values are set to Scenario 5 in Table 5.
As can be seen from Figure 7, for the same initial probability of ( 0.1 ,   0.5 ,   0.9 ) , respectively, for the simulation, the higher the initial probability of GI in the manufacturer’s decision making, the shorter its evolution to a steady state. It is worth noting that the recycler’s initial probability of GI of 0.5 ultimately evolved to the longest time of 1; when the initial probability was 0.1 and 0.9, it evolved to a steady state in almost the same time. For the government, the higher the probability of initial green regulation, the longer it took to evolve to 0.

5.2. Sensitivity Analysis

According to the stability analysis, stakeholders will eventually have different ESSs with factors changing. Since ( 1 , 1 , 0 ) is the ideal state, the initial value is set according to the conditions of Scenario 5.
In this section, we simulated the stakeholders’ evolutionary path and sensitivity analysis. In addition to this simulation, we discuss in this section the impact of green subsidy intensity, carbon tax rates, incentive bases, ‘free-rider’ benefits, GI and regulatory costs, and the rate of increase in the benefits of GI behavior on the evolutionary equilibrium.

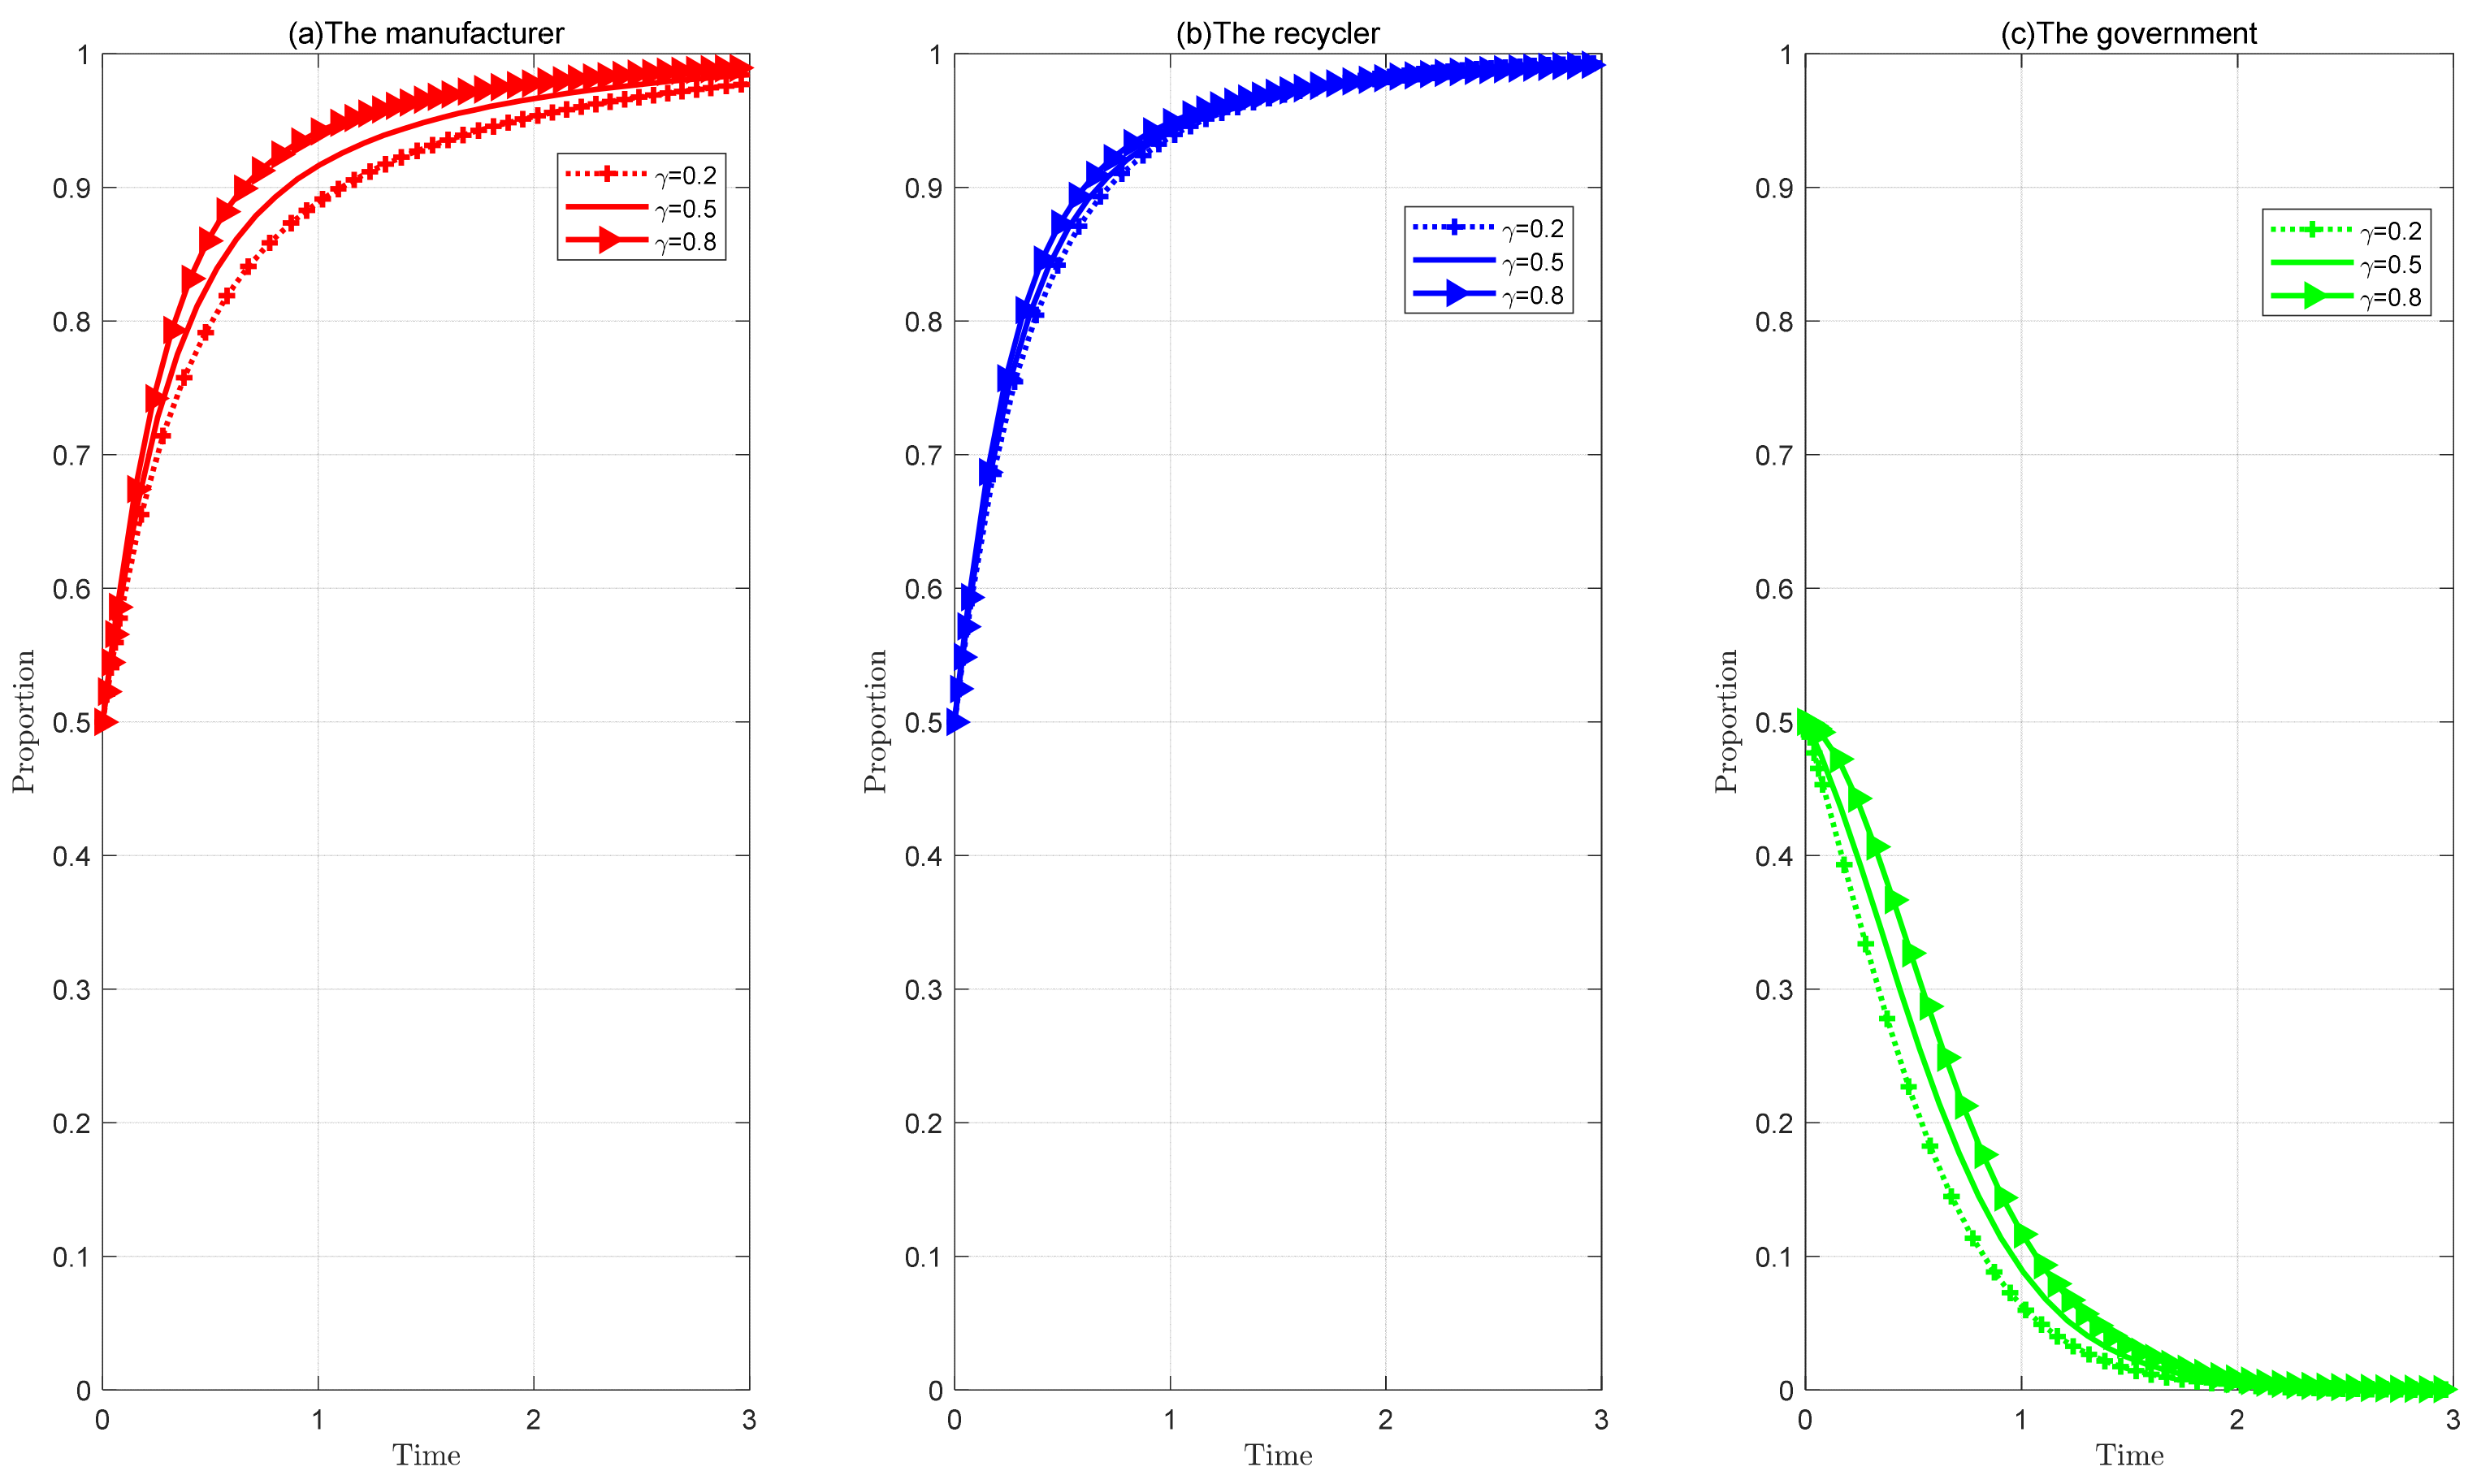
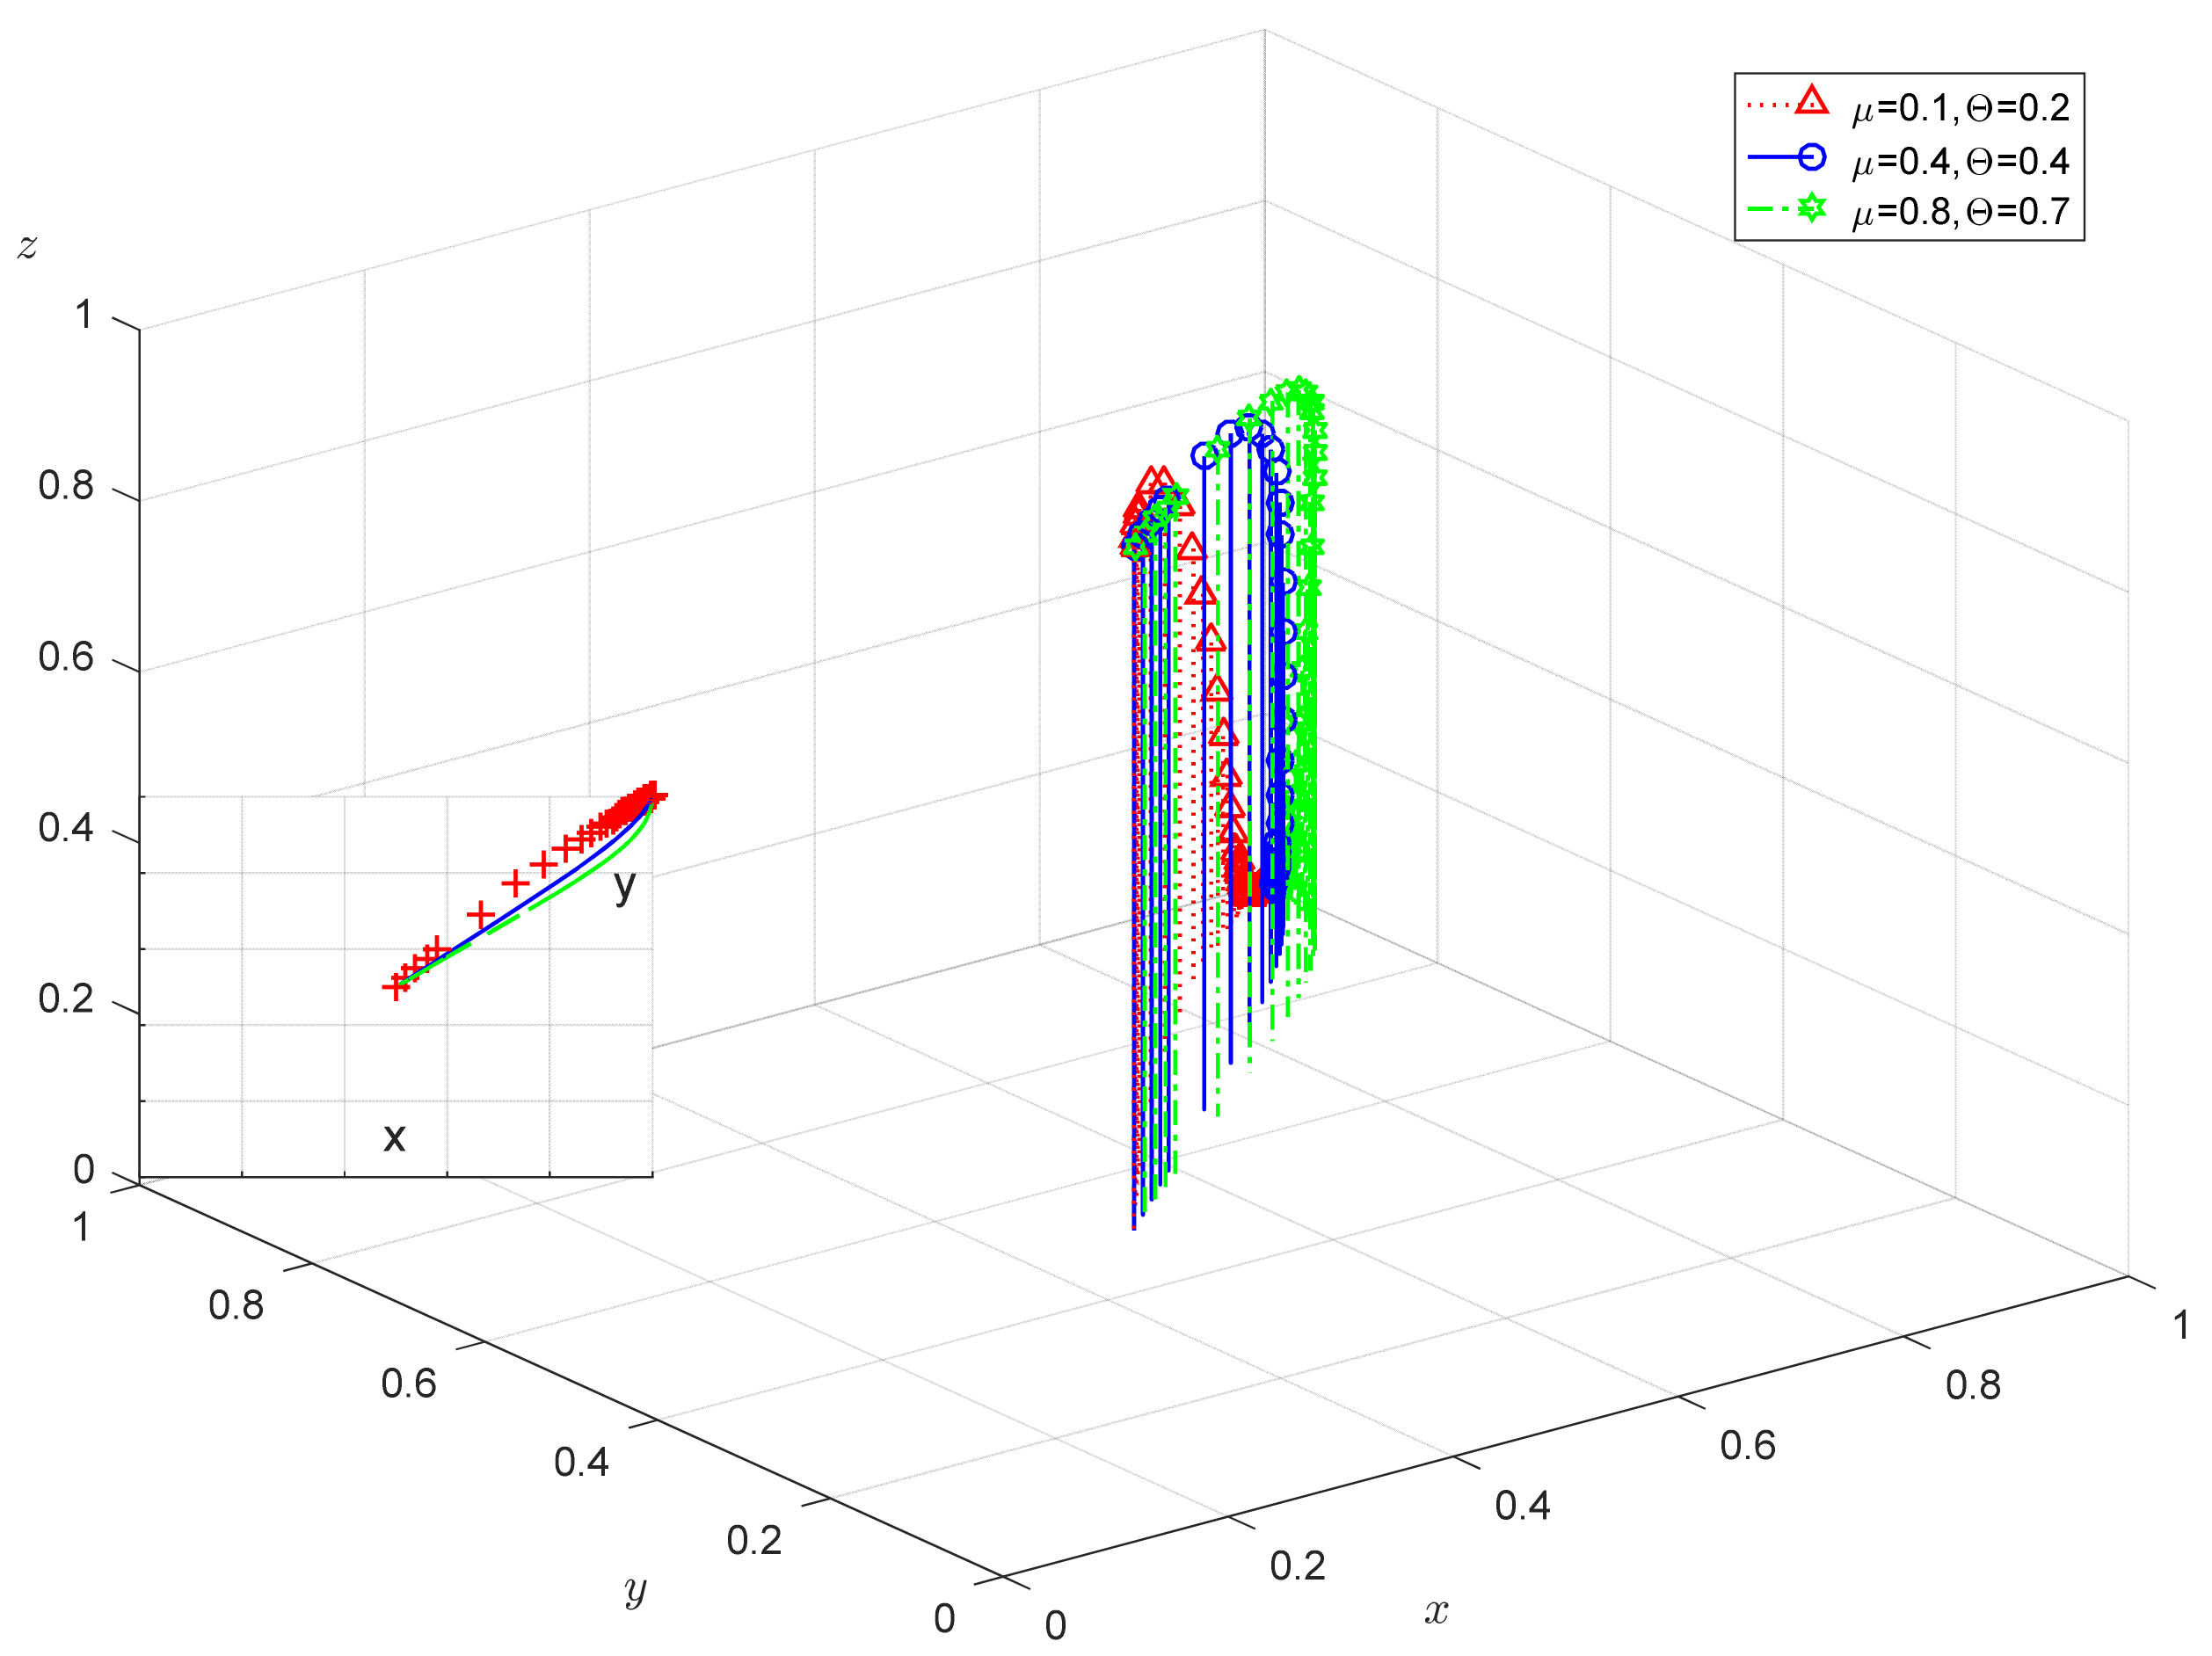
5.2.1. Impact of Subsidy Coefficient

According to Figure 8, as there is an increase in the value of α , the probability of GI of manufacturers and recyclers gradually increases; and the larger the value of α , the faster the final evolution of manufacturers and recyclers to 1. It is worth noting that when α < 0.5 , the manufacturer will ultimately choose NI. In building the closed-loop recycling channel for power batteries through GI, the value of α is mainly influenced by the degree of complementarity of green recycling technologies and the subject and complexity of green cooperation. However, there are technical barriers to the recycling of EVBs, and a large number of decommissioned power batteries to informal channels not only increases carbon emissions in the process of decommissioned batteries but also causes the metal resources not to be effectively recycled, increasing the potential for environmental pollution.
Therefore, the government needs to greatly support green innovation by constructing information sharing platforms and enhance green technology resource sharing and encourage complementary parties to collaborate on innovation, which is conducive to expanding the benefits of synergistic advantages, so as to achieve high-quality battery recycling technology collaborative innovation.

5.2.2. Impact of Tax Rate

Observing Figure 9, it can be seen that as the tax rate γ gradually increases, the possibility of GI for manufacturers gradually increases, the possibility of GI for recyclers gradually increases, the possibility of GI in enterprise technology gradually increases, the possibility of government green regulation gradually decreases, and the game system will converge to E 5 ( 1 , 1 , 0 ) .
According to research, carbon emissions from the production of power batteries account for about 19–20% of the production process of pure electric passenger vehicles, so it is crucial to reduce carbon emissions with EVB recycling. The implementation of a carbon tax could motivate manufacturers and recyclers to increase their investment in green technologies to reduce the carbon emissions of the battery supply chain. The higher the tax rate γ , the more excess carbon emission costs are generated, and the higher the incentive for firms to reduce carbon emissions through GI in technological advancement. Therefore, levying a carbon tax is an effective means for the government to guide enterprises’ green innovation and investment to reduce carbon emissions.

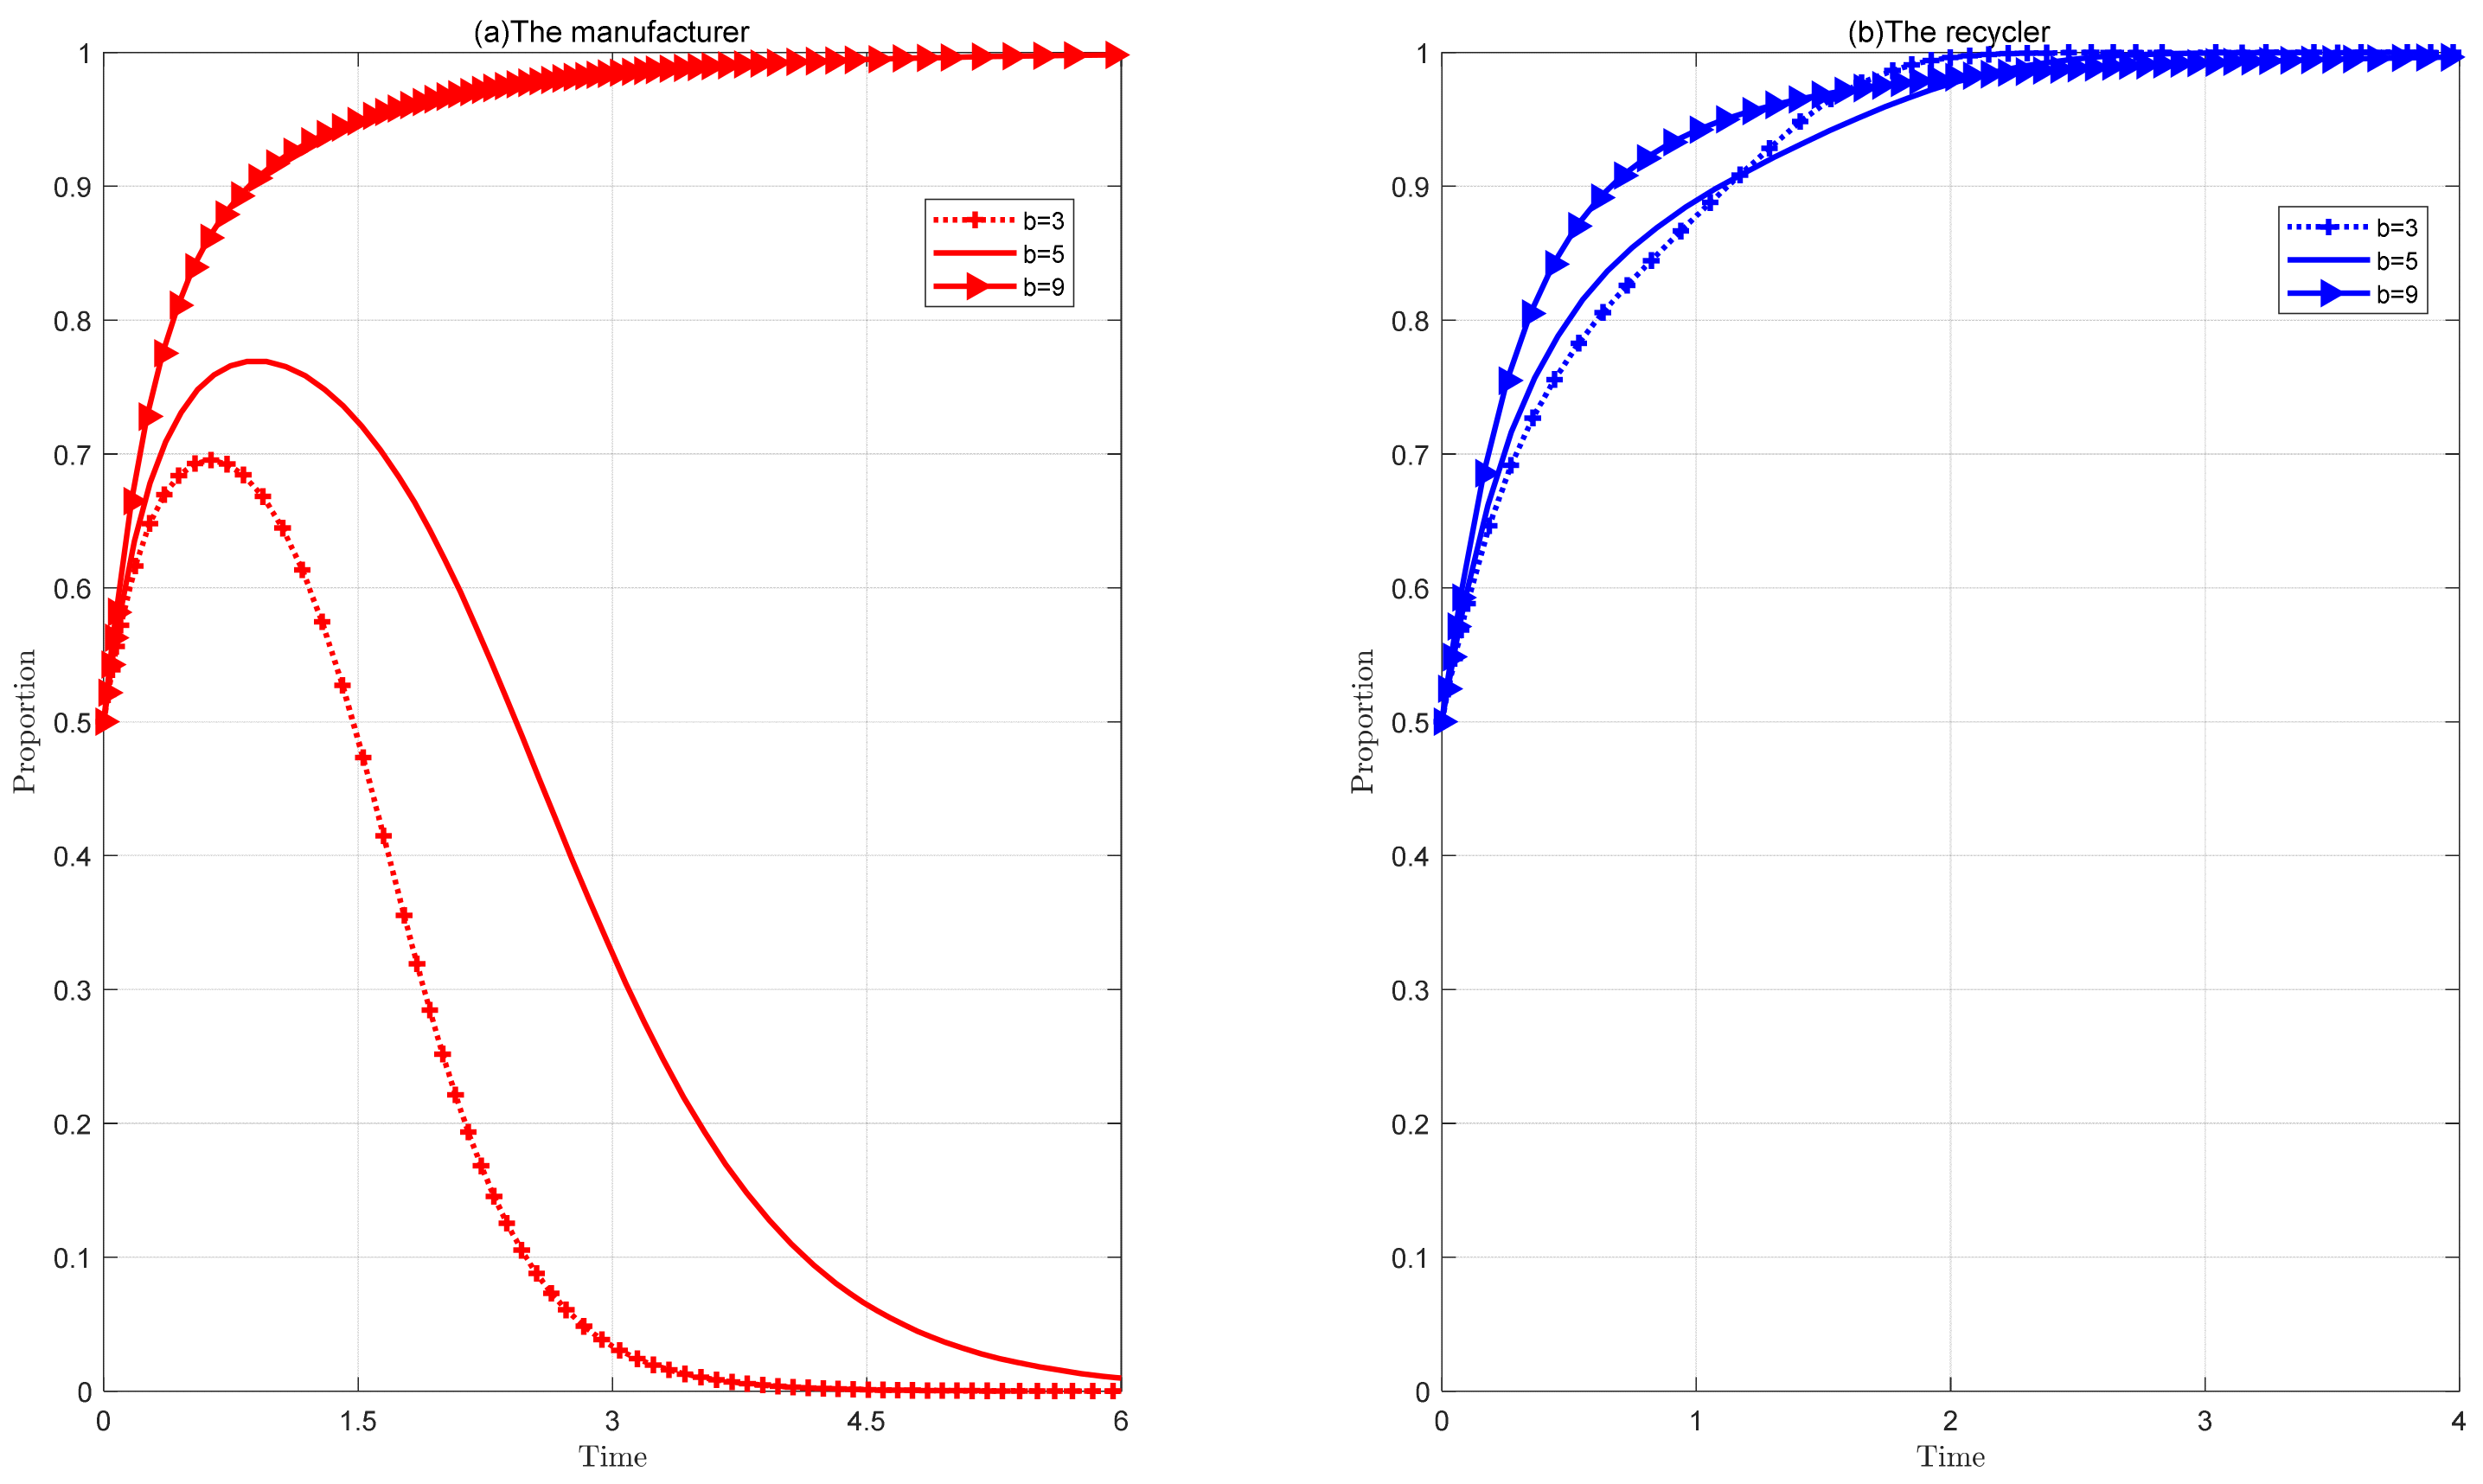
5.2.3. Impact of Synergy Benefits Base

When different types of agents in the CLSC collaborate and adopt a GI strategy, they contribute to the green emission reduction of the whole supply chain and create social benefits, and thus receive additional incentives for collaborative green innovation. By observing Figure 10, on the one hand, for manufacturers, the larger the incentive base b for collaborative GI is, the higher the probability of choosing “green investment”, and when b > 9 , manufacturers eventually evolve to 1, i.e., GI; and when b < 9 , manufacturers eventually evolve to 0, i.e., NI. On the other hand, for the same value of b , the larger the recycler is, the shorter the time for the recycler to evolve to the stable state, and the final evolution result is 1, i.e., “green investment”. The comparison also shows that recyclers are less sensitive to changes in b than manufacturers.
Because both groups of enterprises in CLSC adopting a green investment strategy will have the effect of “1 + 1 > 2”, and the government will receive more environmental benefits, the government prefers manufacturers and recyclers to choose technology investment at the same time. To achieve this status, the government could encourage manufacturers and recyclers to enhance their incentives to reduce emissions from green technologies by setting a higher incentive base b , thus increasing the green level of EV battery CLSC.

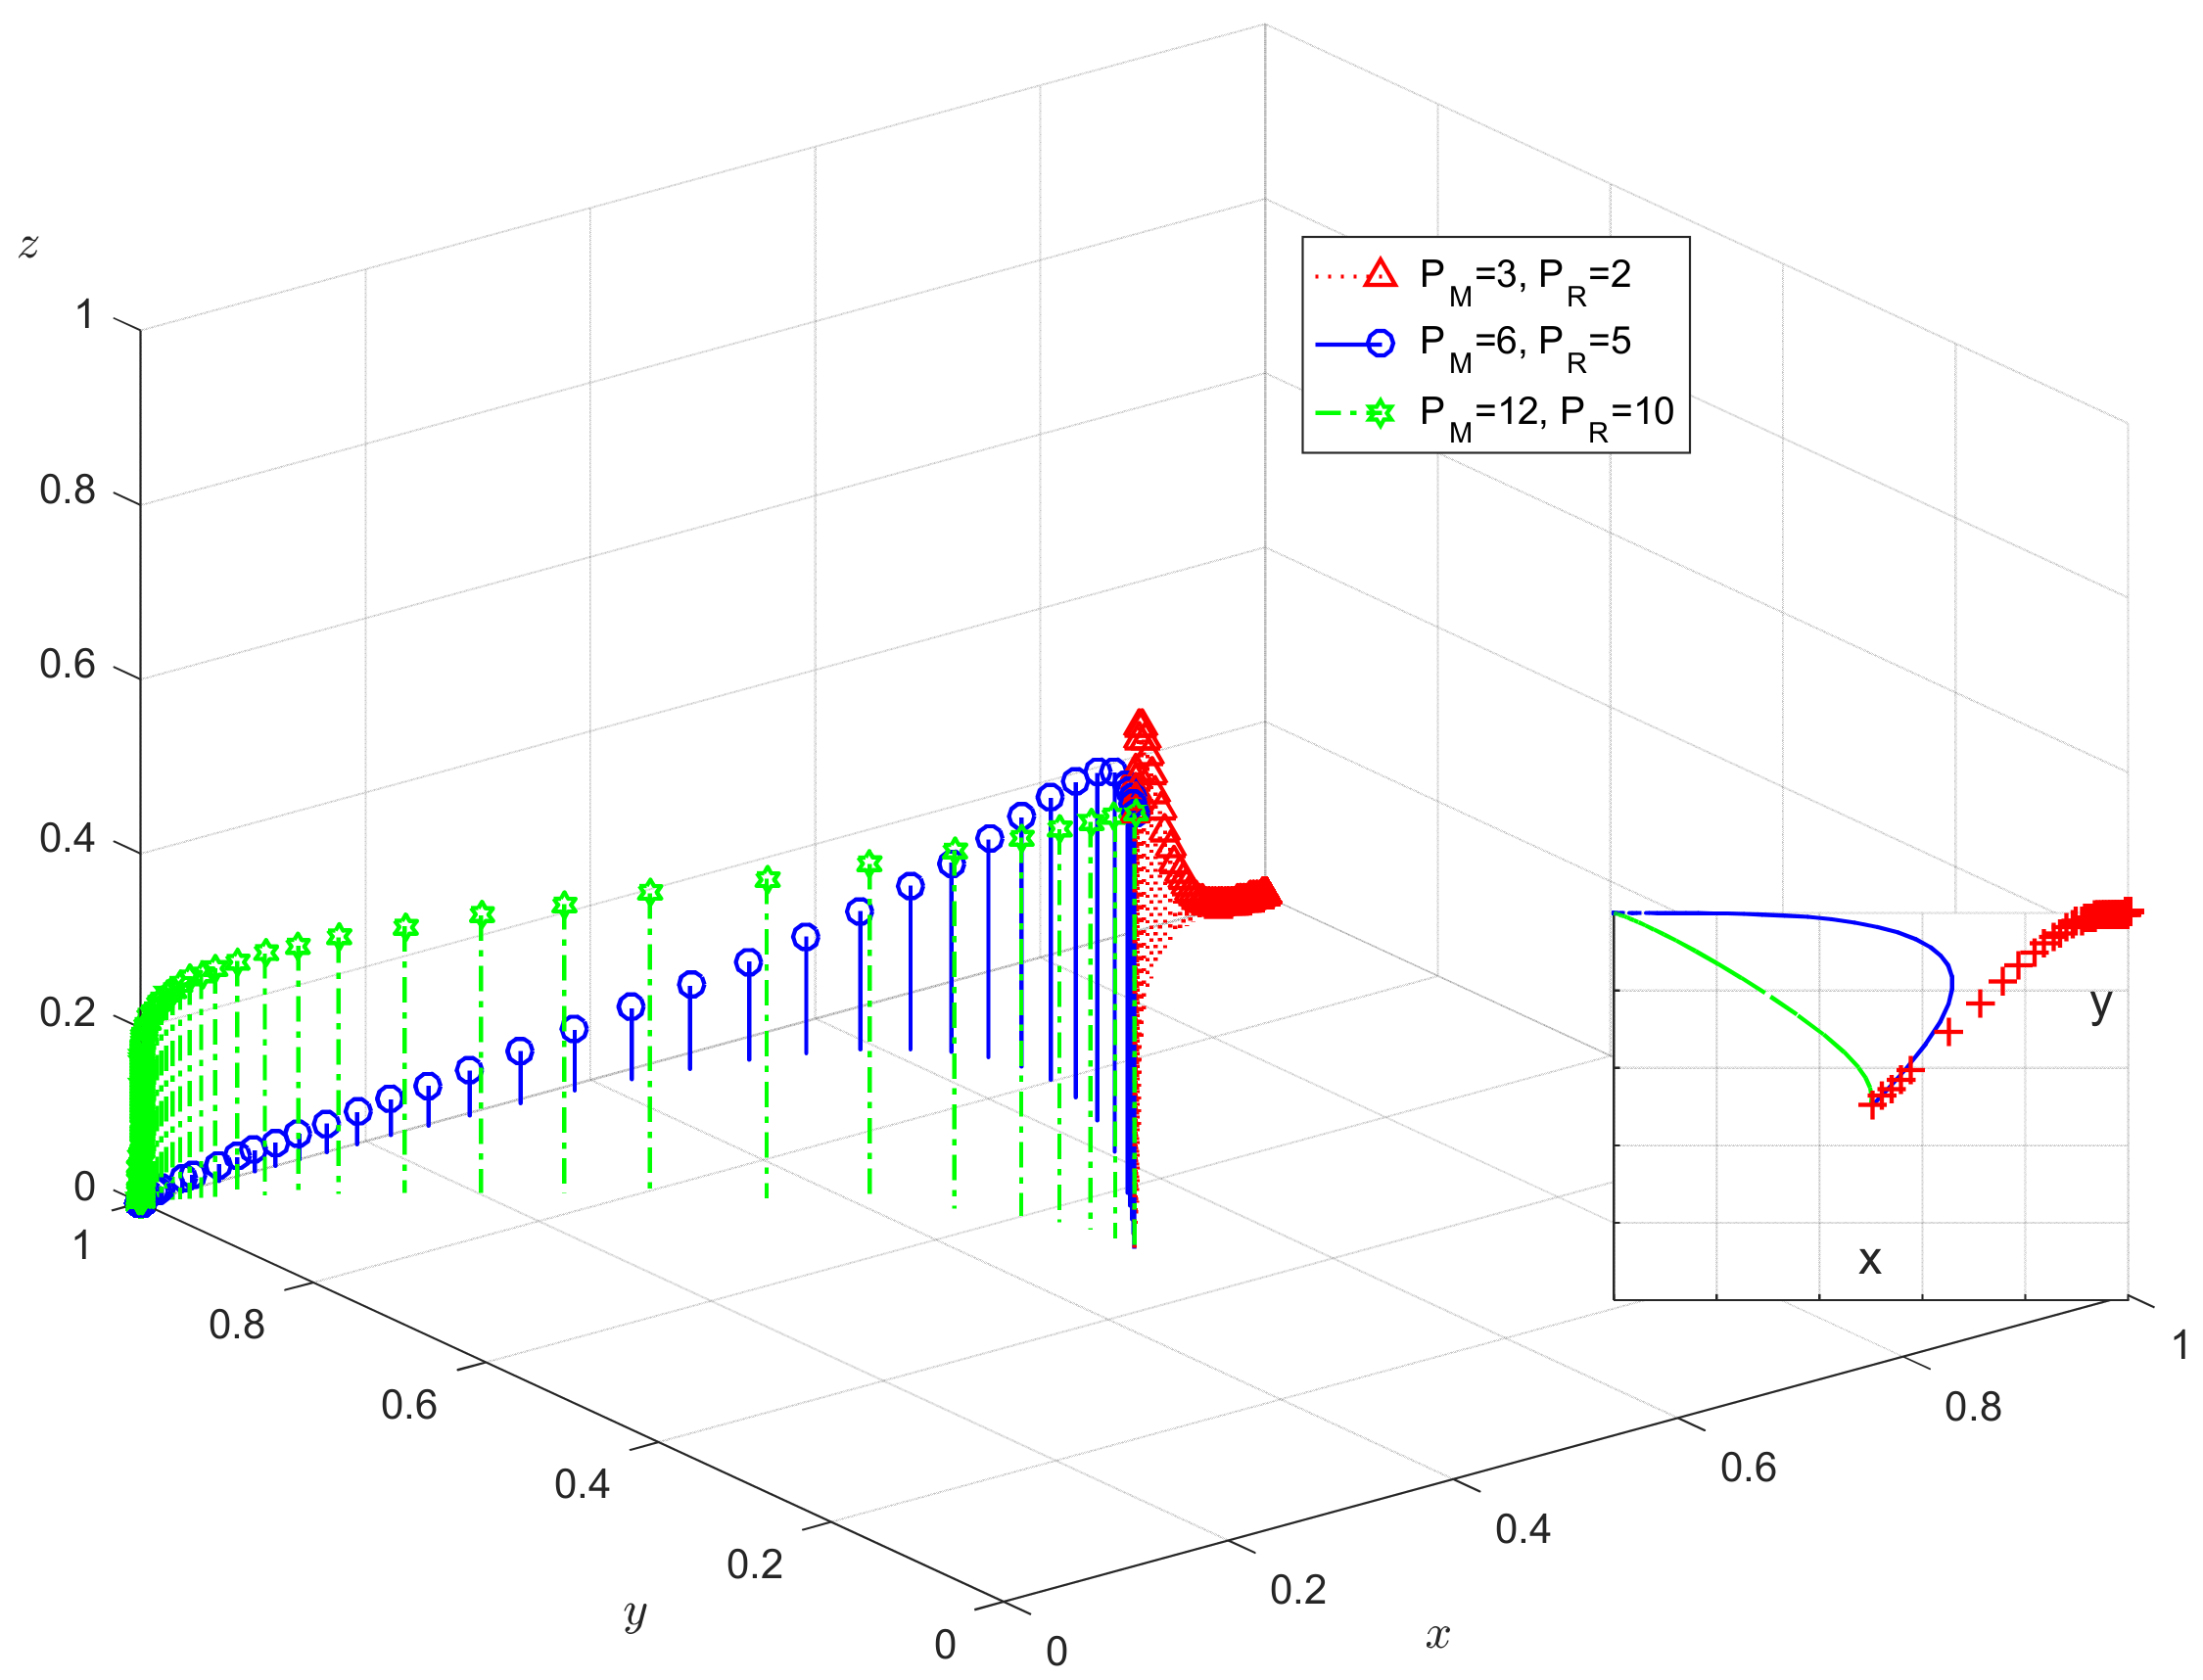
5.2.4. Impact of Free-Rider Benefits

With the parameter-setting range satisfied with Scenario 5, Figure 11 shows that with green investment in power battery CLSC, manufacturers will be the first to change their decision making from initial GI to NI as the free-rider benefit of green investment increases. In addition, manufacturers will be the first to change their decision making from initial GI to NI. In addition, as P R increases, it will discourage recyclers from investing in green investments and reduce the rate of evolution to 1. As seen in Figure 10, only when P M = 3 , P R = 2 can the three parties eventually evolve to the ideal state E 5 ( 1 , 1 , 0 ) after repeated games; that is, the manufacturer and recycler choose GI, and the government chooses NR.

5.2.5. Impacts of Green Costs

Under the parameter conditions of Scenario 5, observing Figure 12, when changing the green investment cost of manufacturers and recyclers and the value of government green regulation, respectively, it is not difficult to find that when the green cost is very small, manufacturers and recyclers will choose green investment, and at the same time, due to the low cost of government green regulation, in the initial period, the government may increase the probability of green regulation to guide enterprises to green investment; as enterprises take the initiative to adopt green investment, the government will gradually withdraw from regulation, and the game system will eventually evolve to the ideal state ( 1 , 1 , 0 ) . In addition, as the cost of green investment increases, it affects the green decisions of manufacturers and recyclers, resulting in a shift in their strategies from GI to NI.
It can be noted that the cost is important to green innovation of EVB recycling enterprises. This is due to the control of the waste battery treatment process being prone to environmental pollution; the national battery treatment has more stringent requirements, recycling enterprises need to spend a lot of capital on recycling and utilizing technology reform, upgrading, and equipment renewal, etc., and the initial government subsidies are far from meeting the investment needs of enterprises, hindering the enthusiasm of enterprises to invest in green innovation.

5.2.6. Impact of Benefits Increases Coefficient from Green Investments

When the rest of the parameter values are taken to satisfy Scenario 5, only the μ and theta values are varied to examine the evolutionary path. According to Figure 13, it can be seen that the larger μ is, the faster x converges to 1, and the larger θ theta is, the faster y converges to 1. The magnitude of the rate of increase in the benefits of green innovation alone does not affect the final evolutionary outcome for manufacturers and recyclers as well as the government.
It can be seen that in the process of green innovation in the closed-loop supply chain of new energy vehicle power batteries, the main factor that affects the green investment decision of manufacturers and recyclers is not the rate of increase of the return of their individual investment; on the contrary, the magnitude of their “free-rider” benefits can affect the investment battery recycling enterprises.

6. Discussion and Policy Implications

6.1. Discussion

In this study, an EGT model is presented to evaluate the decision-making behavior of enterprises and the government in EV battery recycling CLSC. It aims to find the optimal green strategy through a tripartite evolutionary game, which simulates and analyses the game between the government and enterprises at each stage of EV battery recycling. The results show that there are five stable scenarios corresponding to different periods of green investment in the closed-loop supply chain, including the early period, the transition period, and the mature period. It was observed that if the cost of government green regulation exceeds the environmental benefits and fines, the government may choose to abandon the green regulation of power battery recycling. This could leave manufacturers and recyclers with insufficient incentives for green investment, resulting in a threefold strategy of no green investment, no green investment, and no green regulation. However, with the improvement of the government’s reward and punishment mechanism for green investment and the effective implementation of the carbon tax policy, the government will gradually withdraw from regulation. This will eventually lead to a scenario of green investment, green investment, and no green regulation. This would allow battery manufacturers and recyclers to spontaneously carry out green investment activities without mandatory government regulation, which can better promote the realization of the green goal of low-carbon emissions in the lifecycle of new energy vehicles. Based on the above results, the following conclusions can be drawn:
1. For certain values of parameters, the size of the initial probability does not affect the ultimate consequences of the tripartite evolution, but may only contribute to the speed of the evolution.
2. Based on the green decision making of the government and power battery recycling-related enterprises, green investment in the closed-loop supply chain can be divided into three phases: the early period, the development period, and the mature period. The optimal strategy set for manufacturers, recyclers, and government is (GI, GI, NR), at which time the EVB green recycling market is gradually mature and stable, the government is gradually downplaying the regulatory efforts so that the regulatory costs are greatly reduced, and the manufacturers and recyclers are able to actively invest in green investment to obtain a greater green reward.
3. Government subsidy intensity affects the final decision of green investment of closed-loop supply chain firms. Generally speaking, the higher the coefficient of subsidy intensity, the higher the willingness of enterprises on both sides to participate in green investment. When the subsidy coefficient is less than 0.5, manufacturers will be the first to give up the green investment strategy, which also indicates that manufacturers are more sensitive to government subsidy intensity than recyclers.
4. The synergistic benefits when both enterprises jointly adopt green investment have a significant impact on the manufacturers’ decisions. Our results show that manufacturers will not choose green investment when the synergistic return base b = 3 , b = 5 , and only when the synergistic return base b > 9 will manufacturers choose a green investment strategy. And for recyclers, the larger b is, the faster they evolve to 1, which means the higher the willingness for green investment.
5. Increasing free-rider benefits and green costs deters manufacturers and recyclers from green investments. When both sides of the free-riding benefit is very small, both the manufacturer and the recycler eventually evolve to 1; however, as the mutual free-riding benefit gradually increases and the manufacturers’ free-riding benefit is higher than the recyclers’, the possibility of the manufacturers’ green investment initially increases and then decreases to 0, while the recyclers’ possibility of green investment gradually increases; when the free-riding benefit continues to increase, the possibility of the manufacturers’ green investment rapidly decreases, while the recyclers’ possibility of green investment increases. The reason for this may be that the recycler realizes that the manufacturer will choose not to invest green and therefore will not be able to free-ride, and will choose to invest green even though his free-rider gains are high.
6. Similarly, when the green costs are low, the system will eventually evolve to the optimal state, i.e., ( 1 , 1 , 0 ) , and as the green costs gradually increase, it will constrain the green investment strategy choices of both the manufacturer and the recycler, and the party with higher green investment costs will be the first one to give up the green investment strategy. Therefore, the scenarios of ( 1 , 0 , 0 ) and ( 0 , 1 , 0 ) will occur.

6.2. Policy Implications

In the context of promising EVB recycling industry, there are certain challenges with green investment in CLSC to be noticed. The battery recycling processes and technologies are still formative and lacking a maturity phase. However, due to the stringent standards imposed on battery treatment, recycling stakeholders are compelled to make substantial investments in technology transformation, equipment upgrades, and renewal. Regrettably, government subsidies during this period fall short of meeting the considerable financial demands, leading to a notable lack of motivation for green investment within power battery recycling enterprises. To address this issue effectively, several suggestions are proposed as follows:
First of all, the government should consider loosening the carbon quotas during the initial and transitional periods. In this way, the government could alleviate the financial burden faced by recycling enterprises and encourage them to invest more significantly in green technologies. Additionally, the government should bolster research and development efforts in EVB recycling technologies and provide monetary support, such as elevating the subsidy for green innovations. Furthermore, the implementation of carbon emission policies can serve as a potent tool to enhance the environmental consciousness of both power battery manufacturing and recycling enterprises. For instance, the government can institute carbon taxes based on the emission intensity associated with NEV usage and the EVB recycling process. Moreover, a carbon trading system can be introduced to reward companies that effectively reduce emissions, drawing inspiration from the “Notice on Carbon Emission Trading Pilot Work” program initiated in 2011 in Beijing, Tianjin, Shanghai, Shenzhen, Guangzhou, Hubei, and Chongqing in China.
Furthermore, with the maturity of the green CLSC for power batteries, it is expected that companies will increase their green investments by building factories and making capital acquisitions. Simultaneously, the government can consider gradually reducing the green regulations to mitigate costs for these enterprises. In view of the complexity of EVB recycling, it is imperative to anticipate the formation of strategic alliances between stakeholders across the CLSC. Through positive green investments, an innovative model featuring cost sharing and benefit sharing can be established, thereby promoting the green, sustainable, and high-quality development of the EVB recycling industry.

Author Contributions

Conceptualization, Y.Z. and Y.X.; methodology, Y.X.; software, Y.Z.; writing—original draft preparation, Y.Z.; writing—review and editing, Y.X. All authors have read and agreed to the published version of the manuscript.

Funding

This research was funded by 2023 Harbin University of Commerce Postgraduate Innovative Research Funding Project, grant number YJSCX2023-788HSD.

Institutional Review Board Statement

Not applicable.

Informed Consent Statement

Not applicable.

Data Availability Statement

Not applicable.

Conflicts of Interest

The authors declare no conflict of interest.

References

  1. Kazancoglu, Y.; Ozbiltekin-Pala, M.; Ozkan-Ozen, Y.D. Prediction and evaluation of greenhouse gas emissions for sustainable road transport within Europe. Sustain. Cities Soc. 2021, 70, 102924. [Google Scholar] [CrossRef]
  2. Way, R.; Ives, M.C.; Mealy, P.; Farmer, J.D. Empirically grounded technology forecasts and the energy transition. Joule 2022, 6, 2057–2082. [Google Scholar] [CrossRef]
  3. Zhang, H.; Zhu, K.; Hang, Z.; Zhou, D.; Zhou, Y.; Xu, Z. Waste battery-to-reutilization decisions under government subsidies: An evolutionary game approach. Energy 2022, 259, 124835. [Google Scholar] [CrossRef]
  4. Neumann, J.; Petranikova, M.; Meeus, M.; Gamarra, J.D.; Younesi, R.; Winter, M.; Nowak, S. Recycling of lithium-ion batteries—Current state of the art, circular economy, and next generation recycling. Adv. Energy Mater. 2022, 12, 2102917. [Google Scholar] [CrossRef]
  5. Li, J.; Li, L.; Yang, R.; Jiao, J. Assessment of the lifecycle carbon emission and energy consumption of lithium-ion power batteries recycling: A systematic review and meta-analysis. J. Energy Storage 2023, 65, 107306. [Google Scholar] [CrossRef]
  6. Wang, L.; Zhu, S.; Evans, S.; Zhang, Z.; Xia, X.; Guo, Y. Automobile recycling for remanufacturing in China: A systematic review on recycling legislations, models and methods. Sustain. Prod. Consum. 2023, 36, 369–385. [Google Scholar] [CrossRef]
  7. He, L.; Sun, B. Exploring the EPR system for power battery recycling from a supply-side perspective: An evolutionary game analysis. Waste Manag. 2022, 140, 204–212. [Google Scholar] [CrossRef]
  8. Azadnia, A.H.; Onofrei, G.; Ghadimi, P. Electric vehicles lithium-ion batteries reverse logistics implementation barriers analysis: A TISM-MICMAC approach. Resour. Conserv. Recycl. 2021, 174, 105751. [Google Scholar] [CrossRef]
  9. MIIT. The Interim Measures for the Administration of Recycling and Utilization of New Energy Vehicles Power Battery. 2018. Available online: https://www.gov.cn/xinwen/2018-02/26/content_5268875.htm (accessed on 25 May 2023).
  10. Zhang, M.; Kong, Z. A tripartite evolutionary game model of emergency supplies joint reserve among the government, enterprise and society. Comput. Ind. Eng. 2022, 169, 108132. [Google Scholar] [CrossRef]
  11. Wang, S.; Xu, Y. Complex Network-Based Evolutionary Game for Knowledge Transfer of Social E-Commerce Platform Enterprise’s Operation Team under Strategy Imitation Preferences. Sustainability 2022, 14, 15383. [Google Scholar] [CrossRef]
  12. Liu, C.; Song, Y.; Wang, W.; Shi, X. The governance of manufacturers’ greenwashing behaviors: A tripartite evolutionary game analysis of electric vehicles. Appl. Energy 2023, 333, 120498. [Google Scholar] [CrossRef]
  13. Lin, Y.; Yu, Z.; Wang, Y.; Goh, M. Performance evaluation of regulatory schemes for retired electric vehicle battery recycling within dual-recycle channels. J. Environ. Manag. 2023, 332, 117354. [Google Scholar] [CrossRef] [PubMed]
  14. Zheng, B.; Wen, K.; Jin, L.; Hong, X. Alliance or cost-sharing? Recycling cooperation mode selection in a closed-loop supply chain. Sustain. Prod. Consum. 2022, 32, 942–955. [Google Scholar] [CrossRef]
  15. Harper, G.; Sommerville, R.; Kendrick, E.; Driscoll, L.; Slater, P.; Stolkin, R.; Walton, A.; Christensen, P.; Heidrich, O.; Lambert, S.; et al. Recycling lithium-ion batteries from electric vehicles. Nature 2019, 575, 75–86. [Google Scholar] [CrossRef]
  16. Chinen, K.; Matsumoto, M.; Tong, P.; Han, Y.S.; Niu, K.-H.J. Electric Vehicle Owners’ Perception of Remanufactured Batteries: An Empirical Study in China. Sustainability 2022, 14, 10846. [Google Scholar] [CrossRef]
  17. Rajaeifar, M.A.; Ghadimi, P.; Raugei, M.; Wu, Y.; Heidrich, O. Challenges and recent developments in supply and value chains of electric vehicle batteries: A sustainability perspective. Resour. Conserv. Recycl. 2022, 180, 106144. [Google Scholar] [CrossRef]
  18. Qiao, D.; Wang, G.; Gao, T.; Wen, B.; Dai, T. Potential impact of the end-of-life batteries recycling of electric vehicles on lithium demand in China: 2010–2050. Sci Total Env. 2021, 764, 142835. [Google Scholar] [CrossRef]
  19. Xu, X.; Hu, W.; Liu, W.; Wang, D.; Huang, Q.; Chen, Z. Study on the economic benefits of retired electric vehicle batteries participating in the electricity markets. J. Clean. Prod. 2021, 286, 125414. [Google Scholar] [CrossRef]
  20. Mirzaei Omrani, M.; Jannesari, H. Economic and environmental assessment of reusing electric vehicle lithium-ion batteries for load leveling in the residential, industrial and photovoltaic power plants sectors. Renew. Sustain. Energy Rev. 2019, 116, 109413. [Google Scholar] [CrossRef]
  21. Skeete, J.-P.; Wells, P.; Dong, X.; Heidrich, O.; Harper, G. Beyond the EVent horizon: Battery waste, recycling, and sustainability in the United Kingdom electric vehicle transition. Energy Res. Soc. Sci. 2020, 69, 101581. [Google Scholar] [CrossRef]
  22. Miao, Y.; Liu, L.; Zhang, Y.; Tan, Q.; Li, J. An overview of global power lithium-ion batteries and associated critical metal recycling. J. Hazard. Mater. 2022, 425, 127900. [Google Scholar] [CrossRef]
  23. Jung, J.C.-Y.; Sui, P.-C.; Zhang, J. A review of recycling spent lithium-ion battery cathode materials using hydrometallurgical treatments. J. Energy Storage 2021, 35, 102217. [Google Scholar] [CrossRef]
  24. Zhang, C.; Tian, Y.-X.; Han, M.-H. Recycling mode selection and carbon emission reduction decisions for a multi-channel closed-loop supply chain of electric vehicle power battery under cap-and-trade policy. J. Clean. Prod. 2022, 375, 134060. [Google Scholar] [CrossRef]
  25. Yu, W.; Guo, Y.; Shang, Z.; Zhang, Y.; Xu, S. A review on comprehensive recycling of spent power lithium-ion battery in China. Etransportation 2022, 11, 100155. [Google Scholar] [CrossRef]
  26. Zhao, S.; Ma, C. Research on the coordination of the power battery echelon utilization supply chain considering recycling outsourcing. J. Clean. Prod. 2022, 358, 131922. [Google Scholar] [CrossRef]
  27. Sun, Q.; Chen, H.; Long, R.; Li, Q.; Huang, H. Comparative evaluation for recycling waste power batteries with different collection modes based on Stackelberg game. J. Environ. Manag. 2022, 312, 114892. [Google Scholar] [CrossRef]
  28. Kong, J.; Chua, G.A.; Yang, F. Firms’ cooperation on recycling investments in a three-echelon reverse supply chain. Int. J. Prod. Econ. 2023, 263, 108959. [Google Scholar] [CrossRef]
  29. De, M.; Giri, B. Modelling a closed-loop supply chain with a heterogeneous fleet under carbon emission reduction policy. Transp. Res. Part E Logist. Transp. Rev. 2020, 133, 101813. [Google Scholar] [CrossRef]
  30. Mondal, C.; Giri, B.C. Retailers’ competition and cooperation in a closed-loop green supply chain under governmental intervention and cap-and-trade policy. Oper. Res. 2022, 22, 859–894. [Google Scholar] [CrossRef]
  31. Jiao, J.; Pan, Z.; Li, J. Effect of carbon trading scheme and technological advancement on the decision-making of power battery closed-loop supply chain. Environ. Sci. Pollut. Res. 2023, 30, 14770–14791. [Google Scholar] [CrossRef]
  32. Li, S.; Sun, Q. Evolutionary game analysis of WEEE recycling tripartite stakeholders under variable subsidies and processing fees. Env. Sci. Pollut. Res. Int. 2023, 30, 11584–11599. [Google Scholar] [CrossRef] [PubMed]
  33. Jiao, J.; Chen, Y.; Li, J.; Yang, S. Carbon reduction behavior of waste power battery recycling enterprises considering learning effects. J. Environ. Manag. 2023, 341, 118084. [Google Scholar] [CrossRef] [PubMed]
  34. Gu, X.; Zhou, L.; Huang, H.; Shi, X.; Ieromonachou, P. Electric vehicle battery secondary use under government subsidy: A closed-loop supply chain perspective. Int. J. Prod. Econ. 2021, 234, 108035. [Google Scholar] [CrossRef]
  35. Gong, Y.; Chen, M.; Wang, Z.; Zhan, J. With or without deposit-refund system for a network platform-led electronic closed-loop supply chain. J. Clean. Prod. 2021, 281, 125356. [Google Scholar] [CrossRef]
  36. Zhang, M.; Wu, W.; Song, Y. Study on the impact of government policies on power battery recycling under different recycling models. J. Clean. Prod. 2023, 413, 137492. [Google Scholar] [CrossRef]
  37. Li, Z.; Zhong, X.; Xu, X. The mechanism of retired power batteries recycling through blockchain token incentives. J. Clean. Prod. 2023, 415, 137560. [Google Scholar] [CrossRef]
  38. Zheng, Y.; Xu, Y.; Qiu, Z. Blockchain Traceability Adoption in Agricultural Supply Chain Coordination: An Evolutionary Game Analysis. Agriculture 2023, 13, 184. [Google Scholar] [CrossRef]
  39. Li, X.; Du, J.; Liu, P.; Wang, C.; Hu, X.; Ghadimi, P. Optimal choice of power battery joint recycling strategy for electric vehicle manufacturers under a deposit-refund system. Int. J. Prod. Res. 2023, 61, 7281–7301. [Google Scholar] [CrossRef]
  40. Wang, Z.; Chen, B.; Li, B.; Cheng, Y. Rate, tax, or hybrid: A comparison of recycling systems in the electronic industry. Sustain. Prod. Consum. 2023, 39, 93–108. [Google Scholar] [CrossRef]
  41. Meng, Q.; Li, M.; Liu, W.; Li, Z.; Zhang, J. Pricing policies of dual-channel green supply chain: Considering government subsidies and consumers’ dual preferences. Sustain. Prod. Consum. 2021, 26, 1021–1030. [Google Scholar] [CrossRef]
  42. Xu, N.; Xu, Y. Research on Tacit Knowledge Dissemination of Automobile Consumers’ Low-Carbon Purchase Intention. Sustainability 2022, 14, 10097. [Google Scholar] [CrossRef]
  43. Nersesian, L.; Hafezalkotob, A.; Reza-Gharehbagh, R. Alternative governmental carbon policies on populations of green and non-green supply chains in a competitive market. Environ. Dev. Sustain. 2023, 25, 4139–4172. [Google Scholar] [CrossRef]
  44. Zhang, X.; Guo, X.; Zhang, X. Collaborative strategy within China’s emission trading scheme: Evidence from a tripartite evolutionary game model. J. Clean. Prod. 2023, 382, 135255. [Google Scholar] [CrossRef]
  45. Zhang, C.; Chen, Y.-X.; Tian, Y.-X. Collection and recycling decisions for electric vehicle end-of-life power batteries in the context of carbon emissions reduction. Comput. Ind. Eng. 2023, 175, 108869. [Google Scholar] [CrossRef]
  46. Yan, J. Personal sustained cooperation based on networked evolutionary game theory. Sci. Rep. 2023, 13, 9125. [Google Scholar] [CrossRef] [PubMed]
  47. Traulsen, A.; Glynatsi, N.E. The future of theoretical evolutionary game theory. Philos. Trans. R. Soc. B 2023, 378, 20210508. [Google Scholar] [CrossRef]
  48. Wan, X.; Liu, J.; Zhao, S. Evolutionary game study on the governance and development of online car-hailing based on blockchain technology. Sci. Rep. 2022, 12, 9388. [Google Scholar] [CrossRef]
  49. Yuan, Y.; Du, L.; Luo, L.; Cui, L. Allocation strategy of medical supplies during a public health emergency: A tripartite evolutionary game perspective. Sci. Rep. 2023, 13, 9571. [Google Scholar] [CrossRef]
  50. Zhang, Z.; Zhang, G.; Hu, Y.; Jiang, Y.; Zhou, C.; Ma, J. The evolutionary mechanism of haze collaborative governance: Novel evidence from a tripartite evolutionary game model and a case study in China. Humanit. Soc. Sci. Commun. 2023, 10, 69. [Google Scholar] [CrossRef]
  51. Sasikumar, P.; Haq, A.N. Integration of closed loop distribution supply chain network and 3PRLP selection for the case of battery recycling. Int. J. Prod. Res. 2011, 49, 3363–3385. [Google Scholar] [CrossRef]
  52. Wang, F.; Xu, Y. Evolutionary Game Analysis of the Quality of Agricultural Products in Supply Chain. Agriculture 2022, 12, 1575. [Google Scholar] [CrossRef]
  53. Gao, W.; Guo, W.; Zhou, S.; Wu, S.; Yang, Z. The evolution of the relationship among stakeholders in port integration: Evidence from tripartite evolutionary game analysis. Ocean Coast. Manag. 2023, 240, 106628. [Google Scholar] [CrossRef]
Figure 1. The game relationship between governments, manufacturers, and recyclers.
Sustainability 15 15464 g001
Figure 2. Manufacturer dynamic trend phase diagram.
Sustainability 15 15464 g002
Figure 3. Recycler dynamic trend phase diagram.
Sustainability 15 15464 g003
Figure 4. Government dynamic trend phase diagram.
Sustainability 15 15464 g004
Figure 5. Evolution results under different initial probabilities in the early period.
Sustainability 15 15464 g005
Figure 6. Evolution results under different initial probabilities in the transition period.
Sustainability 15 15464 g006
Figure 7. Evolution results under different initial probabilities in the mature period.
Sustainability 15 15464 g007
Figure 8. The impact of subsidy coefficient on evolution results.
Sustainability 15 15464 g008
Figure 9. The impact of tax rate on evolution results.
Sustainability 15 15464 g009
Figure 10. The impact of synergy benefits on evolution results.
Sustainability 15 15464 g010
Figure 11. The impact of free-rider benefits on evolution results.
Sustainability 15 15464 g011
Figure 12. The impact of green costs on evolution results.
Sustainability 15 15464 g012
Figure 13. The impact of incremental benefit coefficient on evolution results.
Sustainability 15 15464 g013
Table 1. Definition of parameters of the game.
ParameterDescription
π M Manufacturer’s usual benefits
π R Recycler’s usual benefits
C M Manufacturer’s GI costs
C R Recycler’s GI costs
C G The cost of GR for governments
P M Additional benefits to manufacturers from investments by recyclers
P R Additional benefits to recyclers from GI by manufacturers
Q M Manufacturer’s excess carbon emissions
Q R Recycler’s excess carbon emissions
γ Carbon tax rates
α Subsidy intensity of government subsidies for GI
μ Benefits increase coefficient of manufacturers choosing GI
θ Benefits increase coefficient of recyclers choosing GI
φ Green benefits of GI for governments
A Government pollution management unit costs
b Synergy benefits base
η Distribution coefficient 0 η 1
β Coefficient of synergy 0 β 1
Table 2. Payoff matrix of the tripartite game.
GovernmentsGR
z
NR
1 z
RecyclersGI
y
NI
1 y
GI
y
NI
1 y
Manufacturers
GI
x
π M C M + α C M + η β b π R C R + α C R + ( 1 η ) β b φ C G 1 + μ π M C M + α C M π R + P R γ Q R φ 2 C G A + γ Q R π M C M + α C M + η β b π R C R + α C R + ( 1 η ) β b φ 1 + μ π M C M + α C M π R + P R φ / 2 A
NI
1 x
π M + P M γ Q M 1 + θ π R C R + α C R φ 2 C G + γ Q M A π M γ Q M π R γ Q R C G + γ Q M + γ Q R 2 A π M + P M 1 + θ π R C R + α C R φ 2 A π M π R 2 A
Table 3. Eigenvalues of Jacobian matrix.
Equilibrium PointsEigenvalues
λ 1 λ 2 λ 3
E 1 ( 0 , 0 , 0 ) μ Π M + α C M C M θ Π R + α C R C R γ Q M + γ Q R C G
E 2 ( 1 , 0 , 0 ) C M α C M μ Π M α C R C R P R + ( 1 η ) β b γ Q R C G
E 3 ( 0 , 1 , 0 ) α C M C M P M + η β b C R α C R θ Π R γ Q M C G
E 4 ( 0 , 0 , 1 ) μ Π M + α C M C M + γ Q M θ Π R + α C R C R + γ Q R C G γ Q M γ Q R
E 5 ( 1 , 1 , 0 ) C M + P M α C M η β b C R + P R α C R ( 1 η ) β b C G
E 6 ( 1 , 0 , 1 ) C M α C M γ Q M μ Π M α C R C R P R + γ Q R + ( 1 η ) β b C G γ Q R
E 7 ( 0 , 1 , 1 ) α C M C M P M + γ Q M + η β b C R α C R γ Q R θ Π R C G γ Q M
E 8 ( 1 , 1 , 1 ) C M + P M α C M γ Q M η β b C R + P R α C R ( 1 η ) β b C G
Table 4. Equilibrium stability conditions of the system.
Equilibrium PointsStability ConditionGreen Invest
Development Period
E 1 ( 0 , 0 , 0 ) μ Π M + α C M < C M ; θ Π R + α C R < C R ; γ Q M + γ Q R < C G Early period
E 2 ( 1 , 0 , 0 ) α C M + μ Π M > C M ; α C R + ( 1 η ) β b < C R + P R Transition period
E 3 ( 0 , 1 , 0 ) α C M + η β b < C M + P M ; θ Π R + α C R > C R Transition period
E 4 ( 0 , 0 , 1 ) μ Π M + α C M + γ Q M < C M ; θ Π R + α C R + γ Q R < C R ; γ Q M + γ Q R > C G Transition period
E 5 ( 1 , 1 , 0 ) C M + P M < α C M + η β b ; C R + P R < α C R + ( 1 η ) β b Mature period
Table 5. Simulation parameter settings for different scenarios.
Conditions Π M μ C M α P M Π R θ C R P R γ Q M Q R b C G
Scenario 1220.380.110200.2680.54325
Scenario 2220.580.38200.2660.54345
Scenario 3220.480.26200.6580.54344
Scenario 4200.2100.110180.2880.56544
Scenario 5260.340.83240.4430.54393
Disclaimer/Publisher’s Note: The statements, opinions and data contained in all publications are solely those of the individual author(s) and contributor(s) and not of MDPI and/or the editor(s). MDPI and/or the editor(s) disclaim responsibility for any injury to people or property resulting from any ideas, methods, instructions or products referred to in the content.

