1. Introduction
Urbanization is a prominent global trend characterized by rapid population growth and excessive expansion of urban areas [
1,
2,
3]. However, this process may adversely affect urban environments [
4,
5]. One negative impact is the UHI effect: when urban areas experience higher LST than the surrounding rural areas [
6]. This research topic has garnered significant attention. In addition to influencing local climates and posing health risks related to heat [
7], the UHI effect contributes to global problems, including global warming [
8,
9], sea level rise [
10,
11], and intensification of storms [
12,
13]. Moreover, when a heatwave occurs in an urban area already experiencing the UHI effect, it can create extreme heat conditions that may potentially induce natural disasters like wildfires or droughts and result in substantial socioeconomic losses [
14,
15]. Hence, research on analyzing LST patterns and mitigating the UHI effect would provide valuable insights and recommendations for attaining the United Nations Sustainable Development Goals and ensuring a resilient urban future.
Remote sensing is widely recognized as an advanced monitoring technology that offers numerous advantages for studying and analyzing various aspects of the earth’s surface [
16]. A key strength of remote sensing is its ability to provide large-scale and long-term monitoring, which allows the retrieval of surface temperature over vast regions and facilitates the study of thermal patterns and dynamics [
17]. For example, Kachar et al. [
18] used Landsat 7 and Landsat 8 satellite images to generate the spatiotemporal distribution of LST in Tehran from 1999 to 2014. Likewise, Taloor et al. [
19] estimated the LST in the Ravi River Basin from February to March 2018 using Landsat 8 satellite imagery. In addition to its application in large-area thermal analysis, remote sensing plays a significant role in characterizing urban environment [
20]. Remote sensing plays a significant role in characterizing urban morphology [
21,
22]. Remote sensing-derived spectral indices such as the NDVI and NDBI serve as valuable indicators of vegetation cover and built-up areas, respectively [
23,
24]. Furthermore, land use classification allows for the identification and categorization of different land use categories within urban areas, thereby aiding in the assessment of urban morphology and contributing to urban planning efforts [
25,
26]. These remote sensing products provide a solid foundation for comprehensive urban environmental monitoring.
Studies have validated the benefits of using UECs to analyze LST. One research direction involves exploring the correlation between LST and spectral indices derived from remote sensing data. The relationship between LST and spectral indices was first investigated in East Texas in 1990 [
27], and subsequent research further examined this connection. Ref. [
28] discussed the relationship between vegetation and LST in North America using NDVI data from 1996 to 2000. The NDBI was employed to study the UHI effect in Hong Kong by using Landsat thermal infrared data [
29]. Several studies have investigated the effect of UHIs by combining various spectral indices. For instance, Guha et al. [
30] focused on determining the relationship between the estimated LST, NDVI, and NDBI for Florence and Naples, Italy, by using Landsat 8 data. Akher et al. [
31] also discovered that the rapid urbanization process in Kolkata contributed to increased LST by using NDVI and NDBI monitoring.
Another direction evaluates LST and its association with land use types, such as vegetation, water bodies, and built-up areas. These studies are crucial for understanding urban heat dynamics and evaluating the effects of landcover changes [
32,
33]. Exploration of the relationship between urban temperature and land use type began as early as the 1990s in the United States [
34]. Research has continued to investigate the influence of land use on LST, considering single and multiple land use types. For instance, Estoque et al. [
35] examined the relationship between LST and the spatial patterns of impervious surfaces and greenspaces in the metropolitan areas of Bangkok (Thailand), Jakarta (Indonesia), and Manila (Philippines). Similarly, Jia et al. [
36] examined the patterns of LST and landcover in Hong Kong and observed a significant cooling effect of vegetation cover on LST.
Studies have primarily explored the relationship between LST and UECs by using statistical approaches, including the Pearson coefficient, Spearman correlation, and ordinary least squares methods [
20,
37,
38]. However, these methods have limitations in capturing spatial variations because they provide non-spatialized results [
39]. In overcoming this limitation, spatial analysis techniques, including spatial bivariate Moran’s I and GWR, have been used [
40]. For example, spatial bivariate Moran’s I was used in Phoenix, Arizona, to explore the relationship between vegetation cover and seasonal surface temperature [
41]. Moreover, Kashki et al. [
42] employed a GWR model to explore the dynamics of LST in response to geographical parameters in Shiraz City, Iran, during the summer of 2019. With the rapid development of artificial intelligence, the attention to data-driven machine and deep learning models is increasing. Random forest is a machine learning algorithm that constructs an ensemble of decision trees using a random selection of observations and covariates [
43,
44,
45]. Its ability to manage complex relationships and capture nonlinear patterns makes it particularly suitable for analyzing the intricate interactions between urban environment and LST.
In this study, we examined the spatiotemporal pattern of LST and explored its relationship with UECs. Our analysis encompassed two categories of UECs: remote sensing spectral indices and land use types. First, we extracted LST and six spectral indices of Hong Kong from 2017 to 2022 from Landsat 8 data on the GEE. To comprehend the spatial and temporal patterns of LST and UECs, we employed Sen’s slope trend analysis and land use change detection. Furthermore, we conducted Pearson correlation and spatial cross-correlation analyses to validate the relationship between LST and UECs. To deepen the analysis, we employed a random forest regression method to evaluate the relative importance of each UEC in relation to LST. This approach enabled us to identify the key drivers influencing LST. Finally, we conducted further analysis of representative UHI areas, with a specific focus on HKIA, to provide recommendations and insights for decision-makers in policy and urban planning.
This paper comprises six sections.
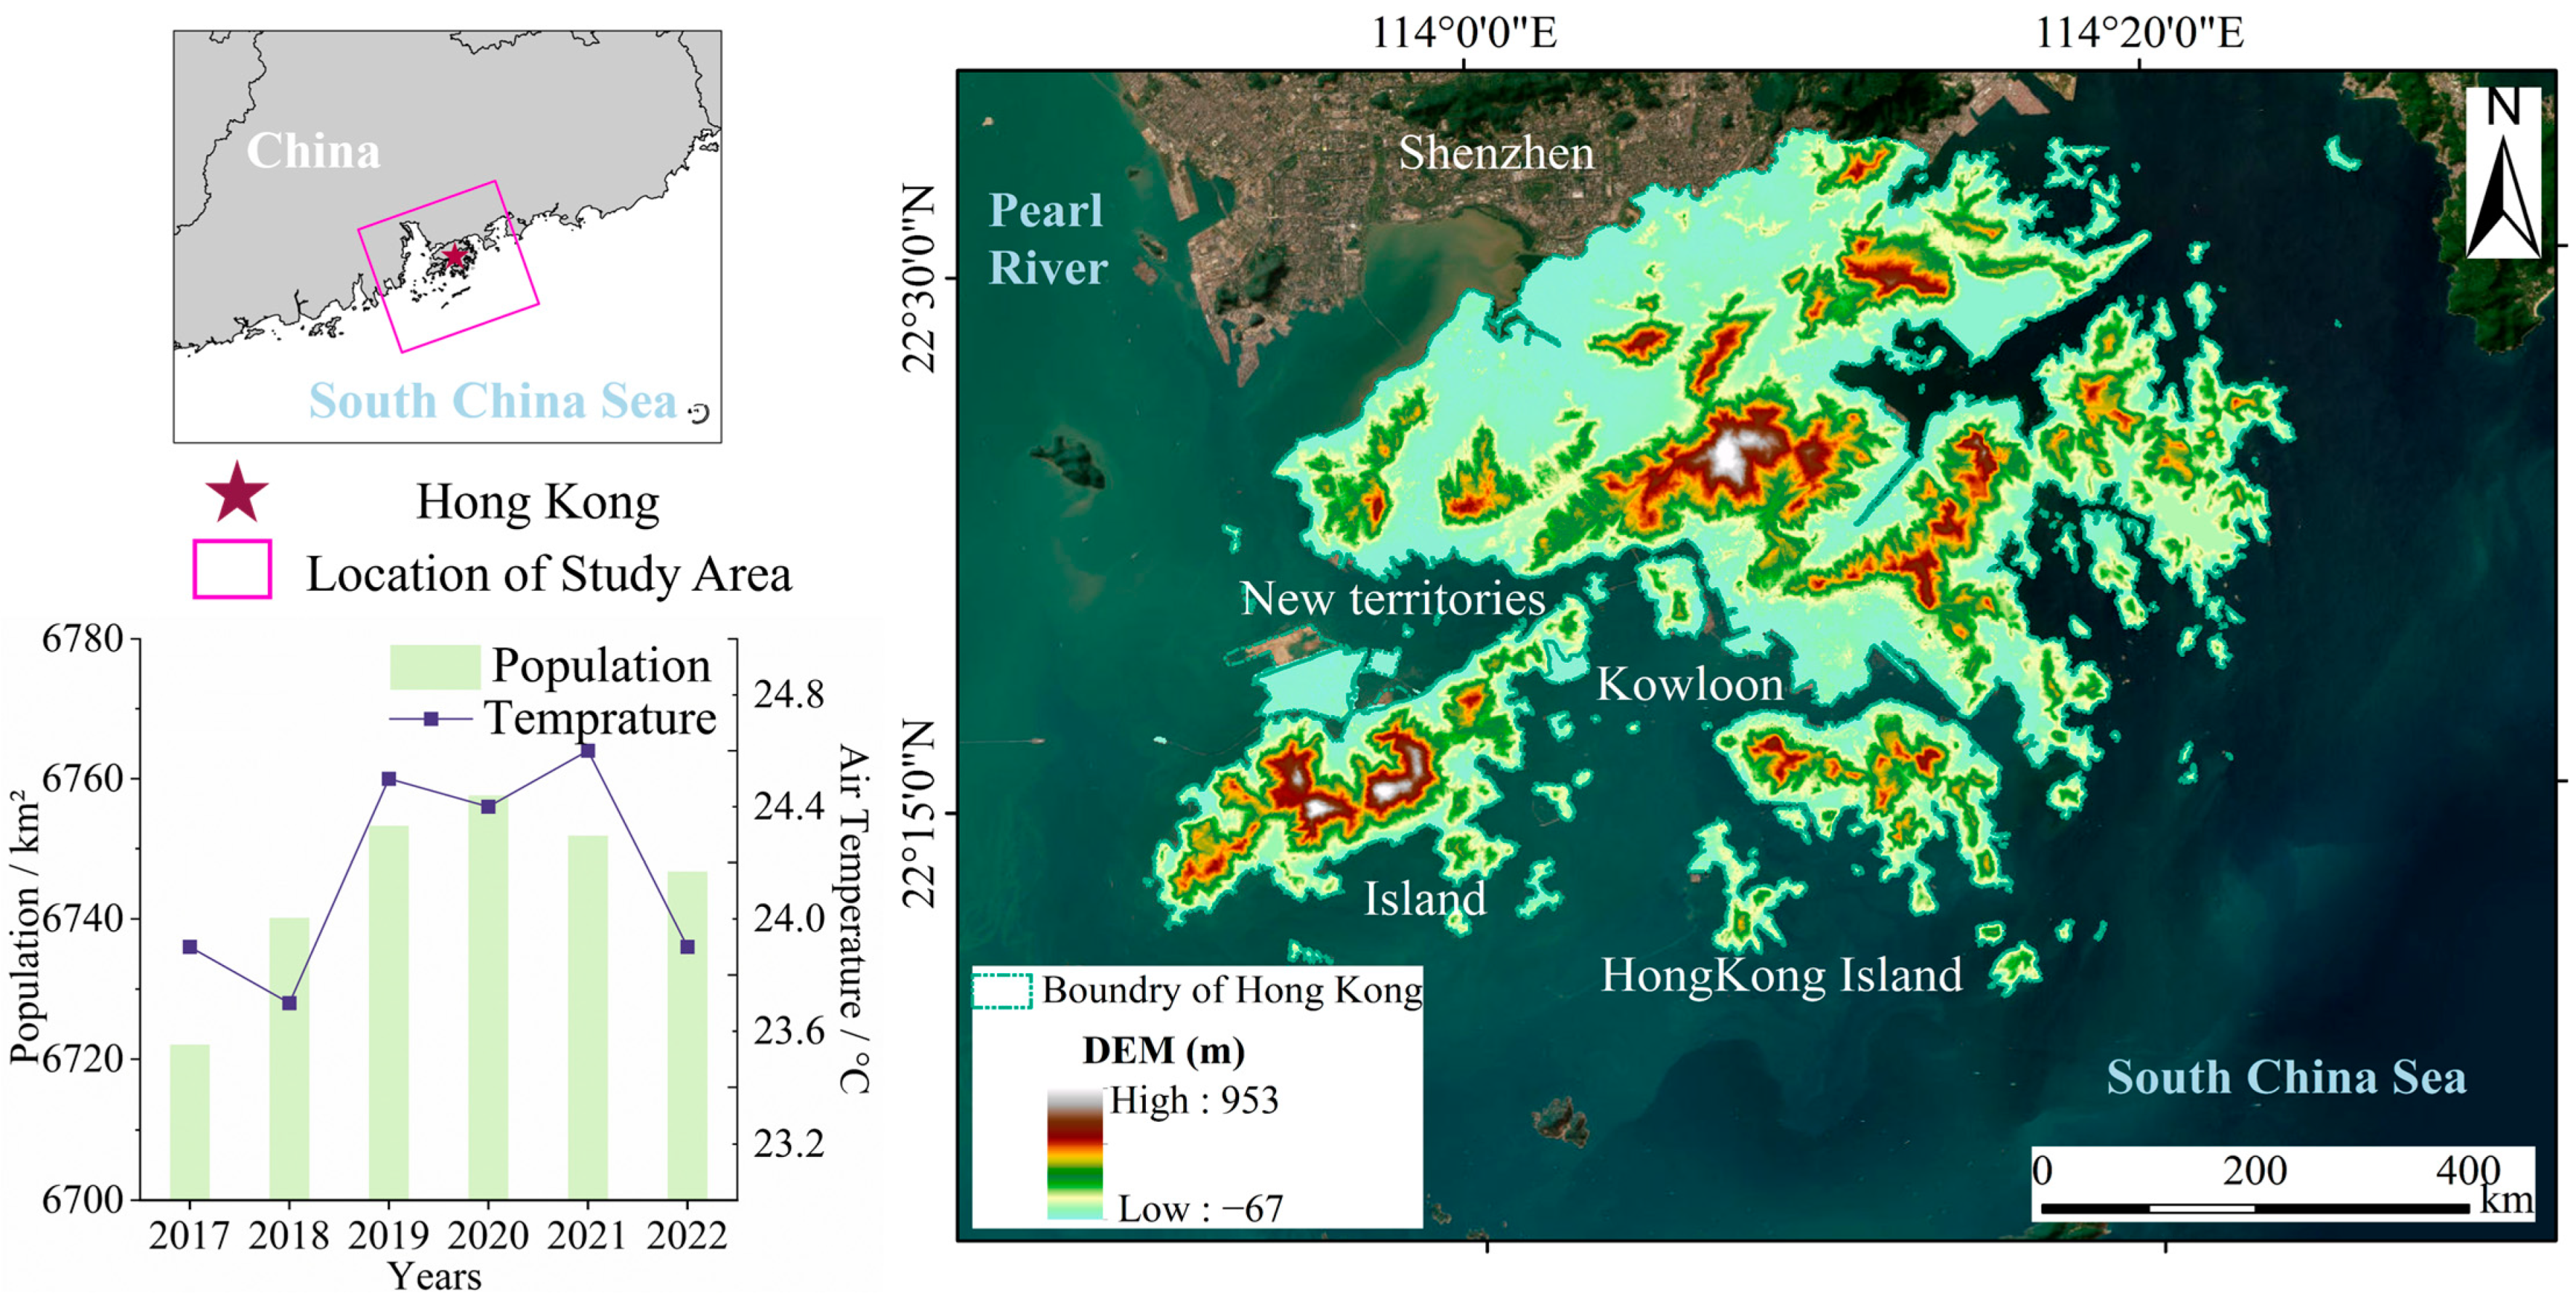
Section 2 introduces the study area and data used.
Section 3 describes the analytical methods used, and
Section 4 presents the results. Next, we analyze the LST mechanism in representative areas and offer recommendations in
Section 5. Finally,
Section 6 concludes and summarizes the key findings.
5. Discussion
5.1. Further Analysis of HKIA
One objective of this study was to investigate the mechanisms that affect the variation in LST. To achieve this objective, we narrowed the focus to the local area of Hong Kong, specifically HKIA. Using HKIA as the research object provided a comprehensive understanding of how urbanization influences LST and contributes to the UHI effect.
As shown in
Figure 13a, the LST of the airport’s third runway in the northwest direction significantly increased from 2017 to 2022. This observation is supported by the trends shown in
Figure 13b–d, which demonstrate the corresponding changes in spectral indices for the third runway area. Specifically, the NDVI in
Figure 13b exhibits a decreasing trend for the third runway and airport, indicating a decline in vegetation cover. Similarly,
Figure 13c displays a rapid decrease in the NDWI, suggesting a reduction in the number of water bodies in the area. By contrast,
Figure 13d exhibits a notable upward trend in the NDBI, indicating increased building cover.
These relationships support the suggestion that the increase in LST is primarily due to the process of reclamation [
67]. HKIA, including parts of the main airport, an artificial island, and a third runway, was constructed through land reclamation. This process leads to a reduction in water bodies and the expansion of built-up areas. Water bodies have a cooling effect, negatively correlated with LST, and built-up areas exhibit a positive correlation, increasing the LST. The combined effect of decreasing water bodies and increasing built-up areas contributed to the UHI effect at the airport. The optical images in
Figure 13e,f provide evidence to support this observation. Furthermore, a portion of the third runway had rapid growth in vegetation cover, possibly for improved runway identification purposes [
68]. Although these vegetation patches mitigated the UHI effect, they did not halt the upward trend. Similar findings have been reported in other reclaimed areas, such as Bahrain International Airport and Istanbul Airport [
69,
70].
We considered the findings on the impact of the reclamation on LST at HKIA and posed the following recommendations to inform future reclamation projects: First, comprehensive environmental impact assessments should be conducted before engaging in reclamation activities, particularly to assess the potential consequences for water bodies and built-up areas. These assessments should consider the potential loss of natural habitats and associated implications for temperature regulation. Second, adopting innovative urban planning strategies would optimize the spatial layout of airports and their surrounding areas, reducing the negative impacts of reclamation on LST. These strategies involve optimizing the distribution of built-up areas, preserving or restoring water bodies, and incorporating natural cooling elements, such as water features or greenspaces, to counterbalance the heat generated by airport infrastructure.
5.2. Implications for Urban Planning and Management
This study focused on the influence of UECs on LST in Hong Kong. The results imply that differentiated and targeted planning strategies based on the effects of UECs on LST can be developed to reduce LST effectively. Additionally, by considering the relationship between LST and spectral indices, along with increasing the percentage of vegetation cover or decreasing the proportion of building areas in urban environment, effective control of reclamation may be the most meaningful approach for reducing LST in regions with high population density, such as Hong Kong.
Because of the significant prevalence of the UHI effect in Hong Kong, particularly in densely built-up areas, prioritizing interventions in these high-temperature zones is crucial. Construction areas within the urban fabric exhibit elevated temperatures, making them focal points for targeted attention. Integrating green spaces with vegetation should be the central focus of urban planning initiatives. This decision would help mitigate the UHI effect by providing shade, transpiration, and evapotranspiration, cooling the surrounding environment. Moreover, the preservation and protection of water bodies should be emphasized to leverage their moderating influence on temperature.
Furthermore, integrating sustainable development principles with infrastructure construction in urban areas is imperative. The implementation of concepts such as green roofs and permeable surfaces can effectively mitigate the UHI effect and enhance urban resilience. These measures facilitate the integration of nature-based solutions and sustainable practices into built environments.
As part of our recommendation to the government, UHI mitigation strategies should be enhanced by incorporating the following key elements: prioritizing interventions in high-temperature zones, integrating green spaces and vegetation, emphasizing the preservation of water bodies, and incorporating sustainable development principles into the infrastructure of built-up areas.
5.3. Limitations and Recommendations for Further Research
This study had limitations that warrant consideration. First, the data resolution and quality used in the analysis would be improved in further research by incorporating data with higher spatiotemporal resolution than the data we used. Such data would provide more detailed and accurate information than we provided, deepening the understanding of the relationship between LST and the spectral indices. Additionally, one limitation of our study is the relatively short six-year time series dataset, which may limit the robustness of trend analysis results. Additionally, this timeframe may not fully capture long-term trends or account for natural variability. Consequently, the interpretation of trends should be made cautiously, recognizing the potential for variability due to the limited temporal scope. Therefore, we recommend that future research endeavors to consider encompassing a more extensive temporal perspective, which could provide valuable insights into the evolution of LST in urban areas [
71,
72,
73].
Additionally, this study did not consider the influence of social and economic factors resulting from human activities and the increasing population on LST. Thus, further research should integrate socioeconomic data to gain insights into the contextual factors shaping temperature patterns, deepening the holistic understanding of the complex interactions among LST, spectral indices, and socioeconomic variables. While this study uses high LST as a proxy for UHI, it is essential to note the inherent uncertainties this may introduce, such as the influence of varied urban land covers, fluctuations in daily temperature patterns, and atmospheric disturbances. Future research could consider employing more rigorous methods to identify UHI regions accurately. It is worth noting that another potential limitation of our study lies in the choice of the model. While we have employed the random forest model effectively to explore relationships within the available data, the limited temporal scope may constrain its ability to capture long-term trends and natural variability. Future research may benefit from comparing various machine learning models to provide a more comprehensive assessment of performance and applicability.


