Abstract
Despite the World Health Organization (WHO) advocating a healthy and balanced diet for consumers for many years, inadequate fruit and vegetable (FV) consumption remains a substantial issue with economic, social, environmental, and nutritional implications. This study aims to identify consumer profiles for sustainable fruit and vegetable consumption in the European Union, considering specific demographic and socio-economic factors. The analysis is based on data from the 2019 European Health Interview Survey (EHIS). This article provides a clear understanding of how gender, age, education level, income, and place of residence relate to sustainable FV consumption through a principal component analysis (PCA). By defining consumer profiles linked to sustainable and healthy FV consumption, the study aids in creating cohesive goals for promoting health within European society. The results of the PCA reveal four distinct consumer profiles and enhance our understanding of the factors influencing these profiles. These findings align with previous research, indicating that consumer profiles remain relatively consistent. According to the PCA classification, sustainable fruit and vegetable consumption is more prevalent among women, educated individuals, higher-income consumers, and those over 55 years old. In contrast, the opposite profile consists of consumers with lower income, younger and middle-aged individuals, men, and those with less than a high school education, highlighting the need for effective strategies to promote a healthier diet in this group. Countries with lower economic development, reflected in consumer incomes, deviate the most from the recommended “at least five portions of fruit and vegetables a day” consumption pattern, and do not exhibit a sustainable consumption model. Thus, continued monitoring of consumer profiles is essential, with a focus on both the quantity and frequency of fruit and vegetable consumption, as well as strategies aiming to increase their intake.
1. Introduction
The European Union considers the solution to the problem of low consumption of fruit and vegetables as one of its priorities, and supports the development of the sustainable food consumption, including fruit and vegetables, as evidenced by the provisions of the European Green Deal, objectives of the Farm to Fork strategy [1,2], The State of Food Security and Nutrition in the World 2022 and 2021 report [3,4], and including the fruit and vegetable sector in Common Agriculture Policy (CAP) Strategic Plans in EU countries. The measures taken to counteract the low consumption of fruit and vegetables include actions supporting pro-health and rational nutrition initiatives, found among the national strategies aiming to improve health and reduce diseases, as well as in some global dietary recommendations formulated for various countries. This includes educational activities and legal regulations, as well as activities for the protection of the environment.
The Food and Agriculture Organization (FAO) of the United Nations [5] says that up to 3.9 million lives could be saved each year if the consumption of fruit and vegetables were sufficient. It is estimated that the lack of fruit and vegetables in the human diet or their low consumption may lead to an increased risk of chronic diseases, metabolic deterioration, as well as regulatory and digestive problems [6,7,8,9,10,11,12,13,14]. The reasons for this phenomenon include unsustainable consumer behaviour, lack of sufficient knowledge about the benefits of fruit and vegetable consumption [15,16,17,18], perception of fruit as luxury goods [5], and price movements for this category of products (changes dictated by, for example, weather conditions or economic crises) [19,20,21,22,23].
The WHO recommends maintaining a healthy diet from an early age, which includes eating a significant amount of fruit and vegetables. The daily intake of fruit and vegetables among adults should be at least 400 g (about 150 kg per person per year) [24]. There is also a second, more stringent and less frequently cited WHO recommendation that takes into account the age of consumers. It is recommended that the consumption of fruit and vegetables should be at a level of 600 g per day for adults and adolescents (aged ≥ 15 years), 480 g per day for children aged 5–14 years, and 330 g per day for children aged 0–4 years [25]. The recommended minimum number of servings is five per day: two fruits and three vegetables (excluding potatoes, sweet potatoes, cassava, and other starchy roots). Due to the fact that individual fruits and vegetables do not present a uniform nutritional value, care should be taken to ensure their diversity in a daily consumption [26].
Sustainable consumption is a significant component of the European Union’s economic transformation towards a sustainable future. Developing healthy dietary patterns is one of the key actions to accelerate progress in achieving the 2030 agenda for sustainable development [27,28]. In contrast to traditional consumption patterns, sustainable food consumption aims to provide services and products that meet basic needs, improve quality of life, reduce resource consumption, minimize environmental harm, and preserve the right to such consumption for future generations [29,30,31,32]. Other factors, such as human health, perception of wellbeing, accessibility, safety, equity, and cultural adequacy, also play a crucial role.
In addition to the concept of sustainable food consumption, the concept of a sustainable diet is frequently encountered. Healthy diets provide adequate, safe, diversified, and nutrient-rich food for all people [33]. The FAO and WHO have undertaken efforts to develop sustainable, healthy diets. These guidelines incorporate international dietary recommendations, the environmental costs of food production and consumption, and the potential for adaptation to local social, cultural, and economic contexts. Their primary objective is to assist countries in transforming their food systems to promote sustainable and healthy dietary habits, thereby contributing to the achievement of sustainable development goals (SDGs) at the national and regional levels [34,35].
Every individual has the potential to have a positive impact on consumption through the daily choices they make, playing a key role in driving sustainable production. Gunter’s research [36] indicates that nutrition and health are the most frequently mentioned aspects of sustainable food in consumer studies, mentioned more often than factors such as environmental or climate impact. Similarly, sustainable diets are primarily associated with nutritionally balanced diets. In the context of sustainable food, balance is currently more related to individual concerns than environmental considerations. Concerning the creation of a sustainable diet beneficial to both the environment and the health of contemporary consumers in developed countries, a proposal called the “Livewell Plate 2020” has been introduced, based on the British dietary guidelines of the “Eatwell Plate” [37].
In the quantitative structure of daily food intake according to the “Livewell Plate 2020” recommendations, fruits and vegetables constitute the largest portion, accounting for as much as 35%. Shaping consumption with a significant emphasis on fruits and vegetables is a key element of the EU Farm to Fork strategy, introduced in 2020. Significant changes in current consumption patterns (both in terms of quantity and quality) are required, including a substantial reduction in the consumption of unhealthy food products such as red meat and sugar, and an increase in the consumption of healthy products like fruits and vegetables, nuts, and legumes. A diet richer in fruits and vegetables, as well as other plant-based products (including nuts, legumes, and whole grains), allows consumers to combine health and environmental benefits [34]. Consumption of fruits and vegetables has gained new impetus due to consumer awareness of the nutritional and health benefits of these products during the pandemic.
Despite the compelling evidence of the importance of fruits and vegetables in human nutrition described above, we still consume them too sparingly. The EU is taking various actions to raise consumer awareness of the value of consuming fresh fruits and vegetables (e.g., a school program providing funding for the distribution of fruits and vegetables to students and educational activities to increase knowledge about agriculture and healthy food). To improve the visibility of fruits and vegetables in the market and enhance their perceived quality, the EU is taking actions in the areas of promotional and quality policy (protection of product-specific characteristics). Willett et al. [27] point out that the awareness of the need for changes and diversity in consumption is growing both regionally and among social groups. To promote the widespread adoption of the sustainable food consumption model [28,38,39,40,41,42], it is necessary to conduct consumer profiling studies that take into account compliance with WHO requirements and Livewell Plate recommendations, especially regarding fruit and vegetable consumption, and the definition of such a consumer profile at the national, regional, and global levels. Research in this area can aid in policymaking and decision making based on evidence and assessments of progress in transforming food consumption. Many studies have shown inequities in FV dietary intake resulting from social, cultural and environmental attributes. These factors influence consumer behaviour with different intensity in different societies [40,43,44,45,46,47,48,49,50,51,52,53,54,55]. Recently, Stea et al. [56] research, based on data collected in 2014 in 21 European countries, concluded that being a female and having a high education level were associated with increased consumption of fruit and vegetables. The comparison study used odds ratios (OR) as a statistical measure of an event occurring in one group to the odds of it occurring in another group. The results showed that participants living in Eastern Europe had the lowest odds of consuming fruit and vegetables, whereas those from Southern and Northern European countries had the highest odds. However, the authors have noted that due to limited data, it was not possible to calculate whether the respondents fulfilled the WHO’s criteria of eating five portions of fruit and vegetables per day. Moreover, the authors have noted that inconsistent findings are reported regarding educational attainment and regional affiliation. As a result, one can conclude that there is a need to assess how the WHO’s recommendation is fulfilled. Therefore, this study enhances the existing part of the research in sustainable consumption based on investigation using classical statistical methods and a multivariate technique such as principal component analysis (PCA). The main goal is the identification of consumer profiles for sustainable fruit and vegetable consumption in the European Union, taking into account selected demographic and socio-economic characteristics of consumers. The consumer profiles of sustainable fruit and vegetable consumption in the European Union presented in this paper narrow that gap.
In the literature, there are only limited studies that used principal component analysis, mainly for identifying dietary patterns among populations [57,58,59,60,61]. Most previously published studies regarding the profile of fruit and vegetable consumers are based on OR factors and focused on comparisons within a particular group. In this paper, we have proved that the PCA may provide a useful approach for summarizing extensive data consisting of several groups in graphically interpretable clusters. Moreover, advances in the PCA allow us to assess the importance of factors influencing inequalities in consumer behaviour in different EU countries.
This exploratory study uses data from the European Health Interview Survey (EHIS) [62], Reference Metadata in Euro SDMX Metadata Structure (ESMS) collected in 2019. The EHIS survey was performed in 27 EU countries. The use of the PCA offers the perspective of identifying the studied phenomenon, considering the number of consumers from a larger geographical area and data concerning the frequency of fruit and vegetable consumption, as well as portion sizes at the same time. An important part of our work is the inclusion of the survey information taking into account the consumers that meet the WHO’s recommendation of five portions of fruit and vegetables per day. Separating subgroups enables their in-depth characterization in terms of consumer behaviour, which is an important issue due to its practical significance. The grouping results can be used to build marketing strategies, which is key to improving policies for increasing fruit and vegetable consumption, and updating solutions and recommendations for problems related to low consumption of fruit and vegetables in the society.
Therefore, the major tasks of the present paper are as follows:
- (i)
- assessing the homogeneity of the structure of the surveyed countries in terms of daily consumption of fruit and vegetables;
- (ii)
- a summary of how far residents of the EU countries deviate from the synthetic consumption pattern of five servings of fruit and vegetables per day;
- (iii)
- assessing the strength of the impact of demographic (sex, age) and socio-economic (education, income) characteristics on inequalities in fruit and vegetable consumption;
- (iv)
- creating consumer profiles of fruit and vegetables and pure fruit or vegetable juices, and drawing attention to consumers who do not comply with WHO recommendations;
- (v)
- analyzing the impact of inequalities in the level of economic development of countries on differences in the level of consumption of fruit and vegetables.
In order to achieve the research objectives, the article is organized as follows. The next section describes the data structure and the methodology used in the study; in particular, the limitations are presented. The third part presents the research results and discussion. In particular, the following were described: the structure of the studied countries in terms of daily consumption of fruit and vegetables, the strength of the impact of demographic and socio-economic characteristics on inequalities in fruit and vegetable consumption, the profiles of fruit and vegetable consumers, and the impact of inequalities in the level of economic development of countries on differences in the level of consumption of the analyzed products. The next part of the paper summarizes the results, describes managerial implications, and gives suggestions for future research directions.
2. Materials and Methods
2.1. Data Structure
The material includes data collected in 2019 from national sources by the Statistical Office of the European Union (EUROSTAT service): the European Health Interview Survey (EHIS) [62] and Reference Metadata in Euro SDMX Metadata Structure (ESMS) for those European countries for which data are available. The aim of the EHIS is to measure, in a harmonized way and with a high degree of comparability among Member States (MS), the health status (including disability) and health determinants (lifestyle) of EU citizens, the use of care health services, and restrictions on access to them. The study covers the following topics: health status, health care and health determinants, in which the consumption of fruit and vegetables is taken into account as an important factor documenting the behaviour of European residents in terms of consumption of these products. The general scope of the study covers the population aged 15 or over, living in private households. The survey is conducted every 5 years. The first wave of the survey (EHIS wave 1) was conducted between 2006 and 2009, the second (EHIS wave 2) took place in 2013–2015, and the third (EHIS wave 3) in 2018–2020. During the EHIS 3 wave, the minimum effective sample size for the 27 European Union member states was 176,100 people (Appendix A). In the database, all indicators are calculated as percentages. Free online data can be found at the website http://ec.europa.eu/eurostat/web/health/database (accessed on 20 October 2023) [63] in the relevant modules: health status (hlth_state), health determinants (hlth_det), and health care (hlth_care).
It is important to tailor information sheets and forms to a specific study. For the purposes of this study, variables on the daily consumption of fruit and vegetables in portions and the frequency of consumption of fruit, vegetables and pure fruit or vegetable juices were compiled by consumers. The final data presented the percentage share of individual indications in 27 countries of the European Union. The survey was created based on different consumer groups according to gender, age, education and economic status. Each group was categorized as shown in Table 1. According to the collected data from the European Health Interview Survey (EHIS), the following ranks (criteria) of consumer types were defined:
- –
- gender—female, male;
- –
- age—age groups 15–24, 25–34, 35–44, 45–54, 55–64, 65 or over;
- –
- education—level 0–2 (no education, primary and/or lower secondary education); level 3–4 (upper secondary education, secondary education, post-secondary education), level 5–8 (higher education: bachelor’s, engineer’s, master’s, doctoral);
- –
- income quintile—1st quintile (20% of people with the lowest income), 2nd quintile, 3rd quintile, 4th quintile, 5th quintile (20% of people with the highest income.
The consumption of fruit, vegetables and fruit–vegetable juice was expressed with a number of cases (in percentage units) by asking the respondents to declare one of the daily intake categories—“O portions”, “From 1 to 4 portions”, “5 or more portions”. The data were ordered in a matrix form, denoted by X1, according to the diagram depicted in Table 2. For the purpose of the principal component analysis, the rows are so-called objects. The graphical analysis of the results of the study makes use of abbreviations of the names of European Union Member States, according to ISO 3166 Alpha-2 codes developed by the International Organisation for Standardisation: Austria (AT), Belgium (BE), Bulgaria (BG), Croatia (HR), Cyprus (CY), Czechia (CZ), Denmark (DK), Estonia (EE), Finland (FI), France (FR), Germany (DE), Greece (GR), Hungary (HU), Ireland (IE), Italy (IT), Latvia (LV), Lithuania (LT), Luxembourg (LU), Malta (MT), Netherlands (NL), Poland (PL), Portugal (PT), Romania (RO), Slovakia (SK), Slovenia (SI), Spain (ES), Sweden (SE).

Table 1.
The design of the factors (demographic criteria) influencing consumer behaviour.
Table 1.
The design of the factors (demographic criteria) influencing consumer behaviour.
| Factor | Levels (Consumer Group) | Name (for PCA Purpose) |
|---|---|---|
| Gender | Females | Females |
| Males | Males | |
| Age | From 15 to 24 years | Y_15_24 |
| From 25 to 34 years | Y_25_34 | |
| From 35 to 44 years | Y_35_44 | |
| From 45 to 54 years | Y_45_54 | |
| From 55 to 64 years | Y_55_64 | |
| 65 years or over | Y_65_or over | |
| Education | Levels 0–2 | Levels 0–2 |
| Levels 3 and 4 | Levels 3–4 | |
| Levels 5–8 | Levels 5–8 | |
| Income quintile | First | Q_first |
| Second | Q_second | |
| Third | Q_third | |
| Fourth | Q_fourth | |
| Fifth | Q_fifth |
Source: own work based on Eurostat. 2022. Your Key to European Statistics. Available online: https://ec.europa.eu/eurostat/web/main/data/database (accessed on 23 June–18 July 2023).
Table 2.
The design of the objects for the purpose of the PCA.
Table 2.
The design of the objects for the purpose of the PCA.
| Objects X1 | Levels (Vegetable and Fruit Daily Intake) | Class Name (for PCA Purpose) |
|---|---|---|
| Country | 0 portions | Country_0 |
| From 1 to 4 portions | Country_1 | |
| 5 or more portions | Country_5 |
Source: own work based on Eurostat. 2022. Your Key to European Statistics. Available online: https://ec.europa.eu/eurostat/web/main/data/database (accessed on 23 June–18 July 2023).
To obtain further information, questionnaires about the frequency of consumption were completed into four categories: “Once a day”, “From 1 to 3 times a week”, “From 4 to 6 times a week”, and “Never or occasionally”. Based on the data, the matrix X2 was created using an average value (European average) for each group of the respondents from Table 1 and within each level of days of consumption and frequency of consumption, as clarified in Table 3.
Table 3.
Design of the objects and variables for typical consumer’s profile, identified via PCA.
Limitations
The availability and usefulness of any existing databases and resources should be stressed. However, the databases are limited in their usefulness for regulatory as well as scientific purposes. It this study, these limitations relate to the period of the survey, the range of sites/countries in which the survey was carried out, and the form and quality of the questions asked about fruit and vegetable consumption, as well as methodological issues. One limitation relates to the set of figures: four years have passed since the last survey, and the 2019 data are the most up to date. To keep the discussion concrete, the questions on the number of portions of fruit and vegetables consumed and the frequency of consumption could have been made more developed and specific, which would have given more insightful conclusions. Moreover, a comparison of consumption patterns in more countries would probably have yielded more generous managerial implications.
2.2. Statistical Analyses
2.2.1. Principal Component Analysis
The principal component analysis (PCA) is a multivariate projection method which has been used for a long time in many different sciences, such as economics, agriculture, psychology, etc. A detailed description of the PCA can be found elsewhere (see, for example, Ref. Jolliffe) [64]. The main advantage of using the PCA in multivariate dataset analysis is related to its graphical interpretation. It projects the main features of a multivariate data table onto a low-dimensional image of the data structure. The algorithm that calculates the PC model finds the directions, called principal components, that have the largest variation and represent the data as well as possible. Each principal component (PC) is a combination of all variables in the table and can therefore not be assigned to only one of the original variables. In such cases, the principal component tries to pick out a few variables that covary. One usually calculates at least two PC components, so that a two-dimensional plot can be constructed. Such a plot is named a PC1-PC2 scatter plot, and provides a useful approach for summarizing graphically explained variance, most often in the form of groups of objects or groups of variables.
One of the advantages of introducing the PCA is its ability to map data in both objects and variable domains at the same time. Thus, a biplot is constructed, which can be a very efficient way of extracting useful information for classification task.
2.2.2. Classical Statistical Model
The differences in FV consumption are influenced not only by the socio-demographic characteristics of consumers and their income status, the impact of which was studied using the PCA method, but also by the economic conditions of a country. The paper uses a classic statistical model to verify whether there is a regional correlation between the endogenous/explained variables studied (i.e., daily intake of fruit and vegetables in portions and frequency of their consumption) and the exogenous/explanatory variable (i.e., gross domestic product (GDP) per capita in euro) for 27 elements (27 EU countries). It was assumed that the remaining exogenous variables are constant and do not affect the differences in FV consumption. The Pearson’s correlation coefficient r was calculated to check whether the linear model is the appropriate predictor of observations, and the determination coefficient R2 to inform if the linear regression model fits the empirical data.
2.2.3. Software
Here, STATISCICA® 8.0 software (StatSoft, Tulsa, OK, USA) and Matlab® software 7.11.2 (Mathworks Inc., Natick, MA, USA) with the PLS Toolbox 6.0 (Eigenvector Research Inc., Wenatchee, WA, USA) were applied for the data exploration and the PCA analysis.
3. Results and Discussion
3.1. Analysis of Fruit and Vegetable Consumption of Residents of EU Countries Using PCA
3.1.1. Evaluation of the Homogeneity of the Structure of EU Countries in Terms of Daily Consumption of Fruit and Vegetables
To assess the homogeneity of the structure of EU countries in terms of consumption of fruit and vegetables, indicators showing their daily consumption by consumers were taken into account. The results of EHIS [62] indicate that the current average dose of fruit and vegetables consumed is lower than the recommended one, and the formation and development of appropriate dietary patterns among the inhabitants of Europe leave much to be desired. In 2019, only 12.4% of the European adult population declared that they eat the recommended five or more servings of fruit or vegetables per day, and every second European surveyed admitted that they eat one to four servings of fruit and vegetables per day (54.7%). As many as one in three people (32.9%) in the EU declared that they do not eat any fruit or vegetables during the day. The principal design of a PCA strategy for the investigation of a daily intake of fruit and vegetables for each of the 27 European countries is given in Figure 1. It is advisable to name objects organized in the matrix X1 in a way that reflects their known external properties. To look for patterns, it is useful to encircle groups of objects (countries) with the same intake level. In this plot, one can clearly see the separation (the PC1 direction explains 63% of the original variance). The intake level seems to be the most important factor that differentiates fruit and vegetable consumption in Europe. However, the regional affiliation is also recognizable for the PC2 direction, which explains 21% of the variance. It should be noted that the respondents who confirmed eating “5 portions or more” per day show a much more homogeneous group structure compared to others (EHIS). The lower the level of the declared fruit and vegetable portions is, the more expressive the differences between countries are (see, for instance, that there is an object in the lower right corner SI_0 and LV_0 in the upper right side).
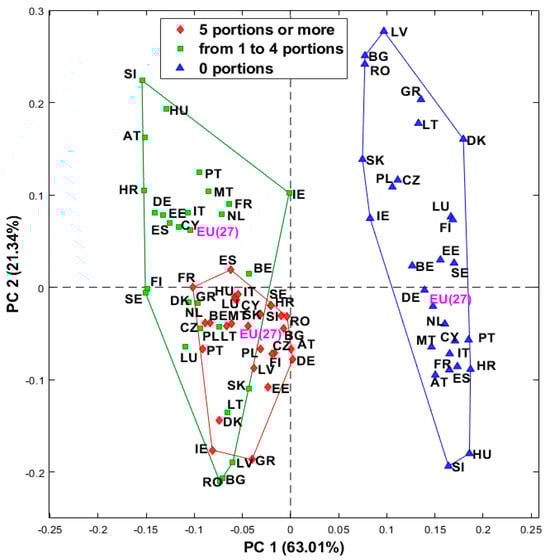
Figure 1.
PC1−PC2 scatter plot of 27 European countries scored by three levels of fruit and vegetable daily intake. Source: own work based on Eurostat. 2022. Your Key to European Statistics. Available online: https://ec.europa.eu/eurostat/web/main/data/database (accessed on 23 June–18 July 2023).
3.1.2. Comparison of EU Countries to the Synthetic Pattern of Consumption of Five Portions of Fruit and Vegetables
Deficiencies in the number of daily servings of fruit and vegetables consumed are visible in individual countries. The essential information about consumer behaviour in Europe can be presented graphically. Since “5 or more portions” of fruits and vegetables daily is recommended by the WHO, it is therefore useful to generate a synthetic scheme of the model with the required properties. In this study, we assumed that a very realistic example accepts 20% of the answers “from 1 to 4 portions” and 80% of “5 or more portions”. Any negative behaviours, i.e., answers “0 portions”, are unacceptable [62]. For the purpose of comparison, the dataset for 27 European countries with total %, i.e., not stratified by gender, age, educational attainment, and income quintile were analysed in such a way that a composite score was calculated by increasing up 100% to the % assigned the answer “5 portion or more”, and reducing by the % of answers of “0 portions”, as shown in Figure 2. It is proven that consumers in Ireland, Belgium and France are more oriented towards healthy diets, with a high level of daily portions of fruit and vegetables. These countries, in their behaviour, are the closest to the synthetic model of sustainable consumption of five portions of fruit and vegetables per day. Among all EU countries (27), Ireland appears to be the closest to a sustainable FV consumption pattern. In line with the recommended dietary guidelines, Ireland introduced a zero VAT rate on fruit and vegetables in 2010 to increase their consumption; however, even so, the people of this country still fall short of the recommended intake of fruits and vegetables, consuming 3.9 servings per day compared to the recommended 7 servings per day [65]. At the other extreme, with the smallest number of responses pointing to five or more servings of fruits and vegetables, were countries such as Romania, Latvia and Bulgaria. The problem of insufficient consumption of these products in the aforementioned countries is often addressed in the literature [66,67,68].
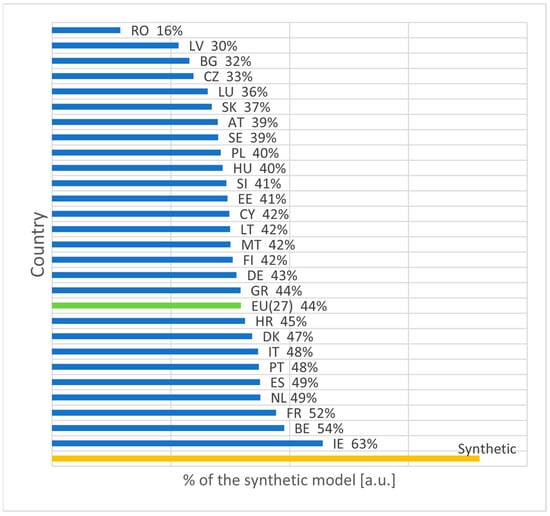
Figure 2.
The ranking of the 27 European countries according to fruit and vegetable daily intake compared to the synthetic model. Source: own work based on Eurostat. 2022. Your Key to European Statistics. Available online: https://ec.europa.eu/eurostat/web/main/data/database (accessed on 23 June–18 July 2023).
The impact of regional affiliation on FV consumption was also demonstrated by Stea et al. [56], who conducted a cross-sectional study in 21 European countries and analysed the logistic regression of variables. According to the study, respondents living in Eastern Europe had the lowest chance of eating fruit and vegetables, and those from Southern and Northern Europe the highest.
3.1.3. The Strength of the Influence of the Demographic and Socio-Economic Characteristics of Consumers on Inequalities in Fruit and Vegetable Consumption
As mentioned in the introduction, the discrepancies in fruit and vegetable consumption and the impact of socio-demographic and economic characteristics of consumers and regional conditions have already been researched by other authors [43,44,45,46,47,48,49,50,51,52,53,54]. In our article, we examined which of the factors from Table 1 mainly influence the inequities in consumer behaviour in different European countries. In Figure 3, the coefficients that determine PC2 can be found. This plot can be used to study how the original factors covary, and what their impact is on the discrepancies in the results in the 27 European countries. Two sets of factors, those with positive PC2 (in descending order of value: 65 years or over, level 0–2, first quintile, second quintile, males, from 45 to 64 years, third quintile) and those with negative PC2 (levels 5–8, fifth quintile, from 15 to 24 years, from 25 to 34 years, from 35 to 44 years, fourth quintile, females, from 45 to 54 years) can be distinguished. The magnitude of the variables in the PC direction approximates their variances; the higher the variance, the more important the factor is in the inequities identification. This leads to the conclusion that mostly age, then educational attainment, income, and finally gender are the factors that are responsible for differences in vegetable and fruit consumption in different European countries. Moreover, in each of the four demographic criteria subgroups, differences in the behaviour are indicated, since their PC2 coefficients have opposite signs, e.g., negative PC2 for the group of younger people, and positive PC2 for older people. In conclusion, the result confirms the association between the consumption of fruit and vegetables in Europe and gender, age, educational attainment, and socio-economic situation. This result is in line with other findings saying that education and income have discriminant power with regard to consumer behaviour [56].
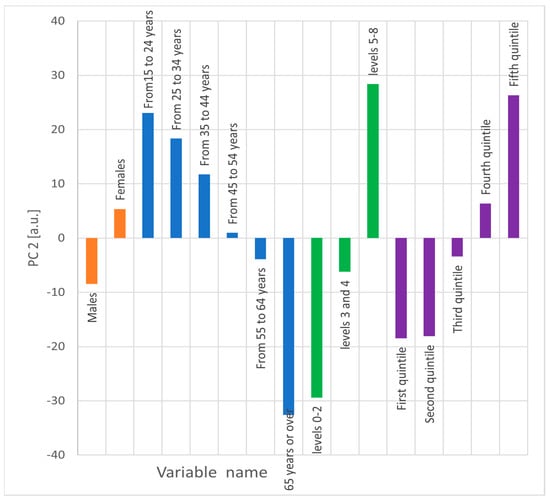
Figure 3.
The correlation of variables associated with gender, age, educational attainment and income with the second principal component direction. Source: own work based on Eurostat. 2022. Your Key to European Statistics. Available online: https://ec.europa.eu/eurostat/web/main/data/database (accessed on 23 June–18 July 2023).
3.1.4. Fruit and Vegetable Consumer Profiles: Who Is Closer to Sustainable Consumption?
To gain a detailed understanding of a typical European consumer’s profile regarding fruit and vegetable consumption, the second step of the proposed study is to update the analysis using the effects of consumption frequency. The results of the PCA analyses for fruit and vegetable consumption and fresh juice drinking are presented separately as biplots (Figure 4 and Figure 5, respectively). No significant differences exist in the demographic and socio-economic characteristics (profiles) of consumers in terms of the frequency of fruit consumption as well as vegetable consumption; therefore, the results are presented in one plot. According to Figure 4, four clusters of consumers are identified based on preferences for 16 objects associated with gender (2 objects), age (4 objects), education level (3 objects), and income (5 objects). Cluster 1 displayed consumers who are females and have a high education level and higher income. It can be found that members of cluster 1 are associated with high values of “5 portions or more” and “once a day_v”. Cluster 2 integrates older people with “once a day_f” and “and “1_4 portions”. Cluster 3 captures a different preference. It contains consumers that are less oriented towards fruit and vegetable nutrition. Cluster 3 includes males, less educated people, and people with a relatively low income. Members of cluster 4 are between 25 and 44 years old. They declared fruit and vegetable consumption “from 4 to 6 times a week”. The position of the object that represents the youngest respondents (Y_15_24) has a specific preference. It shows a strong correlation with “0 portion”, and at the same time reveals some correlation with high-frequency fruit and vegetable consumption.
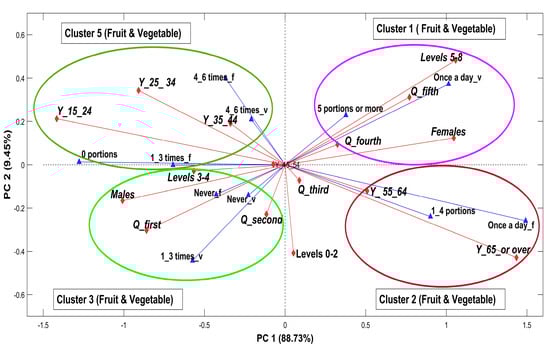
Figure 4.
The PCA biplot exploring the intercorrelation between the frequency of fruit and vegetable intake, daily intake, and factors determining consumer behaviour such as gender, age, educational attainment and income quintile. Source: own work based on Eurostat. 2022. Your Key to European Statistics. Available online: https://ec.europa.eu/eurostat/web/main/data/database (accessed on 23 June–18 July 2023).
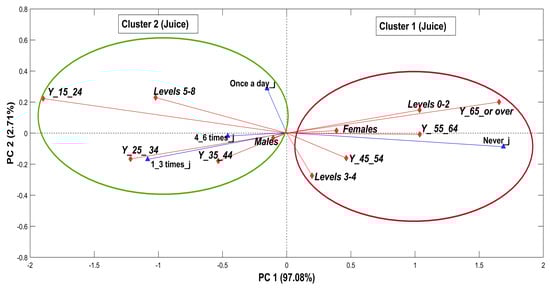
Figure 5.
The PCA biplot exploring the intercorrelation between the frequency of drinking pure fruit or vegetable juice and factors determining consumer behaviour such as gender, age, and educational attainment. Source: own work based on Eurostat. 2022. Your Key to European Statistics. Available online: https://ec.europa.eu/eurostat/web/main/data/database (accessed on 23 June–18 July 2023).
The results confirmed previous studies, which showed that the goal of eating five servings of fruits and vegetables a day was least likely to be met in groups with lower socio-economic status (e.g., lower education and income) and those living in disadvantaged areas [8,50,69,70,71,72]. The profiles of consumers eating five or more servings of fruits and vegetables per day coincide with the highest frequency of consumption; vice versa, 0 servings coincides with the lowest frequency of consumption. Summarizing the results of our analyses, consumers who consume both fruit and vegetables 4–6 times a week or at least once a day are women, people over 65 years of age, people with higher education, and people the highest income (Cluster 1 and Cluster 2, according to the PCA analysis). On the other hand, those who were most likely to claim that they consume fruit and vegetables only 1 to 3 times a week and occasionally or never are men, people aged 15–24, people with primary education, and people the lowest income (Clusters 3 and 4).
To compare our analysis with the previous study conducted by Stea et al. [56], estimates such as odd ratios (OR) are summarized in Table 4. The results confirmed no significant differences in fruit and vegetable consumption among woman and men in 2019 compared to 2014. However, we can see changes in consumer behaviours according to their education level. Increased odds of FV consumption are observed among low-educated Europeans (OR 1.19 and OR 1.08, respectively). As before, higher education is associated with a more sustainable diet; however, the strength of this relationship is smaller (OR 1.41 (2019) compared to 1.53 (2014) for fruit and OR 1.56 (2019), and compared to 1.86 (2014) for vegetable consumption.
Table 4.
Odds ratio (OR) comparison according to gender and education level with the previous study by Stea et al. [56].
3.1.5. Profiles of Consumers of Fruit or Vegetable Juices
In addition, the article analyzes the frequency of consumption of fruit or vegetable juices and creates consumer profiles. Our analysis of data obtained with EHIS showed that 11.2% of all respondents from Europe consumed pure fruit and vegetable juices at least once a day; 19.1% of them did so from 1 to 3 times a week, 6.2% from 4 to 6 times a week, and as much as 63.5% never or occasionally. The consumption patterns of fruit and vegetable juices and nutrients in the diets of children and adults were studied in France by Francou et al. [73]. They compared their study with the results for the United States [19]. Data from both France and the United States showed that the consumption of fruit and vegetable juices was well below the recommended standards. Our results also showed that the European adult population consumed fruit and vegetable juices with a much lower frequency than whole fruit and vegetables.
In the case of the frequency of consumption of fruit or vegetable juices, the demo-graphic and social characteristics of consumers differed from the previously described consumer profiles of whole fruit and vegetables. This was confirmed by the PCA analysis and the created profiles (clusters) of fruit or vegetable juice consumers. As can be seen in Figure 5, the first PC dimension (97% variance explained) is mainly associated with a contrast between younger and elderly consumers. It can be seen that the younger and more highly educated people are, the more they drink fresh juice. Such a distribution is a consequence of the fact that the older generation drinks less fresh fruit and vegetable juices than the younger generation, despite actually being more prone to health problems. Cluster 1 includes countries wherein consumers, usually the oldest, and women, with primary or secondary education, most often declared that they do not consume fruit and vegetable juices. The second cluster consists of men, younger consumers, and those with higher education who consume juices once a day or several times a week.
Similar results were obtained by Francou et al. [73]. According to the conducted multivariate analyses, there was a significant relationship between higher consumption of fruit and vegetable juices and diet quality, which persisted after taking into account socio-demographic covariates. Higher scores were associated with the younger age group and children usually had a higher quality diet than adults. Diet quality was also higher for men than for women. Juice consumption also increased with education and less sedentary lifestyle. The frequency of consumption of fruit juices was also studied by Murphy et al. [74]. According to their study, more frequent consumption of juices (≥0.5 times a day) was associated with higher consumption of fruit and vegetables in general, whole fruit, plus energy, total sugars, vitamin C and potassium. In addition, they pointed out that the consumption of fruit juices contributes to increased consumption of vitamin C and potassium, as well as energy and sugars in total, which is a compromise that consumers need to balance.
3.2. The Impact of Countries’ Economic Development on the Consumption of Fruit and Vegetables
The study sought to answer the question of whether the number of portions and frequency of consumption of fruit and vegetables in a given EU country depends on its economic development. The economic development of the countries was determined on the basis of their real GDP per capita in EUR. Based on the analyses, it was established that significant positive relationships exist only between the indicator taken into account and the consumption of five servings of fruit and vegetables per day. Thus, it can be said without a doubt that the higher the level of economic development, the closer the consumption of fruits and vegetables in these countries is to the balanced pattern of five servings per day. The correlations were, respectively, rxy for GDP in 2019 = 0.539; rxy for GDP in 2020 = 0.563; and rxy for GDP in 2021 = 0.593. The remaining positive or negative values of the calculated correlations do not always rationally confirm the impact of differences in the level of economic development of a country on differences in the share of responses. These relationships are insignificant, so no clear conclusions can be drawn from them (Table 5).
Table 5.
The relationships between the economic development of EU countries (27) and the number of daily portions and the frequency of consumption of fruit and vegetables and pure fruit or vegetable juices.
As can be seen in the scatter plot between real GDP per capita (EUR) in the EU (27) and consumption of five portions or more of fruit and vegetables, there is a positive correlation between these indicators. In Bulgaria and Romania, the countries with the lowest economic development in the EU, citizens are the least likely to consume five or more portions of fruit and vegetables per day. Conversely, in countries such as the Netherlands, Denmark and Ireland, the high level of economic development is reflected in the exemplary consumption of these products (Figure 6). It should be emphasized that the calculated coefficient of determination, R2 = 0.2962, shows that the economic development index taken into account (real GDP per capita in euro) accounts for only 30% of the variability of the obtained responses on “consumption of 5 servings and more of fruit and vegetables a day”; the remaining 70% are other factors that are not related to the economic development of a country.
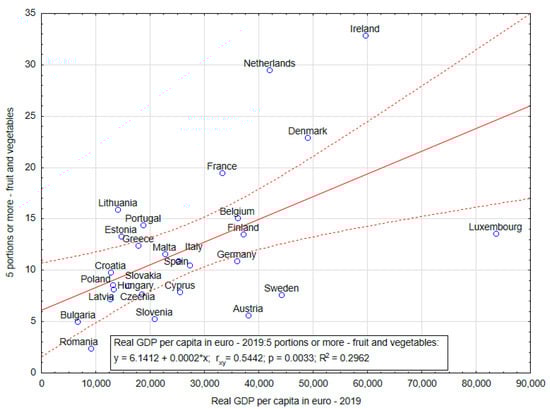
Figure 6.
The scatterplot and correlations between real GDP per capita in euro in the EU (27) and consumption of five or more portions of fruit and vegetables (data for 2019). Source: own work based on Eurostat. 2022. Your Key to European Statistics. Available online: https://ec.europa.eu/eurostat/web/main/data/database (accessed on 23 June–18 July 2023).
3.3. The Idea of Using Consumer Profiles to Promote Fruit and Vegetable Consumption
Despite a number of community-wide campaigns to promote the advantages of eating fruit and vegetables, the observed consumer behaviour shows that the level of their consumption is not significantly improving [12,14,28,75,76,77,78]. The results of the research conducted so far indicate that promotional campaigns may have a limited impact on promoting FV consumption [16,79,80,81,82,83]. Verain et al. [82] points to the “one-size-fits-all” approach to consumer behaviour as a potential reason for the ineffectiveness of these campaigns. Other mistakes may include excessive focus on health benefits while omitting other aspects related to their consumption [79,84], e.g., motives for choice (eating more food and vegetables, eating more frequently at home and eating out less frequently) [82,85], sensory appeal, losing weight [86], aesthetic considerations [21], care for the environment [87], and convenience [88]. Talking about these aspects can strengthen the message and boost the campaign’s effectiveness. Good results were achieved by combining education with ecology [87,89] and referring to aesthetic standards set by retailers [21].
Grouping and creating profiles of fruits and vegetables consumers with specific and different preferences for the consumption of portions and frequencies of these products based on the PCA can be used to build marketing strategies, which is a key element for improving policies aiming to increase FV consumption, update solutions and recommendations for problems related to low consumption of fruits and vegetables in the diet of Europeans, and promote a healthy lifestyle. The similarities and differences between the consumer profiles, representative of Europe, can also provide valuable tips for businesses. This may apply to distributors and retailers of fruit and vegetables and institutions developing marketing activities aiming to increase the consumption of edible fruits and vegetables [86,90,91,92], shorten supply chains [93,94], reduce the amount of fruit and vegetables wasted in households [21], and implement practices to reduce waste without increasing consumer costs [95].
4. Conclusions
According to the EHIS, only 12.4% of the EU adult population reported consuming the recommended five daily servings or more of fruit or vegetables in 2019, with the frequency of consumption of vegetables higher than fruit, and fruit or vegetable juices. Therefore, the goal of this paper was an identification of consumer profiles for sustainable fruit and vegetable consumption, taking into account selected demographic and socio-economic characteristics of European residents. Utilizing the PCA approach, a comprehensive study according to regional affiliation, gender, age, educational attainment, and income quintile was carried out. With this projection method, the respondents were divided into classes based on how similar their diets regarding fruit and vegetable consumption are.
The results of the PCA proved that EU consumers generally are linked according to the daily dose outcomes. The respondents who indicated consumption of “5 servings or more of fruit and vegetables” showed a much more homogeneous structure in the study group, whilst the group who declared “0 portion” showed the greatest discrepancies. Regional affiliation seems to have important implications for this arrangement.
The main advantage of using PCA relates to the fact that this technique allows us to integrate different consumer characteristics (gender, age, etc.) in one common advanced analysis. The following conclusions were derived from the PCA results of this study:
- age, education level, income level, and finally gender are the factors responsible for inequalities in fruit and vegetable consumption;
- four consumer profiles of fruit and vegetable can be distinguished;
- two consumer profiles of fruit or vegetable juices are indicated.
In the case of consumption of fruit and vegetables, the first two profiles (cluster 1 and cluster 2) are made up of consumers declaring the consumption of five servings a day and every day or several times a week. In this way, they are closer to sustainable food consumption. These are usually women, people with higher education, people with high incomes, and the elderly. Cluster 3 and cluster 4 are made up of consumers who are reluctant to consume healthy and sustainable foods. These are usually men, people with secondary education, people with low incomes, and young people. Interestingly, men and young people, if more reluctant to consume raw fruit and vegetables, are relatively more frequent fruit and vegetable juice consumers (as shown in cluster 2, which describes the consumption of juices). It should be mentioned that the PCA analysis presented in this study could be an initial step toward further investigation. The clusters currently being developed via PCA are well suited for analysis using an ANOVA (analysis of variance) to test how country of residence, gender, etc. affect the individual groups.
Another factor that differentiates the consumption of fruit and vegetables is the level of economic development of the country. Countries with a comparatively lower level of economic development, which is reflected in consumers’ incomes, deviate the most from the desired pattern of consumption of “at least 5 portions of fruit and vegetables a day”, and do not follow the model of sustainable consumption.
During this study, it was confirmed that the average daily dose of fruit and vegetables consumed is significantly lower than recommended. The EU countries that are closest to the synthetic pattern of sustainable consumption of “5 servings of FV” are Ireland, Belgium, and France. At the other extreme are Romania, Bulgaria, and Latvia.
Managerial Implications and Future Perspectives
Care should be taken to increase the amount of fruit and vegetables in the diet of the Europeans, increasing their consumption to at least 400 g/day. Funds should be directed to social marketing companies that provide consistent messages in order to adopt more healthy and sustainable practices. In developing public health policies and practices across Europe, findings on the impact of demographic and socio-economic characteristics, regional affiliation, and national economic development and their effects on inequalities in fruit and vegetable consumption should be considered.
A good strategy is the continuous monitoring of consumer profiles, paying attention to the amount and frequency of fruit and vegetable consumption, as well as focusing on actions aiming to increase their consumption. The present work verified the thesis formulated in ref. Stea et al. [56], and confirmed that five years later, fruit and vegetables are consistently undervalued in the diet of Europeans. This proves that actions towards sustainable food consumption are of a significant value, not only in the field of marketing, but also in social sciences in general.
The results provide new insights into the profiles of fruit and vegetable consumers in the EU and the fulfilment of WHO guidelines on portion sizes and frequency of consumption. They provide conclusions for individuals and professionals working in the field developing the fruit and vegetable consumption. Institutions at international level, state bodies, agri-food industry leaders, NGOs, and the local community, using modern methods and marketing communication tools, must make continuous efforts to prevent low consumption of fruit and vegetables, especially among men, people with lower education levels and incomes, and particularly the residents of Romania, Latvia, and Bulgaria. Research is also needed to assess the effectiveness of different types of measures aiming to increase fruit and vegetable consumption among EU consumers.
The consumer profiles we have identified, as well as the observations of Stea et al. show the detailed socio-economic characteristics of different consumer groups in the EU, including the under-consumption of fruit and vegetables by the EU consumers, and confirm that increasing consumers’ awareness is necessary. Care should be taken to build good information and education campaigns in the EU countries, taking into account the need to adapt the content of messages to the different profiles of fruit and vegetable consumers. The vast majority of the information spread in modern media is aimed at younger consumer groups, which can, in particular, limit opportunities for people aged 65+ to obtain practical and reliable information that is appropriate for their age and health status.
In the area of education and information strategies, it seems useful to analyse if message senders use appropriate communication instruments and tools that take into account the needs of specific consumer groups (e.g., younger and older age groups), and, in particular, if the content of the messages created does not result in lower consumption of fruit or vegetables at the consumer level in households (e.g., when it comes to encouraging to the consumption of leftovers).
It will also be interesting to describe the nutritional quality and the environmental impact of self-selected diets of adult consumers in relation to, among other things, fruit and vegetable consumption. It could be further explored whether consumption of fruit and vegetables, following WHO recommendations, is associated with lower environmental impact. More communication on the advantages of fruit and vegetables is needed to change the dietary choices of individuals with low fruit and vegetable consumption. Given the advantages of fruits and vegetables for human health and the environment, such areas of research are worth exploring further. For example, an information campaign focusing on the production methods of fruit and vegetables with low environmental pressure (e.g., micro-irrigation of tomatoes) or based on non-chemical plant protection, could be considered; this would make it easier for consumers to choose the right products.
Author Contributions
Conceptualization, E.G.-G. and A.M.; methodology, E.G.-G., A.M. and G.B.-C.; software, E.G.-G., A.M. and G.B.-C.; validation, E.G.-G., A.M. and G.B.-C.; formal analysis, E.G.-G., A.M. and G.B.-C.; investigation, E.G.-G., A.M. and G.B.-C.; resources, E.G.-G., A.M. and G.B.-C.; data curation, E.G.-G., A.M. and G.B.-C.; writing—original draft preparation, E.G.-G., A.M. and G.B.-C.; writing—review and editing, E.G.-G., A.M. and G.B.-C.; visualization, E.G.-G., A.M. and G.B.-C.; supervision, E.G.-G. and A.M. All authors have read and agreed to the published version of the manuscript.
Funding
This research received no external funding.
Institutional Review Board Statement
Not applicable.
Informed Consent Statement
Not applicable.
Data Availability Statement
Not applicable.
Conflicts of Interest
The authors declare no conflict of interest.
Appendix A
Table A1.
Information on data details relevant to the purpose of the research project.
Table A1.
Information on data details relevant to the purpose of the research project.
| Data description The aim of the European health interview survey (EHIS) is to measure, in a harmonized way and with a high degree of comparability among Member States (MS), the health status (including disability) and health determinants (lifestyle) of the EU citizens and the use of care health services and restrictions on access to them. EHIS was developed between 2003 and 2006. EHIS is a general population survey, and health variables describe general population health, health determinants, and the use of health care services. The general scope of the study covers the population aged 15 or over, living in private households. |
| Available countries and time series As of 2020, three waves of EHIS have been implemented.
|
For the purpose of this article, the data for EHIS wave 3 included in Health determinants module such as Consumption of fruit, vegetable and juice were used according to the following indicators:
|
| Selected basic EHIS variables related to demographics and socio-economic characteristics included in the article: Sex: females, males. Age: the age completed at the time of the interview. 10-year age groups (15–24, 25–34, …, 75+) are used by default for most indicators. In addition, other age groups varying among indicators are used. Educational attainment level: the education attainment levels of individuals are classified according to the International Standard Classification of Education (ISCED) version of 1997 (wave 1) and version of 2011 (wave 2), and are grouped as follows:
The data (of each person) are ordered according to the value of the total equivalised disposable income. Four cut-point values (the so-called quintile cut-off points) of income, which divide the survey population into five groups equally, represented by 20% of individuals each, are found:
Country of residence: Country: Austria (AT), Belgium (BE), Bulgaria (BG), Croatia (HR), Cyprus (CY), Czechia (CZ), Denmark (DK), Estonia (EE), Finland (FI), France (FR), Germany (DE), Greece (GR), Hungary (HU), Ireland (IE), Italy (IT), Latvia (LV), Lithuania (LT), Luxembourg (LU), Malta (MT), Netherlands (NL), Poland (PL), Portugal (PT), Romania (RO), Slovakia (SK), Slovenia (SI), Spain (ES), Sweden (SE). |
| EHIS data collection—data are collected using questionnaires and obtained through face-to-face interviews, telephone interviews, self-administered questionnaires, or a combination of these methods, depending on the country, in electronic or non-electronic form. |
| Unit of measure—all indicators are calculated in terms of percentages. |
| Survey time and sample size from each country (look Table A2) The survey year for the third wave of EHIS was as follows:
|
| Free online data can be found at the website http://ec.europa.eu/eurostat/web/health/database (accesed on 20 October 2023) in the relevant modules: health status (hlth_state), health determinants (hlth_det) and health care (hlth_care). |
Table A2.
Sample size in the national EHIS wave 3.
Table A2.
Sample size in the national EHIS wave 3.
| Country | Achieved Sample Size for HS3 | Achieved Effective Sample Size for HS3 | Minimum Effective Sample Size (3) |
|---|---|---|---|
| AT | 15,461 | 12,778 | 6104 |
| BE | 9644 | 5880 | 6502 |
| BG | 7540 | 5273 | 5738 |
| CY | 6156 | 6413 | 3829 |
| CZ | 7993 | 7612 | 6391 |
| DE | 23,001 | 9056 | 12,963 |
| DK | 6629 | 6629 | 5442 |
| EE | 4881 | 4833 | 4063 |
| GR | 8125 | 7004 | 6437 |
| ES | 22,072 | 13,882 | 10,390 |
| FI | 6251 | 6251 | 5384 |
| FR (1) | 14,192 | : | 11,705 |
| HR | 5461 | 1986 | 5041 |
| HU | 5603 | 7004 | 6268 |
| IE | 7621 | 5115 | 5169 |
| IT | 45,962 | 32,597 | 11,449 |
| LT | 4923 | 5075 | 4648 |
| LU | 4504 | 4416 | 3661 |
| LV | 6033 | 12,066 | 4325 |
| MT (1) | 4413 | : | 3583 |
| NL | 8194 | 7587 | 7376 |
| PL | 19,959 | 11,088 | 9603 |
| PT (2) | 14,617 | 7236 | 6374 |
| RO (1) | 16,186 | : | 7656 |
| SE | 9757 | 8131 | 6280 |
| SI | 9900 | 9706 | 4395 |
| SK | 5527 | 5527 | 5372 |
(1) Information not available for the design effect of HS3 variable. In France, simulations showed during the construction of the new master sample, the design effect could be small, and the assumption was that 12,000 respondents would be sufficient to fulfil the precision requirements set by the regulation. (2) Average design effect calculated for HS3; at NUTS II level around 1.4; design effect calculated for HS3 at national level: 2.02. (3) Estimated by Eurostat using the formula from Annex II Precision requirements of Commission Regulation (EU) No 2018/255 of 19 February 2018, where a = 1200, b = 2800 and N is the population aged 15 or over residing in private households in million persons and rounded to three decimal digits (data for the 2019 reference year used in the computation, demo_pjanbroad). ‘:’ Information not available. Source: Quality report of the third wave of the European Health Interview Survey 2022 edition, Statistical Reports, Luxembourg: Publications Office of the European Union, 2022, s. 19; https://ec.europa.eu/eurostat/documents/7870049/14937972/KS-FT-22-002-EN-N.pdf/40912c04-ac9d-012c-358e-111efe0a8976?t=1659613423879 (accessed on 20 October 2023).
References
- European Commission (EC). Communication from the Commission to the European Parliament, the Council, the European Economic and Social Committee and the Committee of the Regions. Closing the Loop—An EU Action Plan for the Circular Economy; European Commission COM (2015) 614 Final; European Union: Brussels, Belgium, 2015; p. 21. Available online: https://eur-lex.europa.eu/resource.html?uri=cellar:8a8ef5e8-99a0-11e5-b3b7-01aa75ed71a1.0012.02/DOC_1&format=PDF (accessed on 19 September 2023).
- European Commission (EC). Communication from the Commission to the European Parliament, the Council, the European Economic and Social Committee and the Committee of the Regions a Farm to Fork Strategy for a Fair, Healthy and Environmentally-Friendly Food System; COM/2020/381 Final; European Union: Brussels, Belgium, 2020; p. 20. Available online: https://eur-lex.europa.eu/legal-content/EN/TXT/?uri=celex%3A52020DC0381 (accessed on 19 September 2023).
- FAO; IFAD; UNICEF; WFP; WHO. The State of Food Security and Nutrition in the World 2022. Repurposing Food and Agricultural Policies to Make Healthy Diets More Affordable; FAO: Rome, Italy, 2022. [Google Scholar] [CrossRef]
- FAO; IFAD; UNICEF; WFP; WHO. The State of Food Security and Nutrition in the World 2021. Transforming Food Systems for Food Security, Improved Nutrition and Affordable Healthy Diets for All; FAO: Rome, Italy, 2021; Available online: https://data.unicef.org/resources/sofi-2021/ (accessed on 14 September 2023).
- FAO. Fruit and Vegetables–Your Dietary Essentials: The International Year of Fruits and Vegetables, 2021, Background Paper; FAO: Rome, Italy, 2020; ISBN 978-92-5-133709-7. Available online: https://www.fao.org/3/cb2395en/online/cb2395en.html (accessed on 15 September 2023). [CrossRef]
- Cois, A.; Abdelatief, N.; Steyn, N.; Turawa, E.B.; Awotiwon, O.F.; Roomaney, R.A.; Neethling, I.; Joubert, J.D.; Pacella, R.; Bradshaw, D.; et al. Estimating the Burden of Disease Attributable to a Diet Low in Fruit and Vegetables in South Africa for 2000, 2006 and 2012. South Afr. Med. J. 2022, 112, 617–626. [Google Scholar] [CrossRef] [PubMed]
- Ridoutt, B.; Baird, D.; Hendrie, G.A. Diets with Higher Vegetable Intake and Lower Environmental Impact: Evidence from a Large Australian Population Health Survey. Nutrients 2022, 14, 1517. [Google Scholar] [CrossRef] [PubMed]
- Amin, M.; Zhou, S.; Safi, A. The Nexus between Consumption-Based Carbon Emissions, Trade, Eco-Innovation, and Energy Productivity: Empirical Evidence from N-11 Economies. Environ. Sci. Pollut. Res. 2022, 29, 39239–39248. [Google Scholar] [CrossRef] [PubMed]
- Springmann, M.; Spajic, L.; Clark, M.A.; Poore, J.; Herforth, A.; Webb, P.; Rayner, M.; Scarborough, P. The Healthiness and Sustainability of National and Global Food Based Dietary Guidelines: Modelling Study. BMJ 2020, 370, m2322. [Google Scholar] [CrossRef]
- Afshin, A.; Sur, P.J.; Fay, K.A.; Cornaby, L.; Ferrara, G.; Salama, J.S.; Mullany, E.C.; Abate, K.H.; Abbafati, C.; Abebe, Z.; et al. Health Effects of Dietary Risks in 195 Countries, 1990–2017: A Systematic Analysis for the Global Burden of Disease Study 2017. Lancet 2019, 393, 1958–1972. [Google Scholar] [CrossRef]
- Boeing, H.; Bechthold, A.; Bub, A.; Ellinger, S.; Haller, D.; Kroke, A.; Leschik-Bonnet, E.; Müller, M.J.; Oberritter, H.; Schulze, M.; et al. Critical Review: Vegetables and Fruit in the Prevention of Chronic Diseases. Eur. J. Nutr. 2012, 51, 637. [Google Scholar] [CrossRef]
- Morgan, E. Fruit and Vegetable Consumption and Waste in Australia Recommendations towards a Food Supply System Framework; Victorian Health Promotion Foundation: Melbourne, Australia, 2009; p. 64. Available online: www.vichealth.vic.gov.au (accessed on 15 September 2023).
- Kamphuis, C.B.M.; Giskes, K.; de Bruijn, G.-J.; Wendel-Vos, W.; Brug, J.; van Lenthe, F.J. Environmental Determinants of Fruit and Vegetable Consumption among Adults: A Systematic Review. Br. J. Nutr. 2006, 96, 620–635. [Google Scholar]
- Lock, C.; Pomerleau, J.; Causer, L.; McKee, M. Low Fruit and Vegetable Consumption; WHO: Rome, Italy, 2004; Available online: https://www.jstor.org/stable/pdf/resrep27829.14.pdf (accessed on 15 September 2023).
- Woś, J.; Rachocka, J.; Kasperek-Hoppe, M. Zachowania Konsumentów-Teoria i Praktyka (Consumer Behaviour-Theory and Practice), 2nd ed.; Wydawnictwo Uniwersytetu Ekonomicznego w Poznaniu: Poznań, Poland, 2011. [Google Scholar]
- Appleton, K.M.; Krumplevska, K.; Smith, E.; Rooney, C.; McKinley, M.C.; Woodside, J.V. Low Fruit and Vegetable Consumption Is Associated with Low Knowledge of the Details of the 5-a-Day Fruit and Vegetable Message in the UK: Findings from Two Cross-Sectional Questionnaire Studies. J. Hum. Nutr. Diet. 2018, 31, 121–130. [Google Scholar] [CrossRef]
- Boca, G.D. Factors Influencing Consumer Behavior in Sustainable Fruit and Vegetable Consumption in Maramures County, Romania. Sustainability 2021, 13, 1812. [Google Scholar] [CrossRef]
- De Filippo, A.; Meldrum, G.; Samuel, F.; Tuyet, M.T.; Kennedy, G.; Adeyemi, O.A.; Ngothiha, P.; Wertheim-Heck, S.; Talsma, E.F.; Shittu, O.O.; et al. Barrier Analysis for Adequate Daily Fruit and Vegetable Consumption among Low-Income Residents of Hanoi, Vietnam and Ibadan, Nigeria. Glob. Food Secur. 2021, 31, 100586. [Google Scholar] [CrossRef]
- Darmon, N.; Drewnowski, A. Contribution of Food Prices and Diet Cost to Socioeconomic Disparities in Diet Quality and Health: A Systematic Review and Analysis. Nutr. Rev. 2015, 73, 643–660. [Google Scholar] [CrossRef] [PubMed]
- Miller, V.; Yusuf, S.; Chow, C.K.; Dehghan, M.; Corsi, D.J.; Lock, K.; Popkin, B.; Rangarajan, S.; Khatib, R.; Lear, S.A.; et al. Availability, Affordability, and Consumption of Fruits and Vegetables in 18 Countries across Income Levels: Findings from the Prospective Urban Rural Epidemiology (PURE) Study. Lancet Glob. Health 2016, 4, e695–e703. [Google Scholar] [CrossRef] [PubMed]
- Barbe, F.; von Dewitz, P.; Gonzalez-Triay, M. Understanding Consumer Behaviour to Develop Competitive Advantage: A Case Study Exploring the Attitudes of German Consumers towards Fruits with Cosmetic Flaws. Int. J. Acad. Res. Bus. Soc. Sci. 2017, 7, 554–580. [Google Scholar] [CrossRef] [PubMed]
- Mead, D.; Ransom, K.; Reed, S.B.; Sager, S. The Impact of the COVID-19 Pandemic on Food Price Indexes and Data Collection: Monthly Labor Review; U.S. Bureau of Labor Statistics: Washington, DC, USA, 2020.
- Smoluk-Sikorska, J.; Jabłońska-Porzuczek, L.; Kalinowski, S. Wybrane zagadnienia potencjału konkurencyjności przedsiębiorstw przetwórstwa owocowo-warzywnego zlokalizowanych na terenie województwa wielkopolskiego (Selected issues of competitiveness potential of fruit and vegetable processing companies located in the Wielkopolskie voivodeship). J. Agribus. Rural. Dev. 2014, 33, 253–261. [Google Scholar]
- WHO. 2020. Healthy Diet; WHO: Geneva, Switzerland, 2022; Available online: www.who.int/news-room/fact-sheets/detail/healthy-diet (accessed on 14 July 2023).
- Global Nutrition Report. Action on Equity to End Malnutrition; Development Initiatives: Bristol, UK, 2020; Available online: https://globalnutritionreport.org/ (accessed on 14 June 2023).
- Produce for Better Health Foundation. Available online: https://fruitsandveggies.org/recipes/ (accessed on 18 October 2022).
- Willett, W.; Rockström, J.; Loken, B.; Springmann, M.; Lang, T.; Vermeulen, S.; Garnett, T.; Tilman, D.; DeClerck, F.; Wood, A.; et al. Food in the Anthropocene: The EAT–Lancet Commission on Healthy Diets from Sustainable Food Systems. Lancet 2019, 393, 447–492. [Google Scholar] [CrossRef]
- Goryńska-Goldmann, E.; Mytko, W. Zrównoważona Konsumpcja Żywności. Wybrane Działania Wspierające Jej Rozwój (Sustainable Food Consumption. Selected Initiatives to Support Its Development); Wydawnictwo Difin Sp z o.o.: Warsaw, Poland, 2021. [Google Scholar]
- Verain, M.C.D.; Bartels, J.; Dagevos, H.; Sijtsema, S.J.; Onwezen, M.C.; Antonides, G. Segments of Sustainable Food Consumers: A Literature Review. Int. J. Consum. Stud. 2012, 36, 123–132. [Google Scholar] [CrossRef]
- Reisch, L.; Eberle, U.; Lorek, S. Sustainable Food Consumption: An Overview of Contemporary Issues and Policies. Sustain. Sci. Pract. Policy 2013, 9, 7–25. [Google Scholar] [CrossRef]
- Pieńkowski, D.; Murawska, A.; Zaremba-Warnke, S. Zrównoważona Konsumpcja. Wyzwanie Dla Społeczeństw w Dobie Globalizacji (Sustainable Consumption: A Challenge for Societies in the Era of Globalization); Wydawnictwo Texter Sp. z o.o.: Warsaw, Poland, 2018. [Google Scholar]
- UNEP Environment. Annual Report. Seizing the Green Opportunity. 2009. Available online: http://www.unep.org/resources/annual-report/unep-2009-annual-report (accessed on 23 October 2023).
- FAO; WHO. Second International Conference on Nutrition: Framework for Action; Conference Outcome Document: Framework for Action; FAO: Rome, Italy, 19–21 November 2014; Available online: https://www.fao.org/3/mm215e/mm215e.pdf (accessed on 23 October 2023).
- WHO; FAO. Sustainable Healthy Diets: Guiding Principles; FAO: Rome, Italy, 2019; Available online: https://iris.who.int/bitstream/handle/10665/329409/9789241516648-eng.pdf?sequence=1 (accessed on 23 October 2023).
- European Commission (EC); Directorate-General for Research and Innovation; Group of Chief Scientific Advisors (European Commission). Towards Sustainable Food Consumption: Executive Summary; Publications Office of the European Union: Luxembourg, 2023; Available online: https://op.europa.eu/en/web/eu-law-and-publications/publication-detail/-/publication/9f582c41-1565-11ee-806b-01aa75ed71a1 (accessed on 23 October 2023)ISBN 978-92-68-03285-5.
- Grunert, K.G. Consumer Attitudes and Views on Sustainable Food System. Available online: https://food.ec.europa.eu/system/files/2020-11/f2f_conf_20201016_pres-01.pdf (accessed on 23 October 2023).
- Macdiarmid, J.; Keyle, J.; Horgan, G.; Loe, J.; Fyfe, C.; McNeil, G. Livewell: A Balance of Healthy and Sustainable Food Choices; Livewell Report 2011; WWF-UK: Woking, UK, 2011; p. 64. Available online: http://assets.wwf.org.uk/downloads/livewell_report_corrected.pdf (accessed on 23 October 2023).
- Wojciechowska-Solis, J.; Śmiglak-Krajewska, M. Being a Product Consumer during the COVID-19 Pandemic: Profile of the Polish Consumer in the Organic Dairy Market. Br. Food J. 2022, 125, 2350–2367. [Google Scholar] [CrossRef]
- O’Rourke, D.; Lollo, N. Transforming Consumption: From Decoupling, to Behavior Change, to System Changes for Sustainable Consumption. Annu. Rev. Environ. Resour. 2015, 40, 233–259. [Google Scholar] [CrossRef]
- Murawska, A. Uwarunkowania i Tendencje Zmian Konsumpcji Żywności w Polsce. Wydatki. Spożycie. Determinanty. Zróżnicowanie. (Conditions and Trends in Food Consumption Changes in Poland. Expenses. Consumption. Determinants. Diversity); Wydawnictwa Uczelniane Politechniki Bydgoskiej: Bydgoszcz, Poland, 2023. [Google Scholar]
- Thøgersen, J. Concise Introduction to Sustainable Consumption; Edward Elgar Publishing: Cheltenham, UK, 2023; ISBN 978-1-80392-451-9. [Google Scholar]
- Jakubowska, D.; Sadílek, T. Sustainably Produced Butter: The Effect of Product Knowledge, Interest in Sustainability, and Consumer Characteristics on Purchase Frequency. Agric. Econ. 2023, 69, 25–34. [Google Scholar] [CrossRef]
- Amini, M.; Najafi, F.; Kazemi Karyani, A.; Pasdar, Y.; Samadi, M.; Moradinazar, M. Does Socioeconomic Status Affect Fruit and Vegetable Intake? Evidence from a Cross-Sectional Analysis of the RaNCD Cohort. Int. J. Fruit Sci. 2021, 21, 779–790. [Google Scholar] [CrossRef]
- Mokari, A.; Sadeghian-Sharif, S.; Nattagh-Eshtivani, E.; salehi-sahlabadi, A.; Ghavami, A.; Barati, M.; Ebrahimi-Mameghani, M. Socioeconomic Inequality in Fruit and Vegetable Consumptions in Elderly People: A Cross Sectional Study in North West of Iran. Nutr. Food Sci. Res. 2019, 6, 17–22. [Google Scholar] [CrossRef]
- Schreinemachers, P.; Simmons, E.B.; Wopereis, M.C.S. Tapping the Economic and Nutritional Power of Vegetables. Glob. Food Secur. 2018, 16, 36–45. [Google Scholar] [CrossRef]
- Parks, C.A.; Blaser, C.; Smith, T.M.; Calloway, E.E.; Oh, A.Y.; Dwyer, L.A.; Liu, B.; Nebeling, L.C.; Yaroch, A.L. Correlates of Fruit and Vegetable Intake among Parents and Adolescents: Findings from the Family Life, Activity, Sun, Health, and Eating (FLASHE) Study. Public Health Nutr. 2018, 21, 2079–2087. [Google Scholar] [CrossRef]
- de Menezes, M.C.; Diez Roux, A.V.; Souza Lopes, A.C. Fruit and Vegetable Intake: Influence of Perceived Food Environment and Self-Efficacy. Appetite 2018, 127, 249–256. [Google Scholar] [CrossRef]
- Liu, H.; Hall, J.J.; Xu, X.; Mishra, G.D.; Byles, J.E. Differences in Food and Nutrient Intakes between Australian- and Asian-Born Women Living in Australia: Results from the Australian Longitudinal Study on Women’s Health. Nutr. Diet. 2018, 75, 142–150. [Google Scholar] [CrossRef]
- Shahraki, M.; Ghaderi, S. Socioeconomic Factors Determining Fruit and Vegetable Consumption among Urban Households in Iran. J. Res. Health 2017, 7, 887–898. [Google Scholar]
- Azagba, S.; Sharaf, M.F. Disparities in the Frequency of Fruit and Vegetable Consumption by Socio-Demographic and Lifestyle Characteristics in Canada. Nutr. J. 2011, 10, 118. [Google Scholar] [CrossRef]
- Salehi, L.; Eftekhar, H.; Mohammad, K.; Tavafian, S.S.; Jazayery, A.; Montazeri, A. Consumption of Fruit and Vegetables among Elderly People: A Cross Sectional Study from Iran. Nutr. J. 2010, 9, 2. [Google Scholar] [CrossRef]
- Riediger, N.D.; Shooshtari, S.; Moghadasian, M.H. The Influence of Sociodemographic Factors on Patterns of Fruit and Vegetable Consumption in Canadian Adolescents. J. Am. Diet. Assoc. 2007, 107, 1511–1518. [Google Scholar] [CrossRef]
- Prättälä, R.; Paalanen, L.; Grinberga, D.; Helasoja, V.; Kasmel, A.; Petkeviciene, J. Gender Differences in the Consumption of Meat, Fruit and Vegetables Are Similar in Finland and the Baltic Countries. Eur. J. Public Health 2007, 17, 520–525. [Google Scholar] [CrossRef] [PubMed]
- Wagstaff, A. The Bounds of the Concentration Index When the Variable of Interest Is Binary, with an Application to Immunization Inequality. Health Econ. 2005, 14, 429–432. [Google Scholar] [CrossRef] [PubMed]
- Gazdecki, M.; Goryńska-Goldmann, E.; Kiss, M.; Szakály, Z. Segmentation of Food Consumers Based on Their Sustainable Attitude. Energies 2021, 14, 3179. [Google Scholar] [CrossRef]
- Stea, T.H.; Nordheim, O.; Bere, E.; Stornes, P.; Eikemo, T.A. Fruit and Vegetable Consumption in Europe According to Gender, Educational Attainment and Regional Affiliation—A Cross-Sectional Study in 21 European Countries. PLoS ONE 2020, 15, e0232521. [Google Scholar] [CrossRef]
- Dias, P.G.I.; Sajiwani, J.W.A.; Rathnayaka, R.M.U.S.K. Consumer Perception and Sensory Profile of Probiotic Yogurt with Added Sugar and Reduced Milk Fat. Heliyon 2020, 6, e04328. [Google Scholar] [CrossRef]
- Bratkowski, G.R.; Backes, V.; Olinto, M.T.; Henn, R.L. Identification of Dietary Patterns by Principal Component Analysis in Schoolchildren in the South of Brazil and Associated Factors. Rev. Bras. Saude Mater. Infant. 2020, 20, 735–745. [Google Scholar] [CrossRef]
- Thorpe, M.G.; Milte, C.M.; Crawford, D.; McNaughton, S.A. A Comparison of the Dietary Patterns Derived by Principal Component Analysis and Cluster Analysis in Older Australians. Int. J. Behav. Nutr. Phys. Act. 2016, 13, 30. [Google Scholar] [CrossRef]
- Hearty, Á.P.; Gibney, M.J. Dietary Patterns in Irish Adolescents: A Comparison of Cluster and Principal Component Analyses. Public Health Nutr. 2013, 16, 848–857. [Google Scholar] [CrossRef]
- Canuto, R.; Camey, S.; Gigante, D.P.; Menezes, A.M.B.; Olinto, M.T.A. Focused Principal Component Analysis: A Graphical Method for Exploring Dietary Patterns. Cad. Saude Publica 2010, 26, 2149–2156. [Google Scholar] [CrossRef]
- European Health Interview Survey (EHIS). Information on Data Details Relevant for Research Project Proposals. Available online: https://ec.europa.eu/eurostat/web/microdata/european-health-interview-survey (accessed on 12 September 2023).
- Eurostat. Health Database. 2023. Available online: https://ec.europa.eu/eurostat/web/health/database (accessed on 20 October 2023).
- Jolliffe, I.T. Principal Component Analysis, 2nd ed; Springer Series in Statistics (SSS); Springer: New York, NY, USA, 2002; ISBN 978-0-387-95442-4. [Google Scholar] [CrossRef]
- Tamminen, A.C.M.; Duport, G.; Serrano, R.A.; Babich, S.M. Increasing Fruit and Vegetable Consumption in Ireland. South East Eur. J. Public Health (SEEJPH) 2022, 3. [Google Scholar] [CrossRef]
- Ladaru, G.-R.; Ilie, D.M.; Diaconeasa, M.C.; Petre, I.L.; Marin, F.; Lazar, V. Influencing Factors of a Sustainable Vegetable Choice. The Romanian Consumers’ Case. Sustainability 2020, 12, 9991. [Google Scholar] [CrossRef]
- Stefler, D.; Bobak, M. Does the Consumption of Fruits and Vegetables Differ between Eastern and Western European Populations? Systematic Review of Cross-National Studies. Arch. Public Health 2015, 73, 29. [Google Scholar] [CrossRef] [PubMed][Green Version]
- Schätzer, M.; Rust, P.; Elmadfa, I. Fruit and Vegetable Intake in Austrian Adults: Intake Frequency, Serving Sizes, Reasons for and Barriers to Consumption, and Potential for Increasing Consumption. Public Health Nutr. 2010, 13, 480–487. [Google Scholar] [CrossRef] [PubMed]
- de Jong, E.; Visscher, T.L.S.; HiraSing, R.A.; Seidell, J.C.; Renders, C.M. Home Environmental Determinants of Children’s Fruit and Vegetable Consumption across Different SES Backgrounds. Pediatr. Obes. 2015, 10, 134–140. [Google Scholar] [CrossRef]
- Glen, K.E.; Thomas, H.M.; Loebach, J.E.; Gilliland, J.A.; Gobert, C.P. Fruit and Vegetable Consumption Among Children: In a Socioeconomically Disadvantaged Neighbourhood. Can. J. Diet. Pract. Res. 2013, 74, 114–118. [Google Scholar] [CrossRef]
- Hughes, R.J.; Edwards, K.L.; Clarke, G.P.; Evans, C.E.L.; Cade, J.E.; Ransley, J.K. Childhood Consumption of Fruit and Vegetables across England: A Study of 2306 6-7-Year-Olds in 2007. Br. J. Nutr. 2012, 108, 733–742. [Google Scholar] [CrossRef]
- Dubowitz, T.; Heron, M.; Bird, C.E.; Lurie, N.; Finch, B.K.; Basurto-Dávila, R.; Hale, L.; Escarce, J.J. Neighborhood Socioeconomic Status and Fruit and Vegetable Intake among Whites, Blacks, and Mexican Americans in the United States. Am. J. Clin. Nutr. 2008, 87, 1883–1891. [Google Scholar] [CrossRef]
- Francou, A.; Hebel, P.; Braesco, V.; Drewnowski, A. Consumption Patterns of Fruit and Vegetable Juices and Dietary Nutrient Density among French Children and Adults. Nutrients 2015, 7, 6073–6087. [Google Scholar] [CrossRef]
- Murphy, M.M.; Barraj, L.M.; Brisbois, T.D.; Duncan, A.M. Frequency of Fruit Juice Consumption and Association with Nutrient Intakes among Canadians. Nutr. Health 2020, 26, 277–283. [Google Scholar] [CrossRef]
- Ubiparip, S.; Pezo, L.; Mastilović, J.; Kovač, R.; Zoranović, T.; Vlahović, B. Modeling Fruit and Vegetable Consumption in Serbia. Food Feed. Res. 2022, 49, 127–137. [Google Scholar] [CrossRef]
- Halicka, E.; Rejman, K. Fruit and Vegetable Promotion Programs in the European Union. Probl. World Agric. 2007, 01, 38–45. Available online: https://cejsh.icm.edu.pl/cejsh/element/bwmeta1.element.cejsh-from-agro-7fa8b523-d492-4e94-8185-3e32dccfcfb3?q=bwmeta1.element.cejsh-from-agro-6308f0a4-98de-4249-944e-2f573e5326e0;4&qt=CHILDREN-STATELESS (accessed on 12 July 2023).
- Pollard, C.M.; Miller, M.R.; Daly, A.M.; Crouchley, K.E.; O’Donoghue, K.J.; Lang, A.J.; Binns, C.W. Increasing Fruit and Vegetable Consumption: Success of the Western Australian Go for 2&5 Campaign. Public Health Nutr. 2008, 11, 314–320. [Google Scholar] [CrossRef] [PubMed]
- Jayawardena, R.; Jeyakumar, D.T.; Gamage, M.; Sooriyaarachchi, P.; Hills, A.P. Fruit and Vegetable Consumption among South Asians: A Systematic Review and Meta-Analysis. Diabetes Metab. Syndr. 2020, 14, 1791–1800. [Google Scholar] [CrossRef] [PubMed]
- Ashfield-Watt, P.A.L. Fruits and Vegetables, 5+ a Day: Are We Getting the Message Across? Asia Pac. J. Clin. Nutr. 2006, 15, 245–252. [Google Scholar]
- Capacci, S.; Mazzocchi, M. Five-a-Day, a Price to Pay: An Evaluation of the UK Program Impact Accounting for Market Forces. J. Health Econ. 2011, 30, 87–98. [Google Scholar] [CrossRef] [PubMed]
- Carter, O.B.J.; Pollard, C.M.; Atkins, J.F.P.; Marie Milliner, J.; Pratt, I.S. “We’re Not Told Why–We’re Just Told”: Qualitative Reflections about the Western Australian Go for 2&5® Fruit and Vegetable Campaign. Public Health Nutr. 2011, 14, 982–988. [Google Scholar] [CrossRef]
- Verain, M.C.D.; Sijtsema, S.J.; Taufik, D.; Raaijmakers, I.; Reinders, M.J. Motive-Based Consumer Segments and Their Fruit and Vegetable Consumption in Several Contexts. Food Res. Int. 2020, 127, 108731. [Google Scholar] [CrossRef]
- Englund, T.R.; Hedrick, V.E.; Patiño, S.R.-G.; Kennedy, L.E.; Hosig, K.W.; Serrano, E.L.; Kraak, V.I. Awareness and Outcomes of the Fruits and Veggies (FNV) Campaign to Promote Fruit and Vegetable Consumption among Targeted Audiences in California and Virginia: A Cross-Sectional Study. BMC Public Health 2021, 21, 1100. [Google Scholar] [CrossRef]
- Putra, S.; Dewi, Y.; Soemanto, R. The Effectiveness of Web-Based Health Promotion Intervention on Fruits Consumption in Children in America, Australia, and Europe. In Proceedings of the 7th International Conference on Public Health, Solo, Indonesia, 18–19 November 2020. [Google Scholar]
- O’Neal, C.S.; Cocco, A.R.; Della, L.J.; Ashlock, M.Z. Pilot Intervention Using Food Challenges and Video Technology for Promoting Fruit and Vegetable Consumption. J. Nutr. Educ. Behav. 2022, 54, 707–717. [Google Scholar] [CrossRef]
- de Hooge, I.E.; Oostindjer, M.; Aschemann-Witzel, J.; Normann, A.; Loose, S.M.; Almli, V.L. This Apple Is Too Ugly for Me!: Consumer Preferences for Suboptimal Food Products in the Supermarket and at Home. Food Qual. Prefer. 2017, 56, 80–92. [Google Scholar] [CrossRef]
- Boucher, D.; Gagné, C.; Côté, F. Effect of an Intervention Mapping Approach to Promote the Consumption of Fruits and Vegetables among Young Adults in Junior College: A Quasi-Experimental Study. Psychol. Health 2015, 30, 1306–1325. [Google Scholar] [CrossRef] [PubMed]
- Stangierska, D.; Kowalczuk, I.; Widera, K.; Olewnicki, D.; Latocha, P. Innovation as a Factor Increasing Fruit Consumption: The Case of Poland. Nutrients 2022, 14, 1246. [Google Scholar] [CrossRef] [PubMed]
- Brown, O.N.; O’Connor, L.E.; Savaiano, D. Mobile MyPlate: A Pilot Study Using Text Messaging to Provide Nutrition Education and Promote Better Dietary Choices in College Students. J. Am. Coll. Health 2014, 62, 320–327. [Google Scholar] [CrossRef] [PubMed]
- Normann, A.; Röding, M.; Wendin, K. Sustainable Fruit Consumption: The Influence of Color, Shape and Damage on Consumer Sensory Perception and Liking of Different Apples. Sustainability 2019, 11, 4626. [Google Scholar] [CrossRef]
- Makhal, A.; Thyne, M.; Robertson, K.; Mirosa, M. “I Don’t like Wonky Carrots”—An Exploration of Children’s Perceptions of Suboptimal Fruits and Vegetables. J. Retail. Consum. Serv. 2020, 54, 101945. [Google Scholar] [CrossRef]
- Gallagher, R.; Raimondo, M.; Caracciolo, F. Eating the “Inedible”: How to Improve the Consumption of the Perceived Inedible Parts of Fruits and Vegetables in Ireland and Italy? Food Qual. Prefer. 2022, 99, 104548. [Google Scholar] [CrossRef]
- Tanasă, L.; Ulman, S.; Cautisanu, C.; Brumă, I.; Juravle, D. Vegetables Consumers’ Profile in the Context of Digitalization: Evidence from Romania. Amfiteatru Econ. 2022, 24, 128–142. [Google Scholar] [CrossRef]
- Tort, Ö.Ö.; Vayvay, Ö.; Çobanoğlu, E. A Systematic Review of Sustainable Fresh Fruit and Vegetable Supply Chains. Sustainability 2022, 14, 1573. [Google Scholar] [CrossRef]
- Mason-D’Croz, D.; Bogard, J.R.; Sulser, T.B.; Cenacchi, N.; Dunston, S.; Herrero, M.; Wiebe, K. Gaps between Fruit and Vegetable Production, Demand, and Recommended Consumption at Global and National Levels: An Integrated Modelling Study. Lancet Planet. Health 2019, 3, e318–e329. [Google Scholar] [CrossRef]


Disclaimer/Publisher’s Note: The statements, opinions and data contained in all publications are solely those of the individual author(s) and contributor(s) and not of MDPI and/or the editor(s). MDPI and/or the editor(s) disclaim responsibility for any injury to people or property resulting from any ideas, methods, instructions or products referred to in the content. |
© 2023 by the authors. Licensee MDPI, Basel, Switzerland. This article is an open access article distributed under the terms and conditions of the Creative Commons Attribution (CC BY) license (https://creativecommons.org/licenses/by/4.0/).