Article

The Role of Green Recruitment on Organizational Sustainability Performance: A Study within the Context of Green Human Resource Management

1
Department of Business Administration, Jinnah University for Women, Karachi 74600, Pakistan
2
School of Economics and Management, Southwest Jiaotong University, Chengdu 610031, China
3
Sheffield Business School, Sheffield Hallam University, Sheffield S1 1WB, UK
4
Faculty of Engineering and Applied Science, University of Regina, Regina, SK S4S 0A2, Canada
*
Author to whom correspondence should be addressed.
Sustainability 2023, 15(21), 15567; https://doi.org/10.3390/su152115567
Submission received: 28 September 2023 / Revised: 17 October 2023 / Accepted: 23 October 2023 / Published: 2 November 2023
(This article belongs to the Section Sustainable Management)

Abstract

:
In light of the increasing recognition among modern business communities regarding the importance of implementing environmentally sustainable practices, this study thoroughly examines the concept of green recruitment (GR) and its subsequent impact on organizational sustainability performance (OSP). Situated within the shift from conventional to contemporary organizational frameworks that prioritize capacity, this study emphasizes the crucial importance of integrating sustainability into recruitment processes. This alignment ensures that human resource practices are in line with both environmental and organizational goals. The primary purpose emerges as a thorough examination and identification of sixteen critical factors that intersect GR and OSP, using insights from both the current literature and expert viewpoints, so this fills a crucial gap in the existing research. This study utilizes an integrated ISM-DEMATEL strategy to systematically reveal the hierarchical and relational patterns that are inherent in the connections between GR and OSP variables. This technique allows for a thorough comprehension of how these variables interact with each other. The findings highlight several important variables, emphasizing the complex network of interdependencies among the elements studied. The suggested model in this research encapsulates its originality, as it not only sheds light on the interdependent interactions for policy- and decision-makers but also establishes a foundation for future research in this field.

1. Introduction

Concerns about the depletion of natural resources have arisen due to continued economic growth and expansion across the world. However, some academics have argued that, since climate change also prevents positive economic growth, global economies cannot be sustained if the current pace of natural resource consumption continues [1]. Moving toward a more environmentally friendly economy, especially through business-related endeavors, might help to solve the present environmental problems and pave the way for more sustainable economic growth in the future. Organizations are starting to set other goals in addition to competitive gain, such as a dedication to social and environmental consequences and a growing focus on social accountability and sustainable operations [2]. These objectives can be met by successfully implementing GHRM. Green Human Resource Management (GHRM) can be used to implement HRM policies that promote the sustainable utilization of resources within an organization and encourage adopting environmentally sustainable practices [3]. The utilization of GHRM practices presents a potential solution to address this particular requirement. Implementing such practices promotes the adoption of environmentally conscious behavior, enhances employees’ competencies, and fosters their willingness to contribute to the development of a sustainable culture [4]. In GHRM, green recruitment (GR) is essential because it aligns the hiring process with an organization’s sustainability goals, ensuring that the workforce contributes positively towards environmental conservation and sustainability. Green recruitment ensures that the hiring process is in line with the organization’s sustainability strategy and objectives. It helps to ensure the organization’s long-term survival and performance by bringing it in line with global sustainability trends. Furthermore, hiring individuals with a sustainability mindset can drive innovation in green products and services that leads to the effective achievement of sustainability goals.
The green recruitment (GR) concept involves selecting and hiring individuals with knowledge, competencies, techniques, and attitudes that are compatible with a particular organization’s environmental management systems. Sandi et al. [5] suggest that green recruitment practices can contribute to successful environmental management by ensuring that new employees are familiar with an organization’s environmentally friendly values and possess the necessary skills to uphold its environmental principles. The achievement of organizational sustainability is contingent upon the active participation of employees in environmentally responsive policies and initiatives [6]. Job seekers tend to prefer firms that align with their values. The increasing awareness of environmental issues has resulted in a greater emphasis on the environmental image and reputation of recruiting companies during recruitment drives. Organizations have come to acknowledge that establishing a reputation as an environmentally conscious employer is a viable strategy for attracting prospective employees [7]. According to Muduli et al. [8], organizations may contribute to local and global environmental goals through organization sustainable practices; one way they can achieve this is by hiring environmentally conscious workers who actively engage in sustainable behaviors. This can lead to a more sensible world.
The effect of GHRM practices on an organization’s performance in terms of sustainability has received substantial research from several academics. Malik et al. [9] posit that an excellent correlation exists between an organization’s financial performance and its implementation of GR practices, thereby underscoring the economic facet of sustainability. The present research examines the impact of employees’ environmental beliefs and values on OSP, as posited by Scholten et al. [10]. Implementing GHRM has been found to foster a sense of motivation and dedication among employees, creating sustainable value and a positive impact on the organization’s performance [11]. According to Davidescu et al. [12], green recruitment and organizational sustainability are intrinsically linked; GR focuses on hiring individuals with skills and knowledge in sustainable practices, ensuring that the workforce is equipped to implement and manage sustainable initiatives. Only a small number of studies, however, have concentrated on certain GHRM operations such as green recruiting, training, selection, etc. One previous study sets itself apart from prior studies by emphasizing the identification of the influence of green recruiting methods on OSP [13]. Similarly, the values and skills of recruited individuals might not always translate into effective OSP due to various organizational barriers, such as a lack of resources, support, or a clear sustainability strategy [10]. While having a green workforce is beneficial, challenges in implementing and adhering to OSP may still arise due to various factors. Thus, further research in this area is necessary to better understand and address these challenges effectively [14]. This research aims to investigate the influence and relationship factors of GR on enhancing OSP within the context of GHRM. The present study addresses the following research question (RQ): how does implementing Green Human Resource Management, particularly the factors associated with GR, contribute to OSP?
This study contributes to advances in understanding of the function of GR in OSP by offering a comprehensive, organized, and cause-and-effect analytical method. Using the powerful integrated ISM-DEMATEL approach, a combination of the Interpretive Structural Modeling (ISM) and Decision-Making Trial and Evaluation Laboratory (DEMATEL) methodologies, this study offers a novel analysis of the complex link between GR practices and OSP within the context of GHRM. Understanding the interactions and effects of these variables on the overall performance of organizations led to the development of a hierarchical structure. This strategy made use of DEMATEL to facilitate an understanding of the complex feedback loops that exist between GR methods and the numerous OSP metrics that they influence. In addition to highlighting the importance of GHRM practices in modern businesses, this study provides a methodological framework for further research in this area.
The remainder of this paper is structured as follows: The second section discusses the literature review and framework development, while the third section presents the methodology of this study, which includes techniques for identifying challenges and ranking solutions. The fourth section addresses the implementation of the method as results. The fifth section comprises the discussions on findings and research implications from theoretical and practical perspectives, and the last section presents the conclusion, limitations, and future directions of this study.

2. Literature Review

2.1. Green Recruitment (GR)

Ogbu Edeh and Okwurume [15] posits that GR is an innovative approach that organizations adopt to utilize their environmental consciousness as a fundamental criterion for hiring. GR involves using a paperless approach to minimize the potential ecological impact [15]. Online platforms such as email, online job application forms, and a global talent pool are utilized to solicit applications. The GR process involves conducting video or telephone interviews to mitigate any potential ecological impact associated with travel [16]. In contrast to conventional media such as brochures or newspaper advertising, online recruitment enables recruiters to disseminate more information simultaneously, thereby reducing the adverse ecological impact [12]. Masri and Jaaron [17] assert that GR advocates for the adoption of a recruitment strategy that prioritizes individuals who exhibit a strong passion for working in an environmentally conscious organization that is committed to upholding ecological sustainability. To facilitate the recruitment of individuals who align with an organization’s sustainability program, the company must develop job descriptions that are in line with the program’s objectives. The company’s website and other research tools that are accessible to candidates should provide a clear outline of their environmental sustainability initiatives, as suggested by Peerzadah et al. [18]. Organizations can utilize various strategies to enhance their GHRM practices during recruitment processes. These include incorporating environmental reporting and health and safety activities into job descriptions and designing interviews that assess a candidate’s potential alignment with the sustainability priorities of the organization. According to Masri and Jaaron [17], recruiters can develop a workplace training program for newly hired employees that emphasizes disseminating information regarding the sustainable protection practices, priorities, and ecological objectives of the organization.
The growing awareness and concern for environmental sustainability among employees and employers has highlighted the importance of incorporating GR initiatives. Presently, many recruitment professionals are enthusiastic and eager to be employed by an organization that promotes environmentally conscious recruitment practices. This approach has yielded benefits such as increased productivity, reduced expenses, and enhanced employee retention [14]. The concept of GR pertains to organizations’ strategies to attract and nurture skilled individuals through applying various forms of GHRM techniques [19]. Ecological concerns have impacted the recruitment strategies of organizations in the United Kingdom. According to a recent survey, the ecological performance of a company was evaluated by highly accomplished graduates as a determining factor in assessing its reputation. As documented by Mwita and Kinemo [16], the aforementioned practice refers to a criterion that job seekers adhere to before submitting their applications for employment opportunities. If the GR process is executed effectively, it can aid in subsequent stages, such as promoting employee engagement and providing green training and development opportunities [20]. According to the British Carbon Trust survey, a significant majority of employees, amounting to over 75%, prefer working with organizations that prioritize implementing a dynamic strategy aimed at reducing carbon emissions [18].

2.2. Organizational Sustainability Performance (OSP)

Consumers, the media, and policymakers believe that the environment negatively impacts businesses. As a result of this perception, organizations have been under intense pressure for the last few decades to incorporate sustainability into their management principles [21]. With regard to business sustainability, by ensuring competitiveness and safeguarding both immediate and long-term social and natural resources, performance is the concept of accommodating and managing stakeholders’ present and future wants and needs on behalf of the business [22,23]. Three pillars, “social, economic, and environmental”, make up the triple bottom line philosophy, a sustainability component. Economic sustainability encompasses the analysis and reduction of company costs, the expansion of market share, returns on investments, and the improvement of revenue and earnings compared to economic performance targets. It frequently ranks as an organization’s top priority [24]. The conservation of natural resources is crucial to achieving environmental sustainability, including businesses’ impact on the environment for sustainable economic development and intergenerational equality. According to Yong et al. [12], social sustainability is a corporate strategy that supports equality in opportunity, distribution, and finding solutions to problems with poverty, income inequality, and health and education. These ideas have significantly altered how firms conduct their operations and have substantially impacted firms’ performances [25].
Sustainable growth encompasses a business framework that prioritizes value creation through the sustained upkeep and enhancement of economic, ecological, and social capital [26]. Organizations that exhibit higher levels of OSP experience more excellent stability and achieve superior rates of return, unlike firms with lower sustainability levels. The rationales behind this phenomenon are the allure of superior human capital, additional perks extended to employees, and the impetus to foster innovation in production and processes to maintain competitiveness [27]. Implementing sustainability initiatives has the potential to enhance the standing of an organization. The management of reputation is a crucial organizational asset that requires proactive measures due to its impact on external stakeholders’ investment decisions, product selection, and employment opportunities [28]. Integrating sustainability practices within businesses has enabled numerous organizations to implement a global strategy that expands their operations across various regions worldwide. Companies prioritizing sustainability have surpassed their rivals in market share and financial performance. According to Ogbu Edeh and Okwurume [15], sustainable organizations prioritize business continuity, fostering stakeholder confidence. The incentives mentioned in the literature encompass the deduction of expenses associated with ethical relationships with external stakeholders, as well as the sustained commitment of the workforce towards the objectives of their organization [29].

2.3. Green Recruitment and Organizational Sustainability Performance

A body of the literature examines the relationship between green recruiting and an organization’s success in sustainability. Using case studies of two hotels, Haldorai et al. [30] analyzed how green commitments from upper management and green intellectual capital affected GHRM and, in turn, how this affected the hotels’ environmental performance. In the setting of higher education in a developing country, Abbas et al. [31] performed a study to explore the effect of GHRM practices on OSP. Previous studies have shown that there is a positive association between environmentally conscious recruiting methods and the economic component of sustainability [32]. Nevertheless, only a small number of research has looked into certain GHRM tasks including training, selection, and GR [33]. The impact of GR on improving OSP in the framework of GHRM is the main topic of this study. The Resource-Based View (RBV) served as the basis for the study’s theoretical framework. The research carried out by Khan et al. [34] explores the association between environmentally friendly human resource strategies—such as environmentally friendly selection and recruitment, environmentally friendly training and development, and environmentally friendly evaluation—and OSP, as shown in previous work. Mousa and Othman [33] conducted a study to examine the extent to which GHRM practices, such as GR, are implemented in healthcare organizations in Palestine. This study also aimed to evaluate the impact of these practices on OSP within this critical service sector. This study analyzed a previous paper that investigated the potential impact of GHRM practices on the environmental performance of the hotel industry. This study used an RBV theory-informed research approach to investigate the connection between GHRM procedures like green hiring, green learning, green evaluating, and green paying, and the environmental performance of Malaysia’s hotel sector [32]. A previous study has examined the noteworthy consequences of incorporating GHRM into organizational performance for both academic and industrial professionals [35]. A prior study has examined the correlation between GR and OSP, highlighting the significance of employees’ pro-environmental behaviors in the success of organizational endeavors toward environmental sustainability [36]. Jabbar and Abid [37] conducted a study that differentiated the effects of GHRM practices on environmental performance, as outlined in a previous publication. A prior research endeavor examined the impact of green manufacturing and eco-innovation on OSP, encompassing economic, environmental, and social aspects [38].

2.4. Theoretical Exposition

The RBV theory provides theoretical support for examining study variables and associated techniques. According to Raduan et al. [39], the RBV theory is a strategic management approach that stresses a firm’s internal resources and capabilities as the roots of the organization’s competitive advantage. The RBV theory posits that a company’s different resources and capabilities, including valuable assets, intellectual property, knowledge, and organizational culture, can significantly achieve long-term success and maintain a competitive edge. The RBV theory can be employed to comprehend how an organization’s environmental sustainability initiatives and practices can serve as valuable resources that entice and retain skilled individuals in GR [40]. By incorporating sustainable practices into its fundamental operations, an entity can distinguish itself from rivals and bolster its image as a socially and environmentally conscious employer. Adopting green practices and initiatives can be valuable resources that enhance an organization’s competitive advantage and sustainability, from the RBV perspective. By aligning GR with the RBV theory, organizations can effectively utilize their environmental sustainability initiatives as valuable resources to attract and retain high-performing employees. This, in turn, can significantly enhance their competitive advantage in the market and facilitate the integration of sustainable practices within the organization [41].

2.5. Literature Roundup and Contribution
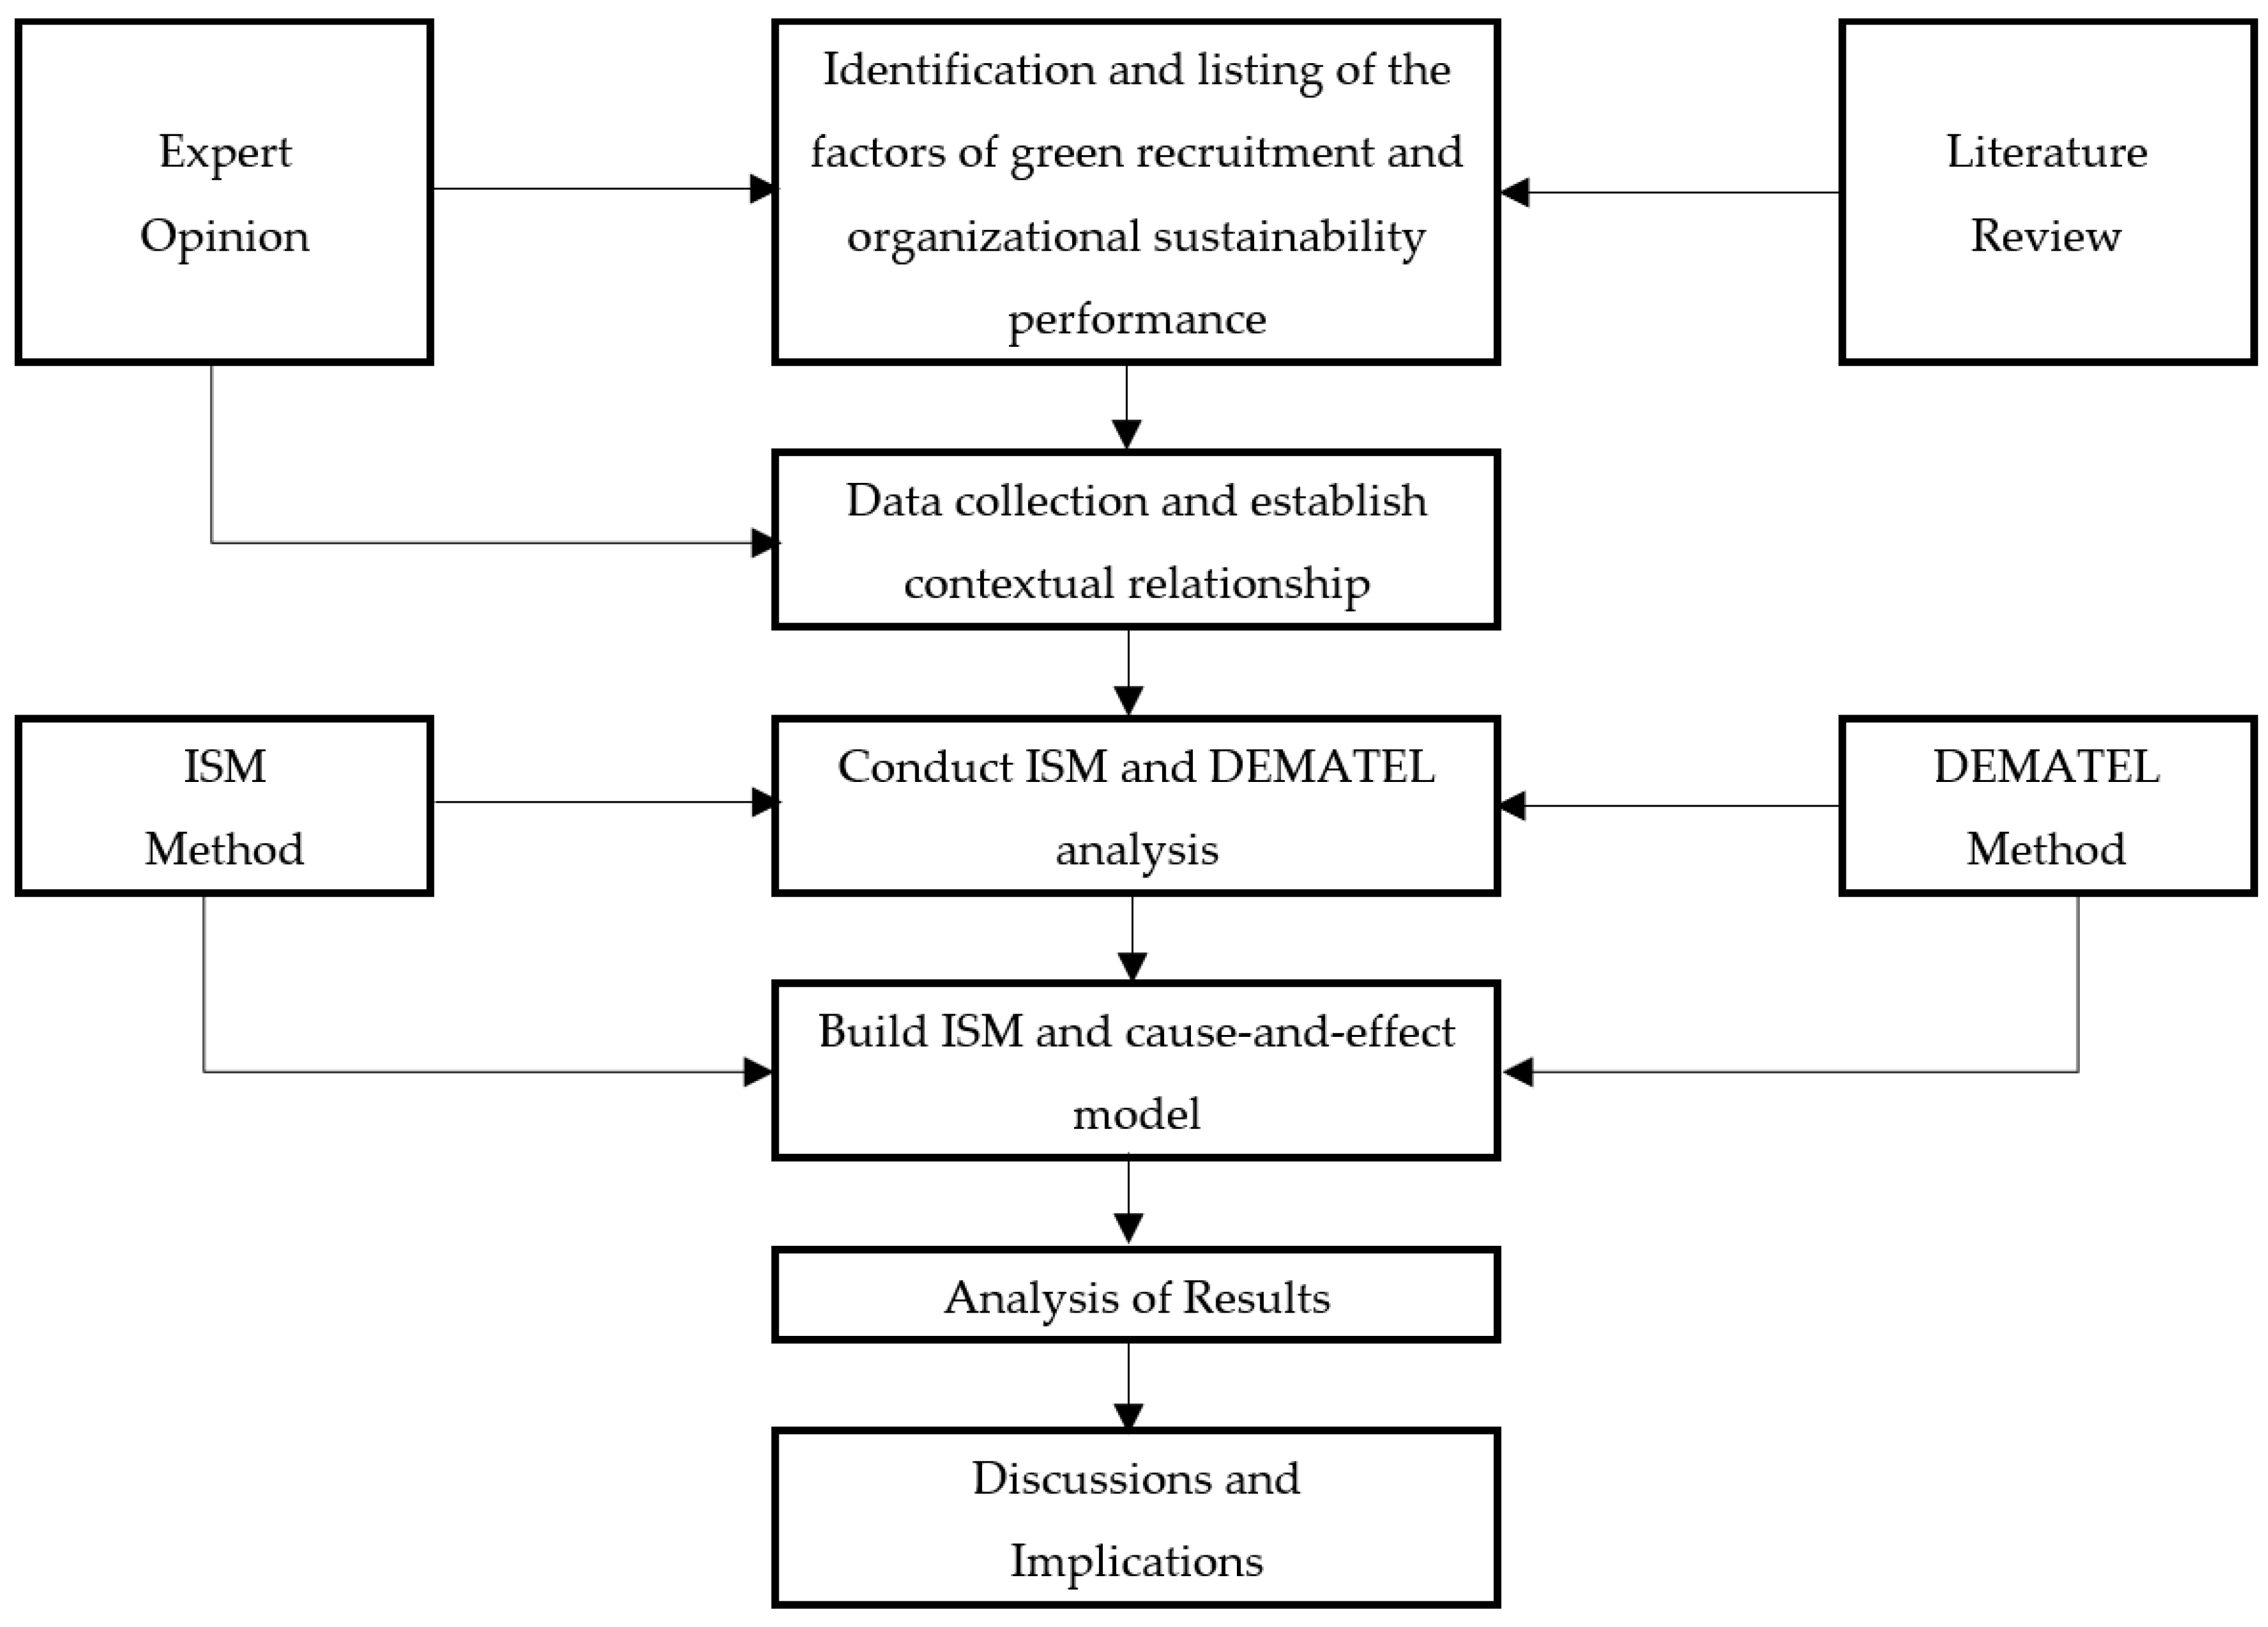
The literature mentioned above delineates that GR is a crucial strategy that companies employ. The implementation of green practices by an organization aid in the attraction of highly qualified recruits who exhibit enthusiasm toward working for environmentally conscious companies [42]. The notion of OSP encompasses fulfilling current stakeholder requirements while safeguarding both short- and long-term human and natural resources. Sustainability initiatives aid organizations in enhancing their reputation and gaining a competitive edge in terms of market dominance and financial performance. The impact of GHRM practices on OSP has been extensively examined in prior research. Prior studies have indicated that there exists a positive relationship between environmentally conscious recruiting strategies and the economic dimension of sustainability [34]. Nonetheless, GHRM activities including GR, training, and selection have only been the subject of a small number of research studies [43]. The impact of GR on improving OSP in the framework of GHRM is the main topic of this study.

3. Methodology

3.1. Role of MCDM in GR Context

An approach to Multiple Criteria Decision Making (MCDM) known as ISM clarifies the interactions and connections among the chosen/selected factors. Attri et al. [44] state that the context is better explained by the indirect and direct relationships between the variables than by the individual variable considered alone. ISM has a much wider range of applications in all disciplines that employ the MCDM technique [45,46]. Govindan et al. [47] investigated the reasons for the implementation of GR and GHRM in developing nations using the Fuzzy-DEMATEL. We learn more about DEMATEL and ISM from this work, and proceed with ISM analysis and the evaluation of essential factors. Figure 1 illustrates the framework of the proposed research methodology.

3.2. Data Collection Procedure

Data were collected for this study to investigate the aspects that determine GR’s impact on OSP. The purposive sampling expert sample approach is used to gather information from respondents. Purposive sampling allows researchers to select experts who will be able to provide insights that are both deep and broad. This method is particularly useful for the researcher to gain insights and understand the underlying reasons, opinions, and motivations related to a particular research problem. Purposive sampling, also known as judgmental, selective, or subjective sampling, is a type of non-probability sampling technique in which the population size is unknown. The data utilized in this study have undergone rigorous validation and reliability testing to ensure the robustness and credibility of the findings. The experts were chosen using a purposeful or judgmental approach as opposed to a random sample [48]. The experts had at least five years of academic and industry experience. The researchers choose the experts based on their familiarity with the topic [49]. According to Seuring and Gold [50], this method increases the validity of decision analysis-based research findings and aids in researchers staying on course with their study’s objectives.

3.3. Selection and Validation of Factors

Factors are primarily those crucial fields of knowledge upon which the achievement of an organization’s goal depends [23]. A few crucial areas where “things must go right” for the company to thrive and the manager’s goals to be achieved are known as factors. This research looked at the sixteen important factors that make up the GR factors. It also evaluates the OSP aspects, which include ethical environment, corporate reputation, minimizing environmental impact, and the triple bottom line principle. For the research, ten experts from both the academic and corporate realms were consulted. In this case, the authors employed a sampling methodology aimed at enhancing the quality of results. This approach involves carefully selecting and examining a subset of requirements, often representative of the larger set, to ensure accuracy and appropriateness. By doing so, authors can assess whether the requirements have been defined correctly and whether they meet the desired quality standards before applying them more broadly. This study used paired questionnaires for collecting response from the experts. Using MCDM procedures, a number of strategic strategies were used to meticulously evaluate and consider the data credibility. Enhancing the content validity, expert elicitation using structured questionnaires ensured that the criteria and sub-criteria were thorough and pertinent. Consistency ratios were used to verify the data’s reliability, especially with regard to the criterion weighting, and they were made to meet acceptable standards. To further ensure the validity and reliability of the decision-making process and results, robustness tests were carried out to confirm that changes in criteria weights did not significantly affect the decision-making outcomes. Each industry expert possessed a bachelor’s degree, in-depth theoretical and practical insight into GR and OSP practices, a thorough understanding of the survey instrument, and a minimum of a decade’s experience in their respective fields. These experts played a crucial role in vetting and refining the initial set of factors for GR to ensure their pertinence. Based on the judgment and experience of the expert, the five experts used a combination of tools to define requirement standards. These tools include industry-specific guidelines, benchmarking data, market research, regulatory compliance frameworks, and best practices. Additionally, they leveraged their own expertise and insights gained from practical experience within their respective fields to contribute to the definition of these standards. In the beginning, 35 potential factors were identified. Through systematic literature reviews, expert feedback, and rigorous data analysis, this list underwent iterative refinement across four distinct phases. In the first phase, the list was trimmed from 38 to 29 factors after consultations and brainstorming sessions with academic specialists, primarily to remove redundancies and overlapping factors. In the second phase, industry professionals then further condensed the list from 29 to 23 factors. Additional discussions in the third phase led to a further reduction, bringing the count from 23 down to 19 factors. In the conclusive phase, a comprehensive review by both industrial and academic experts led to the selection of the definitive 16 factors that are crucial for GR and OSP. Table 1 encapsulates the identified and verified GR and OSP enablers along with succinct descriptions. Meanwhile, Table 2 offers a detailed overview of the experts consulted.

3.4. Case Study

In this study, the Pakistani banking industry receives significant attention. The financial industry is vital to every economy in the globe. In underdeveloped countries, where resources are less mobilized than in developed nations, banks play a much more significant role in resource mobilization than in prosperous economies [70,71]. In Pakistan, the banking sector comprises around three-fourths of the financial system. Currently, 31 banks operate in Pakistan, of which 22 are local commercial institutions, and five are public-sector institutions. Six banks are the largest corporations in the economy and a sizable portion of Pakistan’s financial assets. These banks collectively control more than 57% of investment banks and 53% of communications networks, enabling them to be more selective [72]. Technological advancements in recent years have helped the banking industry grow. Long queues and overwhelming job postings have long been associated with the banking industry. The need for labor and paperwork has considerably decreased due to technological advancements in the banking sector. Web-based applications and Application Programming Interfaces (APIs), enabling cross-institutional service composition to offer and provide investment services, are heavily concentrated in digital banking. To maintain both innovation and sustainability, banks must undertake small-scale green efforts like green hiring and job descriptions [73].

3.5. Solution Methodology

The integrated ISM-DEMATEL approach has many similarities to other approaches since they both look at how numerous criteria relate to causes and outcomes. The key benefit of the integrated ISM-DEMATEL approach is important since both techniques are strong and efficient mechanisms that support the decision-making team. Even though the DEMATEL approach may employ additional possibilities, such as 0, 1, 2, 3, and 4, among the challenges to investigate the interrelationship between cause-and-effect, the ISM method’s methodological technique can only fill the evaluation matrix with binary numbers (0, 1). Kumar and Dixit [74] suggested that the integrated ISM-DEMATEL approach provides the relationship between criteria most readily. Zaman et al. [75] analyzed the health considerations in the highway job area using the integrated ISM-DEMATEL approach. Zhou and Zhang [76] developed a hierarchical framework within a complex system using an integrated ISM-DEMATEL approach. To obtain useful results, the integrated ISM-DEMATEL approach has been integrated into this study. After comparing the outcomes of the two methodologies, it has been shown that GR is the most important component in OSP. A detailed explanation of both techniques is provided in the following section.

3.5.1. ISM Method

The Interpretive Structural Modeling (ISM) method was created as a tool to aid in overcoming complicated obstacles. Figure 1 illustrates the research method that was used in this investigation. Research on operations and administrative difficulties has frequently employed ISM [74,77,78,79,80,81,82,83]. Liao and Chiu [84] conducted a study that utilized ISM to determine the links between the many difficulties associated with managing municipal solid waste. To identify the information management obstacles to the growth of affiliation among them, Singh and Kant [85] utilized the ISM technique. The following actions are a part of an ISM strategy:
Step 1: Sixteen factors are considered for the method to be employed.
Step 2: Based on the study’s objective, a contextual interrelationship is developed between the factors.
Step 3: Formation of a Structural Self-Interaction Matrix based on the contextual relationship between GR and OSP.
Step 4: To test the SSIM’s transitivity, first generate a reachability matrix from it. The transitivity of the interrelationship between the elements is one of the essential ideas behind the ISM model. If factor A is related to factor B and factor B is linked to factor C, then factor A must necessarily be linked to factor C, according to the idea of transitivity, an assumption made with the ISM method.
Step 5: Level partitioning is performed by using the reachability matrix obtained.
Step 6: A resultant graph is made based on the partition level, and the transitive links are eliminated by taking the rule of transitivity into account.
Step 7: The completed digraph becomes the hierarchical structure of the ISM by substituting statements for the barrier nodes.

3.5.2. DEMATEL Method

The Battelle Memorial Institute’s Geneva research center created the Decision-Making Trial and Evaluation Laboratory (DEMATEL) technique between 1972 and 1976. To effectively address complex management problems, it is possible to examine the causal interdependence and interaction between the various components using the DEMATEL mathematical technique [86]. By categorizing the obstacles into the cause-and-effect category and organizing workable solutions in a hierarchically structured way, the DEMATEL approach evaluates the relationships between the barriers [74,75,87,88]. The DEMATEL method involves the following phases:
Step 8: Make the first direct-relationship matrix ( A ): Each expert was required to rate the variables in this stage and produce a pairwise matrix using the comparison scale. There are five levels on the comparison scale. The first level, “0”, means “No Influence”; the second level, “1”, means “Very Low Influence”; the third level, “2”, means “Low Influence”; the fourth level, “3”, means “High influence”; and the fifth level, “4” means “Very Strong Influence”. The starting data may be recovered as a pairwise matrix, or x = [ x i j K ], which is an ( n × n ) non-negative matrix. In order to incorporate all the responses from H respondents, the initial or average direct-relation matrix, “ a i j ”, is developed by using Equation (1) as follows:
a i j = 1 H K = 1 H x i j K
where K is the number of the respondent with 1 K H
Step 9: Composition of the normalized direct-relation matrix ( D ): in this step, the direct-relation matrix is normalized using Equation (2):
D = A × λ
where λ = m n 1 m a x j = 1 n a i j , 1 m a x j = 1 n a i j
Step 10: Computing the total relation matrix ( T ): the total relation matrix is computed by using Equation (3).
T = D I D 1
where I represents the identity matrix.
Step 11: Compute the prominence (r + c) and relation (rc) value for each factor using Equations (4) and (5).
r s u m = [ b = 1 n t a b ] n × 1
c s u m = [ a = 1 n t a b ] 1 × n
Step 12: Creating a causal diagram: The vectors of the total relation matrix are represented by the sum of the rows [ r i ] and the sum of the columns [ c j ], respectively. The subsequent horizontal axis vector ( r i + c j ) labeled “Prominence” displays the total impact that factor “ i ” has contributed to and experienced. Similarly, factor “ i ” may split the vertical axis vector ( r i c j ) designated as “Relation” into a cause-and-effect group. In general, the criteria are categorized under the cause group if ( r i c j ) is positive and under the effect group if ( r i c j ) is negative [89].

4. Analysis of Results

4.1. ISM Analysis

4.1.1. Development of Structural Self-Interaction Matrix

The following four terms denote the direction of the link between the two factors, A and B, in developing a Structural Self-Interaction Matrix (SSIM):
V—Factor A will facilitate attaining Factor B.
A—Factor B will facilitate attaining Factor A.
X—Factors A and B will facilitate attaining each other.
O—Factors A and B have no relation.
Based on the mutual relationship among the factors, an SSIM was made. The SSIM was discussed with experts. Based on their responses, the factor “F1” (i.e., effective performance) leads to factor “F14” (i.e., economic sustainability), signified by the term “V”. Factor “F12” (i.e., ethical environment) will help factor “F9” (i.e., employees’ environmental beliefs) as the desired goal, so symbol “A” is assigned, and so on (refer Table 2).

4.1.2. Reachability Matrix

In this step, by replacing V, A, X, and O with binary digits, the SSIM is transformed into an initial reachability matrix. The replacement is carried out by following the rules, which are as follows:
In the SSIM, if the (i,j) entry is signified as symbol V, then in the initial reachability matrix, the (i,j) entry becomes “1”, and the (j,i) cell entry becomes “0”.
In the SSIM, if the (i,j) entry is signified as A, then in the initial reachability matrix, the (i,j) entry becomes “0”, and the (j,i) cell entry becomes “1”.
In the SSIM, if X signifies the (me, j) entry, then in the initial reachability matrix, the (i,j) entry becomes “1”, and the (j,i) cell entry becomes “1”.
In the SSIM, if O signifies the (me, j) entry, then in the initial reachability matrix, the (i,j) entry becomes “0”, and the (j,i) cell entry becomes “0”.
Based on this substitution, Table 3 develops and displays the first reachability matrix for factors. The transitivity idea, which states that if factor “A” is correlated with factor “B” and factor “B” is correlated with factor “C”, then factor “A” is inevitably associated with factor “C”, is integrated into the matrix after the initial reachability matrix to achieve final reachability: Table 4 lists both the underlying and dependent powers of each element. The final reachability matrix is the foundation for calculating power dependency and driving variables. The creation of the ISM hierarchical structure also level-partitions the pieces according to the final reachability matrix. In contrast, the Cross-Impact Matrix Multiplication Applied to Classification (MICMAC) analysis aids in performing both component driving and dependency power.

4.1.3. Level Partitions

The final reachability matrix is used to establish each factor’s reachability and antecedent set based on suggestions made by Warfield [46]. The components that make up a factor’s reachability include the factor itself and additional aspects that it can aid in achieving. The components and other circumstances that can help to achieve them make up the precedent. After locating the reachability and context set for each factor, the intersections of these two sets are determined seen in Table 5. All interactions are represented as “1”, while the effective transitive links are represented as “1 *”. The factor is regarded as at Level I and is given the top factor position in the ISM model hierarchy if the reachability and intersection sets are identical [79]. After Level I is attained, iteration 1 is finished, and the factors responsible for Level I are distinguished from the other factors. Similarly, iterations are carried out to determine each function’s levels.
ISM Level I
Table 6 shows that social sustainability (F16) is placed at Level I in the ISM-based hierarchical model.
ISM Level II
Table 6 implies that corporate website (F7), employees’ environmental beliefs (F9), human capital (F11), organization’s legitimacy (F13), economic sustainability (F14), and environmental sustainability (F15) are positioned at Level II.
ISM Level III
In the ISM hierarchy, the triple bottom line principle (F10) is located at Level III.
ISM Level IV
Factor “F12” (i.e., ethical environment) is placed at Level IV.
ISM Level V
Factor “F8” (i.e., minimizing environmental impact) is set at Level V.
ISM Level VI
Green awareness (F2), corporate reputation (F4), job advertisements (F5), and green job description (F6) are placed at Level VI.
ISM Level VII
Effective performance (F7) is placed at Level VII.
ISM Level VIII
Attracting new talent (F3) is positioned at Level VIII. The final iteration level of each factor is given in Table 7.

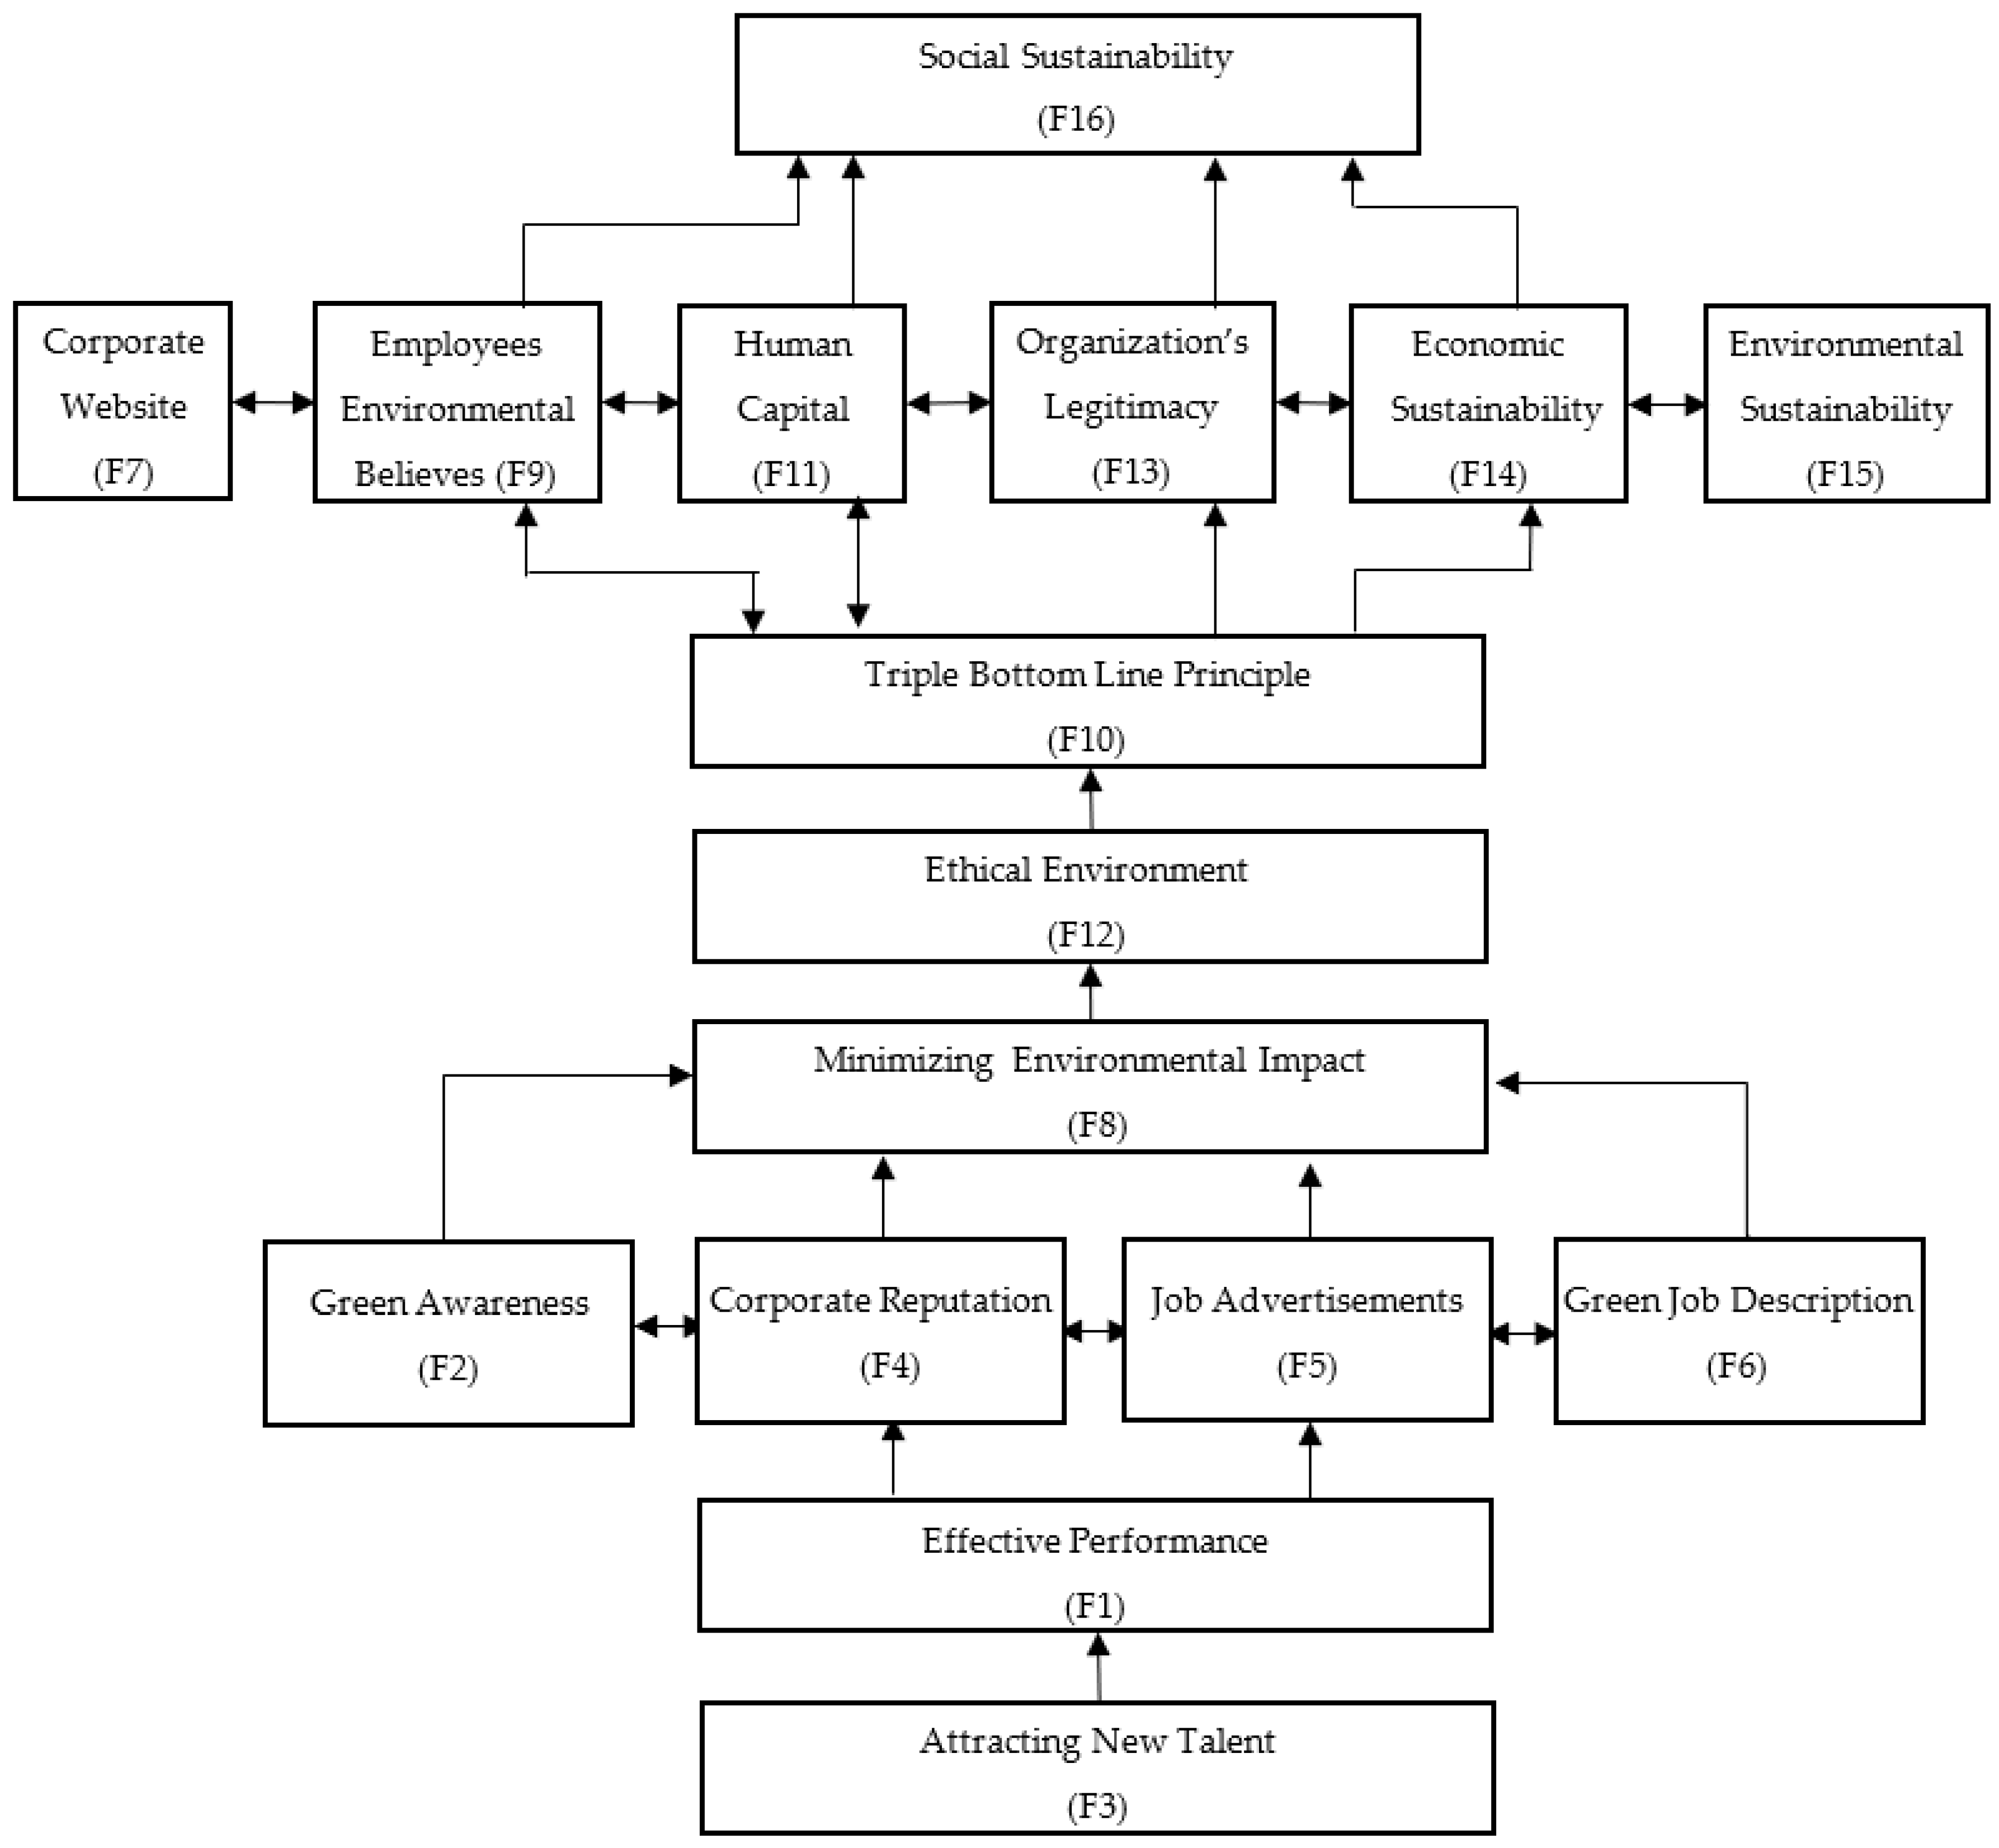
4.1.4. Building ISM Model

Figure 2 displays the whole ISM model for every factor and how the last division level generates the hierarchical structure model. The figure shows how the last division level generates the hierarchical structure model. An arrow pointing from “i” and “j” denotes the interdependence of the component’s “j” and “i”. The next step is to convert the resultant graph, the digraph, into the ISM model. As mentioned in the ISM approach, the transitivity rule eliminates transitivity. To show that Social Sustainability (F16) was located at Level I of the ISM hierarchy model, it is clear from the final division level that it was. According to Figure 2, attracting new talent (F3) is at the bottom of the ISM model due to its high driving power and weak ISM structure reliance.

4.1.5. MICMAC Analysis

Matrices’ multiplication characteristics serve as the MICMAC concept’s foundation [90]. The main goal is to use MICMAC analysis to gauge the influence and reliance of known components. The four Clusters were used in this study to group the elements. The following four types are autonomous factors, domino/dependent factors, relay/linkage factors, and independent factors. Based on Table 4, it is possible to compute each element’s driving and dependent power. The Cluster-I factors are characterized as autonomous factors since they have low driving and reliance power. These autonomous components are unconnected to the system as a whole. Cluster-II elements are dependent factors because they have a high reliance power but a low driving power. Factors are regarded as linkage factors in Cluster-III because of their significant dependency and driving force. Independent factors fall within Cluster-IV and have a high driving force but a low dependence force [74]. The driving and dependent power diagram is created using the MICMAC analysis, depicted in Figure 3.
Cluster-I: These are the autonomous factors. These variables have a low degree of reliance and driving force. Due to their poor connections to other components or their complete lack of impact on the system, these aspects have no connection to the overall system. According to Figure 3, there are no autonomous components in this study.
Cluster-II: These variables have a low driving power and a high degree of dependency. They are the ones that are impacted by different variables. The triple bottom line principle (F10), economic sustainability (F14), and social sustainability (F16) are three factors that are seen in this study to have high dependencies but weak driving forces. The management of these adverse conditions requires particular thought.
Cluster-III: In the MICMAC study, the relay or linking factors have significant driving and reliance power. The following factors were included in this study: green job description (F6), corporate website (F7), minimizing environmental impact (F8), employees’ environmental beliefs (F9), human capital (F11), ethical environment (F12), organization’s legitimacy (F13), and environmental sustainability (F15). Since these factors are inherently unstable, any action to address them will influence other factors and potentially result in a closed-loop effect.
Cluster-IV: In the MICMAC analysis, independent components have great driving power and modest dependency power. Effective performance (F1), green awareness (F2), attracting new talent (F3), corporate reputation (F4), and job advertisements (F5) are considered to be critical, crucial factors in this study and belong under this category.

4.2. DEMATEL Analysis

The DEMATEL method has been applied to identify the cause-and-effect link between the cited aspects that are crucial for adopting GR in a business. In this method, the experts rate the components on a scale of 0 to 4 based on how each aspect affects the others. The experts’ responses are used to create a pairwise comparison matrix. The pairwise expert answer matrix from Table 8 is combined to create the average matrix (A), which is then calculated. The normalized initial direct-relationship matrix is then determined using Equation (2). In the normalized direct connection matrix, each barrier has a value between 0 and 1 (see Table 9). As illustrated in Table 10, the following step involves computing each element’s total relationship matrix (T) using the formula T = D (I − D). “Prominence” values, or r i + c j , indicate the overall impact of each element on the entire management system. Based on the ( r i + c j ) values, the preference or relative importance order for these identified factors is given as economic sustainability (F14) > corporate reputation (F4) > triple bottom line principle (F10) > organization’s legitimacy (F13) > human capital (F11) > employees’ environmental beliefs (F9) > environmental sustainability (F15) > effective performance (F1) > green job description (F6) > ethical environment (F12) > corporate website (F7) > minimizing environmental impact (F8) > green awareness (F2) > job advertisements (F5) > social sustainability (F16) > attracting new talent (F3), as shown in Table 11. In contrast to the importance of each factor, economic sustainability (F14), corporate reputation (F4), and the triple bottom line principle (F10) are ranked first, second, and third, with the highest ( r i + c j ) values.
Similar to how the “relation” values (i.e., r i c j ) are used to classify the components into cause-and-effect categories based on the positive (net cause) and negative (net receive) values obtained in the overall relationship matrix, using the values of the overall association matrix, we next computed the threshold value (0.29373) of the detected factors. In Table 12, values exceeding the threshold value are highlighted in bold.
Further, according to Figure 4, the causal diagram, attracting new talent (F3), Corporate reputation (F4), job advertisements (F5), green job description (F6), corporate website (F7), human capital (F11), ethical environment (F12), economic sustainability (F14), and environmental sustainability (F15) come under the cause group. It was further indicated that factors F1, F2, F8, F9, F10, F13, and F16 belong to the effect group that is shown in Figure 3.

5. Discussions and Implications

The primary objective of this study is to emphasize the significance of green recruitment (GR) in bolstering organizational sustainability performance (OSP) within the banking sector. Through comprehensive research, we have successfully pinpointed several key factors associated with GR that are instrumental in advancing OSP. To understand the complex interactions between these factors, our study employed a dual-method approach, simultaneously applying two methodologies, ISM-DEMATEL. The outcomes of our research provide valuable insights into the intricate network of factors present in the model. These factors, through direct or indirect influence, play a crucial role in shaping GR and OSP within the banking sector.

5.1. Performing ISM

In the ISM process, we prioritize critical elements of green recruitment and OSP, integrating them into a structured hierarchical model. ISM is used to explore interconnections within the factors in the banking sector. ISM creates a hierarchy, organizing factors based on their relative importance, making the framework more meaningful.

5.1.1. ISM Level 8

The analysis indicates that attracting new talent (F3), situated at Level VIII of the ISM hierarchical model, and belonging to Cluster-IV, is a potent factor with a high driving power and low dependence power. Acquiring fresh talent is crucial for banks, as contemporary, highly skilled candidates exhibit a keen interest in joining firms that adhere to environmentally sustainable practices. Hiring candidates with a green mindset enables banks to recruit individuals with knowledge of fundamental sustainability practices. This, in turn, facilitates the banks’ ability to enhance their green performance in the future [16].

5.1.2. ISM Level 7

Effective performance (F1) is situated at Level VII within the ISM hierarchical model and is categorized within Cluster-IV. Effective performance is commonly defined as attaining predetermined objectives by an organization, such as a bank, within the designated timeframe and with minimal expenses, utilizing the resources at hand. In management, performance can be defined as the ability to achieve profitability or competitiveness for the organization. Alternatively, from an employee’s perspective, performance may be evaluated based on factors such as the work environment or the quality of customer service. The concept was determined based on the diversity of the organization’s groups, which gave rise to many potential approaches [7].

5.1.3. ISM Level 6

The green awareness (F2), corporate reputation (F4), and job advertisement (F5) factors have been categorized under Level IV and Cluster-IV. The green job (F6) factor is categorized under Level IV and Cluster-III. The banking industry has become increasingly aware of the negative impact it may have on the environment and the depletion of natural resources, leading to a heightened focus on green initiatives. A positive corporate image concerning environmental policies and security greatly encourages job seekers to pursue specific careers. Banking activities can potentially harm the ecological system, either directly or indirectly. Consequently, many countries have initiated efforts to promote environmental awareness within their banking sector. This reflects a growing recognition of the need for sustainable practices in the financial sector to mitigate ecological impacts and align with broader environmental objectives [91]. In this context, the corporate reputation of banks holds a pivotal sway over customers’ choices when selecting service providers, with a notable emphasis on banks with a positive environmental image. Customers are increasingly attuned to the environmental responsibility demonstrated by financial institutions, making a favorable reputation for eco-conscious practices a key driver in influencing their decisions on which banks to engage with for services.
Achieving successful corporate green awareness and implementing eco-initiatives hinges on a proficient workforce with advanced management and technical skills. Banks increasingly focus on pioneering environment-centric programs to elevate the banking sector’s sustainable competitiveness. To accomplish this, financial institutions can create job roles aligned with environmentally conscious responsibilities, attracting dedicated talent, and fostering a heightened sense of environmental awareness and commitment among employees. This strategic alignment of skilled personnel with sustainability goals enhances both the bank’s green initiatives and the broader mission of promoting sustainability within the financial sector.

5.1.4. ISM Level 5

Minimizing environmental impact (F8) is categorized under Level V and Cluster-III. Banks should consider directing their investments towards companies or organizations that prioritize environmental sustainability, community development, and social justice. This approach aligns with the values of responsible banking. Furthermore, financial institutions, including banks, usually uphold transparency in their operational processes as a fundamental commitment to their stakeholders. This transparency fosters trust and demonstrates their dedication to maintaining ethical and socially responsible practices while pursuing financial goals [7].

5.1.5. ISM Level 4

An ethical environment (F12) is situated within Cluster-IV and Level IV. Ethical environment banking encompasses integrating a bank’s business operations with sustainable development goals and Social, Environmental, and Ethical (SEE) criteria. This involves selecting financial institutions that implement socially responsible investment policies and business practices, according to Sparkes and Cowton [92]. A socially responsible financial institution could potentially implement a policy that prohibits investment in industries that contribute to carbon emissions or engage in labor practices that are deemed exploitative [93].

5.1.6. ISM Level 3

The triple bottom line principle (F10) is situated at Level III and Cluster-II. The triple bottom line principle (F10) is an accounting framework that integrates three distinct performance dimensions: social, environmental, and financial [94].
The adoption of a triple bottom line approach could potentially serve as a mechanism for oversight and aid in the process of recapturing lost clientele or acquiring new patrons. Triple bottom line banks and credit unions provide novel approaches to assess performance and withstand financial market turbulence. These approaches benefit the wider community and environment and promote a brand’s enduring prosperity and profitability [95]. Fagley and Adler [96] have referred to it as a motivating analogy that urges modern corporations to fulfill their economic, environmental, and social objectives in a synchronized manner [97].

5.1.7. ISM Level 2

The corporate website (F7) is associated with the concepts of an organization’s legitimacy (F13), human capital (F11), employees’ environmental beliefs (F9), and environmental sustainability (F15). These factors are classified in Level II and Cluster-III of the ISM hierarchy. The economic sustainability (F14) factor is categorized under Level II and Cluster-II. The significance of this approach is rooted in its capacity to implement virtuous actions that mitigate an organization’s negative environmental impacts. For banks, the importance of sustainability initiatives extends to enhancing their legitimacy and bolstering their reputation. Economically sustainable banks play a pivotal role in generating employment opportunities, increasing local wages, and contributing to the development of the local economy. This impact is particularly notable as it fosters economic sustainability and promotes community welfare. A bank’s website serves as a vital tool for conveying the corporation’s goals, objectives, and activities to both internal and external stakeholders. It plays a pivotal role in shaping the organization’s image and facilitating effective communication. The contribution of an organization’s legitimacy can manifest in both direct and indirect ways, underlining its multifaceted importance in today’s business landscape.
The environmental beliefs held by employees encompass a desire to enhance business productivity through attributes that significantly affect an individual’s economic output and the overall performance of the organization, all while promoting environmental improvements. The significance of this subject matter spans various aspects. Human capital encompasses an individual’s intangible assets, such as intelligence, practical knowledge, and skills, which are associated with non-financial and non-physical resources. The augmentation of human capital has been shown to positively influence employees’ levels of environmental consciousness. Furthermore, the enhancement of human capital is believed to lead to increased productivity and profitability [98].
Economically sustainable banking involves strategically planning and executing banking activities and commercial ventures while considering their impact on Environmental, Social, and Governance (ESG) factors. This approach includes initiatives like adopting green IT and implementing energy-efficient facilities to minimize or eliminate environmental impacts within the bank’s operations. Economic sustainability in banking also extends to providing financial services that encourage or mandate environmentally responsible behavior. In essence, it represents a comprehensive commitment to both financial success and environmental responsibility, reflecting the growing recognition of the interconnectedness of economic and environmental considerations in the modern banking sector [99].

5.1.8. ISM Level 1

The factor that exhibits the highest degree of dependence is social sustainability (F16), situated at Level I and belonging to Cluster-II. Yong et al. [12] highlight the significance of socioeconomic business sense in promoting the equitable distribution of opportunities and resources and addressing health, education, income inequality, and poverty issues. Social sustainability performance is considered one of the three fundamental components of ESG. The assessment evaluates the level of engagement between a bank and its employees, customers, suppliers, and the surrounding community. The subject encompasses human rights, diversity and inclusion, health and safety, and community impact. One of the primary objectives is to optimize the rate of wealth accumulation, which involves augmenting the net profits of a financial institution’s stakeholders or proprietors. The second objective pertains to devising strategies aimed at enhancing the overall satisfaction level of the bank’s clientele, thereby augmenting their perceived value. The third aspect pertains to the procedural advancement of the bank’s technology, policies, and work protocols, the introduction of pioneering banking services and products, and the generation of value for the bank’s personnel [100].

5.2. Performing DEMATEL

Most Influencing Cause-and-Effect Factor

As per the analysis conducted through DEMATEL, it has been observed that economic sustainability (F14) holds the topmost position and falls under the cause group. The significance of this phenomenon within the banking industry lies in its ability to foster a commitment toward economic development. Corporate reputation (F4) ranks as the second most significant cause factor. The corporate reputation of banks is a crucial factor in the decision-making process of job seekers, as evidenced by numerous studies. The cause group’s fifth most significant factor is human capital (F11). The factor above holds great significance, as it is closely tied to an individual’s economic productivity and organizational performance, owing to the crucial role played by the associated characteristics and expertise.
The triple bottom line principle (F10) is classified within the effect group and holds the third position. The proposed significance of corporate sustainability is that it entails a multidisciplinary process that necessitates a complex framework to address various and often conflicting issues and stakeholders, as posited by Ogbu Edeh and Okwurume [15]. The fourth most salient factor within the effect group is the organization’s legitimacy (F13). The significance of such initiatives lies in their ability to strengthen the legitimacy of banks’ sustainability efforts. The sixth most noteworthy aspect within the impact group pertains to the environmental beliefs of employees (F9). The significance of this is that it encompasses employees who are motivated to enhance the bank’s productivity and attain benefits in the broader context.

5.3. Overlapping of Factors in ISM and DEMATEL

According to the DEMATEL method, economic sustainability (F14) significantly influences decision-making processes, as it ranks first and falls under the cause group. The digraph utilized in ISM, as indicated through the ISM methodology, reveals that the most influential factor in the bank is attracting new talent (F3). The root cause group of the dependent group factor can be quantified as a potent causal factor. Hence, to ensure the implementation’s effectiveness, it is imperative to prioritize the factors contributing to the cause group or the influential group. Therefore, to mitigate the impact or address influential factors, decision-makers of banks must ensure that the framework for identifying such factors is sturdy and manageable. Hence, the outcomes derived from utilizing the ISM and DEMATEL methods exhibit a certain degree of coherence. The ISM and DEMATEL methods are utilized in tandem to establish a framework for GR and OSP factors while identifying these factors’ interconnectedness.

5.4. Contribution to Theory

According to resource-based perspectives, performance and competitive advantage are based on how organizations utilize their valued strategic resources and skills, which are essential, sporadic, and difficult for competitors to imitate in the marketplace. Sustainability, environmental awareness, and the triple bottom line are the competitive advantages that an RBV offered for the company studied. Instead, accruing from the organizations, a strategic set of competencies and resources are deliberately and methodically produced by the leader’s decisions and actions. According to this reasoning, academics contend that creating dynamic resources to adjust to shifting external networks and global conditions may be more important for sustaining business profitability than maintaining market domination. As a result, a firm’s capabilities and resources indicate its capacity to develop novel forms of competitive advantage, reconfigure those capabilities in response to environmental changes, and reduce environmental consequences while still maintaining the bank’s effective performance (F1).
Determining how green awareness (F2) as a firm resource may solve the trade-off between resource use and resource preservation is, therefore, possible using the RBV. For a bank to be viable in the long term in the development of self-sufficient capacities to improve corporate performance, the resources of corporate websites (F7), an organization’s legitimacy (F13), job advertisements (F5), corporate reputation (F4), and an ethical environment (F12) are essential to take into account. Firms can attain environmental sustainability (F15) and increase employees’ environmental beliefs (F9) by utilizing valuable, uncommon, imperfectly imitable, and non-substitutable talents and resources [101].
Additionally, an RBV attests that the opponent has a competitive edge in the market due to the essential, sporadic nature of the critical resources in the capabilities. A bank’s green job description (F6) should demonstrate its capacity to create novel and distinctive skills that aid in discovering new possibilities, retaining qualified personnel in stressful environments, and swiftly implementing strategic solutions to changing circumstances. In addition to making it more critical for businesses to comprehend and win the battle, the concentration of banks on human capital (F11) as a source of competitive advantage has also resulted in a closer integration of the domains of strategic management and strategic HRM, frequently seen via the lens of RBV theory. According to research, talented people often tend to change jobs to advance their careers [102]. As a result, organizations must develop strategies to draw in attracting new talent (F3) so that they will stay with the company and help it grow. Talented people are also frequently career-focused, highly mobile, and drawn to professions that present challenges and opportunities for personal growth. The assets that a bank needs to create a sustainable competitive advantage depend on its interactions with the environment and the well-being of its communities.

5.5. Practical Implications and Managerial Implications

GR has significant implications for the banking industry. First, a bank’s competitive edge largely depends on its ability to recruit fresh talent (F3). The competence of a bank’s staff directly influences its performance. Employees equipped with specialized skills can make a bank stand out among its competitors [103]. Second, effective performance (F1) management is indispensable. While new trends in this area emerge every year, HR departments often misconstrue them. Proper performance review systems foster motivated and dedicated employees, whereas ineffective systems can demoralize staff, leading to disengagement [104]. Third, green banking (F2) is typically not seen as a polluting business. The banking sector might not be traditionally viewed as environmentally harmful, but its carbon footprint arises from aspects like energy consumption (due to lighting, air conditioning) and extensive paper use. Although “green banking” is still in its nascent stages in Pakistan, it is crucial to recognize its environmental implications [105].
GR offers several benefits to decision-makers and managers. First, the ethical environment (F12) has a significant impact. Employees should maintain high ethical standards for optimal performance. Every managerial decision has potential ramifications on the environment and society, making it crucial to be considerate of these impacts during decision making [106]. Second, the banking industry’s recent emphasis on human capital (F11) underlines the increasing importance of intangible resources. In today’s era, human capital often holds greater value than physical assets. To harness this potential, banks should promote continuous learning and professional development [107]. A bank’s green endeavors are not only contingent upon the institution’s stance on environmental issues but also on the employees’ commitment to these causes [108]. Encouraging employees to regularly engage in eco-friendly practices or even spearhead their green initiatives can make a substantial difference.

6. Conclusions

The intricate relationship between Green Human Resource Management (GHRM) practices specifically shedding light on the multifaceted impact of green recruiting (GR) and Organizational Sustainable Performance (OSP) has been meticulously explored in this research, within the broader context of sustainability and organizational performance. The empirical findings underscore the pivotal role of employees’ environmental beliefs and values in shaping OSP. The present study has navigated through the nuanced pathways through which GHRM, and more specifically GR, permeates and potentially enhances OSP. Moreover, this research has highlighted the imperative for organizations to not only adopt GHRM practices but to also integrate them strategically into their overall operational and strategic framework to enhance sustainability performance.
Hence, we identify sixteen factors from the previous literature expressed from several databases which need to be assessed; these factors were assessed by developing long-term, flexible decision-making strategies using the ISM and DEMATEL methods. An integrated ISM-DEMATEL approach not only helps to transform the model of the system’s obscure and faulty pattern into structural patterns, but also helps to establish an internal dependence between the factors that cause and effect. They are categorized as group constraints. The methodology proposed for addressing MCDM problems involves the development of value functions. Economic sustainability (F14) is the most influential factor, as it is on the first rank of the DEMATEL digraph, and attracting new talent (F3) is the most driving factor, as it is at Level I of the ISM hierarchy model. Furthermore, research using an RBV shows that a company can create new forms of competitive advantage, reorganize its resources to adapt to shifting conditions, and lessen its negative effects on the environment without sacrificing performance.

Limitation and Future Direction

Our study is subject to some restrictions. To assess GR and OSP, this study focuses on attracting new talent, economic sustainability, corporate reputation, environmental sustainability, green awareness, social sustainability, effective performance, job advertisement, and other factors. On the other hand, there are many ways to investigate green recruiting. The study solely includes Pakistan’s banking sector in evaluating these aspects. Researchers can also use these components in several businesses. However, the exploration of the impact of GR on OSP within the GHRM framework has unveiled a complex, multifaceted relationship that warrants further exploration. While the present study has made significant strides in identifying and understanding the influence of green recruiting methods on OSP, it has also opened new avenues for future research. The specificity of GHRM operations, such as green training and selection, remains an area that is ripe for further exploration and analysis. The study solely uses the team of five experts to validate the items. Future examiners can, however, confirm their integrations using a larger sample size and more expert judgment. This study employs the integrated ISM-DEMATEL approach from the MCDM methodology to evaluate the accuracy of findings with a small sample size. Future research should assess these components using various MCDM techniques, such as Fuzzy-AHP, Fuzzy-DEMATEL, FIS-AHP, etc. The study only looks at one country, Pakistan, to analyze the impact of GR on OSP. Future research should apply these methods and these components to further geographies.

Author Contributions

Conceptualization, S.J. and S.I.Z.; methodology, S.I.Z.; software, Y.K.; validation, S.J., S.I.Z. and S.A.K.; formal analysis, S.A.K.; investigation, S.J.; resources, S.I.Z.; data curation, Y.K.; writing—original draft preparation, S.J.; writing—review and editing, Y.K.; visualization, S.I.Z.; supervision, S.A.K.; project administration, Y.K.; funding acquisition, S.I.Z. All authors have read and agreed to the published version of the manuscript.

Funding

This research received no external funding.

Institutional Review Board Statement

Not applicable.

Informed Consent Statement

Not applicable.

Data Availability Statement

Data are available on request from the author; the data that supported the findings of this study are available from the corresponding author upon reasonable request.

Conflicts of Interest

The authors declare no conflict of interest.

Abbreviations

The following abbreviations are used in this manuscript:
DEMATELDecision-Making Trial and Evaluation Laboratory
ESGEnvironmental, Social, and Governance
GHRMGreen Human Resource Management
GRGreen Recruitment
HRMHuman Resource Management
ISMInterpretive Structural Modeling
MCDMMultiple Criteria Decision Making
MICMACCross-Impact Matrix Multiplication Applied to Classification
OSPOrganizational Sustainability Performance
RBVResource-Based View
SEESocial, Environmental, and Ethical
SSIMStructural Self-Interaction Matrix

References

  1. Li, N.; Wu, D. Nexus between natural resource and economic development: How green innovation and financial inclusion create sustainable growth in BRICS region? Resour. Policy 2023, 85, 103883. [Google Scholar] [CrossRef]
  2. Sarfraz, M.; Ozturk, I.; Yoo, S.; Raza, M.A.; Han, H. Toward a new understanding of environmental and financial performance through corporate social responsibility, green innovation, and sustainable development. Humanit. Soc. Sci. Commun. 2023, 10, 297. [Google Scholar] [CrossRef]
  3. Sabokro, M.; Masud, M.M.; Kayedian, A. The effect of green human resources management on corporate social responsibility, green psychological climate and employees’ green behavior. J. Clean. Prod. 2021, 313, 127963. [Google Scholar] [CrossRef]
  4. Alavi, S.; Aghakhani, H. Identifying the effect of green human resource management practices on lean-agile (LEAGILE) and prioritizing its practices. Int. J. Product. Perform. Manag. 2023, 72, 599–624. [Google Scholar] [CrossRef]
  5. Sandi, A.; Sabarno, H.; Aulia, N.T.; Amareta, N.; Munawar, F. Toward green purchase intention in eco-friendly product: The role of green advertising effectiveness, green perceived value and green trust. Rev. Int. Geogr. Educ. Online 2021, 11, 2464–2479. [Google Scholar]
  6. Muisyo, P.; Su, Q.; Ho, T.H.; Julius, M.M.; Usmani, M.S. Implications of green HRM on the firm’s green competitive advantage: The mediating role of enablers of green culture. J. Manuf. Technol. Manag. 2022, 33, 308–333. [Google Scholar] [CrossRef]
  7. Guillot-Soulez, C.; Saint-Onge, S.; Soulez, S. Green certification and organizational attractiveness: The moderating role of firm ownership. Corp. Soc. Responsib. Environ. Manag. 2022, 29, 189–199. [Google Scholar] [CrossRef]
  8. Muduli, K.K.; Luthra, S.; Kumar Mangla, S.; Jabbour, C.J.C.; Aich, S.; de Guimarães, J.C.F. Environmental management and the “soft side” of organisations: Discovering the most relevant behavioural factors in green supply chains. Bus. Strategy Environ. 2020, 29, 1647–1665. [Google Scholar] [CrossRef]
  9. Malik, S.Y.; Hayat Mughal, Y.; Azam, T.; Cao, Y.; Wan, Z.; Zhu, H.; Thurasamy, R. Corporate social responsibility, green human resources management, and sustainable performance: Is organizational citizenship behavior towards environment the missing link? Sustainability 2021, 13, 1044. [Google Scholar] [CrossRef]
  10. Scholten, M.; Correia, M.F.; Esteves, T.; Gonçalves, S.P. No Place for Pointless Jobs: How Social Responsibility Impacts Job Performance. Sustainability 2022, 14, 12031. [Google Scholar] [CrossRef]
  11. Marrucci, L.; Daddi, T.; Iraldo, F. The contribution of green human resource management to the circular economy and performance of environmental certified organisations. J. Clean. Prod. 2021, 319, 128859. [Google Scholar] [CrossRef]
  12. Davidescu, A.A.; Apostu, S.-A.; Paul, A.; Casuneanu, I. Work flexibility, job satisfaction, and job performance among Romanian employees—Implications for sustainable human resource management. Sustainability 2020, 12, 6086. [Google Scholar] [CrossRef]
  13. Yong, J.Y.; Yusliza, M.Y.; Ramayah, T.; Chiappetta Jabbour, C.J.; Sehnem, S.; Mani, V. Pathways towards sustainability in manufacturing organizations: Empirical evidence on the role of green human resource management. Bus. Strategy Environ. 2020, 29, 212–228. [Google Scholar] [CrossRef]
  14. Lee, S.H.; Ha-Brookshire, J. Ethical climate and job attitude in fashion retail employees’ turnover intention, and perceived organizational sustainability performance: A cross-sectional study. Sustainability 2017, 9, 465. [Google Scholar] [CrossRef]
  15. Ogbu Edeh, F.; Okwurume, C.N. Green human resource management and organisational sustainability of deposit money banks in Nigeria. J. Manag. Sci. 2019, 3, 224–235. [Google Scholar] [CrossRef]
  16. Mwita, K.M.; Kinemo, S.M. The role of green recruitment and selection on performance of processing industries in Tanzania: A case of Tanzania tobacco processors limited (TTPL). Int. J. Hum. Resour. Stud. 2018, 8, 3546. [Google Scholar] [CrossRef]
  17. Masri, H.A.; Jaaron, A.A. Assessing green human resources management practices in Palestinian manufacturing context: An empirical study. J. Clean. Prod. 2017, 143, 474–489. [Google Scholar] [CrossRef]
  18. Peerzadah, S.A.; Mufti, S.; Nazir, N. Green Human Resource Management: A Review. Int. J. Enhanc. Res. Manag. Comput. Appl. 2018, 7, 790–795. [Google Scholar]
  19. Jiang, K.; Lepak, D.P.; Han, K.; Hong, Y.; Kim, A.; Winkler, A.-L. Clarifying the construct of human resource systems: Relating human resource management to employee performance. Hum. Resour. Manag. Rev. 2012, 22, 73–85. [Google Scholar] [CrossRef]
  20. Pham, D.D.T.; Paillé, P. Green recruitment and selection: An insight into green patterns. Int. J. Manpow. 2020, 41, 258–272. [Google Scholar] [CrossRef]
  21. Clemens, B. Economic incentives and small firms: Does it pay to be green? J. Bus. Res. 2006, 59, 492–500. [Google Scholar] [CrossRef]
  22. Discua Cruz, A. There is no need to shout to be heard! The paradoxical nature of corporate social responsibility (CSR) reporting in a Latin American family small and medium-sized enterprise (SME). Int. Small Bus. J. 2020, 38, 243–267. [Google Scholar] [CrossRef]
  23. Zaman, S.I.; Kusi-Sarpong, S. Identifying and exploring the relationship among the critical success factors of sustainability toward consumer behavior. J. Model. Manag. 2023. [Google Scholar] [CrossRef]
  24. Pan, X.; Sinha, P.; Chen, X. Corporate social responsibility and eco-innovation: The triple bottom line perspective. Corp. Soc. Responsib. Environ. Manag. 2021, 28, 214–228. [Google Scholar] [CrossRef]
  25. He, H.; Harris, L. The impact of COVID-19 pandemic on corporate social responsibility and marketing philosophy. J. Bus. Res. 2020, 116, 176–182. [Google Scholar] [CrossRef] [PubMed]
  26. Zhang, Q.; Pan, J.; Jiang, Y.; Feng, T. The impact of green supplier integration on firm performance: The mediating role of social capital accumulation. J. Purch. Supply Manag. 2020, 26, 100579. [Google Scholar] [CrossRef]
  27. Haar, J.; O’Kane, C.; Daellenbach, U. High performance work systems and innovation in New Zealand SMEs: Testing firm size and competitive environment effects. Int. J. Hum. Resour. Manag. 2022, 33, 3324–3352. [Google Scholar] [CrossRef]
  28. Gangi, F.; Daniele, L.M.; Varrone, N. How do corporate environmental policy and corporate reputation affect risk-adjusted financial performance? Bus. Strategy Environ. 2020, 29, 1975–1991. [Google Scholar] [CrossRef]
  29. Aranganathan, P. Green recruitment, a new-fangled approach to attract and retain talent. Int. J. Bus. Manag. Res. 2018, 8, 69–76. [Google Scholar] [CrossRef]
  30. Haldorai, K.; Kim, W.G.; Garcia, R.F. Top management green commitment and green intellectual capital as enablers of hotel environmental performance: The mediating role of green human resource management. Tour. Manag. 2022, 88, 104431. [Google Scholar] [CrossRef]
  31. Abbas, Z.; Sarwar, S.; Rehman, M.A.; Zámečník, R.; Shoaib, M. Green HRM promotes higher education sustainability: A mediated-moderated analysis. Int. J. Manpow. 2022, 43, 827–843. [Google Scholar] [CrossRef]
  32. Yusoff, Y.M.; Nejati, M.; Kee, D.M.H.; Amran, A. Linking green human resource management practices to environmental performance in hotel industry. Glob. Bus. Rev. 2020, 21, 663–680. [Google Scholar] [CrossRef]
  33. Mousa, S.K.; Othman, M. The impact of green human resource management practices on sustainable performance in healthcare organisations: A conceptual framework. J. Clean. Prod. 2020, 243, 118595. [Google Scholar] [CrossRef]
  34. Khan, N.U.; Bhatti, M.N.; Obaid, A.; Sami, A.; Ullah, A. Do green human resource management practices contribute to sustainable performance in manufacturing industry? Int. J. Environ. Sustain. Dev. 2020, 19, 412–432. [Google Scholar] [CrossRef]
  35. Rashid, A.; Alam, W. The Impact of Green Human Resource Management on Organizational Performance: A Case of Manufacturing Industry. City Univ. Res. J. 2020, 10, 289–299. [Google Scholar]
  36. Saeed, B.B.; Afsar, B.; Hafeez, S.; Khan, I.; Tahir, M.; Afridi, M.A. Promoting employee’s proenvironmental behavior through green human resource management practices. Corp. Soc. Responsib. Environ. Manag. 2019, 26, 424–438. [Google Scholar] [CrossRef]
  37. Jabbar, M.H.; Abid, M. A study of green HR practices and its impact on environmental performance: A review. Manag. Res. Rep. 2015, 3, 142–154. [Google Scholar]
  38. Sezen, B.; Cankaya, S.Y. Effects of green manufacturing and eco-innovation on sustainability performance. Procedia Soc. Behav. Sci. 2013, 99, 154–163. [Google Scholar] [CrossRef]
  39. Raduan, C.; Jegak, U.; Haslinda, A.; Alimin, I. Management, strategic management theories and the linkage with organizational competitive advantage from the resource-based view. Eur. J. Soc. Sci. 2009, 11, 402–418. [Google Scholar]
  40. Malik, S.Y.; Cao, Y.; Mughal, Y.H.; Kundi, G.M.; Mughal, M.H.; Ramayah, T. Pathways towards sustainability in organizations: Empirical evidence on the role of green human resource management practices and green intellectual capital. Sustainability 2020, 12, 3228. [Google Scholar] [CrossRef]
  41. Savitz, A. Talent, Transformation, and the Triple Bottom Line: How Companies Can Leverage Human Resources to Achieve Sustainable Growth; John Wiley & Sons: Hoboken, NJ, USA, 2013. [Google Scholar]
  42. Meister, J.C.; Willyerd, K. The 2020 Workplace: How Innovative Companies Attract, Develop, and Keep Tomorrow’s Employees Today; HarperCollins Publishers Inc.: New York, NY, USA, 2021. [Google Scholar]
  43. Van Beurden, J.; Van De Voorde, K.; Van Veldhoven, M. The employee perspective on HR practices: A systematic literature review, integration and outlook. Int. J. Hum. Resour. Manag. 2021, 32, 359–393. [Google Scholar] [CrossRef]
  44. Attri, R.; Dev, N.; Sharma, V. Interpretive structural modelling (ISM) approach: An overview. Res. J. Manag. Sci. 2013, 2319, 1171. [Google Scholar]
  45. Sage, A.P. Methodology for Large-Scale Systems; McGraw Hill Higher Education: New York, NY, USA, 1977. [Google Scholar]
  46. Warfield, J.N. Developing interconnection matrices in structural modeling. IEEE Trans. Syst. Man Cybern. 1974, 4, 81–87. [Google Scholar] [CrossRef]
  47. Govindan, K.; Kannan, D.; Shankar, K.M. Evaluating the drivers of corporate social responsibility in the mining industry with multi-criteria approach: A multi-stakeholder perspective. J. Clean. Prod. 2014, 84, 214–232. [Google Scholar] [CrossRef]
  48. Jiang, Y.; Zaman, S.I.; Jamil, S.; Khan, S.A.; Kun, L. A triple theory approach to link corporate social performance and green human resource management. Environ. Dev. Sustain. 2023. [Google Scholar] [CrossRef]
  49. Pawson, R.; Greenhalgh, T.; Harvey, G.; Walshe, K. Realist review-a new method of systematic review designed for complex policy interventions. J. Health Serv. Res. Policy 2005, 10, 21–34. [Google Scholar] [CrossRef]
  50. Seuring, S.; Gold, S. Conducting content-analysis based literature reviews in supply chain management. Supply Chain Manag. Int. J. 2012, 17, 544–555. [Google Scholar] [CrossRef]
  51. Boyatzis, R.E. The Competent Manager: A Model for Effective Performance; John Wiley & Sons: Hoboken, NJ, USA, 1982. [Google Scholar]
  52. Obaid, T.F.; Alias, R.B. The impact of green recruitment, green training and green learning on the firm performance: Conceptual paper. Int. J. Appl. Res. 2015, 1, 951–953. [Google Scholar]
  53. Wehrmeyer, W. Greening People: Human Resources and Environmental Management; Routledge: Abingdon-on-Thames, UK, 2017. [Google Scholar]
  54. Bauer, T.N.; Aiman-Smith, L. Green career choices: The influence of ecological stance on recruiting. J. Bus. Psychol. 1996, 10, 445–458. [Google Scholar] [CrossRef]
  55. Kuruppu, S.; Milne, M.J. Dolphin deaths, organizational legitimacy and potential employees’ reactions to assured environmental disclosures. Account. Forum 2010, 34, 1–19. [Google Scholar] [CrossRef]
  56. Alon, A.; Vidovic, M. Sustainability performance and assurance: Influence on reputation. Corp. Reput. Rev. 2015, 18, 337–352. [Google Scholar] [CrossRef]
  57. Bhutto, S.A.; Auranzeb, Z. Effects of green human resources management on firm performance: An empirical study on Pakistani Firms. Eur. J. Bus. Manag. 2016, 8, 119–125. [Google Scholar]
  58. Shaw, P.; Greenstein, D.; Lerch, J.; Clasen, L.; Lenroot, R.; Gogtay, N.; Giedd, J. Intellectual ability and cortical development in children and adolescents. Nature 2006, 440, 676–679. [Google Scholar] [CrossRef] [PubMed]
  59. Quartey, A.A.D. The use of LinkedIn for recruitment: An exploratory and descriptive study of telecommunications companies listed on LinkedIn (South Africa). Master’s Thesis, University of KwaZulu-Natal, KwaZulu-Natal, Pietermaritzburg, South Africa, 2017. [Google Scholar]
  60. Cornelius, R.R. Theoretical approaches to emotion. In Proceedings of the ISCA Tutorial and Research Workshop (ITRW) on Speech and Emotion, Newcastle, Ireland, 5–7 September 2000. [Google Scholar]
  61. Jeschke, S.; Hees, F.; Richert, A.S.; Trantow, S. Prethinking Work: Insights on the Future of Work; LIT Verlag Münster: Münster, Germany, 2012; Volume 7. [Google Scholar]
  62. Chams, N.; García-Blandón, J. On the importance of sustainable human resource management for the adoption of sustainable development goals. Resour. Conserv. Recycl. 2019, 141, 109–122. [Google Scholar] [CrossRef]
  63. Sherwood, P. A Triple Bottom Line Evaluation of the Impact of Special Events: The Development of Indicators. Ph.D. Thesis, Victoria University, Sunshine North, VIC, Australia, 2007. [Google Scholar]
  64. Schultz, T.W. Investment in human capital. Am. Econ Rev. 1961, 51, 1–17. [Google Scholar]
  65. Martin, K.D.; Cullen, J.B. Continuities and extensions of ethical climate theory: A meta-analytic review. J. Bus. Ethics 2006, 69, 175–194. [Google Scholar] [CrossRef]
  66. Carroll, A.B.; Shabana, K.M. The business case for corporate social responsibility: A review of concepts, research and practice. Int. J. Manag. Rev. 2010, 12, 85–105. [Google Scholar] [CrossRef]
  67. Basri, W.S.M.; Siam, M.R. Social media and corporate communication antecedents of SME sustainability performance: A conceptual framework for SMEs of Arab world. J. Econ. Adm. Sci. 2019, 35, 172–182. [Google Scholar] [CrossRef]
  68. Cella-De-Oliveira, F.A. Indicators of organizational sustainability: A proposition from organizational competences. Int. Rev. Manag. Bus. Res. 2013, 2, 962. [Google Scholar]
  69. Roome, N. Conceptualizing and studying the contribution of networks in environmental management and sustainable development. Bus. Strategy Environ. 2001, 10, 69–76. [Google Scholar] [CrossRef]
  70. Lin, W.; Zaman, S.I.; Jamil, S.; Khan, S.A. Students engagement in distant learning: How much influence do the critical factors have for success in academic performance? Psychol. Sch. 2023, 60, 2373–2394. [Google Scholar] [CrossRef]
  71. Sharofiddin, A.; Othman, A. The effects of trust mediator and education level moderator on adoption of Islamic banking system in Tajikistan. Russ. J. Econ. 2019, 5, 277–296. [Google Scholar]
  72. Michaels, R. The Outlook of the Banking Industry in Pakistan. International Banker. 2017. Available online: https://internationalbanker.com/banking/outlook-banking-industry-pakistan/ (accessed on 22 March 2023).
  73. Chen, Z.; Li, Y.; Wu, Y.; Luo, J. The transition from traditional banking to mobile internet finance: An organizational innovation perspective—A comparative study of Citibank and ICBC. Financ. Innov. 2017, 3, 12. [Google Scholar] [CrossRef]
  74. Kumar, A.; Dixit, G. An analysis of barriers affecting the implementation of e-waste management practices in India: A novel ISM-DEMATEL approach. Sustain. Prod. Consum. 2018, 14, 36–52. [Google Scholar] [CrossRef]
  75. Zaman, S.I.; Khan, S.; Zaman, S.A.A.; Khan, S.A. A grey decision-making trial and evaluation laboratory model for digital warehouse management in supply chain networks. Decis. Anal. J. 2023, 8, 100293. [Google Scholar] [CrossRef]
  76. Zhou, D.-q.; Zhang, L. Establishing hierarchy structure in complex systems based on the integration of DEMATEL and ISM. J. Manag. Sci. Chin. 2008, 11, 20–26. [Google Scholar]
  77. Diabat, A.; Govindan, K. An analysis of the drivers affecting the implementation of green supply chain management. Resour. Conserv. Recycl. 2011, 55, 659–667. [Google Scholar] [CrossRef]
  78. Govindan, K.; Kannan, D.; Haq, A.N. Analyzing supplier development criteria for an automobile industry. Ind. Manag. Data Syst. 2010, 110, 43–62. [Google Scholar] [CrossRef]
  79. Kannan, G.; Haq, A.N. Analysis of interactions of criteria and sub-criteria for the selection of supplier in the built-in-order supply chain environment. Int. J. Prod. Res. 2007, 45, 3831–3852. [Google Scholar] [CrossRef]
  80. Mandal, A.; Deshmukh, S. Vendor selection using interpretive structural modelling (ISM). Int. J. Oper. Prod. Manag. 1994, 14, 52–59. [Google Scholar] [CrossRef]
  81. Mathiyazhagan, K.; Govindan, K.; NoorulHaq, A.; Geng, Y. An ISM approach for the barrier analysis in implementing green supply chain management. J. Clean. Prod. 2013, 47, 283–297. [Google Scholar] [CrossRef]
  82. Patil, N.Y.; Warkhedkar, R.M. Knowledge management implementation in Indian automobile ancillary industries: An interpretive structural model for productivity. J. Model. Manag. 2016, 11, 802–810. [Google Scholar] [CrossRef]
  83. Ravi, V.; Shankar, R. Analysis of interactions among the barriers of reverse logistics. Technol. Forecast. Soc. Change 2005, 72, 1011–1029. [Google Scholar] [CrossRef]
  84. Liao, C.-H.; Chiu, A.S. Evaluate municipal solid waste management problems using hierarchical framework. Procedia Soc. Behav. Sci. 2011, 25, 353–362. [Google Scholar] [CrossRef]
  85. Singh, M.; Kant, R. Knowledge management barriers: An interpretive structural modeling approach. Int. J. Manag. Sci. Eng. Manag. 2008, 3, 141–150. [Google Scholar] [CrossRef]
  86. Tzeng, G.-H.; Chiang, C.-H.; Li, C.-W. Evaluating intertwined effects in e-learning programs: A novel hybrid MCDM model based on factor analysis and DEMATEL. Expert Syst. Appl. 2007, 32, 1028–1044. [Google Scholar] [CrossRef]
  87. Hsu, C.-W.; Kuo, T.-C.; Chen, S.-H.; Hu, A.H. Using DEMATEL to develop a carbon management model of supplier selection in green supply chain management. J. Clean. Prod. 2013, 56, 164–172. [Google Scholar] [CrossRef]
  88. Lin, R.-J. Using fuzzy DEMATEL to evaluate the green supply chain management practices. J. Clean. Prod. 2013, 40, 32–39. [Google Scholar] [CrossRef]
  89. Tseng, M.-L. Application of ANP and DEMATEL to evaluate the decision-making of municipal solid waste management in Metro Manila. Environ. Monit. Assess. 2009, 156, 181. [Google Scholar] [CrossRef]
  90. Sharma, H.; Gupta, A. The objectives of waste management in India: A futures inquiry. Technol. Forecast. Soc. Change 1995, 48, 285–309. [Google Scholar] [CrossRef]
  91. Bukhari, S.A.A.; Hashim, F.; Amran, A. The journey of Pakistan’s banking industry towards green banking adoption. S. Asian J. Bus. Manag. Cases 2020, 9, 208–218. [Google Scholar] [CrossRef]
  92. Sparkes, R.; Cowton, C.J. The maturing of socially responsible investment: A review of the developing link with corporate social responsibility. J. Bus. Ethics 2004, 52, 45–57. [Google Scholar] [CrossRef]
  93. Hurd, A.; Porter, K. Ethical Banking. Forbes. 2022. Available online: https://www.forbes.com/advisor/banking/ethical-banking/#:~:text=Ethical%20banking%20is%20the%20practice,engage%20in%20exploitative%20labor%20practices (accessed on 5 August 2023).
  94. Slaper, T.F.; Hall, T.J. The triple bottom line: What is it and how does it work? Indiana Bus. Rev. 2011, 86, 4–8. [Google Scholar]
  95. Watson, L.; Larson, D. The Case for Triple-Bottom-Line Banking How Doing Good Means Doing Well. Market Insights. Alling Henning Association. 2009. Available online: https://iupe.files.wordpress.com/2009/11/watson-larson.pdf (accessed on 5 August 2023).
  96. Fagley, N.S.; Adler, M.G. Appreciation: A spiritual path to finding value and meaning in the workplace. J. Manag. Spiritual. Relig. 2012, 9, 167–187. [Google Scholar] [CrossRef]
  97. Galamadien, P.A. Sustainability and Triple Bottom Line Reporting in the Banking Industry. Ph.D. Thesis, North-West University, Potchefstroom, South Africa, 2011. [Google Scholar]
  98. Kenton, W. Investopedia. Human Capital Definition: Types, Examples, and Relationship to the Economy. 2023. Available online: https://www.investopedia.com/terms/h/humancapital.asp (accessed on 5 August 2023).
  99. Accenture. Sustainable Banking. 2022. Available online: https://www.accenture.com/us-en/services/banking/sustainable-banking#:~:text=Green%20banking%20refers%20to%20a,or%20mandate%20environmentally%2Dfriendly%20behavior (accessed on 19 January 2023).
  100. Mounir, H. Daily News Egypt. Social Responsibility of Banks: Sustainable, Constructive and Connecting: Pundits. 2022. Available online: https://dailynewsegypt.com/2022/02/05/social-responsibility-of-banks-sustainable-constructive-and-connecting-pundits/ (accessed on 19 January 2023).
  101. Hanna, B.; Xu, G.; Wang, X.; Hossain, J. Blockchain-enabled humanitarian supply chain management: Sustainability and responsibility. In Blockchain in a Volatile-Uncertain-Complex-Ambiguous World; Elsevier: Amsterdam, The Netherlands, 2023; pp. 251–276. [Google Scholar]
  102. Holland, C.; Clark, A.; Katz, J.; Peace, S. Social Interactions in Urban Public Places; Policy Press: Bristol, UK, 2007. [Google Scholar]
  103. Hongal, P.; Kinange, U. A study on talent management and its impact on organization performance-an empirical review. Int. J. Eng. Technol. Mgmt. Res. 2020, 10, 64–81. [Google Scholar] [CrossRef]
  104. Nguyen, P.-H. A fully completed spherical fuzzy data-driven model for analyzing employee satisfaction in logistics service industry. Mathematics 2023, 11, 2235. [Google Scholar] [CrossRef]
  105. Ellahi, A.; Jillani, H.; Zahid, H. Customer awareness on green banking practices. J. Sustain. Finance Invest. 2023, 13, 1377–1393. [Google Scholar] [CrossRef]
  106. Calza, F.; Sorrentino, A.; Tutore, I. Combining corporate environmental sustainability and customer experience management to build an integrated model for decision-making. Manag. Decis. 2023, 61, 54–84. [Google Scholar] [CrossRef]
  107. Rajput, N.; Das, G.; Shivam, K.; Nayak, C.K.; Gaurav, K.; Nagpal, P. An inclusive systematic investigation of human resource management practice in harnessing human capital. Mater. Today Proc. 2023, 80, 3686–3690. [Google Scholar] [CrossRef]
  108. Rolland, D.; O’Keefe Bazzoni, J. Greening corporate identity: CSR online corporate identity reporting. Corp. Commun. Int. J. 2009, 14, 249–263. [Google Scholar] [CrossRef]
Figure 1. Framework of proposed research methodology.
Sustainability 15 15567 g001
Figure 2. ISM-based model.
Sustainability 15 15567 g002
Figure 3. MICMAC analysis.
Sustainability 15 15567 g003
Figure 4. Cause-and-effect digraph.
Sustainability 15 15567 g004
Table 1. Selected factors.
CodeFactorFactor DescriptionReferences
F1Effective
Performance
Effective performance is achieving the specific results required by the work through particular activities while sustaining or being persistent with the organization’s environmental policies, processes, and conditions. The recruitment process could support organizations in delivering effective performance with an environmental performance by making sure that newly recruited workers are aware of the organization’s ecological values, and they can uphold the organization’s green standards.[51,52,53]
F2Green
Awareness
The green awareness of applicants is a fundamental characteristic of green recruitment and selection. It includes behavioral factors that enable the accomplishment of corporate ecological goals, such as the green awareness, dedication, and acceptability of candidates.[16,54]
F3Attracting
New Talent
Organizations have now started acknowledging that an effective strategy to attract new talent is gaining a reputation as a green employer. To attract highly skilled workers, German companies like Siemens and Bayer used their green images and eco-friendly activities.[16,52]
F4Corporate
Reputation
The social concept, based on the perceptions of stakeholders, is called reputation. Many types of research prove that a job seeker’s option to join and pursue a particular career strongly relies on the corporate image in terms of environmental policy and environmental security.[53,55,56,57]
F5Job
Advertisements
A job advertisement is a notice in a publication on a company’s website or on a career portal that declares a vacancy in a company calling for suitable candidates to apply for the role. In order to attract ecologically anxious candidates for job vacancies, certain environmental values can be expressed in the advertisement of organizations. Some organizations also express their desire in the job advertisement to recruit applicants who have the capabilities and attitudes to contribute to firm’s environmental management initiatives, too.[58,59]
F6Green Job
Description
The job description is a representation of the tasks and responsibilities involved. It further describes the role of a job in the organization and clarifies its importance to accomplish operational and departmental objectives. Green job descriptions have now been included by many organizations in their recruitment agendas with environmental aspects. This evidence concludes that green recruitment plays a big role in making one organization different from others and increasing more chances for firms to invite and retain talented applicants after induction.[14,60]
F7Corporate
Website
The company website reflects the corporation’s goals, objectives, and activities, and plays an essential role in presenting itself to internal and external stakeholders of the enterprise. The content provided on a corporate website can serve to minimize any misperception by offering descriptions about an organization’s work openings and its terms. An organization’s websites are a reliable and effective tool which can be used to recruit qualified candidates.[14,60]
F8Minimizing
Environmental
Impact
Green recruiting may be considered a paper-free recruiting method with a limited effect on the climate. Through online media such as online application forms, e-mail, and the global talent pool, applications are invited.[61]
F9Employees’
Environmental
Beliefs
Organizations choose environmentally conscious workers who improve the business’s productivity and gain advantages in the overall environment. Job seekers are training themselves in compliance with green culture requirements and are trying to own the expertise that is essential as green employees.[53,57,62]
F10Triple Bottom Line PrincipleTriple bottom line methodology interprets companies’ potential to grow sustainably, not only relying on the economic (profitability) approach but also taking into consideration the environmental and social influences of their operations. In this sense, the success of corporate sustainability is a multidisciplinary process that needs to be handled through a complex framework that covers various and often contradictory issues and stakeholders.[63]
F11Human
Capital
Human capital is described as productive resources embodied in labor, knowledge, and “skills” that includes any stock of knowledge, inherited, or learned characteristics that an individual possesses. These characteristics and expertise play a significant role in an individual’s economic productivity and organizational performance.[29,64]
F12Ethical
Environment
Ethical environment can be characterized as employees’ mutual understanding of what ethically appropriate behavior is and how to cope with ethical problems. It reflects how the rules and culture of an organization interact with an individual employee’s perspectives. Employees’ perception of the work environment plays an essential part in corporate performance.[29,65]
F13Organization’s
Legitimacy
A growing number of businesses prefer to publish and address their performance and sustainability strategies. Companies are engaging in sustainability initiatives, including reporting on sustainability, to reinforce their legitimacy and improve repute.[56,66]
F14Economic
Sustainability
Economic sustainability includes the commitment of businesses towards economic development and the elimination of society’s financial uncertainties. Sustainable companies have an economic impact on the community, like the creation of a job, local wages, and their involvement in local economic development.[15,67]
F15Environmental
Sustainability
Environmental sustainability is about taking virtuous actions that would reduce the adverse environmental effects of an organization. Companies that are aware of environmental sustainability do not produce radiation that builds up in the atmosphere at rates above the systems’ natural capacity to absorb such emissions.[15,68]
F16Social
Sustainability
Social sustainability refers to corporate attitudes concerning workers, suppliers, contractors, consumers, and general impacts on society other than their own corporate domains. Organizational sustainability is not all about only conducting business in a sustainable way but also about enhancing social sustainability through organizational practices.[15,69]
Table 2. Expert details.
CategoryClassificationNo. of Experts
Educational
Qualification
Bachelor2
Master7
Ph.D.1
Total:10
Work ExperienceLess than 5 Years3
5–10 Years4
11–20 Years2
More than 20 Years1
Total:10
BackgroundChief Human Resource Officer (CHRO)1
Chief People Officer (CPO)1
HOD (HR Compliance)1
Senior Manager (HR)3
HR Coordinator1
HR Assistant3
Total:10
Table 3. SSIM.
Table 3. SSIM.
i/jFactorsF16F15F14F13F12F11F10F9F8F7F6F5F4F3F2
F1Effective PerformanceVVVVVVOVVVVOOAV
F2Green AwarenessVVVVVOOVVVOXOO
F3Attracting New TalentVVVVVVOVVVVOV
F4Corporate ReputationVVVVVOOVVVOX
F5Job AdvertisementsOVVOVVVVVVA
F6Green Job DescriptionVVVVVVVAVO
F7Corporate WebsiteVVVOAXXVA
F8Minimizing Env. ImpactVVVOVXVO
F9Employees’ Env. BeliefsVVVVAXO
F10Triple Bottom Line PrincipleVOVVAO
F11Human CapitalOVAAO
F12Ethical EnvironmentVXOO
F13Organization’s LegitimacyAXX
F14Economic SustainabilityVO
F15Environmental SustainabilityO
F16Social Sustainability
Table 4. Initial reachability matrix.
i/jF1F2F3F4F5F6F7F8F9F10F11F12F13F14F15F16
F11100011110111111
F20100101110011111
F31011011110111111
F40001101110011111
F50101101111110110
F60000110101111111
F70000001011100111
F80000001101110111
F90000010010101111
F100000001001001101
F110000001110100010
F120000001011010011
F130000000000101110
F140000000000101101
F150000000000011010
F160000000000000001
Table 5. Final reachability matrix.
i/jF1F2F3F4F5F6F7F8F9F10F11F12F13F14F15F16Driving Power
F111001 *11111 *11111114
F20101 *11 *1111 *1 *1111114
F311 *111 *11111 *11111116
F401 *0111 *1111 *1 *1111114
F5010111 *1111111 *11013
F601 *01 *111 *11 *111111114
F7000001 *11 *1111 *1 *11111
F8000000111 *1111 *11110
F900001 *11 *1 *11 *11 *111112
F10000000101 *11 *0111 *18
F11000001 *1111 *11 *1 *1 *11 *11
F1200000010111 *11 *1 *119
F130000001 *1 *1 *011 *1111 *9
F140000001 *1 *1 *010111 *18
F150000001 *01 *1 *1 *111 *11 *9
F1600000000000000011
Dependence Power26157915121513151315151515173/173
Table 6. Iteration Level I to Level VIII.
Iteration Level I
CodeReachability SetAntecedents SetIntersection SetLevel
F1(1,2,5,6,7,8,9,10,11,12,13,14,15,16)(1,3)(1)
F2(2,4,5,6,7,8,9,10,11,12,13,14,15,16)(1,2,3,4,5,6)(2,4,5,6)
F3(1,2,3,4,5,6,7,8,9,10,11,12,13,14,15,16)(3)(3)
F4(2,4,5,6,7,8,9,10,11,12,13,14,15,16)(2,3,4,5,6)(2,4,5,6)
F5(2,4,5,6,7,8,9,10,11,12,13,14,15)(1,2,3,4,5,6,9)(2,4,5,6,9)
F6(2,4,5,6,7,8,9,10,11,12,13,14,15,16)(1,2,3,4,5,6,7,9,11)(2,4,5,6,7,9,11)
F7(6,7,8,9,10,11,12,13,14,15,16)(1,2,3,4,5,6,7,8,9,10,11,12,13,14,15)(6,7,8,9,10,11,12,13,14,15)
F8(7,8,9,10,11,12,13,14,15,16)(1,2,3,4,5,6,7,8,9,11,13,14)(7,8,9,11,13,14)
F9(5,6,7,8,9,10,11,12,13,14,15,16)(1,2,3,4,5,6,7,8,9,10,11,12,13,14,15)(5,6,7,8,9,10,11,12,13,14,15)
F10(7,9,10,11,13,14,15,16)(1,2,3,4,5,6,7,8,9,10,11,12,15)(7,9,10,11,15)
F11(6,7,8,9,10,11,12,13,14,15,16)(1,2,3,4,5,6,7,8,9,10,11,12,13,14,15)(6,7,8,9,10,11,12,13,14,15)
F12(7,9,10,11,12,13,14,15,16)(1,2,3,4,5,6,7,8,9,11,12,13,15)(7,9,11,12,13,15)
F13(7,8,9,11,12,13,14,15,16)(1,2,3,4,5,6,7,8,9,10,11,12,13,14,15)(7,8,9,11,12,13,14,15)
F14(7,8,9,11,13,14,15,16)(1,2,3,4,5,6,7,8,9,10,11,12,13,14,15)(7,8,9,11,13,14,15)
F15(7,9,10,11,12,13,14,15,16)(1,2,3,4,5,6,7,8,9,10,11,12,13,14,15)(7,9,10,11,12,13,14,15)
F16(16)(1,2,3,4,6,7,8,9,10,11,12,13,14,15,16)(16)I
Iteration Level II
CodeReachability SetAntecedents SetIntersection SetLevel
F1(1,2,5,6,7,8,9,10,11,12,13,14,15)(1,3)(1)
F2(2,4,5,6,7,8,9,10,11,12,13,14,15)(1,2,3,4,5,6)(2,4,5,6)
F3(1,2,3,4,5,6,7,8,9,10,11,12,13,14,15)(3)(3)
F4(2,4,5,6,7,8,9,10,11,12,13,14,15)(2,3,4,5,6)(2,4,5,6)
F5(2,4,5,6,7,8,9,10,11,12,13,14)(1,2,3,4,5,6,9)(2,4,5,6,9)
F6(2,4,5,6,7,8,9,10,11,12,13,14,15)(1,2,3,4,5,6,7,9,11)(2,4,5,6,7,9,11)
F7(6,7,8,9,10,11,12,13,14,15)(1,2,3,4,5,6,7,8,9,10,11,12,13,14,15)(6,7,8,9,10,11,12,13,14,15)II
F8(7,8,9,10,11,12,13,14,15)(1,2,3,4,5,6,7,8,9,11,13,14)(7,8,9,11,13,14)
F9(5,6,7,8,9,10,11,12,13,14,15)(1,2,3,4,5,6,7,8,9,10,11,12,13,14,15)(5,6,7,8,9,10,11,12,13,14,15)II
F10(7,9,10,11,13,14,15)(1,2,3,4,5,6,7,8,9,10,11,12,15)(7,9,10,11,15)
F11(6,7,8,9,10,11,12,13,14,15)(1,2,3,4,5,6,7,8,9,10,11,12,13,14,15)(6,7,8,9,10,11,12,13,14,15)II
F12(7,9,10,11,12,13,14,15)(1,2,3,4,5,6,7,8,9,10,11,12,13,15)(7,9,11,12,13,15)
F13(7,8,9,11,12,13,14,15)(1,2,3,4,5,6,7,8,9,10,11,12,13,14,15)(7,8,9,11,12,13,14,15)II
F14(7,8,9,11,13,14,15,)(1,2,3,4,5,6,7,8,9,10,11,12,13,14,15)(7,8,9,11,13,14,15)II
F15(7,9,10,11,12,13,14,15)(1,2,3,4,5,6,7,8,9,10,11,12,13,14,15)(7,9,10,11,12,13,14,15)II
Iteration Level III
CodeReachability SetAntecedents SetIntersection SetLevel
F1(1,2,5,6,8,10,12)(1,3)(1)
F2(2,4,5,6,8,10,12)(1,2,3,4,5,6)(2,4,5,6)
F3(1,2,3,4,5,6,8,10,12)(3)(3)
F4(2,4,5,6,8,10,12)(2,3,4,5,6)(2,4,5,6)
F5(2,4,5,6,8,10,12)(1,2,3,4,5,6)(2,4,5,6)
F6(2,4,5,6,8,10,12)(1,2,3,4,5,6)(2,4,5,6)
F8(8,10,12)(1,2,3,4,5,6,8)(8)
F10(10)(1,2,3,4,5,6,8,10,12)(10)III
F12(10,12)(1,2,3,4,5,6,8,10,12)(12)
Iteration Level IV
CodeReachability SetAntecedents SetIntersection SetLevel
F1(1,2,5,6,8)(1,3)(1)
F2(2,4,5,6,8)(1,2,3,4,5,6)(2,4,5,6)
F3(1,2,3,4,5,6,8)(3)(3)
F4(2,4,5,6,8)(2,3,4,5,6)(2,4,5,6)
F5(2,4,5,6,8)(1,2,3,4,5,6)(2,4,5,6)
F6(2,4,5,6,8)(1,2,3,4,5,6)(2,4,5,6)
F8(8,12)(1,2,3,4,5,6,8)(8)
F12(12)(1,2,3,4,5,6,8,10,12)(12)IV
Iteration Level V
CodeReachability SetAntecedents SetIntersection SetLevel
F1(1,2,5,6,8)(1,3)(1)
F2(2,4,5,6,8)(1,2,3,4,5,6)(2,4,5,6)
F3(1,2,3,4,5,6,8)(3)(3)
F4(2,4,5,6,8)(2,3,4,5,6)(2,4,5,6)
F5(2,4,5,6,8)(1,2,3,4,5,6)(2,4,5,6)
F6(2,4,5,6,8)(1,2,3,4,5,6)(2,4,5,6)
F8(8)(1,2,3,4,5,6,8)(8)V
Iteration Level VI
CodeReachability SetAntecedents SetIntersection SetLevel
F1(1,2,5,6)(1,3)(1)
F2(2,4,5,6)(1,2,3,4,5,6)(2,4,5,6)VI
F3(1,2,3,4,5,6)(3)(3)
F4(2,4,5,6)(2,3,4,5,6)(2,4,5,6)VI
F5(2,4,5,6)(1,2,3,4,5,6)(2,4,5,6)VI
F6(2,4,5,6)(1,2,3,4,5,6)(2,4,5,6)VI
Iteration Level VII
CodeReachability SetAntecedents SetIntersection SetLevel
F1(1)(1,3)(1)VII
F3(1,3)(3)(3)
Iteration Level VIII
CodeReachability SetAntecedents SetIntersection SetLevel
F3(3)(3)(3)VIII
Table 7. Final level partitioning.
CodeReachability SetAntecedents SetIntersection SetLevel
F3(3)(3)(3)VIII
F1(1)(1,3)(1)VII
F2(2,4,5,6)(1,2,3,4,5,6)(2,4,5,6)VI
F4(2,4,5,6)(2,3,4,5,6)(2,4,5,6)VI
F5(2,4,5,6)(1,2,3,4,5,6)(2,4,5,6)VI
F6(2,4,5,6)(1,2,3,4,5,6)(2,4,5,6)VI
F8(8)(1,2,3,4,5,6,8)(8)V
F12(7,9,10,11,12,13,14,15,16)(1,2,3,4,5,6,7,8,9,10,11,12,13,15)(7,9,10,11,12,13,15)IV
F10(10)(1,2,3,4,5,6,8,10,12)(10)III
F9(5,6,7,8,9,10,11,12,13,14,15)(1,2,3,4,5,6,7,8,9,10,11,12,13,14,15)(5,6,7,8,9,10,11,12,13,14,15)II
F11(6,7,8,9,10,11,12,13,14,15)(1,2,3,4,5,6,7,8,9,10,11,12,13,14,15)(6,7,8,9,10,11,12,13,14,15)II
F13(7,8,9,11,12,13,14,15)(1,2,3,4,5,6,7,8,9,10,11,12,13,14,15)(7,8,9,11,12,13,14,15)II
F14(7,8,9,11,13,14,15,)(1,2,3,4,5,6,7,8,9,10,11,12,13,14,15)(7,8,9,11,13,14,15)II
F15(7,9,10,11,12,13,14,15)(1,2,3,4,5,6,7,8,9,10,11,12,13,14,15)(7,9,10,11,12,13,14,15)II
F7(6,7,8,9,10,11,12,13,14,15)(1,2,3,4,5,6,7,8,9,10,11,12,13,14,15)(6,7,8,9,10,11,12,13,14,15)II
F16(16)(1,2,3,4,6,7,8,9,10,11,12,13,14,15,16)(16)I
Table 8. Average direct-relationship matrix (A).
i/jF1F2F3F4F5F6F7F8F9F10F11F12F13F14F15F16Sum
F1032423124333202135
F2202230112422143332
F3230343232310330133
F4323023342233343242
F5233204232302311334
F6202410323323423135
F7134322034242131136
F8312421202311224232
F9220311240413344236
F10210213342022441233
F11331343113201444340
F12210222214320444336
F13331333311423012336
F14343222243433402243
F15332123302441220436
F16220311121133231026
Table 9. Normalization direct-relationship matrix (D).
00.06980.04650.09300.04650.06980.02330.04650.09300.06980.06980.06980.046500.04650.0233
0.046500.04650.04650.069800.02330.02330.04650.09300.04650.04650.02330.09300.06980.0698
0.04650.069800.06980.09300.06980.04650.06980.04650.06980.023300.06980.069800.0233
0.06980.04650.069800.04650.06980.06980.09300.04650.04650.06980.06980.06980.09300.06980.0465
0.04650.06980.06980.046500.09300.04650.06980.04650.069800.04650.06980.02330.02330.0698
0.046500.04650.09300.023300.06980.04650.06980.06980.04650.06980.09300.04650.06980.0233
0.02330.06980.09300.06980.04650.046500.06980.09300.04650.09300.04650.02330.06980.02330.0233
0.06980.02330.04650.09300.04650.02330.046500.04650.06980.02330.02330.04650.04650.09300.0465
0.04650.046500.06980.02330.02330.04650.093000.09300.02330.06980.06980.09300.09300.0465
0.04650.023300.04650.02330.06980.06980.09300.046500.04650.04650.09300.09300.02330.0465
0.06980.06980.02330.06980.09300.06980.02330.02330.06980.046500.02330.09300.09300.09300.0698
0.04650.023300.04650.04650.04650.04650.02330.09300.06980.046500.09300.09300.09300.0698
0.06980.06980.02330.06980.06980.06980.06980.02330.02330.09300.04650.069800.02330.04650.0698
0.06980.09300.06980.04650.04650.04650.04650.09300.06980.09300.06980.06980.093000.04650.0465
0.06980.06980.04650.02330.04650.06980.069800.04650.09300.09300.02330.04650.046500.0930
0.04650.046500.06980.02330.02330.02330.04650.02330.02330.06980.06980.04650.06980.02330
Table 10. Total relation matrix T = Y (inverse (I − Y)).
1.24340.29410.21320.3640.26030.30010.24260.28830.33740.37270.29320.29230.33470.2860.29250.2532
0.26711.21540.19990.29390.26240.21740.22150.24860.27240.36680.2550.25110.28860.34340.28410.277
0.27340.28411.16660.32880.29030.28710.25120.30120.2790.35570.23540.2170.33710.32610.22880.2364
0.35630.32260.27271.3320.30380.34520.32550.37610.34530.41120.34030.33410.40960.41750.3560.3167
0.27280.28080.22730.30941.20250.30630.25190.29720.27980.35520.21720.25950.3370.28680.25080.2793
0.29210.23770.21850.36790.24211.24090.29080.29310.3210.37690.28010.29630.38080.32860.31330.2554
0.27550.30690.26590.35320.27140.28551.22460.3220.34660.36290.32090.27590.3240.360.27760.2593
0.290.23830.20430.34020.2420.24140.24671.22580.27390.34690.23740.23120.30810.29970.30740.2548
0.29720.28340.1780.34870.24310.26340.27130.33761.25810.40420.26410.30020.36230.37490.33950.2831
0.27740.24380.16660.31150.22740.28720.27450.31970.28451.29260.26510.26330.36180.35050.2580.2614
0.34330.33250.21940.37870.33140.33340.27160.29910.3480.39561.26210.28430.4140.39990.36160.3286
0.29670.26520.17630.32850.26420.28680.27130.27470.34460.38410.28531.23790.38560.37420.33830.3049
0.31040.29890.19710.34620.2830.30440.28690.26990.27910.39480.27930.29721.29230.30770.28920.2977
0.35860.36540.26970.37910.30640.32510.30640.37890.36640.45720.33990.33690.43291.33710.33830.3208
0.30990.30170.21610.30450.26330.30290.2840.24810.29870.39420.32160.25340.33660.32881.24240.3177
0.23280.22340.13290.27760.18980.2020.18880.22950.21690.2580.24380.24120.26690.28110.21421.1776
Table 11. Degree of influence.
CodeRiCiRi + CiRi − CiIdentifyRanking
F14.667924.696869.36478−0.0289Effect8
F24.264554.494268.75881−0.2297Effect13
F34.39783.324237.722031.07357Cause16
F45.564765.3641810.92890.20058Cause2
F54.413674.183348.597010.23033Cause14
F64.735454.528879.264320.20657Cause9
F74.832044.209299.041320.62275Cause11
F84.287924.709688.9976−0.4218Effect12
F94.809094.851549.66062−0.0424Effect6
F104.445315.9289410.3743−1.4836Effect3
F115.303354.440549.743890.8628Cause5
F124.818524.371939.190450.44659Cause10
F134.734175.5722710.3064−0.8381Effect4
F145.618855.4021911.0210.21666Cause1
F154.723974.691749.41570.03223Cause7
F163.57644.423878.00026−0.8475Effect15
Table 12. Total relationship matrix (T).
0.24340.29410.21320.36400.26030.30010.24260.28830.33740.37270.29320.29230.33470.28600.29250.2533
0.26710.21540.19990.29390.26240.21740.22150.24860.27240.36680.25500.25110.28860.34340.28410.2770
0.27340.28410.16660.32880.29030.28710.25120.30120.27900.35570.23540.21700.33710.32610.22880.2364
0.35630.32260.27270.33200.30380.34520.32550.37610.34530.41120.34030.33410.40960.41750.35600.3167
0.27280.28080.22730.30940.20250.30630.25190.29720.27980.35520.21720.25950.33700.28680.25080.2793
0.29210.23770.21850.36790.24210.24090.29080.29310.32100.37690.28010.29630.38080.32860.31330.2554
0.27550.30690.26590.35320.27140.28550.22460.32200.34660.36290.32090.27590.32400.36000.27760.2593
0.29000.23830.20430.34020.24200.24140.24670.22580.27390.34690.23740.23120.30810.29970.30740.2548
0.29720.28340.17800.34870.24310.26340.27130.33760.25810.40420.26410.30020.36230.37490.33950.2831
0.27740.24380.16660.31150.22740.28720.27450.31970.28450.29260.26510.26330.36180.35050.25800.2614
0.34330.33250.21940.37870.33140.33340.27160.29910.34800.39560.26210.28430.41400.39990.36160.3286
0.29670.26520.17630.32850.26420.28680.27130.27470.34460.38410.28530.23790.38560.37420.33830.3049
0.31040.29890.19710.34620.28300.30440.28690.26990.27910.39480.27930.29720.29230.30770.28920.2978
0.35860.36540.26970.37910.30640.32510.30640.37890.36640.45720.33990.33690.43290.33710.33830.3208
0.30990.30170.21610.30450.26330.30290.28400.24810.29870.39420.32160.25340.33660.32880.24240.3177
0.23280.22340.13290.27760.18980.20200.18880.22950.21690.25800.24380.24120.26690.28110.21420.1776
Disclaimer/Publisher’s Note: The statements, opinions and data contained in all publications are solely those of the individual author(s) and contributor(s) and not of MDPI and/or the editor(s). MDPI and/or the editor(s) disclaim responsibility for any injury to people or property resulting from any ideas, methods, instructions or products referred to in the content.

