Article

Quality Grading and Prediction of Frozen Zhoushan Hairtails in China Based on ETSFormer

1
National Institutes for Food and Drug Control, Beijing 100050, China
2
National Engineering Research Centre for Agri-Product Quality Traceability, Beijing Technology and Business University, Beijing 100048, China
3
China Food Flavor and Nutrition Health Innovation Center, Beijing Technology and Business University, Beijing 100048, China
*
Author to whom correspondence should be addressed.
Sustainability 2023, 15(21), 15566; https://doi.org/10.3390/su152115566
Submission received: 22 September 2023 / Revised: 28 October 2023 / Accepted: 31 October 2023 / Published: 2 November 2023

Abstract

:
With the increasing demand for high-quality, healthy, and nutritious food, hairtails have good potential for development in both domestic and international markets. In particular, Zhoushan hairtail is known as one of the best-tasting hairtail in the world for its unique composition and flavor. However, as a perishable food, the quality and safety of hairtails are susceptible to temperature and storage time. Therefore, the management of storage conditions and the prediction of quality changes in hairtails have become particularly important. In this study, Zhoushan hairtail is selected as an experimental subject, and its quality is assessed by collecting the physicochemical characteristics of hairtail at four different temperatures (−7 °C, −13 °C, −18 °C, and −23 °C) over time. Combined with the K-Means++ algorithm, we have constructed a hierarchy of hairtail quality and predicted its quality using the ETSFormer model. Through the validation of the self-constructed data set, our model has achieved good results in predicting the low, medium, and high quality of hairtails, with F1 values of 92.44%, 95.10%, and 98.01%, respectively. The model provides a theoretical basis for the scientific storage and quality regulation of Zhoushan hairtail.

1. Introduction

Hairtail is highly popular in the Chinese market and is one of the traditional Chinese ingredients [1], which is loved by people for its unique taste and rich nutritional value. Meanwhile, with the growing demand for healthy food and diversified cuisines, hairtails are gaining popularity in foreign markets such as the United States and Europe. The advancement of cold chain logistics and cross-border trade has facilitated the import and export of hairtails [2,3,4,5,6,7]. Zhoushan hairtail is one of the leading hairtail species, known as the best-tasting hairtail [8], and is one of the first seafood in China to be awarded the National Geographical Indication Trademark (NGIT). Compared with other hairtails, Zhoushan hairtail has higher nutritional value and benefits. It is rich in various unsaturated fatty acids, such as docosahexaenoic acid (DHA) and eicosapentaenoic acid (EPA), which help prevent cardiovascular diseases, enhance memory, and improve intelligence. In addition, Zhoushan hairtail is also rich in trace elements, such as calcium, magnesium, iron, zinc [9,10], etc., which can improve the human immune system and enhance the body’s immunity. Therefore, Zhoushan hairtail is well recognized and loved by consumers. As the popularity of hairtails continues to grow among consumers, the issue of muscle quality of hairtails has also attracted attention. First of all, hairtail belongs to marine fish and has a high water content. Thus, it spoils relatively fast. Meanwhile, hairtails are rich in bacteria and enzymes. If they are not refrigerated or treated in time after being caught, high temperatures will accelerate the process of their deterioration, and bacteria will multiply rapidly, leading to the deterioration of hairtails [11]. Secondly, prolonged storage may also lead to deterioration in the quality of hairtails. Even when stored at low temperatures, the nutritional value and texture of hairtails will gradually decrease. Prolonged storage may lead to oxidation of fatty acids and loss of vitamins, making the texture and flavor of hairtails impaired. In addition, prolonged storage also increases the risk of bacterial and mold growth, further affecting the quality and safety of hairtails. Hence, when storing hairtails, it is necessary to ensure appropriate low temperatures and appropriate time to reduce the risk of deterioration and spoilage of hairtails [12].
As the market share of hairtails continues to expand, improving the muscle quality of hairtails is becoming increasingly important. Ensuring that the freshness, taste, and nutritional value of hairtails are retained to the maximum extent through stringent quality testing [13,14] and improving food safety and food quality of hairtail products can enhance consumer trust in hairtail products. Therefore, the hairtails industry should continue to strengthen its quality assurance efforts and align itself with the global market in order to realize greater development potential. At the same time, with the continuous expansion of the hairtail market, the catch of hairtail in the Zhoushan area is also increasing. However, due to a series of problems in transportation and storage, a large number of caught hairtail will rot and deteriorate, resulting in the actual number of hairtail that can be consumed does not match the needs of consumers. In order to meet the growing demand of consumers for hairtail products, we can only increase the catch of hairtail in Zhoushan. However, this behavior not only leads to the waste of hairtail resources but also challenges the reproduction of hairtail fish in the Zhoushan area and threatens its sustainable development. Therefore, in order to reduce the loss of hairtail in Zhoushan during storage and promote its sustainable development, it is very important to group and predict the quality of hairtail. Through reasonable management and treatment of hairtail in transportation and storage according to quality grade, unnecessary loss can be reduced so as to reduce the dependence on the catch quantity of hairtail, ensure the normal reproduction of fish, and realize sustainable development. This will help to reduce the waste of resources, ensure the sustainable utilization of hairtail resources in Zhoushan, and meet the demand of consumers for high-quality hairtail products.
In order to improve the above problem, many related scholars are committed to studying the quality change in hairtail during logistics and transportation and its maintenance methods. Scholars analyzed microbial communities in hairtail muscle samples using the Illumina MiSeq high-throughput DNA sequencing platform [15]. This method can be used to study the diversity and dynamics of microbial communities in hairtail during the cold chain. The results of the study showed that the diversity and abundance of bacteria in hairtail muscle reached the highest level after 168 h of cold storage. Moreover, some scholars investigated the changes in fat composition in hairtail muscle after 120 days of cryopreservation using chemical methods and liquid chromatography-mass spectrometry (LC/MS) techniques [16]. The results of the study showed that the peroxide value (PV) and thiobarbituric acid reactive substance value (TBARS) of hairtail muscle increased significantly after freezing for 120 days. Another research method was used to study the protein composition of hairtail muscles cryopreserved for 120 and 6 days using physicochemical, proteomic, and bioinformatics analyses [17]. The results showed that compared with the initial state, the muscle elasticity, chewiness, active sulfhydryl content of myogenic fiber, and Ca2+-ATPase activity of refrigerated hairtail decreased significantly. This study provided an in-depth understanding of the mechanism of protein changes in hairtail muscle under cold stress. In addition, liquid nitrogen freezing [18] plays an important role in the long-term cryopreservation of hairtail. In the experiment, fresh hairtail was frozen with liquid nitrogen or cold air and stored at 20·°C or 80 °C for 120 days to study the effect of liquid nitrogen freezing. The experimental results showed that the contents of carboxyl, trichloroacetic acid (TCA) soluble polypeptide, and N-acetyl-β-d-glucosaminidase (NAG) in muscle increased with the storage time, while the activities of Ca2+-ATPase, Mg2+-ATPase and sulfhydryl group decreased with the storage time. In addition, the researchers involved also studied the lipid composition of hairtail muscle after 6 days of cold storage by chemical and LC-MS lipid proteomics techniques [19]. The results showed that the contents of peroxide value (PVs) and thiobarbituric acid reactive substances (TBARS) in muscle increased after 6 days of cold storage. It increased from 0.43 meq/kg lipid and 0.86 mg malondialdehyde (MDA)/kg muscle to 8.36 meq/kg and 10.69 mg MDA/kg, respectively. Furthermore, some scholars investigated the effect of cold plasma (CAP) [20] on the quality parameters of hairtail studied under cold storage conditions (4 C and relative humidity range of 45–55%). The effects of CAP on the total bacterial count (TBC), total volatile basic nitrogen (TVB nitrogen), pH value, thiobarbituric acid reactive substance value (TBARS), color, texture, and sensory evaluation of hairtail in cold storage were studied. The results have shown that CAP can effectively delay the deterioration of hairtail in cold storage, slow the rise of pH value, and maintain the sensory characteristics of hairtail, proving that CAP is a new method to prolong the shelf life of food.
Besides, with the increasing public concern about food quality, more and more scholars have begun to study the related fields. In recent years, deep learning has been widely applied in this area. Zhao [21] et al. proposed a deep learning-based extended morphology-nonlocal capsule network (EMP-NLCapsNet) algorithm for classifying the quality of fruits at different temperatures and different storage times. Bhole [22] et al. investigated a deep learning-centered non-destructive mango classification and grading system. The study automatically captured RGB and thermal images of mangoes from 360°. From these images, mango quality was automatically categorized into three classes based on parameters such as defects, shape, size, and ripeness. Stasenko [23] et al. trained U-Net and Deeplab models based on convolutional neural network (CNN) to detect and predict decay regions in post-harvest apples stored at room temperature, which improved the food storage process in precision agriculture by automatically detecting and quantifying decay regions. Abdallah [24] et al. collected images of healthy and spoiled beef and proposed a deep learning method based on ResNet-50 as a promising classifier for grading and classifying beef.
Summarizing the foregoing, this paper has constructed an ETSFormer-based quality prediction model for frozen Zhoushan hairtail from China. In this model, carbonyl content, sulfhydryl content, TBARS, and Ca2+-ATPase activity are measured at different storage temperatures and storage days using hairtails from the East China Sea waters of Zhoushan City, Zhejiang Province. By combining the K-Means++ algorithm, the data-driven formation of Zhoushan hairtail quality grade is performed. Finally, the quality prediction model of Zhoushan hairtail is constructed by combining the ETSFormer neural network model and tested on the constructed data set. This study provides technical support and a scientific basis for evaluating the quality grade of hairtails and predicting the change in quality grade.

2. Materials and Methods

2.1. Sample Collection and Processing

In order to study the changes in muscle physicochemical properties of hairtail during freezing and storage, four indicators, namely, carbonyl content, sulfhydryl content, TBARS, and Ca2+-ATPase, are selected for measurement in this paper. Among them, the samples of hairtails are selected from the East China Sea waters of Zhoushan City, Zhejiang Province.

2.1.1. Determination of Carbonyl Content

The carbonyl content of hairtail muscle under different freezing conditions is determined by referring to the instructions in the protein carbonyl test kit [25]. The formula is calculated as:
Protein   carbonyl   content   ( nmol / mg   prot ) = OD 1 OD 2 22   ×   n   ×   m   ×   125   ×   10 5
where OD1 represents the absorbance value of the assay tube, OD2 represents the absorbance value of the control tube, n represents the colorimetric optical diameter, and m represents the sample protein concentration.

2.1.2. Determination of Sulfhydryl Content

Referring to Zhao et al. [26] method. The sulfhydryl contents are calculated by the formula:
SH   ( μ mol / g   prot ) = ( A 1   ×   A 4 ) / ( A 2   ×   A 3 )
where A1 represents the absorbance value, A2 represents the protein concentration, A3 represents the molar extinction coefficient 13,600/(L/mol·cm), and A4 represents the dilution ratio.

2.1.3. Determination of TBARS Values

According to the spectrophotometric method in the determination of malondialdehyde in food according to the National Standard for Food Safety [27], the malondialdehyde content is determined by the standard curve of 1,1,3,4-tetraethoxypropane, and the TBARS value is calculated by the formula below:
TBARS   ( mg   MDA / kg ) = X     0.0114 2.3879
where X represents the absorbance value.

2.1.4. Determination of Ca2+-ATPase Activity

Ca2+-ATPase activity is determined by referring to the instructions for use in the ATPase kit [28]. It is calculated by the formula:
ATP   Activity   ( U / mg   prot ) = A 1 A 2 A 3 A 4   ×   0.02   ×   2.8 **   ×   6 * m
where A1 represents the absorbance value of the measured sample, A2 represents the absorbance value of the control sample, A3 represents the absorbance value of the standard sample, A4 represents the absorbance value of the blank sample, m represents the concentration of the sample protein, 2.8** represents the dilution times of the enzymatic reaction system (280 μL/100 μL), and 6* represents the reaction time.

2.1.5. Data Preprocessing

Since the carbonyl content, sulfhydryl content, TBARS value, and Ca2+-ATPase activity indicators have different ranges of values, and their data do not have consistent monotonicity. Therefore, if the raw data are used directly for cluster analysis, the accuracy of the clustering results may be affected. In order to solve this problem, this study has performed normalization and monotonicity transformation on the measurement data. By normalizing the data, the value ranges of different indicators are unified, which avoids the influence of the differences between indicators on the clustering results. At the same time, monotonicity conversion processing can adjust the data that do not have consistent monotonicity to the form that has consistent monotonicity so as to better carry out the clustering analysis.
1.
Data normalization
In this study, we have used the maximum–minimum method [29] to normalize the data in order to eliminate the influence of different measures on the clustering results and make different indicators comparable. The formula is shown in Equation (5).
X ˜ = X     X min X max X min
where X ˜ denotes the value of the evaluation indicator after normalization, X denotes the evaluation index in the original data set, X min denotes the minimum value of the evaluation indicator X in the original data set, and X max denotes the maximum value of the evaluation indicator X in the original data set. As can be seen from the formula, the normalization process maps the range of values of the original data to between 0 and 1.
2.
Data monotonicity transformation
From the experiments, it is found that among the raw data of the four metrics, the values of carbonyl content and TBARS value show a monotonically increasing trend with time, while the values of sulfhydryl content and Ca2+-ATPase activity show a monotonically decreasing trend. For consistent monotonicity of the data, we have transformed the raw data for sulfhydryl content and Ca2+-ATPase activity to show a monotonically increasing trend with time.
To adjust the monotonicity of the raw data of sulfhydryl content and Ca2+-ATPase activity, we have converted them using a logarithmic function. The specific conversion equations are shown in Equations (6) and (7).
S ˜ = 1 log 10 S
w ˜ = log 10 1 w
where S ˜ denotes the sulfhydryl content after logarithmic function conversion and S denotes the original sulfhydryl content; w ˜ denotes the Ca2+-ATPase activity after logarithmic function conversion and w denotes the original Ca2+-ATPase activity. Since the adjusted w ˜ exists less than zero, data normalization is performed for w ˜ , and the formula is shown in Equation (8).
w N ˜ = w ˜   w min ˜ w max ˜ w min ˜
where w N ˜ denotes the normalization-adjusted Ca2+-ATPase activity,   w min ˜ denotes the minimum value of the Ca2+-ATPase activity after conversion by the logarithmic function, and   w max ˜ denotes the maximum value of the Ca2+-ATPase activity after conversion by the logarithmic function.

2.2. Muscle Quality Grading Model of Hairtail Based on K-Means++

In order to classify the hairtail muscle quality more objectively, this study has used an unsupervised clustering algorithm to automatically divide the hairtail muscle quality data into different clusters in a data-driven manner, thus establishing a quality level classification. Considering the characteristics of the hairtail muscle quality data, i.e., small dimensions and continuous values, we have chosen the K-Means++ [30] algorithm as the clustering method. The core idea of the K-Means++ algorithm is to give preference to the sample points that are farther away from the existing clustering centers when selecting a new clustering center as the new clustering center. The detailed flowchart of the algorithm is given below in Figure 1:

2.3. ETSFormer-Based Quality Prediction Model of Zhoushan Frozen Hairtail

2.3.1. Quality Prediction Model for Frozen Hairtail in Zhoushan

In this paper, a prediction model of hairtail quality in Zhoushan, China, based on the ETSFormer [31] neural network is constructed, and its structure is shown in Figure 2. The model consists of three main components: the data processing layer, the prediction layer of hairtail muscle quality indicators based on the ETSFormer neural network, and the prediction layer of hairtail muscle quality grade. These components collaborate with each other to provide the quality prediction results of the Zhoushan hairtail by processing and predicting the indicator data of the Zhoushan hairtail muscle.
First, the various quality indicators of the Zhoushan hairtail muscle are measured at the data processing layer, and the obtained indicator data are converted to construct the Zhoushan hairtail muscle quality data set. Then, a K-Means++ clustering algorithm is used to cluster the sample data so as to form the quality class space. Next, the time series of quality assessment indicators [ X t L , , X t + i , X t ] are used as inputs to predict the quality indicators using the ETSFormer model. With this model, quality assessment indicators, including X (carbonyl), X (sulfhydryl), X (TBARS), and X (Ca2+-ATPase), can be predicted at the future moment t + 1.
Secondly, in the prediction layer of muscle quality indicators of hairtail based on the ETSFormer neural network, this study has used the ETSFormer algorithm to predict the various quality assessment indicators of Zhoushan hairtail with time-series characteristics. The ETSFormer model has improved the Transformer model [32] that is used for time series prediction by introducing exponential smoothing attention (ESA) and frequency attention (FA). The detailed description of the ETSFormer-based prediction model for muscle quality indicators of hairtail is described in Section 2.3.2.
Finally, in the prediction layer of the hairtail muscle quality level, the sample points formed by the hairtail muscle quality indicators obtained from the prediction of the upper layer are firstly compared in terms of distance with the constructed quality grade space. By calculating the distance to each grade space, the grade space with the closest distance is selected. Then, the current quality level of Zhoushan hairtail muscle is categorized into the corresponding grade space, which is the predicted quality level of hairtail.

2.3.2. Prediction Model of Zhoushan Frozen Hairtail Quality Indicator Based on ETSFormer

In this study, a quality prediction model for Zhoushan frozen hairtail based on the ETSFormer neural network model is proposed. The ETSFormer neural network model is a variant of the Transformer neural network model that incorporates the principle of exponential smoothing to improve the Transformer for time series forecasting. The model utilizes the new exponential smoothing attention (ESA) and frequency attention (FA), which replace the self-attention mechanism in the traditional Transformer and redesign the architecture of the Transformer. Figure 3 illustrates the overall encoder-decoder architecture of the ETSformer model. This architecture provides a complete encoder-decoder framework for the ETSformer model.
In this architecture, we are able to see the presence of encoder layers, the combination of decoder stacks and level stacks, as well as the role of growth damping and frequency attention. Each decoder stack consists of growth damping and frequency attention mechanisms for processing and extracting features of the input sequence to better capture the complexity and variation in the time series. For the decoder, generating advanced predictions, each G+S stack in the decoder consists of growth damping and frequency notation. The growth damping factor is between 0 and 1. The structure of ESA and FA is described below:
1.
Exponential Smoothing Attention
ESA mechanism is a novel form of attention whose weights are computed by the relative time lag rather than input content. Thus, it is defined as follows:
A ES ( V ) t = α V t + ( 1 α ) A ES ( V ) t 1 = j = 0 t 1 α ( 1 α ) j V t j + ( 1 α ) t v 0
where 0 < α < 1, α and v 0 are learnable parameters known as the smoothing parameter and initial state, respectively. A ES ( V ) t R d denotes the t-th row of the output matrix, representing the token corresponding to the t-th time step.
2.
Frequency Attention
Frequency attention first decomposes input signals into their Fourier bases via a discrete Fourier transform (DFT) along the temporal dimension, F ( Z t L : t n 1 ) C F × d , where F = ( L 2 ) + 1 , and selects bases with the K largest amplitudes. An inverse DFT is then applied to obtain the seasonality pattern in time domain. Formally, this is given by the following equations:
Φ k , i =   ( F ( Z t L : t ( n 1 ) ) k , i )
A k , i = | F ( Z t L : t ( n 1 ) ) k , i |
k i ( 1 ) , ,   k i ( K ) = arg k { 2 , F } Top K { A k , i }
S j , i ( n ) = k = 1 K A k i k , i [ cos ( 2 π f k i ( k ) j + Φ k i ( k ) , i ) + cos ( 2 π k i ( k ) j + Φ k i ( k ) , i ) ]
where Φ k , i , A k , i are the phase/amplitude of the k-th frequency for the i-th dimension,   arg   Top K returns the arguments of the top K amplitudes, K is a hyperparameter, f k is the Fourier frequency of the corresponding index, and k ,   Φ k , i are the Fourier frequency/amplitude of the corresponding conjugates.
In the encoder layer, raw signals are mapped to potential space through the input embedding module. The encoder extracts the potential components of growth and seasonality by iteratively extracting the level components from the recall window using a technique similar to classical level smoothing. Subsequently, these extracted components are passed to the decoder, which generates the final forecast under a combination of level, growth, and seasonal forecasts, which is defined as below:
X t + 1 = E t + 1 + Linear ( n = 1 N ( B t + 1 ( n ) ) + ( S t + 1 ( n ) ) )
where E t + 1 R H × m and B t + 1 ( n ) ,   S t + 1 ( n ) R H × d represent the level forecasts, and the growth and seasonal latent representations of each time step in the forecast horizon, respectively. The superscript represents the stack index, for a total of N encoder stacks. Note that Linear(·): R d R m operates element-wise along each time step, projecting the extracted growth and seasonal representations from latent to observation space.

3. Results

3.1. Data Set of Quality Indicators for Zhoushan Hairtail

Based on the above experiments, this paper has constructed a data set of quality indicators of muscle quality of Zhoushan hairtail over time at four temperatures, namely −7 °C, −13 °C, −18 °C and −23 °C, as shown in Figure 4, Figure 5, Figure 6 and Figure 7, where the horizontal coordinates represent the number of days, the vertical coordinates represent the indicator values, and the color of the curves represent different temperatures.
By observing Figure 4 and Figure 6, it can be clearly seen that the carbonyl content and TBARS value in hairtail samples gradually increase over time at different temperatures. This indicates that the lipid and protein of hairtail samples will be oxidized at different temperatures. A study has pointed out that the oxidation of lipids can indirectly lead to the oxidation of protein [33]. This is because the free radicals and reactive oxygen species produced by lipid oxidation can react with the surrounding protein, which leads to the oxidative modification of protein. According to this study, it can be found that there are differences between TBARS value and protein carbonyl value. The results show that lipid oxidation is only one-factor inducing protein oxidation, and there are other influencing factors. These other factors may include the production of oxygen-free radicals and the role of enzymes. Oxygen-free radicals are highly active molecules produced in the oxidation reaction, which can directly attack protein molecules and trigger their oxidation. In addition, some specific enzymes may be activated during food processing, leading to protein oxidation in hairtail samples. These factors interact with lipid oxidation and jointly affect the quality of hairtail. To sum up, the changes in TBARS value and protein carbonyl value are helpful to evaluate the oxidation degree of hairtail samples and then judge their quality.

3.2. Muscle Quality Grading of Zhoushan Hairtail

According to the current regulatory needs, this study classifies the quality of hairtail muscle into 2–6 levels and uses the K-Means++ algorithm in cluster analysis to set the K values of the cluster centers to 2–6, respectively. By comparing the silhouette coefficients of the clusters, the number of clusters with the best clustering effect is selected, which is the most suitable number for grading the quality of hairtail muscle. According to the experimental results, it can be observed in Figure 8 that the silhouette coefficient achieves the maximum value when the number of clusters is selected as three, indicating that the clustering effect is the best at this time. Based on this result, the quality grade of Zhoushan hairtail is classified into three levels in this study.
After selecting the number of quality classes, we use the K-Means++ algorithm to cluster the sample points. Table 1 lists the normalized values of the sample centers of each cluster and the number of sample points in each cluster. In order to classify the quality level, we evaluate the normalized cluster centers based on their Euclidean distance from the origin, and the higher the quality level of the samples, the closer their Euclidean distance is to the origin. Accordingly, we classify the three clusters into low-middle-high quality classes in order.
After dividing the sample set of Zhoushan hairtail into different quality classes, we analyze the probability density of the distribution of the original sample points in each cluster, as shown in Figure 9, Figure 10 and Figure 11. From the figure, we can observe the distribution of each indicator in different quality clusters as follows:
(1)
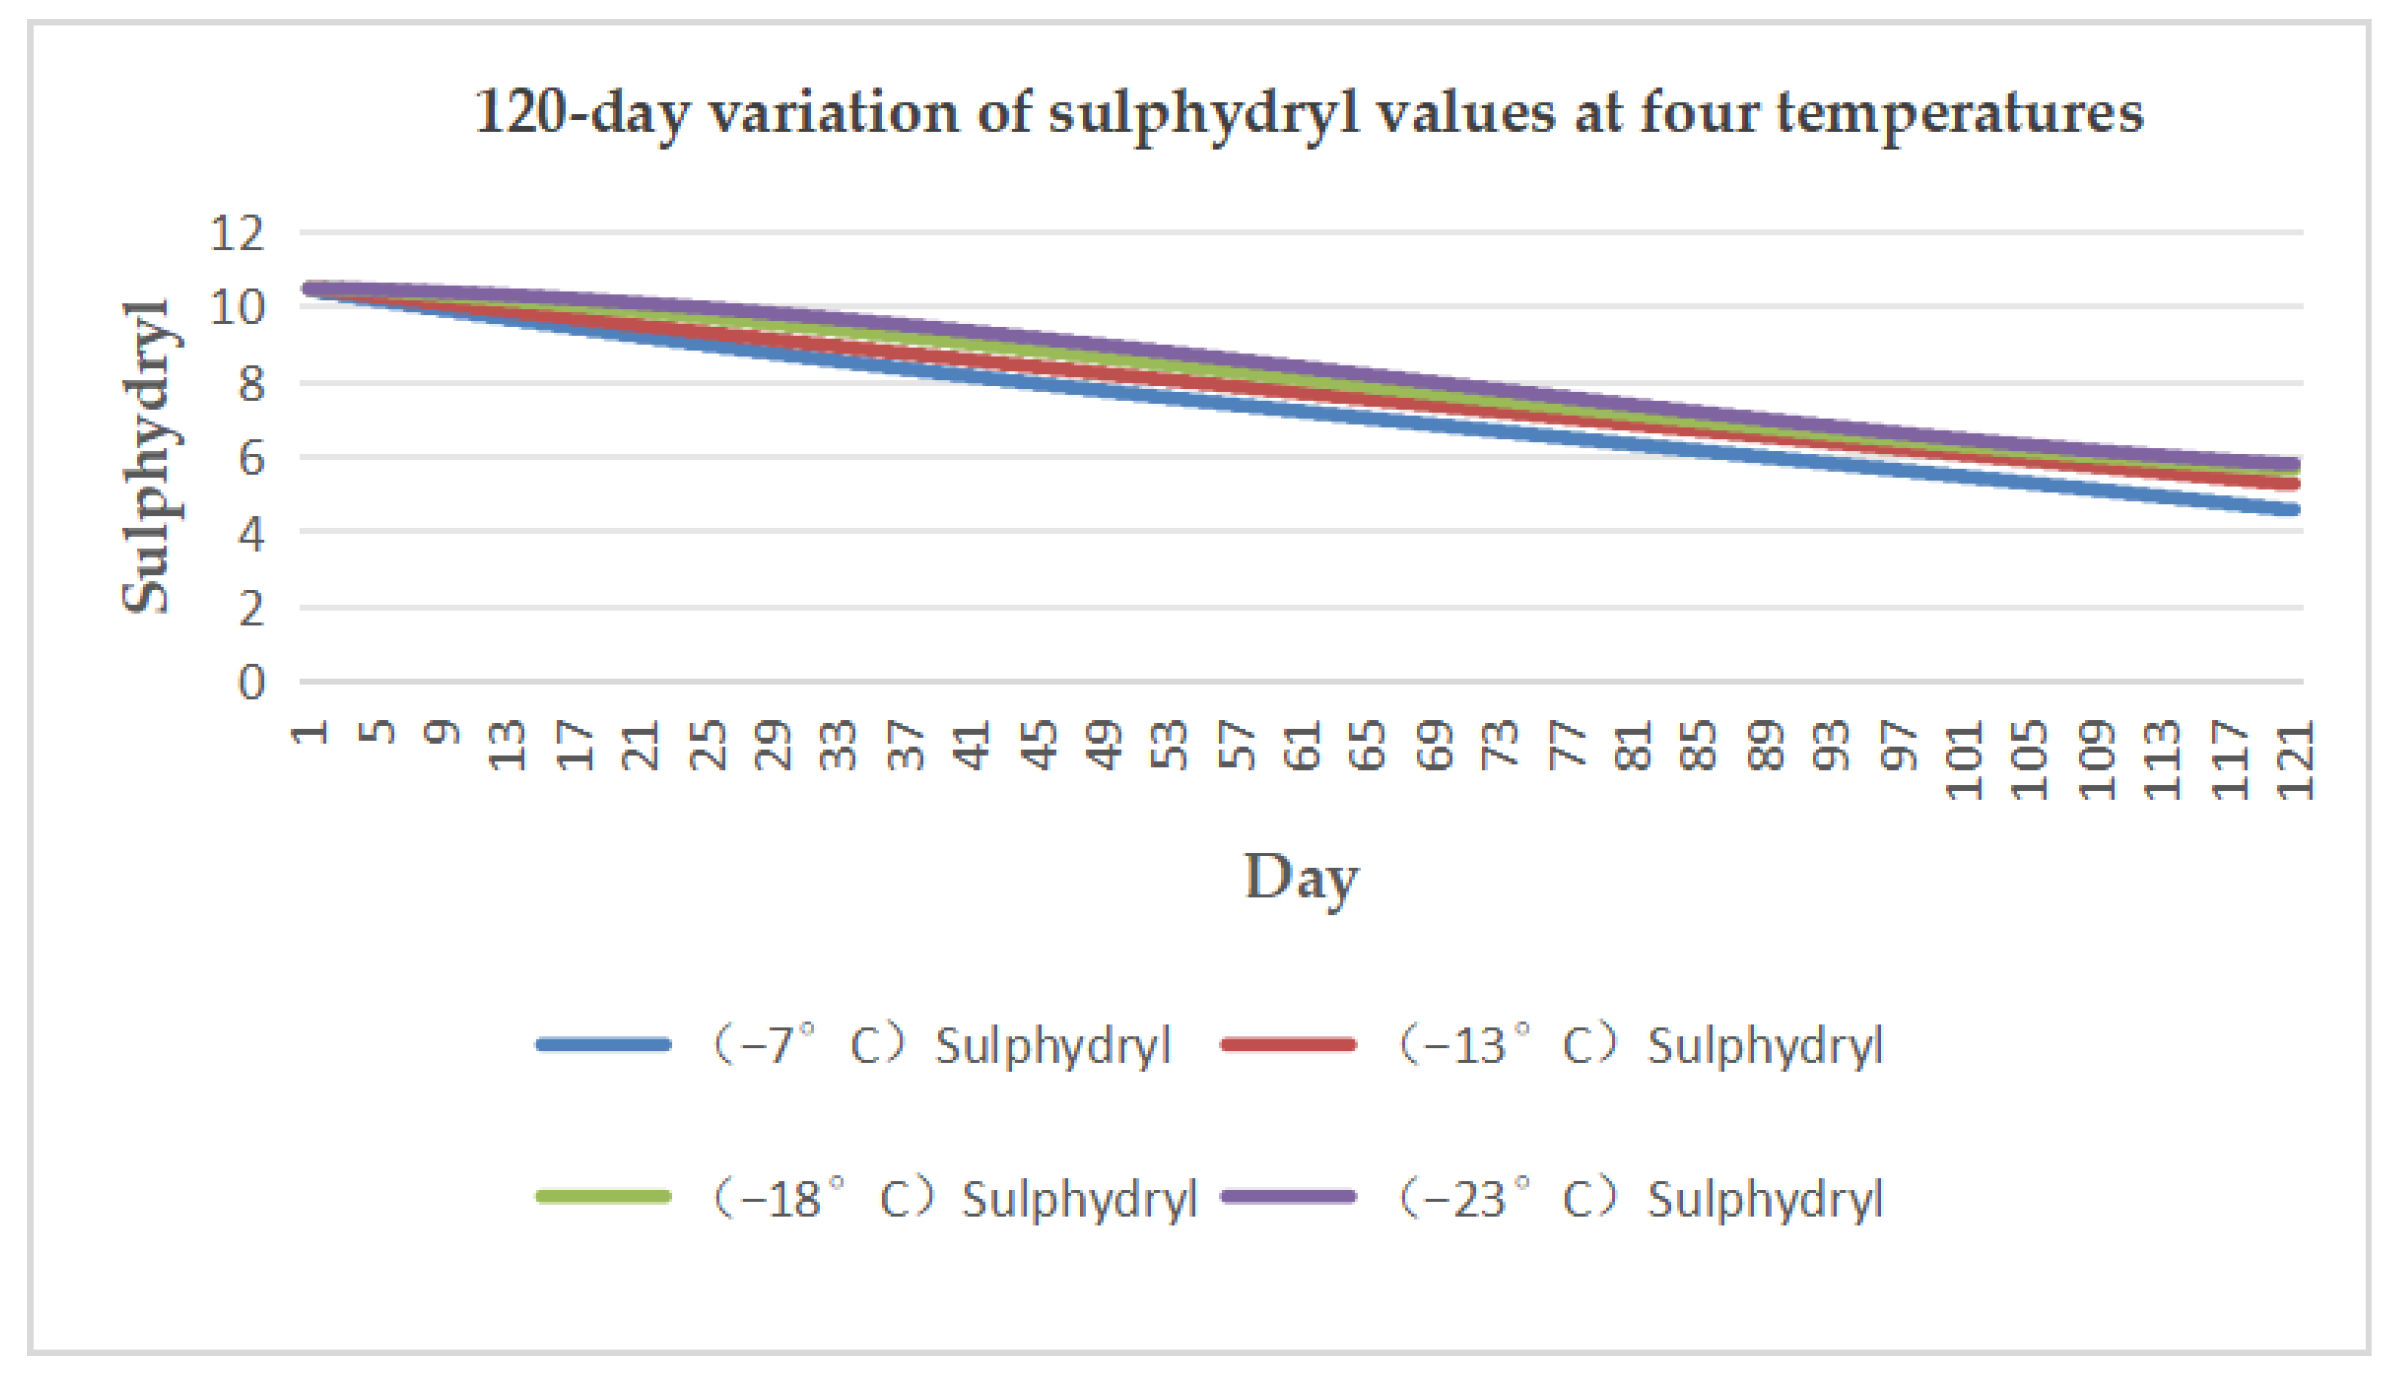
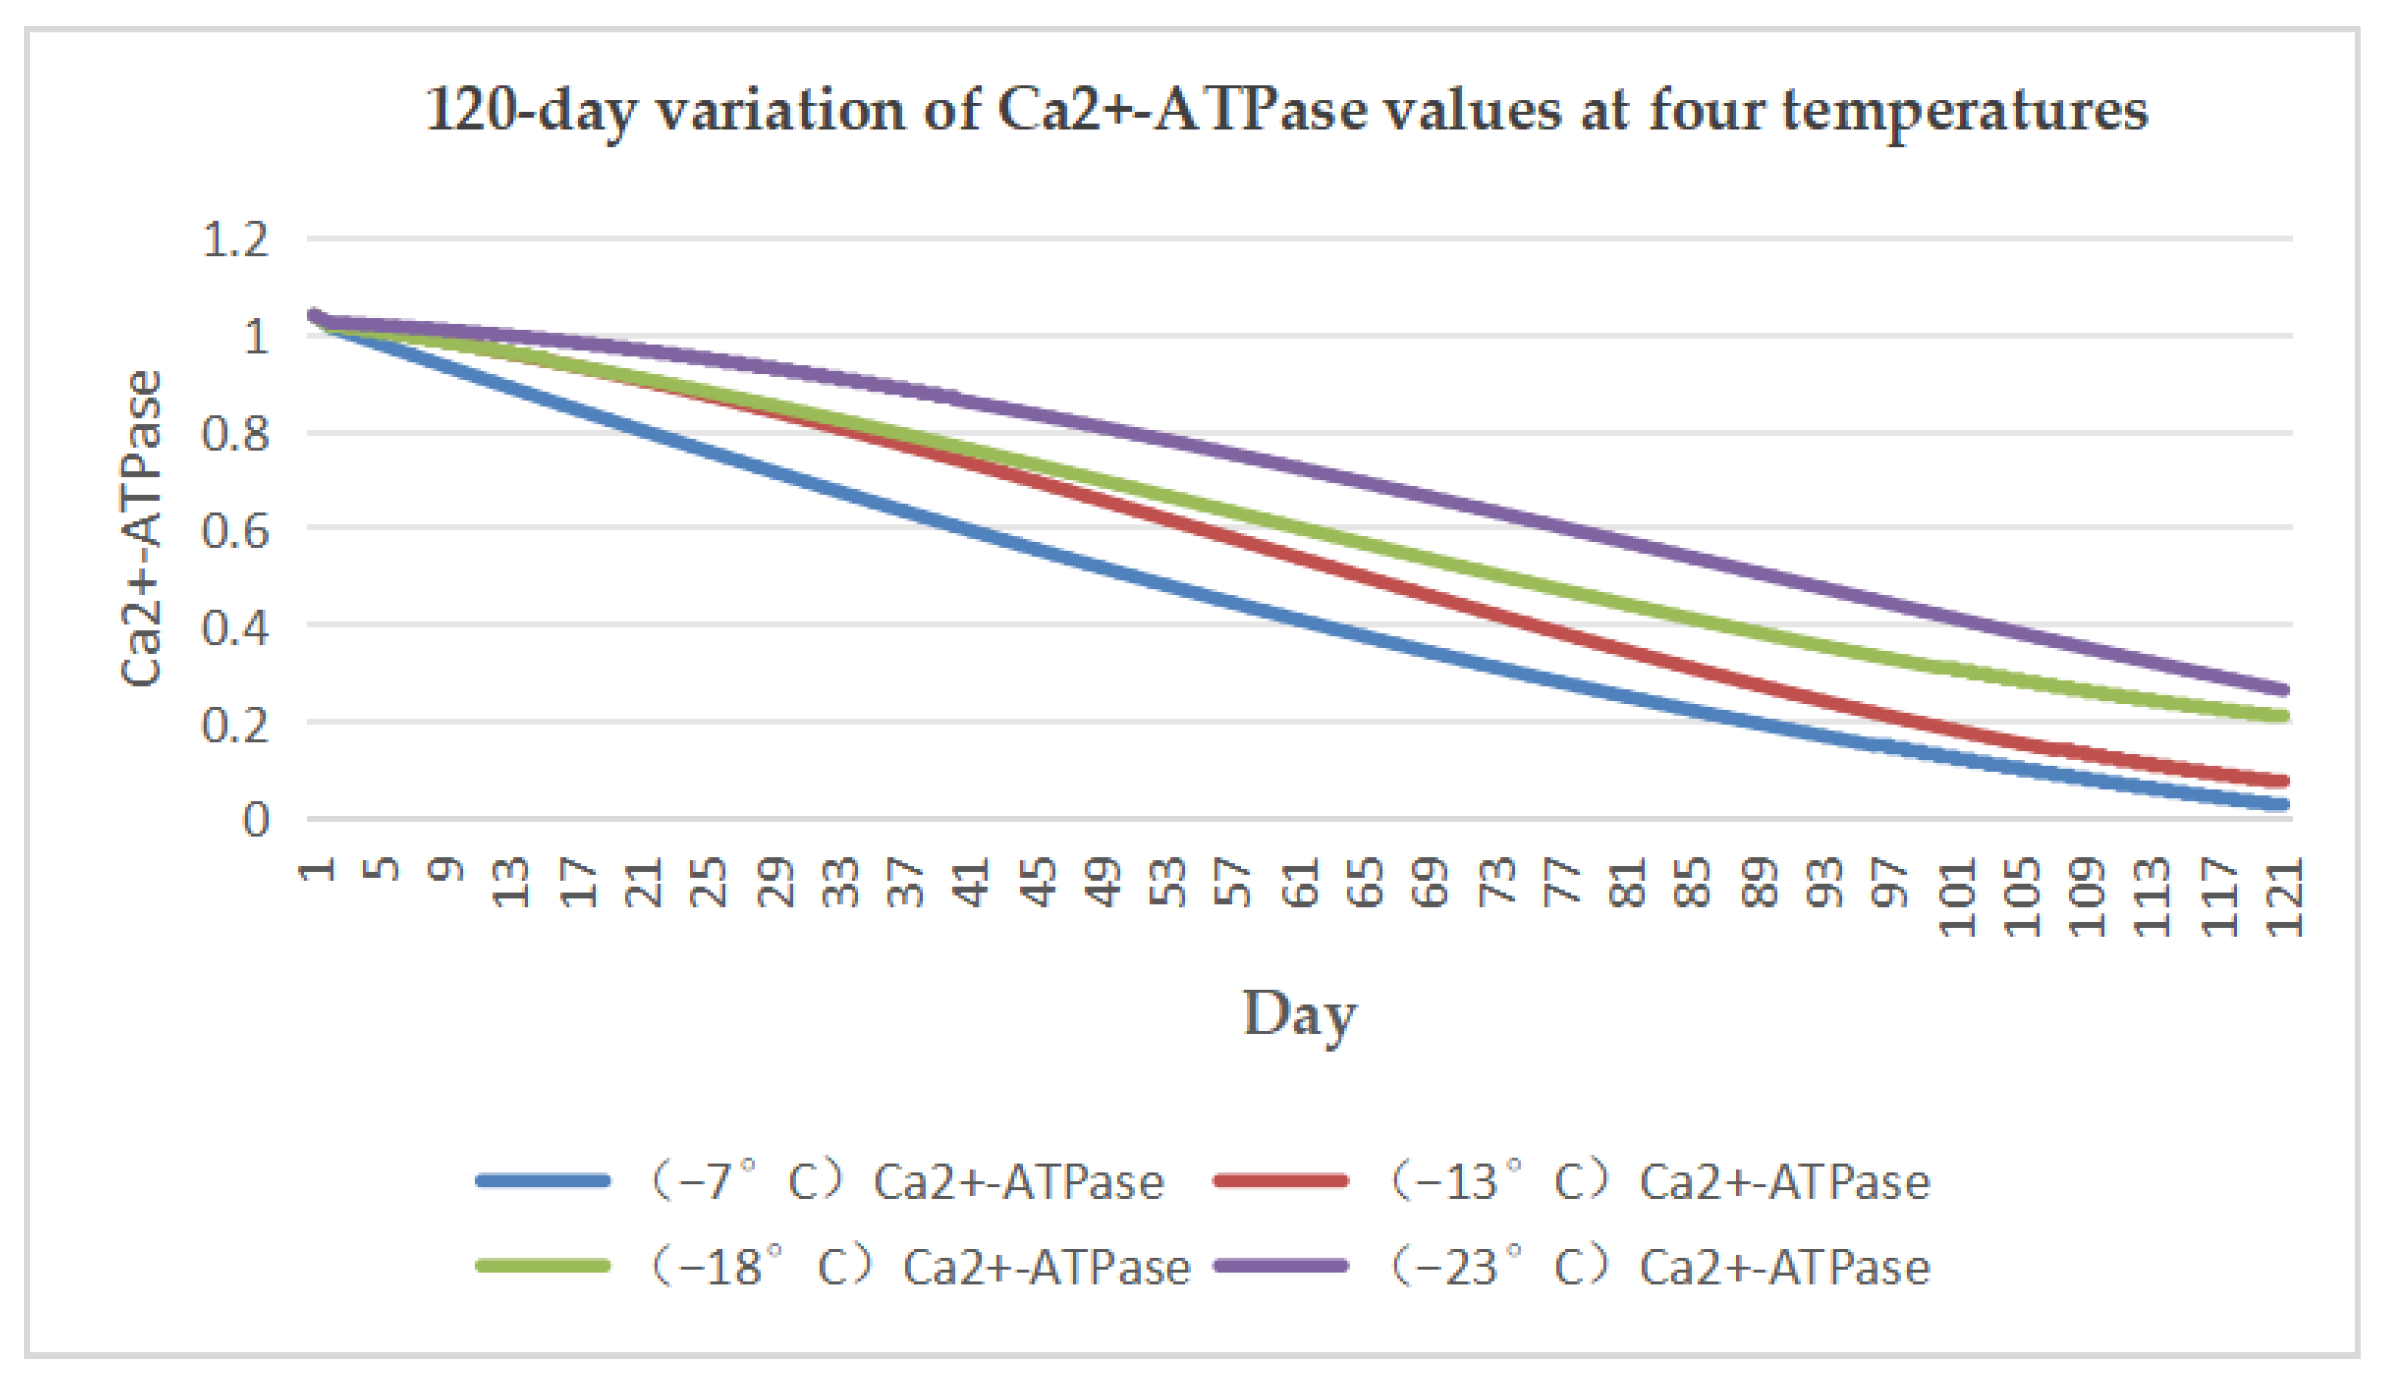
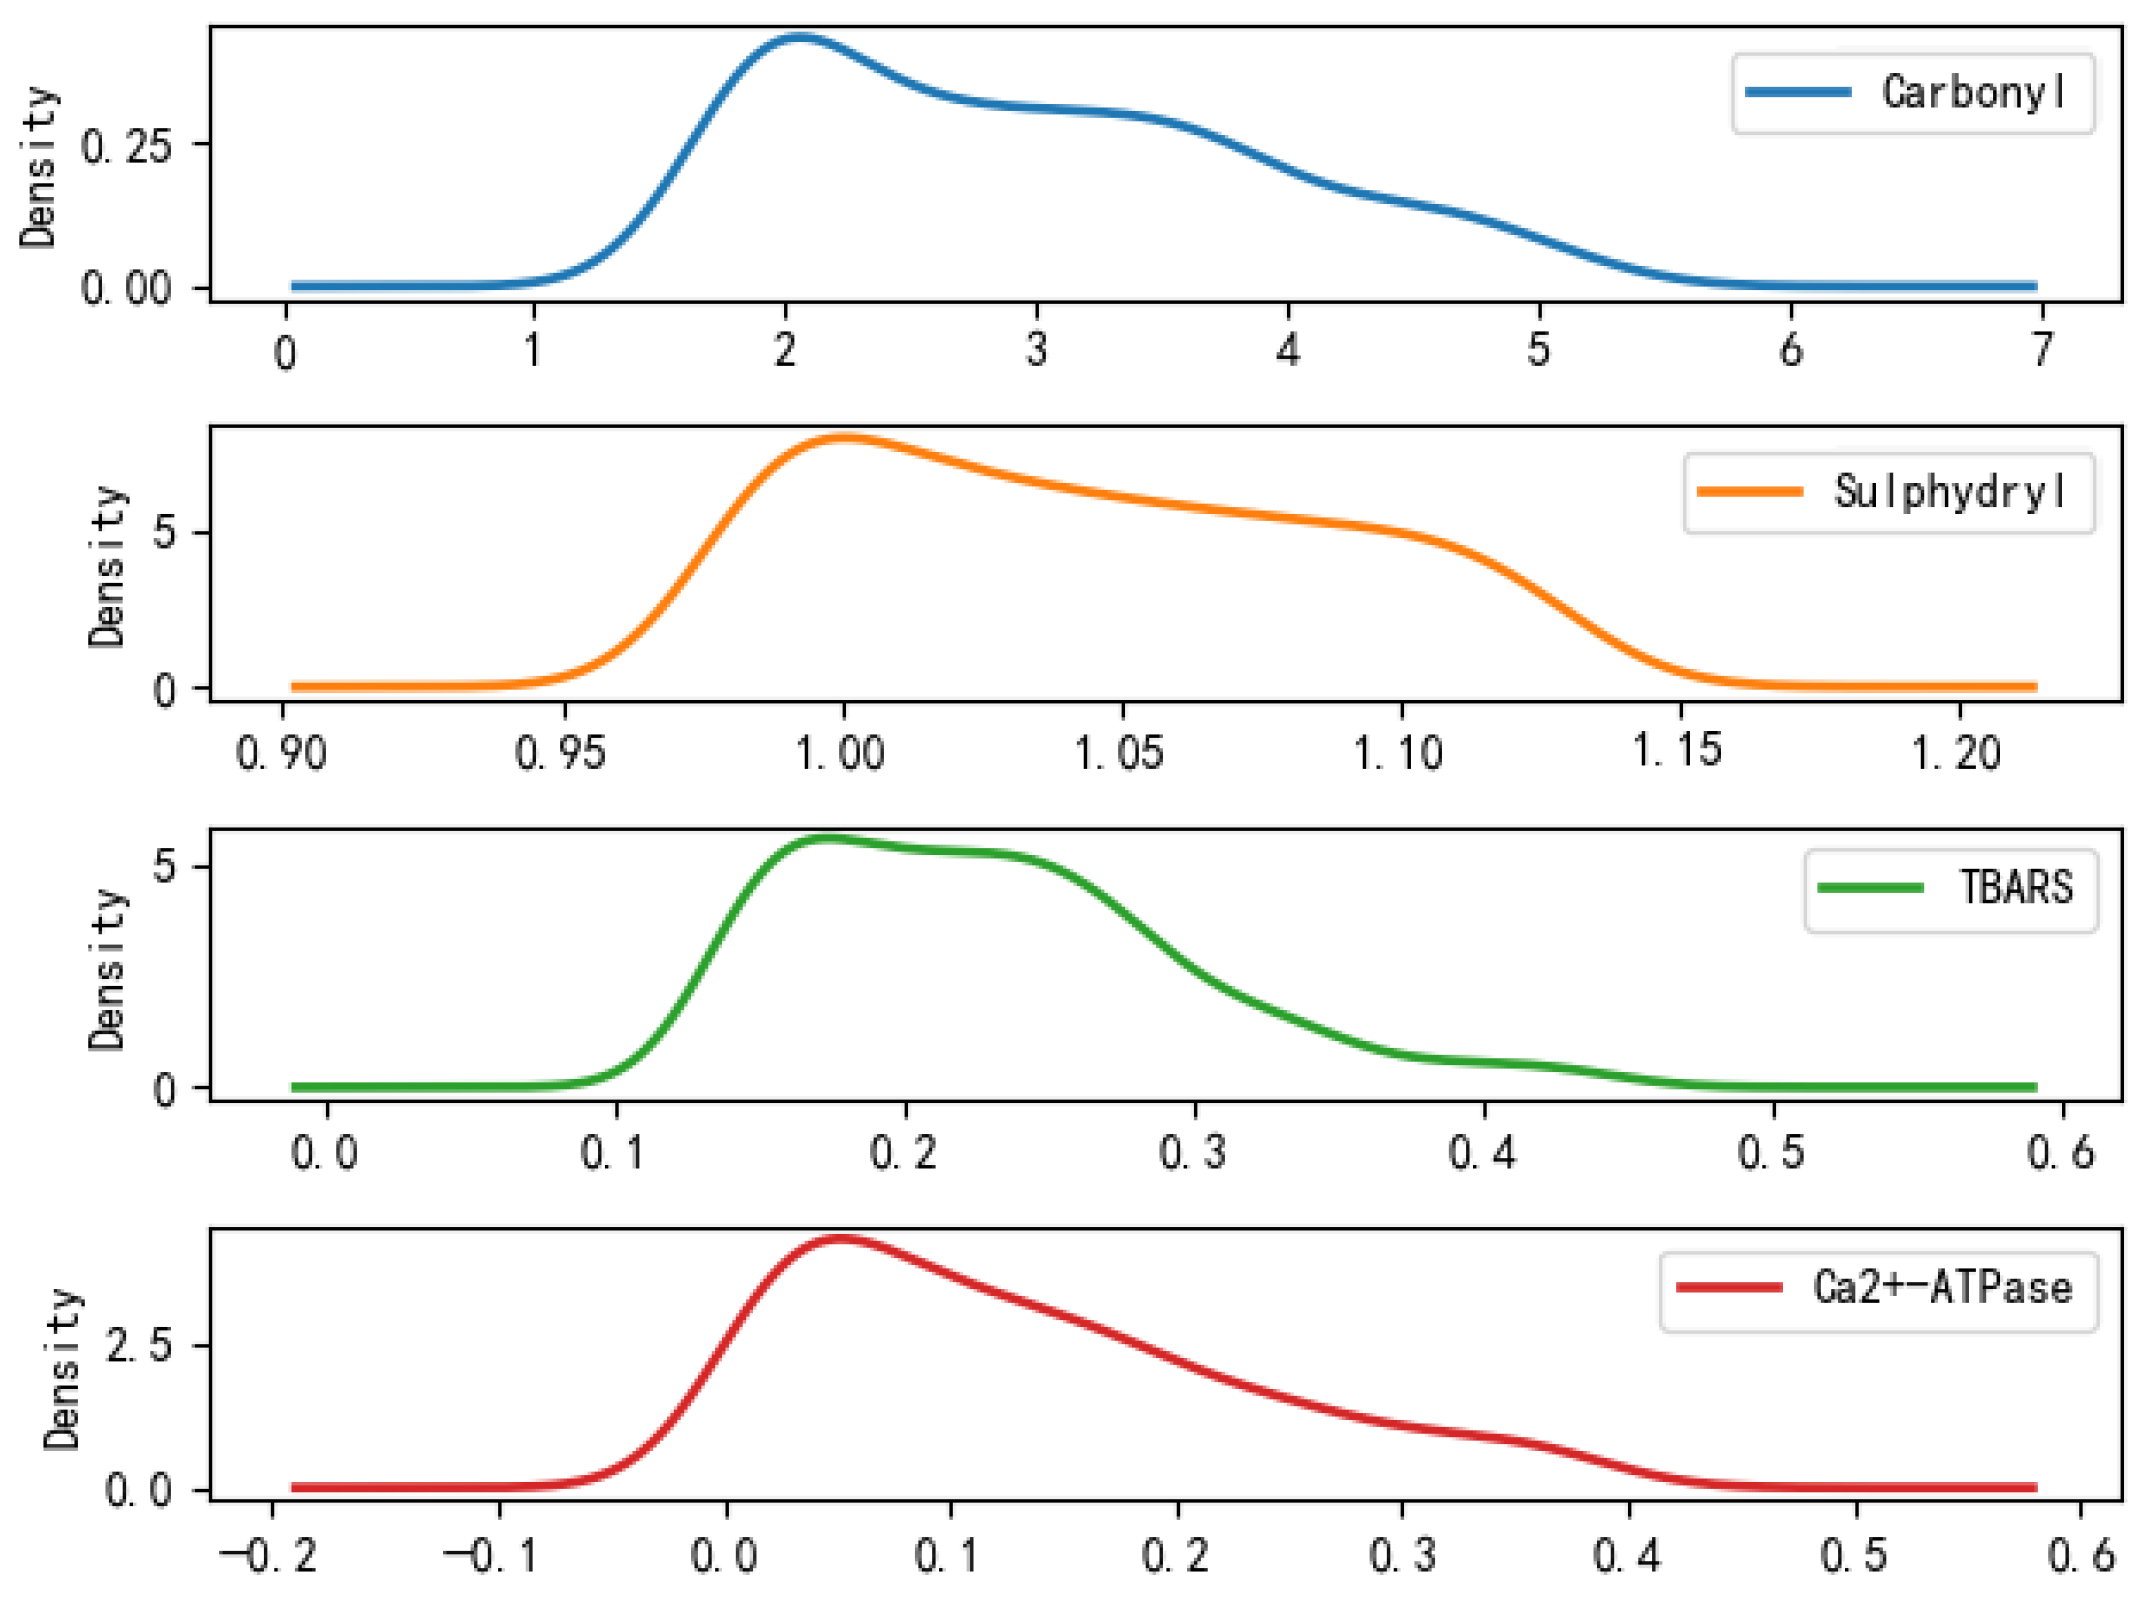
Figure 9 shows the distribution of the indicators of high-quality clusters, in which the carbonyl contents are concentrated around 2.1 and mainly distributed between 1.5 and 4.5; the sulfhydryl contents are concentrated around 1.0 and mainly distributed between 0.97 and 1.12; the TBARS values are concentrated around 0.18 and distributed between 0.13 and 0.3; and the Ca2+-ATPase values are concentrated around 0.05 and mainly distributed between 0.02 and 0.2.
(2)
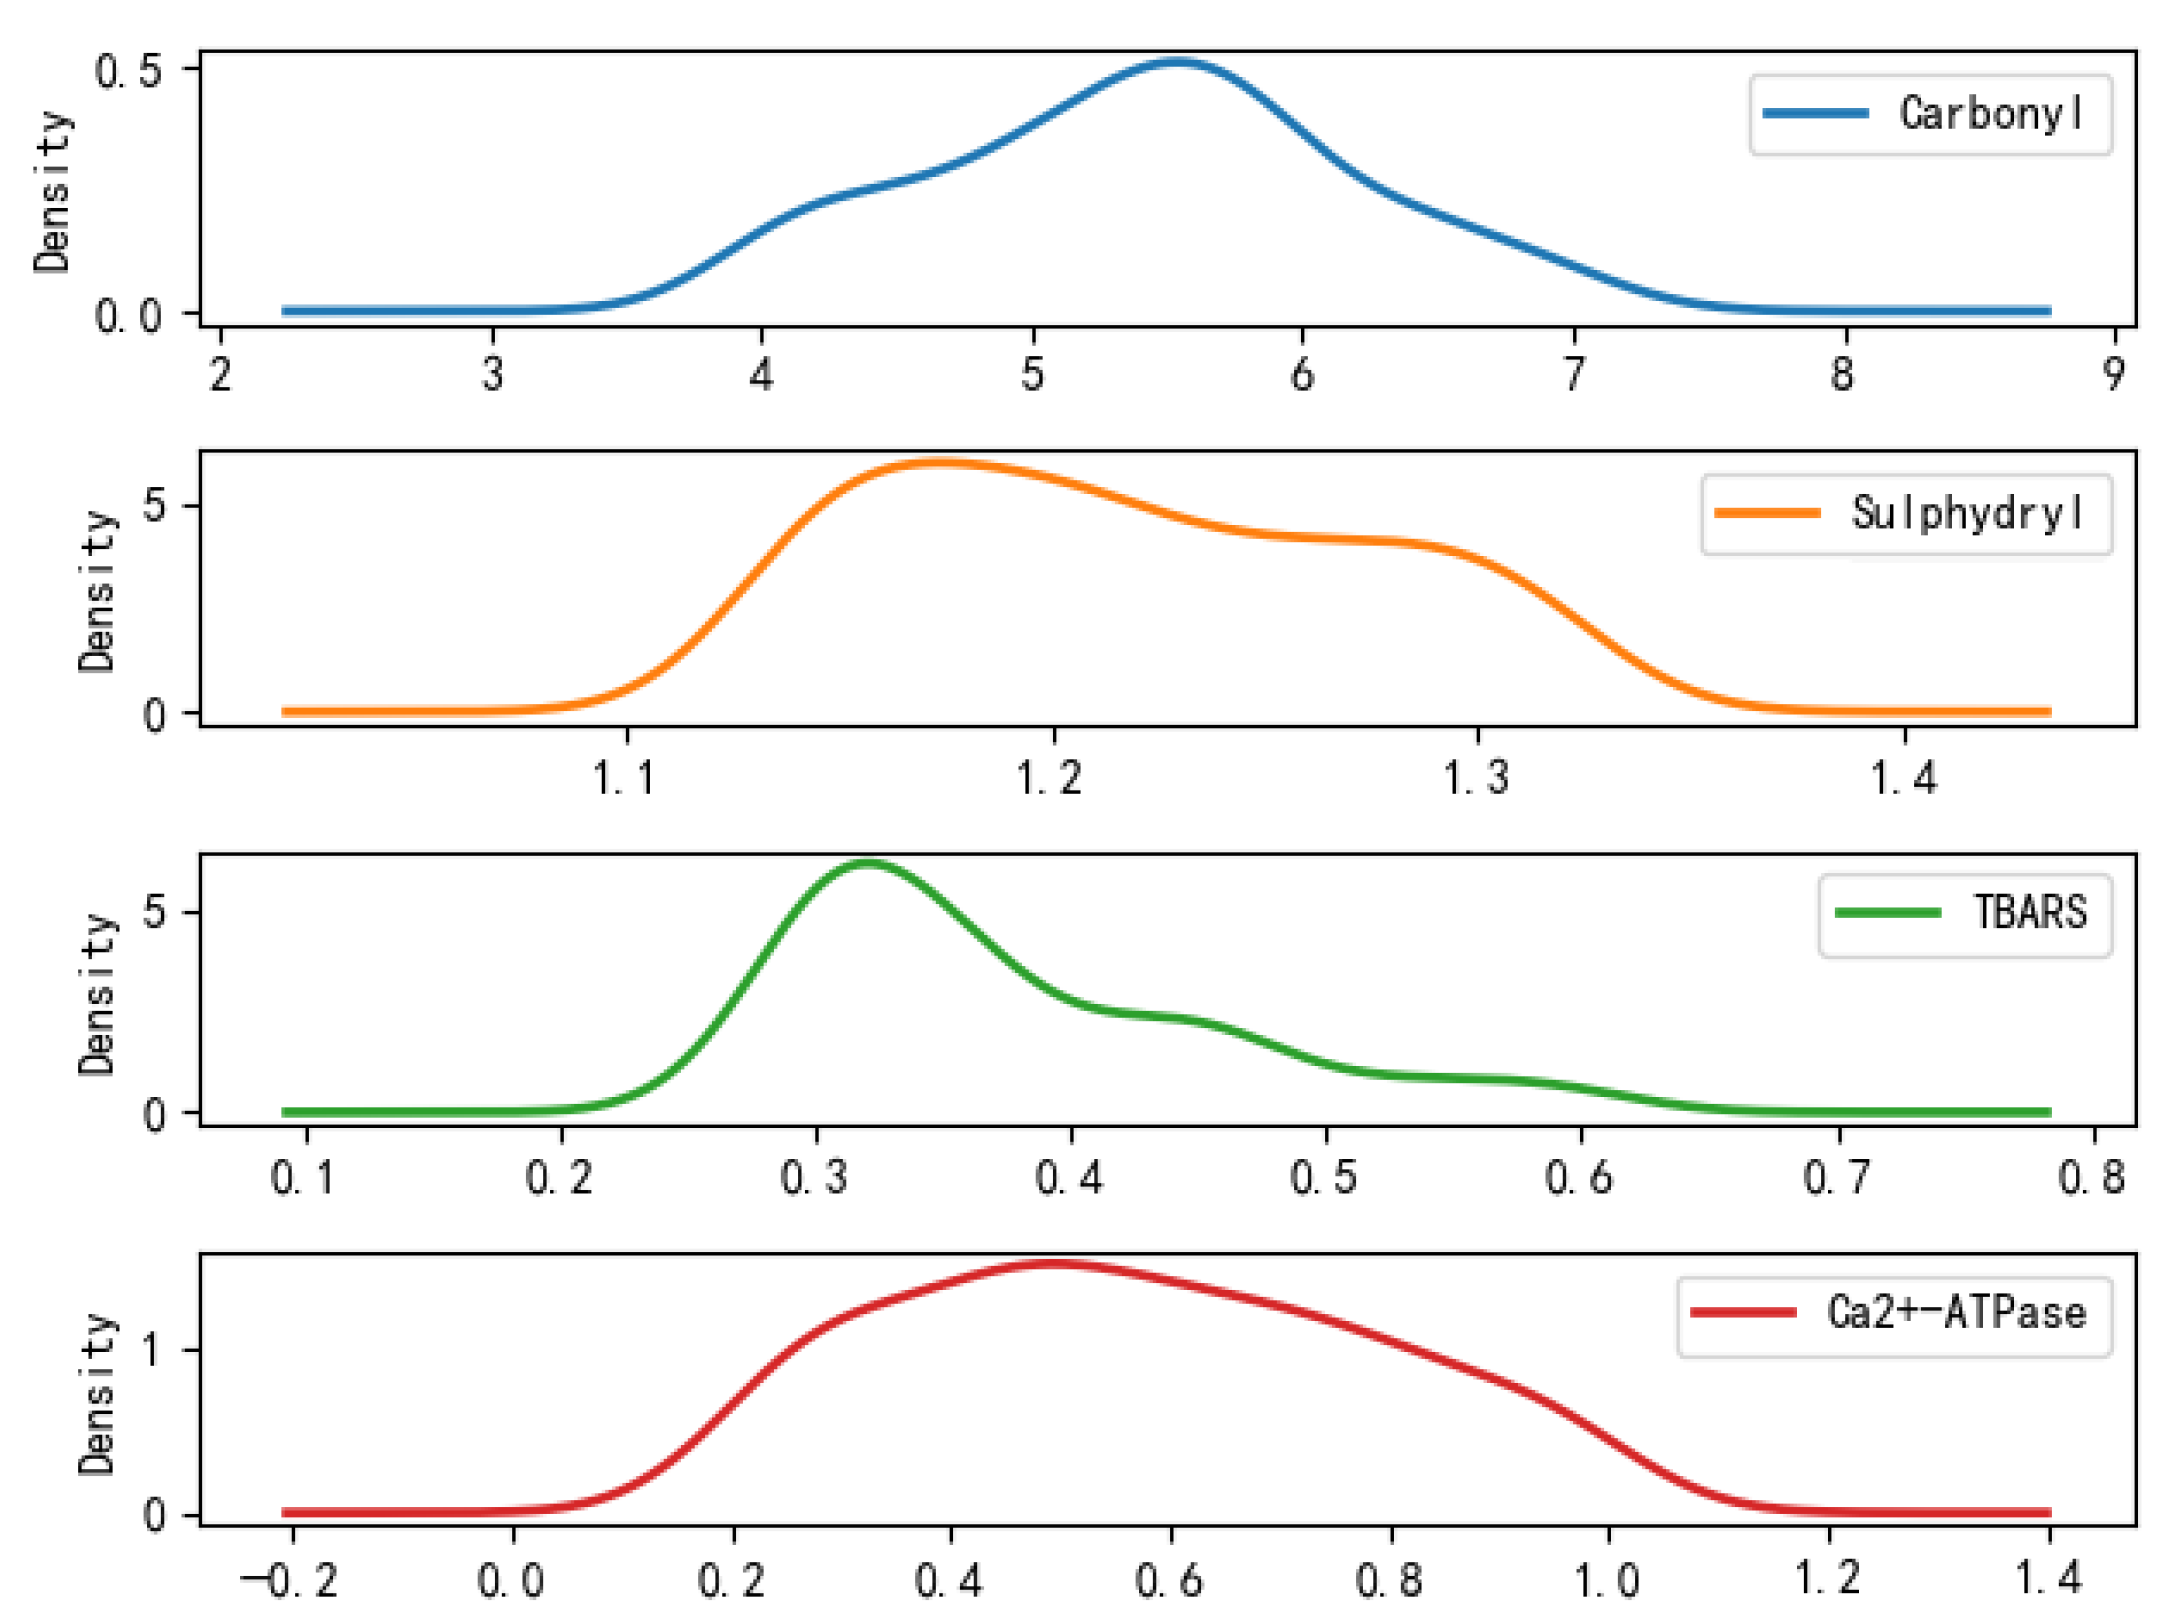
Figure 10 shows the probability densities of the indicators in the medium-quality clusters, in which the carbonyl contents are concentrated around 5.5 and mainly distributed between 4.5 and 6.5; the sulfhydryl contents are concentrated around 1.18 and mainly distributed between 1.13 and 1.3; the TBARS values are concentrated around 0.33 and distributed between 0.3 and 0.4; and the Ca2+-ATPase values are concentrated around 0.47 around and mainly distributed between 0.3 and 0.9.
(3)
Figure 11 shows the probability densities of each indicator of the low-quality clustering, in which the carbonyl contents are concentrated around 7.5 and mainly distributed between 7 and 10; the sulfhydryl contents are concentrated around 1.36 and mainly distributed between 1.25 and 1.45; the TBARS values are concentrated around 0.77 and distributed between 0.65 and 0.82; and the Ca2+-ATPase values are concentrated around 0.45 around and mainly distributed between 0.3 and 1.0.
(4)
Figure 9, Figure 10 and Figure 11 reflect the quality clustering of hairtail fish in Zhoushan in turn. It can be seen that the sample center values of carbonyl, sulfhydryl, TBARS, and Ca2+-ATPase are increasing with the quality from high to low, and the fish quality is decreasing with the increase of each index value, which is consistent with the changing trend of each index with time after data pretreatment. In addition, according to Table 1, it can be found that there are many high-quality sample points and few low-quality sample points, but the sample data are widely distributed, and the low-quality hairtail fish is harmful to the human body and unfit for consumption, so it is necessary to classify and predict its quality, so as to carry out key supervision.
(5)
With the increase in storage time, the quality of hairtail meat is declining, so we predict the quality index according to the time and then put forward the quality grade prediction, as described in Section 3.3.

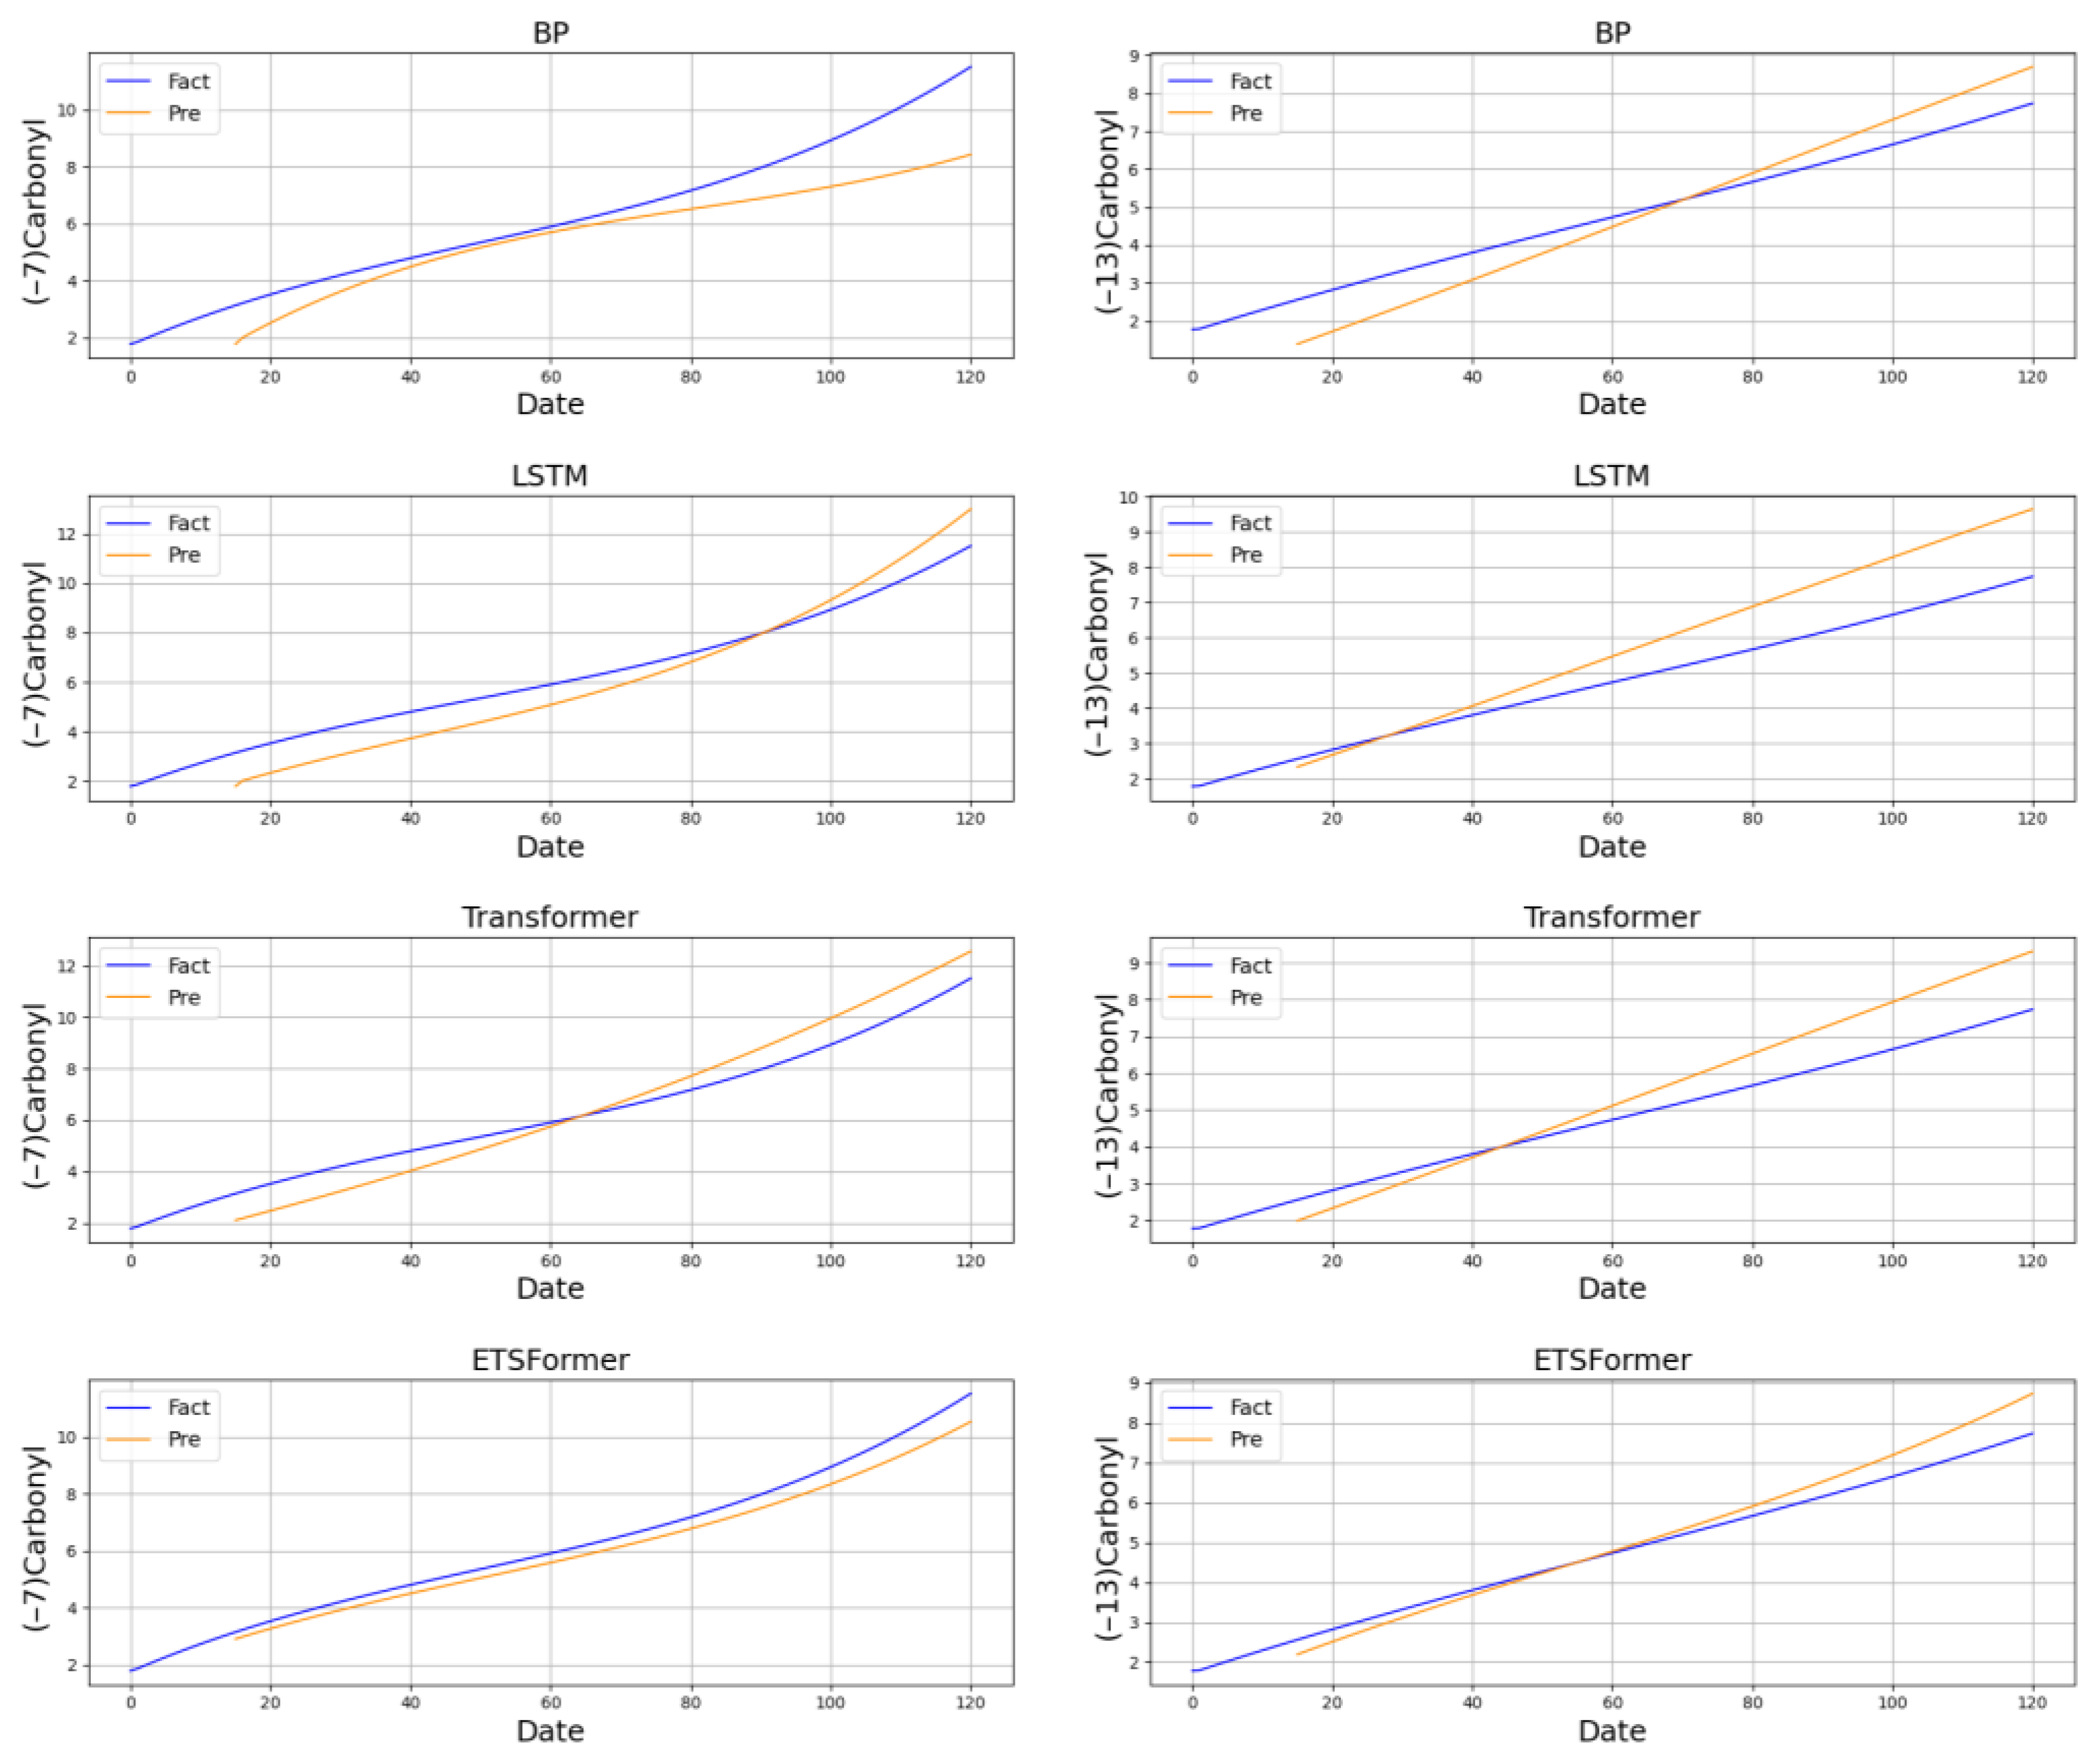
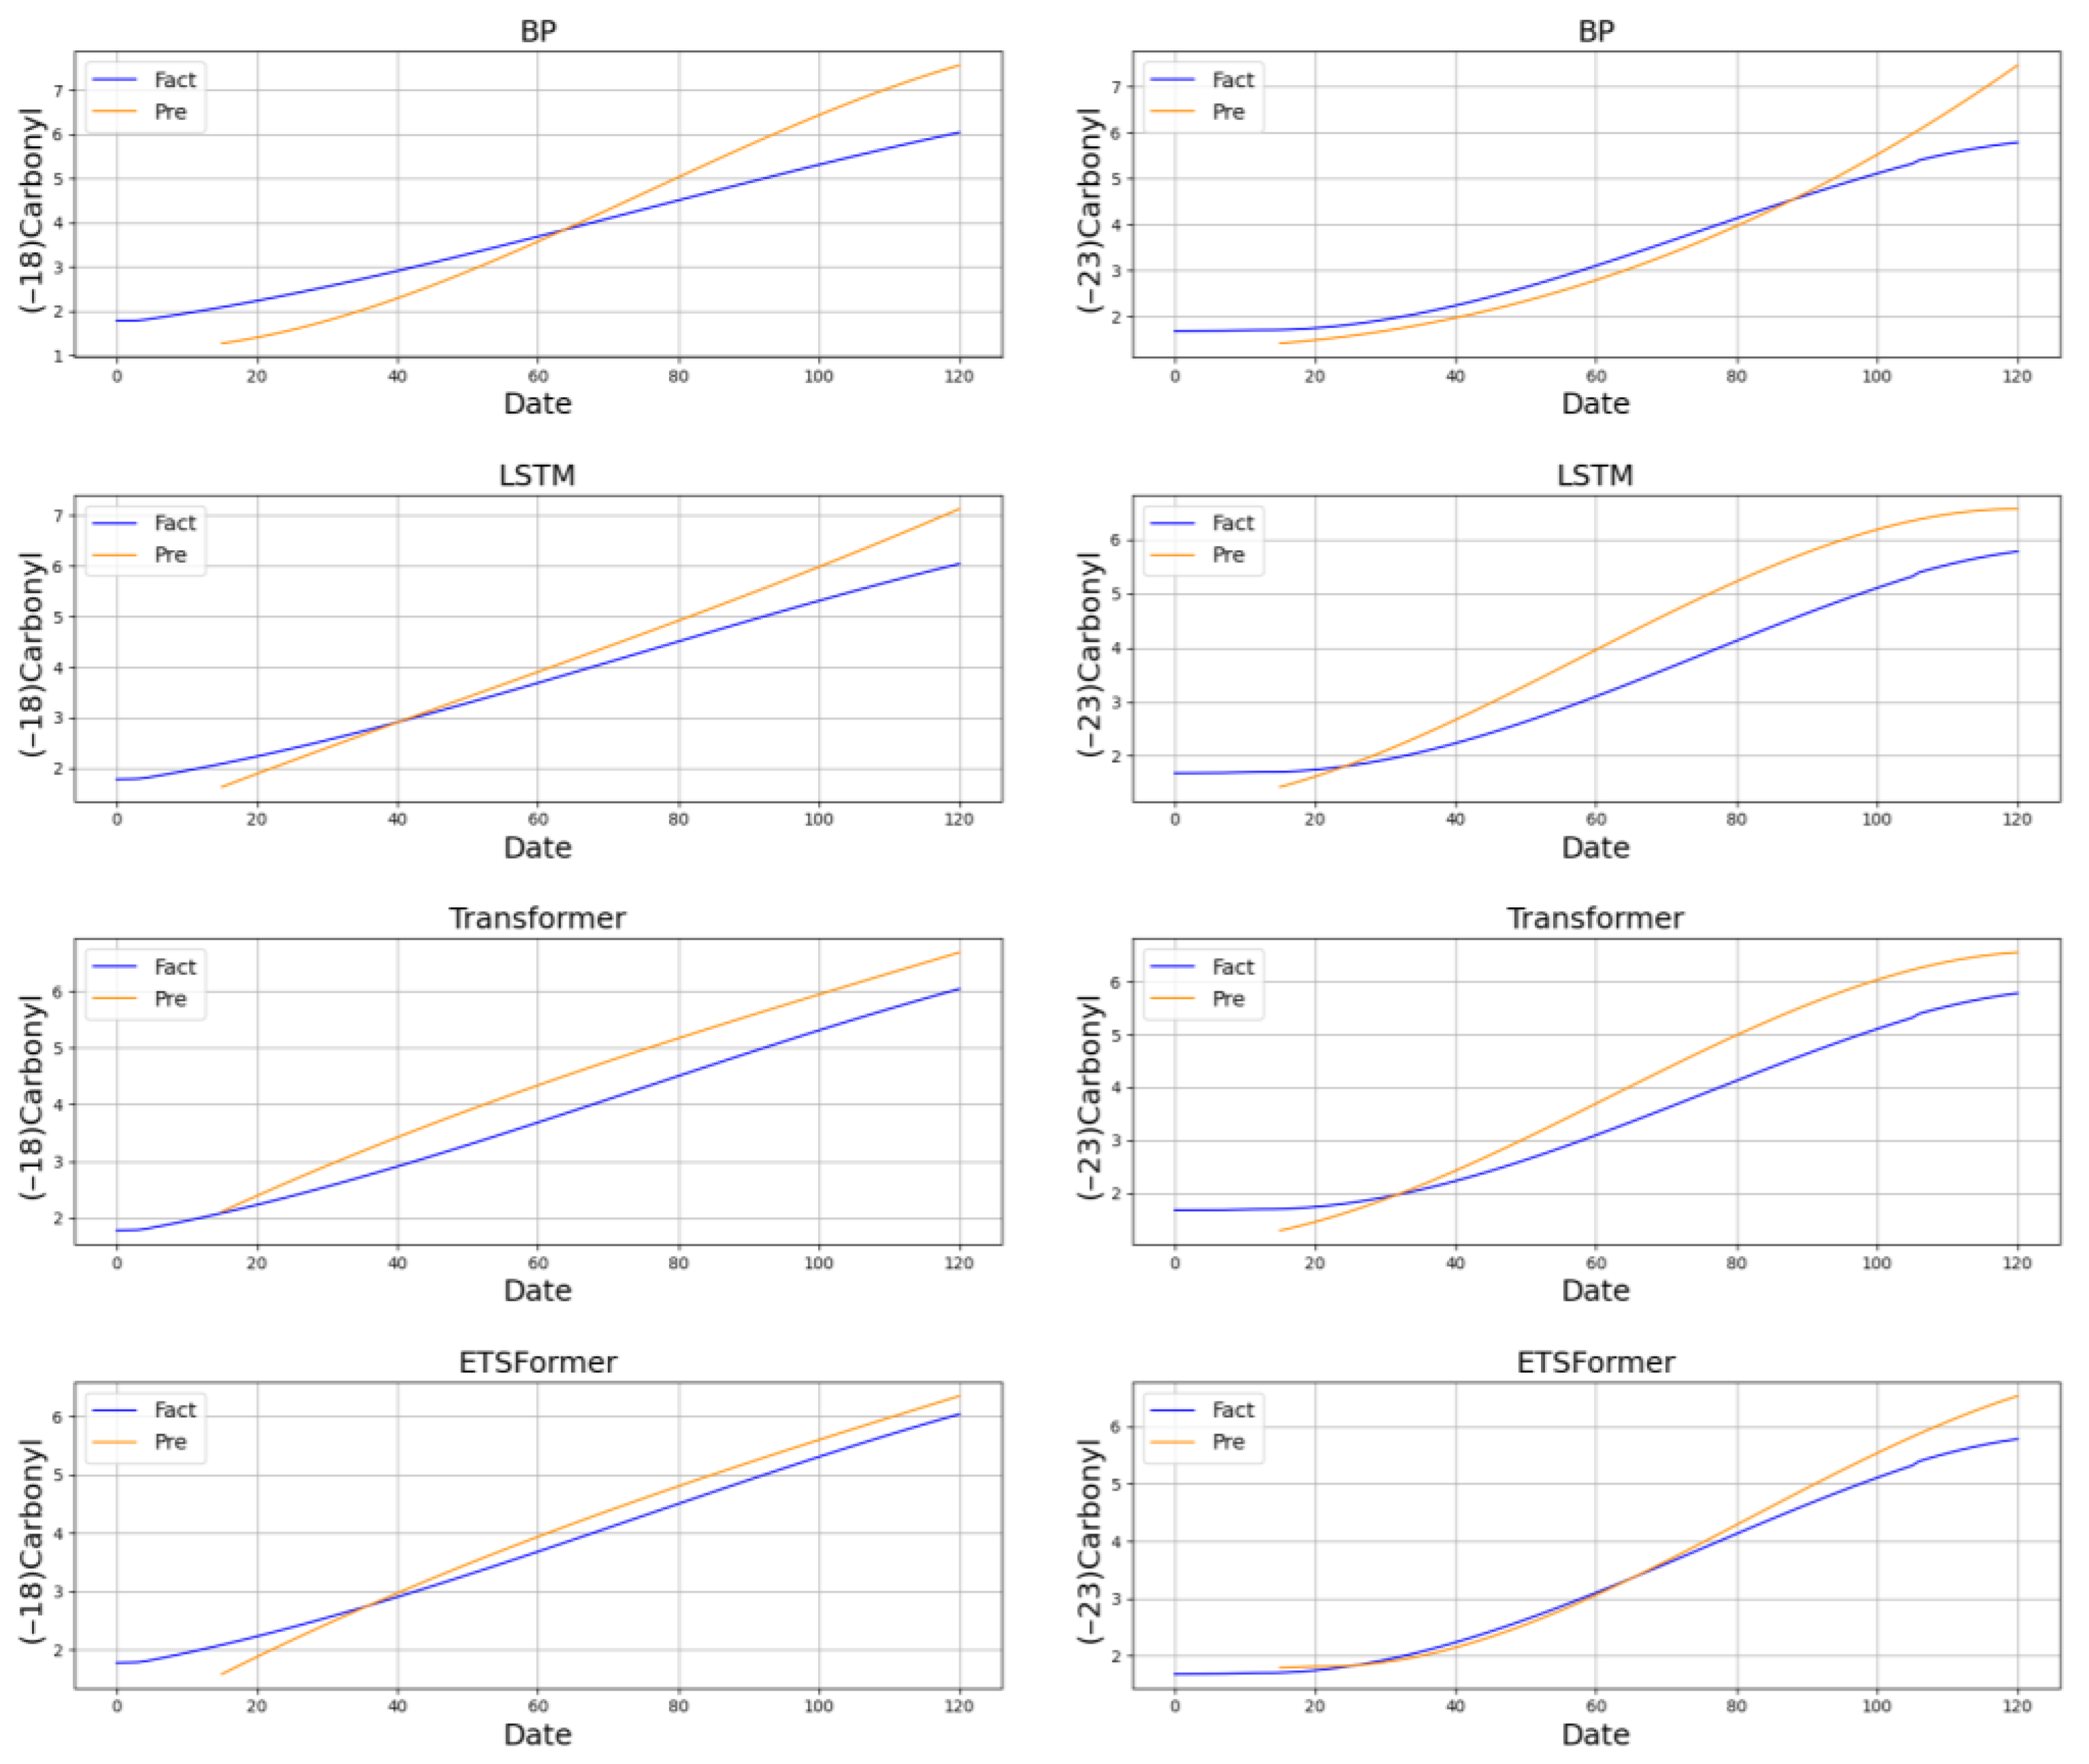
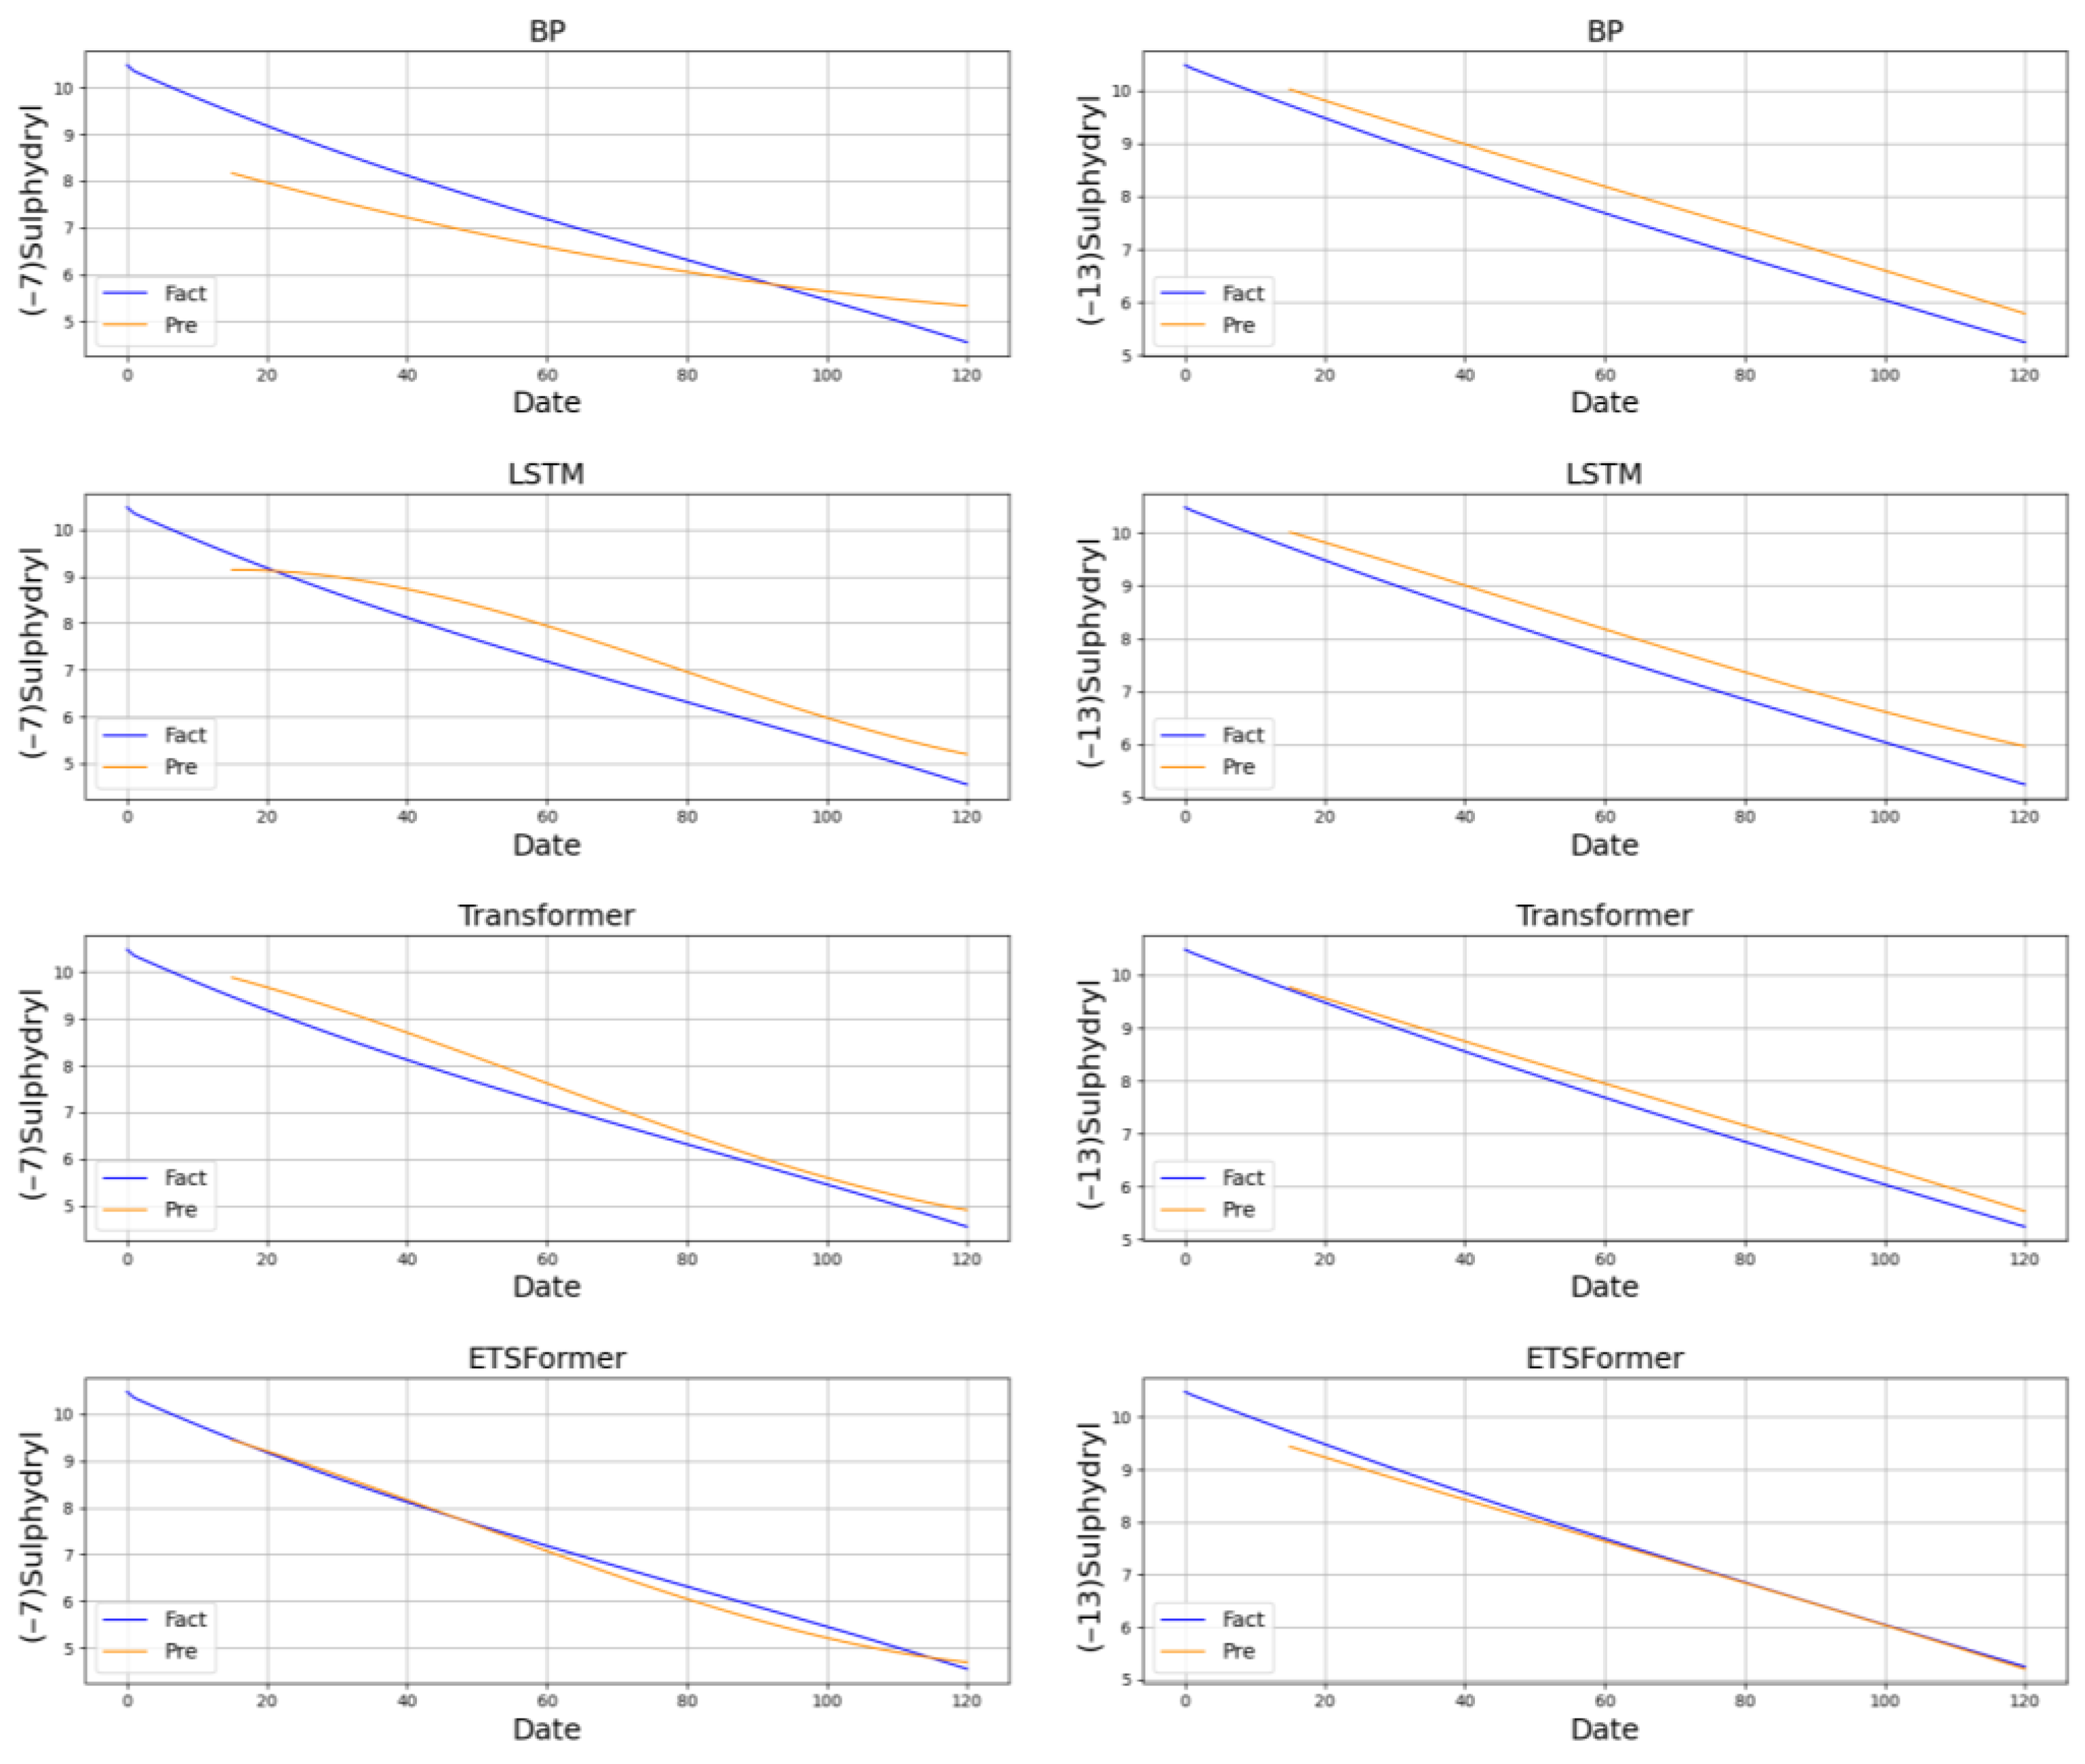
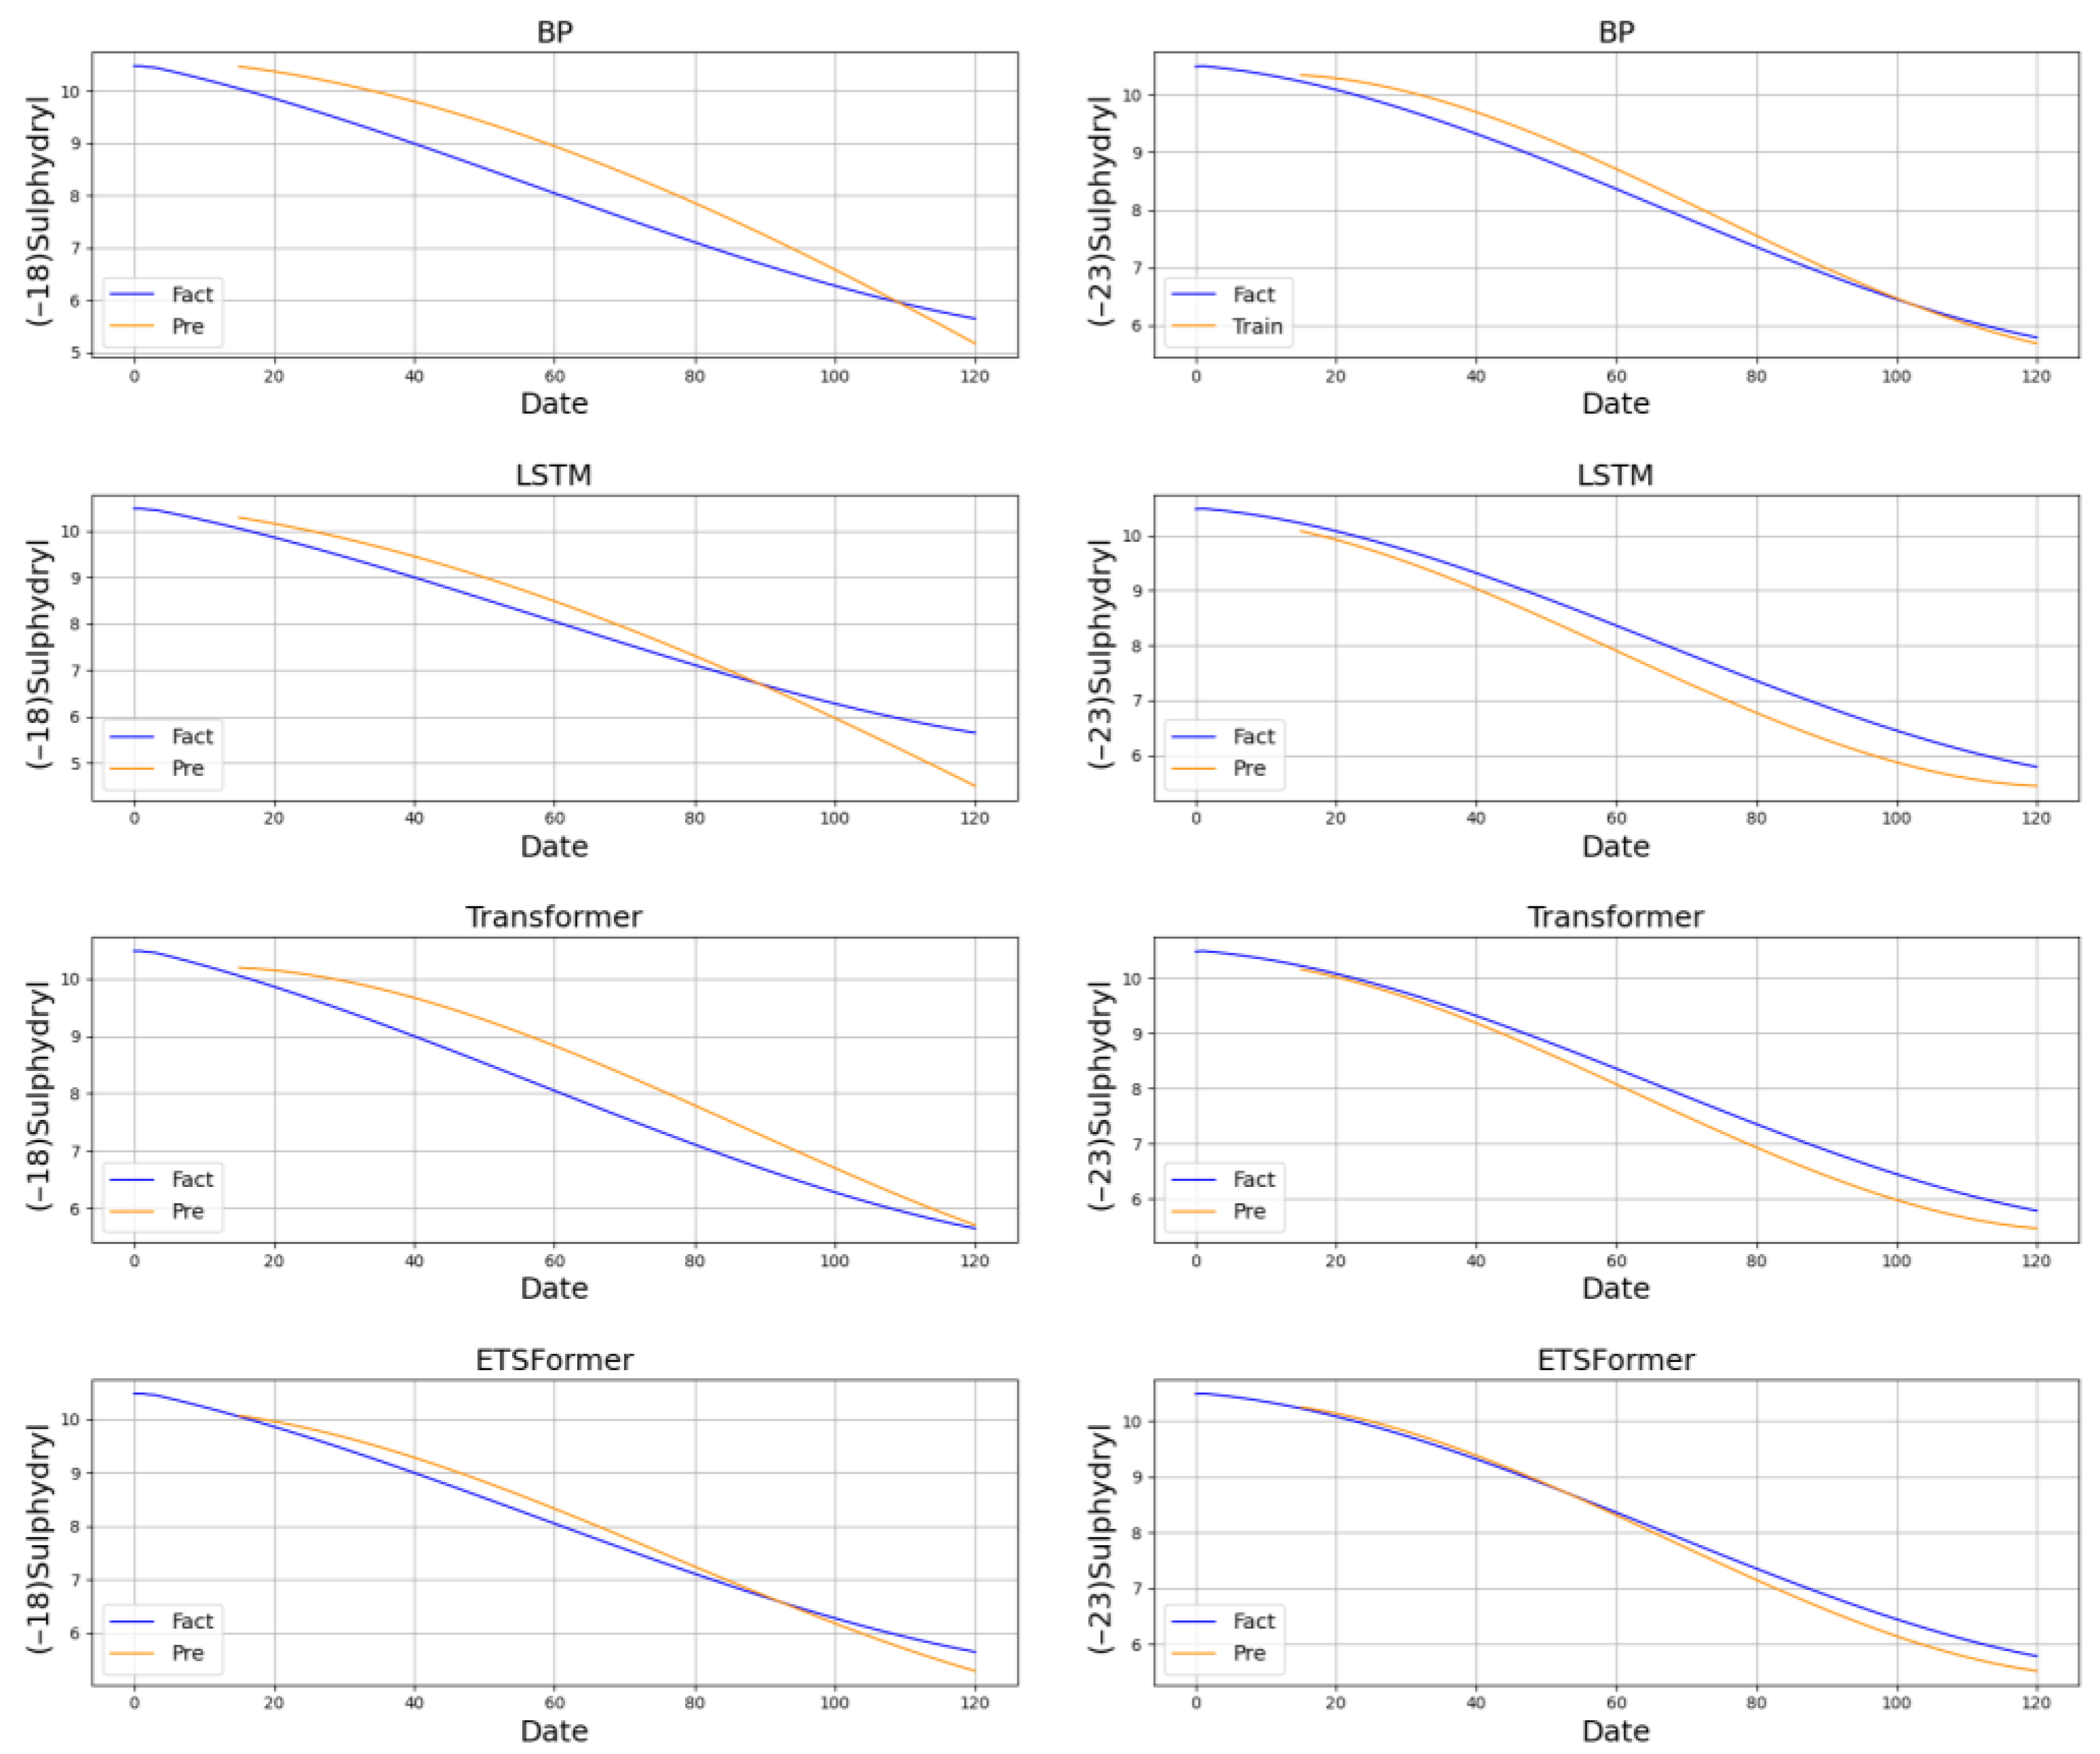
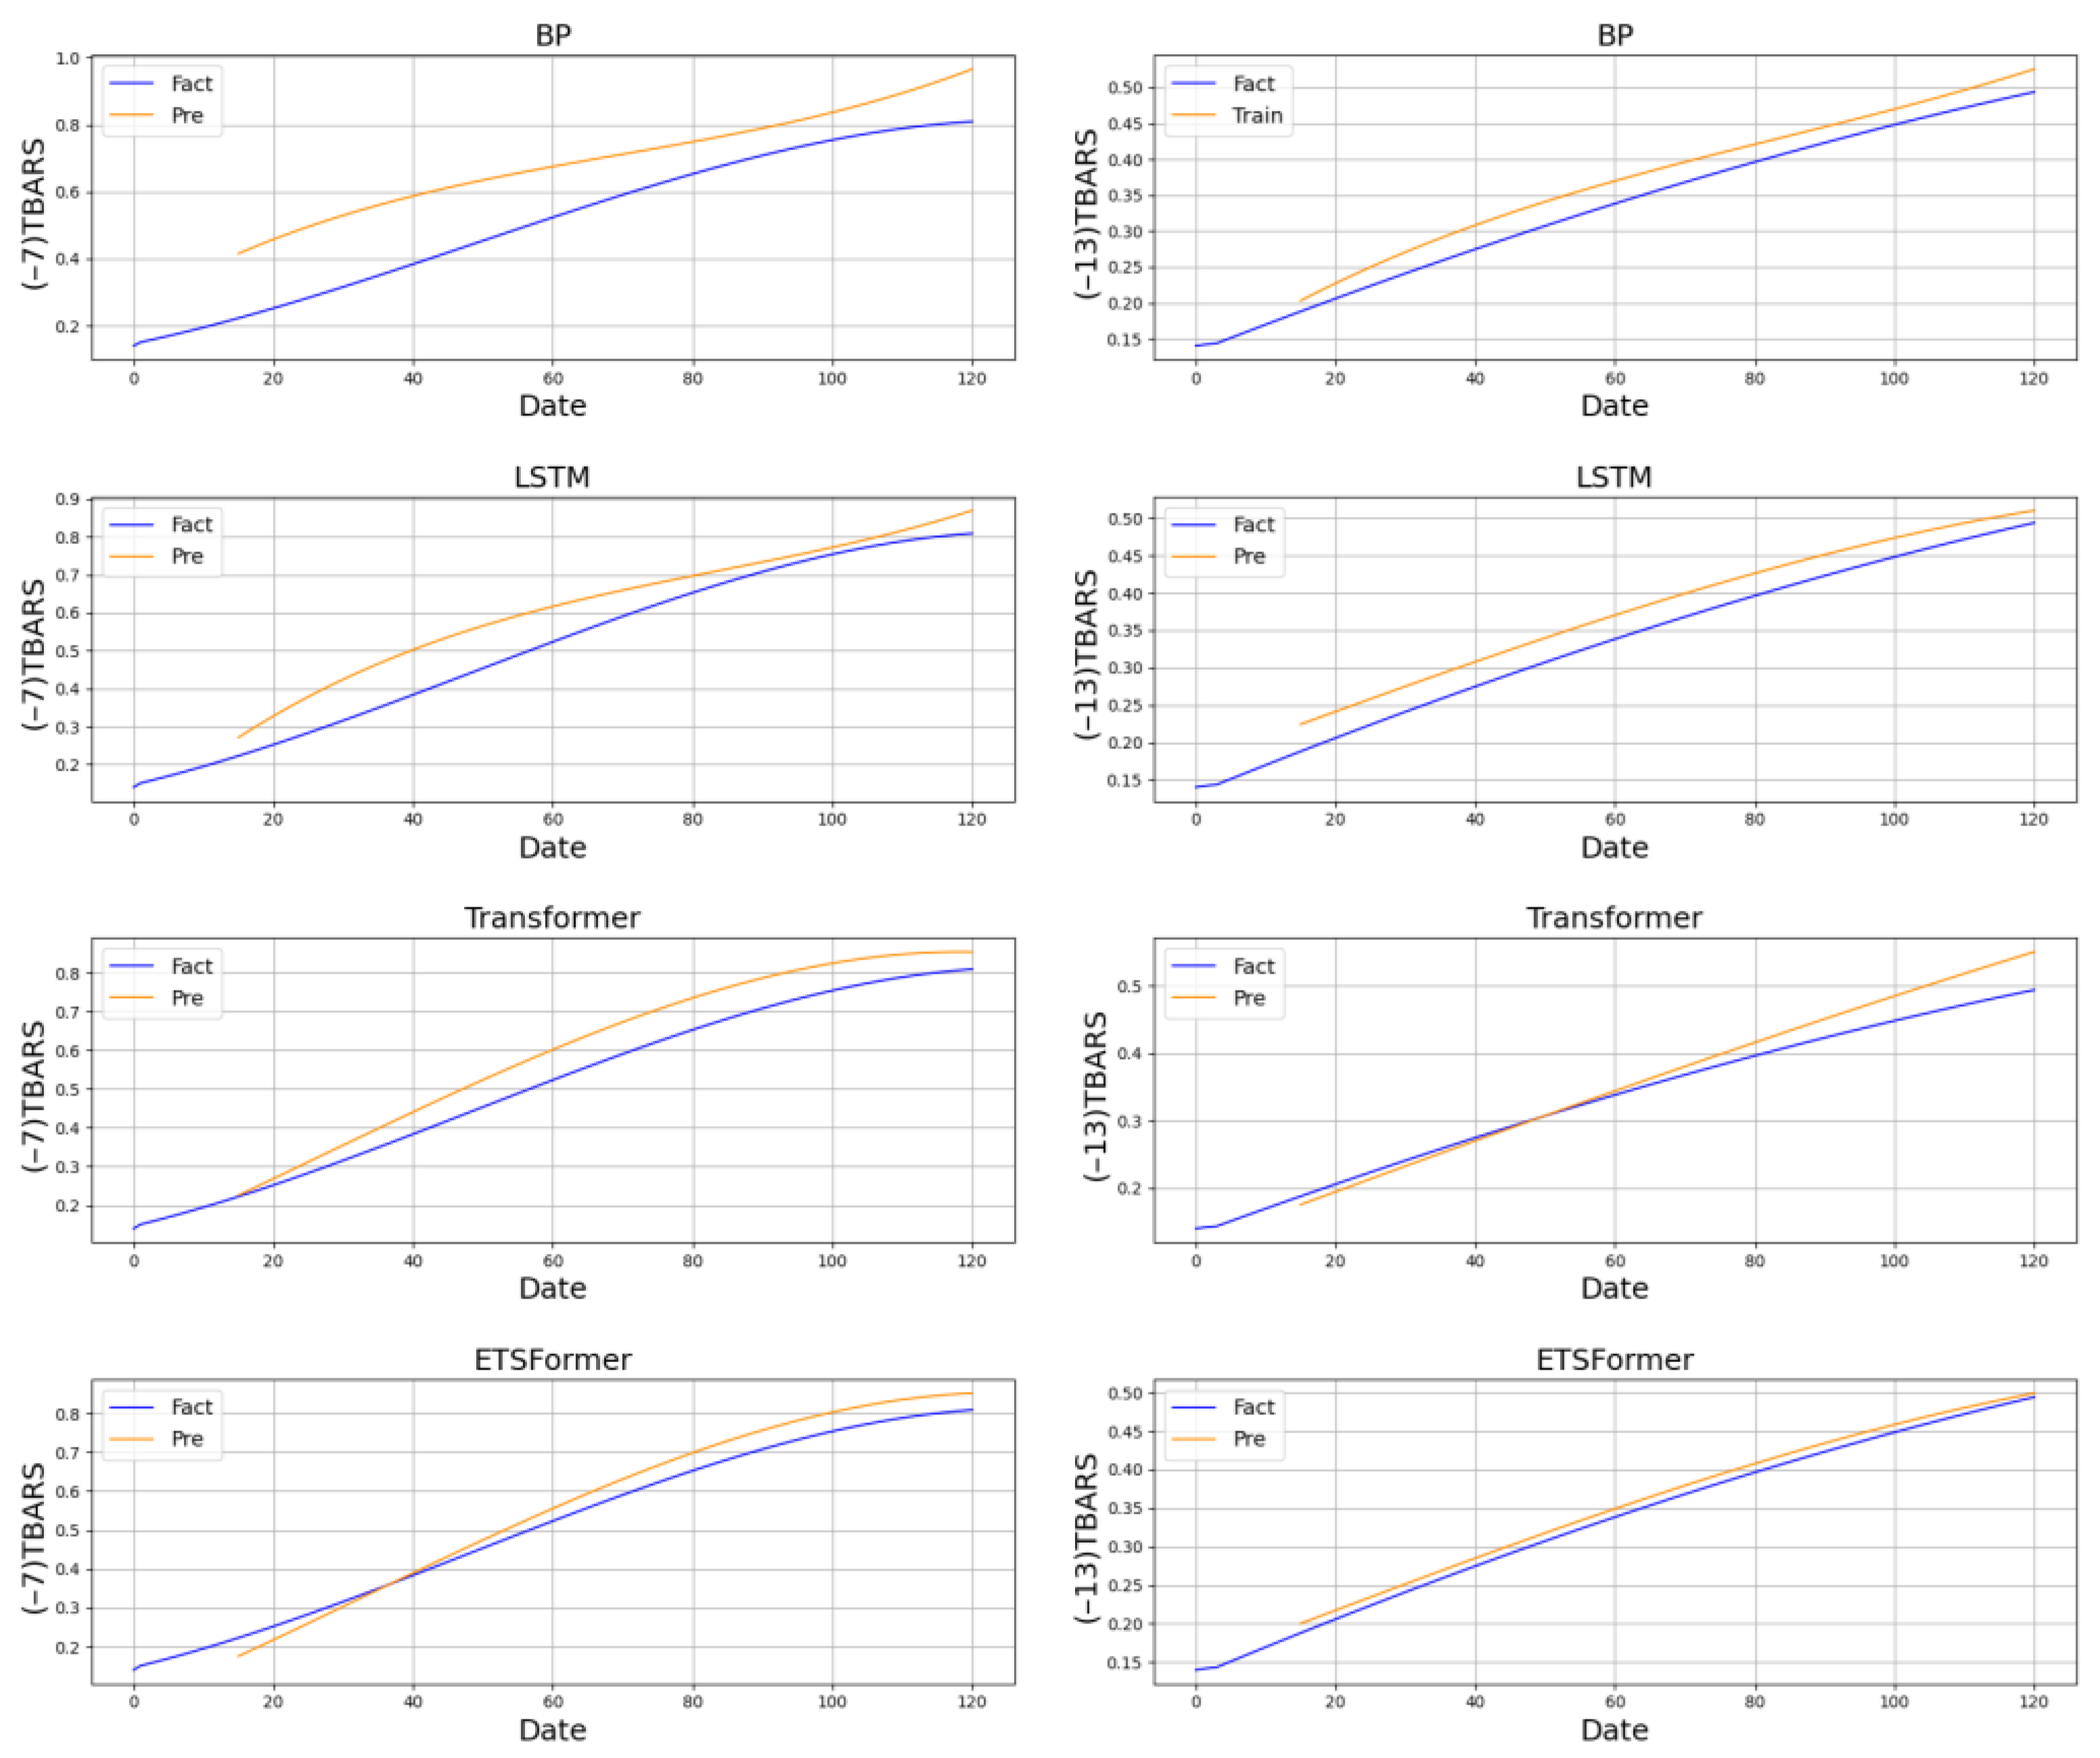
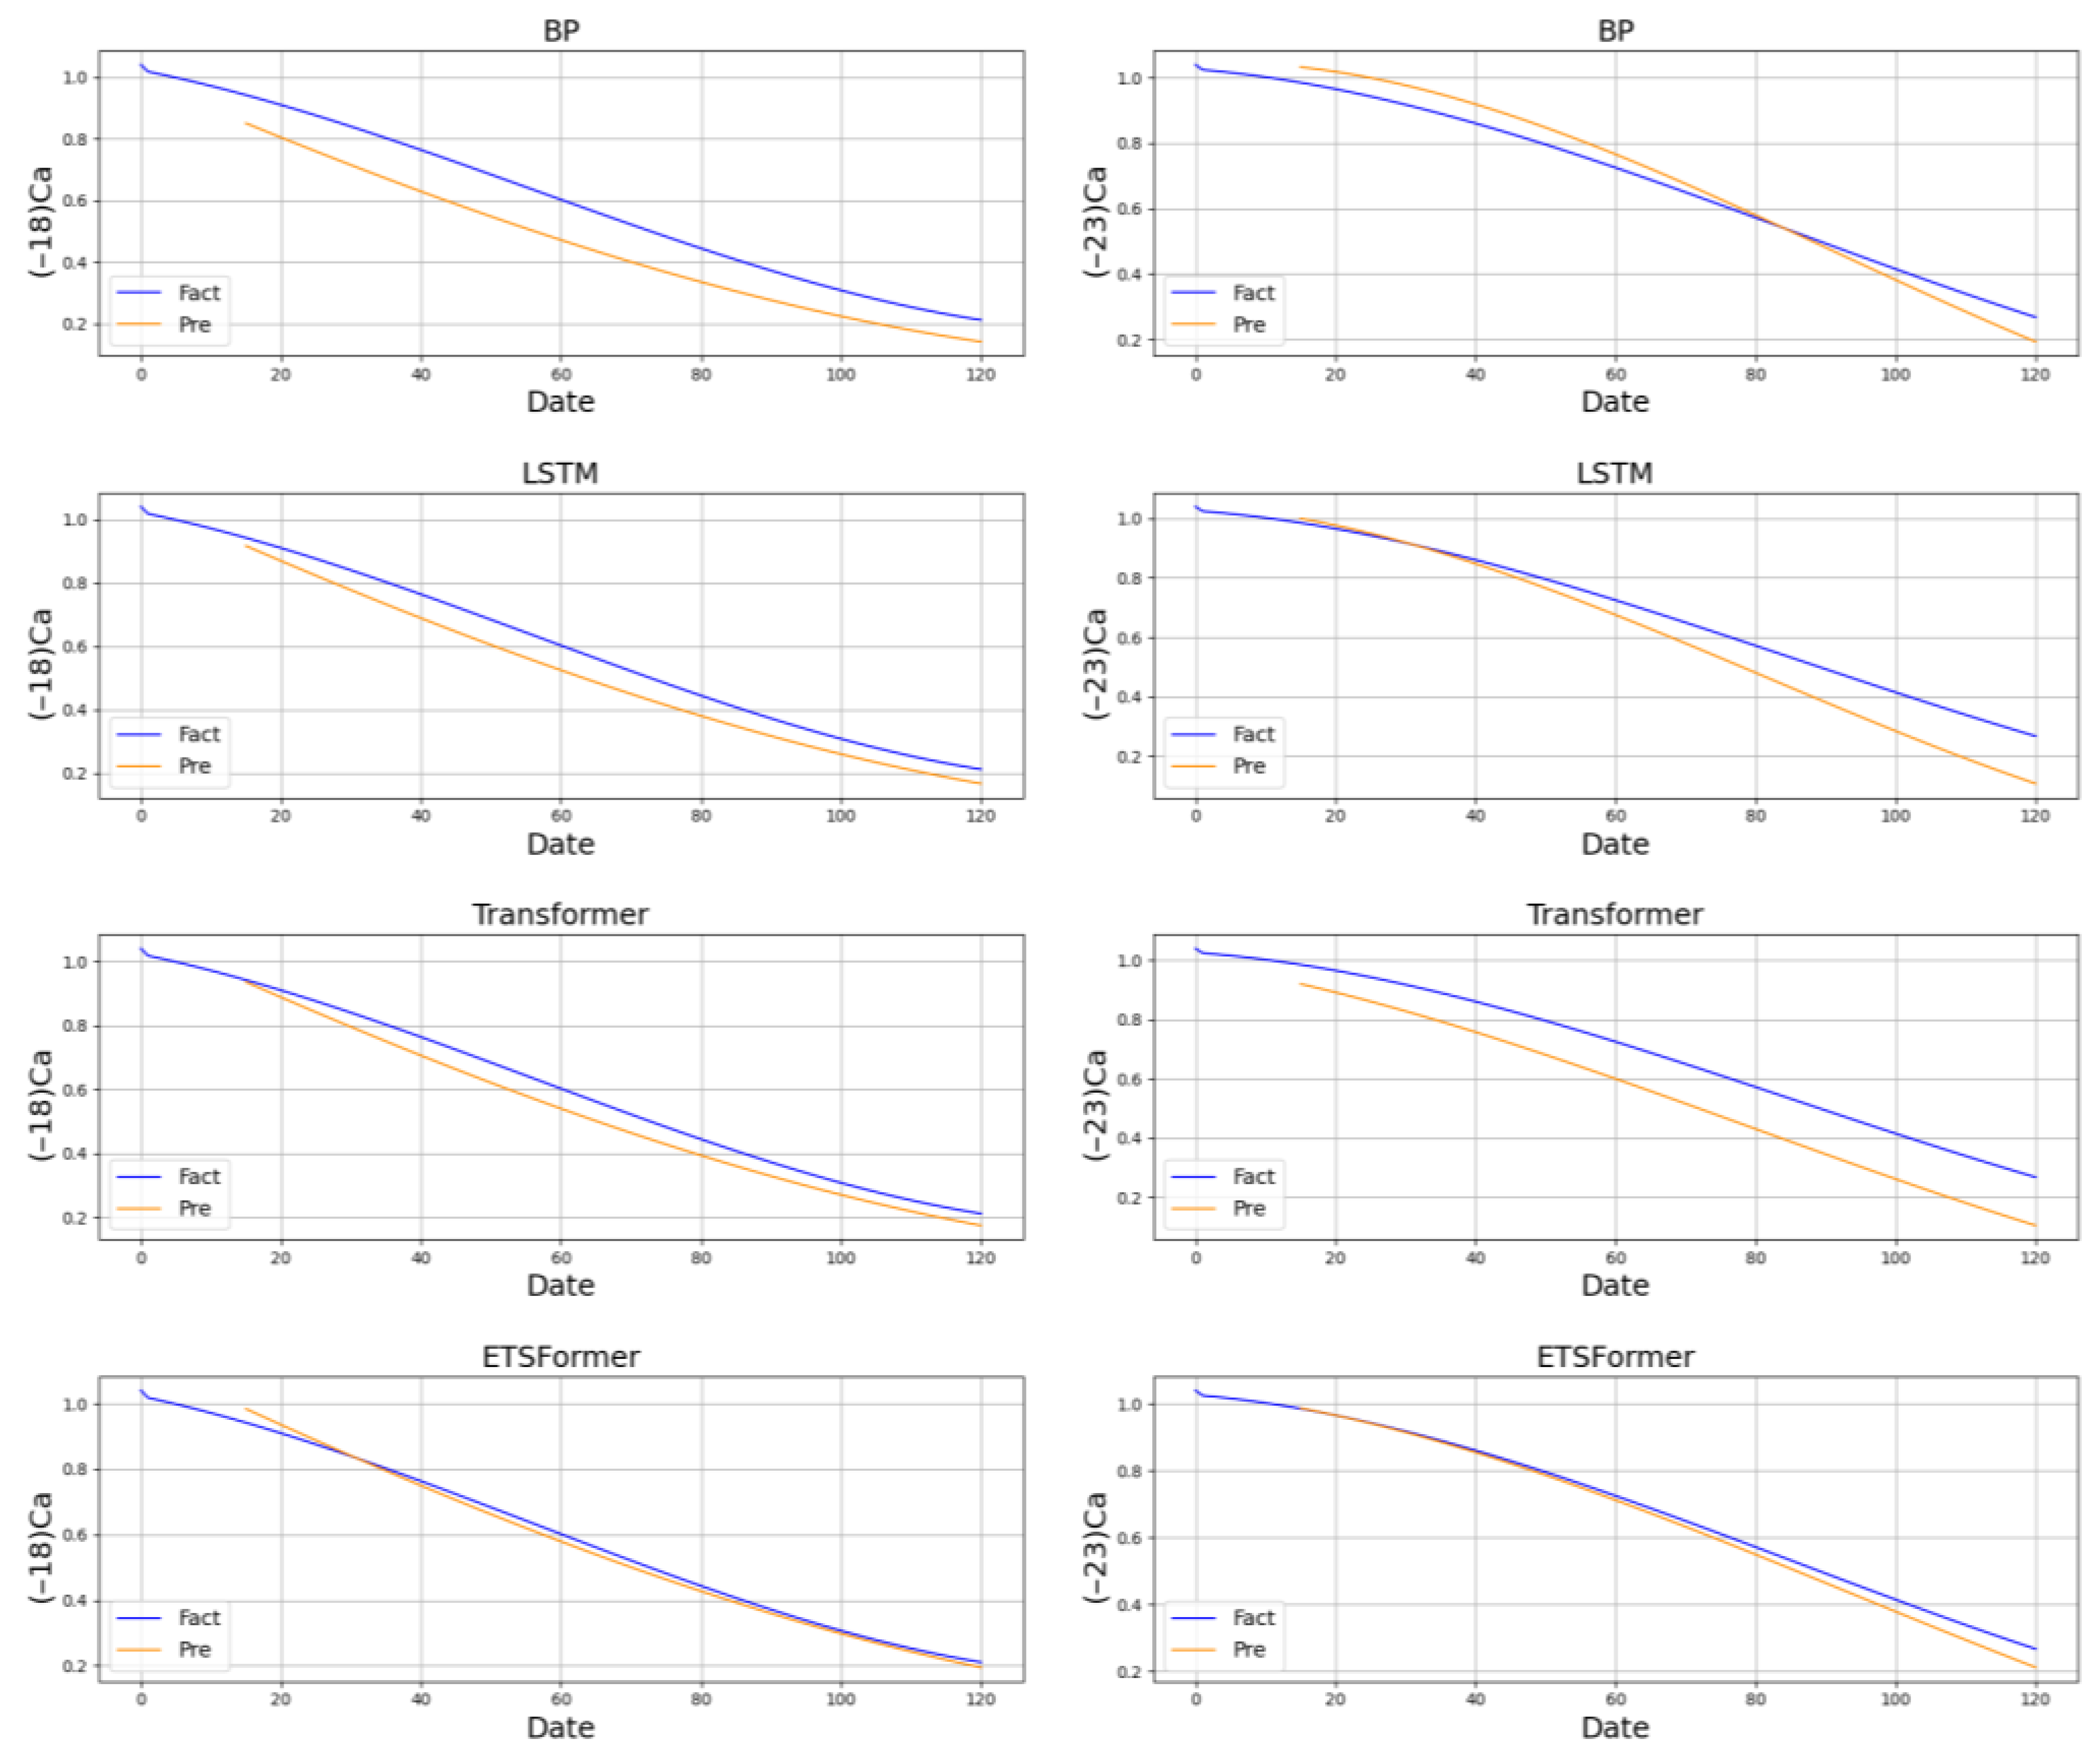
3.3. Frozen Hairtail Quality Forecast in Zhoushan

This study firstly predicts the quality indicators of Zhoushan hairtails during storage. Time and temperature are regarded as environmental factors affecting the muscle quality of Zhoushan hairtails. We use data from the past 15 days to predict the indicators on day 16 and further predict the changes in the muscle indicators of Zhoushan hairtail in the subsequent days, resulting in a prediction plot for days 16–120. In order to verify the predictive validity of the ETSFormer model on the indicators of Zhoushan hairtail, BP, LSTM, and Transformer neural network models are used as the control group to compare with the ETSFormer model in this study. Appendix A Figure A1, Figure A2, Figure A3, Figure A4, Figure A5, Figure A6, Figure A7 and Figure A8 show the prediction results of carbonyl contents, sulfhydryl contents, TBARS values, and Ca2+-ATPase activity indicators based on the four neural network prediction models for four temperature conditions, namely −7 °C, −13 °C, −18 °C, and −23 °C, respectively. The blue solid line in the figure indicates the trend of the actual data used for model training, and the orange solid line indicates the trend of the predicted data.
We calculate the evaluation metrics of prediction effectiveness, including mean absolute error (MAE), mean square error (MSE), and mean absolute percentage error (MAPE) [34] for the four neural network models, and the results are shown in Table 2, Table 3 and Table 4. As can be seen from the tables, the ETSFormer model performs best in predicting the TBARS indicators at −13 °C, with its MAE, MSE, and MAPE reaching 0.01, 0.00012, and 3.151, respectively. During the experimental process, the maximum values of the ETSFormer model’s MAE, MSE, and MAPE are 0.439, 0.229, and 9.869, which are much lower than the other models. The experimental results show that the ETSFormer prediction model performs the best in predicting all the quality indexes of Zhoushan hairtail muscle under different environments, and its accuracy exceeds that of other prediction models. This verifies that the ETSFormer-based quality indicator prediction model proposed in this study can effectively predict the quality indicators of Zhoushan hairtail muscle. In addition, it can be observed from the experimental plots that the quality of Zhoushan hairtail is retained for the longest period of time, which could reach more than 90 days under the freezing and preservation condition of −23 °C, but after more than 90 days, the indicators of Zhoushan hairtail deteriorated dramatically, and it might lose the original aroma and taste and might show signs of off-flavor or deterioration. Therefore, it is very important to properly control the storage time of Zhoushan hairtails to ensure the quality and safety of food.
Based on the prediction of quality evaluation indicators of Zhoushan hairtail, this study has predicted the actual quality of Zhoushan hairtail and compared it with the predicted quality. We use the indexes of precision, recall, and F1 value as the evaluation indexes of quality model prediction, and the experimental results are shown in Table 5. As can be seen from the table, compared with the traditional BP, LSTM, and Transformer models, the ETSFormer model performs well in the quality prediction task of Zhoushan hairtail, achieving the highest scores in terms of precision, recall, and F1 value. In particular, in the prediction of low-quality samples with the least number of samples, the ETSFormer model achieves 90.16%, 94.83%, and 92.44% in precision, recall, and F1 value, respectively, which improve by 2.02–9.51%, 5.17–8.62%, and 3.55–9.11%, respectively, relative to the other models.

4. Conclusions

Zhoushan hairtail, as one of the important seafood products in China, has a wide demand in the Chinese market and is gradually attracting international consumers thanks to its rich nutritional value and delicious taste. In recent years, due to the increasing popularity of hairtails, the assessment and prediction of the muscle quality of hairtails during storage have become an important part of ensuring food quality and safety needs. At the same time, it also provides a reference for regulatory agencies and marketers to regulate and control the quality of hairtails. Therefore, in this study, we have developed a quality prediction model for frozen Zhoushan hairtail in China based on the ETSFormer model to predict the changes in muscle quality of hairtails and to provide a scientific basis for the storage of Zhoushan hairtail. By meeting the needs of consumers and providing more high-quality hairtail, the storage loss is reduced, and the catch is indirectly reduced so as to achieve the goal of protecting the sustainable development of hairtail in Zhoushan. However, this study only considers the effects of temperature and storage time on the quality of hairtail and has not yet covered other factors such as humidity and initial microbial colony counts, while more physicochemical properties of hairtail muscle need to be included for quality assessment.
Besides, studies of hairtail quality have involved a number of microbial effects. For example, deoxytrimethylamine (TMAO) is deoxidized and reduced to trimethylamine (TMA) and dimethylamine (DMA) under the action of TMAO reductase and facultative anaerobic bacteria. TMA is the reason for the fishy smell of fish, and the higher the TMA content, the heavier the fishy smell of fish. The existence of putrefying bacteria will decompose organic substances in fish, produce malodorous odors and harmful metabolites, and lead to the rapid deterioration of hairtail. If pathogenic bacteria such as Salmonella and Escherichia coli exist on the hairtail, it will not only lead to the deterioration of hairtail but also cause food poisoning or digestive tract infection in consumers. Mold in the air can grow on the surface of the hairtail under suitable temperature and humidity conditions. If mold appears in the process of transportation and storage of hairtail, it may cause a peculiar smell, odor, and quality degradation to the fish. Therefore, in the process of fish storage, microorganisms will also affect the quality of fish. In this study, the effects of storage time and storage temperature on the quality of hairtail were analyzed in four aspects: carbonyl content, sulfhydryl content, TBARS, and Ca2+-ATPase activity. In the next step, we will further study the effects of microorganisms on the quality of hairtail.

Author Contributions

Conceptualization, K.H. and M.Z.; methodology, W.Y.; software, T.H.; validation, T.H. and Q.Z.; formal analysis, W.Y.; investigation, W.D.; resources, Q.Z.; data curation, T.H.; writing—original draft preparation, T.H.; writing—review and editing, W.D.; visualization, T.H.; supervision, W.D.; project administration, M.Z.; funding acquisition, W.Y. All authors have read and agreed to the published version of the manuscript.

Funding

This research was funded by the National Key Technology R&D Program of China, No. 2022YFF0606803; Project of Beijing Municipal University Teacher Team Construction Support Plan, No. BPHR20220104.

Institutional Review Board Statement

Not applicable.

Informed Consent Statement

Not applicable.

Data Availability Statement

The data used to support the findings of this study are available from the corresponding author upon request.

Conflicts of Interest

The authors declare no conflict of interest.

Appendix A

Figure A1. Prediction plots of four prediction models for carbonyl contents at −7 °C and −13 °C.
Sustainability 15 15566 g0a1
Figure A2. Prediction plots of four prediction models for carbonyl contents at −18 °C and −23 °C.
Sustainability 15 15566 g0a2
Figure A3. Prediction plots of four prediction models for sulfhydryl contents at −7 °C and −13 °C.
Sustainability 15 15566 g0a3
Figure A4. Prediction plots of four prediction models for sulfhydryl contents at −18 °C and −23 °C.
Sustainability 15 15566 g0a4
Figure A5. Prediction plots of four prediction models for TBARS values at −7 °C and −13 °C.
Sustainability 15 15566 g0a5
Figure A6. Prediction plots of four prediction models for TBARS values at −18 °C and −23 °C.
Sustainability 15 15566 g0a6
Figure A7. Prediction plots of four prediction models for Ca2+-ATPase activity at −7 °C and −13 °C.
Sustainability 15 15566 g0a7
Figure A8. Prediction plots of four prediction models for Ca2+-ATPase activity at −18 °C and −23 °C.
Sustainability 15 15566 g0a8

References

  1. He, X.; Luo, Z.; Zhao, C.; Huang, L.; Yan, Y.; Kang, B. Species composition, growth, and trophic traits of hairtail (Trichiuridae), the most productive fish in Chinese marine fishery. Animals 2022, 12, 3078. [Google Scholar] [CrossRef] [PubMed]
  2. Feng, T.; Ji, J.; Zhang, X. Research progress of phase change cold energy storage materials used in cold chain logistics of aquatic products. J. Energy Storage 2023, 60, 106568. [Google Scholar] [CrossRef]
  3. Ye, B.; Chen, J.; Fu, L.; Wang, Y. Application of nondestructive evaluation (NDE) technologies throughout cold chain logistics of seafood: Classification, innovations and research trends. LWT 2022, 158, 113127. [Google Scholar] [CrossRef]
  4. Shi, Y.; Lin, Y.; Lim, M.K.; Tseng, M.-L.; Tan, C.; Li, Y. An intelligent green scheduling system for sustainable cold chain logistics. Expert. Syst. Appl. 2022, 209, 118378. [Google Scholar] [CrossRef]
  5. Zhang, Y.; Liu, Y.; Jiong, Z.; Tseng, M.-L.; Tan, C.; Li, Y. Development and assessment of blockchain-IoT-based traceability system for frozen aquatic product. J. Food Process. Eng. 2021, 44, e13669. [Google Scholar] [CrossRef]
  6. Wei, J.; Lv, S. Research on the distribution system of agricultural products cold chain logistics based on internet of things. In Proceedings of the IOP Conference Series: Earth and Environmental Science, Seoul, Republic of Korea, 26–29 January 2019. [Google Scholar]
  7. Racaud, S. Low-cost Chinese goods in Tanzania: The rise of transnational trade routes peripheral branches. Crit. Afr. Stud. 2023, 15, 106–123. [Google Scholar] [CrossRef]
  8. Wang, S.; Wang, P.; Cui, Y.; Lu, W.; Shen, X.; Zheng, H.; Xue, J.; Chen, K.; Zhao, Q.; Shen, Q. Study on the physicochemical indexes, nutritional quality, and flavor compounds of Trichiurus lepturus from three representative origins for geographical traceability. Front. Nutr. 2022, 9, 1034868. [Google Scholar] [CrossRef]
  9. Nieder, R.; Benbi, D.K.; Reichl, F.X. Microelements and their role in human health. In Soil Components and Human Health, 1st ed.; Springer: Dordrecht, The Netherlands, 2018; pp. 317–374. [Google Scholar]
  10. Dawood, M.A.O.; Alagawany, M.; Sewilam, H. The role of zinc microelement in aquaculture: A review. Biol. Trace Elem. Res. 2021, 200, 3841–3853. [Google Scholar] [CrossRef]
  11. Koddy, J.K.; Miao, W.; Hatab, S.; Tang, L.; Xu, H.; Nyaisaba, B.M.; Chen, M.; Deng, S. Understanding the role of atmospheric cold plasma (ACP) in maintaining the quality of hairtail (Trichiurus lepturus). Food Chem. 2021, 343, 128418. [Google Scholar] [CrossRef]
  12. Yan, B.; Bai, W.; Tao, Y.; Ye, W.; Zhang, W.; Zhang, N.; Huang, J.; Chen, W.; Fan, D. Physicochemical changes and comparative proteomics analysis of hairtail (Trichiurus lepturus) fish muscles during frozen storage. Food Biosci. 2023, 55, 103021. [Google Scholar] [CrossRef]
  13. Kim, D.Y.; Park, S.W.; Shin, H.S. Fish Freshness Indicator for Sensing Fish Quality during Storage. Foods 2023, 12, 1801. [Google Scholar] [CrossRef]
  14. Song, S.; Huang, T.; Ma, J.; Ye, W.; Zhang, W.; Zhang, N.; Huang, J.; Chen, W.; Fan, D. Assessing safety of market-sold fresh fish: Tracking fish origins and toxic chemical origins. Environ. Sci. Technol. 2022, 56, 9505–9514. [Google Scholar] [CrossRef] [PubMed]
  15. Xing, J.; Xu, X.; Luo, X.; Zheng, R.; Mao, L.; Zhang, S.; Shen, J.; Lu, J. Characterization of microbial community in cold-chain hairtail fish by high-throughput sequencing technology. J. Food Prot. 2021, 84, 1080–1087. [Google Scholar] [CrossRef] [PubMed]
  16. Fang, C.; Chen, H.; Yan, H.; Shui, S.; Benjakul, S.; Zhang, B. Investigation of the changes in the lipid profiles in hairtail (Trichiurus haumela) muscle during frozen storage using chemical and LC/MS-based lipidomics analysis. Food Chem. 2022, 390, 133140. [Google Scholar] [CrossRef]
  17. Shui, S.; Yan, H.; Tu, C.; Benjakul, S.; Aubourg, S.P.; Zhang, B. Cold-induced denaturation of muscle proteins in hairtail (Trichiurus lepturus) during storage: Physicochemical and label-free based proteomics analyses. Food Chem. X 2022, 16, 100479. [Google Scholar] [CrossRef]
  18. Hu, L.; Ying, Y.; Zhang, H.; Liu, J.; Chen, X.; Shen, N.; Hu, Y.; Li, Y. Advantages of liquid nitrogen freezing in long-term frozen preservation of hairtail (Trichiurus haumela): Enzyme activity, protein structure, and tissue structure. J. Food Process. Eng. 2021, 44, e13789. [Google Scholar] [CrossRef]
  19. Yan, H.; Jiao, L.; Fang, C.; Benjakul, S.; Zhang, B. Chemical and LC–MS-based lipidomics analyses revealed changes in lipid profiles in hairtail (Trichiurus haumela) muscle during chilled storage. Food Res. Int. 2022, 159, 111600. [Google Scholar] [CrossRef]
  20. Xu, H.; Miao, W.; Zheng, B.; Deng, S.; Hatab, S. Assessment of the Effect of Cold Atmospheric Plasma (CAP) on the Hairtail (Trichiurus lepturus) Quality under Cold Storage Conditions. Foods 2022, 11, 3683. [Google Scholar] [CrossRef] [PubMed]
  21. Zhao, Y.; Kang, Z.; Chen, L.; Guo, Y.; Mu, Q.; Wang, S.; Zhao, B.; Feng, C. Quality classification of kiwifruit under different storage conditions based on deep learning and hyperspectral imaging technology. J. Food Meas. Charact. 2023, 17, 289–305. [Google Scholar] [CrossRef]
  22. Bhole, V.; Kumar, A. Mango quality grading using deep learning technique: Perspectives from agriculture and food industry. In Proceedings of the 21st Annual Conference on Information Technology Education, Omaha, NE, USA, 7–9 October 2020. [Google Scholar]
  23. Stasenko, N.; Chernova, E.; Shadrin, D.; Ovchinnikov, G.; Krivolapov, I.; Pukalchik, M. Deep Learning for improving the storage process: Accurate and automatic segmentation of spoiled areas on apples. In Proceedings of the 2021 IEEE International Instrumentation and Measurement Technology Conference (I2MTC), Glasgow, UK, 17 May 2021. [Google Scholar]
  24. Abdallah, S.E.; Elmessery, W.M.; Shams, M.Y.; Al-Sattary, N.S.A.; Abohany, A.A.; Thabet, M. Deep learning model based on ResNet-50 for beef quality classification. Inf. Sci. Lett. 2023, 12, 289–297. [Google Scholar]
  25. Detection of Carbonyl Content in Protein. Available online: https://www.docin.com/p-3285294660.html (accessed on 9 August 2023).
  26. Zhao, Z.; Wang, Q.; Yan, B.; Gao, W.; Jiao, X.; Huang, J.; Zhao, J.; Zhang, H.; Chen, W.; Fan, D. Synergistic effect of microwave 3D print and transglutaminase on the self-gelation of surimi during printing. Innov. Food Sci. Emerg. Technol. 2021, 67, 102546. [Google Scholar] [CrossRef]
  27. GB 5009.181-2016; National Standards for Food Safety Determination of Malondialdehyde in Food. Standard Press: Beijing, China, 2016.
  28. Shen, N. Protein Oxidation, Cathepsins Activity, Texture and Structure of Muscle Changes of Hairtail during Low-Temperature Storage; Zhejiang University: Hangzhou, China, 2018. [Google Scholar]
  29. Henderi, H.; Wahyuningsih, T.; Rahwanto, E. Comparison of Min-Max normalization and Z-Score Normalization in the K-nearest neighbor (kNN) Algorithm to Test the Accuracy of Types of Breast Cancer. Int. J. Lang. Lit. Stud. 2021, 4, 13–20. [Google Scholar] [CrossRef]
  30. Du, G.; Li, X.; Zhang, L.; Liu, L.; Zhao, C. Novel Automated K-Means++Algorithm for Financial Data Sets. Math. Probl. Eng. 2021, 2021, 1–12. [Google Scholar] [CrossRef]
  31. Woo, G.; Liu, C.; Sahoo, D.; Kumar, A.; Hoi, S. Etsformer: Exponential smoothing transformers for time-series forecasting. arXiv 2022, arXiv:2202.01381. [Google Scholar]
  32. Vaswani, A.; Shazeer, N.; Parmar, N.; Uszkoreit, J.; Jones, L.; Gomez, A.N.; Polosukhin, I.; Kaiser, Ł. Attention is all you need. In Proceedings of the Thirty-First Annual Conference on Neural Information Processing System, Long Beach, CA, USA, 4–9 December 2017. [Google Scholar]
  33. Jiang, Y.; Li, D.; Tu, J.; Zhong, Y.; Zhang, D.; Wang, Z.; Tao, X. Mechanisms of change in gel water-holding capacity of myofibrillar proteins affected by lipid oxidation: The role of protein unfolding and cross-linking. Food Chem. 2021, 344, 128587. [Google Scholar] [CrossRef] [PubMed]
  34. Chicco, D.; Warrens, M.; Jurman, G. The coefficient of determination R-squared is more informative than SMAPE, MAE, MAPE, MSE and RMSE in regression analysis evaluation. PeerJ Comput. Sci. 2021, 7, e623. [Google Scholar] [CrossRef]
Figure 1. Flowchart of muscle quality grading of hairtail based on K-Means++.
Sustainability 15 15566 g001
Figure 2. Quality prediction model of Zhoushan frozen hairtail based on ETSFormer.
Sustainability 15 15566 g002
Figure 3. Prediction model of Zhoushan frozen hairtail quality indicator based on ETSFormer.
Sustainability 15 15566 g003
Figure 4. Changes in carbonyl indicators of Zhoushan hairtail at four temperatures for 120 days.
Sustainability 15 15566 g004
Figure 5. Changes in sulfhydryl indicators of Zhoushan hairtail at four temperatures for 120 days.
Sustainability 15 15566 g005
Figure 6. Changes in TBARS indicators of Zhoushan hairtail at four temperatures for 120 days.
Sustainability 15 15566 g006
Figure 7. Changes in Ca2+-ATPase indicators of Zhoushan hairtail at four temperatures for 120.
Sustainability 15 15566 g007
Figure 8. Silhouette coefficient plot for clustering.
Sustainability 15 15566 g008
Figure 9. Probability density plot of high-quality clusters.
Sustainability 15 15566 g009
Figure 10. Probability density plot of medium-quality clusters.
Sustainability 15 15566 g010
Figure 11. Probability density plot of low-quality clusters.
Sustainability 15 15566 g011
Table 1. Normalized clusters.
ClusterCarbonylSulfhydrylTBARSCa2+-ATPaseSample Points *Quality Level
10.6950.6890.8130.64758Low
20.3720.4400.3490.568173Medium
30.1210.1170.1340.129253High
* Sample points: after the cluster number is set to 3, 484 normalized sample points of 4 indicators are clustered, and according to the distance between the sample points and the clustering center, they are divided into 3 qualities: low, medium, and high. Among them, the number of samples near the low-quality cluster center is 58, the number of samples near the middle-quality cluster center is 173, and the number of samples near the high-quality cluster center is 253.
Table 2. Table of evaluation metrics MAE* for predicting the effectiveness of quality indicators of Zhoushan hairtails.
IndicatorsCarbonylSulfhydrylTBARSCa2+-ATPase
Temp (°C)−7−13−18−23−7−13−18−23−7−13−18−23−7−13−18−23
BP0.940.590.720.380.600.550.660.220.140.030.220.110.540.480.770.29
LSTM0.790.930.400.760.570.560.400.430.070.030.230.110.340.210.430.50
Transformer0.730.720.560.500.250.370.540.290.060.020.120.120.300.180.330.89
ETSFormer0.440.310.250.210.030.130.200.150.030.010.080.050.110.140.110.14
MAE*: MAE (mean absolute error) is the average value of absolute error, which can better reflect the actual situation of prediction error. The smaller the MAE, the better the model.
Table 3. Table of evaluation metrics MSE* for predicting the effectiveness of quality indicators of Zhoushan hairtails.
IndicatorsCarbonylSulfhydrylTBARSCa2+-ATPase
Temp (°C)−7−13−18−23−7−13−18−23−7−13−18−23−7−13−18−23
BP1.510.450.680.270.480.250.510.070.028 × 10−42 × 10−33 × 10−40.010.010.012 × 10−3
LSTM0.761.260.240.70.350.260.210.200.019 × 10−42 × 10−33 × 10−43 × 10−31 × 10−34 × 10−30.01
Transformer0.640.750.340.450.160.070.340.114 × 10−30.014 × 10−43 × 10−43 × 10−38 × 10−42 × 10−30.02
ETSFormer0.230.170.070.090.030.010.050.041 × 10−31 × 10−42 × 10−41 × 10−44 × 10−45 × 10−43 × 10−47 × 10−4
MSE*: MSE is a simple and effective index commonly used in statistical analysis to evaluate the predicted value (the error between the original data and the predicted value), which can clearly reflect the prediction accuracy of statistical models.
Table 4. Table of evaluation metrics MAPE* for predicting the effectiveness of quality indicators of Zhoushan hairtails.
IndicatorsCarbonylSulfhydrylTBARSCa2+-ATPase
Temp (°C)−7−13−18−23−7−13−18−23−7−13−18−23−7−13−18−23
BP13.113.418.410.78.256.728.372.6333.18.311.87.0716.225.122.37.29
LSTM14.315.99.1220.28.687.285.515.7515.99.3111.35.5525.015.112.816.1
Transformer12.112.814.115.65.113.627.054.0811.64.905.797.5613.88.539.9124.0
ETSFormer6.455.726.384.762.160.892.592.226.253.153.562.999.877.293.144.64
MAPE*: a MAPE (mean absolute percentage error) of 0% indicates a perfect model and a MAPE greater than 100% indicates an inferior model.
Table 5. Evaluation indexes of the neural network-based quality grade prediction model.
ModelLow QualityMedium QualityHigh Quality
P*%R*%F1*%P%R%F1%P%R%F1%
BP80.6586.2183.3391.6789.0290.3294.4494.0794.26
LSTM82.2687.9385.0092.5793.6493.1096.7694.4795.60
Transformer88.1489.6688.8994.8094.8094.8096.8396.4496.63
ETSFormer90.1694.8392.4494.8395.3895.1098.8097.2398.01
P*: the accuracy rate represents the accuracy of the prediction in the positive sample results. R*: the higher the recall rate, the greater the probability that the samples with positive real labels are predicted to be positive. F1*: the F1 value is a combination of the two, which can reflect the ability of the model to check accurately and completely.
Disclaimer/Publisher’s Note: The statements, opinions and data contained in all publications are solely those of the individual author(s) and contributor(s) and not of MDPI and/or the editor(s). MDPI and/or the editor(s) disclaim responsibility for any injury to people or property resulting from any ideas, methods, instructions or products referred to in the content.

