Article

Research on the Spatial Pattern of the Logistics Industry Based on POI Data: A Case Study of Zhengzhou City

1
Key Research Institute of Yellow River Civilization and Sustainable Development & Collaborative Innovation Center on Yellow River Civilization Jointly Built by Henan Province, Ministry of Education, Henan University, Kaifeng 475001, China
2
College of Geography and Environmental Science, Henan University, Kaifeng 475004, China
*
Author to whom correspondence should be addressed.
Sustainability 2023, 15(21), 15574; https://doi.org/10.3390/su152115574
Submission received: 31 August 2023 / Revised: 8 October 2023 / Accepted: 16 October 2023 / Published: 2 November 2023

Abstract

:
How to optimize the spatial layout of the logistics industry is a challenge faced by every city under the rapid development of e-commerce nowadays. Enterprises and nodes as the core of logistics and their locational formation mechanisms are the key content of the study. Based on the API platform of Gaode Map, the POI data of Zhengzhou City with representative years during 2012–2021 were collected. Using the methods of industry concentration evaluation and nuclear density analysis, the spatial pattern changes of the logistics industry in Zhengzhou in recent years are demonstrated, the differences in location selection of the logistics industry are analyzed, and the analysis of its formation mechanism is made. The results of the study show that: (1) the logistics industry in Zhengzhou has developed rapidly in recent years, forming a “double core” spatial pattern of agglomeration near the four urban areas in the center of the metropolitan area and Xinzheng Airport, with a high degree of coordination in the agglomeration of industries and practitioners; and (2) the layout of logistics nodes is influenced by government planning, and logistics enterprises have strong autonomy in the layout. In the process of industrial agglomeration, the government guides the industry to gradually achieve agglomeration by laying out the transportation environment and providing low-rent land for industrial parks, while logistics enterprises provide services for different types of groups through segmenting specialized markets for different types of groups to provide services.

1. Introduction

1.1. Research Background

Logistics cluster is a spatial concentration phenomenon of logistics enterprises in the process of competition and cooperation [1,2], which is important for optimizing logistics industry structure and promoting regional economic transformation [3]. The core components of the logistics industry are logistics enterprises (LE) and logistics nodes (LN), among which logistics enterprises have strong autonomy, and their location selection behavior is influenced more by enterprise managers and less by government planning and policies; logistics nodes are more sensitive to site environment, land rent, and traffic resources and therefore are more influenced by planning layout [4]. China was late to the introduction of the logistics concept; after 2011, it gradually formed a large logistics node as the core of the spatial aggregation model. At present, China’s logistics industry is mainly concerned with the location of distribution warehouses and distribution centers manufactured by distribution enterprises in the distribution phase; in the logistics function integration phase, it focuses on the construction of aggregated public industrial parks to reduce the overall cost and improve the efficiency of the logistics industry [5]. The above two stages are mainly focused on the optimization of logistics node locations and layouts, and the scale of research is mainly focused on the level of cities and specific enterprises. With the high demand for logistics in the heart of China’s large cities, the layout of logistics enterprises and nodes has become one of the most important items in urban planning. Zhengzhou, the capital of Henan Province, is a well-known transportation hub with a wide radius to other regions of China. In terms of connectivity and logistics capabilities, Zhengzhou could develop into an international logistics center. With the integration of the global economy and the implementation of the strategy for the rise of central and western China, Zhengzhou must strengthen its position as a logistics center [6].

1.2. Research Review

International scholars have studied logistics locations earlier, and the logistics industry in Western countries has gone through different stages of development; their research in recent years has focused on three aspects: green logistics, urban logistics, and emergency logistics [7,8]. Among them, urban logistics, as a micro-part of the logistics research field, scholars usually focus on the spatial pattern of the logistics industry, industrial agglomeration, population of employees, etc. Sakai et al. [9] used the Urban Logistics Land Use and Traffic Simulator (ULLTRASIM) to assess the level of externalities of different spatial distribution patterns of logistics facilities. The results of the study showed that the concentration and dispersion of logistics facilities had no significant effect on the level of externalities, while areas of imbalance between logistics supply and demand led to an increase in the level of externalities. Genevieve Giulian et al. [10] compared logistics siting with population employment trends, confirmed the existence of dispersion in logistics firms and population employment in Los Angeles, and showed that the phenomenon may be related to city size and economic Adeline Heitz et al. [11] proposed a generalized model for studying the distribution of logistics facility locations in Paris to provide decision support to the government in planning the layout of logistics facilities. The “last mile” delivery difficulty is also one of the hot issues that foreign scholars focus on. Iwan et al. [12] found through simulation analysis that InPost’s parcel locker system delivery model can effectively improve delivery efficiency and reduce the negative impact on the environment. It is the future direction of the urban delivery system. Punakivi et al. [13] found that the locker delivery mode is cheaper and easier to deploy by simulating both manual delivery and locker delivery modes. The cost of manual delivery service is also lower, and the delivery is more efficient in companies that mainly use locker delivery. Castillo et al. [14] proposed a new delivery model for sharing economy business, namely “crowdsourced logistics” (CSL), and demonstrated through simulations that this model offers lower costs, faster delivery efficiency, more flexible delivery formats, and more jobs for the industry in the end-delivery chain. Riccardo Mangiaracina, Perego et al. [15] systematically explains the combination of factors that affect the “last mile” delivery, including delivery costs, delivery efficiency, and pricing policies.
Scholars studying the Chinese region have also achieved interesting findings: Xu et al. [16] analyzed the panel data of 26 cities in the Yangtze River Delta using the overall entropy method and the spatial Durbin model. The results found that the development of the logistics industry in the Yangtze River Delta city cluster has a more significant impact on the local economic growth and is the second most direct influence besides capital input, which is an extremely strong thrust of economic growth in the Yangtze River Delta city cluster. By studying the warehouses and ports of Paris, Hertz et al. [11] found that 50% of the logistics facilities are located in less than 10% of Paris. Smaller warehouses and logistics facilities are clustered in the suburbs of Paris. Large logistics facilities, on the other hand, are located on the fringes of the urban agglomeration. They also found different spatial patterns within the logistics industry between large groups of transportation hubs and the courier and parcel delivery industries, as well as the food industry, which relies on retail distribution and wholesale trade. Retail distribution, on the other hand, has the same spatial pattern as many logistics service providers. Cao et al. [17] found by establishing the logistics spatial database of Suzhou city that the logistics industry in Suzhou city showed a trend of agglomeration before diffusion, the industrial expansion was centered on transportation routes, and the asset ratio of logistics enterprises determined the spatial distribution of the logistics industry. Liang et al. [18] analyzed the logistics industry in the port city of Shanghai and found that the overall spatial pattern of logistics enterprises showed suburbanization characteristics, and its evolutionary path was influenced by the evolution of port functions, the construction of comprehensive transportation networks, commercial supporting conditions, urban planning, and development policies. Tian et al. [19] analyzed the spatial layout of logistics in 31 Chinese provinces and cities, and they found that China’s logistics industry as a whole shows agglomeration characteristics, the spatial agglomeration of logistics practitioners is not obvious, and the overall unbalanced spatial distribution of the industries and practitioners. The influence of human resource factors on the spatial relationship of logistics development level is decreasing with the level of agglomeration, while the influence of the degree of informationization of the logistics industry is increasing. Qian et al. [20] found through analyzing the spatial distribution characteristics of logistics enterprises in Guangzhou that logistics and analyzed the spatial distribution characteristics of logistics enterprises in Guangzhou and found that logistics enterprises have a strong service dependency, and the CBD and industrial areas in the city center are important concentration areas for logistics enterprises. Li and Yang et al. [21,22] explored the spatial pattern and formation mechanism of the logistics industry in Beijing through industrial agglomeration assessment and statistical analysis and found that logistics activities in Beijing generally exhibit centrality. They found that the spatial pattern of logistics activities in Beijing is “interspersed with peripheral, suburban, and distant suburbs”, and that transportation, land rent, and asset allocation are important factors for industrial agglomeration or differentiation. Hong et al. [23] found that related logistics enterprises and other institutions gradually form logistics industry clusters in port areas. Port logistics parks play an important role in improving the functions of ports, improving the level of port operation and organization, and expanding the radiation service capacity of ports. Based on LQ theory and the characteristics of regional logistics, Cai et al. [24] used exploratory spatial data analysis (ESDA) to study the changes in the logistics industry in the East Coast Area (ECA) of China. They found Moran’s I of GDP per capita is higher than that for the logistics industry. Logistics clusters were formed in developed strip regions, confirming the existence of agglomeration economics. The literature review is summarized in Table 1.
We used CiteSpace (version 5.7) software to search and analyze the following keywords: “Logistics”, “Logistics Enterprise”, “Spatial”, “Cluster”, “Business organization”, and “Spatial Network”. The results (Figure 1) found that “supply chain infrastructure development”, “spatial coupling effect” and “strategic orientation” were found to be the most popular topics for research in the related fields. The three topics related to geography are “spatial coupling effect (No. 1)”, “industrial cluster (No. 9)”, and “location selection (No. 10)”, suggesting that the spatial layout of the logistics industry and its drivers are a popular topic for research.
Previous studies conducted by scholars at various spatial scales and from various perspectives have yielded rich research results. However, there are still the following shortcomings: (1) Quantitative analysis of the driving factors of the spatial distribution of the logistics industry because most of the studies use point data to show the spatial distribution of the logistics industry, and it is difficult to use the existing methods to analyze the intrinsic influence factors. This study constructs a city grid division model, converts point data into surface data, and then uses geographic detectors and geographically weighted regression models to analyze the driving factors of the spatial distribution of the logistics industry; (2) Previous studies have dealt less with inland port cities, and have focused more on coastal port cities. However, Zhengzhou City, as a nationally positioned international dry port city in China, shoulders the important responsibility of the central transportation hub, based on the “China-European liner”, ground transportation hub, and aviation hub, showing a very different natural environment and transportation environment from the coastal port cities. Therefore, the study of the logistics industry in Zhengzhou city has strong theoretical significance.
At present, China’s logistics activity location theory is still imperfect. With the increase in global integration, China’s logistics industry is bound to face new challenges. The development of leading e-commerce enterprises such as Alibaba and Jingdong will continue to intensify land conflicts. With the steady promotion of the strategy of the rise of central China, the logistics function of the city will also become the focus of government adjustment. Zhengzhou is an international inland port city in central China with a well-developed ground transportation infrastructure society and aviation infrastructure. However, the development of the logistics industry in Zhengzhou City is relatively short, and the overall layout of the city’s logistics industry is still imperfect. Compared with other coastal port cities, inland cities have different natural conditions, economic conditions, policy conditions, etc., which makes the spatial layout of the logistics industry in inland port cities have certain differences that need to be studied in depth. This paper takes Zhengzhou City as the research object, collects the logistics points of interest (POI) in the region, and analyzes the location characteristics and agglomeration patterns of the logistics industry to provide a decision-making reference for the layout adjustment of the logistics industry. The research framework is shown in Figure 2.

2. Materials and Methods

2.1. Data Source and Processing

This study focuses on the layout of LE and LN in the logistics industry. At present, the classification of logistics nodes and logistics enterprises is still vague. This paper refers to the classification of Han et al. [25] and the national standard “Basic Requirements for Classification and Planning of Logistics Centers” (GB/T 24358-2019 [26], Classification and planning fundamental requirements of logistics center, Standardization Administration of China, 2019), reference to “Classification and Evaluation Index of Logistics Enterprises” (GB/T 19680-2005 [27], Classification and evaluation indicators of logistics enterprises, Standardization Administration of China, 2005), and the research of domestic and foreign scholars [21,28]. It divides logistics nodes into three subcategories: logistics parks, logistics centers, and distribution centers. Logistics enterprises are divided into four subcategories: express and postal, warehousing and transportation, freight forwarding, and comprehensive logistics. Logistics-related facilities are divided into transportation, bonded, industrial parks, and comprehensive markets. The results are shown in Table 2.
Based on the open API platform of Gaode Map (https://lbs.amap.com, accessed on 2 May 2021), the keywords of “logistics”, “transportation”, and “post office express” were selected (The keyword ’logistics’ already contain almost all logistics-related data, and ‘transportation’ and ‘post office express’ are intended to further expand the scope of logistics-related data), and the latest and representative cross-sectional times were in May 2021, May 2020, December 2017, December 2015, and December 2012 (The year 2012 is the beginning of the rapid development of the logistics industry in Zhengzhou, which was designated as a national international inland port city, and the initial construction of ground transportation as well as air transportation has been completed. 2015, 2017, and 2020 are the typical years of the development of the logistics industry. 2021 is the period of the study data acquisition; in order to ensure that the data is current, we will add 2021 data into the dataset as well. Compared to Google Maps and Baidu map, using Gaode Map’s API can obtain more comprehensive POI data in the study area. While the Baidu map lacks some necessary elemental data), we collected the basic data of traffic network and road yards and programmed the logistics POI samples of Zhengzhou city including counties and districts (Figure 3). Among them are: in 2021: 330 logistics nodes, 4898 logistics enterprises, 1061 logistics-related facilities; in 2020: logistics nodes: 497, 5135 logistics enterprises, 88 logistics-related facilities; in 2017: 30 logistics nodes, 3377 logistics enterprises, 76 logistics-related facilities; in 2015: 25 logistics nodes, logistics enterprises 2776, 47 logistics-related facilities; 2012: 17 logistics nodes, 1097 logistics enterprises, 80 logistics-related nodes.

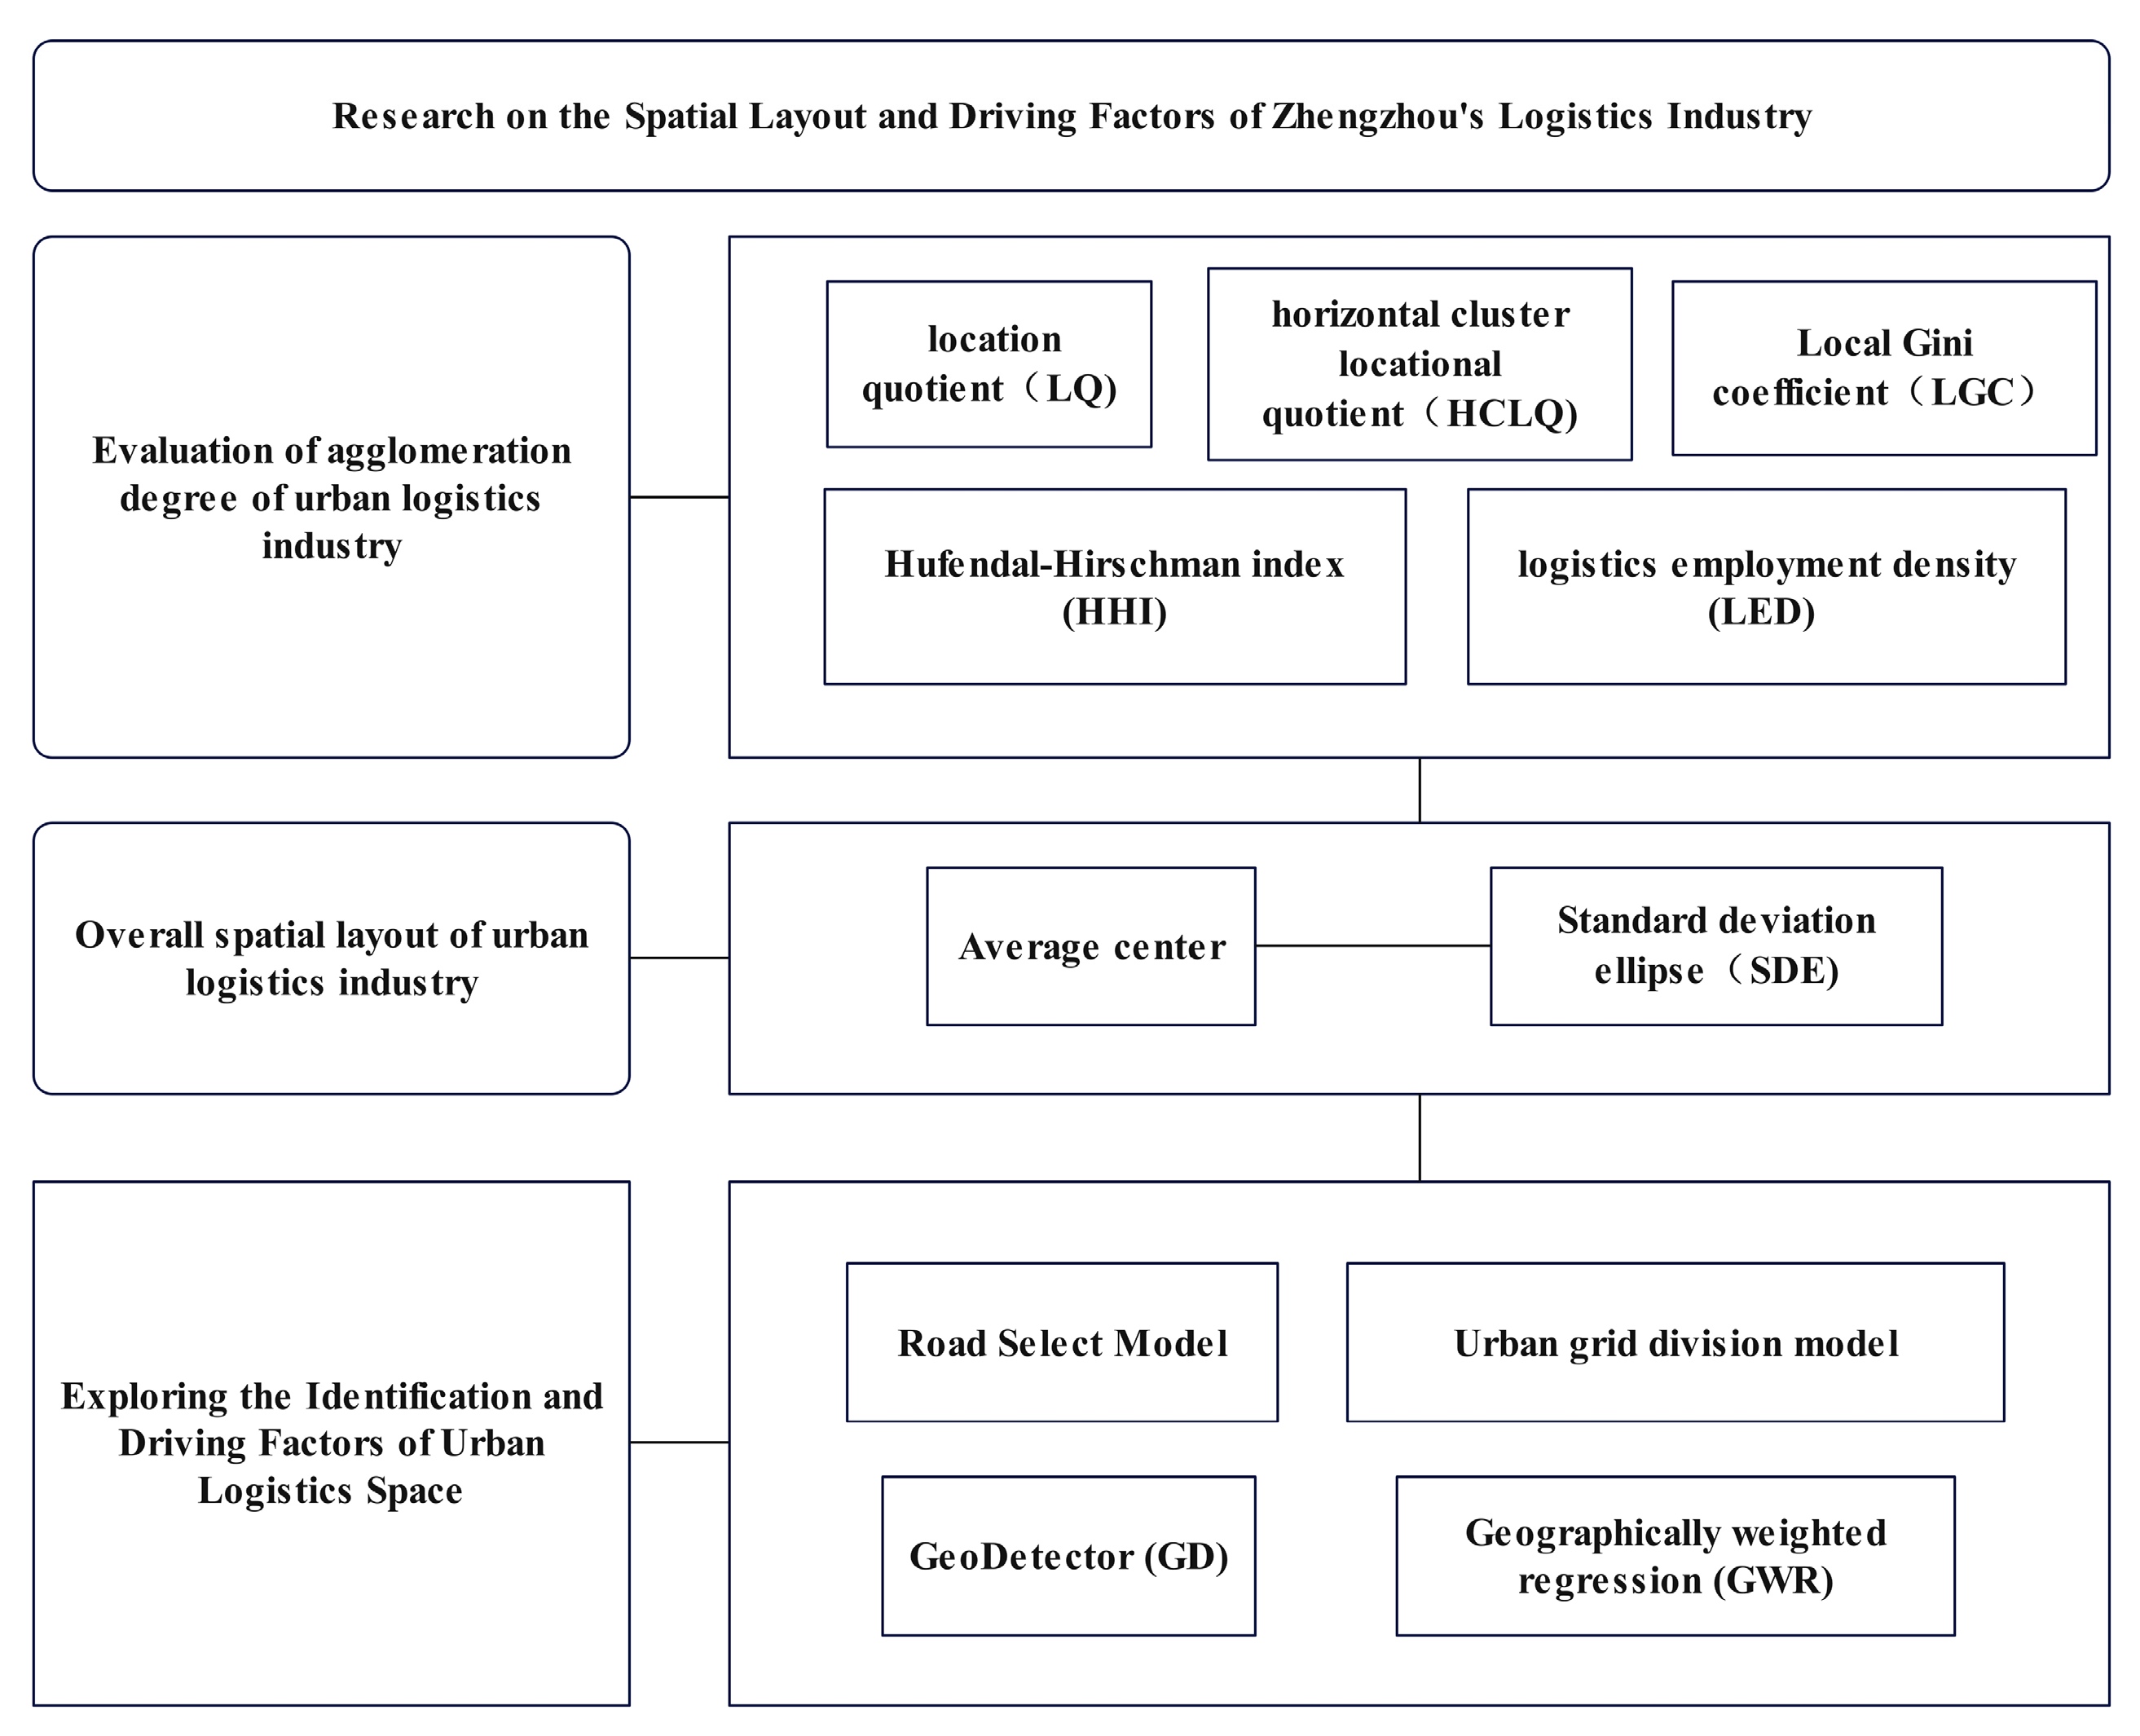
2.2. Research Methods

This study will use five models to analyze the spatial layout of the logistics industry and its driving factors in Zhengzhou City. Among them, Location Entropy analysis can evaluate the overall agglomeration degree of the logistics industry in the study area; the Standard deviation ellipse (SDE) model can reveal the spatial agglomeration center point and agglomeration distribution direction of the logistics industry in the study area; and the Urban Grid Division Model (UGDM) is an intermediate over-model for further analyzing the spatial distribution intrinsic driving factors of the logistics industry. On the one hand, this model can reveal the spatial structure of the city (this aspect is not involved in this paper for the time being) and its driving factors. UGDM is an intermediate model to further analyze the intrinsic driving factors of the logistics industry’s spatial distribution, on the one hand, this model can reveal the spatial structure of the city (this issue is not involved in this paper for the time being), on the other hand, it is to pave the way for the GeoDetector and the Geographically weighted regression model. On the basis of the results of the previous model, the driving factors and factors of the spatial distribution of the logistics industry in the study area are analyzed by GeoDetector. On the basis of the previous model results, GeoDetector is used to analyze the drivers and factor interactions of the spatial layout of the logistics industry. In order to validate the accuracy of the GeoDetector model, geographically weighted regression is used to further validate the drivers of the spatial layout of the logistics industry, and at the same time, compared with GeoDetector, Geographically weighted regression has better performance. Weighted regression has a better visualization advantage than GeoDetector, which helps us to interpret the drivers of the spatial layout of the logistics industry more intuitively in our study.

2.2.1. Location Entropy Analysis

In this paper, firstly, we analyze the spatial layout of logistics industry in Zhengzhou from 2012–2019 using the improved location quotient (LQ) and horizontal cluster locational quotient (HCLQ) of Professor MIT Yousi Sheffield, Local Gini coefficient (LGC), Hufendal-Hirschman index (HHI), and logistics employment density (LED) changes [1,21]; secondly, to study the current spatial pattern and structural characteristics of logistics in Zhengzhou using methods such as nuclear density; again, to study the spatial pattern of domestic mainstream end delivery modes through statistical analysis; then, to analyze the decisions of different types of logistics in location selection using statistical methods, and to analyze the link between location selection and supply and demand factors using density distribution and buffer zone analysis methods; Finally, the spatial pattern of logistics nodes and logistics enterprises within the study area is analyzed to determine the intrinsic influencing factors.
Location entropy is commonly used to study the spatial distribution of regions and the degree of specialization of industries. The calculation formula is as follows:
L Q = E x p / E x c / E y p E y c
where E x p denotes the employed population in industry x in region p. E x c denotes the employed population in industry x nationwide. E y p denotes the total employed population in region p. E y c denotes the total employed population nationwide. It is generally accepted that an LQ value less than 1 means that the local industry specialization is not up to the national average, and an LQ value greater than 1 means the opposite.
The entropy of horizontal agglomeration location considers the expected and realistic, industrial employment population fallout, which can reflect the spatial agglomeration of industry by the scale of employed people. The calculation formula is as follows:
H C L Q = E x p E ^ x p
where E ^ x p denotes the employment population in industry x in region p expected assuming LQ is 1. A value of HCLQ greater than 0 indicates that the employment concentration in the region is higher than the national average.
The logistics employment density index considers the actual land area within the study area and can be used as a reference for HQ and HCLQ. The calculation formula is as follows:
L E D = E x p / A p
where   A p denotes the land area of area p.

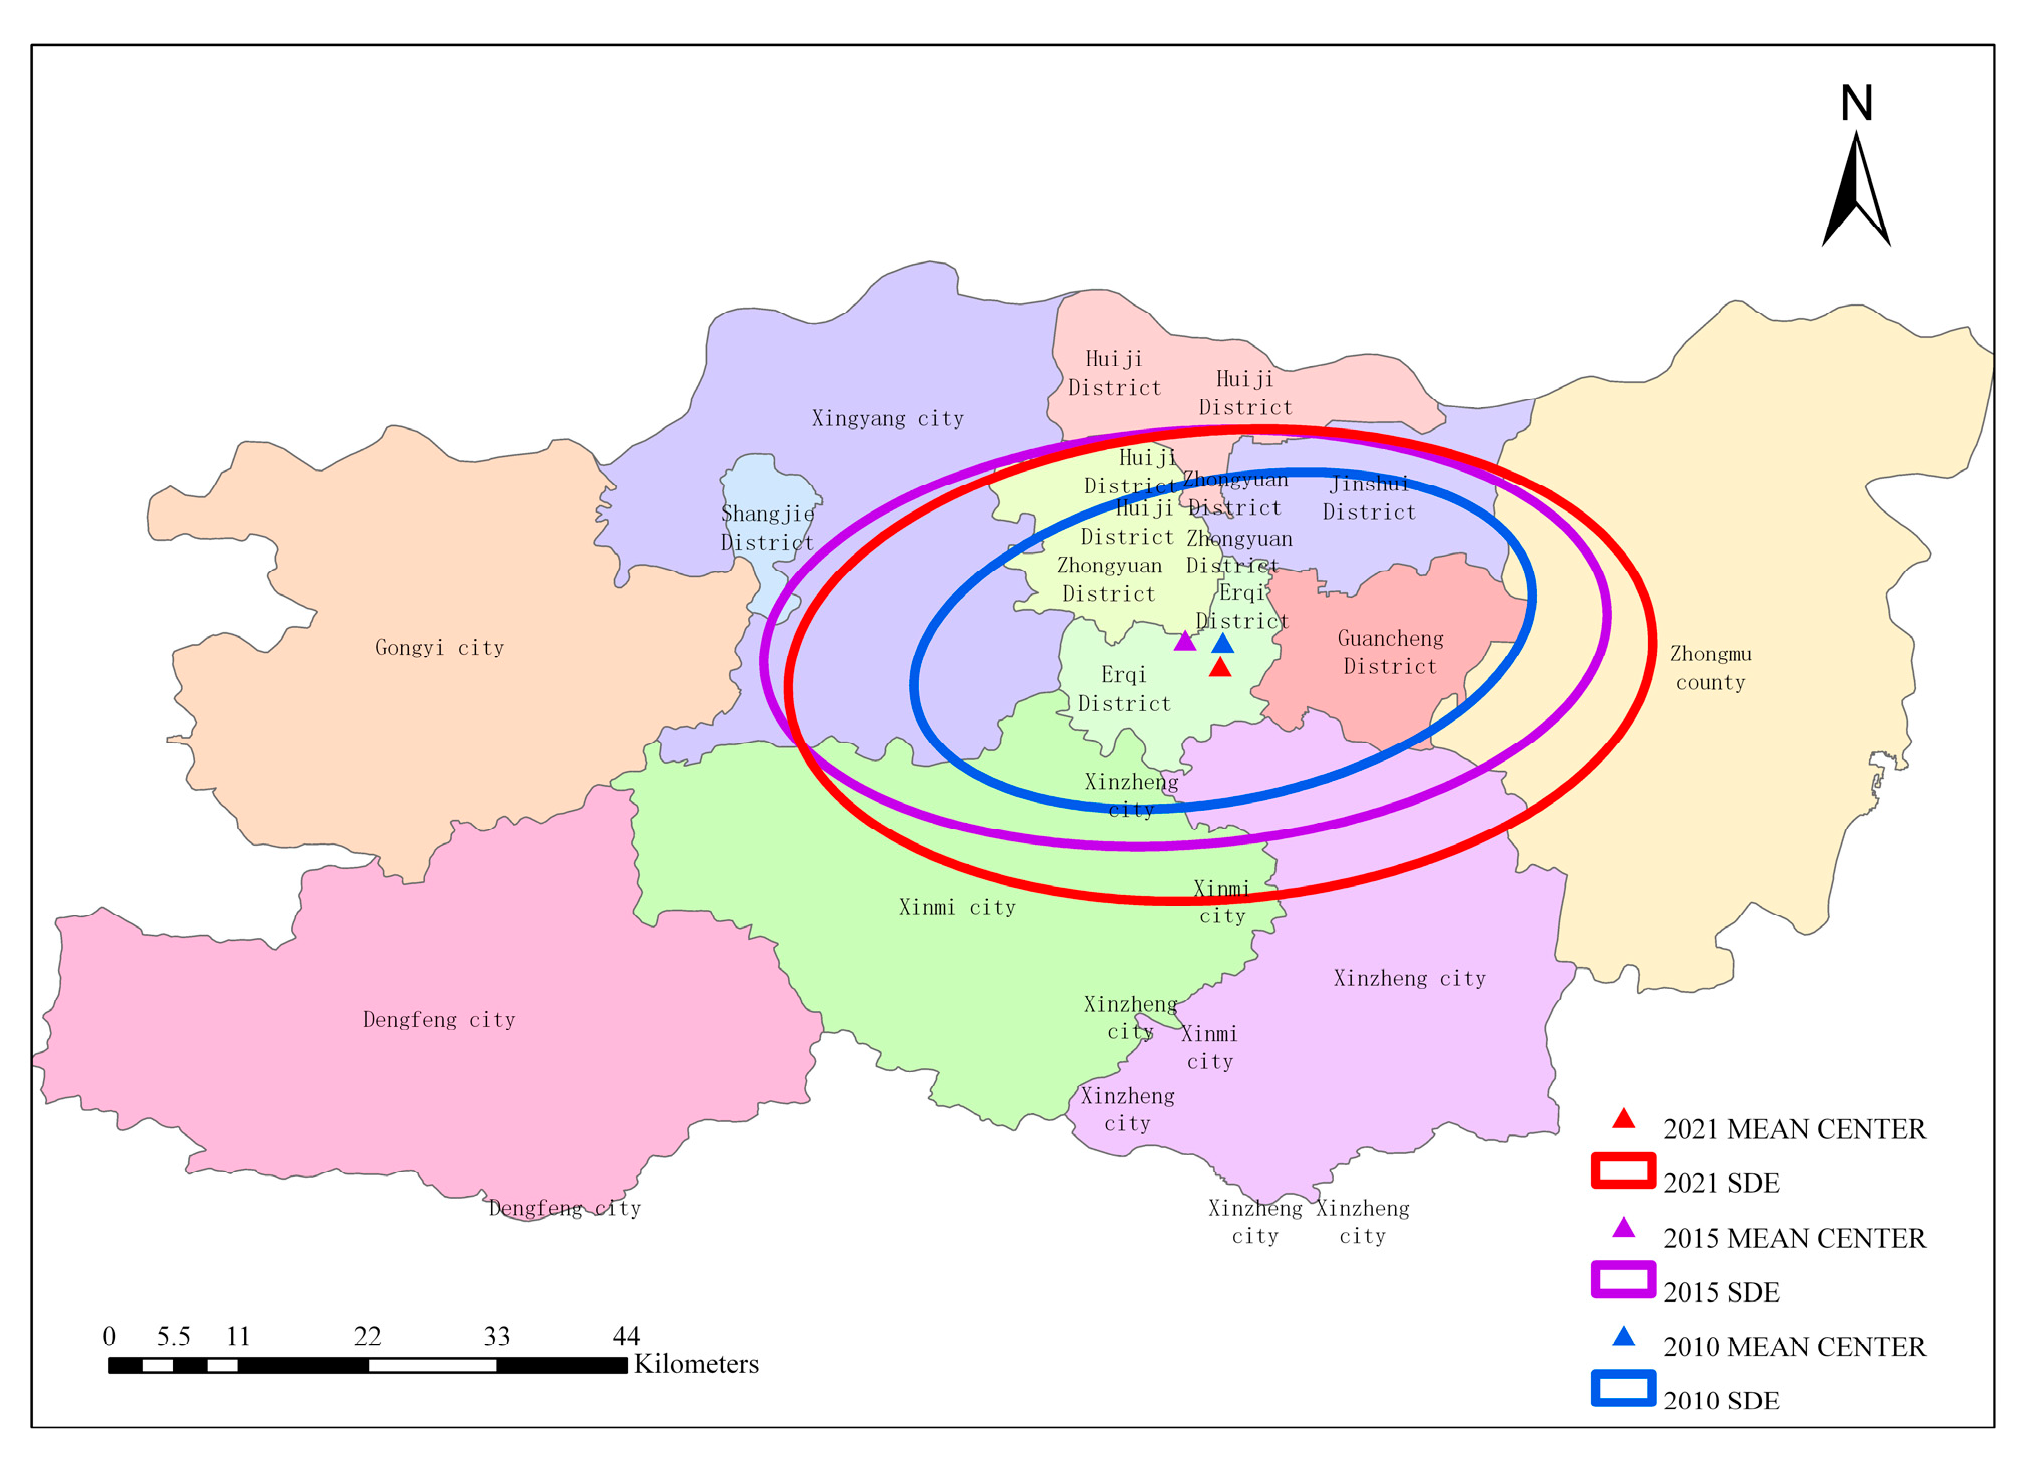
2.2.2. Standard Deviation Ellipse (SDE)

The standard deviation ellipse analysis method is often used to measure the spatial distribution characteristics of the point data set. The comparison of the size of the standard deviation ellipse area can be used to determine the degree of dispersion of the distribution of each enterprise, and a smaller area means that the distribution of each enterprise is closer to the center of gravity. The standard deviation ellipse analysis method consists of three main elements: the angle of rotation θ, the standard deviation along the long axis, and the standard deviation along the short axis. The calculation formula is as follows:
tan θ = i = 1 n   x i x ¯ 2 i = 1 n   y i y ¯ 2 + i = 1 n   x i x ¯ 2 i = 1 n   y i y ¯ 2 2 + 4 i = 1 n   x i x ¯ i = 1 n   y i y ¯ 2 2 i = 1 n   i = 1 n   x i x ¯ i = 1 n   y i y ¯
σ x = i = 1 n   x i x ¯ cos θ y i y ¯ sin θ 2 / n
y = i = 1 n   x i x ¯ sin θ y i y ¯ cos θ 2 / n

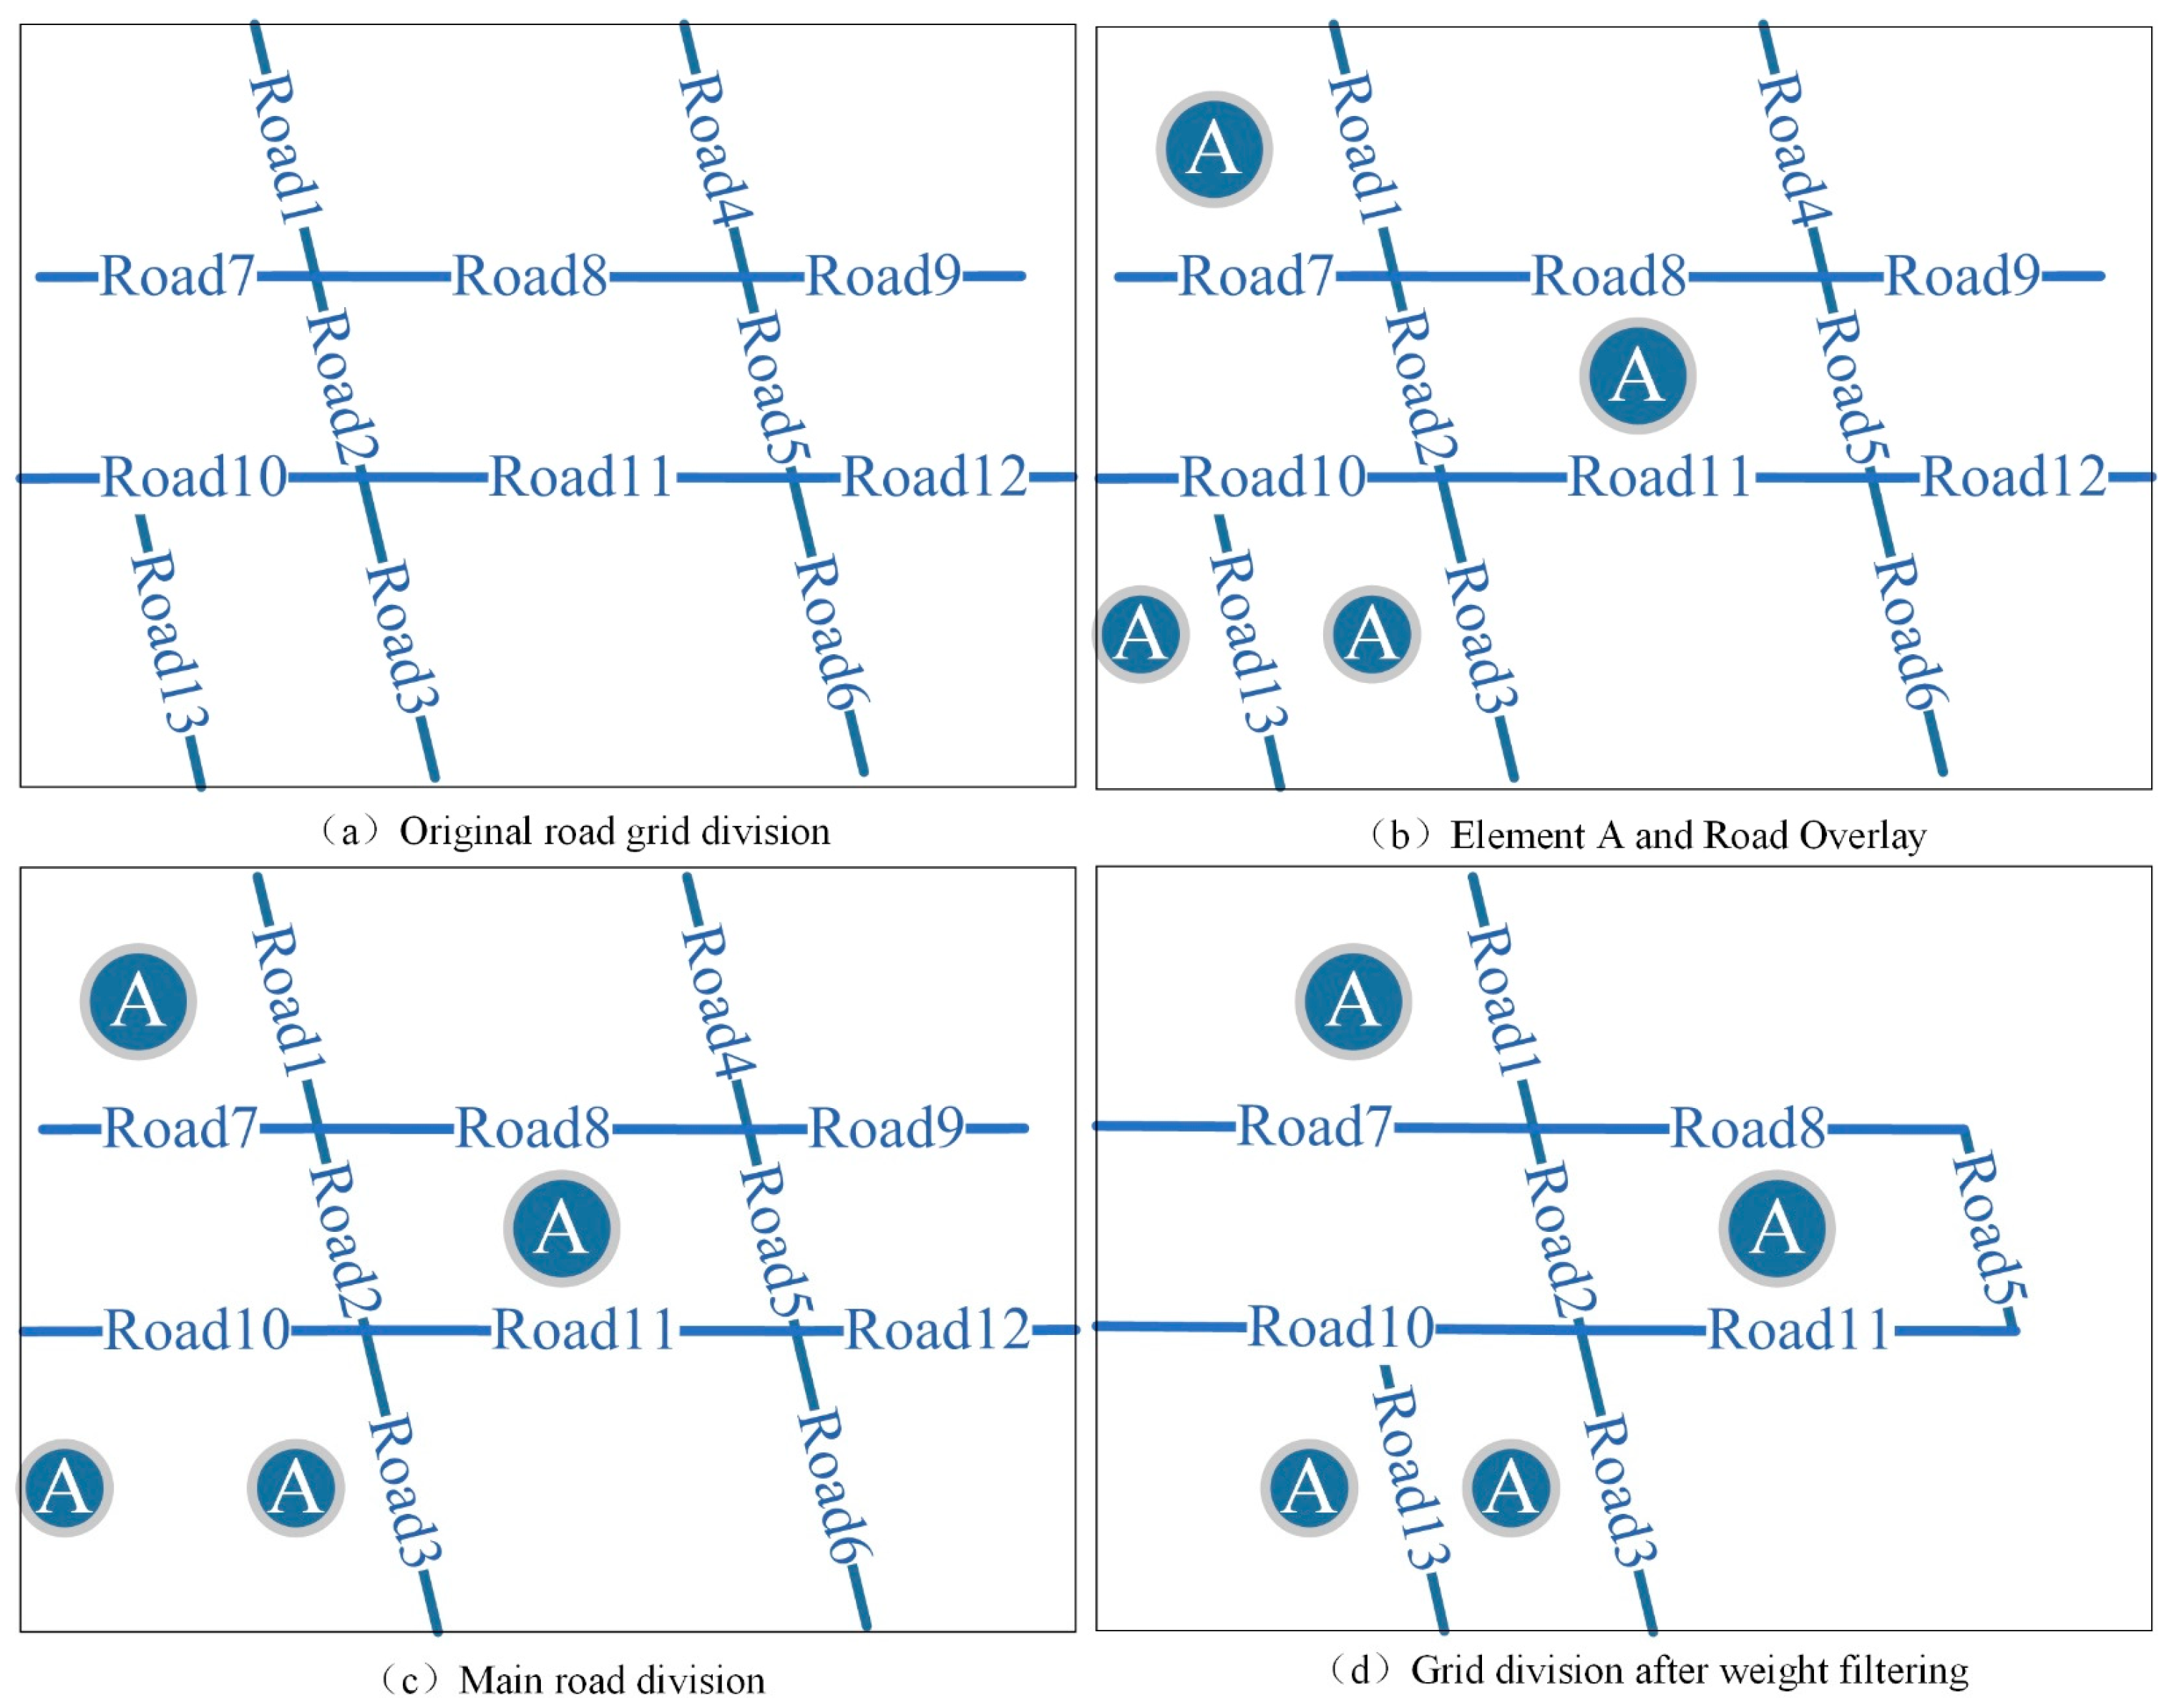
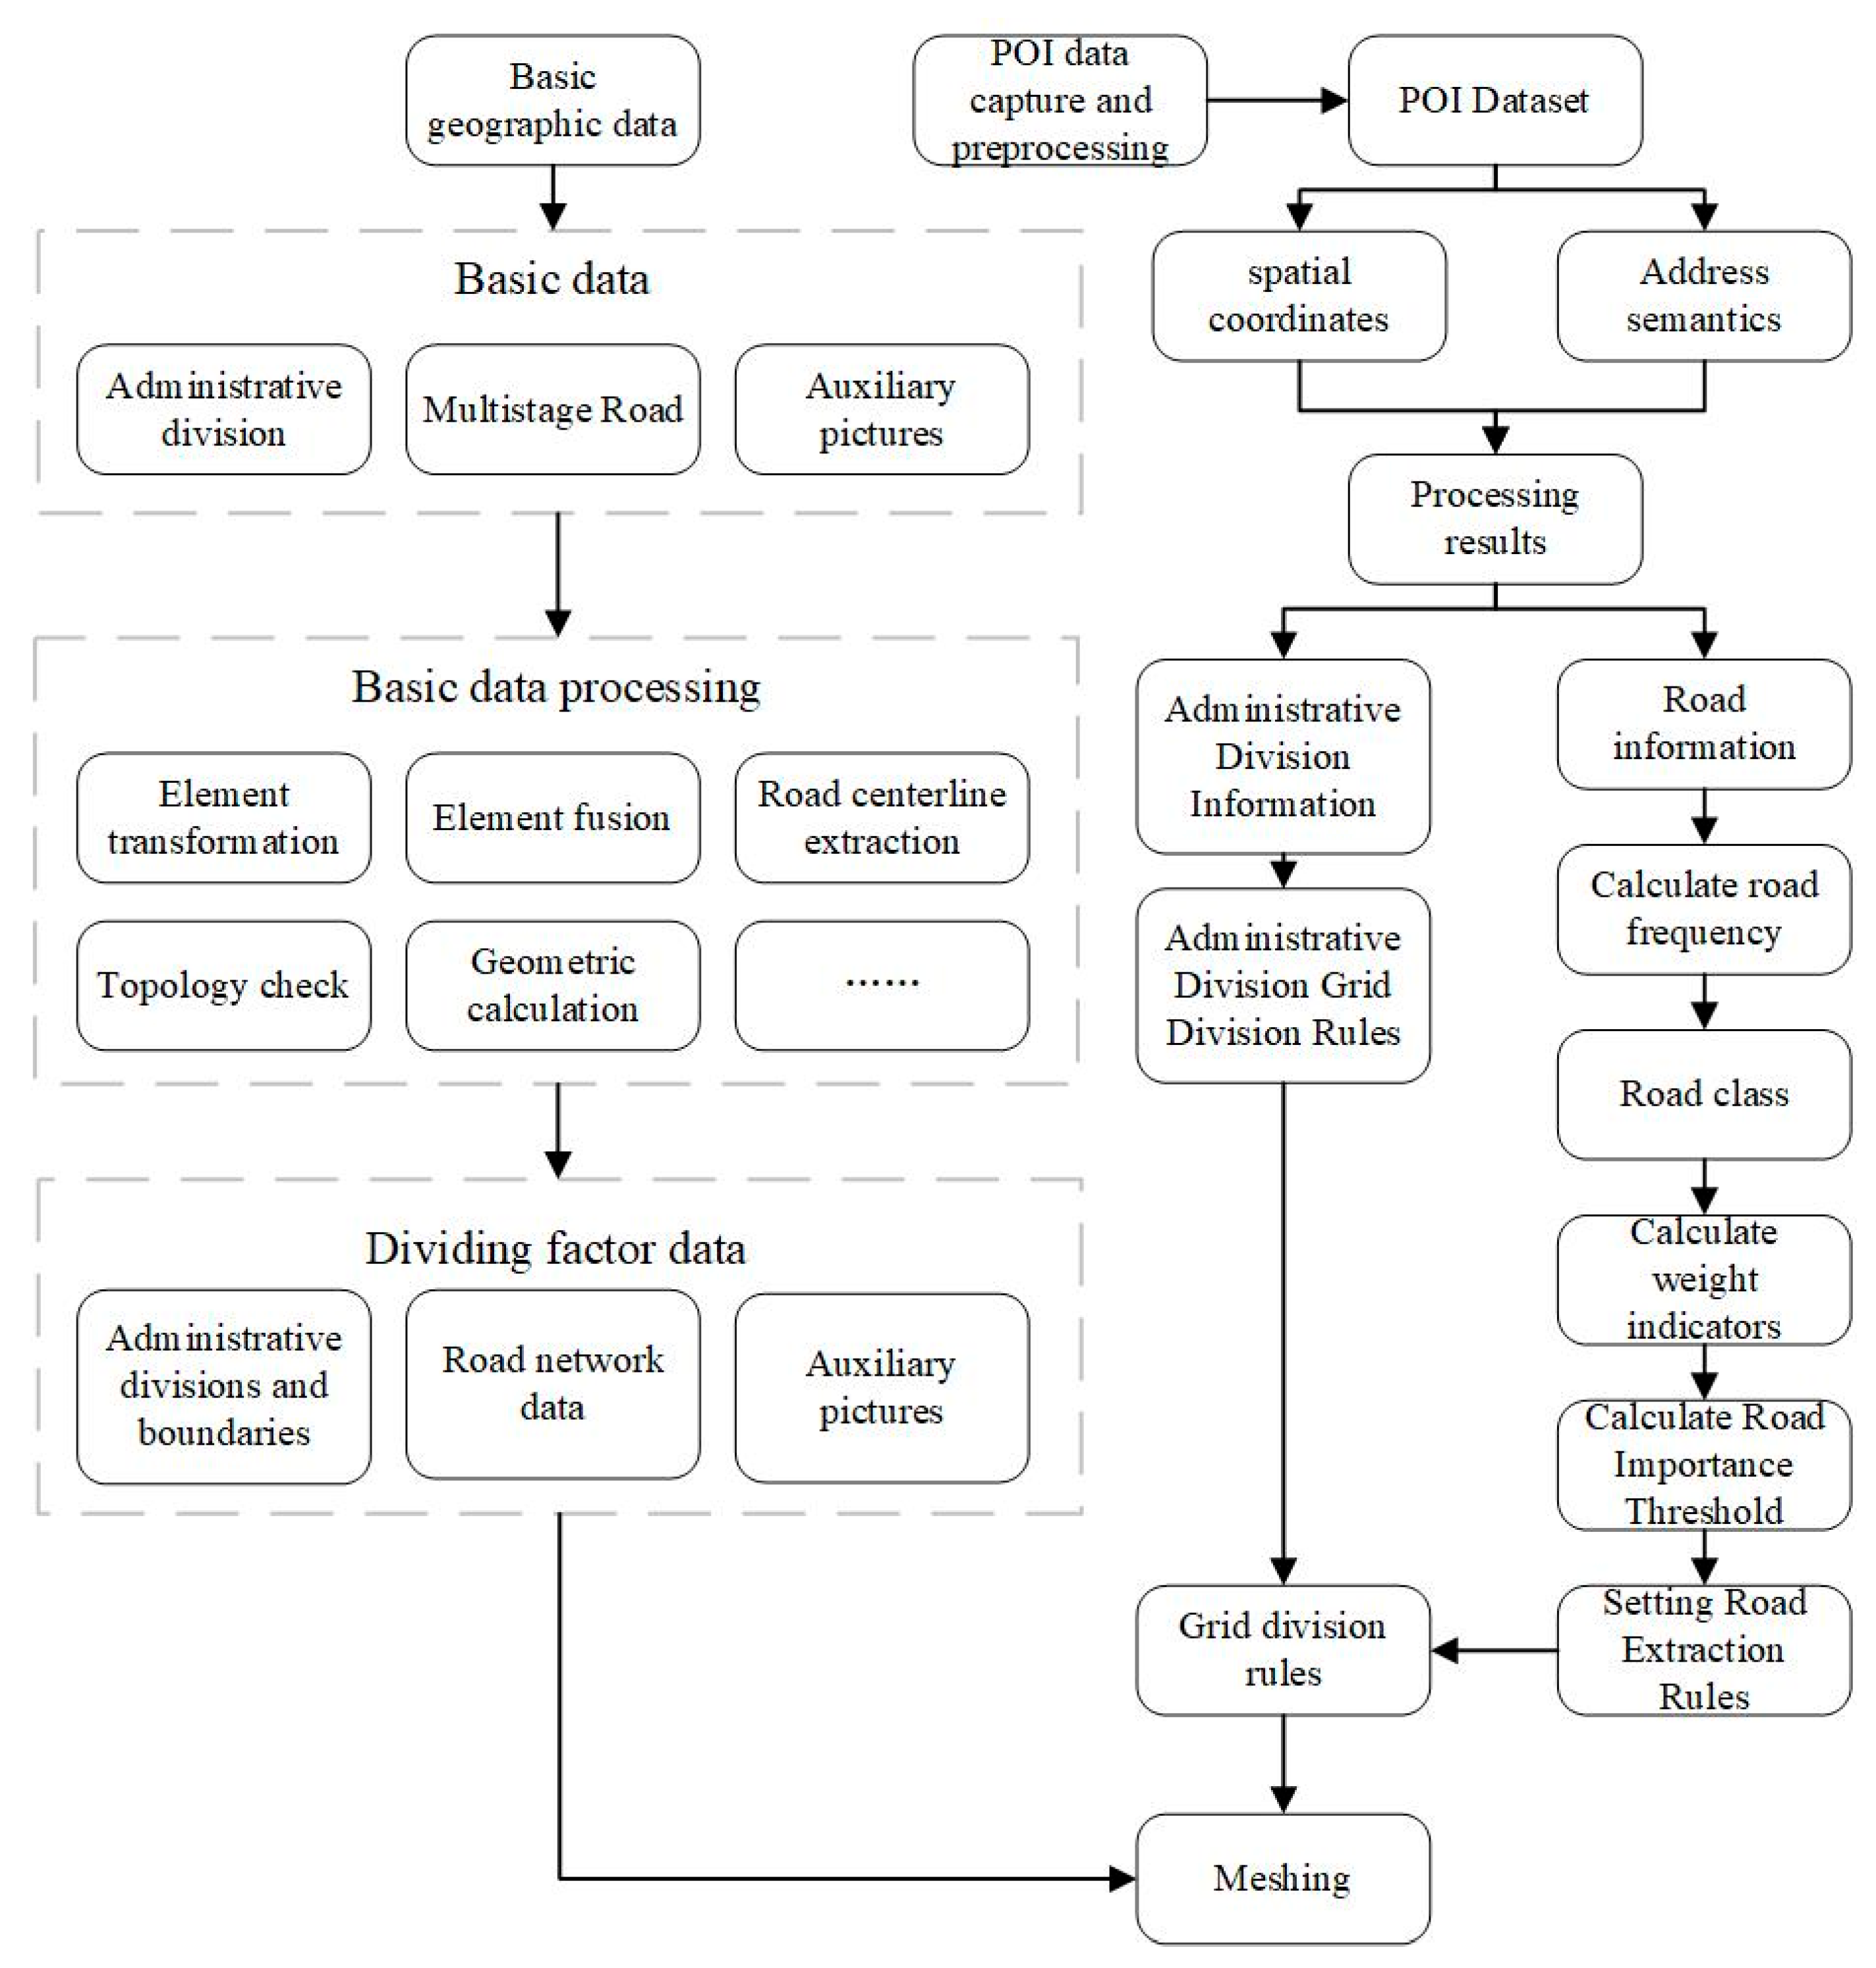
2.2.3. Urban Grid Division Model (UGDM)

In this study, we use an integrated modeling software developed by ourselves. It contains three functions: intelligent selection of urban roads, intelligent division of urban grids, and identification of urban functional areas. The model is based on big data (e.g., POI data). The integrated model is used in this study to be able to analyze the current state of the logistics industry within Zhengzhou from the perspective of the city grid.
Urban gridding often uses administrative districts as boundaries, but changes in scale can lead to uncertainty in the size of the grid. Roads are an essential element in urban development, and they have a profound impact on the development of urban forms and human activities. The road network of the city contains multiple layers of road levels, and different levels of roads show different operation status according to the road width, speed limit, and so on. Generally speaking, it is difficult to quantify the index parameters of the roads in the urban grid based on the original roads, and only the original level of the roads can be taken Into account, or the parameters can be set by manual intervention, which often neglects the importance of the roads in the physical space. The urban grid relies on roads as the skeleton; how to quantify the selection indexes of roads is an important issue of grid division. The focus of road selection contains two aspects: one is how many roads to select, and the other is which roads to select. The main elements involved in road selection include geometric features, semantic features, and administrative elements of roads. After analysis, the existing road selection methods have the following shortcomings: 1. When selecting roads, it is not possible to consider all the characteristics of the road, such as the traditional method of weight selection based on the grade of the road cannot quantify the indicators of the road; 2. It is not possible to closely link the road with the humanities, such as the roads in busy commercial districts are generally lower in grade, but the grid division of the road has a higher weight. Therefore, this paper uses POI data to calculate the spatial distribution characteristics of the method by resolving the specific coordinates of POIs around the road and then using the nearest distance method to match the POI points to the road to form an interconnection between POI data and road data, as shown in Figure 4.
In the specific model, this study sets the road feature indicators into 6 kinds: road length, road width, road grade, speed limit, traffic flow, and POI frequency. The six indicators not only contain the geometric characteristics of the road information but also have semantic and associative features, which can better reflect the importance of the road when the road indicators are weighted. Commonly used methods for index weighting include the entropy weight method, standard deviation method, and deviation maximization method. Among them, the entropy weight method is a comprehensive evaluation system designed based on information analysis theory and method, which is often used in the research of road selection. Referring to the planning rules for each grade of the road in the Urban Road Engineering Design Code (CJJ37-2012 [29], Urban Road Engineering Specification, Ministry of Housing and Urban Rural Development of the People’s Republic of China, 2012), this study presents an initial weight for the road, and then obtains the frequency number of POI points on each road by matching the spatial coordinates of the POI data with the road, standardizes the weight indicators to eliminate the errors generated by the large gap in the data, and finally employs entropy weighting to weight the indicators of the importance of the road. Finally, the entropy weighting method is used to weight the indicators of road importance. Therefore, this model establishes a weight calculation model based on multiple indicators of roads and finally outputs the importance (RI) value. The specific formula is as follows:
P R I = λ 1 · P R L + λ 2 · P R W + λ 3 · P R S + λ 4 · P R P + λ 5 · P F + λ 6 · P V
where P R I is the importance value of the road; the coefficients λ 1 ,   λ 2 ,   λ 3 ,   λ 4 ,   λ 5 ,   λ 6 are computed by the entropy weighting method, which indicates the weight of each index, and the other parameters are shown in Table 3. Among them, the semantic matching method is used to match the POI data to the exact road, and for the POI data with incomplete information, the POI data are matched to the corresponding road by the shortest path method, and finally calculate the frequency value of the road.
POI data is the newer spatial location description data, which not only contains the spatial information where the elements are located but also contains the information of human elements; the urban grid is a faceted urban space artificially divided according to set rules, which is the basis of the construction of the smart city, and it is also the carrier of the grid management. The application of the urban grid is also more widely involved in many aspects of urban operation. The natural entity elements and human entity elements of the urban space form a bond with the urban grid through the spatial location information of POI. The urban grid can be regarded as the carrier of the entity elements represented by POI data, and the relationship between the two can be expressed by the following formula:
U U L = i = 1 n   N i + i = 1 m   H i , U G L = i = 1 n   G i , U R L = i = 1 n   P i
where U UL denotes the complete space of the city, U GL denotes the grid space of the city, and U RL denotes the physical space of the city; N i and H i represent the natural and humanistic elements, respectively; G i   is the grid cell; and P i is the parcel expressed by POI. Therefore, the complete space of the city can be expressed by a combination of physical space, grid space, natural elements, human elements, and POI elements.
Due to the non-equilibrium distribution of spatial elements in the city, there is often no direct correlation between the point elements and the line elements of the roads. As in Figure 5b, roadway selection tends to have grid redundancy without considering entity elements. As shown in Figure 5c,d, the use of POI solid elements as an auxiliary index for road selection can reduce the redundancy generated by meshing and improve the quality of the grid. Therefore, the basic grid delineation is carried out by cutting the administrative district surface through the road network on the basis of the road data selected in the previous section. After the basic grid division is completed, the POI data are input as auxiliary elements, and the grid fusion at the next level is carried out according to the type and number of POIs, so as to achieve the purpose of streamlining the grid and eliminating redundancy, and the model parameters are shown in Table 4.
The grid delineation process (Figure 6) has the following three main steps:
  • Basic data preprocessing: POI data, OSM road network data, administrative district data, and human element data are the basic data for grid delineation. Data preprocessing is the key part of the model. Among them, POI data mainly removes redundancy, and OSM road network data mainly deals with broken roads and so on.
  • Road extraction: Taking six indexes of road grade, road frequency value, road length and width, road traffic flow, and road speed limit as the basis, the importance degree of the road is obtained by calculating the weights of the indexes.
  • Grid division: Input the produced basic data and adjust the model parameters to realize grid division and grid optimization.

2.2.4. GeoDetector (GD)

GeoDetector is a statistical method used for detecting the consistency of spatial distribution patterns between dependent and independent variables based on the geospatial divergence theory. The GeoDetector model contains four detection modules: factor, interaction, risk, and ecological detection. The factor detection module is used to examine the effect of the independent variable on the dependent variable as follows:
q = 1 h = 1 1 N h σ h 2 N σ 2 = 1 S S W S S T S S W = h = 1 L N h σ h 2 , S S T = N σ 2 ,
where h = 1, …, n; L is the strata of variable Y or factor X, which is the classification or partitioning; N h and N are the h and full area of the number of cells; σ h 2 and σ 2 are the variance of the h and Y-values, respectively; SSW and SST are the “within sum of squares” and “total sum of squares”; and the value range of q is [0,1].

2.2.5. Geographically Weighted Regression (GWR)

Dependent and independent variables were selected. In this study, the number of logistics enterprises in each study unit in Zhengzhou City was taken as the dependent variable, and the independent variables were grouped into four categories: economic factors, traffic factors, social factors, and enterprise agglomeration factors (Table 5), and results shown in Figure A1, Figure A2, Figure A3 and Figure A4. The economic factors include GDP per capita; the social factors include population density and number of settlements and land rent; the traffic factors refer to the distribution density of roads and the number of public transportation facilities within each unit; and the agglomeration factors refer to the number of enterprises, markets, industrial parks, and office buildings clustered within the unit. The agglomeration economy affects the location choice of enterprises. Here, the number of various types of enterprises in Zhengzhou City in 2020 is used as the basis to test the influence of industrial agglomeration on the location choice of enterprises.
GWR model construction. Let the geocentric coordinates of the i cell be u i , v i . According to the selected influencing factors and their parameter settings, the GWR model is constructed as follows:
Y = β 0 u i , v i + j = 1 k   β 1 u i , v i x i j ( a g g l o m e r a t i o n ) + j = 1 k   β 2 u i , v i x i j ( i n c o m e ) + j = 1 k   β 3 u i , v i x i j ( r o a d d e n t i s i t y ) + j = 1 k   β 4 u i , v i x i j ( p r o p o r t i o n ) + ε i
where: ( u i , v i ) is the geocentric coordinates of the i th sample spatial cell; β k u i , v i is the value of the continuous function β k u , v in the i sample spatial cell.

3. Results

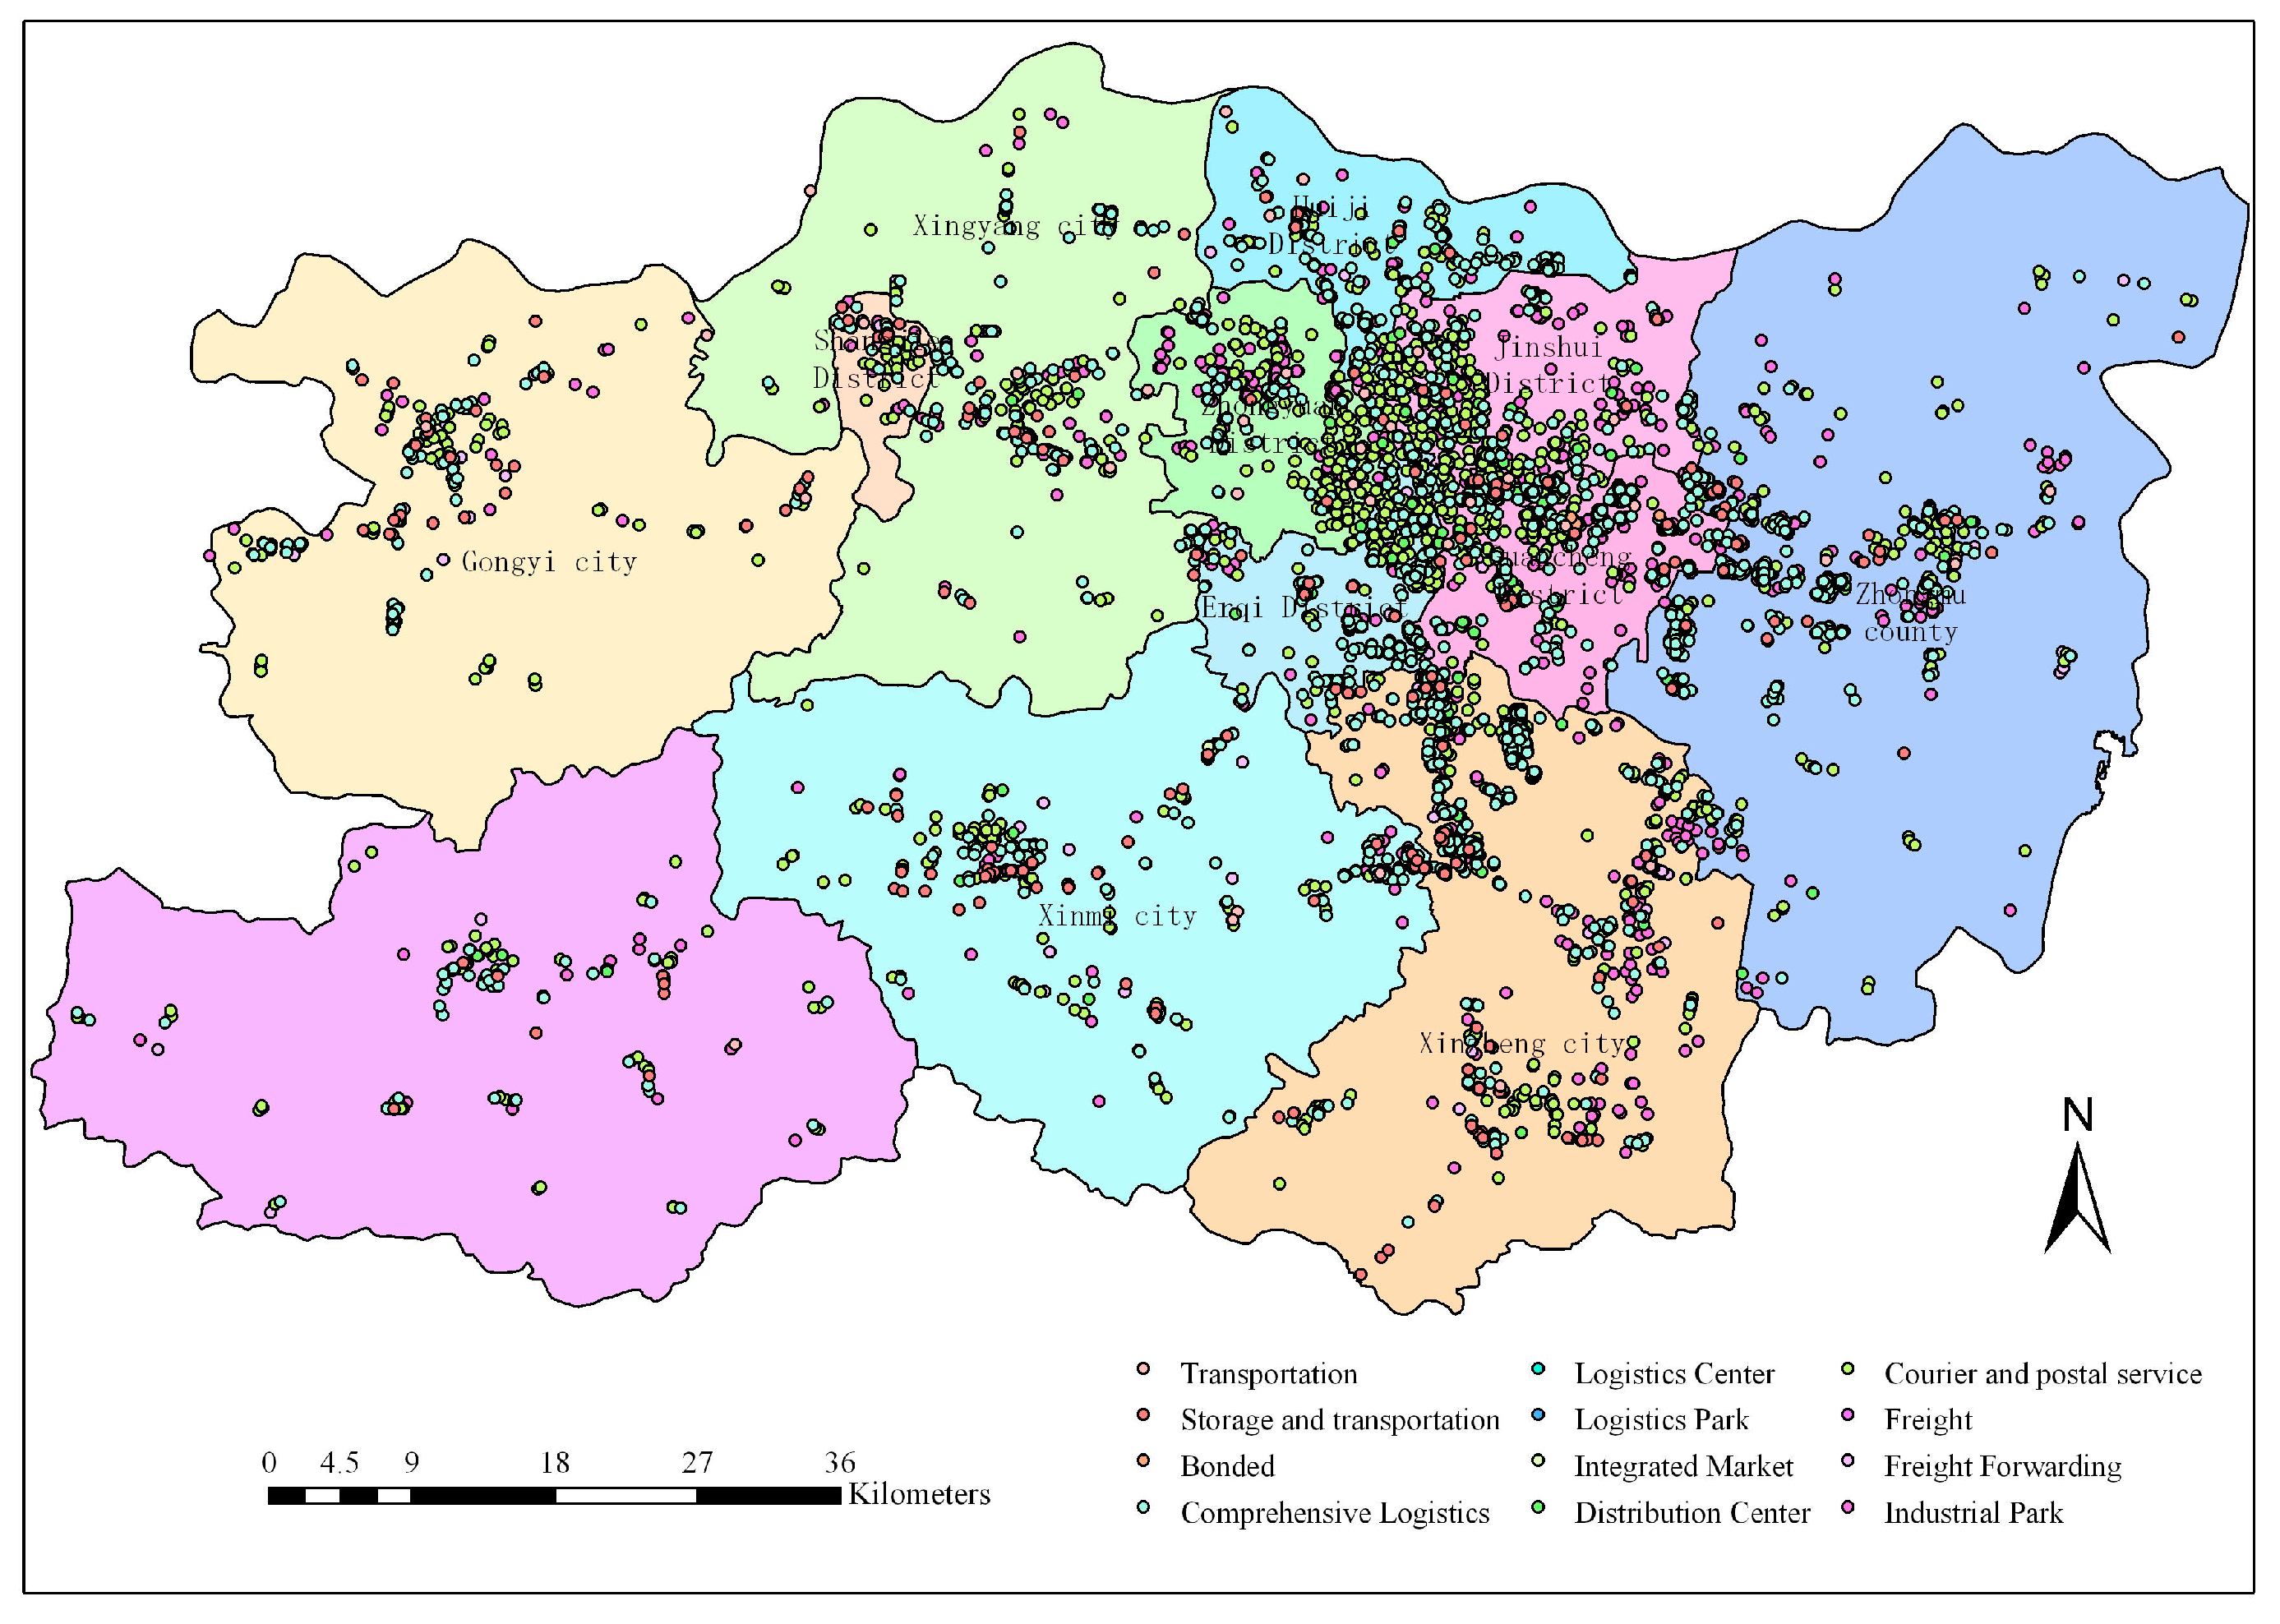
3.1. Spatial Location Characteristics of Logistics in Zhengzhou

Based on the logistics POI data of Zhengzhou and the employment population data of transportation, storage, and postal industries in the Statistical Yearbook of Henan Province from 2012 to 2019, the reference values of the concentration degree of the logistics industry in Zhengzhou were calculated (Table 6).
The LQ and HCLQ values calculated from the 2012–2019 data show that the agglomeration level of the logistics industry in Zhengzhou was below the national average level in 2012. From the spatial pattern (Figure 7), the agglomeration level in the central city of Zhengzhou was relatively high in 2012, showing a spatial layout with four areas of Zhongyuan District, Jinshui District, Erqi District, and Guancheng District as the core. The logistics industry in this period was mainly clustered by the railroads in the city center as the core, and the periphery of Zhengzhou, county, and township areas did not form a large-scale agglomeration, and the logistics industry was still in the early stages of accelerated development. The government’s planning of the logistics industry has not yet taken shape in this period, and the autonomy of logistics enterprises and node location selection is strong; in 2015, the logistics layout shifted from the original four regions in the city center to the south, and the distribution pattern of multiple core concentrations appeared. The opening of the Zhengmin Expressway made the logistics industry form a new core dominated by highways, while the spatial scope of the overall industrial layout also expanded, indicating that with the rise of e-commerce, the railroad freight-oriented mode can no longer meet the diversified needs of the logistics industry, and the road-oriented LE and LN guided by government planning have stronger flexibility and professionalism in logistics activities and the initial formation of the industrial structure of logistics. In 2017, the logistics industry regrouped in the four urban areas of the city center, showing “multiple small”; this indicates that the focus of the industry has shifted from blind expansion to reasonable adjustment of industrial structure in this period, and logistics enterprises have realized specialized market segmentation by changing asset ratios, forming specialized logistics industry clusters in different functional urban areas during 2017–2020, with the completion of the planning of the logistics industry in the area around Xinzheng Airport. The area of the logistics industry land in the study area expands rapidly, the agglomeration phenomenon is obvious, and the overall layout of the logistics industry is basically completed. Two more obvious agglomeration centers appeared in Zhengzhou City during this period, one is the two small core areas formed around Erqi District and Guancheng District, and the other is near Xinzheng Airport at the junction of Erqi District and Xinzheng City. Meanwhile, the spatial clustering trend of the logistics industry also appears in the area adjacent to Xinzheng in Zhongmu County. The results show that logistics enterprises are more obviously clustered in the downtown area because logistics enterprises are mostly oriented to service functions, and it is more conducive to the development of logistics activities in more densely populated and commercial areas; the logistics park located west of Xinzheng Airport has convenient transportation advantages, and it is adjacent to Beijing-Hong Kong-Macao Expressway, Zheng-Min Expressway, Zheng-Luan Expressway and Shang-Deng Expressway, which is a more ideal place for the logistics industry to cluster; the logistics park located in Zhongmu County adjacent to Xinzheng also has an obvious trend of concentration, which is adjacent to Zhengmin Expressway and Beijing-Hong Kong-Macao Expressway and is an extension of the land expansion during the rapid development of the logistics park industry in Xinzheng Airport. The industrial layout changes slightly, among which the main change points focus on the shift of the center of gravity of the industrial layout. The agglomeration core of Erqi District and Guancheng District has started to shift to Xinzheng Airport Logistics Park, indicating that the logistics industry structure in the area is in the adjustment stage. After several years of development, the spatial layout of the logistics industry with downtown Zhengzhou and Xinzheng Airport Logistics Park as the core has been completed, and the spatial agglomeration of logistics in marginal cities and towns is still not obvious. Through the HCLQ value, we can understand the industrial structure level of the region; from 2012 to 2018, the HCLQ is negative, compared with the industrial spatial pattern, indicating that the number of logistics enterprises in Zhengzhou is large and does not form a monopoly of large enterprises, and the employees of logistics are relatively scattered. The 2019 Zhengzhou logistics industry has undergone significant changes. According to the official statistics, the employees of the logistics industry The significant increase is probably related to the explosive growth of e-commerce that has driven the demand for the logistics industry. Compared with LQ and HCLQ, the spatial pattern of logistics clusters characterized by LED is more intuitive, and the Guancheng District, Zhongmu County, and Xinzheng Airport area have the necessary conditions for spatial agglomeration, such as convenient transportation, large logistics throughput, and large industrial investment, and the logistics industry has a strong ability to gather employees. The 2019 logistics industry concentration level in Zhengzhou has far exceeded the national average, and the number of regional employees reached 12% of the total number of employed persons. The concentration of employees has been significantly improved.
The POI data of Zhengzhou City in 2021 were aggregated by partition and divided into two categories: logistics enterprises and logistics nodes (Figure 8). The results show that Zhongmu County, Guancheng District, Jinshui District, and Xinzheng City account for 70.52% of the number of logistics nodes and 57.61% of the number of logistics enterprises, with significant synergistic clustering. Among them, the adjacent areas of Zhongmu County and Xinzheng City, as the layout of highways, railroads, airports, and freight yards, logistics nodes accounted for 23.40% and 16.41%, respectively, indicating that under the new economic model, the areas with transportation and land price advantages at the edge of urban development are important areas for logistics industry clustering. Influenced by the transfer of logistics clustering core and lot costs, Jinshui District is the location choice for logistics enterprises. The attractiveness of Jinshui District is gradually weakening, and the proportion of logistics nodes is only 9.12%. Zhongmu County and Xinzheng City are the neighboring parts of the new city in the east of Zhengzhou City and the layout of the new airport area, respectively, while Guancheng District is the intersection area connected with Zhongmu County and Xinzheng City, and the area has natural road, railroad and air traffic advantages and lower land price advantages, reflecting the sensitivity of logistics enterprises to traffic and cost; as the edge of the central city. The three county-level cities of Dengfeng, Gongyi, and Xinmi account for 1.82%, 1.52%, and 5.17%, respectively, which shows that the cities as the radiation zone around the central city are not strongly dependent on the logistics nodes and are still mainly transported by the central city for logistics resources. Xingyang City and Shangdi District are adjacent to Shangjie Airport, but since Shangjie Airport is not a node of civil air logistics transportation, they account for a lower percentage, 3.65% and 1.52%, respectively; Zhongyuan District, Erqi District, and Huijie District, 3.34%, 5.78%, and 6.69%, respectively, are average.
The results show that the LGC value of the study area is 0.3703 and the HHI value is 0.1724, indicating that the concentration of the logistics industry in Zhengzhou is not high and the mobility of personnel is low, but the industry income is reasonable, and no monopoly of large enterprises has been formed. However, the layout of LE and LN shows a high degree of similarity. In the process of industrial agglomeration, LE and LN are inseparable as supporting facilities for each other. Among them, Guancheng District, Xinzheng City, and Zhongmu County have a high degree of POI aggregation, and there is a strong synergy and adaptability between logistics enterprises and nodes.

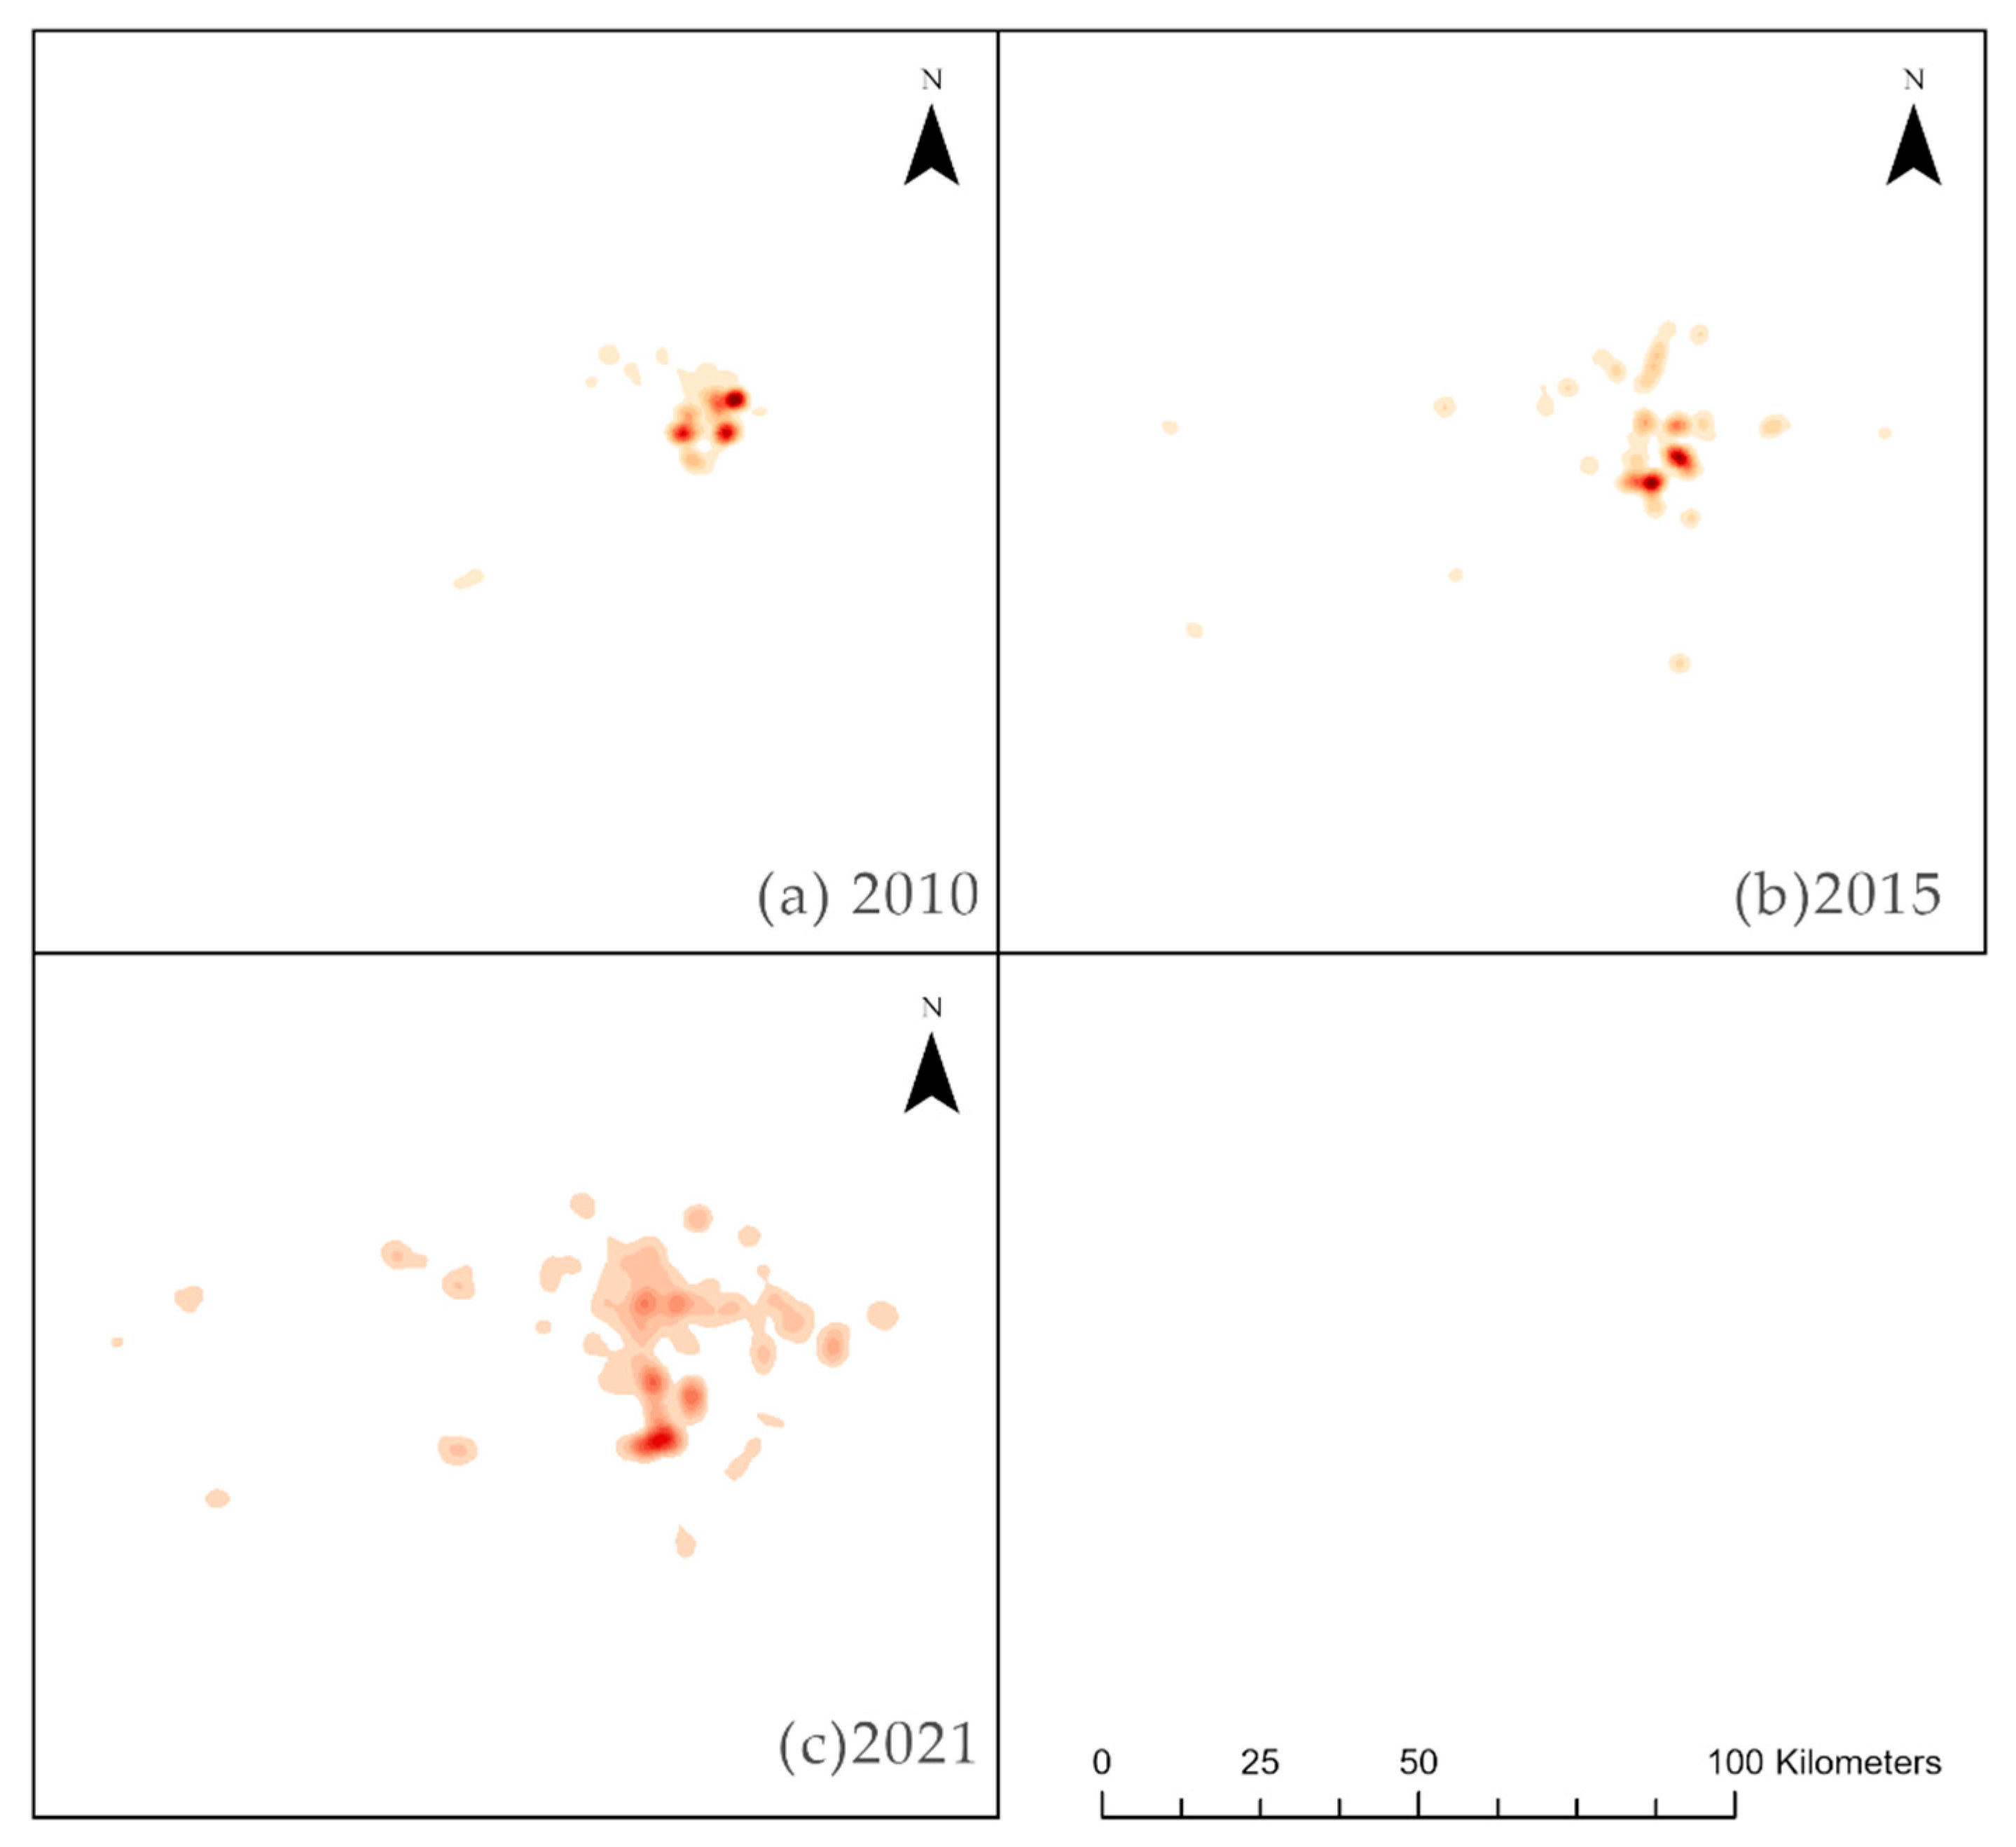
3.2. Spatial Evolutionary Characteristics of Logistics Enterprises

In 2010, the ellipse area covered a relatively small area, mainly including Erqi district, Jinshui district, Zhongyuan district, Guancheng district, and parts of Xingyang city and Xinmi city, with POIs showing an overall southwest-northeast spatial distribution state and spatial clustering. In 2015, the area of the standard deviation ellipse expanded significantly, mainly in the southern area of Xingyang City, the northern area of Xinmi City, the western area of Zhongmou County, and the northern area of Xinzheng City, with a west-east distribution in space. In 2021, the area of the standard deviation ellipse does not change much, but the center point of the ellipse begins to shift to the southeast. Between 2010 and 2015, the long-axis standard deviation increased from 0.24 km to 0.33 km, indicating that the directional characteristics of the spatial distribution of logistics POIs are becoming more and more obvious. The standard deviation of the short axis increased from 0.12 km to 0.18 km, indicating that the distribution range of logistics POIs is expanding year by year.
Figure 9 and Figure 10 show the elliptical distribution of the standard deviation for all different types of POIs. Traditional logistics enterprises (Figure 10a): between 2010 and 2015, the short axis distance increased by 0.020 km, the long axis distance increased by 0.032 km, the angle shifted from 80° to 85°, and the center point shifted to the northeast direction. During this period, the distribution of traditional logistics enterprises expands, the distribution direction tends to be closer to the west-east distribution, and the center point tends to be closer to the railroad freight center. Between 2015 and 2021, the short axis distance increased by 0.034 km, the long axis distance increased by 0.051 km, the distribution angle shifts to 88°, and the center point shifts to the south more significantly. During this period, the distribution range of traditional logistics enterprises further expands, the distribution direction further tends to west-east distribution, and the center point shifts from the railroad freight center to the southern airports. The change in spatial distribution of traditional logistics enterprises reflects the importance of airports in modern logistics, and air transport has a higher timeliness compared with rail transport and road transport.
Courier-type enterprises (Figure 10b): between 2010 and 2015, the short-axis distance increased by 0.035 km, the long-axis distance increased by 0.277 km, the angle shifted from 90.6° to 88.7°, and the center point shifted from near the railroad freight station to the southwest. During this period, the distribution of traditional logistics enterprises expands, the distribution direction shifts to the southwest, and the center point starts to move away from the railway freight center and tends to be closer to the areas where road freight is more convenient. Between 2015 and 2021, the short-axis distance does not change significantly, the long-axis distance decreases by 0.012 km, the distribution angle shifts to 83°, and the center point moves slightly to the southeast. During this period, the distribution range of express-type logistics enterprises is slightly increased, and the distribution direction is further shifted to the southwest. The change of the spatial distribution of express logistics enterprises reflects the current situation that the operation of logistics enterprises whose main service targets are individual users rely more on road transportation under the background of rapid development of e-commerce. Compared with railroad transportation and air transportation, road transportation has better flexibility and relatively lower transportation cost.
Logistics nodes (Figure 10c–f): between 2010 and 2021, the overall distribution direction of freight yards changed from southwest-northeast to northwest-southeast, and the location of the central point shifted to the central railroad freight point, indicating that railroad and road freight yards are still the main mode of logistics transportation. Logistics parks were highly clustered in 2010, mainly distributed in Erqi District and Guancheng District, and with the development of modern logistics, the center point shifted to the Xinzheng Airport area and between airport-affiliated Putian Logistics Park by 2021, with a distribution angle of 30.9°. It indicates that after 2010, with the implementation of the Development Plan of Modern Logistics Industry in Henan Province (2010–2015), the location of logistics parks was influenced by government planning. Logistics centers and distribution centers show similar spatial layout changes, both gradually moving from railroad stations near the city center to the southeastern city periphery. In general, logistics nodes other than freight yards show a trend of migration to the periphery of the city.
Based on the division results in Table 3, a core density analysis of Zhengzhou POI is conducted (Figure 11), which shows that the logistics industry in Zhengzhou is generally based on a spatial agglomeration pattern with the core area of the big city and the airport area with transportation advantages as the core. Among them: logistics nodes are mainly distributed in the surrounding areas, mainly in Xinzheng Airport in southeastern Zhengzhou; the area from Guancheng District to Zhongmu County in eastern Zhengzhou; and the junction area of Zhongyuan District, Jinshui District, and Erqi District in the city center. Compared to the logistics nodes, the spatial clustering of logistics enterprises is more obvious, and they are mainly distributed in the five areas of the Zhongyuan district in Zhongyuan District, Jinshui District, Guancheng District, Zhongmu County, and Xinzheng Airport. The construction of logistics-related facilities is more comprehensive, covering a wider area than LE and LN, mainly concentrated in the vicinity of the first two, and showing consistency with the gathering areas of LE and LN. Some scholars have found the same trend of spatial clustering of logistics in other metropolitan areas in China [18,21]. In general, logistics enterprises, logistics nodes, and logistics-related facilities in Zhengzhou City are spatially clustered in a layout dominated by transportation elements such as railroads, highways, and airports.

3.3. Location Selection Behavior and Driving Forces

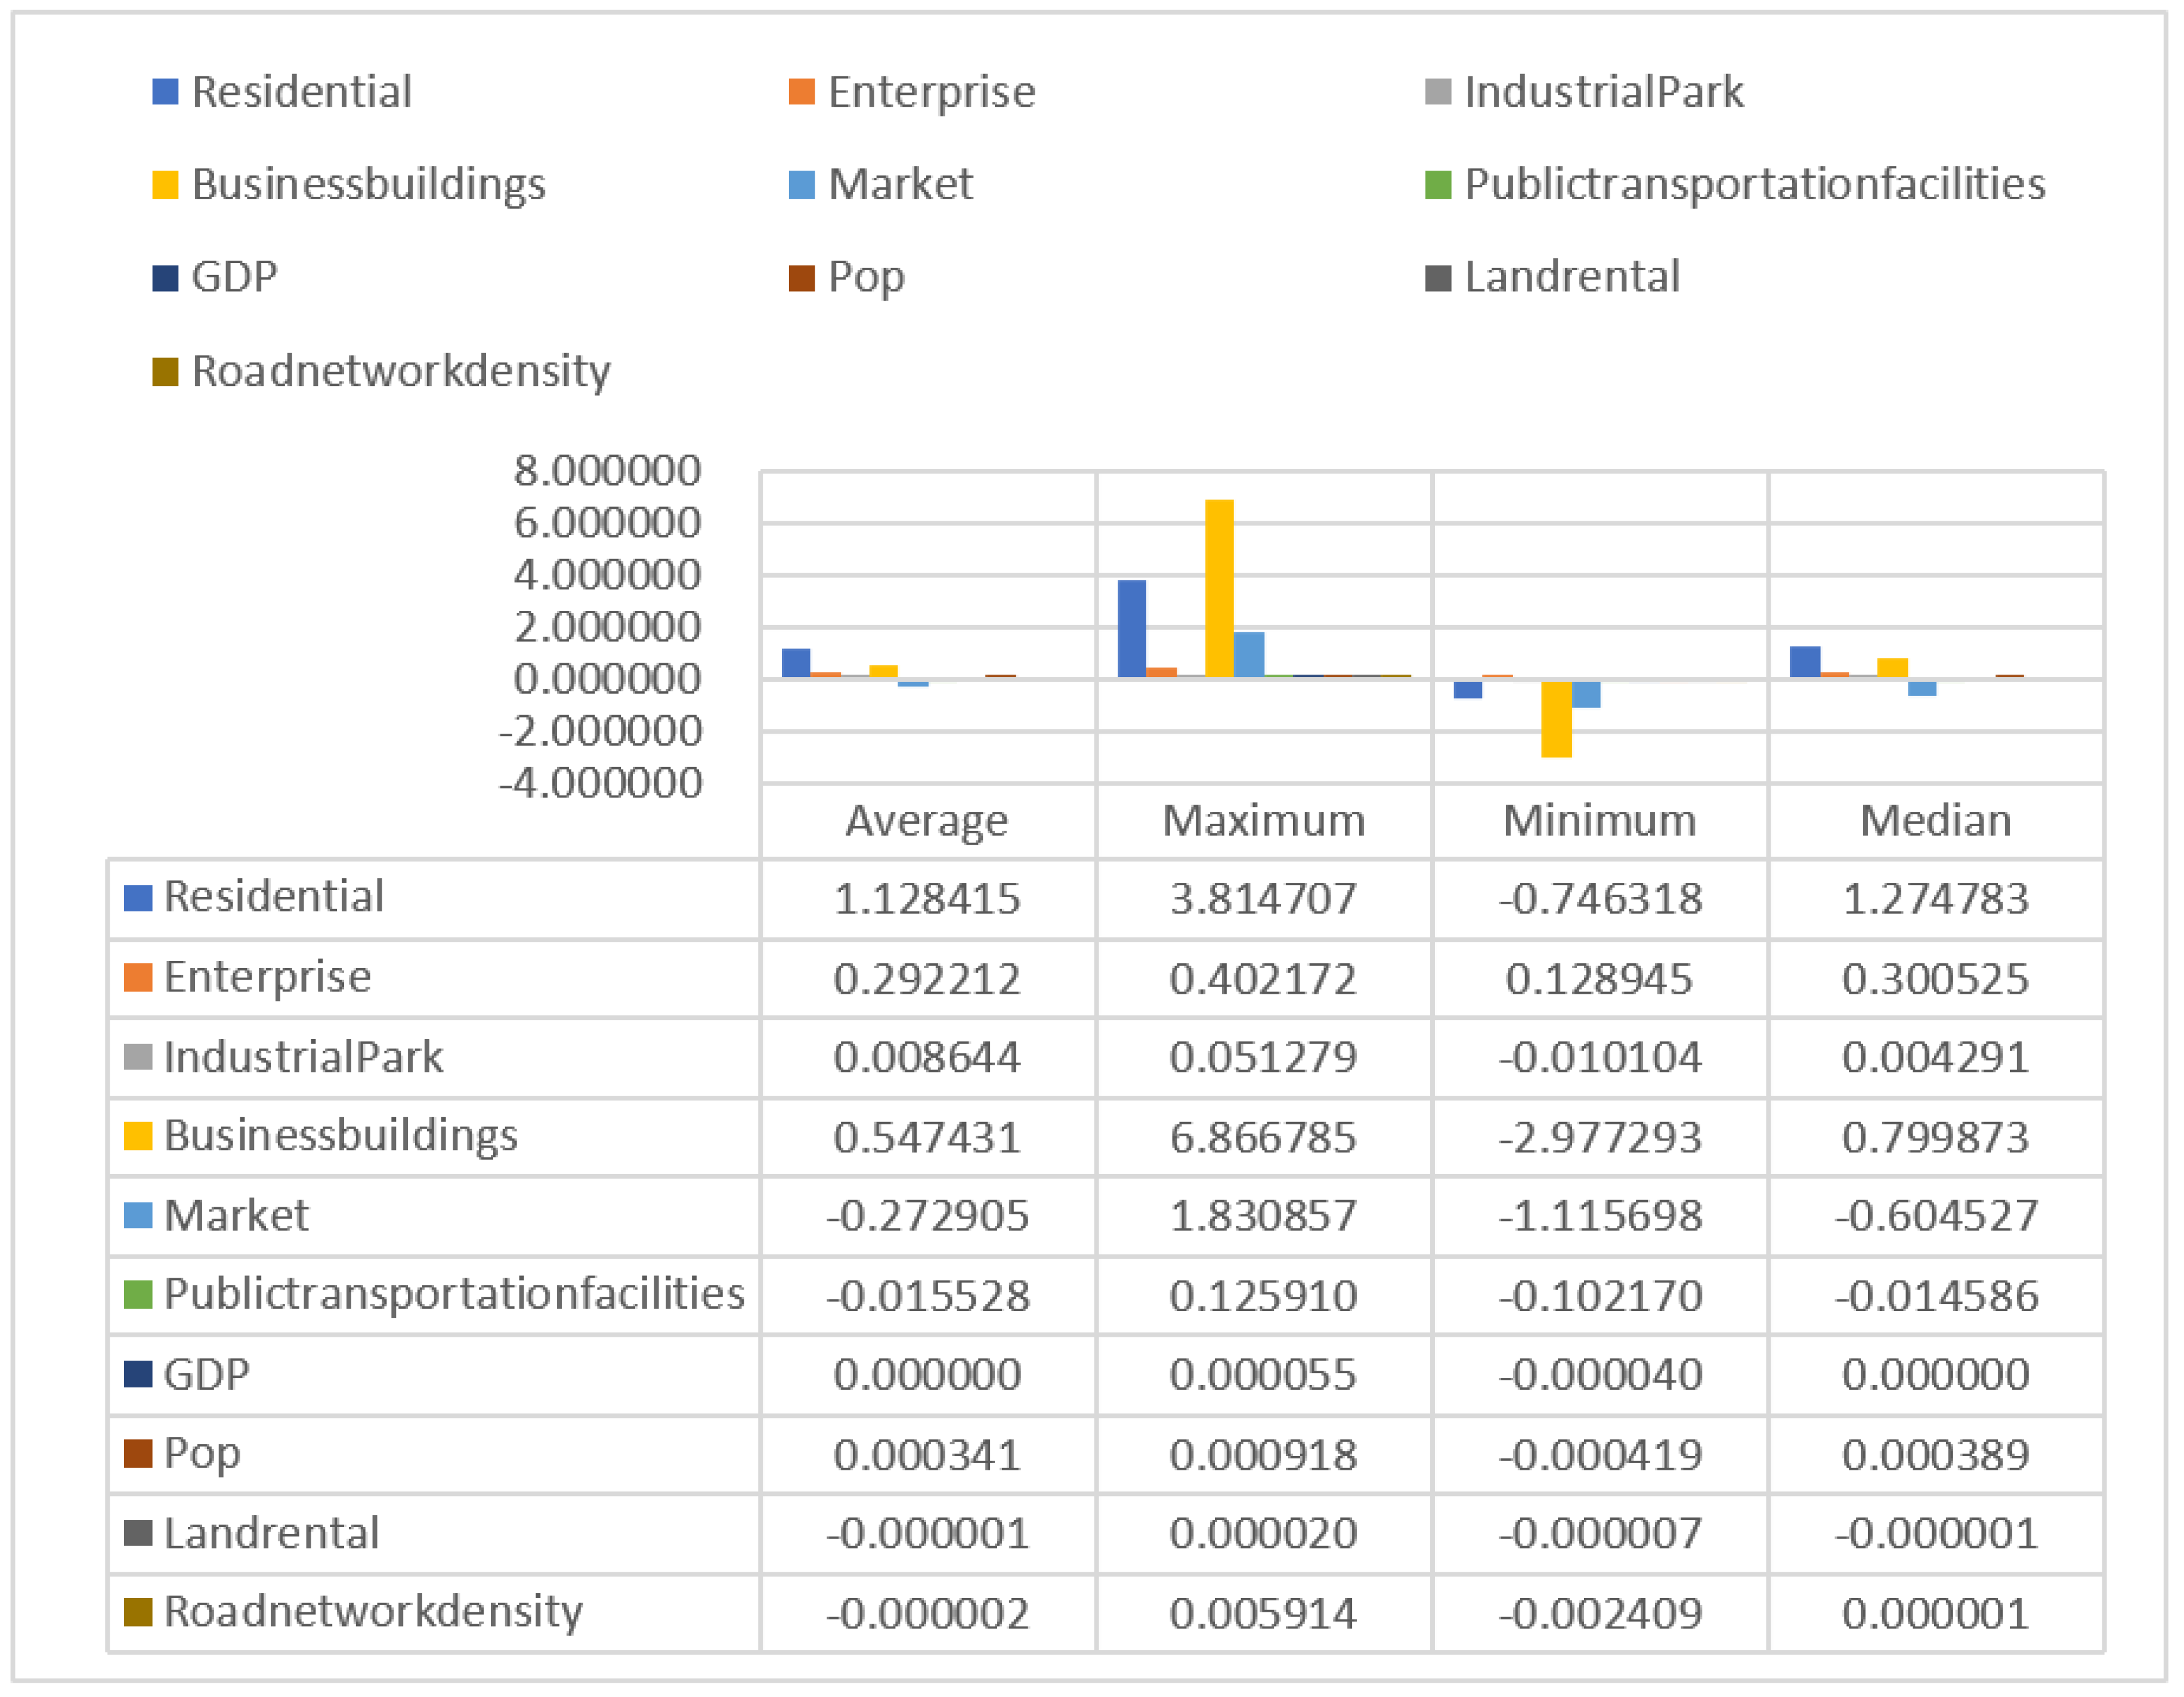
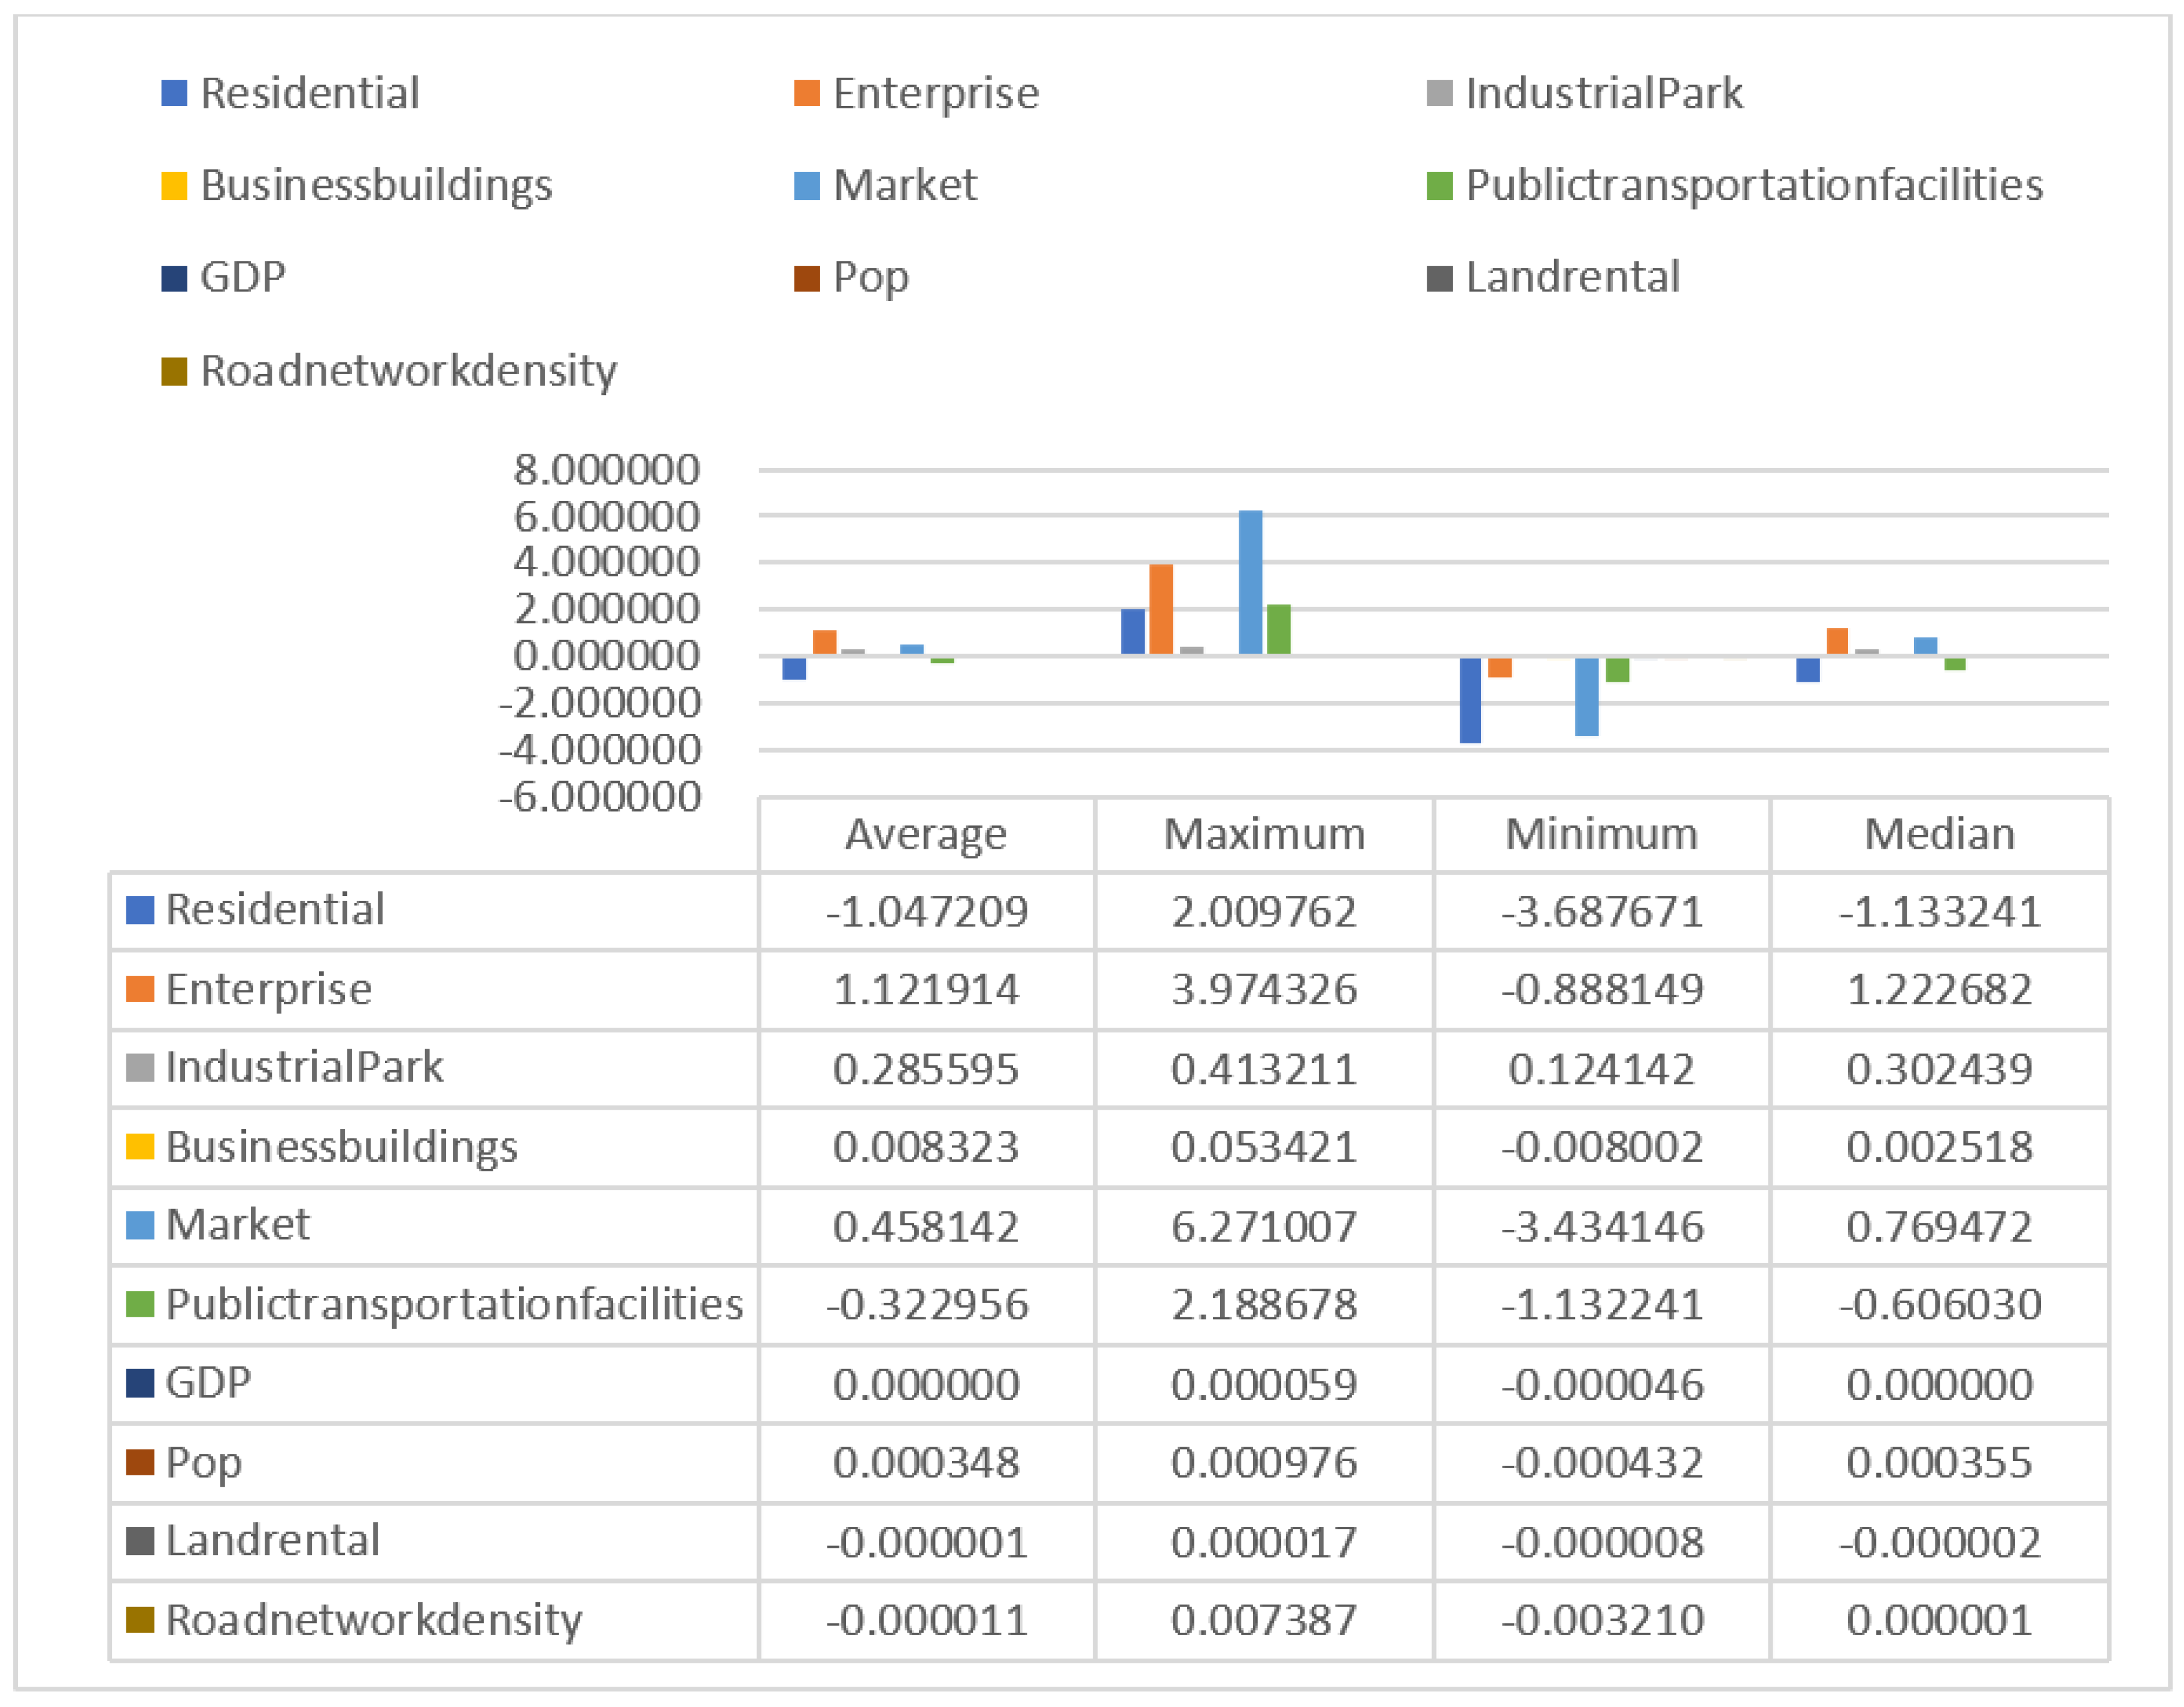
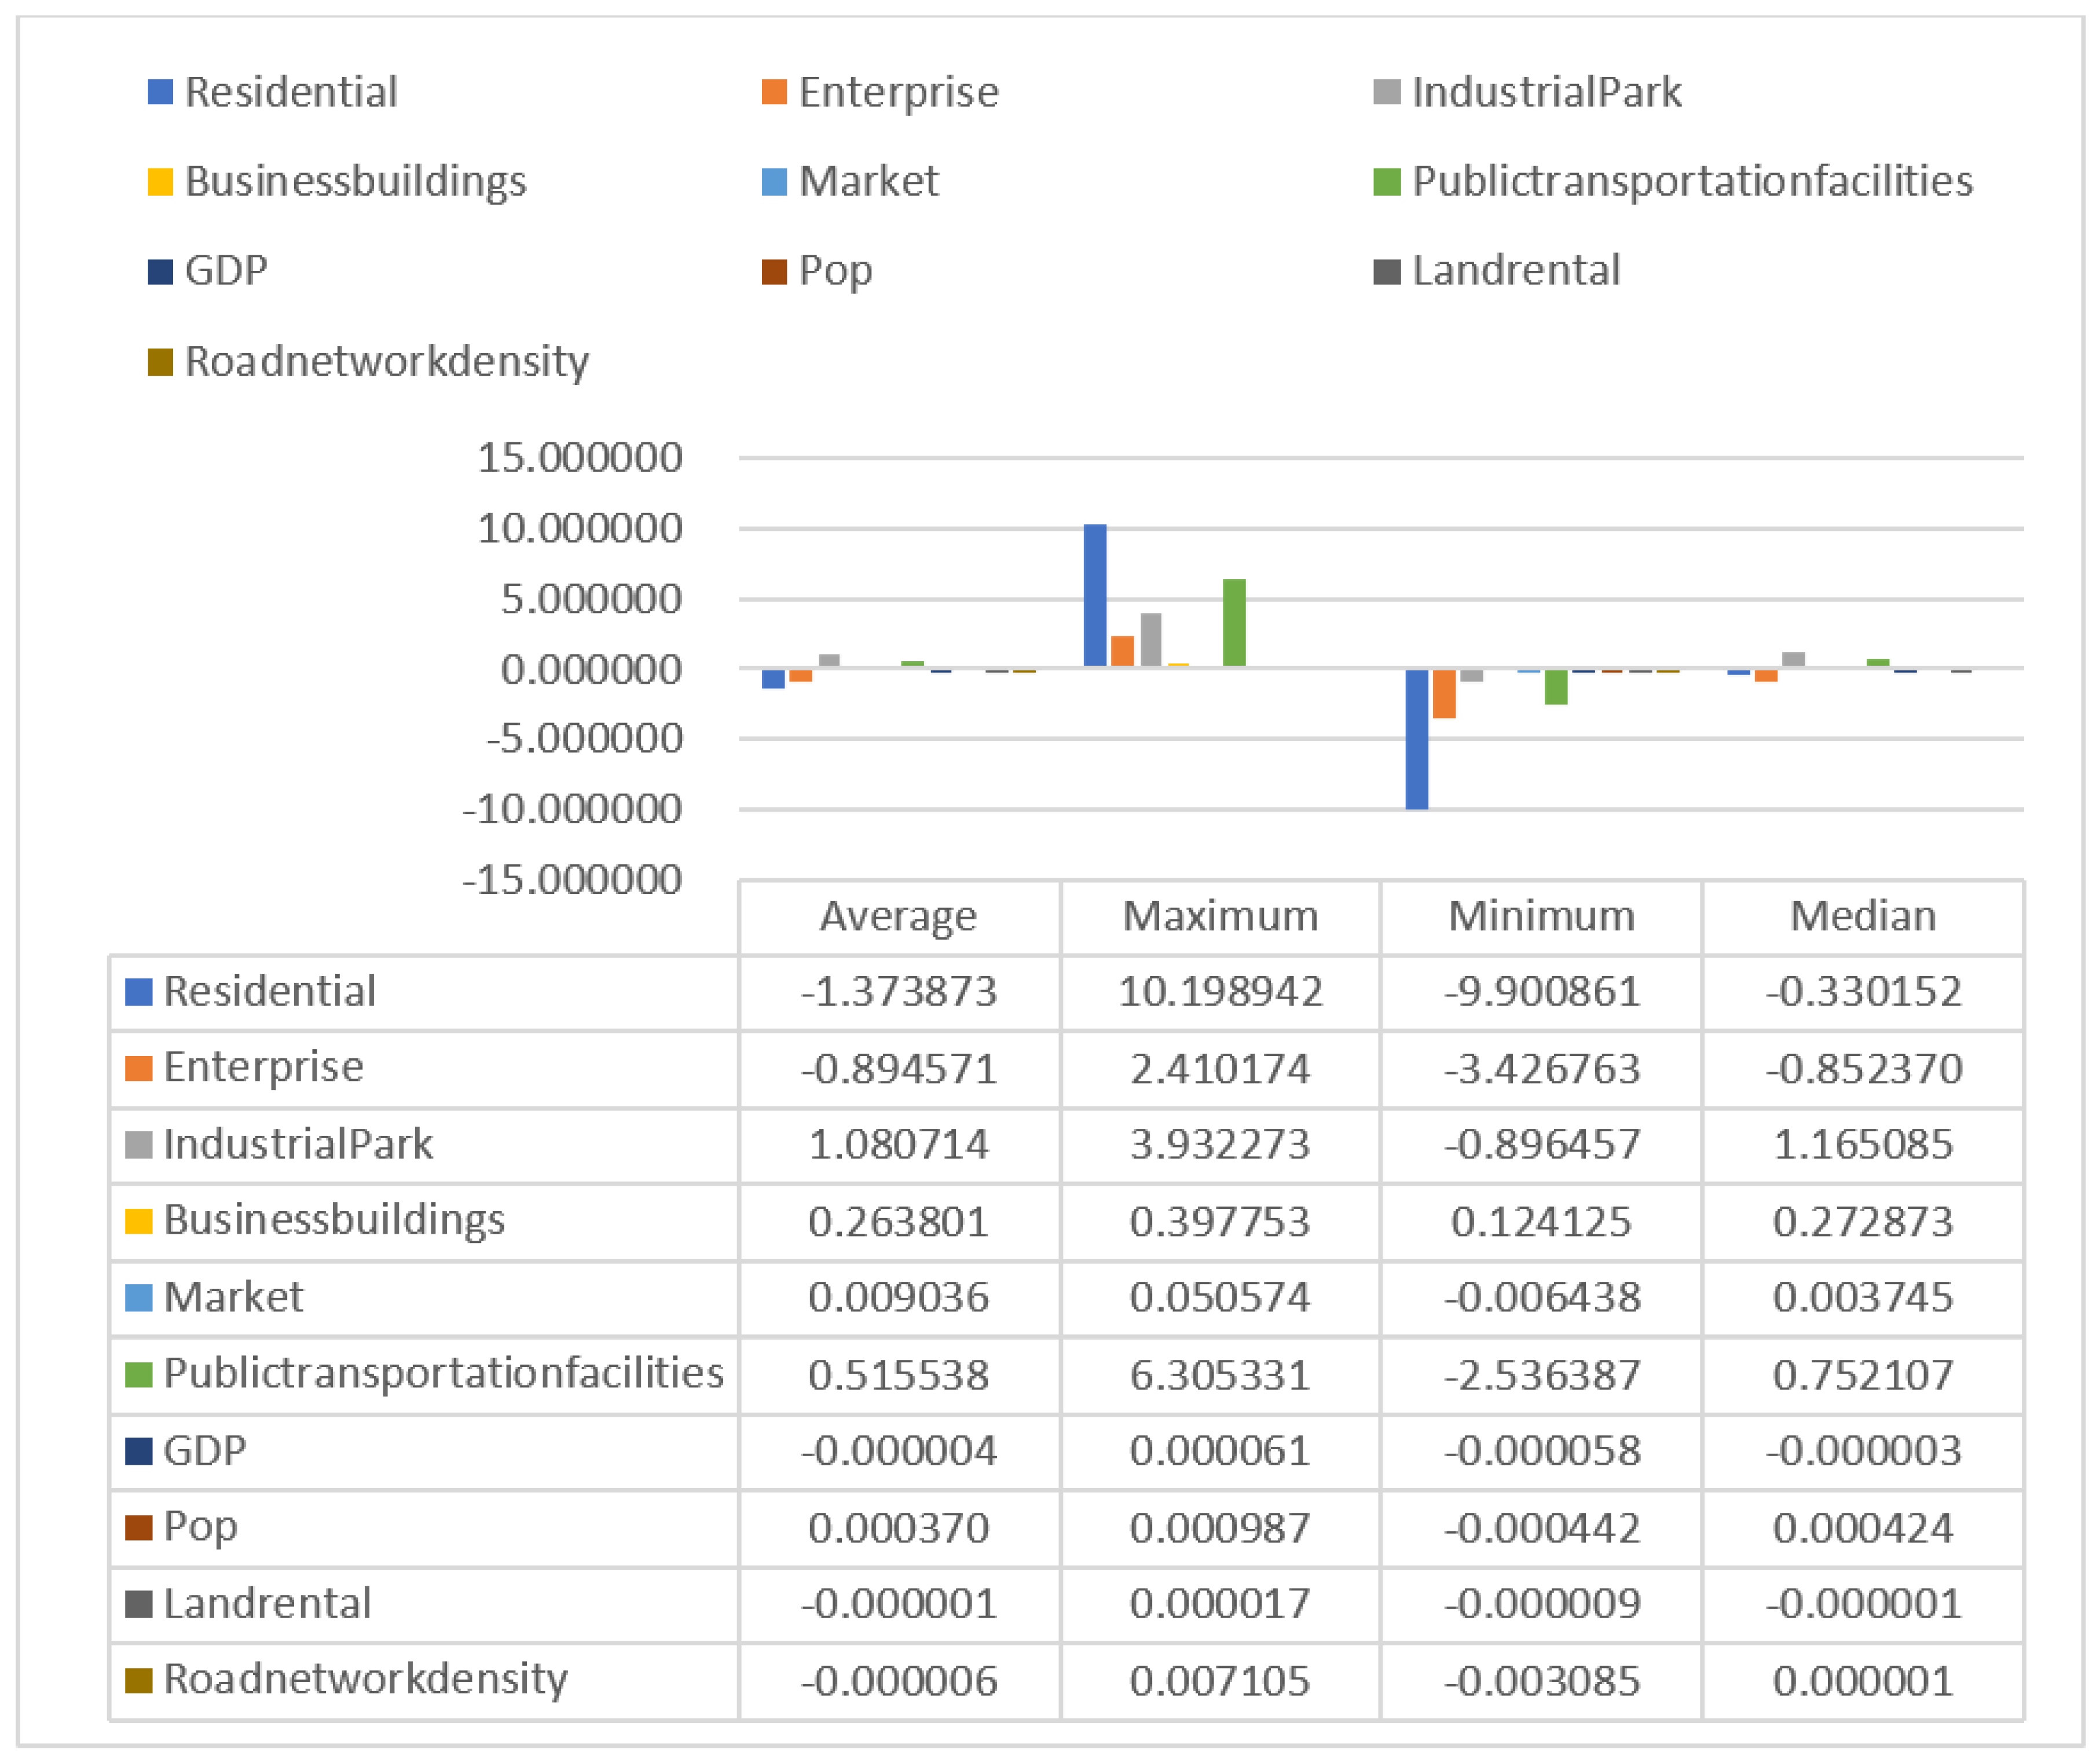
3.3.1. Impact Factor

The spatial agglomeration of logistics industry chain-related enterprises will have an important impact on the spatial distribution of logistics enterprises. As can be seen from Figure 12, the distribution of express-type enterprises is mainly influenced most by the related industry chain enterprises, followed by the number of industrial parks and residential areas as well as the population density. The traditional logistics enterprises are mainly influenced by the trade market, public transportation facilities, and population density the most. This is because the service targets of traditional logistics enterprises are mainly medium and large enterprises and markets, which have a big difference from the courier-type enterprises that mainly serve individual users and small and medium-sized enterprises. Logistics nodes are mainly influenced by the trade market, and logistics parks in logistics nodes are also more sensitive to the number of residential locations and public transportation facilities, and less sensitive to population density.
It can be seen that the spatial pattern of the logistics industry in Zhengzhou is not determined by a single factor but is influenced by several factors together, and it gradually develops towards equilibrium. In a comprehensive view, the market has the highest degree of influence on the spatial distribution of logistics enterprises and logistics nodes. The regional economic strength and the scale of the trade market have been an important influence on the spatial distribution of the logistics industry.
In terms of q-values:
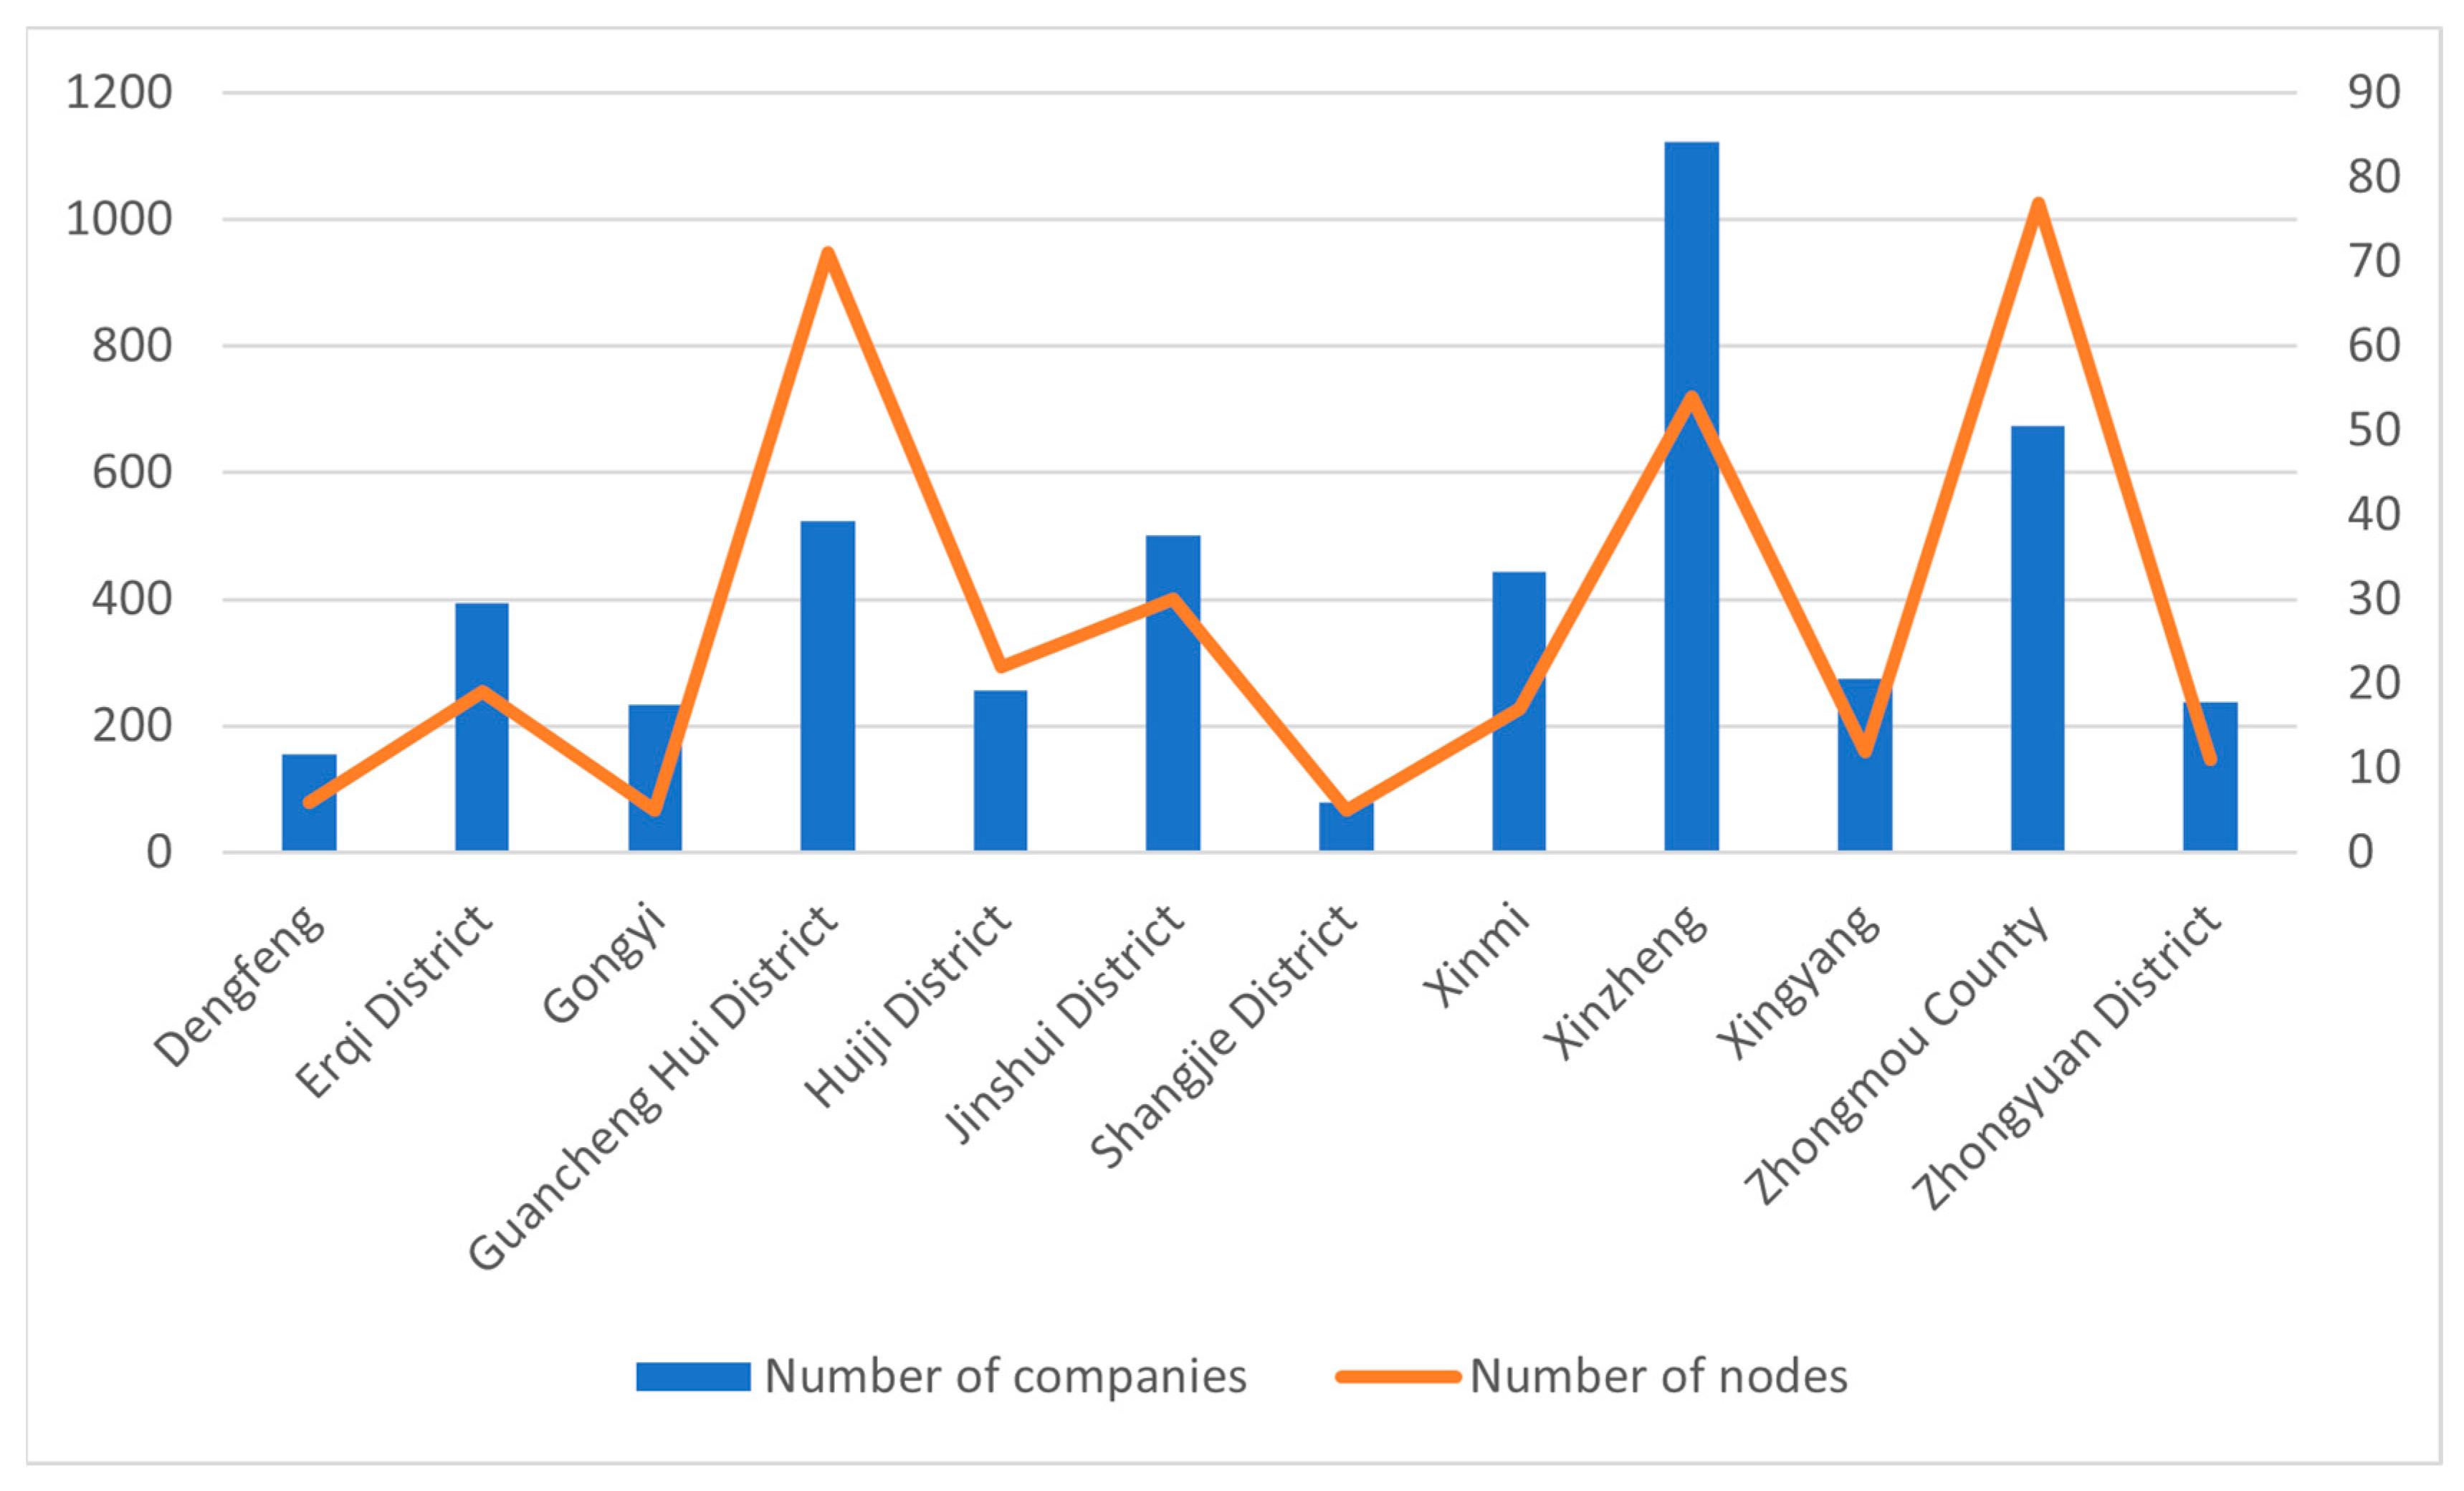
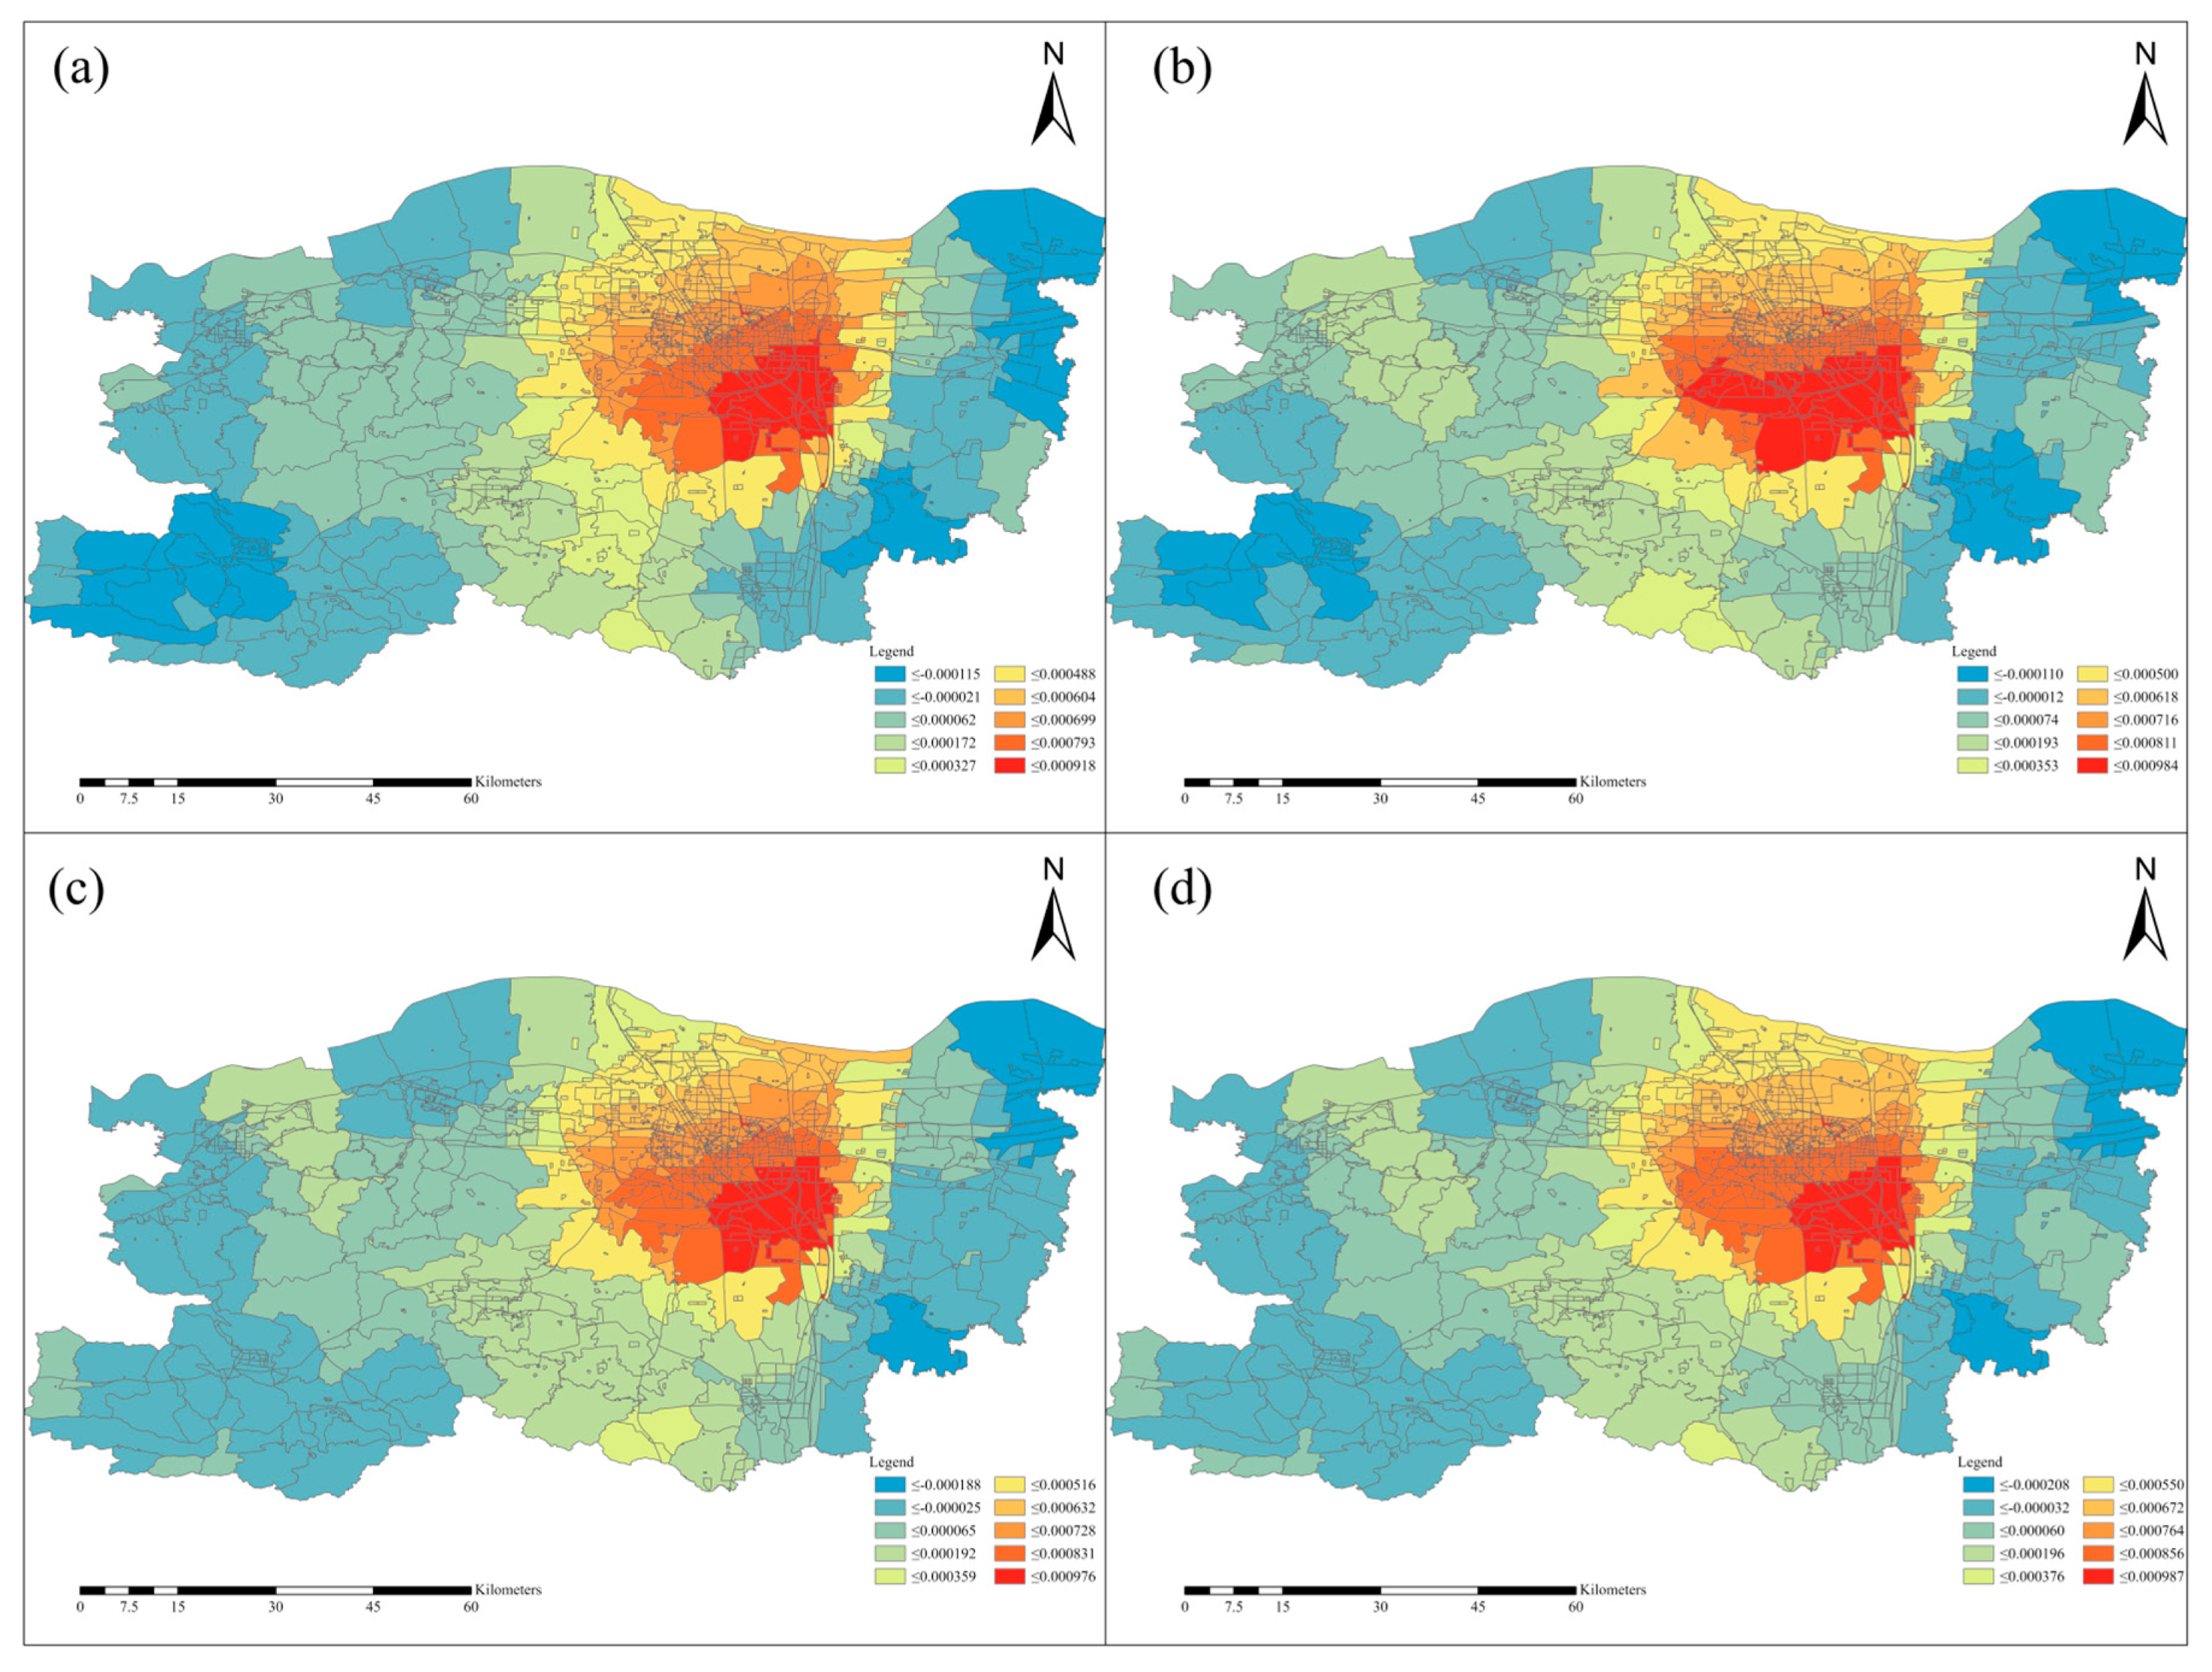
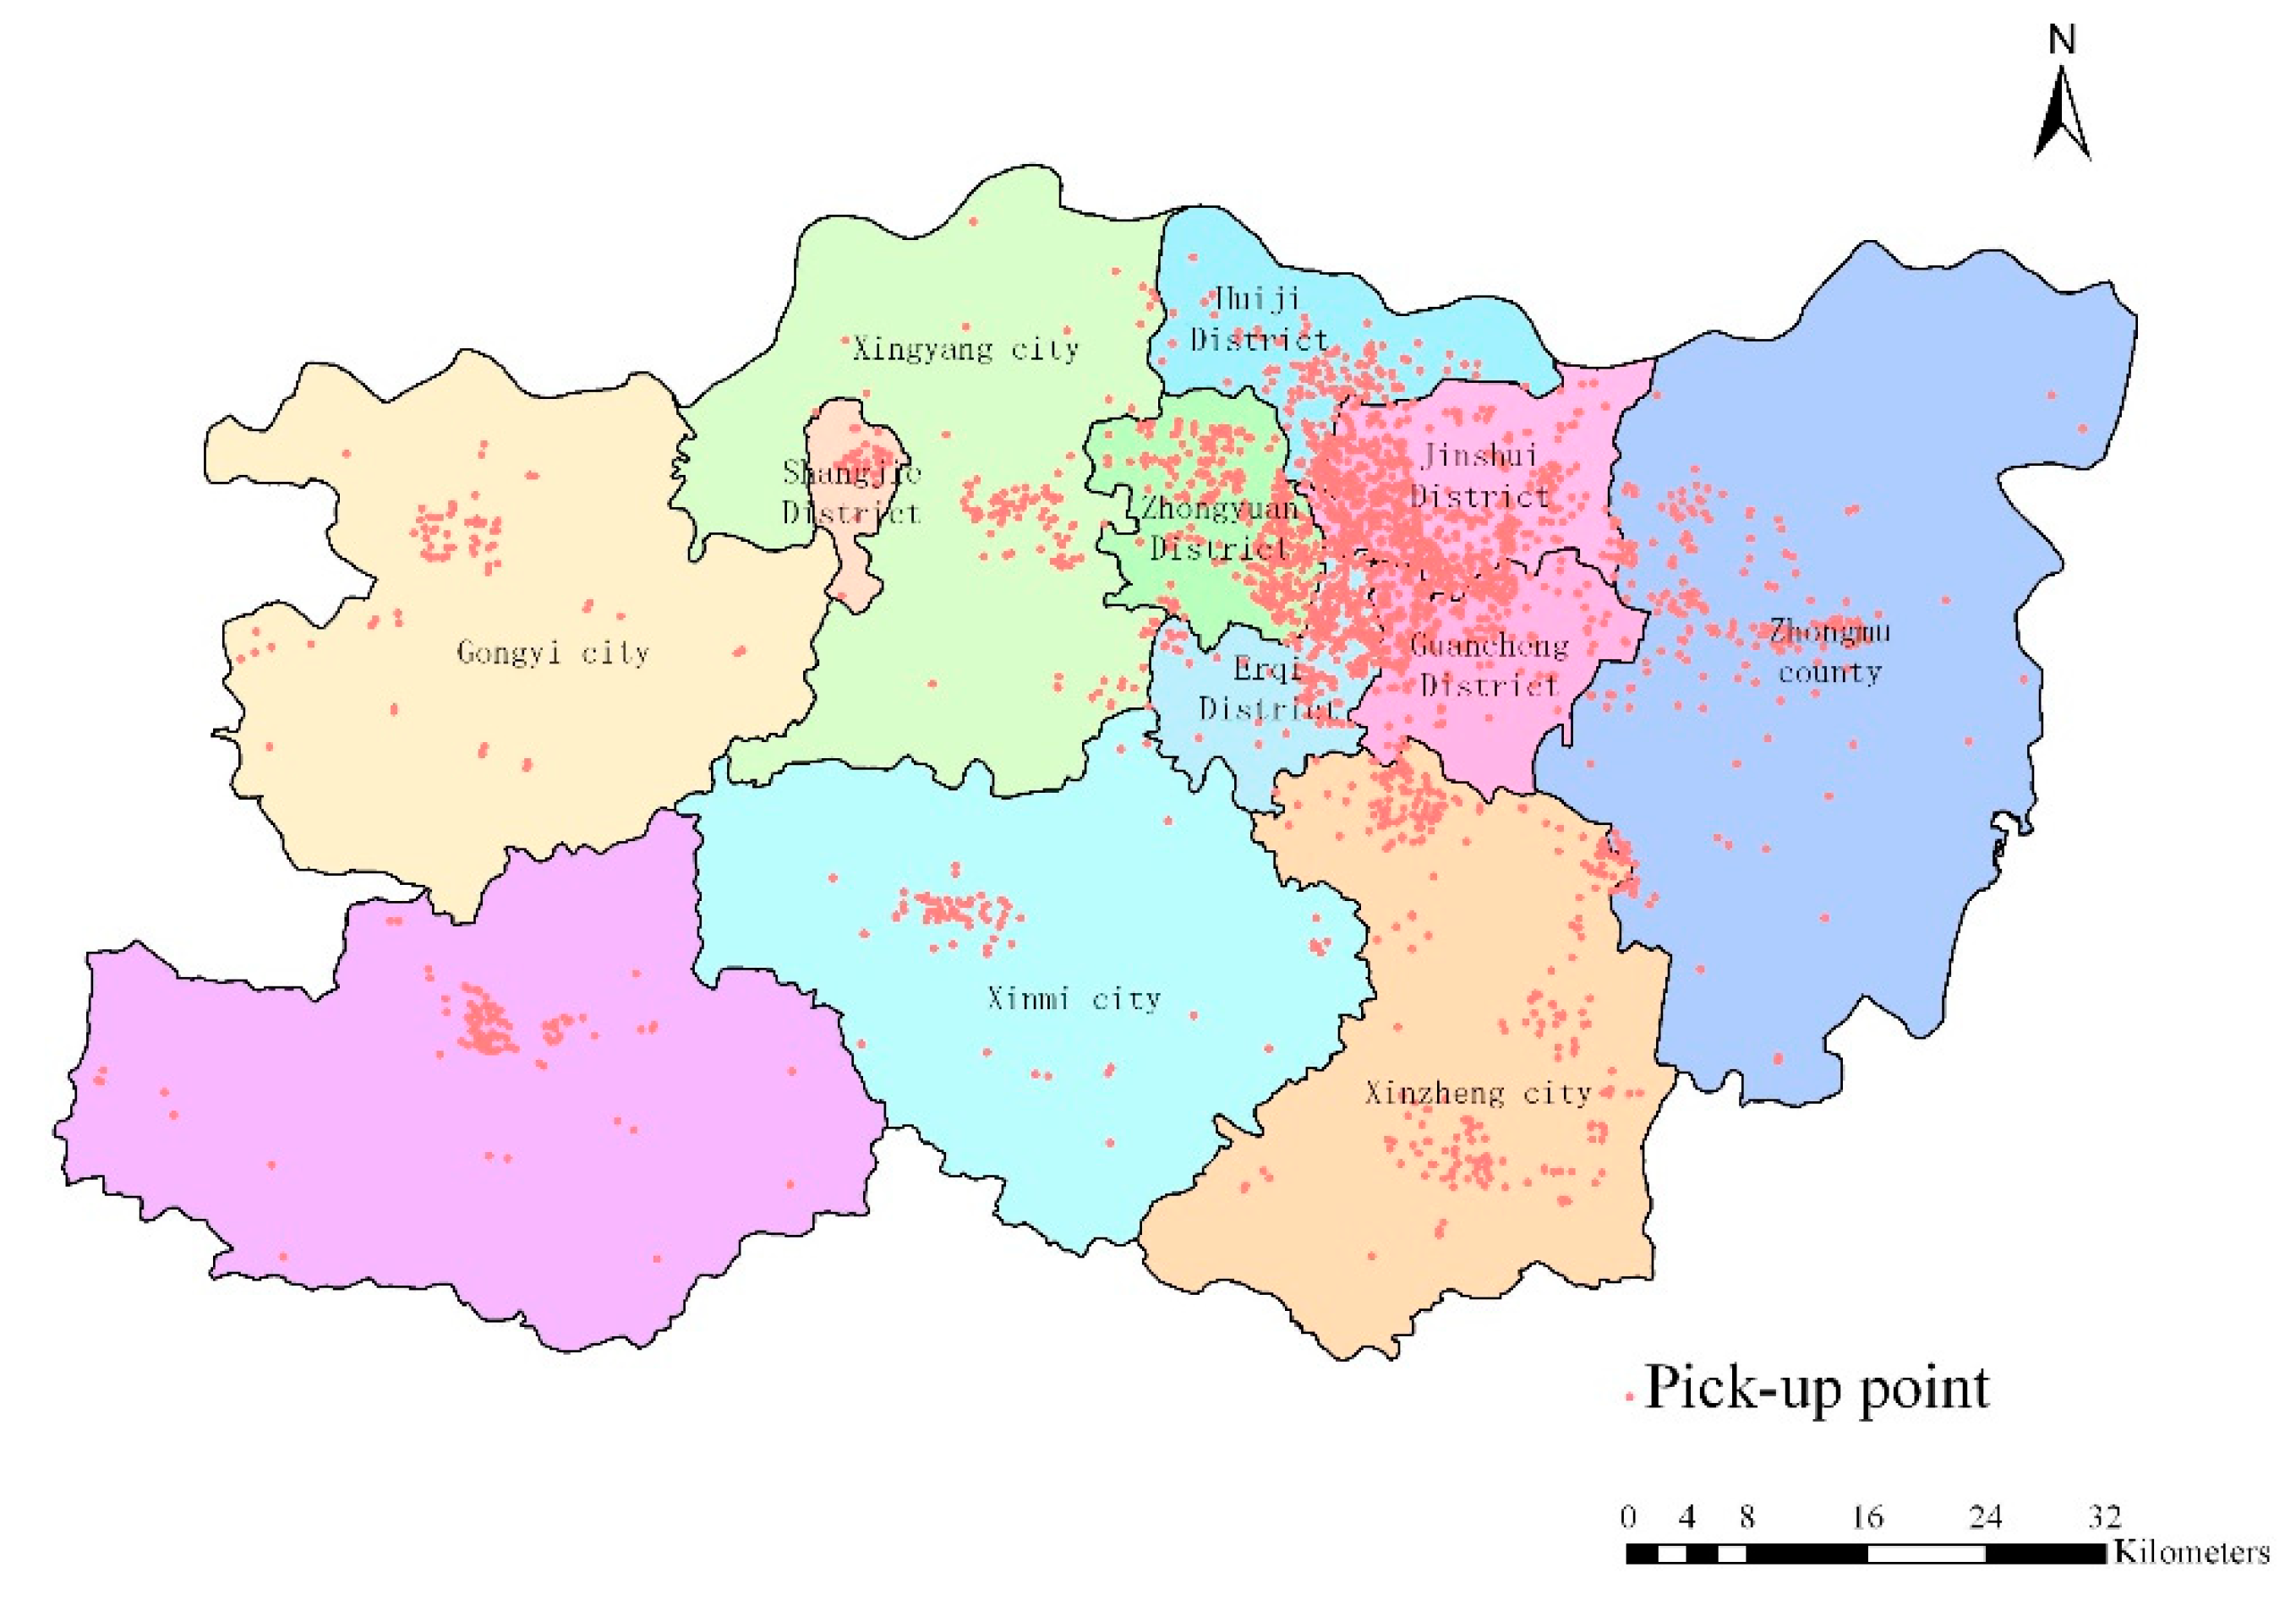
  • Regional economic strength: Regional economic strength has an important influence on the spatial distribution of the logistics industry. As shown in Figure 6, the uneven and heterogeneous regional spatial distribution of the logistics industry reflects, to a certain extent, the differences in the level of economic development between different regions. Over the past 10 years, the number and scale of the logistics industry in Zhengzhou have grown significantly, and the growth areas are mainly concentrated in the main city of Zhengzhou and the surrounding areas, which is mainly due to the significant influence of regional economic strength on the spatial distribution of the logistics industry. From the overall point of view, logistics nodes are more inclined to be laid out in the city center areas with a higher level of economic development, while logistics enterprises are relatively well distributed due to their small scale. From the county (city) district level, most logistics enterprises choose to concentrate in the downtown area and form a hot spot area.
  • Population density: With the upgrading and transformation of the industry, logistics enterprises have introduced intelligent logistics technology and automated equipment, such as automated three-dimensional warehouse, unmanned forklift, and RFID (radio frequency identification), which save a lot of manpower and material resources, resulting in a reduction in the demand for labor in logistics enterprises.
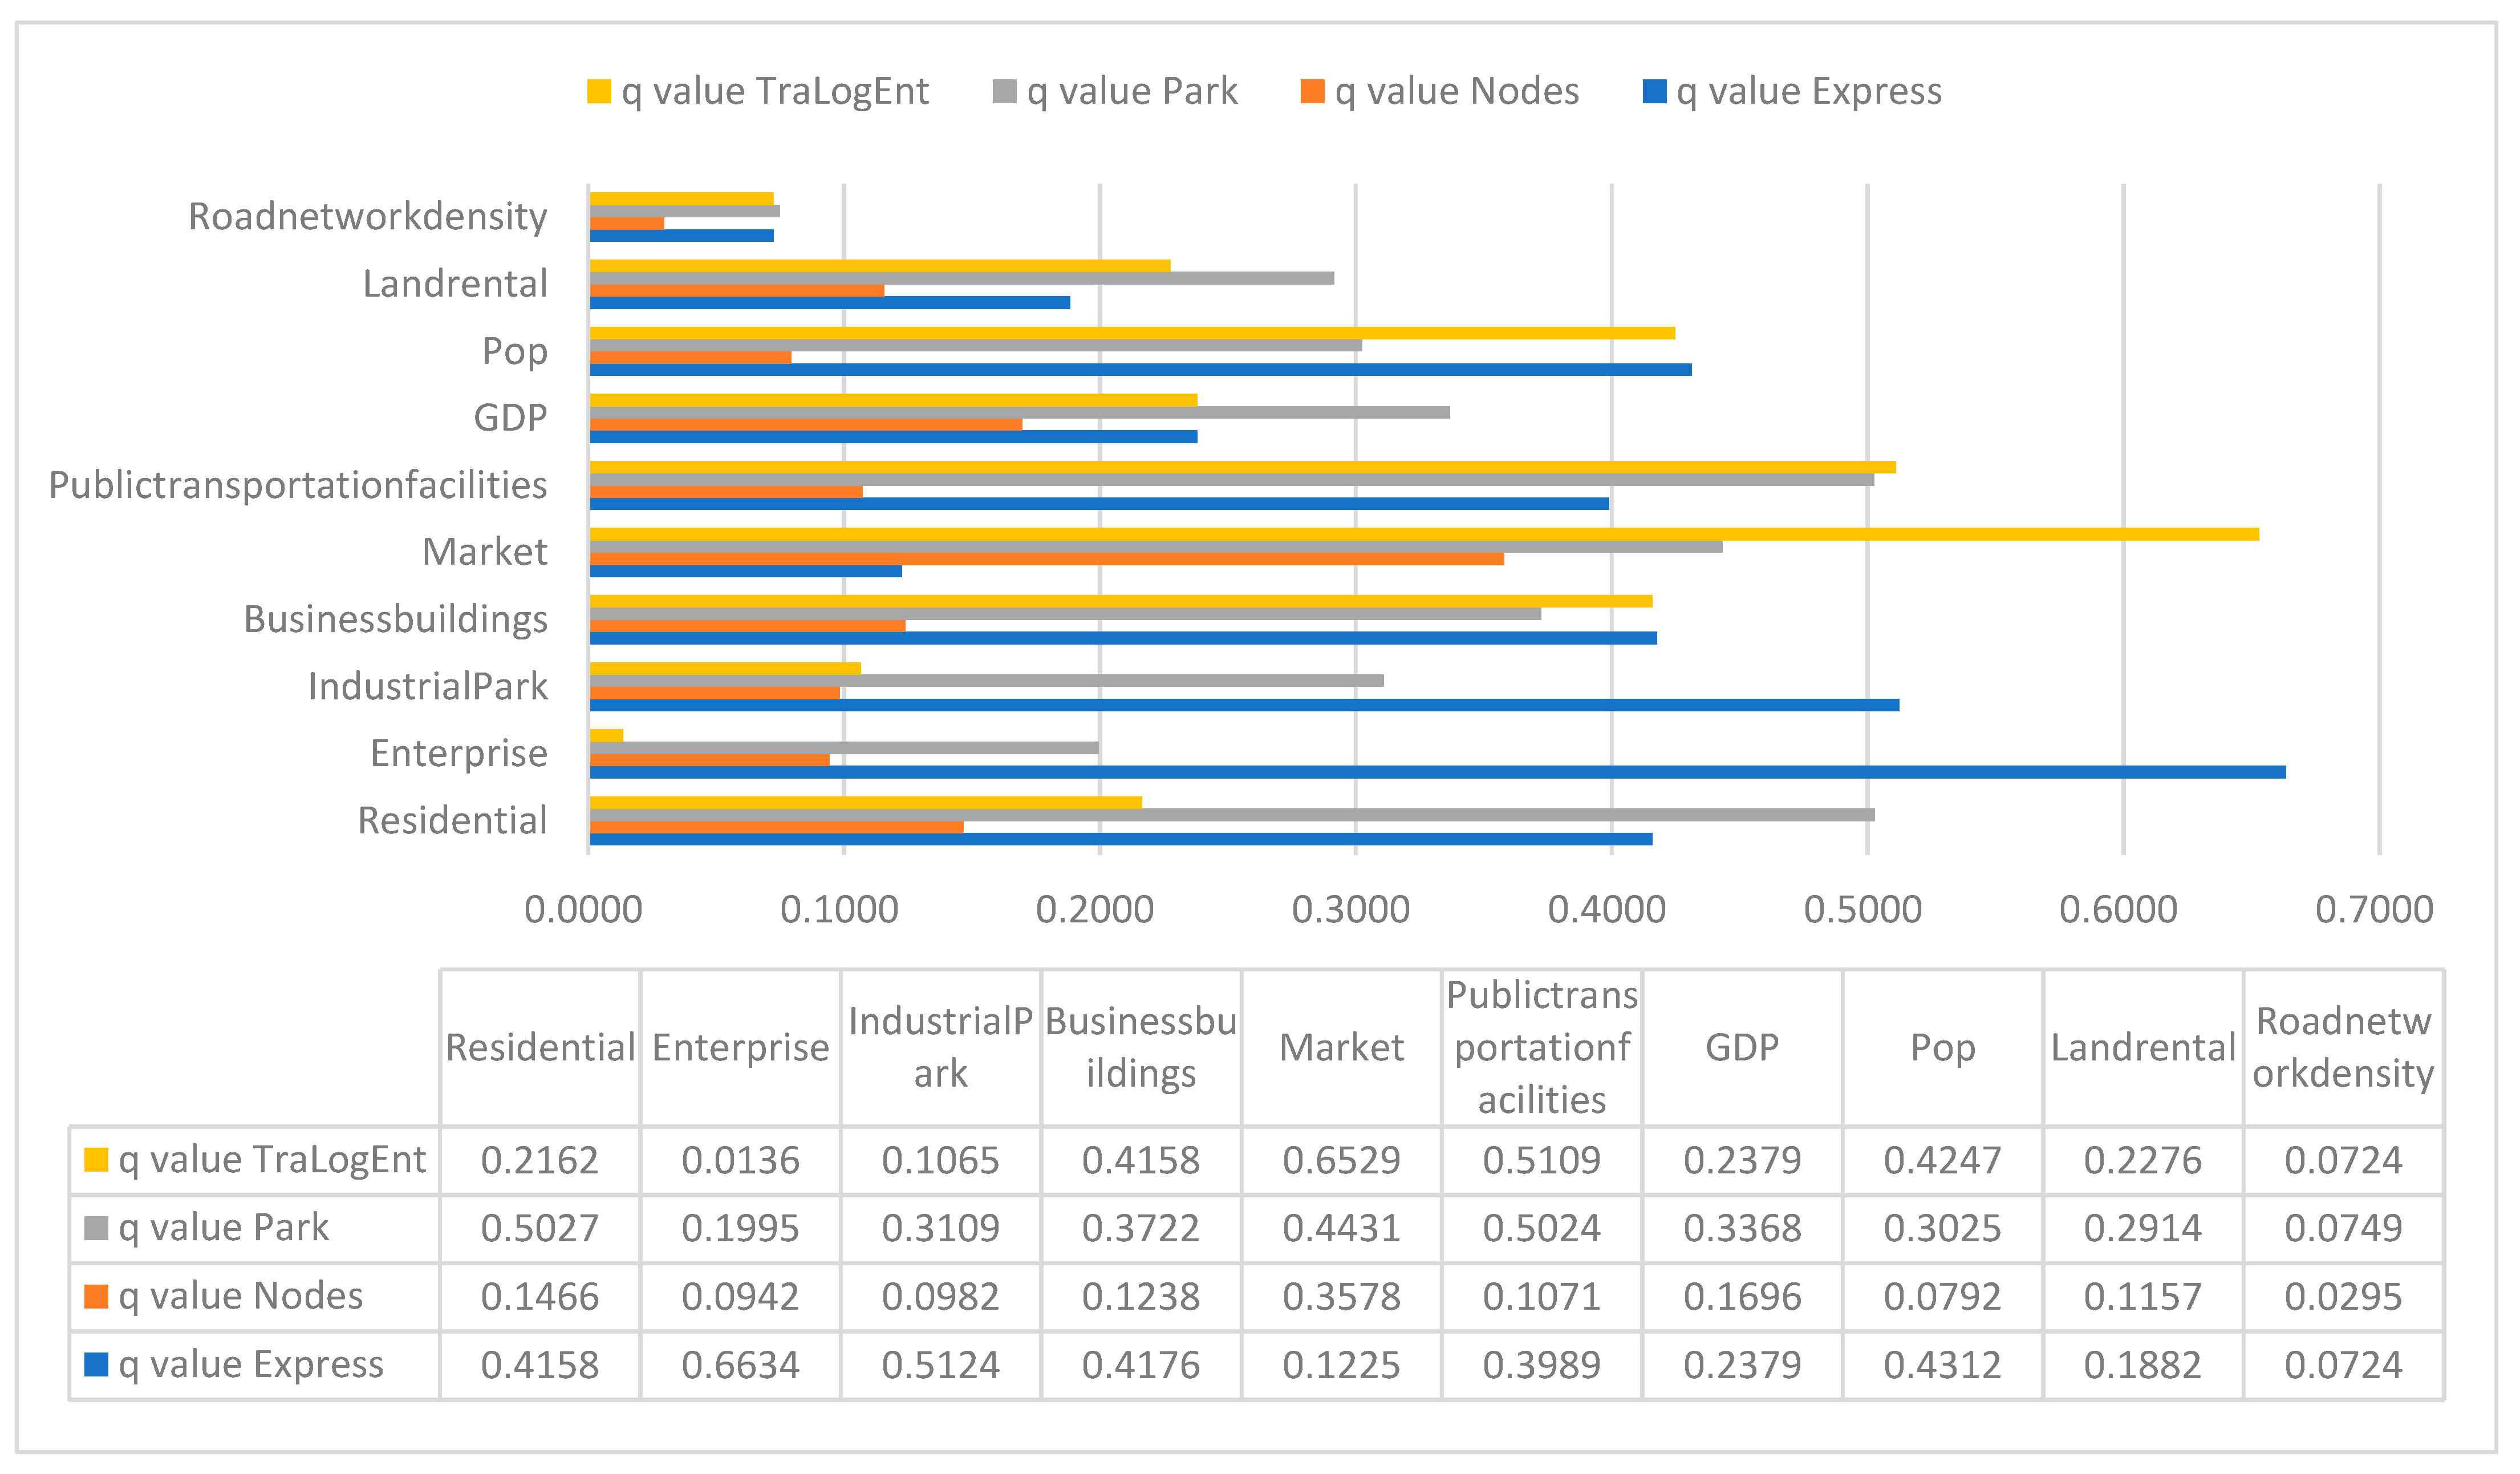
  • The scale of the commerce market: As a tertiary industry, commerce and circulation industries can all create a large amount of demand for transportation and distribution for the logistics industry. In the past 10 years, due to the continuous upgrading and adjustment of the industrial structure, the proportion of the output value of the secondary industry to the regional GDP in Zhengzhou has been decreasing in general, while the proportion of the output value of the tertiary industry has been increasing gradually. The expansion of the scale of the commercial market has increased its influence on the spatial distribution of the logistics industry, and the scale influence q value of the commercial market is high except for the express and postal enterprises.
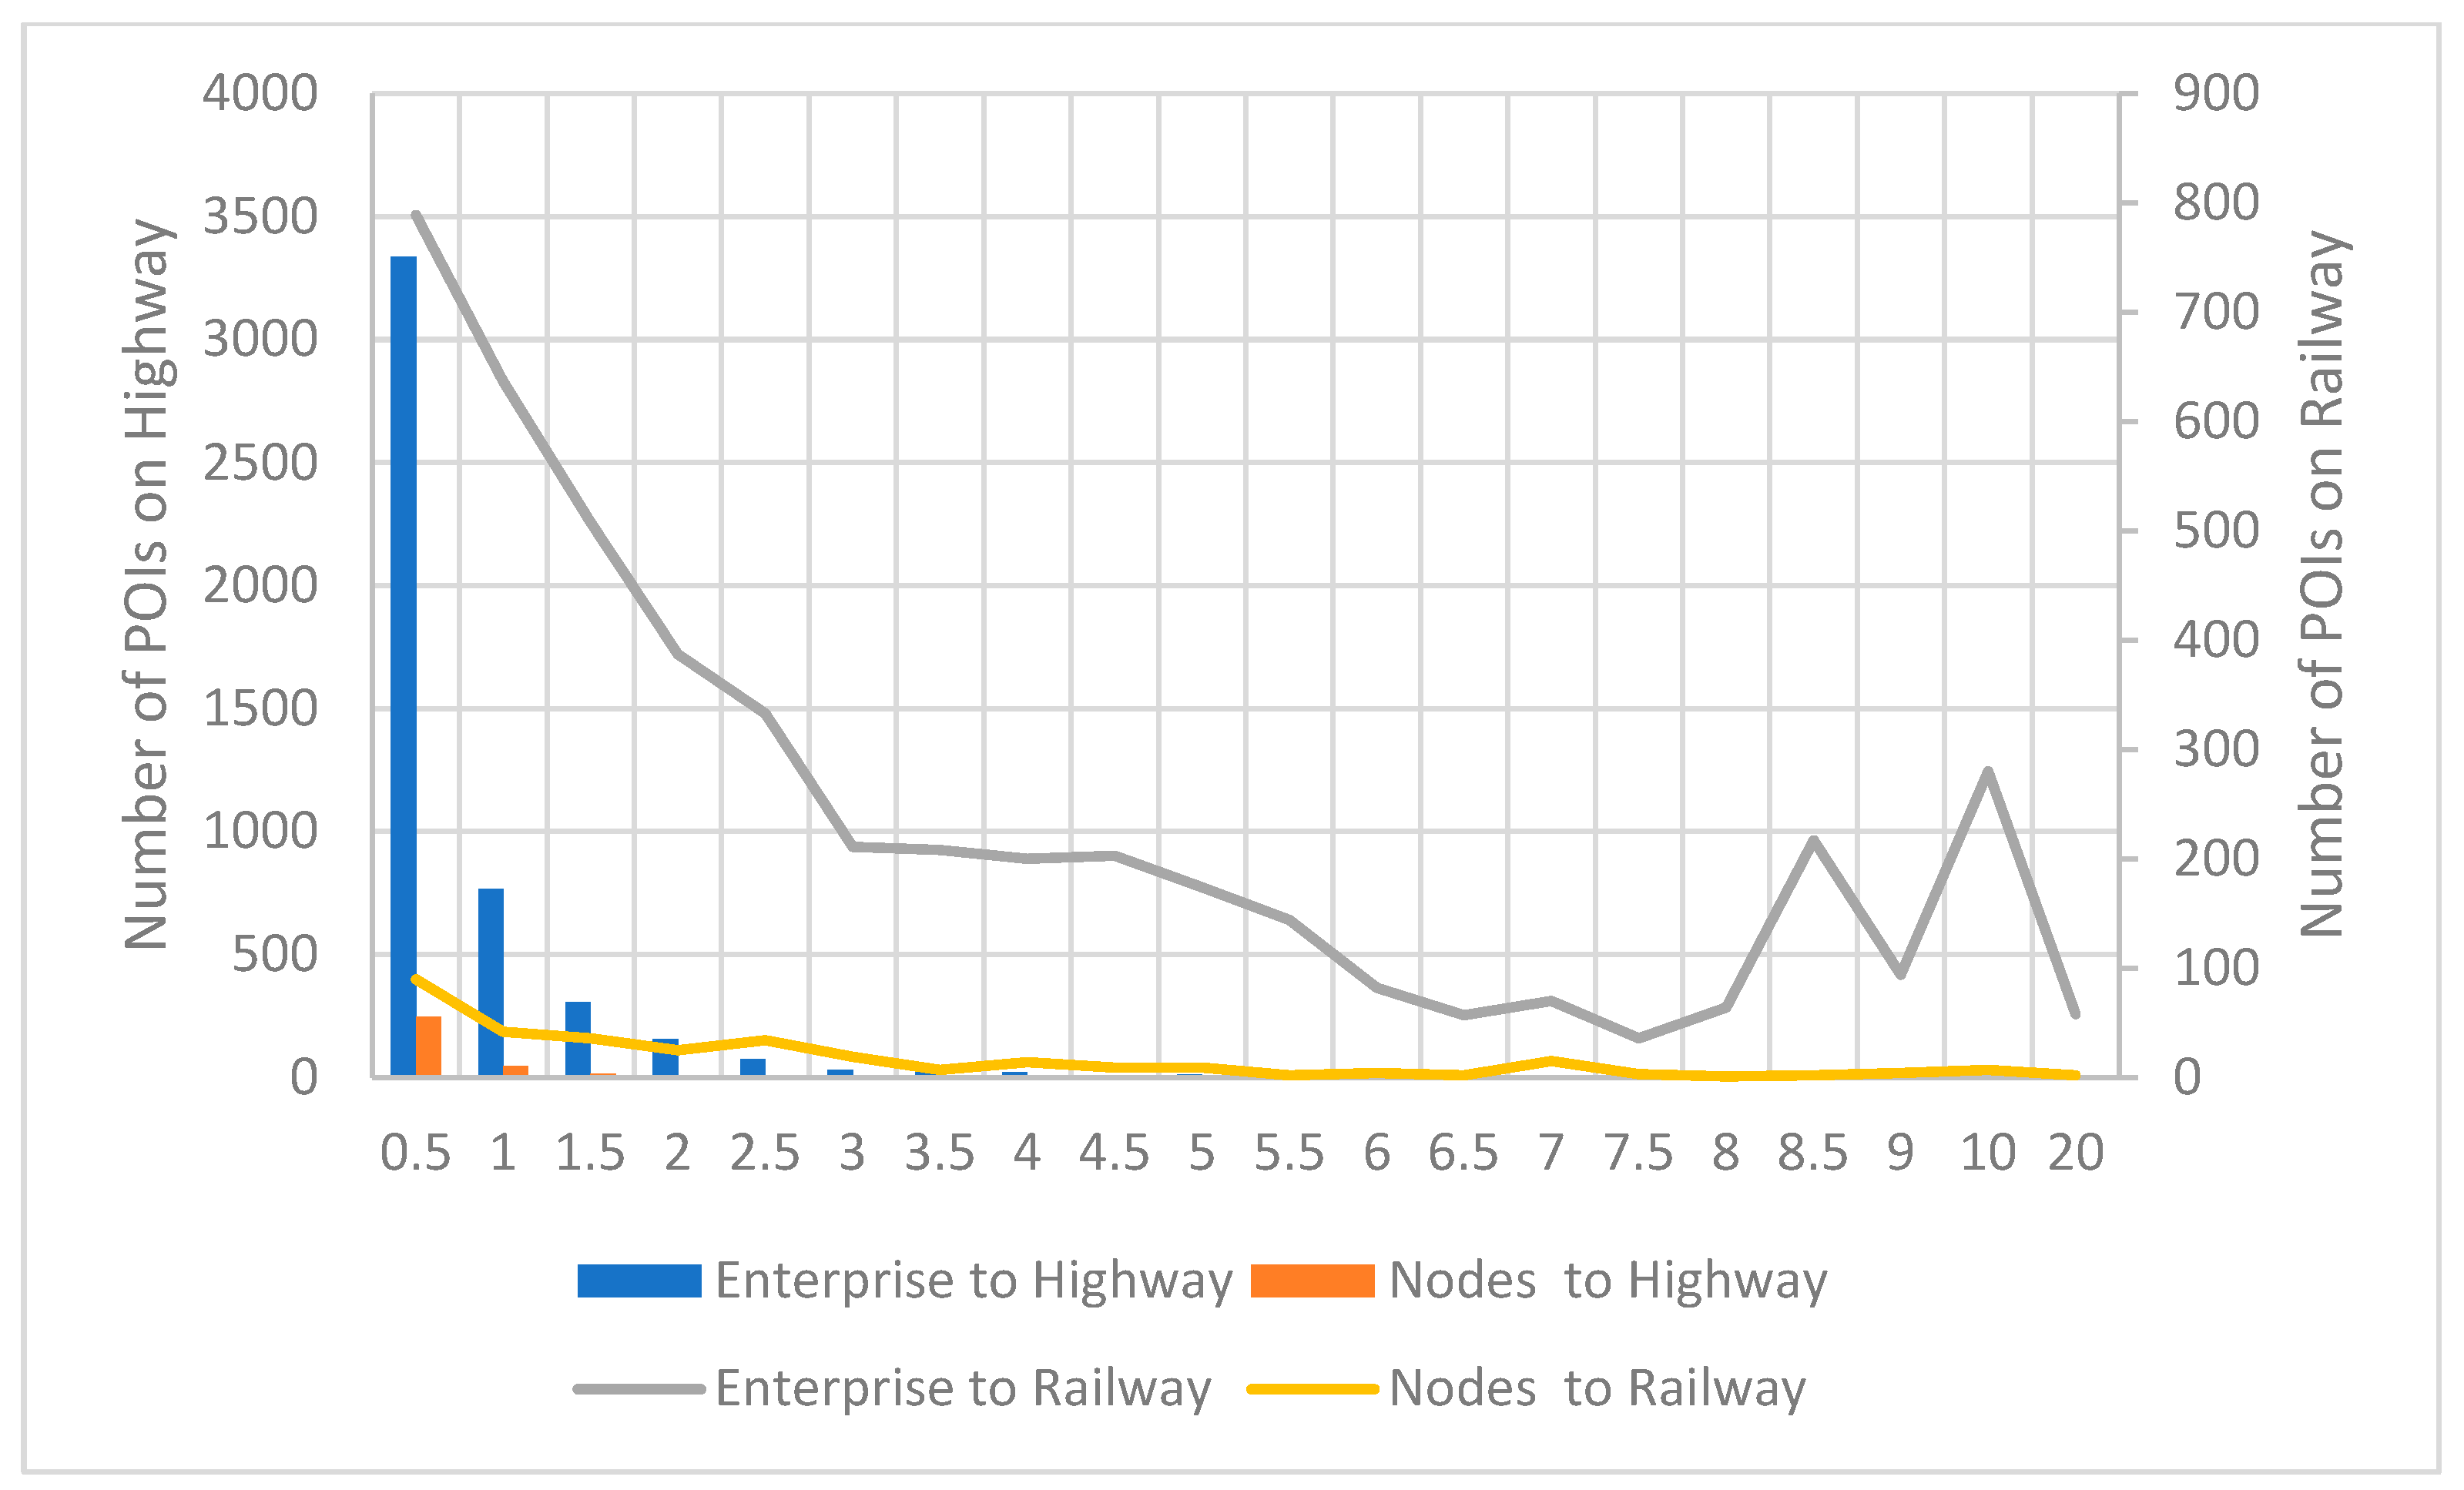
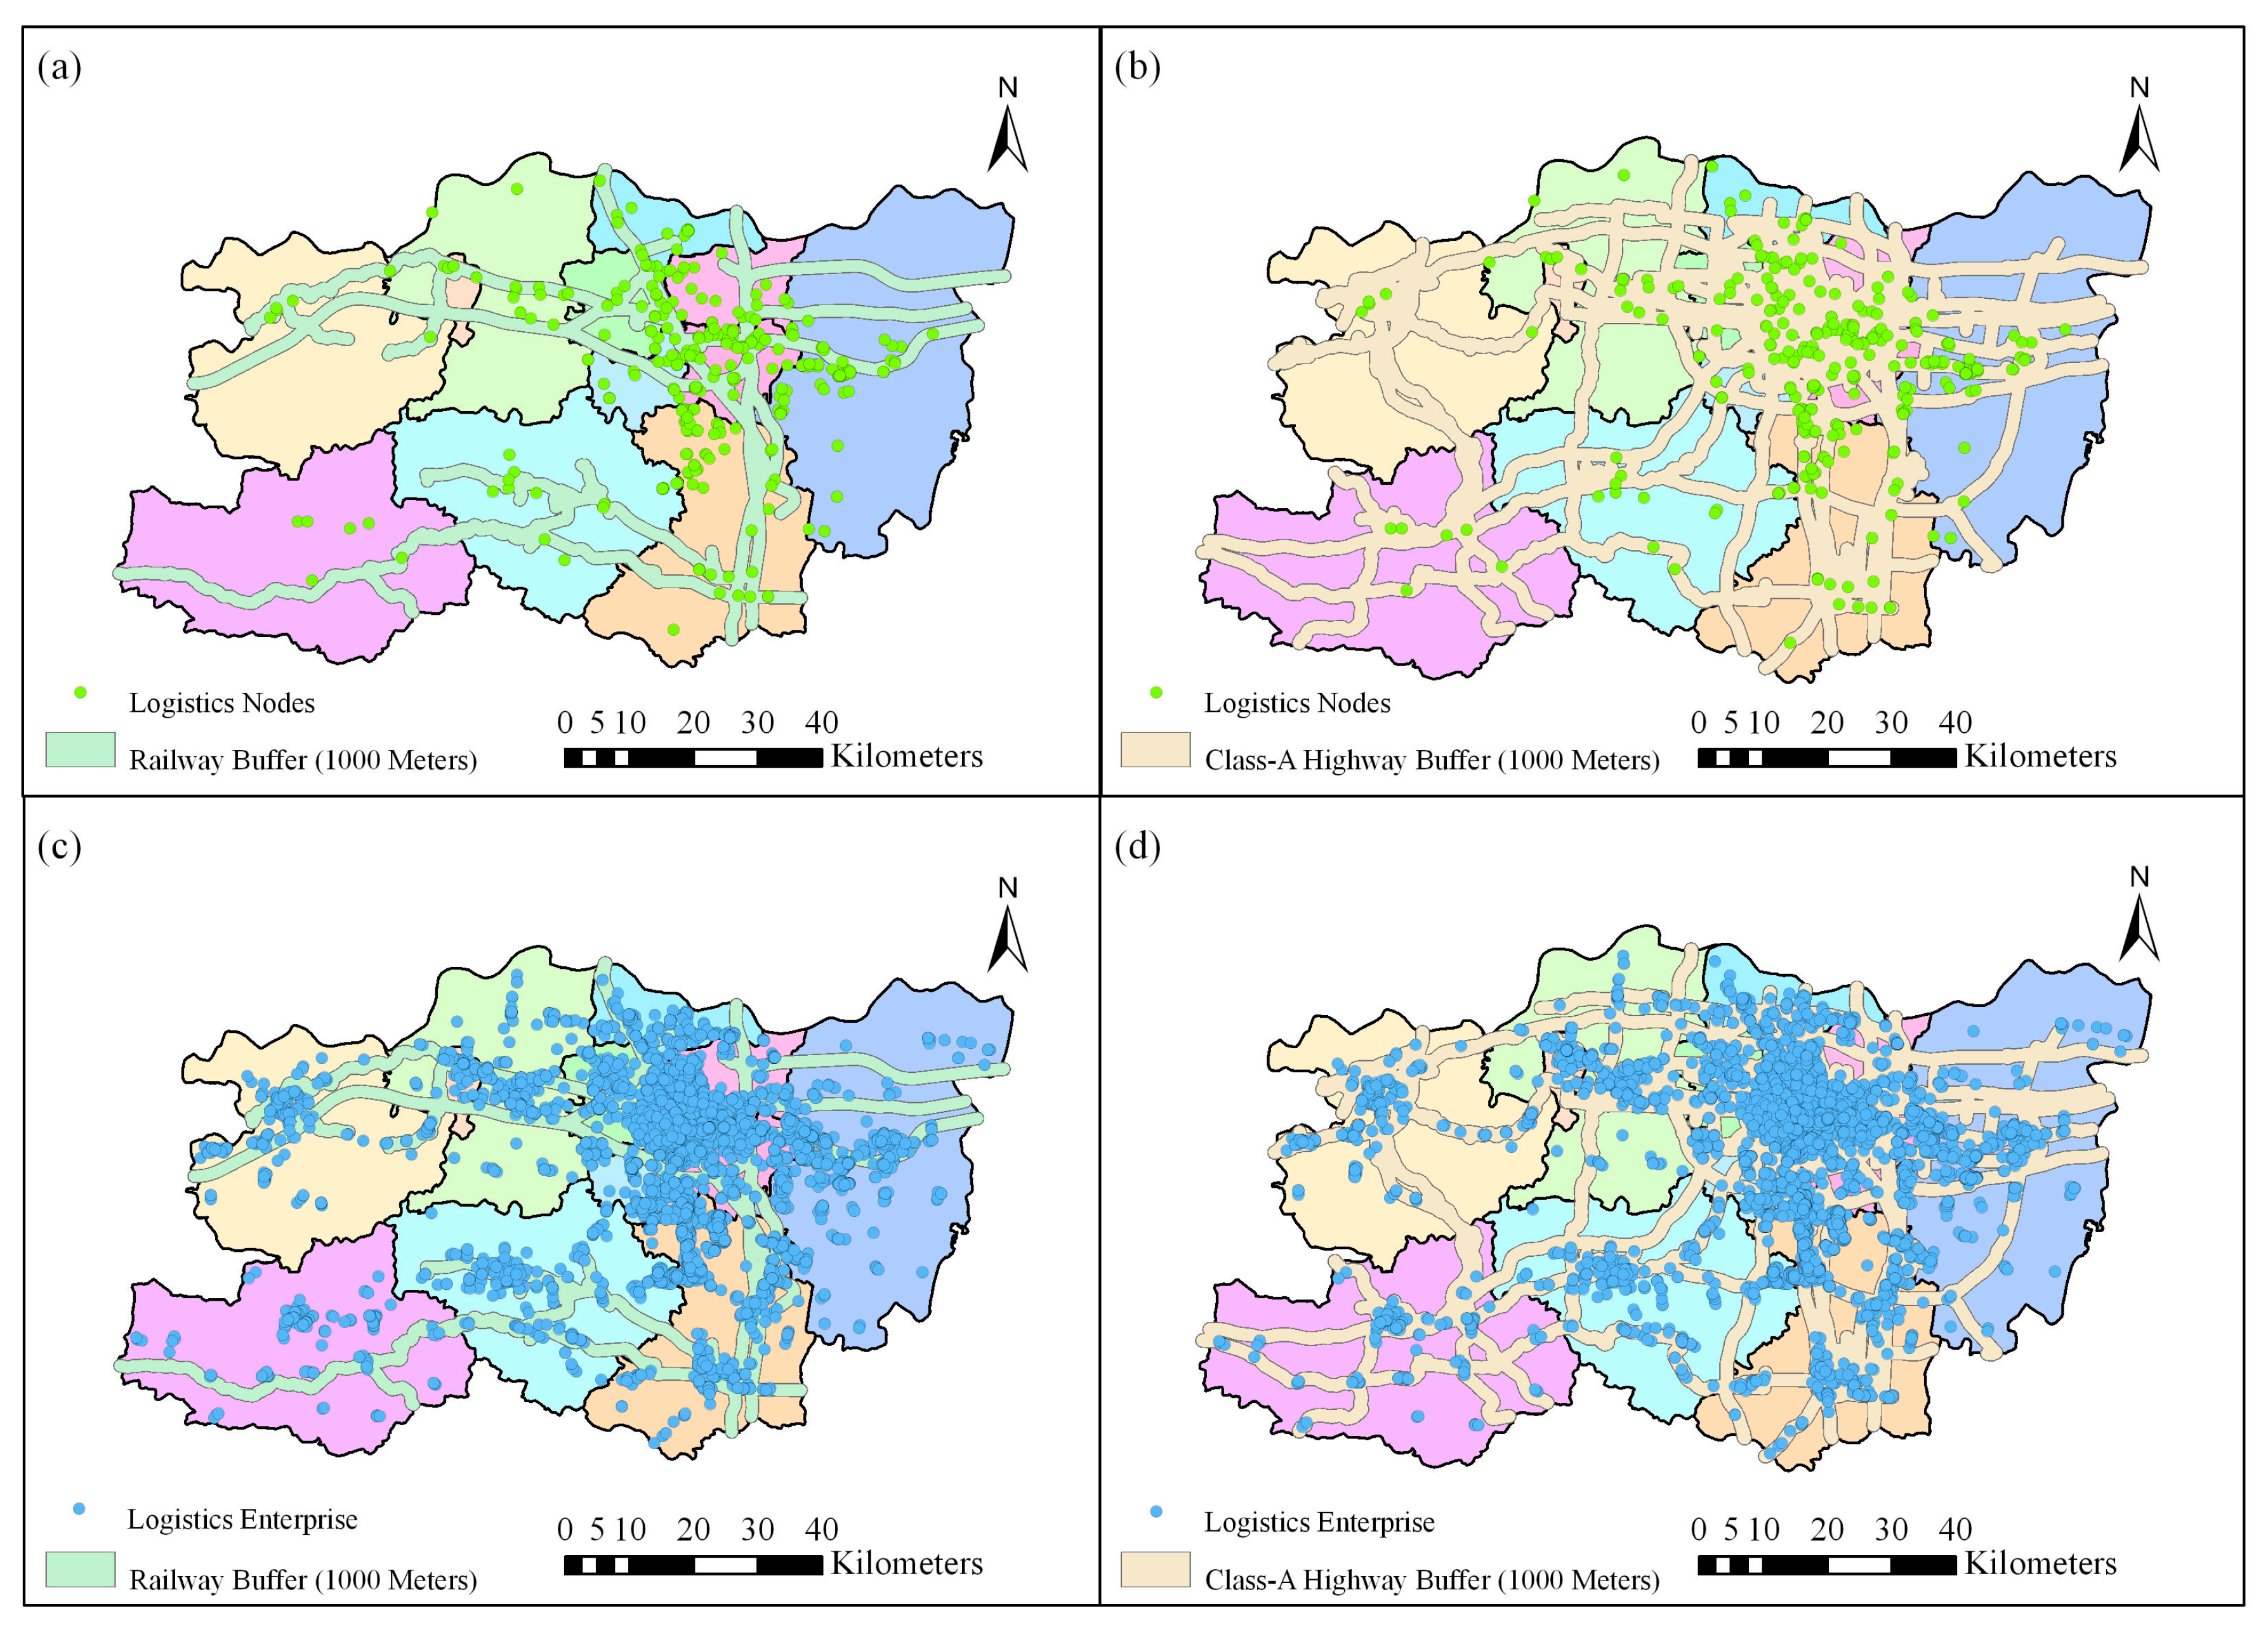
  • Accessibility of transportation: Good traffic accessibility can reduce cargo transportation time, improve transportation efficiency increase customer satisfaction, and also expand the radiation range of logistics enterprises, and win more potential logistics markets. The influence of traffic accessibility in the results is not high, which may be because the UGDM we use is based on roads, and the grid itself has already considered the road factor, so the analysis results in GD do not meet the expectation. We still think that traffic is one of the important factors affecting the distribution of logistics enterprises and logistics nodes.
The goodness of fit of the GWR model for express and postal type enterprises, traditional logistics enterprises, logistics nodes, and logistics parks are 0.832, 0.828, 0838, and 0.832, respectively, with significant fit results. Unlike the GD model, each spatial unit in the GWR model has specific coefficients that can highlight the differences among spatial units.
Figure A1, Figure A2, Figure A3 and Figure A4 show the values of each coefficient, and the results show that population density has a positive influence in all four types of data (Figure 11), among which the greatest influence on the courier and postal type enterprises is the number of residential locations (Figure 13a), and the regression coefficients show a decreasing spatially from north to south and from east to west. The logistics enterprises represented by courier and postal are subject to residential areas because they need to meet the basic logistics needs of residents. influence more. However, with the rapid development of e-commerce and other tertiary industries, the demand for commercial logistics is increasing, so the demand for logistics in industrial parks, trade markets, and other enterprises has also increased sharply.
The biggest influence on traditional logistics enterprises is the number of industrial parks (Figure 13b), and the regression coefficient appears in two regions with high coefficients in space, one in the northeast region of Xinmi City and the other in the south region of Zhongmu County, which is due to the large number of industrial parks clustered in these two regions. Traditional logistics enterprises mainly operate transportation services and warehousing services, and their service targets are mainly manufacturing and trade enterprises, so they are influenced by the spatial layout of industrial parks.
The biggest influence on logistics nodes is the number of logistics industry chain enterprises (Figure 14c), while the biggest influence on logistics parks is the number of industrial parks (Figure 14d), and the regression coefficients of both show a decreasing spatially from north to south and from east to west, and the areas with higher regression coefficients are in the two large logistics parks in Erqi District (Bonded Center and Putian Logistics Park) and Xinzheng Airport Cargo Yard Station, which indicates that logistics nodes and The spatial location of logistics parks mainly depends on the government’s planning.
We obtained similar results in the GD model and the GWR model. This indicates that the main influencing factors affecting the spatial layout of the logistics industry in Zhengzhou are population density, the concentration of logistics industry chain enterprises, the concentration of industrial parks, the concentration of trade markets, and the concentration of residential areas.

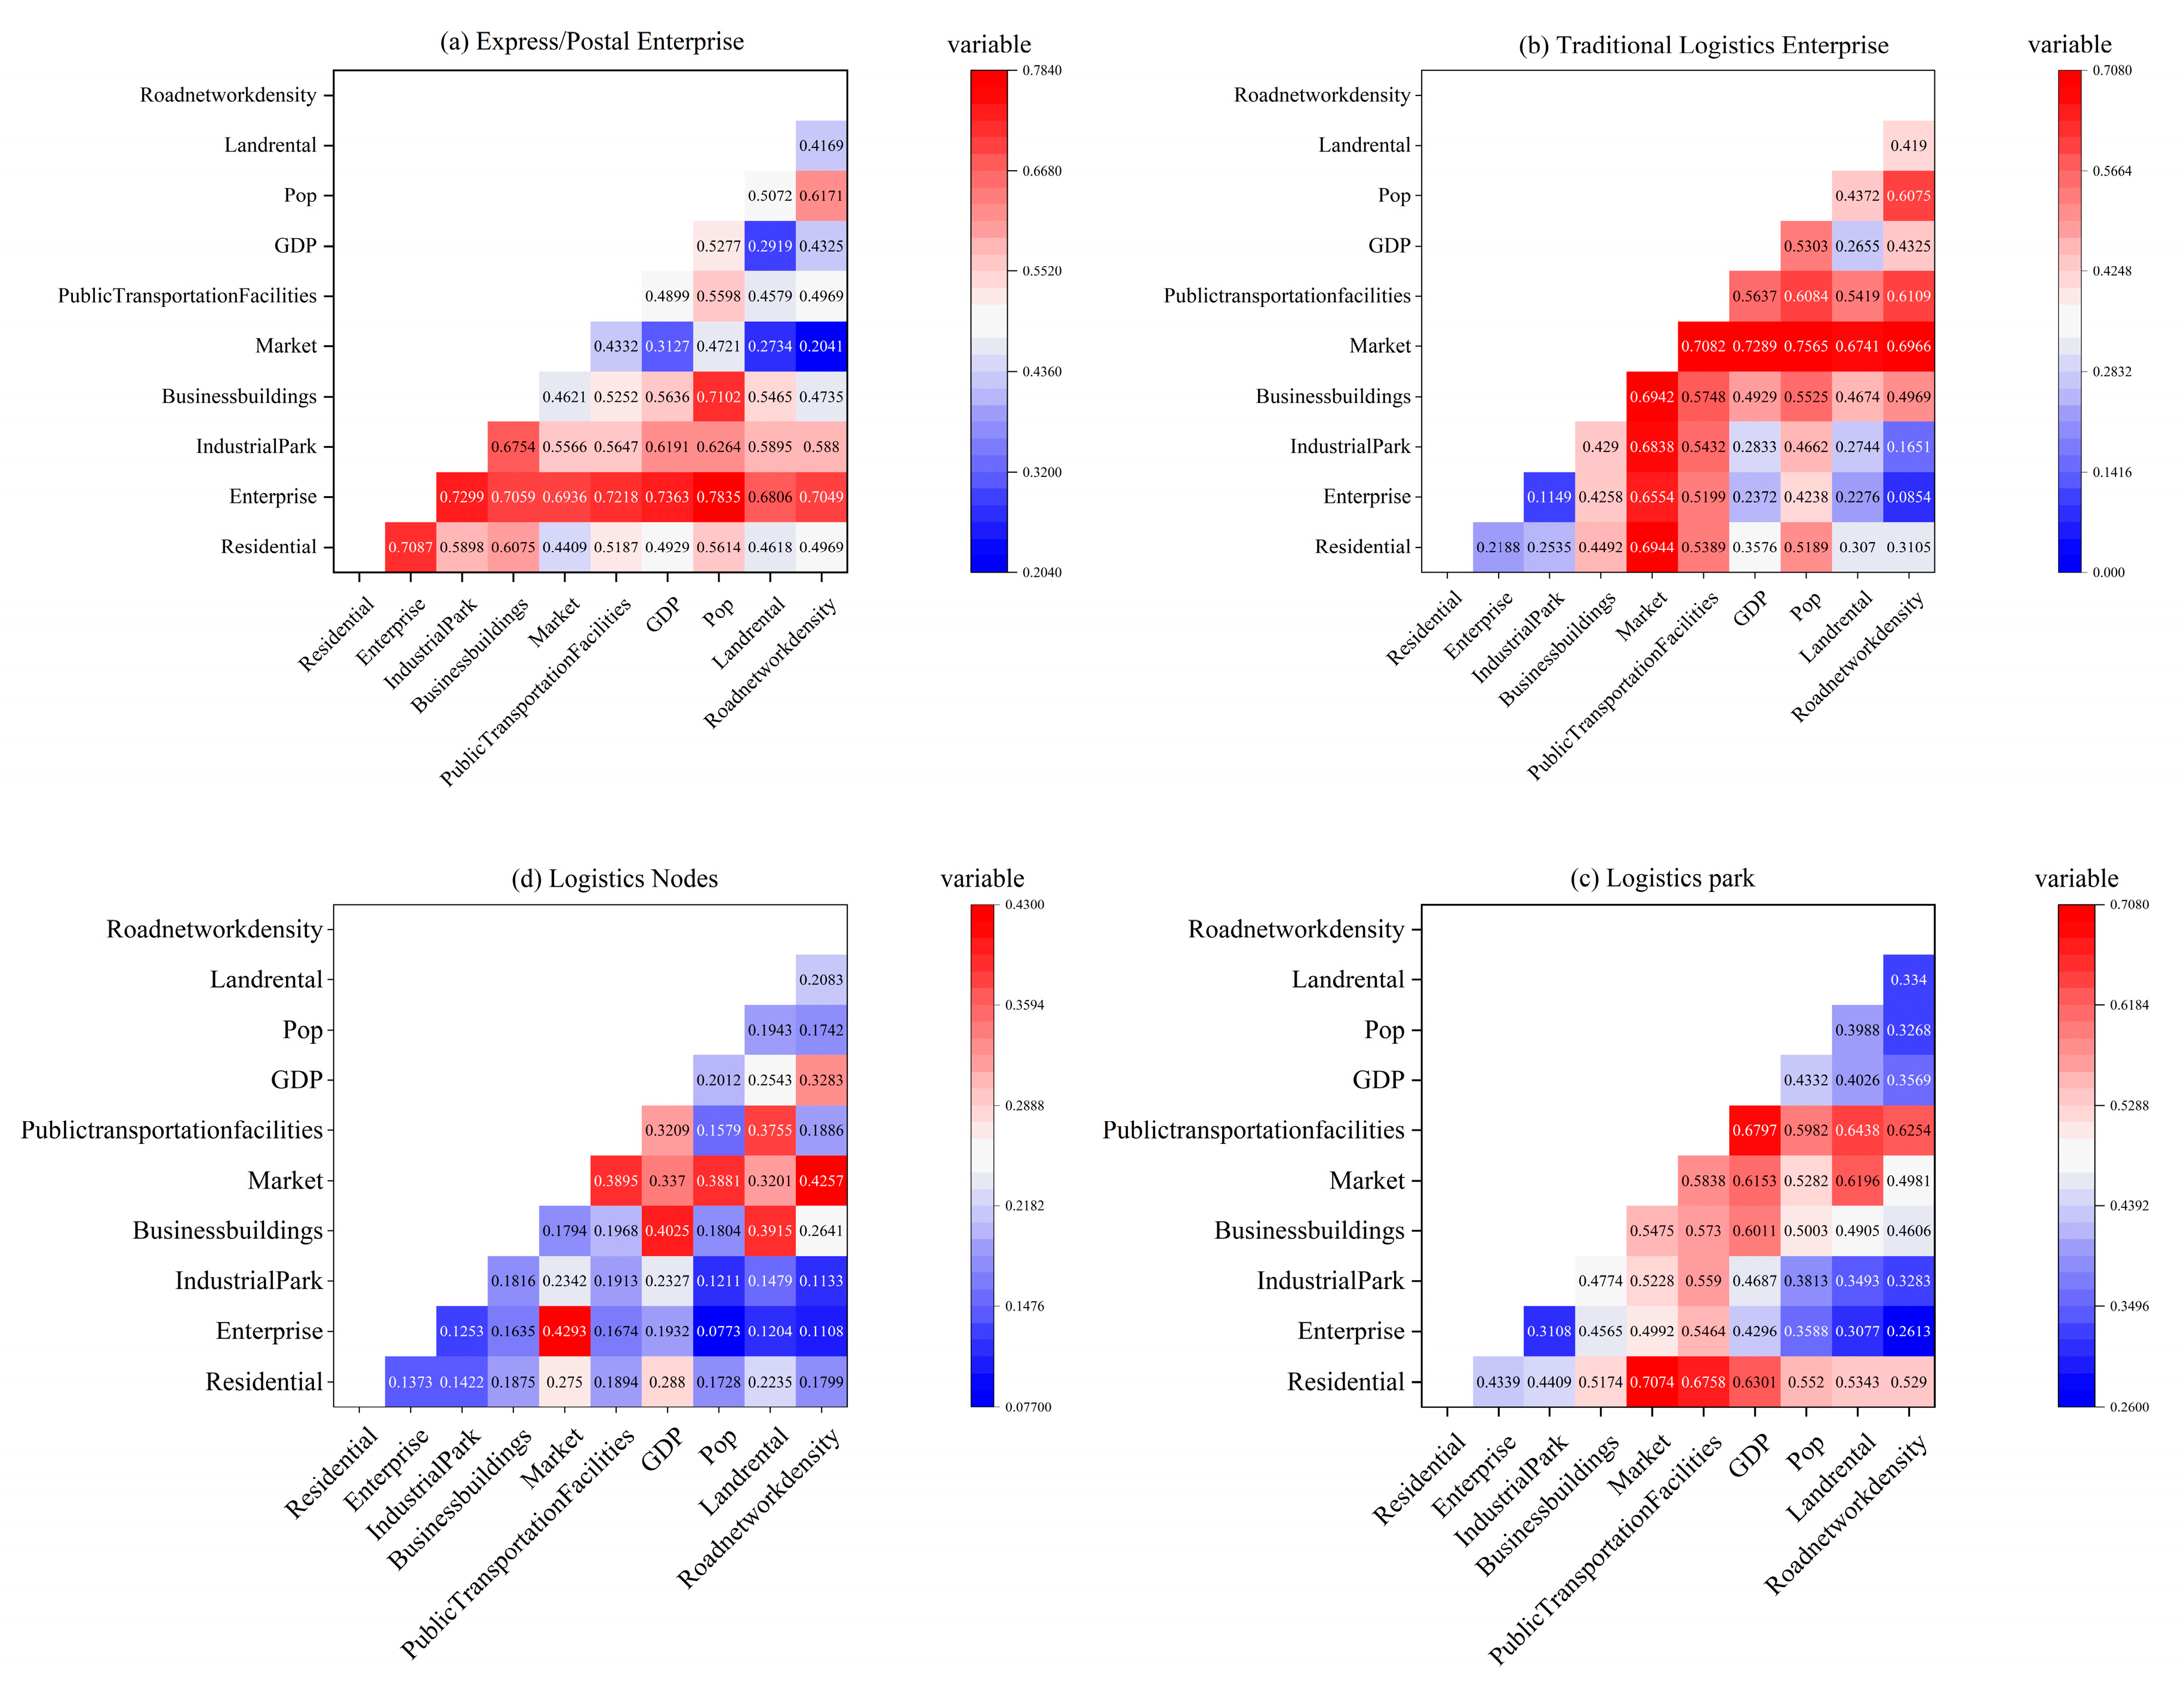
3.3.2. Interaction Factor

As shown in Figure 15, all the influencing factors of the spatial distribution of the logistics industry in Zhengzhou City have interaction, and there are no independent influencing factors. Among the express and postal logistics enterprises, four influencing factors, namely, the number of settlements, the number of enterprises, the industrial park, and the population density, produce a strong non-linear enhancement when interacting. In traditional logistics enterprises, the three influence factors of the trade market, number of office buildings, and number of public transportation facilities have a more obvious non-linear enhancement when interacting. In logistics nodes, the interaction of the commerce market with multiple influencing factors is non-linearly enhanced. In logistics parks, the interaction of trade markets, the number of public transportation facilities, and the number of residential points with multiple influence factors are obvious. This indicates that the influencing factors of the spatial distribution of the logistics industry have both common effects and spatial and temporal differences.

3.3.3. Differences in Location Choice by Type of Analysis

Different types of LE and LN show differentiated location selection behaviors, which are mainly influenced by three factors: service objects, service functions, and asset allocation. The spatial distribution of logistics nodes and logistics enterprises is based on the core of the city center and gradually expands outward in an expansion mode. The main city of Zhengzhou and the surrounding area have similar urban road structure characteristics. Accordingly, the average distance between each POI type and the center point (Figure 16) and the frequency distribution map (Figure 17) is calculated.
The average distance between LE and LN is 19.717 km, the minimum average distance is 17.946 km and the maximum average distance is 21.488 km; the highest frequency corresponds to a distance range of 1.5–2 km, and the spatial location of logistics shows a strong balance, indicating that: (1) government planning plays an important role in the location selection of LE and LN, while the distance from enterprises to The average distance from enterprises to distribution centers is 28.508 km, which indicates that the location advantage is relatively weak in the distribution link, and also reflects the difficult problem that the lack of logistics land and high-cost factors affect the end delivery in the peripheral areas and county-level cities outside the central city of Zhengzhou. Generally, the city’s railroad freight stations are located in the suburbs, but Zhengzhou has the advantage of railroad-highway location. Among them, Erqi District, Guancheng District, Zhongmou, and Xinzheng, which bear the main freight function, are close to the government-planned road freight stations and logistics bases reflecting the planning department’s reasonable special planning for the problems that will arise in the logistics industry clustering, but mega-cities still have the problems of high logistics costs and unreasonable layout of surrounding cities. (2) As mentioned above, there are three main factors that affect different types of logistics enterprises and nodes, the express category mainly provides end-delivery services to customers for e-commerce consumption, and its average distance is 28.328 km. For the postal enterprises, compared with the express enterprises, due to their own attributes, the main focus in its planning and layout is higher coverage, for the time efficiency, cost, and other factors that express enterprises focus on less sensitive. Transportation and distribution enterprises are more focused on the source of customers, both service objects, but also more sensitive to the site, logistics node factors, the average distance of 24.843 km; warehousing enterprise location is less sensitive to traffic, it is more focused on the cost of land and the degree of concentration of industrial parks, the average distance of 34.507 km; freight forwarding enterprises are not sensitive to the three elements: the average distance is only 24.632 km, the integrated logistics category shows the same spatial agglomeration distribution as the logistics nodes, and the average distance from the center of logistics nodes is only 19.354 km.

3.3.4. Logistics Location Selection under the Influence of Supply and Demand

Freight yards are a bearing object in logistics, the POI clustering phenomenon near freight yards can intuitively reflect the sensitivity of the logistics industry to traffic and the clustering ability of the region. Calculate the distance of POI data to the highway and railroad, and get its density distribution (Figure 18) can be seen: the highway has a significant impact on the location choice of LE and LN, and shows a more similar distribution trend, the overall distribution is negatively correlated with the distance from the railroad, in which the main gathering area of logistics enterprises and nodes in the range of 0.5 km from the highway, the total proportion of 70.61%. The trend of distribution in the range of 0.5~2 km decreases significantly, accounting for 25.43% of the total, and only a few logistics enterprises and nodes remain outside the range of 2 km, accounting for 3.95% of the total; the influence of railroad on the location choice of both is also significant, with the highest degree of aggregation in the range of 0.5 km, reaching 17.18%, and the number of distribution in the range of 0.5~6.5 km shows a decreasing trend, accounting for 65.98% of the total, and 6.5 km shows a decreasing trend. 65.98%, 6.5~10 km range partly shows an increasing trend again, accounting for 15.66% of the total, and only 1.18% outside 10 km. According to the data, the freight yard has a strong ability to gather the logistics industry. Among them, highways have higher attractiveness to LE and LN compared with railroads, and the distance from freight yards is an important reference indicator for both location choices. Logistics enterprises are less sensitive to factors such as site and rent, and have more subjectivity and flexibility in site selection, so they form a spatial pattern of agglomeration within the proximity of freight yards; logistics nodes have certain requirements for site and rent and are distributed in areas far away from freight yards due to cost constraints, which shows that the distance between logistics nodes and freight yards is no longer the primary condition for location selection.
The location choice of LE and LN has always been inseparable from the traffic factor. Taking Zhengzhou city highway as the object of analysis, the aggregation of logistics nodes and logistics enterprises within the 2 km buffer zone of the primary highway is counted, and taking Zhengzhou railroad as the object of analysis, the aggregation of logistics nodes within 2 km is counted (Figure 19).
From the data, LE and LN have obvious clustering characteristics in space. According to statistics, the number of logistics enterprises clustered within 0~1 km of the buffer zone accounts for 70.52% of the total, and within 1~2 km, the number accounts for 25.42%, and the total amount within the buffer zone reaches 95.94%. The number of logistics nodes within 0~1 km reaches 88.75% of the total. 6.99% of the total within 1~2 km and 95.74% of the total within the buffer zone. The choice of logistics location in Zhengzhou city, from the central urban area to the peripheral areas and other regions, shows a high dependence on transportation. County-level cities and townships that are far from the central urban area reflect the sensitivity of transportation, even more, when the overall transportation is less convenient than that of the central urban area of Zhengzhou.
Logistics enterprises are less dependent on railroads relative to logistics nodes, of which logistics nodes reach 40.12% in the range of 0~1 km, 18.54% in the range of 1~2 km, and 58.66% in total in the buffer zone. The data show that the distance from the railroad is not an important reason to restrict the choice of logistics location compared with highway, and highway resources are more attractive to LE and LN.
Logistics nodes and logistics enterprises show a more consistent distribution pattern in the region. The former is mainly concentrated in Huizi District as the starting point, down through Zhongyuan District, Erqi District to the vicinity of Xinzheng Airport, which extends eastward in Erqi District through Guancheng District to the western Zhengzhou Logistics Park in Zhongmu County, showing an overall “X” distribution, which is mainly due to the distribution of Zhengmin Expressway, Zheng Luan Expressway, Lianhuo Expressway, Xinzheng Port District and other traffic factors along the route. This is mainly due to the influence of traffic factors such as Zhengmin Expressway, Zhengluan Expressway, Lianhuo Expressway, and Xinzheng Port. The latter agglomeration phenomenon and logistics nodes are similar, based on which an agglomeration belt is formed from Shangjie Airport to the west of Zhongyuan District via Xingyang City, which is also influenced by the traffic factors of Shangjie Airport and Lianhuo Expressway. This shows that logistics enterprises are not very sensitive to the land price, which is because the general enterprises occupy a much smaller area than the logistics nodes and do not have high requirements for the site.
In order to study the aggregation ability of industrial parks and professional markets on POI, the seven parks with the strongest aggregation ability for logistics enterprises in industrial parks are selected through statistical analysis; the seven parks with the strongest aggregation ability for logistics nodes are taken; and the data of four professional markets are taken to calculate the POI distribution of industrial parks and professional markets in a 10 km range (Table 7 and Figure 20): industrial parks show a strong attraction for logistics enterprises and logistics the clustering of industrial parks and logistics nodes show a strong attraction. Logistics is the main means of external circulation of industrial park products, and the industrial chain between the two is complementary in some links; when the government plans the industrial layout, it places industrial parks and logistics industries in the neighboring position, which enhances the circulation of goods in industrial parks, facilitates the delivery of raw materials and finished products, and also promotes the development of logistics industries; at the same time, logistics nodes take advantage of land price, transportation, and industrial support to gather logistics enterprises, and then ensure the circulation quality of industrial goods through specialized services of logistics enterprises, which is in line with the expectation of Zhengzhou logistics planning and the current situation of industrial clustering. Among them, No. 71 Park Henan Aerospace Science and Technology Park is located in the center of Xinzheng Port District, which has the strongest logistics enterprise and logistics node gathering ability, indicating that the aerospace high-tech industry has higher demand for transportation resources, while 92 (garment industrial park) and 133 (high-tech enterprise gas pedal industrial park) are laid out in Zhongyuan District, indicating that the traditional handicraft industry and some high-tech industry subsidiary parks are still laid out In the traditional urban center, 12 and 197 are aluminum industrial parks, both located in Gongyi City, indicating that Gongyi City has industrial advantages in aluminum industry, 203 (intelligent terminal industrial park) and 213 (comprehensive trade industrial park) are located in the north and south of Xinzheng Port District, which are also oriented by the demand of traffic resources; the distribution pattern of professional markets is not obvious, among which 3 and 4. The distribution pattern of professional markets is not obvious, among which No. 3 and No. 4 professional markets are located in the core areas of Erqi District and Jinshui District, respectively, which show strong gathering ability for LE and LN because they are located in the logistics industry gathering center in the central area of the city, while No. 1 and No. 2 markets are located in the county-level cities on the periphery of the central city, and the gathering ability is also weak because the development of local logistics industry is not yet perfect.

3.4. Analysis of Distribution Pattern and Mode of Terminal Delivery Points

According to the 2021 POI data, there are 13,482 residential cell points and 2497 self-pickup points such as Cainiao post and FengSuo within Zhengzhou city. In this paper, we take 500 m as the delivery capacity range of self-pickup points to generate a buffer zone and study the coverage degree of self-pickup points to residential cells within Zhengzhou city (Figure 21). The results show that there are 12,002 neighborhoods within the coverage of 500 m self-pickup points, with a total percentage of 89.02%; the coverage degree of Zhongyuan District, Erqi District, Guancheng District, and Jinshui District in the central city of Zhengzhou reaches 94.67%, 95.14%, 92.46%, and 97.18%, respectively; the average coverage rate of Gongyi City, Dengfeng City, Xinmi City, Xingyang City, and Zhongmu County is 76.76%; 75.46% and 87.28% in Xinzheng City and Huizi District, respectively; the highest coverage rates are in Jinshui District and Zhongyuan District, reaching 97.18% and 94.67%, while the lowest coverage rates are in Xinmi City (66.53%) and Gongyi City (66.40%). The urban area of Zhengzhou, as the central area of the city, has a high coverage of self-pickup points. In contrast, the coverage of self-pickup points in the surrounding county-level cities is reduced. The main urban areas in county-level cities can also reach a coverage level similar to that of the central area of Zhengzhou city, and the main reason for their lower overall coverage is due to the relatively weak logistics-related infrastructure and fewer express enterprises in marginal and rural areas; the lack of concentration of express-related practitioners and the absence of a large-scale logistics industry cluster, which leads to higher costs of end delivery in the area; at the same time, these areas are in the accelerated stage of economic development, the economic volume is not enough to support the agglomeration of logistics industry, residents still mainly consume in physical stores, and network consumption has not developed to a certain scale; logistics resources are mainly attached to Zhengzhou logistics gathering center, and the sensitivity to local logistics network is not high.
At present, traditional logistics can no longer meet the overall demand of e-commerce at this stage. The timeliness of logistics, the degree of informationization, and the specialization of services are the urgent need for improvement in the logistics industry now. China’s mainstream e-commerce operating enterprises, such as Jingdong, Taobao, Suning, etc., generally adopt the delivery method of manual delivery or delivery in cooperation with logistics enterprises. However, the problem of “last mile” delivery remains serious, especially during the “Double 12”, “618” and other online shopping festivals launched by e-commerce enterprises, logistics enterprises, and the end delivery nodes are prone to large area explosion and delivery difficulties. The overall reasons can be divided into the following:
  • The distribution process is not reasonable. The distribution method of ordinary courier enterprises is generally first distributed by the city’s general distribution center to the regional distribution sites and then distributed by the site allocation staff according to the district, street, etc. distribution. In the case of small distribution volume, the disadvantages of this distribution method are not obvious, but due to the staff’s possession of a fixed delivery time, once the large shopping holiday goods cannot be delivered, there will be a backlog of goods, delivery delays, lost pieces and other phenomena.
  • The lower level of informationization in the logistics industry. Since there is no unified address coding system, the delivery address of the consignee cannot be precisely located, which brings inconvenience to the delivery. At the same time, the delivery person and the consignee generally use the way of telephone contact, which is a single way of communication and leads to a higher probability of delivery failure.
The end-delivery mechanism in Western developed countries is more perfect. In the United States, for example, delivery personnel in rural areas will generally be placed at the door of the recipient’s address or in public or private storage cabinets, and there are very few cases of misdelivery and loss of goods. And because the United States has a unified address coding system, delivery personnel rarely cannot find the address of the recipient.
In recent years, China’s relevant departments and the logistics industry have become aware of the many problems in the “last mile” distribution of e-commerce logistics and began to try to change the status quo, the three current optimized end-delivery methods are as follows:
  • Self-pickup. Logistics enterprises will no longer use the service process of manual home delivery after distributing goods to the final distribution site, and instead let the consignee pick up the goods at the distribution site by himself. This way to a certain extent alleviates the pressure of distribution, but not friendly to the consignee.
  • Set up cooperation points. Cooperation mode mainly appears in the range around the university city. Logistics companies and convenience stores form a cooperative relationship, so convenience stores play the role of receiving points, and pick-up points, for schools, neighborhoods, and other areas of high population density, the establishment of multiple convenience store cooperation points, in the delivery can be unified operation, and the consignee also get a certain degree of pick-up convenience, is a compromise end delivery method.
  • Independent pick-up point. Independent self-pickup point is an end delivery method developed on the basis of the first two models. Independent self-pickup points such as FengChao and Cainiao Post have the advantage of being more in-depth in the life of the consignee compared to convenience stores. Feng Chao can be an unmanned, completely independent pick-up, does not need to occupy large sites, and can achieve the effect of large area coverage, for small and medium-sized goods can use this delivery method. Rookie post can go deeper into residential areas, which is not restricted by the convenience store location selection factor and provides convenience for the delivery of medium and large goods.
In addition, most domestic logistics and express delivery enterprises on the “last mile” problem generally use customer pick-up and manual delivery at the same time comprehensive delivery method. General courier services are generally delivered to the pick-up point, for some long-term unclaimed, no nearby pick-up point, special requirements for the use of manual delivery of goods, part of the service as the core of high-end courier class enterprises (such as Jingdong, Shunfeng) is still mainly manual delivery. In short, the end delivery as the last link of the logistics process, high cost, and delivery difficulties, is an important factor affecting the development of e-commerce and logistics industry spatial distribution patterns.

4. Discussion

The empirical study shows that the logistics industry in Zhengzhou City presents significant spatial agglomeration characteristics. Among them, the government, in the process of industrial planning, changes the transportation location conditions by planning transportation routes and freight stations, allocates industrial park land, and influences land price rent, thus guiding the location selection behavior of enterprises and gradually realizing industrial agglomeration. Enterprises, on the other hand, meet the diversified needs of different customers through service differences.

4.1. The Driving Factors of the Spatial Layout of the Logistics Industry

4.1.1. Government Policies

The site selection, land use, management, and operation of logistics parks in China are heavily influenced by government policies. Infrastructure such as transportation and warehousing in logistics parks generally have government departments to invest and manage [30,31]. Zhengzhou logistics enterprises are mainly concentrated in two areas: first, the city center area with the railroad station as the core, which is the most original urban center of Zhengzhou and is a logistics cluster naturally formed in the 80s driven by railroad and automobile transportation, and there are rich logistics upstream and downstream industrial chains around this area, such as wholesale clothing market, commodity market, wholesale electronic parts market, etc.; second, the suburban area concentrated in the southeast of Zhengzhou. This area is adjacent to Xinzheng Aviation Port District, which is a logistics park planned by the government after 2010. We found that before 2000, when the Chinese government had not included the logistics industry as an important element of urban land use planning, the concentration of logistics upstream and downstream-related enterprises was more dependent on transportation factors when e-commerce had just started to develop in China and air transportation was not yet developed. Logistics enterprises still mainly relied on railroads and highways for the flow of goods. After 2000, with the improvement of transportation infrastructure such as the railroad, highway, and airport in Zhengzhou and the growth of land rent in the city, some logistics enterprises started to move from the city center to the suburbs. At the same time, the establishment of the Xinzheng aviation port area also accelerated the gathering of logistics enterprises near the aviation port. Although there are numerous complex factors for the location of logistics enterprises, the government’s land planning for logistics parks is the primary factor for the spatial distribution of logistics enterprises. Several studies have shown that these planning policies can have a significant impact on the location selection of enterprises. Wang and Jiang et al. [32,33] estimated the impact of various factors on logistics location selection by building a statistical model, and they found a direct relationship between the off-location selection of logistics parks in Ningbo and government planning. Liang et al. [18] studied the changes in the spatial location of port logistics institutions in the Shanghai metropolitan area and found that this government planning greatly influenced the spatial location selection of logistics industries and distributed them to the suburbs of the city. Cidell [34] measured the spatial concentration of logistics and warehousing activities using county-level data for 47 U.S. metropolitan areas and showed that most U.S. metropolitan areas experienced a decentralization of the spatial distribution of freight-related activities, which is closely linked to local government land use planning. Sheffi [35] points out that most logistics parks are initiated and promoted by the government or are the result of public-private partnerships, but within logistics parks, logistics institutions, and facilities are usually controlled by private companies. In China, government departments are more involved in land use decisions, and logistics clusters can be developed in planned logistics parks without occupying other sites as much as possible. Local governments plan logistics parks, provide investments in land and infrastructure, and are indirectly involved in the management of the parks.

4.1.2. Transportation

In the development process of logistics industry agglomerations, transportation has been ranked first as an important element in the location selection of logistics enterprises and logistics nodes [36]. The empirical study of Zhengzhou city shows that the industrial agglomeration form of the city center and Xinzheng Airport Logistics Park is formed around five traffic elements: Xinzheng Airport Port, Zheng Luan Expressway, Zhengmin Expressway, Beijing-Hong Kong-Macao Expressway, Shangdong Expressway, and Lianhuo Expressway. Among them, Zhengzhou’s logistics nodes in the main location advantages: four highways and the airport are adjacent to the Xinzheng Port area; Zhengzhou Logistics Industrial Park is adjacent to the Beijing-Hong Kong-Macao Expressway and Zhengmin Expressway; Road Halt Logistics Base is adjacent to Lianhuo Expressway; Guanghui Logistics Park adjacent to Zhengmin Expressway and Zheng Luan Expressway. It can be seen that the node areas of various types of traffic are an important layout of logistics nodes, with a significant agglomeration effect. In 2015, more than 62% of the logistics parks in China had more than two types of transportation connections, 14% of the parks had three types of transportation connections, and 87% of the logistics parks in China logistics park layouts focused on the convenience of transportation [21]. It indicates that transportation location is a common factor that influences LE and LN.

4.1.3. Informatization and Operation Efficiency

Logistics information technology is developed along with the development of enterprises, and the improvement of the level of logistics information technology will also promote the development of enterprises. The application of information and communication technology and warehouse automation technology [37], as well as online shopping, have revolutionized the mode of operation of express-type enterprises in the logistics industry [38]. Zhang et al. [39] believe that the Internet of Things will lead to a new integration of information technology in the logistics industry. The Internet of Things has greatly improved the efficiency of resource utilization among logistics enterprises. We believe that infrastructure construction is the premise of logistics information technology that can be applied. Insufficient investment in information technology, and the lack of information technology awareness, which directly leads to the high efficiency of the infrastructure is difficult to achieve its maximum effectiveness. This is not only the information sharing between enterprises, aviation, land, and air transport as part of the entire logistics industry, the integration of its information platform is also indispensable. There are numerous logistics enterprises have realized that industry clustering can improve the operational efficiency of enterprises [40]. Logistics includes many aspects: transportation, warehousing, packaging, loading and unloading, midway processing, information processing, customer service, etc. To maximize the efficiency of these aspects, all of them are inseparable from the information system because the flow of information runs through the entire supply chain process. Logistics information system includes various decision-making activities in the logistics process of material procurement, sales, storage, and transportation, such as procurement planning, sales planning, selection of suppliers, customer analysis, etc. It provides decision support and makes full use of the Internet to summarize and analyze logistics data, select, analyze, and discover new opportunities in logistics management, and then make better procurement, sales, and storage decisions, and can make full use of enterprise resources to Increase the content tapping and external use of the enterprise, thus reducing costs, improving productivity and enhancing the competitive advantage of the enterprise. However, because the logistics information system has many information sources, wide distribution, large amount of information, dynamic, fast decay of the value of information, high timeliness requirements of the special to. Therefore, the collection, processing, and handling of logistics information are required to be fast and varied. Each link within the logistics system also has different kinds of information and is closely related to other systems, such as the production system, sales system, supply system, consumption system, etc. Therefore, it is necessary to collect these categories of information, and to collect and process information, not only the network needed but also the upstream and downstream enterprises of the whole industry chain are clustered as much as possible in physical space.

4.1.4. Land Rental Cost

Land rent is another important factor influencing the choice of location of LE and LN. The distance from the transportation node directly determines the land rent in the area, while land rent in different geographic environments, such as ports, industrial parks, and CBDs, may also vary in magnitude [41]. Giuliano et al. [42] found decentralization of logistics firms in Los Angeles, but little migration of logistics firms in the other three major California metropolitan areas of San Francisco, San Diego, and Sacramento. Dablanc et al. [43] argue that differences in land rents between urban cores and suburbs, the availability of large parcels, and population density could together explain why some inner-city logistics firms have started to move like out-of-city. Empirical studies in Zhengzhou show that areas located in the periphery or suburbs of urban centers have become important zones for the agglomeration of public logistics nodes, and urban center areas have experienced weak agglomeration in the adjustment of urban functions. The old city, as the main business office area, is still a gathering place for many small logistics enterprises. The spatial pattern of LE and LN in Zhengzhou, dominated by the central city and the southeastern port area, is a full reflection of functional differentiation. The types of functions of logistics enterprises can be simplified into three categories: administrative office, operation management, and operation execution. The senior departments of logistics enterprises, such as information centers and administrative departments, are the least sensitive to land rent and do not need to occupy a large amount of land area, which are mainly located in the commercial centers of cities; the operation departments need to set up numerous offices in the management area to improve the management efficiency of enterprises, which are sensitive to land rent and are mostly located in the areas where the target customers are concentrated; the executive departments of logistics transportation, etc., are highly sensitive to land rent. They are highly sensitive to land rent and are generally located in transportation hubs on the outskirts of cities, such as the entrance of highways, airports, and ports.

4.1.5. Type of Business and Service Targets

Asset allocation determines the type of specialization and service objects of logistics enterprises, and logistics enterprises with heavy assets, as the core force of the development of the logistics industry, invest more in fixed assets and current assets in logistics industry, and such enterprises generally have a fixed mode of operation, poor flexibility and a single type of service; light asset enterprises are generally small and medium-sized courier enterprises and freight forwarders, which are the most numerous types of enterprises in the e-commerce era because of their fixed assets These enterprises are the most numerous types of enterprises in the era of e-commerce because of their less fixed assets and more flexible modes of operation [44,45]. Logistics nodes and logistics enterprises can achieve service support for different groups of customers through the differentiation of asset allocation. According to the actual situation in Zhengzhou, it can be found that different types of LE and LN show different levels of specialization in the whole process of logistics distribution. Enterprises and nodes have different asset configurations, service processes, distribution methods, etc. according to the different service targets. According to the traditional asset classification, we can divide the assets of logistics into two configurations current assets and fixed assets. For heavy assets and light assets two different types of enterprises, their spatial agglomeration and construction of the logistics industry play a different role, heavy assets enterprises have relatively more fixed assets and, a solid regional agglomeration degree. With the development of e-commerce development, new sales and business models are emerging. The traditional logistics industry plays a basic role while the demand for information technology is getting higher and higher. The use of high technology and new business management models on the impact of the location factors gradually emerge. In the market segments of general merchandise, small cargo, and express delivery, many platforms of technology-based asset-light logistics enterprises have emerged, which are insensitive to the traditional constraints of location selection and have strong adaptability, and to a certain extent, have divided the degree of industrial agglomeration.
Influenced by urban expansion and functional area adjustment and optimization, the spatial differentiation process of logistics gradually shifts from the old city to the outside during the process of logistics industry center generally shows four changes: 1. The volume and weight of goods keep getting bigger; 2. The service segmentation becomes clearer and more specialized; 3. The business scope of logistics nodes is transformed. Among them, factors such as supply and demand, transportation, land price, and asset allocation in the region determine the transformation of the logistics industry.

4.1.6. Economic Level of the Region

The relationship between industrial agglomeration and economic development has been the focus of economists’ attention since theories related to industrial clusters were proposed. According to Marshall [46], industrial agglomeration may cause the phenomenon of “internal economy” and “external economy”, both of which will drive the development of the regional economy. The development of industrial agglomeration and the continuous expansion of enterprise-scale make the unit cost of enterprises decrease, thus generating an internal scale effect; industrial agglomeration in space, sharing labor market, and industrial affiliated services make the cost of the whole industry decrease, thus generating economic spillover effect. The spatial agglomeration of logistics enterprises is one of the most obvious features of the logistics industry agglomeration process. According to the theory of industrial clusters, the spatial clustering of logistics enterprises will bring an “external economic” effect, and the existence of this effect will strengthen the regional agglomeration ability. The external economic effect will reduce the logistics production and transaction costs, based on the principle of profit maximization, enterprises are more willing to concentrate in geographical areas with low production costs, and the continuous gathering of the logistics industry expands the market scale of the regional logistics industry, which in turn will prompt more logistics enterprises to pursue lower transaction costs in this production layout, and this effect makes the agglomeration effect self-loop and continuously strengthen the regional agglomeration capacity. In addition, the agglomeration effect brought by logistics agglomeration strengthens the external economic effect between regions by radiating neighboring regions and promoting the economic growth of the whole region.

5. Conclusions

Logistics enterprises are the organizers of logistics activities, logistics nodes are the entities that carry them, and logistics zones with a certain spatial structure are formed under the layout of LE and LN. In the study, it was found that the spatial layout of the logistics industry in Zhengzhou City is more significantly influenced by the government’s planning and guidance than in other coastal port cities, and there is also a significant positive relationship with the economic level of the region. In previous studies, land rent and cargo sources are usually considered to be the focus of influencing the layout of logistics as well, but this phenomenon is not significant in Zhengzhou City, which indicates that the self-organization of industrial space is relatively weak and more dependent on the government in the process of development of logistics industry in Zhengzhou City. Therefore, the rationality of the government’s spatial planning for the logistics industry has become the cornerstone of the future development of the logistics industry.
The study found that: 1. The high degree of enterprise participation in government planning, with government planning as the forerunner and enterprise development as the driving force, Zhengzhou has formed an agglomerated and efficient core of the logistics industry. 2. In the process of urban expansion, logistics location has a significant suburbanization trend, influenced by the transformation of the city’s functional areas and business model, although a large number of logistics enterprises are still distributed in the central area of the city, which differs from the government planning, a part of the logistics enterprises will gradually shift to the periphery of the city as the degree of concentration of logistics industry in the periphery of the city increases. 3. The problem of end delivery difficulties is still serious. Although the central city of Zhengzhou has reached a considerable degree of self-service delivery coverage, the end delivery service in the peripheral areas, county-level cities, towns, and other areas still has problems such as high cost, low efficiency, and delivery difficulties, and the mode of setting up self-service delivery points is obviously not suitable for these areas. 4. For a long time there has been no unified standard in China’s logistics industry, China Post, Shunfeng, Jingdong, and other platforms are using their own independent address coding system, and scholars study common POI data due to the collection and classification of a wide range of different degrees of refinement, resulting in the study of data expression is not comprehensive, not uniform. The State Postal Administration has started to implement the Rules for the Preparation of Mailing Address Codes in recent years, which aims to promote the unification of standards within the industry. With the further development of e-commerce, the asset ratios and service objects of the logistics industry will certainly usher in greater changes, the specialized market of logistics enterprises will continue to be subdivided, and end delivery will continue to face huge challenges, perhaps resulting in a new logistics space pattern. In the process of the gradual shift from the real economy to the virtual economy, the logistics industry is more closely linked to the new economic development model, which is conducive to the formation of a logistics location theory in line with China’s national conditions.
This study still has the following shortcomings: 1. The city gridding model used in this study, although better results were obtained in the case of Zhengzhou City, there is no guarantee that this model is generalizable. This is because the parameterization of this model is extremely complex. If it is to be used in other scales or regions, it is difficult to guarantee the accuracy and results. This requires further optimization of the model in the future to increase its versatility. 2. Different functional types of logistics enterprises have different spatial directionality. However, the categorization of the logistics industry in this study is relatively rough, which can only study the overall state of the logistics industry in Zhengzhou City. In the future study, we will categorize the logistics industry in a more detailed way in order to reveal the spatial layout characteristics and driving factors of the logistics industry in a more in-depth way. 3. The case regions in this study have relatively unique natural, economic, and policy environments, and the findings are unique. However, this study lacks comparative analysis and discussion with other regions. This is because this paper uses a modeling method that is not quite the same as that of other scholars, which leads to the fact that the results of this study can only be differentiated from other scholars’ conclusions on the differences, but not through empirical analysis to distinguish between the differences in the study area, and this method of comparison will bias the results. The authors will further study other study areas in the future based on this study, using improved methods to explore the differences between different study areas through empirical analysis.

Author Contributions

Conceptualization, C.M.; Methodology, X.Z.; Software, X.Z.; Validation, X.Z.; Formal analysis, X.Z.; Writing—original draft, X.Z.; Supervision, C.M.; Project administration, C.M.; Funding acquisition, C.M. All authors have read and agreed to the published version of the manuscript.

Funding

This research was funded by the National Natural Science Foundation of China (Fund project host: Miao Changhong), grant number 42171186; The Major Project of China National Social Science Fund in Art (Foundation sub-project host: Miao Changhong), grant number 21ZD03.

Institutional Review Board Statement

Not applicable.

Informed Consent Statement

Not applicable.

Data Availability Statement

(1)Based on the open API platform of Gaode Map (https://lbs.amap.com, accessed on 2 May 2021), the keywords of “logistics”, “transportation”, and “post office express” were selected; (2) Population, Henan provincial political subdivision data from the Geographic State Monitoring Cloud Platform (https://www.resdc.cn/, accessed on 5 July 2021); (3) administrative divisions, roads, rivers, and other auxiliary data from the Geographic State Monitoring Cloud Platform (https://www.resdc.cn/, accessed on 18 July 2021); (4) total population and GDP data of the study area from the statistical yearbooks from each time period (http://www.henan.gov.cn/, accessed on 19 July 2021).

Conflicts of Interest

The authors declare no conflict of interest.

Appendix A

Figure A1. GWR Coefficient of Express/Postal Enterprise.
Sustainability 15 15574 g0a1
Figure A2. GWR Coefficient of Traditional Logistics Enterprise.
Sustainability 15 15574 g0a2
Figure A3. GWR Coefficient of Logistics Nodes.
Sustainability 15 15574 g0a3
Figure A4. GWR Coefficient of Logistics Park.
Sustainability 15 15574 g0a4

References

  1. Sheffi, Y. Logistics Clusters: Delivering Value and Driving Growth; MIT Press: Cambridge, MA, USA, 2012. [Google Scholar]
  2. Rivera, L.; Sheffi, Y.; Welsch, R. Logistics agglomeration in the US. Transp. Res. Part A Policy Pract. 2014, 59, 222–238. [Google Scholar] [CrossRef]
  3. Rodrigue, J.-P.; Dablanc, L.; Giuliano, G. The freight landscape: Convergence and divergence in urban freight distribution. J. Transp. Land Use 2017, 10, 557–572. [Google Scholar] [CrossRef]
  4. Goh, M.; Ling, C. Logistics development in China. Int. J. Phys. Distrib. Logist. Manag. 2003, 33, 886–917. [Google Scholar] [CrossRef]
  5. Liu, S.; Li, G.; Jin, F. Quantitative measurement and development evaluation of logistics clusters in China. J. Geogr. Sci. 2018, 73, 1540–1555. [Google Scholar]
  6. Li, X. The analysis on the factors of developing Zhengzhou City into a regional center of international logistics. In Proceedings of the International Conference on Advances in Education and Management, Dalian, China, 6–7 August 2011; pp. 586–591. [Google Scholar]
  7. Chen, F.; Lee, C.-Y. Logistics in China. In Handbook of Global Logistics; Springer: Berlin/Heidelberg, Germany, 2013; pp. 3–26. [Google Scholar]
  8. Wu, S.-y.; Liu, J.-h. An Analysis of the Status Quo and Features of International Logistics Research. China Bus. Mark. 2012, 3, 32–36. [Google Scholar]
  9. Sakai, T.; Kawamura, K.; Hyodo, T. Evaluation of the spatial pattern of logistics facilities using urban logistics land-use and traffic simulator. J. Transp. Geogr. 2019, 74, 145–160. [Google Scholar] [CrossRef]
  10. Giuliano, G.; Kang, S. Spatial dynamics of the logistics industry: Evidence from California. J. Transp. Geogr. 2018, 66, 248–258. [Google Scholar] [CrossRef]
  11. Heitz, A.; Launay, P.; Beziat, A. Heterogeneity of logistics facilities: An issue for a better understanding and planning of the location of logistics facilities. Eur. Transp. Res. Rev. 2019, 11, 5. [Google Scholar] [CrossRef]
  12. Iwan, S.; Kijewska, K.; Lemke, J. Analysis of parcel lockers’ efficiency as the last mile delivery solution—The results of the research in Poland. Transp. Res. Procedia 2016, 12, 644–655. [Google Scholar] [CrossRef]
  13. Punakivi, M.; Yrjölä, H.; Holmström, J. Solving the last mile issue: Reception box or delivery box? Int. J. Phys. Distrib. Logist. Manag. 2001, 31, 427–439. [Google Scholar] [CrossRef]
  14. Castillo, V.E.; Bell, J.E.; Rose, W.J.; Rodrigues, A.M. Crowdsourcing last mile delivery: Strategic implications and future research directions. J. Bus. Logist. 2018, 39, 7–25. [Google Scholar] [CrossRef]
  15. Mangiaracina, R.; Perego, A.; Seghezzi, A.; Tumino, A. Innovative solutions to increase last-mile delivery efficiency in B2C e-commerce: A literature review. Int. J. Phys. Distrib. Logist. Manag. 2019, 49, 901–920. [Google Scholar] [CrossRef]
  16. Xu, X.; Wang, Y. Study on spatial spillover effects of logistics industry development for economic growth in the Yangtze River delta city cluster based on spatial durbin model. Int. J. Environ. Res. Public Health 2017, 14, 1508. [Google Scholar] [CrossRef] [PubMed]
  17. Cao, W. Spatial pattern and location evolution of urban logistics enterprises: Taking Suzhou as an example. Geogr. Res. 2011, 30, 1997–2007. [Google Scholar]
  18. Liang, S.; Cao, Y.; Wu, W. Spatial pattern evolution of port logistics enterprises in Shanghai metropolitan area. Geogr. Res. 2013, 32, 1448–1456. [Google Scholar]
  19. Tian, X.; Zhang, M. Research on Spatial Correlations and Influencing Factors of Logistics Industry Development Level. Sustainability 2019, 11, 1356. [Google Scholar] [CrossRef]
  20. Qian, Q.; Chen, Y.; Li, Y.; Mo, X. Spatial distribution of logistics enterprises in Guangzhou and its influencing factors. Geogr. Res. 2011, 30, 1254–1261. [Google Scholar]
  21. Li, G.; Jin, F.; Chen, Y.; Jiao, J.; Liu, S. Location characteristics and differentiation mechanism of logistics nodes and logistics enterprises based on points of interest (POI): A case study of Beijing. J. Geogr. Sci. 2017, 27, 879–896. [Google Scholar] [CrossRef]
  22. Yang, Z.; Deng, E.; Lin, A. Hunan Logistics Industry Cluster System Planning Studies. Econ. Geogr. 2010, 3, 426–430. [Google Scholar]
  23. Hong, Y. Research on port logistics and coastal economic development. J. Coast. Res. 2020, 115, 280–282. [Google Scholar] [CrossRef]
  24. Cai, H.; Xu, Y. Research on the development pattern and effect mechanism of logistics industry in the Yangtze River Delta—Based on the perspective of spatial economics. East China Econ. Manag. 2016, 30, 15–23. [Google Scholar]
  25. Han, H.; Yang, C.; Song, J. Scenario simulation and the prediction of land use and land cover change in Beijing, China. Sustainability 2015, 7, 4260–4279. [Google Scholar] [CrossRef]
  26. GB/T 24358-2019; Classification and Planning Fundamental Requirements of Logistics Center. Standardization Administration of China: Beijing, China, 2019.
  27. GB/T 19680-2005; Classification and Evaluation Indicators of Logistics Enterprises. Standardization Administration of China: Beijing, China, 2005.
  28. Hai-jun, M.; Yong, Z.; Xu-hong, L. Logistics enterprise classifying model. J. Traffic Transp. Eng. 2005, 5, 117–121. [Google Scholar]
  29. CJJ37-2012; Urban Road Engineering Specification. Ministry of Housing and Urban Rural Development of the People’s Republic of China: Beijing, China, 2012.
  30. Wang, Z. The exploration of the development of logistics park and innovation on it. China Bus. Mark. 2009, 23, 4–6. [Google Scholar]
  31. Yu, W.; Ding, W.; Liu, K. The planning, building and developing of logistics parks in China: Review of theory and practice. Chin. USA Bus. Rev. 2005, 4, 73–78. [Google Scholar]
  32. Wang, R.; Jiang, T.; Wang, S. Spatial pattern and location selection of port logistics enterprises in Ningbo. Sci. Geogr. Sin. 2018, 38, 691–698. [Google Scholar]
  33. Jiang, T.-y.; Shi, Y.-n. The spatial pattern evolution and influencing factors of logistics enterprises in Ningbo. Econ. Geogr. 2015, 35, 130–138. [Google Scholar]
  34. Cidell, J. Concentration and decentralization: The new geography of freight distribution in US metropolitan areas. J. Transp. Geogr. 2010, 18, 363–371. [Google Scholar] [CrossRef]
  35. Sheffi, Y. Logistics intensive clusters. Época/Epoch 2010, 20, 11–17. [Google Scholar]
  36. Cho, H.; Lee, J. Does transportation size matter for competitiveness in the logistics industry? The cases of maritime and air transportation. Asian J. Shipp. Logist. 2020, 36, 214–223. [Google Scholar] [CrossRef]
  37. Granlund, A.; Wiktorsson, M. Automation in internal logistics: Strategic and operational challenges. Int. J. Logist. Syst. Manag. 2014, 18, 538–558. [Google Scholar] [CrossRef]
  38. Wang, J.J.; Xiao, Z. Co-evolution between etailing and parcel express industry and its geographical imprints: The case of China. J. Transp. Geogr. 2015, 46, 20–34. [Google Scholar] [CrossRef]
  39. Zhang, G.; Feng, L.; Zhang, H.; Cai, X. Application and Innovation of Computer Internet of Things Technology in Logistics. In Data Processing Techniques and Applications for Cyber-Physical Systems (DPTA 2019); Springer: Berlin/Heidelberg, Germany, 2020; pp. 999–1006. [Google Scholar]
  40. Rivera, L.; Gligor, D.; Sheffi, Y. The benefits of logistics clustering. Int. J. Phys. Distrib. Logist. Manag. 2016, 46, 242–268. [Google Scholar] [CrossRef]
  41. Verhetsel, A.; Kessels, R.; Goos, P.; Zijlstra, T.; Blomme, N.; Cant, J. Location of logistics companies: A stated preference study to disentangle the impact of accessibility. J. Transp. Geogr. 2015, 42, 110–121. [Google Scholar] [CrossRef]
  42. Giuliano, G.; Kang, S.; Yuan, Q.; Center, M.T. Spatial Dynamics of the Logistics Industry and Implications for Freight Flows; METRANS Transportation Center: Long Beach, CA, USA, 2016. [Google Scholar]
  43. Dablanc, L.; Zeting, L.; Koning, M.; Klausberg, J.; De Oliveira, L. Observatory of Strategic Developments Impacting Urban Logistics (2017 Version). 2017. Available online: https://hal.science/hal-01627824/document (accessed on 20 May 2021).
  44. Yao, X.S.; Ying, J.L.; Cao, L.X. Study on the Integration of Regional Logistics Resources Based on SOA. Adv. Mater. Res. 2012, 482, 2153–2156. [Google Scholar] [CrossRef]
  45. Yang, Y.H. The development of logistics services in the United States. J. Oper. Supply Chain. Manag. 2015, 8, 23–35. [Google Scholar] [CrossRef]
  46. Marshall, A. Principles of Economics: Unabridged Eighth Edition; Cosimo, Inc.: New York, NY, USA, 2009. [Google Scholar]
Figure 1. Clustering Analysis of Literature.
Sustainability 15 15574 g001
Figure 2. Research Roadmap.
Sustainability 15 15574 g002
Figure 3. Spatial distribution of the POIs by type in 2021.
Sustainability 15 15574 g003
Figure 4. Quantification of road indicators.
Sustainability 15 15574 g004
Figure 5. Simulation diagram of grid division (The letter A represents POI data).
Sustainability 15 15574 g005
Figure 6. Flow chart of urban grid division.
Sustainability 15 15574 g006
Figure 7. The Kernel Density of Logistics Enterprises in Zhengzhou in (a) 2010, (b) 2015 and (c) 2021.
Sustainability 15 15574 g007
Figure 8. The number of POIs of logistics enterprises and logistics nodes in different regions in 2021.
Sustainability 15 15574 g008
Figure 9. The elliptical distribution of standard deviation for all of POIs.
Sustainability 15 15574 g009
Figure 10. The elliptical distribution of standard deviation for different types of POIs.
Sustainability 15 15574 g010
Figure 11. Kernel density analysis of (a) logistics enterprise, (b) logistics nodes, (c) logistics facilities.
Sustainability 15 15574 g011
Figure 12. Impactor factors result.
Sustainability 15 15574 g012
Figure 13. GWR coefficients between population factors and (a) Express/Postal enterprise, (b) Traditional logistics enterprise, (c) logistics nodes, and (d) logistics park.
Sustainability 15 15574 g013
Figure 14. GWR coefficient between (a) express enterprise and residential points, (b) traditional logistics enterprises and industrial parks, (c) logistics nodes and enterprises, (d) logistics parks and industrial parks.
Sustainability 15 15574 g014
Figure 15. Intersection factors result of (a) Express/Postal enterprise, (b) Traditional logistics enterprise, (c) logistics nodes, (d) logistics park.
Sustainability 15 15574 g015
Figure 16. Average distance from different types of logistics nodes and enterprises to the center.
Sustainability 15 15574 g016
Figure 17. Distance/frequency distribution for LE and LN.
Sustainability 15 15574 g017
Figure 18. Density distribution of POI around highway and railway freight stations.
Sustainability 15 15574 g018
Figure 19. Distribution of LE and LN on buffer zone analysis: (a) LN and Railway; (b) LN and Highway; (c) LE and railway; (d) LE and Highway.
Sustainability 15 15574 g019
Figure 20. Statistics of LE and LN in the vicinity of Professional market.
Sustainability 15 15574 g020
Figure 21. Coverage of pick-up point in Zhengzhou.
Sustainability 15 15574 g021
Table 1. Comparison of spatial characteristics between China and international logistics industries.
RegionSpatial Distribution CharacteristicsAgglomeration Diffusion ModeDrivers
International
(logistics developed countries)
Logistics enterprises: A “center-periphery” spatial pattern, with headquarters located in the central area of the city and departments such as warehousing and transportation distributed in the outskirts of the city or satellite cities.
Logistics nodes: distributed in urban fringe areas and port areas
The logistics industry is greatly influenced by self-organization mechanisms and less influenced by government guidance. When the logistics industry is excessively clustered, logistics enterprises move out of their original logistics clusters and form clusters in new industrial spaces.
The size and function of the original logistics cluster will not undergo significant changes.
Land rent
labor force
market
Customer resources
Industrial chain level
ChinaLogistics enterprises: A “multi core” spatial pattern, most of which form three core agglomeration areas around transportation hubs, markets, and urban edges.
Logistics nodes: distributed in urban fringe areas and port areas.
The logistics industry is strongly guided by government planning. When logistics enterprises excessively gather in space, the government will plan new land as a logistics service space. The logistics enterprise as a whole has migrated to the planned land, and the original logistics cluster has disappeared.Government guidance
Regional economic level
market
labor force
Customer resources
Table 2. Classification and coding of research samples.
CategoryClass
Logistics NodesLogistics Park
Logistics Center
Distribution and dispatch center
Freight yards
Logistics EnterpriseCourier and postal category
Storage and transportation category
Freight forwarding class
Comprehensive logistics class
Logistics-related facilitiesBonded category
Transportation
Industrial Park category
Integrated market category
Table 3. Variable parameters for road selection.
Input ParametersIllustrate
P R L Road length factor
P R W Road width factor
P R S Road speed limiting factors
P R P Road frequency factor extracted by POI
P R I Road importance value
P F Traffic flow on the road
P V Threshold for road selection
Table 4. Model parameter of road select.
Model ParameterIllustrate
P G Administrative Division Data
P R Road data
P A Supporting elements: Humanistic and natural elements
P P Target Theme POI Data
Table 5. Independent variable selection and variable description.
FactorsIndependent VariableVariable Explanation
Economic FactorsGDPGDP in 2020
Social factorsPopPop in 2020
ResidentialNumber of residential points
Land rentalLand sale price
Traffic factorsPublic transportation facilitiesNumber of public transportation facilities
Road network densityRatio of road length to area
Clustering FactorsEnterpriseNumber of other types of enterprises
Industrial ParkNumber of Industrial Park
MarketNumber of Market
Business buildingsNumber of Business buildings
Table 6. The degree of agglomeration of the logistics industry in Zhengzhou.
Zhengzhou Logistics Industry Concentration Evaluation Results
YearLQHCLQLED
20192.63316448.275390.010367
20180.839925−4.490160.003313
20170.806939−4.715860.003251
20160.802247−3.365310.003271
20150.7629−2.62610.003133
20140.700889−3.417550.002909
20130.722984−2.654780.002972
20120.751327−2.623010.002601
Table 7. Statistics of LE and LN in the vicinity of Industrial Park.
Park NumberNumber of EnterprisesPark NumberNumber of Nodes
12116471106
711168406106
921162544107
1331224701108
1971125729106
2031187911107
2131192915108
Disclaimer/Publisher’s Note: The statements, opinions and data contained in all publications are solely those of the individual author(s) and contributor(s) and not of MDPI and/or the editor(s). MDPI and/or the editor(s) disclaim responsibility for any injury to people or property resulting from any ideas, methods, instructions or products referred to in the content.

