

The Impact of Urban Form and Density on Residential Energy Use: A Systematic Review


Abstract
:1. Introduction
1.1. Previous Reviews and the Gaps
1.2. Research Questions
- Is there any consensus among scholars over their findings about the impact of density on residential energy use? Which parameters lead them to contradictory conclusions?
- Which urban form variables are frequently used to represent the urban form’s complexity, and what are their correlations and interpretations?
- Which methodologies are used in the literature to elicit the association between urban form and residential energy use?
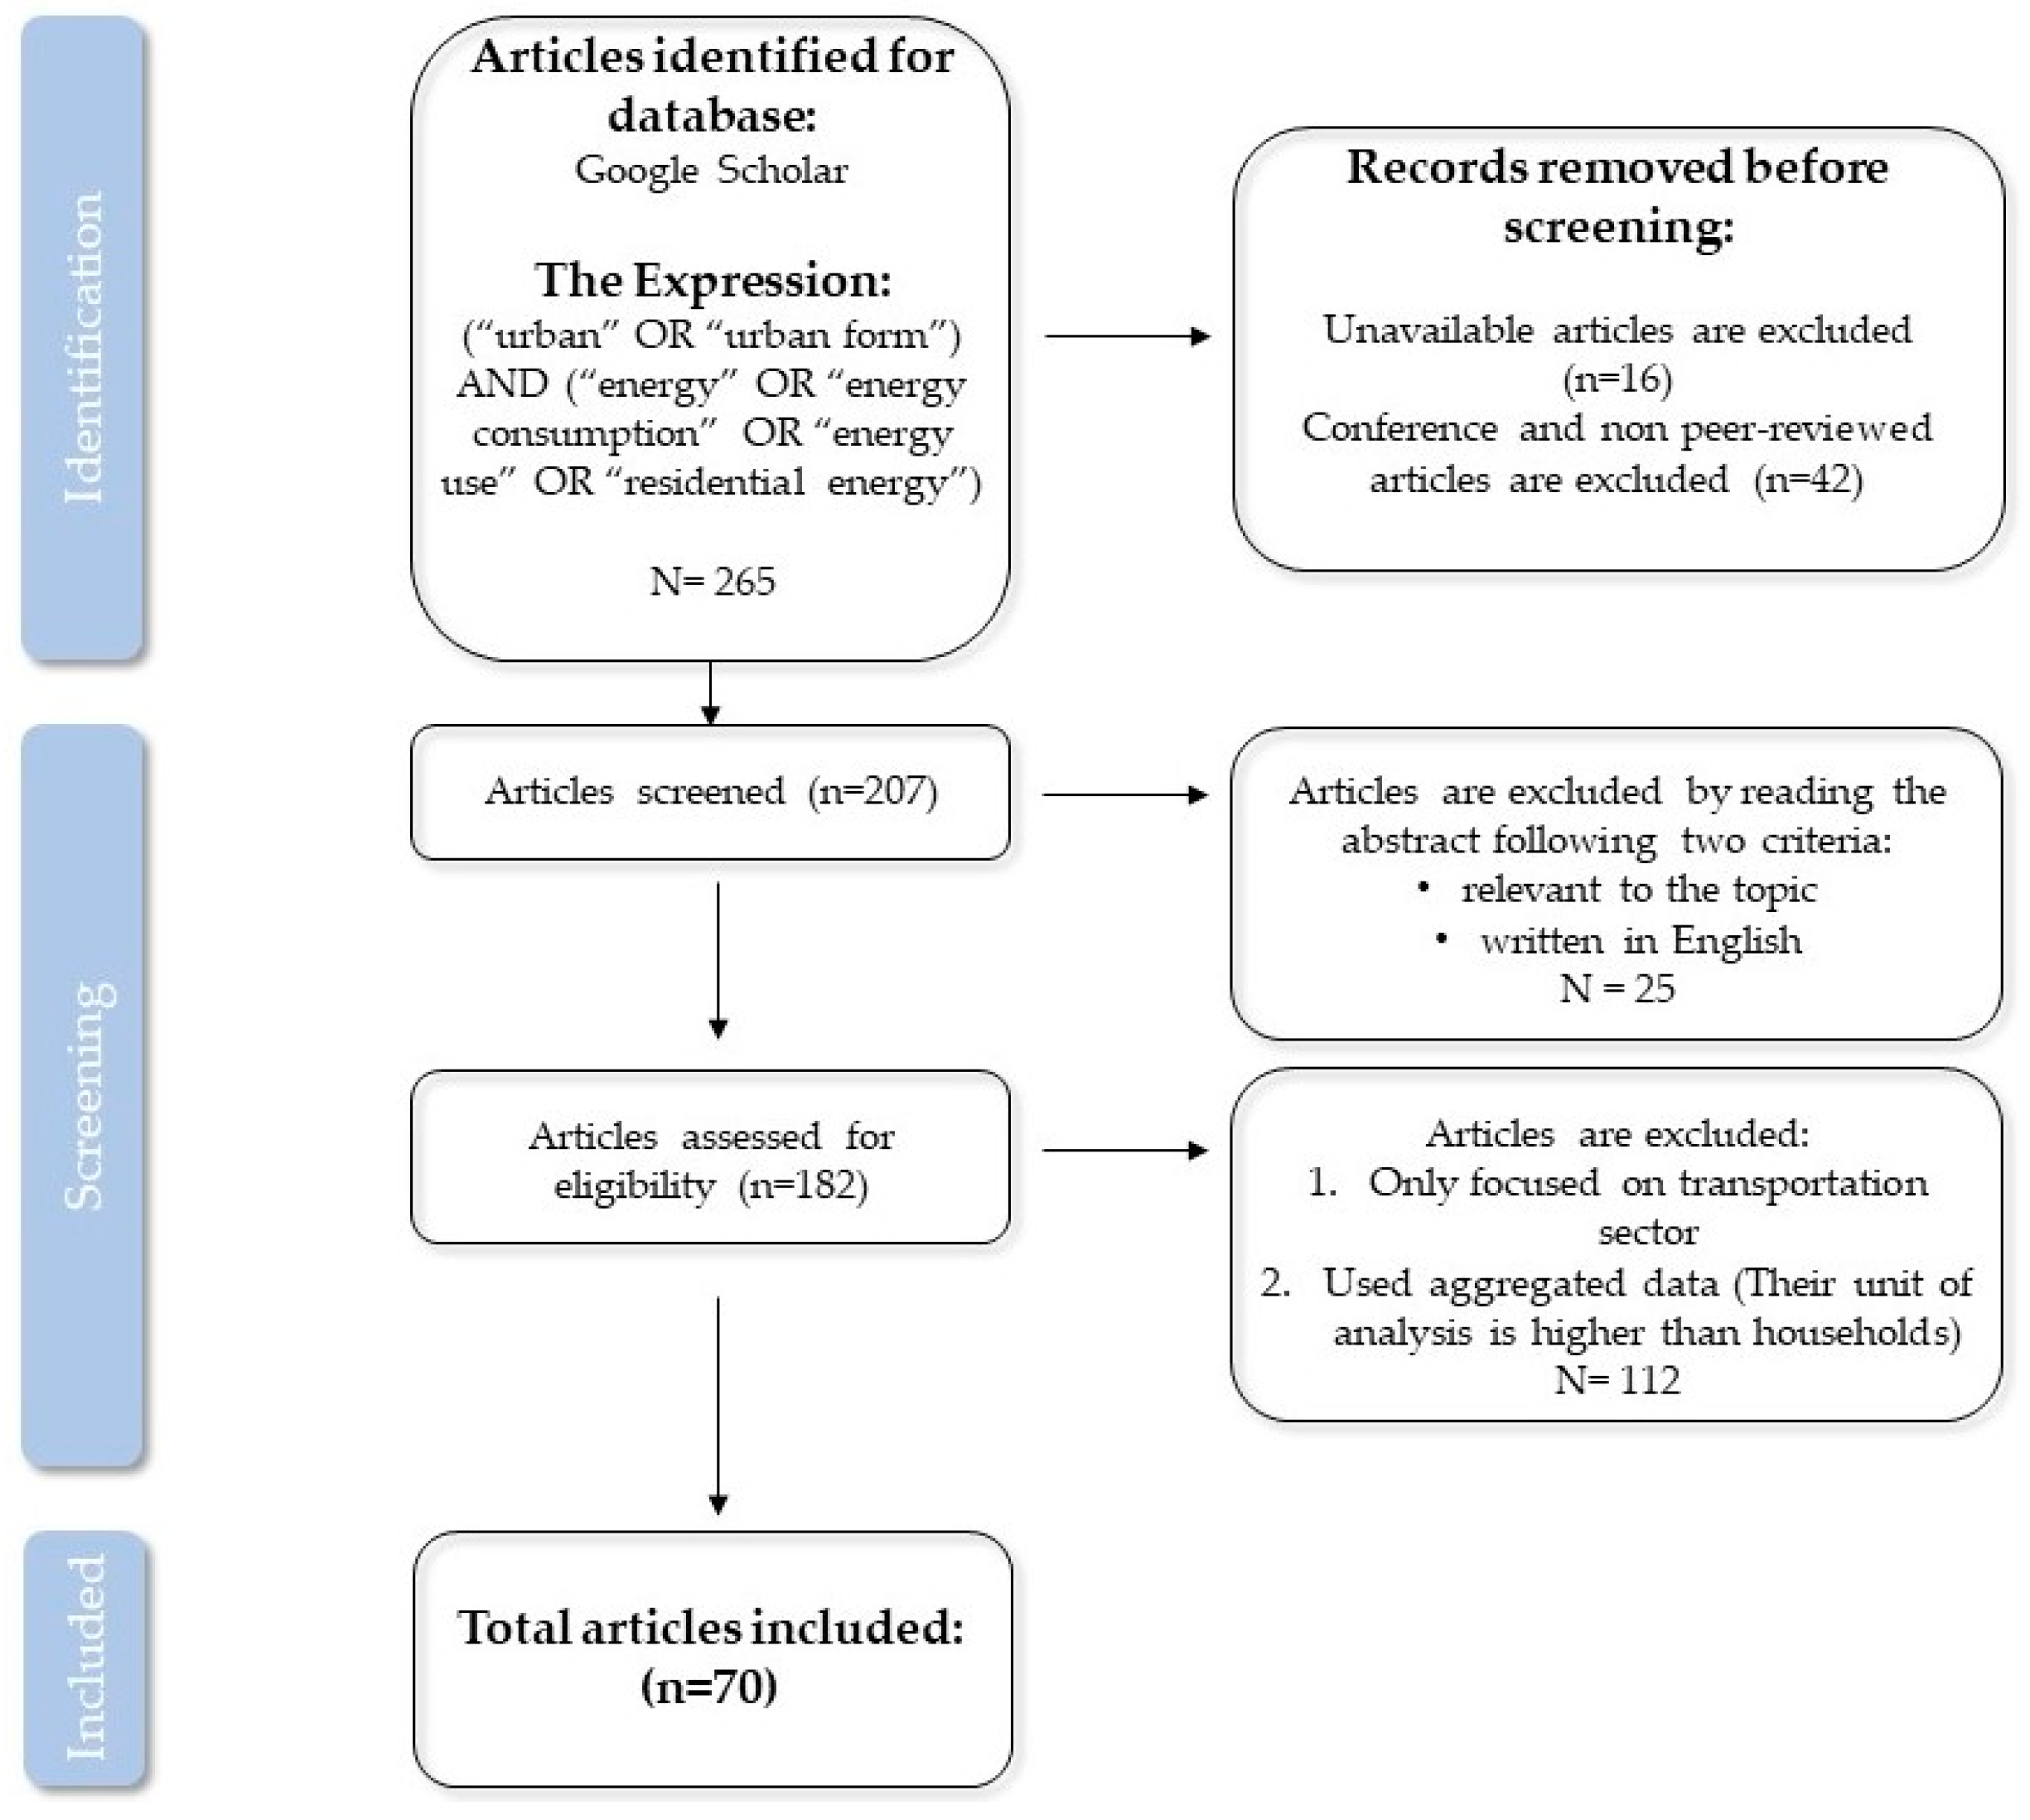
2. Materials and Methods
3. Results
3.1. Urban Form and Density on Residential Energy Use
3.1.1. Limitation of the Data Sources
3.1.2. The Units of Measurement
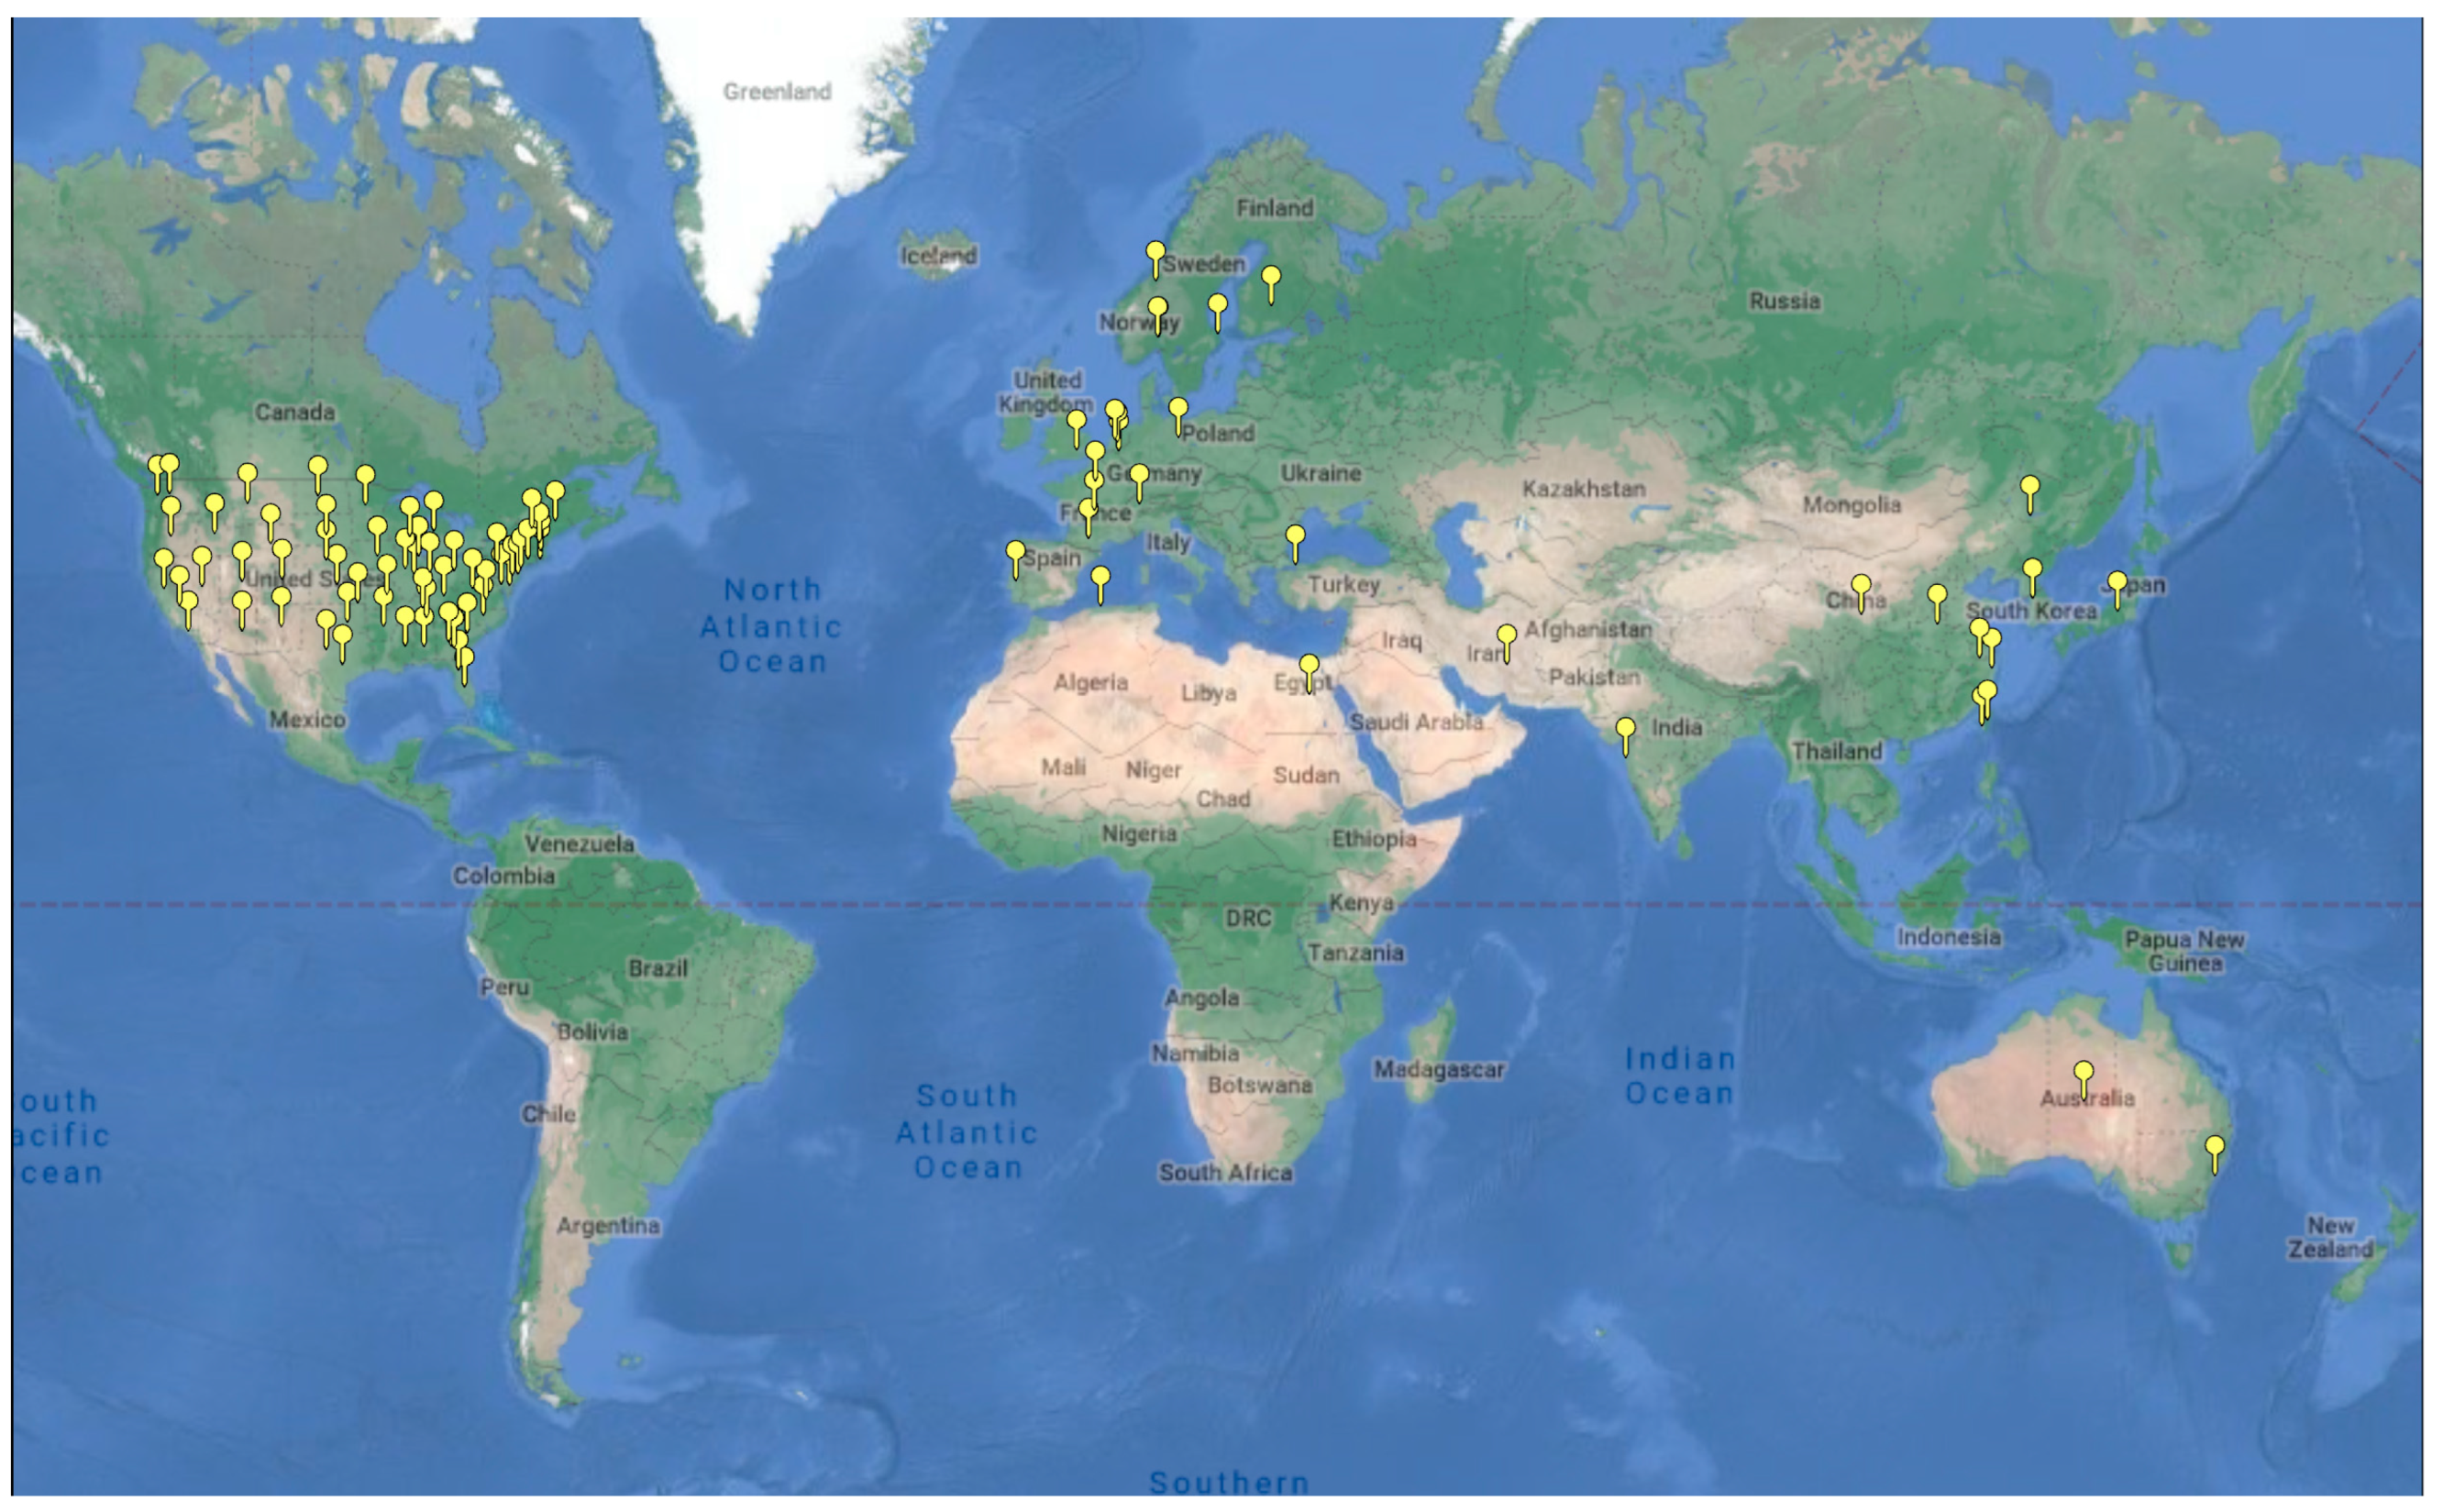
3.1.3. Climate Zone
3.1.4. Energy Type
3.1.5. Data Reliability
3.1.6. Relevancy
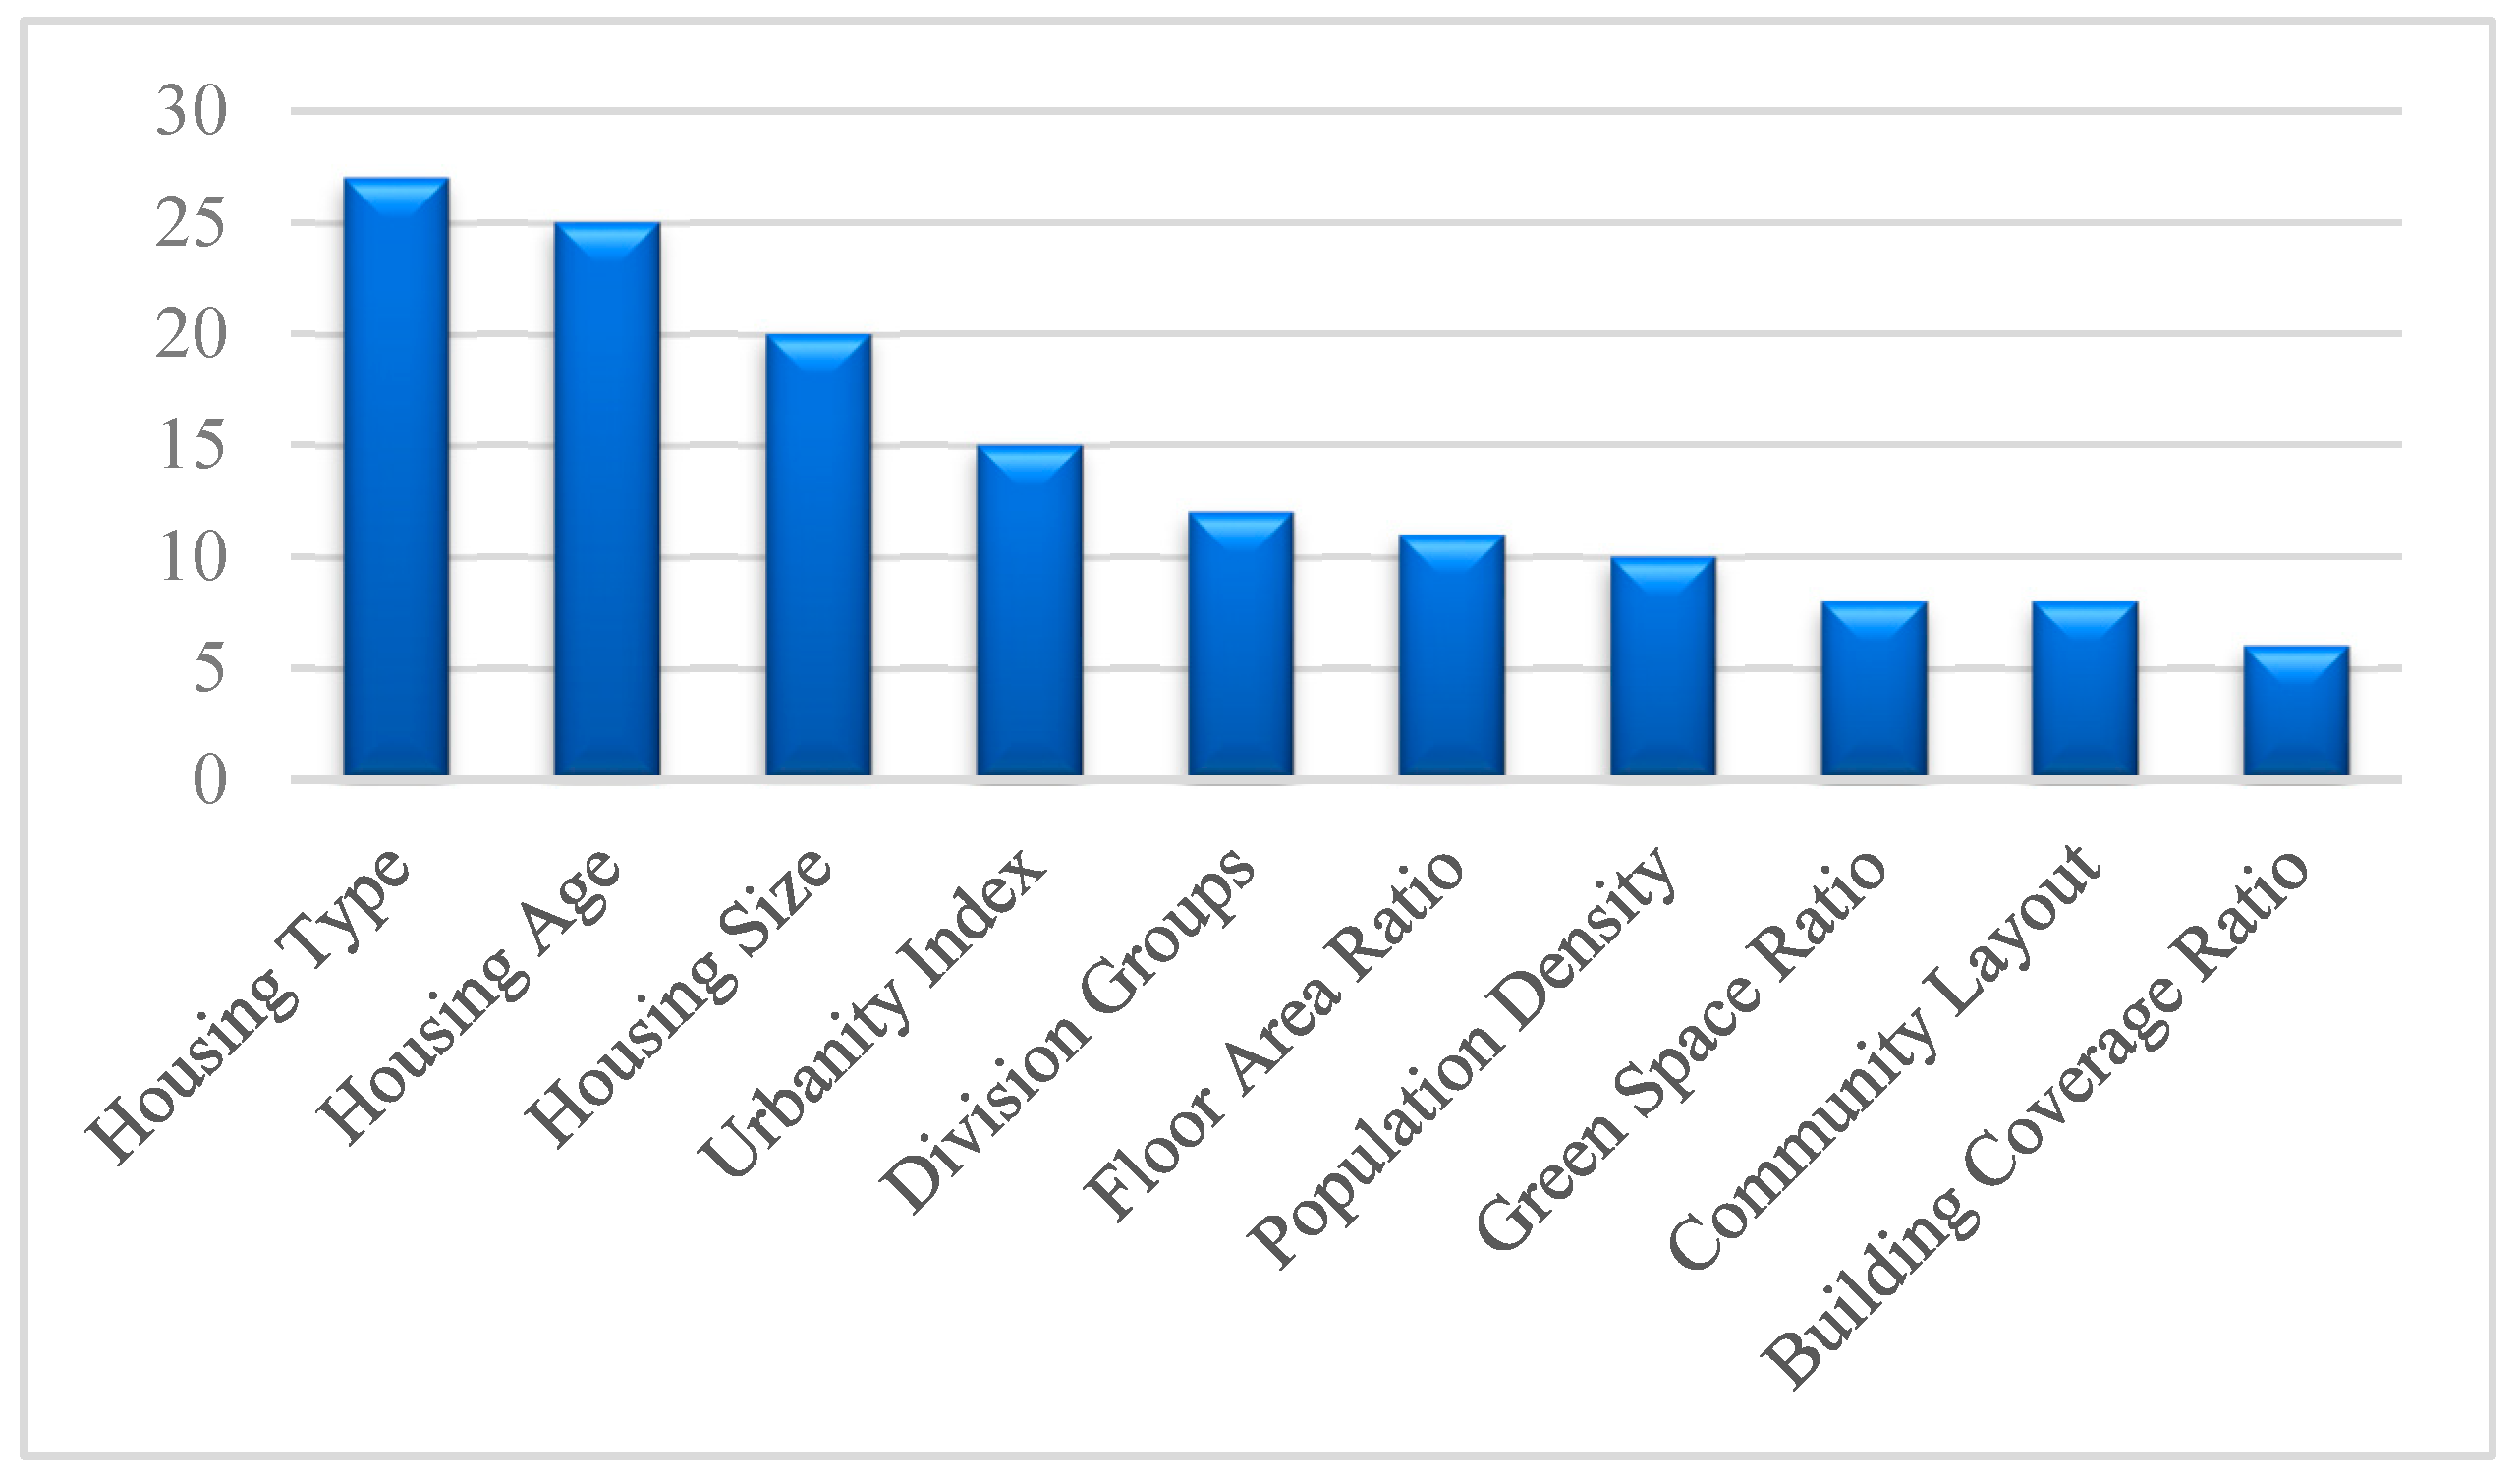
3.1.7. Variables and Methodologies
- Urban Form variables
- Housing Type
- 2.
- Housing Age
- 3.
- Housing Size
- 4.
- Urbanity Index
- 5.
- Floor Area Ratio
- 6.
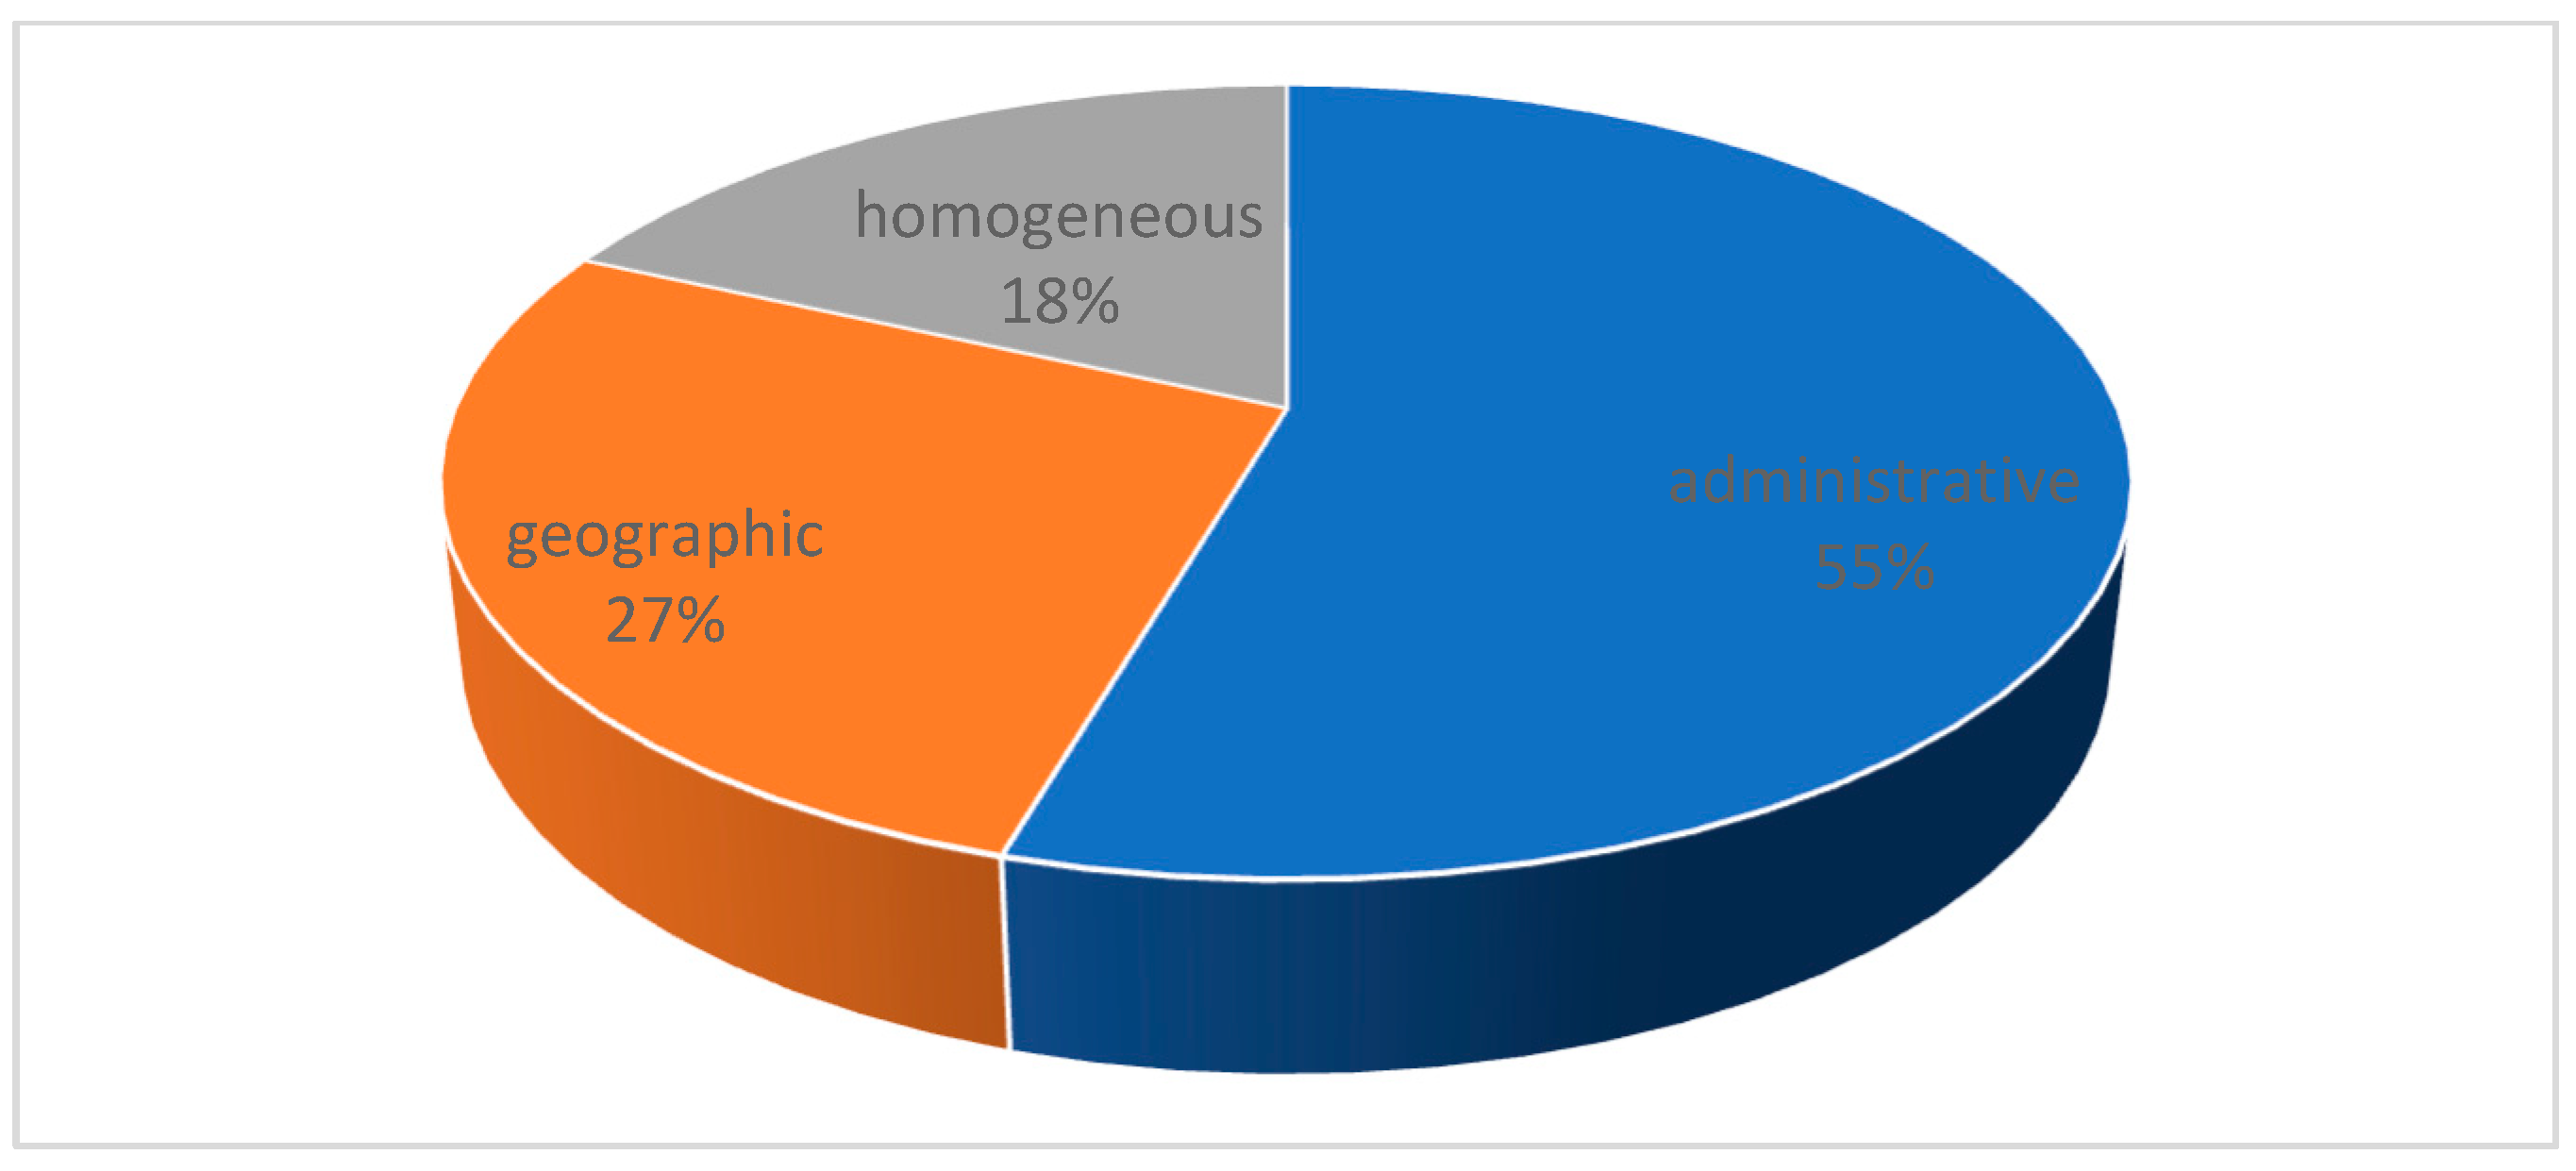
- Division Group
- 7.
- Population Density
- 8.
- Green Space Ratio
- 9.
- Community Layout
- 10.
- Building Coverage Ratio
- 11.
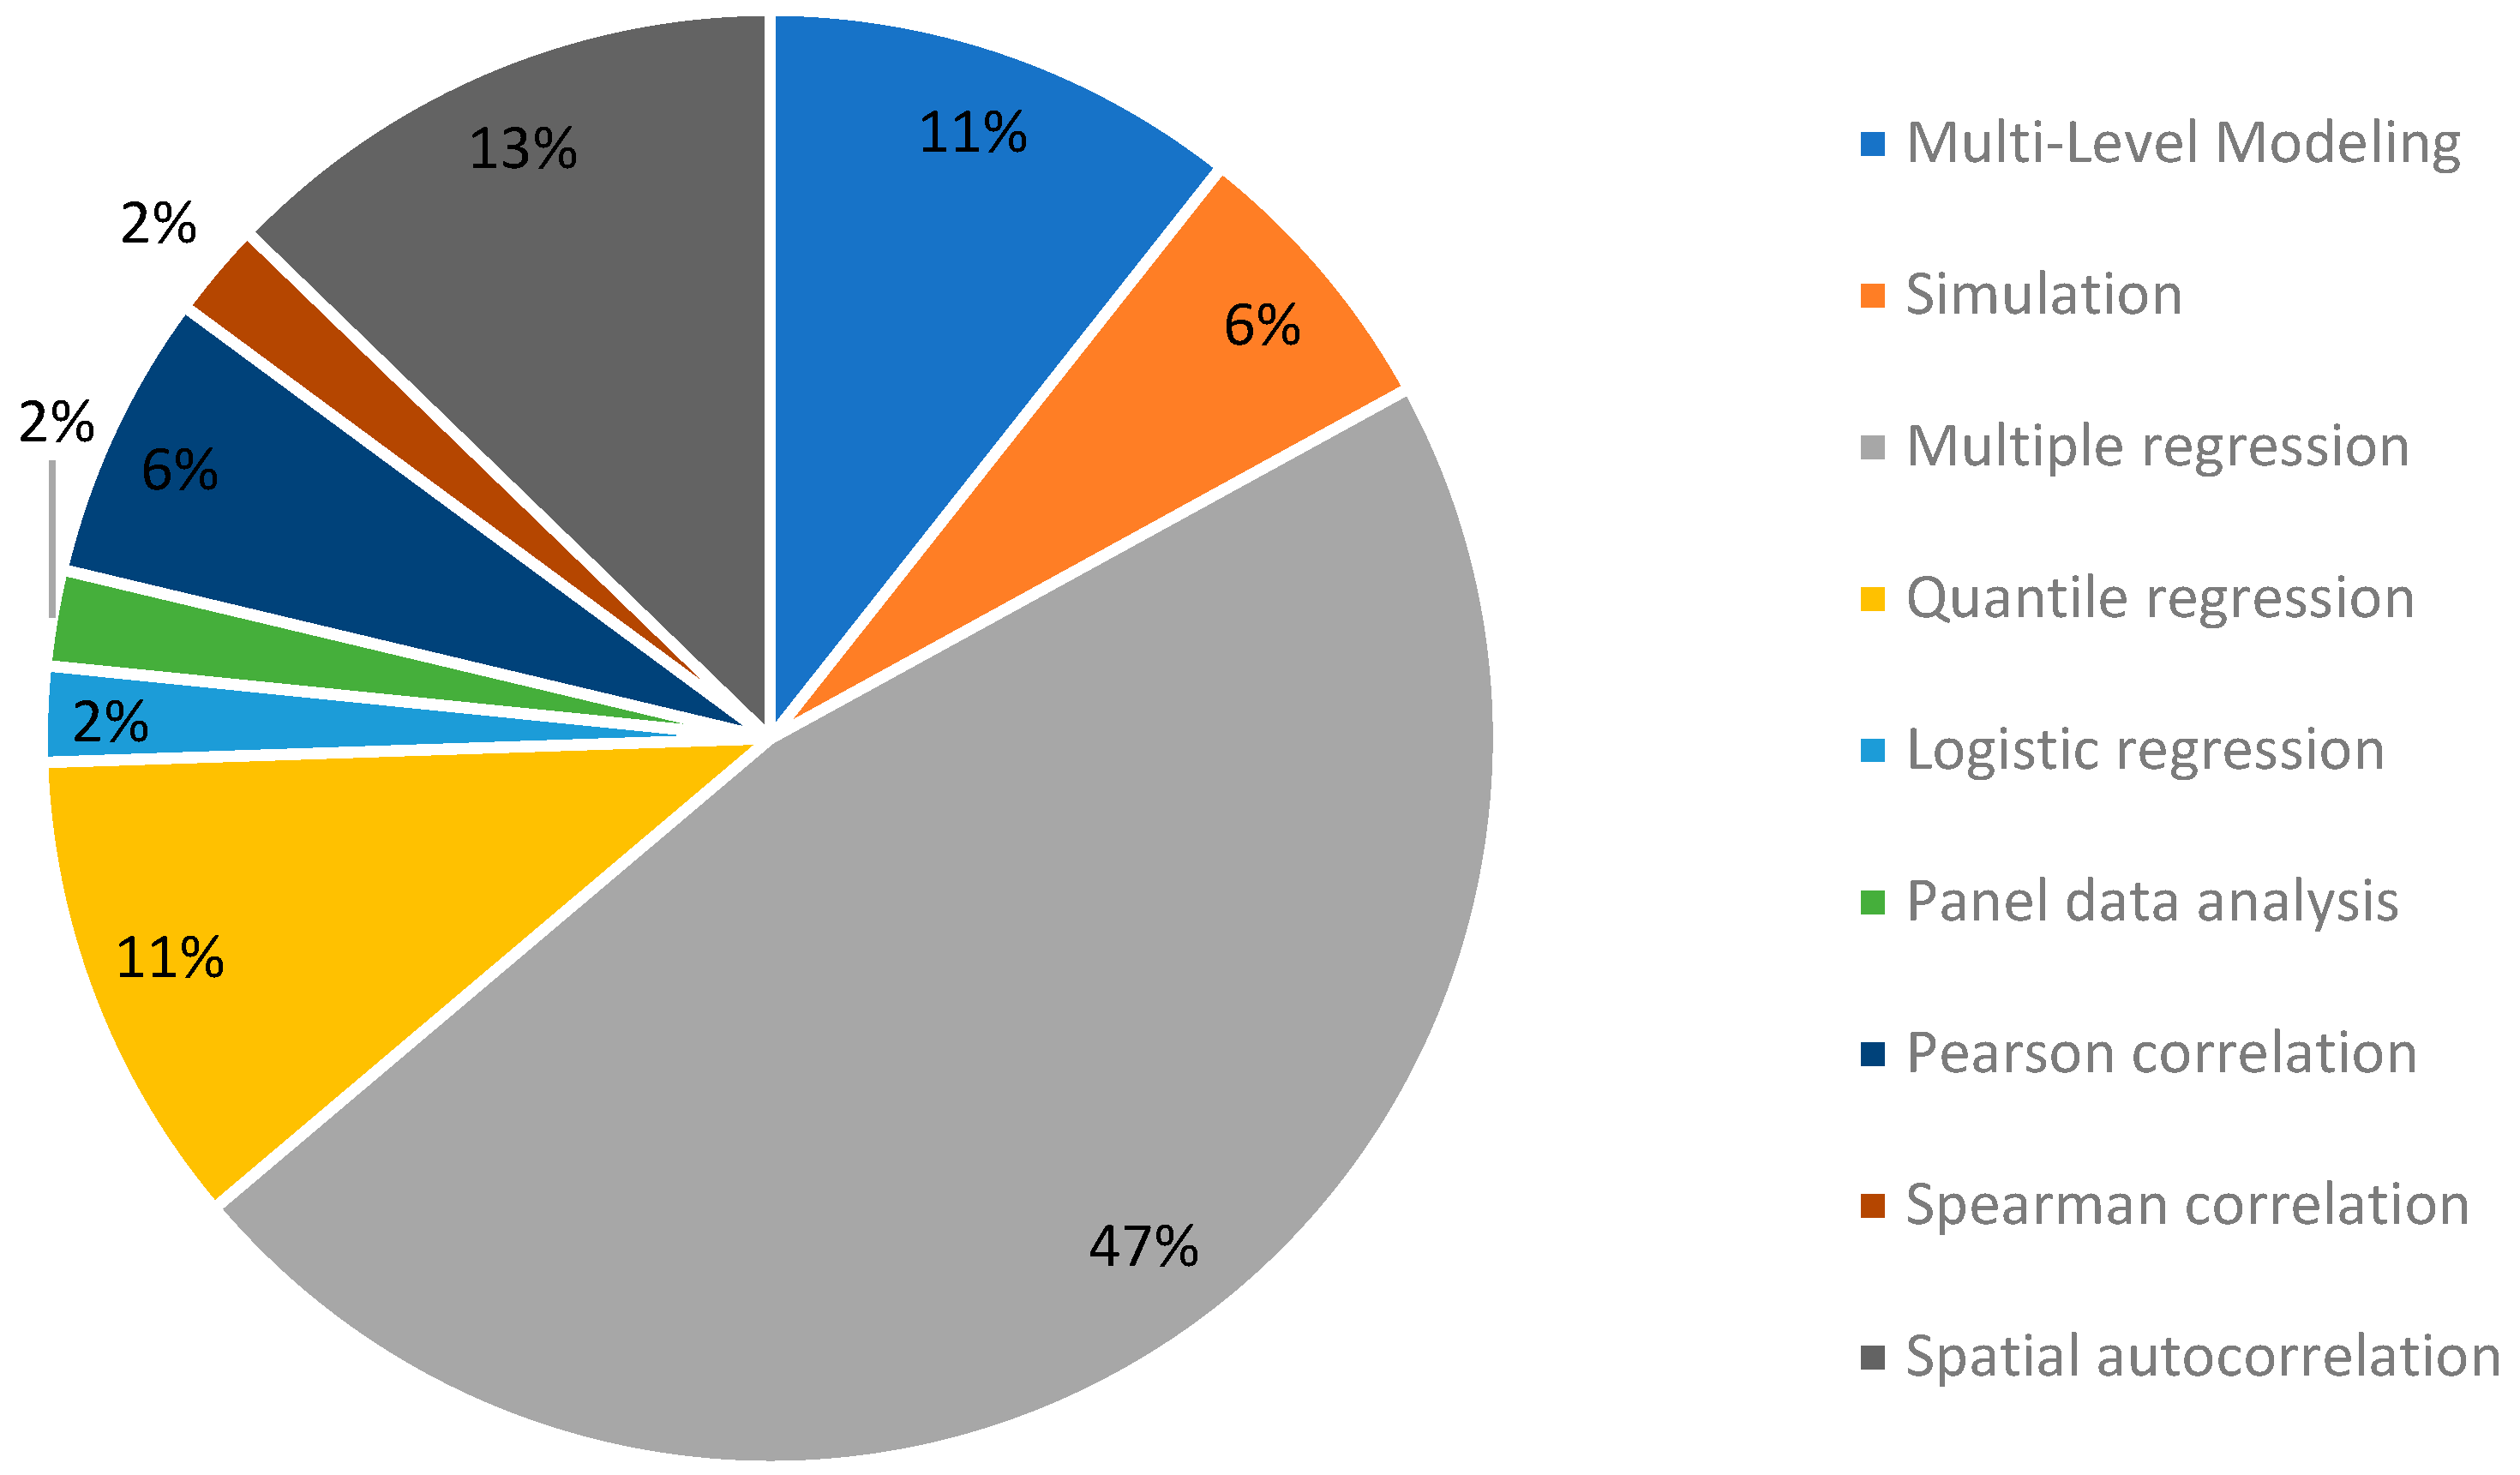
- Methodologies in the Literature
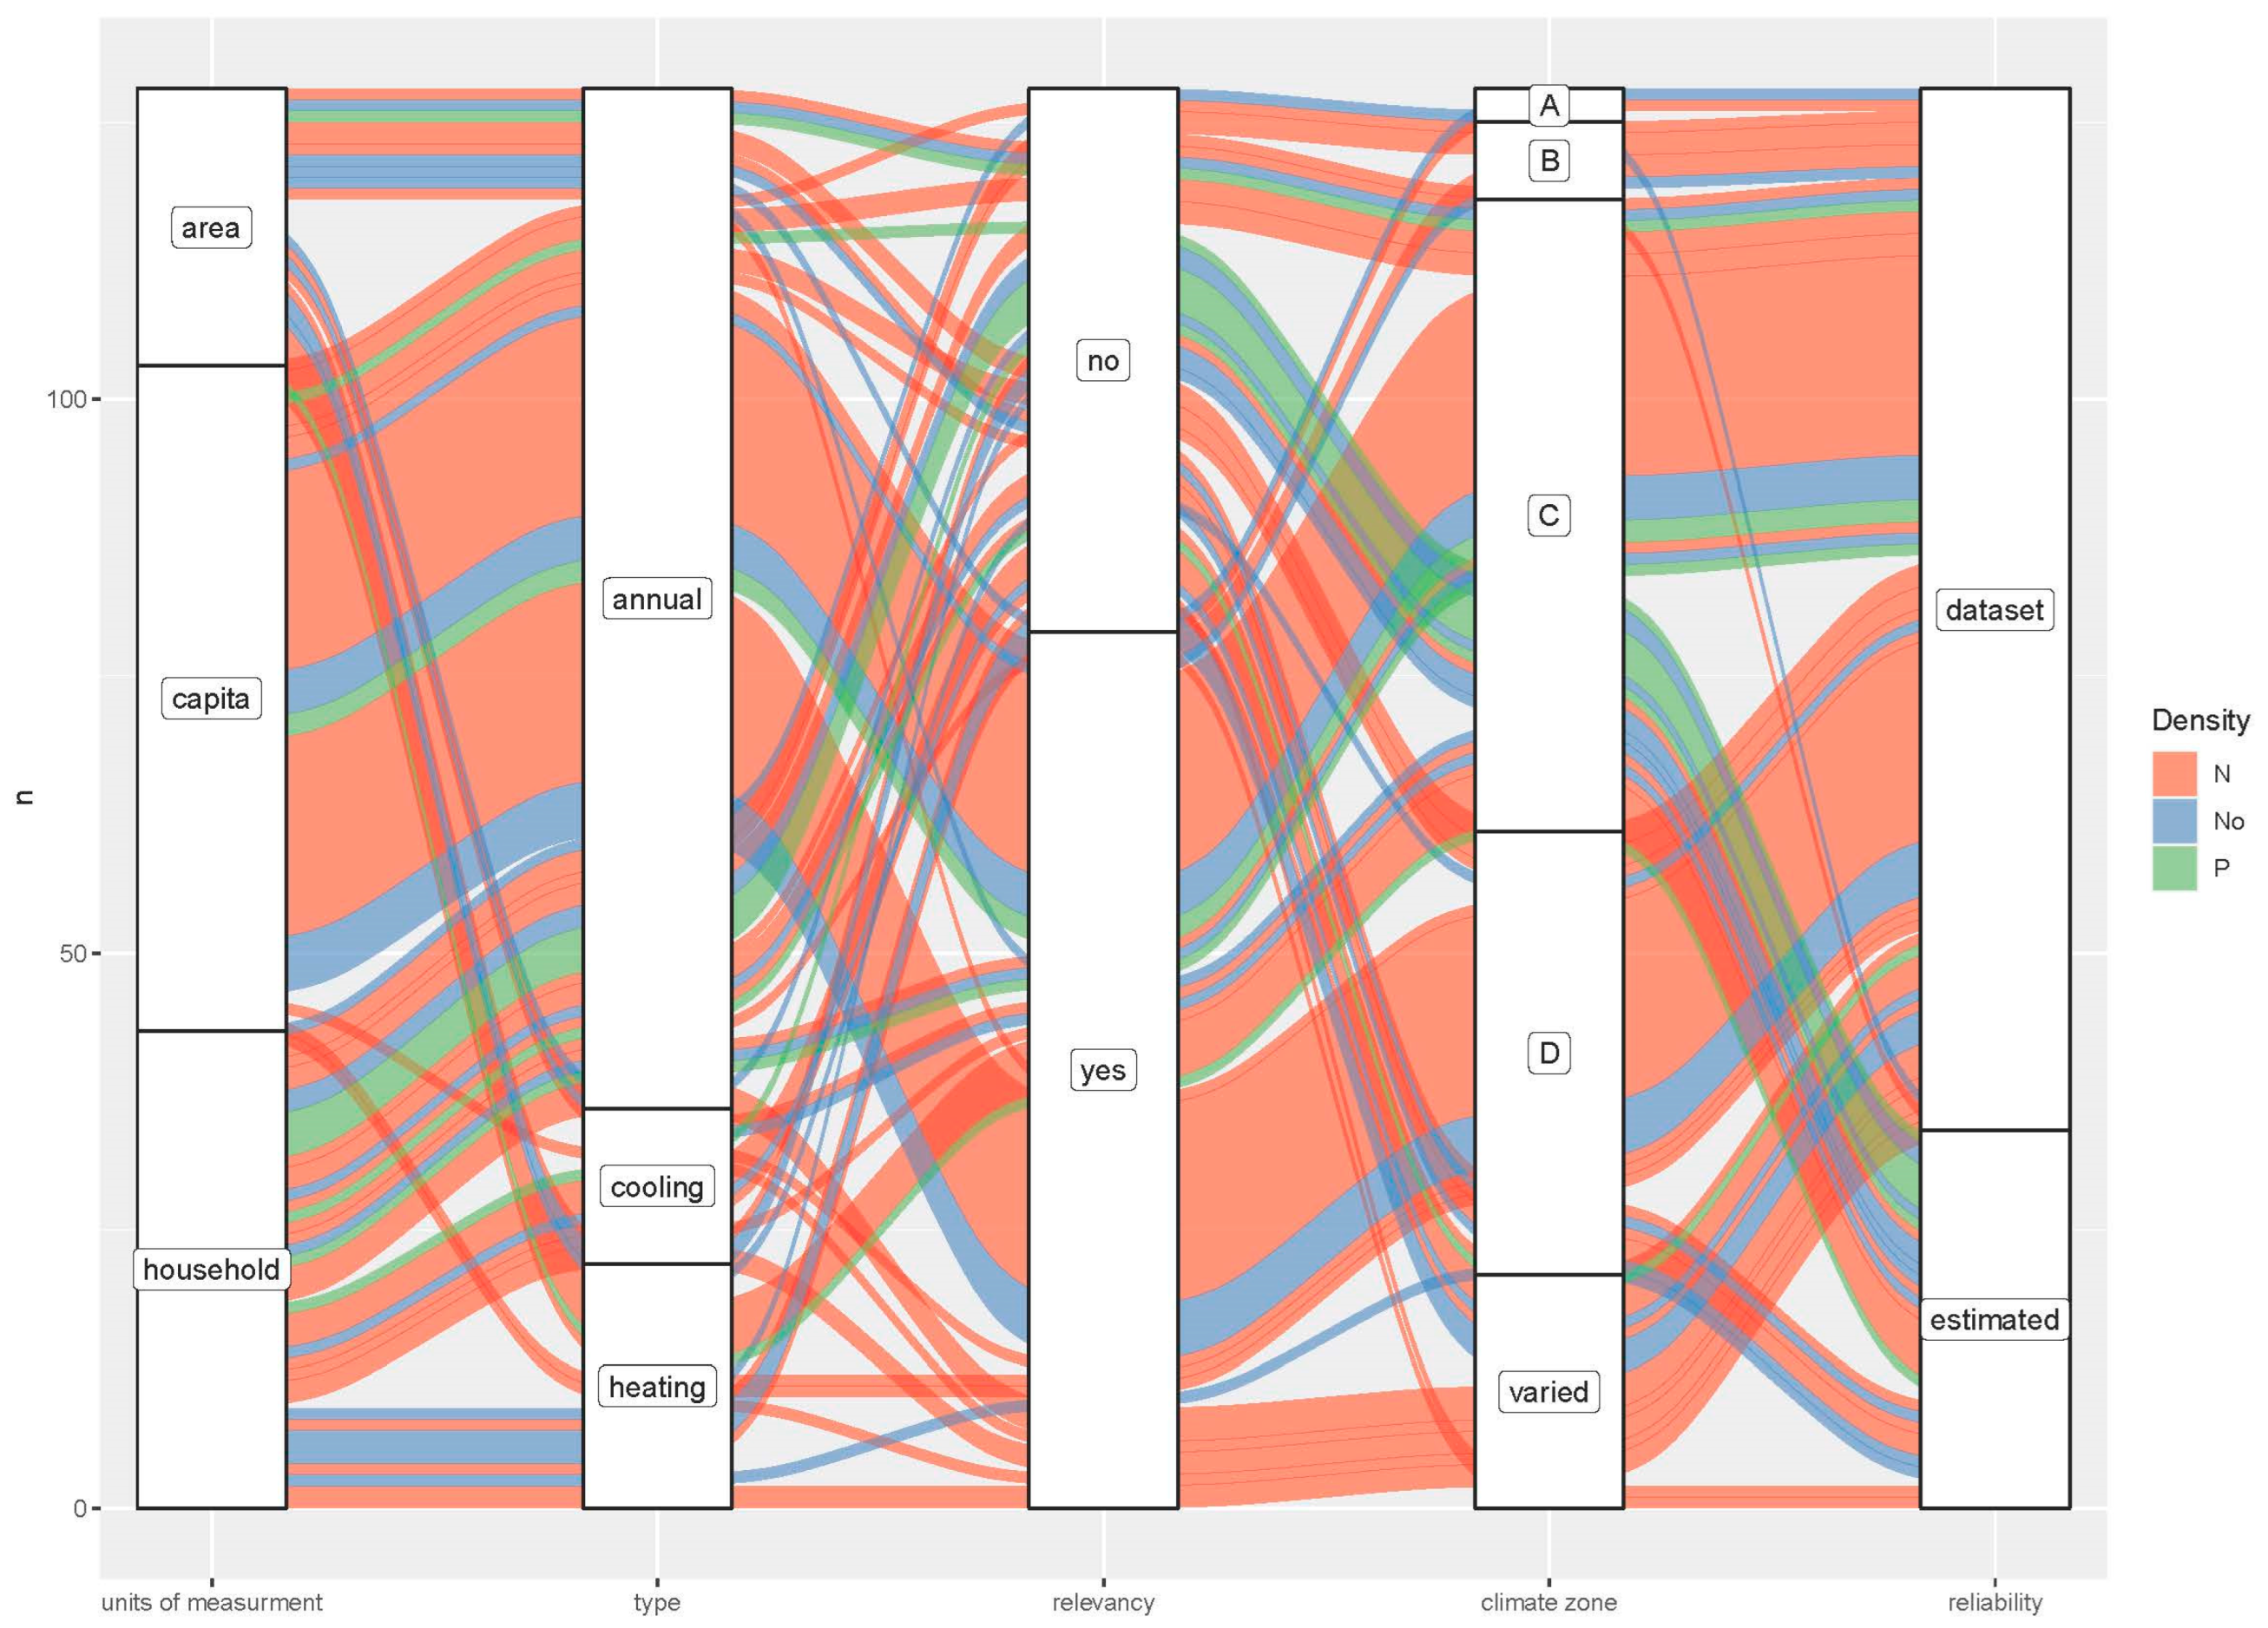
3.2. Classification Model
- Number of indicators considered in the model as the proxy of density,
- Type of energy, which is taken as a dependent variable,
- Unit of measurement,
- Methodology,
- Data reliability,
- Geographical location and its climate classification,
- Published year,
- Relevancy (a binary variable that determines whether the article is published in urban planning-related journals).
4. Discussion
5. Conclusions
6. Further Research in this Field
Funding
Conflicts of Interest
References
- Hamin, E.M.; Gurran, N. Urban form and climate change: Balancing adaptation and mitigation in the U.S. and Australia. Habitat Int. 2009, 33, 238–245. [Google Scholar] [CrossRef]
- Anderson, W.P.; Kanaroglou, P.S.; Miller, E.J. Urban Form, Energy and the Environment: A Review of Issues, Evidence and Policy. Urban Stud. 1996, 33, 7–35. [Google Scholar] [CrossRef]
- Liu, Z.; He, C.; Zhou, Y.; Wu, J. How much of the world’s land has been urbanized, really? A hierarchical framework for avoiding confusion. Landsc. Ecol. 2014, 29, 763–771. [Google Scholar] [CrossRef]
- Fang, C.; Wang, S.; Li, G. Changing urban forms and carbon dioxide emissions in China: A case study of 30 provincial capital cities. Appl. Energy 2015, 158, 519–531. [Google Scholar] [CrossRef]
- IEA. World Energy Outlook 2021. 2021. Available online: www.iea.org/weo (accessed on 4 September 2023).
- Nejat, P.; Jomehzadeh, F.; Taheri, M.M.; Gohari, M.; Muhd, M.Z. A global review of energy consumption, CO2 emissions and policy in the residential sector (with an overview of the top ten CO2 emitting countries). Renew. Sustain. Energy Rev. 2015, 43, 843–862. [Google Scholar] [CrossRef]
- IEA. Energy Efficiency Indicators: Fundamentals on Statistics. 2014. Available online: https://www.iea.org/termsandconditionsuseandcopyright/ (accessed on 4 September 2023).
- Lee, S.; Lee, B. The influence of urban form on GHG emissions in the U.S. household sector. Energy Policy 2014, 68, 534–549. [Google Scholar] [CrossRef]
- Ewing, R.; Rong, F. The impact of urban form on U.S. residential energy use. Hous. Policy Debate 2008, 19, 1–30. [Google Scholar] [CrossRef]
- Rickwood, P.; Glazebrook, G.; Searle, G. Urban structure and energy-a review. Urban Policy Res. 2008, 26, 57–81. [Google Scholar] [CrossRef]
- Sanaieian, H.; Tenpierik, M.; Van Den Linden, K.; Seraj, F.M.; Mofidi Shemrani, S.M. Review of the impact of urban block form on thermal performance, solar access and ventilation. Renew. Sustain. Energy Rev. 2014, 38, 551–560. [Google Scholar] [CrossRef]
- Jones, R.V.; Fuertes, A.; Lomas, K.J. The socio-economic, dwelling and appliance related factors affecting electricity consumption in domestic buildings. Renew. Sustain. Energy Rev. 2015, 43, 901–917. [Google Scholar] [CrossRef]
- Doherty, M.; Nakanishi, H.; Bai, X.; Meyers, J. Relationship Between from, Morphology, Density and Energy in Urban Environments; CSIRO Sustainable Ecosystems: Canberra, Australia, 2009; pp. 1–28. [Google Scholar]
- Gassar, A.A.A.; Cha, S.H. Energy prediction techniques for large-scale buildings towards a sustainable built environment: A review. Energy Build. 1102, 2020, 22438. [Google Scholar] [CrossRef]
- Khan, I. Household factors and electrical peak demand: A review for further assessment. Adv. Build. Energy Res. 2021, 15, 409–441. [Google Scholar] [CrossRef]
- Zhang, H.; Peng, J.; Wang, R.; Zhang, J.; Yu, D. Spatial planning factors that influence CO2 emissions: A systematic literature review. Urban Clim. 2021, 36, 100809. [Google Scholar] [CrossRef]
- Cai, M.; Shi, Y.; Ren, C.; Yoshida, T.; Yamagata, Y.; Ding, C.; Zhou, N. The need for urban form data in spatial modeling of urban carbon emissions in China: A critical review. J. Clean. Prod. 2021, 319, 128792. [Google Scholar] [CrossRef]
- Alsaadani, S. A statistical review of a decade of residential energy research in Egypt. Energy Rep. 2022, 8, 95–102. [Google Scholar] [CrossRef]
- Ko, Y. Urban Form and Residential Energy Use: A Review of Design Principles and Research Findings. J. Plan. Lit. 2013, 28, 327–351. [Google Scholar] [CrossRef]
- Anderson, J.E.; Wulfhorst, G.; Lang, W. Energy analysis of the built environment—A review and outlook. Renew. Sustain. Energy Rev. 2015, 44, 149–158. [Google Scholar] [CrossRef]
- Gargiulo, C.; Russo, L. Cities and Energy Consumption: A Critical Review. TeMA J. Land Use Mobil. Environ. 2017, 10, 259–278. [Google Scholar]
- Silva, M.; Oliveira, V.; Leal, V. Urban Form and Energy Demand: A Review of Energy-relevant Urban Attributes. J. Plan. Lit. 2017, 32, 346–365. [Google Scholar] [CrossRef]
- Quan, S.J.; Li, C. Urban form and building energy use: A systematic review of measures, mechanisms, and methodologies. Renew. Sustain. Energy Rev. 2021, 139, 110662. [Google Scholar] [CrossRef]
- Sun, C.; Zhang, Y.; Ma, W.; Wu, R.; Wang, S. The Impacts of Urban Form on Carbon Emissions: A Comprehensive Review. Land 2022, 11, 1430. [Google Scholar] [CrossRef]
- Geng, Y.; Chen, W.; Liu, Z.; Chiu, A.S.F.; Han, W.; Liu, Z.; Zhong, S.; Qian, Y.; You, W.; Cui, X. A bibliometric review: Energy consumption and greenhouse gas emissions in the residential sector. J. Clean. Prod. 2017, 159, 301–316. [Google Scholar] [CrossRef]
- Page, M.J.; McKenzie, J.E.; Bossuyt, P.M.; Boutron, I.; Hoffmann, T.C.; Mulrow, C.D.; Shamseer, L.; Tetzlaff, J.M.; Akl, E.A.; Brennan, S.E.; et al. The PRISMA 2020 statement: An updated guideline for reporting systematic reviews. Syst. Rev. 2021, 10, 1–11. [Google Scholar] [CrossRef] [PubMed]
- Harris, J.D.; Quatman, C.E.; Manring, M.M.; Siston, R.A.; Flanigan, D.C. How to write a systematic review. Am. J. Sports Med. 2014, 42, 2761–2768. [Google Scholar] [CrossRef] [PubMed]
- Glaeser, E.L.; Kahn, M.E. The greenness of cities: Carbon dioxide emissions and urban development. J. Urban Econ. 2010, 67, 404–418. [Google Scholar] [CrossRef]
- Ratti, C.; Baker, N.; Steemers, K. Energy consumption and urban texture. Energy Build. 2005, 37, 762–776. [Google Scholar] [CrossRef]
- Holden, E.; Norland, I.T. Three challenges for the compact city as a sustainable urban form: Household consumption of energy and transport in eight residential areas in the Greater Oslo Region. Urban Stud. 2005, 42, 2145–2166. [Google Scholar] [CrossRef]
- Jones, C.; Kammen, D.M. Spatial distribution of U.S. household carbon footprints reveals suburbanization undermines greenhouse gas benefits of urban population density. Environ. Sci. Technol. 2014, 48, 895–902. [Google Scholar] [CrossRef]
- Güneralp, B.; Zhou, Y.; Ürge-Vorsatz, D.; Gupta, M.; Yu, S.; Patel, P.L.; Fragkias, M.; Li, X.; Seto, K.C. Global scenarios of urban density and its impacts on building energy use through 2050. Proc. Natl. Acad. Sci. USA 2017, 114, 8945–8950. [Google Scholar] [CrossRef]
- Rode, P.; Keim, C.; Robazza, G.; Viejo, P.; Schofield, J. Cities and energy: Urban morphology and residential heat-energy demand. Environ. Plan. B Plan. Des. 2014, 41, 138–162. [Google Scholar] [CrossRef]
- Huang, W.H. The determinants of household electricity consumption in Taiwan: Evidence from quantile regression. Energy 2015, 87, 120–133. [Google Scholar] [CrossRef]
- Tso, G.K.F.; Guan, J. A multilevel regression approach to understand effects of environment indicators and household features on residential energy consumption. Energy 2014, 66, 722–731. [Google Scholar] [CrossRef]
- Wiedenhofer, D.; Lenzen, M.; Steinberger, J.K. Energy requirements of consumption: Urban form, climatic and socio-economic factors, rebounds and their policy implications. Energy Policy 2013, 63, 696–707. [Google Scholar] [CrossRef]
- Min, J.; Hausfather, Z.; Lin, Q.F. A high-resolution statistical model of residential energy end use characteristics for the United States. J. Ind. Ecol. 2010, 14, 791–807. [Google Scholar] [CrossRef]
- Sajadian, A.; Niazmardi, S.; Argany, M.; Arababadi, R.; Pignatta, G. Investigating the Relative Importance of Spatial and Environmental Factors on Energy Consumption in the Residential Sectors Using GIS (Case Study: Kerman). Environ. Sci. Proc. 2021, 12, 6. [Google Scholar]
- Ahmadian, E.; Sodagar, B.; Bingham, C.; Elnokaly, A.; Mills, G. Effect of urban built form and density on building energy performance in temperate climates. Energy Build. 2021, 236, 110762. [Google Scholar] [CrossRef]
- Zhang, X.; Yan, F.; Liu, H.; Qiao, Z. Towards low carbon cities: A machine learning method for predicting urban blocks carbon emissions (UBCE) based on built environment factors (BEF) in Changxing City, China. Sustain. Cities Soc. 2021, 69, 102875. [Google Scholar] [CrossRef]
- Belaid, F.; Rault, C. Energy Expenditure in Egypt: Empirical Evidence Based on a Quantile Regression Approach. Environ. Model. Assess. 2021, 26, 511–528. [Google Scholar] [CrossRef]
- Berrill, P.; Gillingham, K.T.; Hertwich, E.G. Linking housing policy, housing typology, and residential energy demand in the United States. Environ. Sci. Technol. 2021, 55, 2224–2233. [Google Scholar] [CrossRef]
- Rokseth, L.S.; Manum, B. Patterns of dwelling types, location, and spaciousness of living in norway. Critical remarks on the practice of measuring energy performance per floor area only. Buildings 2021, 11, 394. [Google Scholar] [CrossRef]
- Voskamp, I.M.; Visscher, M.N.; Vreugdenhil, C.; Van Lammeren, R.J.A.; Sutton, N.B. Spatial, infrastructural and consumer characteristics underlying spatial variability in residential energy and water consumption in Amsterdam. Sustain. Cities Soc. 2021, 72, 102977. [Google Scholar] [CrossRef]
- Mostafavi, N.; Heris, M.P.; Gándara, F.; Hoque, S. The relationship between urban density and building energy consumption. Buildings 2021, 11, 455. [Google Scholar] [CrossRef]
- Tilov, I.; Farsi, M.; Volland, B. From frugal Jane to wasteful John: A quantile regression analysis of Swiss households’ electricity demand. Energy Policy 2020, 138, 111246. [Google Scholar] [CrossRef]
- Leng, H.; Chen, X.; Ma, Y.; Wong, N.H.; Ming, T. Urban morphology and building heating energy consumption: Evidence from Harbin, a severe cold region city. Energy Build. 2020, 224, 110143. [Google Scholar] [CrossRef]
- Douthat, T.; Morgan, J.D.; Alibašić, H.; Grant, A. Passive building characteristics, and summertime residential energy use: A spatial analysis of energy efficiency in Gainesville, FL. Build. Environ. 2020, 169, 106542. [Google Scholar] [CrossRef]
- Rong, P.; Zhang, Y.; Qin, Y.; Liu, G.; Liu, R. Spatial patterns and driving factors of urban residential embedded carbon emissions: An empirical study in Kaifeng, China. J. Environ. Manag. 2020, 271, 110895. [Google Scholar] [CrossRef] [PubMed]
- Belaid, F.; Youssef, A.B.; Omrani, N. Investigating the factors shaping residential energy consumption patterns in France: Evidence form quantile regression. Eur. J. Comp. Econ. 2020, 17, 127–151. [Google Scholar] [CrossRef]
- Ahn, Y.J.; Sohn, D.W. The effect of neighbourhood-level urban form on residential building energy use: A GIS-based model using building energy benchmarking data in Seattle. Energy Build. 2019, 196, 124–133. [Google Scholar] [CrossRef]
- Shi, X.; Wang, K.; Cheong, T.S.; Zhang, H. Prioritizing driving factors of household carbon emissions: An application of the LASSO model with survey data. Energy Econ. 2020, 92, 104942. [Google Scholar] [CrossRef]
- Kaza, N. Understanding the spectrum of residential energy consumption: A quantile regression approach. Energy Policy 2010, 38, 6574–6585. [Google Scholar] [CrossRef]
- Wiesmann, D.; Azevedo, I.L.; Ferrão, P.; Fernández, J.E. Residential electricity consumption in Portugal: Findings from top-down and bottom-up models. Energy Policy 2011, 39, 2772–2779. [Google Scholar] [CrossRef]
- Kavousian, A.; Rajagopal, R.; Fischer, M. Determinants of residential electricity consumption: Using smart meter data to examine the effect of climate, building characteristics, appliance stock, and occupants’ behavior. Energy 2013, 55, 184–194. [Google Scholar] [CrossRef]
- Brounen, D.; Kok, N.; Quigley, J.M. Residential energy use and conservation: Economics and demographics. Eur. Econ. Rev. 2012, 56, 931–945. [Google Scholar] [CrossRef]
- Chen, Y.J.; Matsuoka, R.H.; Liang, T.M. Urban form, building characteristics, and residential electricity consumption: A case study in Tainan City. Environ. Plan. B Urban Anal. City Sci. 2018, 45, 933–952. [Google Scholar] [CrossRef]
- Quan, S.J. Energy efficient neighborhood design under residential zoning regulations in Shanghai. Energy Procedia 2017, 143, 865–872. [Google Scholar] [CrossRef]
- Li, C.; Song, Y.; Kaza, N. Urban form and household electricity consumption: A multilevel study. Energy Build. 2018, 158, 181–193. [Google Scholar] [CrossRef]
- Ko, Y.; Radke, J.D. The effect of urban form and residential cooling energy use in Sacramento, California. Environ. Plan. B Plan. Des. 2014, 41, 573–593. [Google Scholar] [CrossRef]
- You, Y.; Kim, S. Revealing the mechanism of urban morphology affecting residential energy efficiency in Seoul, Korea. Sustain. Cities Soc. 2018, 43, 176–190. [Google Scholar] [CrossRef]
- Vartholomaios, A. A parametric sensitivity analysis of the influence of urban form on domestic energy consumption for heating and cooling in a Mediterranean city. Sustain. Cities Soc. 2017, 28, 135–145. [Google Scholar] [CrossRef]
- Quan, S.J.; Wu, J.; Wang, Y.; Shi, Z.; Yang, T.; Yang, P.P.J. Urban form and building energy performance in Shanghai neighborhoods. Energy Procedia 2016, 88, 126–132. [Google Scholar] [CrossRef]
- Wilson, B. Urban form and residential electricity consumption: Evidence from Illinois, USA. Landsc. Urban Plan. 2013, 115, 62–71. [Google Scholar] [CrossRef]
- Rickwood, P. Residential operational energy use. Urban Policy Res. 2009, 27, 137–155. [Google Scholar] [CrossRef]
- Javanroodi, K.; Mahdavinejad, M.; Nik, V.M. Impacts of urban morphology on reducing cooling load and increasing ventilation potential in hot-arid climate. Appl. Energy 2018, 231, 714–746. [Google Scholar] [CrossRef]
- Asfour, O.S.; Alshawaf, E.S. Effect of housing density on energy efficiency of buildings located in hot climates. Energy Build. 2015, 91, 131–138. [Google Scholar] [CrossRef]
- Zhang, L.; Li, R. Impacts of green certification programs on energy consumption and GHG emissions in buildings: A spatial regression approach. Energy Build. 2022, 256, 111677. [Google Scholar] [CrossRef]
- Cao, J.; Zhou, W.; Wang, W.; Pan, X.; Jing, C.; Qian, Y. Spatially heterogeneous effect of temperature on electricity consumption in Shenzhen, China. Build. Environ. 2023, 241, 110468. [Google Scholar] [CrossRef]
- Heinonen, J.; Junnila, S. Residential energy consumption patterns and the overall housing energy requirements of urban and rural households in Finland. Energy Build. 2014, 76, 295–303. [Google Scholar] [CrossRef]
- Reames, T.G. Targeting energy justice: Exploring spatial, racial/ethnic and socioeconomic disparities in urban residential heating energy efficiency. Energy Policy 2016, 97, 549–558. [Google Scholar] [CrossRef]
- Makido, Y.; Dhakal, S.; Yamagata, Y. Relationship between urban form and CO 2 emissions: Evidence from fifty Japanese cities. Urban Clim. 2012, 2, 55–67. [Google Scholar] [CrossRef]
- Tiwari, P. Architectural, Demographic, and Economic Causes of Electricity Consumption in Bombay. J. Policy Model. 2000, 22, 81–98. [Google Scholar] [CrossRef]
- Bartusch, C.; Odlare, M.; Wallin, F.; Wester, L. Exploring variance in residential electricity consumption: Household features and building properties. Appl. Energy 2012, 92, 637–643. [Google Scholar] [CrossRef]
- Kontokosta, C.E.; Tull, C. A data-driven predictive model of city-scale energy use in buildings. Appl. Energy 2017, 197, 303–317. [Google Scholar] [CrossRef]
- Goldstein, B.; Gounaridis, D.; Newell, J.P. The carbon footprint of household energy use in the United States. Proc. Natl. Acad. Sci. USA 2020, 117, 19122–19130. [Google Scholar] [CrossRef] [PubMed]
- Boukarta, S.; Berezowska, E. Exploring the Energy Implication of Urban Density in Residential Buildings. J. Appl. Eng. Sci. 2017, 7, 7–14. [Google Scholar] [CrossRef]
- Li, C.; Song, Y.; Kaza, N.; Burghardt, R. Explaining Spatial Variations in Residential Energy Usage Intensity in Chicago: The Role of Urban Form and Geomorphometry. J. Plan. Educ. Res. 2019, 43, 317–331. [Google Scholar] [CrossRef]
- Kavgic, M.; Mavrogianni, A.; Mumovic, D.; Summerfield, A.; Stevanovic, Z.; Djurovic-Petrovic, M. A review of bottom-up building stock models for energy consumption in the residential sector. Build. Environ. 2010, 45, 1683–1697. [Google Scholar] [CrossRef]
- Tian, W.; Heo, Y.; De Wilde, P.; Li, Z.; Yan, D.; Park, C.S.; Feng, X.; Augenbroe, G. A review of uncertainty analysis in building energy assessment. Renew. Sustain. Energy Rev. 2018, 93, 285–301. [Google Scholar] [CrossRef]
- Li, Q.; Hu, J.; Yu, B. Spatiotemporal patterns and influencing mechanism of urban residential energy consumption in China. Energies 2021, 14, 3864. [Google Scholar] [CrossRef]
- Wang, G. Low-Carbon City Development based on Land Use Planning. Ph.D. Thesis, Technische Universiteit Eindhoven, Eindhoven, The Netherlands, 2021. [Google Scholar]
- Liu, X.; Wang, M.; Qiang, W.; Wu, K.; Wang, X. Urban form, shrinking cities, and residential carbon emissions: Evidence from Chinese city-regions. Appl. Energy 2020, 261, 114409. [Google Scholar] [CrossRef]
- Muñiz, I.; Dominguez, A. The impact of urban form and spatial structure on per capita carbon footprint in U.S. larger metropolitan areas. Sustainbility 2020, 12, 389. [Google Scholar] [CrossRef]
- Quan, S.J.; Economou, A.; Grasl, T.; Yang, P.P.J. An exploration of the relationship between density and building energy performance. Urban Des. Int. 2020, 25, 92–112. [Google Scholar] [CrossRef]
- Norman, J.; MacLean, H.L.; Kennedy, C.A. Comparing High and Low Residential Density: Life-Cycle Analysis of Energy Use and Greenhouse Gas Emissions. J. Urban Plan. Dev. 2006, 132, 10–21. [Google Scholar] [CrossRef]
- Sun, B.; Han, S.; Li, W. Effects of the polycentric spatial structures of Chinese city regions on CO2 concentrations. Transp. Res. Part D 2020, 82, 102333. [Google Scholar] [CrossRef]
- Peel, M.C.; Finlayson, B.L.; Mcmahon, T.A. Updated world map of the Koppen-Geiger climate classification. Hydrol. Earth Syst. Sci. 2007, 11, 1633–1644. [Google Scholar] [CrossRef]
- Graham, M.H. Confronting Multicollinearity in Ecological Multiple Regression. Ecology 2003, 84, 2809–2815. [Google Scholar] [CrossRef]
- Qu, Y.; Liu, Y.; Wang, W.; Cang, Y. Sustainability assessment of urban residential consumption in China megacity. Environ. Dev. Sustain. 2021, 23, 7509–7523. [Google Scholar] [CrossRef]
- Baker, N.; Steemers, K. Energy and Environment in Architecture: A Technical Design Guide. 2016. Available online: https://books.google.com.hk/books?hl=en&lr=&id=FJp5AgAAQBAJ&oi=fnd&pg=PP1&dq=Energy+and+Environment+in+Architecture:+A+Technical+Design+Guide&ots=6jEKrCxW6L&sig=mh58EtR4e0GTB1ZlKo11_qLOzl4&redir_esc=y#v=onepage&q=Energy%20and%20Environment%20in%20Architecture%3A%20A%20Technical%20Design%20Guide&f=false (accessed on 4 September 2023).
- Han, J.; Meng, X.; Zhou, X.; Yi, B.; Liu, M.; Xiang, W.N. A long-term analysis of urbanization process, landscape change, and carbon sources and sinks: A case study in China’s Yangtze River Delta region. J. Clean. Prod. 2017, 141, 1040–1050. [Google Scholar] [CrossRef]
- Xu, L.; Du, H.; Zhang, X. Driving forces of carbon dioxide emissions in China’s cities: An empirical analysis based on the geodetector method. J. Clean. Prod. 2021, 287, 125169. [Google Scholar] [CrossRef]
- Crawford, T.W. Urban form as a technological driver of carbon dioxide emission: A structural human ecology analysis of onroad and residential sectors in the conterminous U.S. Sustainbility 2020, 12, 7801. [Google Scholar] [CrossRef]
- Abanda, F.H.; Byers, L. An investigation of the impact of building orientation on energy consumption in a domestic building using emerging BIM (Building Information Modelling). Energy 2016, 97, 517–527. [Google Scholar] [CrossRef]
- Motoasca, E.; Agarwal, A.K.; Breesch, H. Energy Sustainability in Built and Urban Environments; Springer: Berlin/Heidelberg, Germany, 2019; p. 329. Available online: http://link.springer.com/10.1007/978-981-13-3284-5 (accessed on 4 September 2023).
- Ewing, R.; Park, K. Basic Quantitative Research Methods for Urban Planners; Routledge: London, UK, 2020. [Google Scholar] [CrossRef]
- Finch, W.H.; Bolin, J.E.; Kelley, K. Multilevel Modeling Using R, 2nd ed.; Routledge: London, UK, 2019. [Google Scholar]
- Ewing, R.; Park, K. Advanced Quantitative Research Methods for Urban Planners; Routledge: London, UK, 2020. [Google Scholar]
- Boslaugh, S.; Watters, P.A. Statistics in a Nutshell. 2008. Available online: https://theswissbay.ch/pdf/Gentoomen%20Library/Maths/Statistics/OReilly.Statistics.in.a.Nutshell.A.Desktop.Quick.Reference.Aug.2008.pdf (accessed on 4 September 2023).
- Mustafa, A.M.; Cools, M.; Saadi, I.; Teller, J. Urban Development as a Continuum: A Multinomial Logistic Regression Approach. In Proceedings of the Computational Science and Its Applications, Banff, AB, Canada, 22–25 June 2015; pp. 729–744. [Google Scholar] [CrossRef]
- Geraghty, D.; Mahony, M.O. Urban Noise Analysis Using Multinomial Logistic Regression. J. Transp. Eng. 2016, 142, 04016020. [Google Scholar] [CrossRef]
- Boyko, C.T.; Cooper, R. Clarifying and re-conceptualising density. Prog. Plann. 2011, 76, 1–61. [Google Scholar] [CrossRef]
- United Nations Human Settlements Programme. World Cities Report 2022: Envisaging the Future of Cities; United Nations Human Settlements Programme (UN-Habitat): Nairobi, Kenya, 2022. [Google Scholar]
- Aurand, A. Density, housing types and mixed land use: Smart tools for affordable housing? Urban Stud. 2010, 47, 1015–1036. [Google Scholar] [CrossRef]
- Moroni, S. Urban density after Jane Jacobs: The crucial role of diversity and emergence. City Territ. Archit. 2016, 3, 13. [Google Scholar] [CrossRef]
- Jacobs, J. The Death and Life of Great American Cities. 1961. Available online: http://www.petkovstudio.com/bg/wp-content/uploads/2017/03/The-Death-and-Life-of-Great-American-Cities_Jane-Jacobs-Complete-book.pdf (accessed on 4 September 2023).
- Daniels, T. Smart growth: A new American approach to regional planning. Plan. Pract. Res. 2001, 16, 271–279. [Google Scholar] [CrossRef]

| Advances in Building Energy Research | Journal of Environmental Management |
| Applied Energy | Journal of Industrial Ecology |
| Building and Environment | Journal of Planning Education and Research |
| Energy | Journal of Planning Literature |
| Energy and Buildings | Journal of the American Planning Association |
| Energy Economics | Journal of Urban Economics |
| Energy Policy | Journal of Urban Planning and Development |
| Energy Procedia | Landscape and Urban Planning |
| Environment and Planning B | Remote Sensing Applications: Society and Environment |
| Environmental Science and Technology | Renewable and Sustainable Energy Reviews |
| Housing Policy Debate | Sustainable Cities and Society |
| Intelligent Buildings International | Urban Climate |
| Journal of Applied Engineering Science | Urban Policy and Research |
| Journal of Cleaner Production | Urban Studies |
| The Role of Urban Form on REC | |
|---|---|
| The role of urban form | publications |
| It affects the amount of REC | [8,9,11,14,15,16,17,19,28,29,30,31,32,33,34,35,36,37,38,39,40,41,42,43,44,45,46,47,48,49,50,51,52,53,54,55,56,57,58,59,60,61,62,63,64,65,66,67,68,69,70,81,82,83,84,85,86] |
| It does not affect the amount of REC | [10,23,71,72,73,74] |
| The role of density on REC | |
| The role of density | publications |
| Positive correlation | [34,35,40,54,67,75] |
| Negative correlation | [8,9,28,30,31,32,33,36,37,38,39,41,42,43,46,47,49,50,51,52,56,57,60,64,66,68,76,77,78] |
| Not disclosed (Not. Sig) | [29,45,48,53,55,59,61,62,65,69,70,71,72,73,74,82] |
| UI | HT | Energy Purchases (EUR/Household/Year) | Average Family Size | Living Space (m2) per Household | Energy Purchases (EUR/Person/Year) | Energy Purchases (EUR/m2/Year) |
|---|---|---|---|---|---|---|
| Urban | Detached house | 1733 | 2.75 | 128.0 | 630.2 | 13.5 |
| Row-/terraced house | 1245 | 2.19 | 80.2 | 568.5 | 15.5 | |
| Apartment building | 866 | 1.65 | 58.3 | 524.8 | 14.9 | |
| Rural | Detached house | 1688 | 2.62 | 124.8 | 644.3 | 13.5 |
| Row-/terraced house | 1055 | 1.76 | 62.8 | 599.4 | 16.8 | |
| Apartment building | 776 | 1.57 | 55.0 | 494.3 | 14.1 |
| Researchers | Number of Density Indicators | Energy Type | Units of Measurement | Case Study | Climate Zone | Methodology | Relevancy | Reliability | y_Publish |
|---|---|---|---|---|---|---|---|---|---|
| Ewing [9] | 2 | Cooling, Heating, and Annual energy use | Per household | USA | varied | Multilevel Modeling | yes | dataset | 2008 |
| Glaeser [28] | 1 | Annual energy use | Per household | USA | varied | Multiple regression | yes | dataset | 2010 |
| Holden [30] | 2 | Heating energy use | Per Capita | Greater Oslo Region | Dfb | Multiple regression | yes | dataset | 2005 |
| Jones [31] | 2 | Annual energy use | Per household | USA | varied | Multiple regression | no | dataset | 2014 |
| Lee [8] | 2 | Cooling and Heating | Per household | USA | varied | Multilevel Modeling | no | estimated | 2014 |
| Kaza [53] | 2 | Cooling and Heating | Per household | USA | varied | Quantile regression | no | dataset | 2010 |
| Reames [71] | 1 | Heating energy use | Per square meter | Kansas | Cfa | Multiple regression | no | estimated | 2016 |
| Sajadian [38] | 1 | Annual energy use | Per household | Kerman | BSk | Descriptive Analysis | no | dataset | 2022 |
| Wiedenhofer [36] | 1 | Annual energy use | Per household | Australia | BWh | Multiple regression | no | dataset | 2013 |
| Tso [35] | 2 | Annual energy use | Per household | USA | varied | Multilevel Modeling | no | dataset | 2014 |
| Huang [34] | 2 | Annual energy use | Per household | Taiwan | Cwb | Quantile regression | no | estimated | 2015 |
| Rode [33] | 3 | Heating energy use | Per square meter | Paris, London, Berlin, and Istanbul | C | Pearson correlation | yes | estimated | 2014 |
| Min [37] | 1 | Cooling and Heating | Per household | USA | varied | Multiple regression | no | dataset | 2010 |
| Heinonen [70] | 2 | Annual energy use | Per household/Per square meter/Per capita | Finland | Dfc | Descriptive Analysis | no | estimated | 2014 |
| Kontokosta [75] | 3 | Annual energy use | Per square meter | New York | Cfa | Multiple regression | no | dataset | 2017 |
| Makido [72] | 1 | Annual energy use | Per Capita | Japan | Dfb | Multiple regression | yes | dataset | 2012 |
| Belaid [41] | 2 | Annual energy use | Per household | Egypt | BWh | Quantile regression | no | estimated | 2021 |
| Voskamp [44] | 2 | Annual energy use | Per household | Amsterdam | Cfb | Multiple regression | yes | dataset | 2021 |
| Berrill [42] | 1 | Cooling and Heating | Per household | USA | varied | Multiple regression | no | dataset | 2021 |
| Rokseth [43] | 1 | Annual energy use | Per square meter/Per capita | Oslo, Trondheim | Dfb, Dfc | Descriptive Analysis | no | dataset | 2021 |
| Wang [82] | 3 | Annual energy use | Per square meter | Eindhoven | Cfb | Multiple regression | no | dataset | 2021 |
| Zhang [40] | 2 | Annual energy use | Per household | Changxing | Cfa | Spatial autocorrelation | yes | dataset | 2021 |
| Ahmadian [39] | 1 | Heating energy use | Per square meter | London | Cfb | Simulation | no | estimated | 2021 |
| Wiesmann [54] | 3 | Annual energy use | Per Capita | Portuguese | Csa | Multiple regression | no | estimated | 2011 |
| KERRYPNX | [Positive Correlation] | [Not. Sig] | ||
|---|---|---|---|---|
| Variable | Odd Ratio | p-Value | Odd Ratio | p-Value |
| Num_indicators | 1.84 | 0.227 | 0.28 * | 0.017 |
| Type [annual] | ||||
| 0.11 *** | <0.001 | 0.36 * | 0.031 |
| 0.09 *** | <0.001 | 1.55 | 0.426 |
| Units [m2] | ||||
| 1.54 | 0.180 | 0.57 | 0.223 |
| 0.34 ** | 0.002 | 1.36 | 0.454 |
| Climate Zone [Arid (B)] | ||||
| >10 *** | <0.001 | 7.90 *** | <0.001 |
| 0.00 *** | <0.001 | 7.31 *** | <0.001 |
| >10 *** | <0.001 | 0.76 | 0.357 |
| Methodology [Descriptive Analysis] | ||||
| 0.01 *** | <0.001 | 0.75 | 0.451 |
| 0.00 *** | <0.001 | 0.85 | 0.799 |
| 0.00 *** | <0.001 | 0.54 | 0.075 |
| 0.00 *** | <0.001 | 1.04 | 0.901 |
| 0.00 *** | <0.001 | 0.51 | 0.226 |
| Relevancy [No] | ||||
| 1.46 | 0.506 | 0.36 * | 0.046 |
| Reliability [Dataset] | ||||
| 3.57 ** | 0.005 | 4.18 ** | 0.002 |
| Y-publish | 1.03 *** | <0.001 | 0.89 *** | <0.001 |
| Lat | 0.98 | 0.644 | 0.97 | 0.135 |
| Long | 1.01 | 0.092 | 0.99 | 0.076 |
| Observations | 120 | |||
| log-Likelihood | −72.524 | |||
| AIC | 221.047 | |||
Disclaimer/Publisher’s Note: The statements, opinions and data contained in all publications are solely those of the individual author(s) and contributor(s) and not of MDPI and/or the editor(s). MDPI and/or the editor(s) disclaim responsibility for any injury to people or property resulting from any ideas, methods, instructions or products referred to in the content. |
© 2023 by the authors. Licensee MDPI, Basel, Switzerland. This article is an open access article distributed under the terms and conditions of the Creative Commons Attribution (CC BY) license (https://creativecommons.org/licenses/by/4.0/).
Share and Cite
Narimani Abar, S.; Schulwitz, M.; Faulstich, M. The Impact of Urban Form and Density on Residential Energy Use: A Systematic Review. Sustainability 2023, 15, 15685. https://doi.org/10.3390/su152215685
Narimani Abar S, Schulwitz M, Faulstich M. The Impact of Urban Form and Density on Residential Energy Use: A Systematic Review. Sustainability. 2023; 15(22):15685. https://doi.org/10.3390/su152215685
Chicago/Turabian StyleNarimani Abar, Sina, Martin Schulwitz, and Martin Faulstich. 2023. "The Impact of Urban Form and Density on Residential Energy Use: A Systematic Review" Sustainability 15, no. 22: 15685. https://doi.org/10.3390/su152215685
APA StyleNarimani Abar, S., Schulwitz, M., & Faulstich, M. (2023). The Impact of Urban Form and Density on Residential Energy Use: A Systematic Review. Sustainability, 15(22), 15685. https://doi.org/10.3390/su152215685