
Power Cost and CO2 Emissions for a Microgrid with Hydrogen Storage and Electric Vehicles

Faculty of Engineering and Information Technology, Department of Electrical Engineering and Information Technology, George Emil Palade University of Medicine, Pharmacy, Science, and Technology of Targu Mures, Gheorghe Marinescu 38, 540142 Târgu Mureș, Romania
Sustainability 2023, 15(22), 15750; https://doi.org/10.3390/su152215750
Submission received: 19 September 2023
/
Revised: 3 November 2023
/
Accepted: 7 November 2023
/
Published: 8 November 2023
Abstract
:Hydrogen is considered the primary energy source of the future. The best use of hydrogen is in microgrids that have renewable energy sources (RES). These sources have a small impact on the environment when it comes to carbon dioxide (CO2) emissions and a power generation cost close to that of conventional power plants. Therefore, it is important to study the impact on the environment and the power cost. The proposed microgrid comprises loads, RESs (micro-hydro and photovoltaic power plants), a hydrogen storage tank, an electric battery and fuel cell vehicles. The power cost and CO2 emissions are calculated and compared for various scenarios, including the four seasons of the year, compared with the work of other researchers. The purpose of this paper is to continuously supply the loads and vehicles. The results show that the microgrid sources and hydrogen storage can supply consumers during the spring and summer. For winter and autumn, the power grid and steam reforming of natural gas must be used to cover the demand. The highest power costs and CO2 emissions are for winter, while the lowest are for spring. The power cost increases during winter between 20:00 and 21:00 by 336%. The CO2 emissions increase during winter by 8020%.
1. Introduction
A topic that is currently gaining importance in our lives is the idea of energy. The requirement for energy is growing along with the human population and needs. The rising energy demands, which will rise significantly more in the upcoming years, are met by using both fossil fuels and renewable energy sources (RESs). The main issue with RESs is the fact that they have an intermittent and variable power output [1,2,3,4,5]. One possibility to overcome this issue is to use storage systems [5].
It is possible to improve energy control, dependability, and quality by storing power in batteries, pumped hydro, fuel cells, or supercapacitors. For large-scale export, storage, and transport, hydrogen-based fuel cells and other storage devices are becoming more and more important [2,5,6,7].
Due to its enormous potential to help create a more liveable and sustainable world for humans, hydrogen is increasingly regarded as the primary energy source of the future. Hydrogen can be produced in a variety of ways, including electrical, thermal, hybrid, and biological [3,8,9,10]. The cost of hydrogen varies between 0.8 and 6 EUR/kg considering the technology and materials used [11]. The cost is expected to be around 1.8 EUR/kg in 2030 due to developments in the hydrogen production method [11,12,13,14,15]. Also, the carbon dioxide (CO2) emissions vary considering the production method.
The most desirable use of power and hydrogen is in microgrids, which can achieve low CO2 emissions [16]. The power supplied by the RESs of a microgrid can be converted into hydrogen through water electrolysis. Also, hydrogen can be used by fuel cell electric vehicles.
The rest of the paper is organized as follows. The work of other researchers is presented in Section 2, the literature review. In Section 3, the algorithm and mathematical model used to calculate the power cost and CO2 emissions are presented. In Section 4 the results, the discussion and interpretation of the findings are presented, while in Section 5 the conclusions are presented.
2. Literature Review
The dynamic planning of a microgrid, considering uncertainties, was performed by Sun et al. in [16]. The optimal scheduling of a microgrid that comprised wind, photovoltaic (PV) and hydrogen storage was determined by Zhang et al. in [17]. A rural microgrid was investigated by Alluraiah et al. in [18], and its operation cost was minimum, while in [19] study was performed by Zhong et al. on a real microgrid. In [20], the optimal power dispatch of the microgrid sources and hydrogen storage was determined by Ghezelbash et al. in order to maximize the profit of the microgrid. A control strategy was developed by Villa Londono et al. in [21]; power exchange was reduced, and stability of the microgrid was improved. The management of a microgrid using wind, PV, battery, fuel cell and supercapacitor power was studied by Sahri et al. in [22], who found that overcharging was avoided. The recent advances in the field of PV and fuel cells were investigated by Arsalis et al. [23].
The management and optimization of the operation of an islanded microgrid were performed by Abdelsalam et al. in [24], in which RESs provided a high amount of power and the backup diesel generator was used less. The expenditure cost and operational revenues were optimized by Cao et al. for a microgrid in [25], so the costs were reduced by 50%. Day-ahead and intra-day optimization were performed by Wang et al. in [26], so the operation cost of the microgrid which comprised wind, PV and hydrogen storage was reduced. The energy management of a hybrid microgrid was studied by Alzahrani in [27], so the reactive power of the loads was reduced by 90%. The optimal power dispatch was determined by Hou et al. in [28] for a system with power, hydrogen and heat storage, in which efficiency and profit were improved. The use of an electrolyser designed for a quick response in case the power demand was higher than the power supplied in a microgrid was investigated by Ganeshan et al. in [29]. In [30], it was determined by Oliveira et al. that the use of hydrogen for transport, industrial applications and buildings can help reduce CO2 emissions by 18%. A controller was developed by Behera et al. in [31] for power smoothing in a microgrid with a supercapacitor and redox flow battery. The economic feasibility of a microgrid was investigated by Shanbog et al. in [32] considering the cost of power, investment costs and operational costs.
The optimal management of a residential microgrid, which comprised combined heat and power loads, electric vehicles and charging/discharging behaviour was determined by Gong et al. in [33]. A 100% RES station was developed by Li in [34] in order to supply a microgrid. Fan et al., in [35], minimized the daily operation cost of a microgrid. The performance of a hydrogen storage system in a microgrid was investigated by Serra et al. in [36], in which its annual hydrogen production was optimized. In [37], the optimal management of a microgrid with bidirectional power–hydrogen conversion was determined by Khaligh et al. considering price uncertainties and RES power output. The optimal design of a microgrid was determined by Valverde et al. in [38], while a controller was developed by Cecilia et al. in [39] for the optimal management of a microgrid with short-term storage. The frequency and voltage control were investigated by Naseri et al. in [40] for an islanded microgrid that comprised PV sources. The operation of a hydrogen hub with a microgrid was studied by Hossain et al. in [41], so power balance was respected and power-to-hydrogen and hydrogen-to-power were provided when required.
The efficiency of a hydrogen storage system was studied by Bovo et al. in [42], while in [43] Van et al. reviewed the energy management strategies for microgrids. Califano et al. reduced the size of a hydrogen storage tank by 40% in [44] due to the control strategy. The optimization of a microgrid with electrical and hydrogen loads was performed by Mah et al. in [45], while the participation of the power-to-hydrogen in the power markets in order to minimize the operation costs was investigated by Mansour-Saatloo in [46]. The modeling and analysis of a direct-current microgrid with hydrogen storage were studied in [47,48]. A self-control algorithm for a microgrid was developed and studied by Yang et al. in [49], while Gugulothu et al. determined in [50] the optimal strategy for the power output of the microgrid sources.
The optimal supply of electric and fuel cell vehicles was studied by Förster et al. in [51], while Abo-Elyousr et al. determined in [52] the optimal configuration and size of the sources of a microgrid. Hybrid power–hydrogen refuelling stations, electric, natural gas and hydrogen stations in microgrids were studied in [53,54], while Navas et al. optimized the investment and operation costs in [55] for a hybrid heat and power residential microgrid. The optimal power management was studied by Yousri et al. in [56] for a microgrid considering battery degradation, discomfort, peak-to-average ratio and consumer discomfort, while Kbidi et al. studied in [57] the unit commitment for the components of a microgrid (PV sources, fuel cell, battery and electrolyser). The dispatch of power and hydrogen in real time was studied by Lin et al. in [58] considering the power markets, which resulted in a reduction in the daily operational costs of 37%. The emissions of a FCEV were studied by Heidary et al. in [59]. The emissions were between 50% and 28% lower compared to gasoline vehicles and BEVs. The use of FCEVs in vehicle-to-grid mode was studied by Robledo in [60]. The use was economically beneficial for the end user if the hydrogen prices were below 8.24 EUR/kg. The techno-economic, environmental and safety assessments of hydrogen microgrids were studied by Mukherjee in [61]. The results showed that the system does not have a positive net present value at the end of its project life. The optimal design of a hybrid charging station for battery electric vehicles and fuel cell electric vehicles was performed by Sánchez-Sáinz in [62].
Similar to battery electric vehicles, it is anticipated that sales of fuel cell electric vehicles will increase in the upcoming years. Due to the large hydrogen demand that will result from this increase, it is necessary to research any potential effects on power costs and CO2 emissions. The main contributions of this paper are as follows:
- The microgrid comprises PV power plants and micro-hydro sources in comparison to other studies, where wind turbines and PV power plants were used;
- The analysis is presented for different scenarios (electric and fuel cell vehicles are connected or not to the system) and seasons (spring, summer, autumn and winter);
- It is determined how much hydrogen can be produced and later used to cover power demand and if it is enough, considering the variable power demand during the seasons; three energy carriers are present (power, hydrogen and natural gas);
- The power cost and CO2 emissions are analysed.
3. Materials and Methods
The microgrid studied is presented in Figure 1. It has several consumers with an installed power of 160 kW, various supply units (two PV power plants—PV1 with an installed power of 200 kW, and PV2 with an installed power of 160 kW—and three micro-hydro sources—MH1 with an installed power of 70 kW, MH2 with an installed power of 90 kW and MH3 with an installed power of 100 kW), a hydrogen storage tank (60 kg), a fuel cell (600 kW proton exchange membrane electrolyser), battery electric vehicles (BEVs) and fuel cell electric vehicles (FCEVs).
A PV power plant consists of PV panels and an inverter. Photovoltaic panels transform solar radiation into direct current, while the inverter converts direct current into alternating current. The main components of a photovoltaic panel are the solar cells. A solar cell consists of two or more layers of semiconductor material. When the silicon layer is exposed to light, then the electrons from the material agitate and an electric current will be generated. The current generated by a single cell is small, but series and parallel combinations of these cells can produce currents high enough so they can be used in practice. In order to produce electric current, solar cells are joined together. Photovoltaic modules consist of photovoltaic circuits sealed in a protective laminate environment. Photovoltaic panels include one or more photovoltaic modules [63].
Hydropower systems use the energy in flowing water to produce electricity or mechanical energy. For run-of-the-river micro-hydro power systems, a portion of a river’s water is diverted to a water conveyance—channel, pipeline, or pressurized pipeline (penstock)—that delivers it to a turbine or waterwheel. The moving water rotates the wheel or turbine, which spins a shaft. The motion of the shaft can be used for mechanical processes, such as pumping water, or it can be used to power an alternator or generator to generate electricity [63].
BEVs comprise an electric motor and a battery that powers the electric motor. The BEVs can be charged at home (outlet) or at a charging station. FCEVs are powered by the chemical reaction of oxygen and hydrogen in the fuel cell, storing electricity and driving the motor with this energy. The FCEVs can be charged at a charging station [17,22].
Water that is supplied to the PEM electrolyser is split into hydrogen and oxygen at the electrodes. At the anode, oxygen is produced by the oxidation of water, while at the cathode, hydrogen is produced by the reduction in protons from the proton exchange membrane [64].
Natural gas comprises methane (CH4) that can be used to produce hydrogen. In the steam reforming of natural gas, methane reacts with steam under 3–25 bar pressure in the presence of a catalyst to produce hydrogen [64].
The hydrogen produced through water electrolysis or the reforming of natural gas can be stored in a tank. The fuel cell uses the chemical energy of hydrogen in order to generate power [64].
The power demand of the microgrid loads during the seasons is presented in Table 1. This power demand is for Răstolița, a village located in Mureș County, Romania.
An additional power demand from the BEVs was added to the demand in Table 1. Twelve BEVs and two FCEVs were connected to the microgrid. The BEVs were represented by ten Dacia Springs with a battery capacity of 26.8 kW and two Volkswagen ID.4s with a battery capacity of 55 kW. The FCEVs were represented by one Hyundai Nexo with a tank capacity of 6.33 kg and one Toyota Mirai with a tank capacity of 5.6 kg. The BEVs and FCEVs were considered to be charged during the afternoon after the users come back from work. The BEVs were charged at fast charging stations, so the charging took less than one hour. The BEV demand is 134 kW between 18:00 and 19:00 (five Dacia Spring), 55 kW between 19:00 and 20:00 (one Volkswagen ID.4) and 189 kW between 20:00 and 21:00 (five Dacia Spring and one Volkswagen ID.4). The FCEV demand is 11.93 kg of H2 between 18:00 and 19:00.
The power supplied by the microgrid sources is presented in Table 2 (spring), Table 3 (summer), Table 4 (autumn) and Table 5 (winter).
The power supplied by the microgrid sources is used to cover the power demand of the loads and BEVs. If there is an excess power, then this power is converted by means of water electrolysis into hydrogen and stored in the tank. The hydrogen stored in the tank can be used to charge the FCEVs or it can also be converted into power by means of a fuel cell. The power grid is used only as a backup to cover the power demand in case the power supplied by the microgrid sources is not enough or the sources have a technical problem. Also, a backup source for hydrogen demand is natural gas, which can be converted by steam reforming, which is currently the most used method for hydrogen production.
The power cost is calculated first:
where PC represents the power cost for the microgrid in EUR, gci represents the generation cost in EUR/kWh, Pih represents the energy supplied by the source i at hour h in kWh, h represents the power to hydrogen conversion cost which is 5 EUR/kg for water electrolysis, N is the number of H2 kilograms obtained in kg and ng represents the natural-gas-to-hydrogen conversion cost, which is 2.2 EUR/kg for steam reforming.
Min PC = Σ gci·Pih + Σ h·N + Σ ng·N,
The microgrid sources and hydrogen fuel cell costs are presented in Table 6.
Then, the power supply constraint is verified:
where PSi represents the total power supplied by the microgrid sources at a specific hour in kW and PD represents the power demand at a specific hour in kW. If this constraint is not respected, then the additional power is supplied by the main power grid. If this constraint is respected and there is a power surplus, then this is converted using water electrolysis into hydrogen. The conversion process requires around 9 L of water and 50 kWh of power for 1 kg of hydrogen. The obtained hydrogen can supply the FCEVs or it can be converted back to power. An amount of 1 kg of hydrogen can produce around 33 kWh. For steam reforming, 4.5 m3 of natural gas are required for 1 kg of hydrogen.
Σ PSi ≥ PD,
Second, after the power cost is calculated, the CO2 emissions from the power sources are calculated:
where PSE represents the total emissions in gCO2 from the power supplied by the sources and power conversion into hydrogen. si represents the CO2 emissions from the power source in gCO2/kWh, pi represents the energy supplied by a particular power source during an hour in kWh, hi represents the CO2 emissions from the conversion of power or natural gas into hydrogen in gCO2/kg and ci represents the number of hydrogen kilograms produced in kg. In Table 7, the CO2 emissions for the power plants, electrolysis and steam reforming used are presented.
The MATLAB 2023b software [77] was used to perform the analysis.
4. Results and Discussion
The power supplied by the sources in order to cover the power demand, without the BEVs and FCEVs connected, is presented in Table 8 (spring), Table 9 (summer), Table 10 (autumn) and Table 11 (winter).
The power supplied by the sources at 19:00 during summer is not enough to cover the power demand (2.5 kW are required), so the hydrogen storage must be used.
The power supplied by the sources between 5:00 and 6:00, and between 18:00 and 19:00 during autumn is not enough to cover the power demand, so the hydrogen storage must be used. A power of 3.79 kW is required at 5:00, 7.98 kW is required at 6:00, 12.05 kW is required at 18:00 and 2.42 kW is required at 19:00.
The power supplied by the sources between 5:00 and 8:00, and between 16:00 and 19:00 during winter it is not enough to cover the power demand, so the hydrogen storage must be used. A power of 11.54 kW is required at 5:00, 20.23 kW is required at 6:00, 24.08 kW is required at 7:00, 8.23 kW is required at 8:00, 27.42 kW is required at 16:00, 26.1 kW is required at 17:00, 21.28 kW is required at 18:00 and 12.6 kW is required at 19:00.
In order to convert power into hydrogen, the following surplus presented in Table 12 (spring), Table 13 (summer), Table 14 (autumn) and Table 15 (winter) is used.
The power surplus is converted into hydrogen by means of water electrolysis (Table 16). The total H2 produced is 57.25 kg (spring), 25.26 kg (summer), 13.92 kg (autumn) and 6.55 kg (winter).
As it can be observed from Table 16, the hydrogen production changes due to the excess power supplied by the microgrid sources. If the excess power is high, then more hydrogen is produced. If the excess power is low, then less hydrogen is produced.
The power cost is presented in Table 17 (spring), Table 18 (summer), Table 19 (autumn) and Table 20 (winter). The CO2 emissions caused by the power supplied by the microgrid sources, water electrolysis and power grid are presented in Table 21 (spring), Table 22 (summer), Table 23 (autumn) and Table 24 (winter).
The results for the power cost during the seasons are also presented in Figure 2 (spring), Figure 3 (summer), Figure 4 (autumn), and Figure 5 (winter). The results for the CO2 emissions are also presented in Figure 6 (spring), Figure 7 (summer), Figure 8 (autumn), and Figure 9 (winter).
During autumn, 0.1149 H2 kg are used at 5:00, 0.2419 H2 kg are used at 6:00, 0.3788 H2 kg are used at 18:00 and 0.0734 H2 kg are used at 19:00.
During winter, 0.3497 H2 kg are required at 5:00, 20.23 kW are required at 6:00, 24.08 kW are required at 7:00, 8.23 kW are required at 8:00, 27.42 kW are required at 16:00, 26.1 kW are required at 17:00, 21.28 kW are required at 18:00 and 12.6 kW are required at 19:00. The H2 tank can supply only 0.7764 kg in the morning. This covers the demand at 5:00 and part of the demand at 6:00. At 6:00, there are still 0.1864 H2 kg or 6.15 kW required. This is taken from the power grid, as well as the extra power required between 7:00 and 8:00. Regarding the power required between 16:00 and 19:00, the hydrogen produced and stored between 9:00 and 15:00 is enough to cover the demand that cannot be covered by the microgrid sources. An amount of 0.831 H2 kg is used at 16:00, 0.791 H2 kg is used at 17:00, 0.6449 H2 kg is used at 18:00 and 0.3819 H2 kg is used at 19:00.
The power supplied by the sources at 19:00 during the summer is not enough and hydrogen storage must be used (0.076 kg). This results in a higher cost at 19:00.
The connection of BEVs and FCEVs changes the results, so the conversion of the stored hydrogen into power for BEVs and fuelling the FCEVs with hydrogen is required.
During spring, from the 48.4 kg of H2 stored until 18:00, 11.93 kg must be used to fuel the FCEVs and 11.46 kg must be converted by the fuel cell into power in order to charge the BEVs.
During summer, the 23.5 kg of H2 stored until 18:00 are enough to cover the power demand at 19:00 (0.076 kg) and the total 23.39 kg required by the BEVs and FCEVs.
During autumn, there are 11.47 kg of H2 stored until 18:00. All of these kilograms are used by the FCEVs, which require an additional 0.46 kg. These additional kilograms are produced by means of steam reforming of natural gas, so there is a 1.012 EUR increase in the cost. The power (189 kW) required by the BEVs between 18:00 and 19:00 is supplied by the power grid. Between 20:00 and 21:00, there is a 7.17 kW surplus, which is no longer converted into hydrogen due to the high cost, but supplied to the BEVs with an additional 181.83 kW from the power grid. Considering the fact that extra power is required from the grid, the power cost and CO2 emissions increase. As a result, the power cost increases between 18:00 and 19:00 from 6.67 EUR to 16.16 EUR, which is added to the hydrogen cost from natural gas. The result is 17.172 EUR. The power cost also increases between 19:00 and 20:00 from 5.68 EUR to 9.84 EUR and between 20:00 and 21:00 from 5.44 EUR to 19.86 EUR. The CO2 emissions are higher due to the steam reforming of natural gas and power supplied by the grid. They increase between 18:00 and 19:00 from 1368 gCO2 to 32,710 gCO2, between 19:00 and 20:00 from 1368 gCO2 to 12,533 gCO2 and between 20:00 and 21:00 from 1411.02 gCO2 to 38,193.45 gCO2.
During winter, there are only 2.28 kg of H2 stored until 18:00, which are used by the FCEVs with an additional 9.65 kg from steam reforming of natural gas, so the cost is 21.23 EUR. As in the case for autumn, the power required by the BEVs is supplied by the power grid. Between 20:00 and 21:00, there is a 3.94 kW surplus, which is supplied to the BEVs alongside 185.06 kW from the power grid. As a result, the power cost increases between 18:00 and 19:00 from 7.83 EUR to 16.45 EUR, which is added to the hydrogen cost from natural gas. The result is 37.68 EUR. The power cost also increases between 19:00 and 20:00 from 6.97 EUR to 10.13 EUR and between 20:00 and 21:00 from 6.12 EUR to 20.59 EUR. The CO2 emissions are also higher in the winter. They increase between 18:00 and 19:00 from 1440 gCO2 to 115,492 gCO2, between 19:00 and 20:00 from 1440 gCO2 to 12,605 gCO2 and between 20:00 and 21:00 from 1463.64 gCO2 to 38,959.9 gCO2.
The power supplied by the microgrid sources and hydrogen stored was enough to cover the demand during spring and summer for the cases when the BEVs and FCEVs were connected or not to the microgrid. During the autumn, the hydrogen stored was enough to cover the demand in case the BEVs and FCEVs were not connected to the microgrid. In case the BEVs and FCEVs were connected to the microgrid, the hydrogen stored was enough to cover the demand, so the BEVs were supplied by the main grid and part of the FCEVs were supplied by the hydrogen obtained as steam reforming of natural gas. The same situation happened during the winter, with the difference that the demand of the loads being higher and the hydrogen stored being lower. Therefore, a higher amount was supplied by the power grid. Also, a higher amount of hydrogen obtained by steam reforming was supplied in order to cover the demand.
The power cost was higher during autumn and winter when the BEVs and FCEVs were connected due to the extra power and hydrogen that had to be supplied. The CO2 emissions were also higher during autumn and winter when the BEVs and FCEVs were connected due to the extra power and hydrogen that had to be supplied.
The power cost and CO2 emissions were lower compared to the use of the power grid and steam reforming of natural gas. The power cost of the grid was 100% higher compared with the cost of the RES. A disadvantage was the cost of hydrogen, which was higher than the cost of the power grid, but is expected to decrease to at least half during the next few years due to the advances in the field, as was the case with the power cost of RESs. The CO2 emissions of the power grid were between 400% and 1600% higher compared with the emissions of the RES. An advantage of the hydrogen obtained using water electrolysis is represented by the CO2 emissions. The CO2 emissions of the hydrogen obtained by water electrolysis were between 500% and 3000% lower compared to steam reforming of natural gas. So, the use of hydrogen obtained by water electrolysis decreases the CO2 emissions and increases the power cost.
The power cost and CO2 emission values obtained by other researchers were also lower when renewable energy sources were used in microgrids with hydrogen storage. The CO2 emissions were 72.44% lower during a year in [24] due to the use of microgrid sources and hydrogen storage instead of the power grid, while in [25] the cost of power was 26.3% lower. In [45], it was found that the power cost for the microgrid increased between 5% and 158% due to the use of hydrogen. In [51], it was found that the CO2 emissions are higher in a microgrid if BEVs are used compared to FCEVs.
5. Conclusions
In this paper, hydrogen was obtained from water electrolysis based on the power supplied by photovoltaic and micro-hydro sources. This type of method has low CO2 emissions and high production costs. The hydrogen was also obtained using the steam reforming of natural gas, which has high CO2 emissions and a lower production cost compared to water electrolysis. The hydrogen obtained by steam reforming was used only to cover the hydrogen demand of FCEVs. The hydrogen obtained by water electrolysis was used to cover the power demand of the loads of the microgrid and to supply the FCEVs. The microgrid comprised loads, RESs, BEVs and FCEVs. The power grid and steam reforming of natural gas were used as back-up in case the demand could not be covered.
Considering the seasons and whether the BEVs and FCEVs were connected or not, the hydrogen stored had to be used. The power supplied by the power sources and hydrogen stored was enough to cover the demand during spring and summer, while during autumn and winter the power grid and steam reforming had to be used. Therefore, a back-up is required to ensure the continuous supply of consumers.
The connection of BEVs and FCEVs resulted in a higher power cost and CO2 emissions during autumn and winter due to the extra power and hydrogen that were needed. The power cost increased during the winter between 20:00 and 21:00 by 336%. The CO2 emissions increased during the winter by 8020%. The use of hydrogen obtained from conventional sources has a greater impact on the environment, but the use of hydrogen obtained from renewable energy sources has a smaller impact on the environment, as will be the case in the next decades.
If the power generation cost of the sources is compared with the generation cost of power to hydrogen, it can be observed that during summer, autumn and winter the H2 generation cost is in most cases lower due to the low excess power supplied by the microgrid sources. During spring, the H2 generation cost is in most cases higher, even by 40%, due to the high excess power supplied by the microgrid sources. This means that the H2 generation cost represents a barrier for the adoption of the large-scale use of hydrogen, so this cost must be lower. One way of achieving a lower H2 production cost, around 3 EUR/kg, is to use the hydrogen obtained from ammonia if there are any industrial facilities nearby that use this product, so this is worth further investigation.
In a future study, natural gas can be considered to supply some consumer appliances as well as more FCEVs. Also, the power cost of hydrogen obtained by water electrolysis is expected to decrease, so this will make hydrogen more attractive, especially considering the expected rise in the number of FCEVs.
Funding
This research received no external funding.
Institutional Review Board Statement
Not applicable.
Informed Consent Statement
Not applicable.
Data Availability Statement
The data are available upon request.
Conflicts of Interest
The author declares no conflict of interest.
References
- Tarhan, C.; Çil, M.A. A study on hydrogen, the clean energy of the future: Hydrogen storage methods. J. Energy Storage 2021, 40, 102676. [Google Scholar] [CrossRef]
- Younas, M.; Shafique, S.; Hafeez, A.; Javed, F.; Rehman, F. An Overview of Hydrogen Production: Current Status, Potential, and Challenges. Fuel 2022, 316, 123317. [Google Scholar] [CrossRef]
- Rasul, M.G.; Hazrat, M.A.; Sattar, M.A.; Jahirul, M.I.; Shearer, M.J. The future of hydrogen: Challenges on production, storage and applications. Energy Convers. Manag. 2022, 272, 116326. [Google Scholar] [CrossRef]
- Andersson, J.; Grönkvist, S. Large-scale storage of hydrogen. Int. J. Hydrogen Energy 2019, 44, 11901–11919. [Google Scholar] [CrossRef]
- Dawood, F.; Anda, M.; Shafiullah, G.M. Hydrogen production for energy: An overview. Int. J. Hydrogen Energy 2020, 45, 3847–3869. [Google Scholar] [CrossRef]
- Sazali, N. Emerging technologies by hydrogen: A review. Int. J. Hydrogen Energy 2020, 45, 18753–18771. [Google Scholar] [CrossRef]
- Liu, W.; Zuo, H.; Wang, J.; Xue, Q.; Ren, B.; Yang, F. The production and application of hydrogen in steel industry. Int. J. Hydrogen Energy 2021, 46, 10548–10569. [Google Scholar] [CrossRef]
- Ajanovic, A.; Sayer, M.; Haas, R. The economics and the environmental benignity of different colors of hydrogen. Int. J. Hydrogen Energy 2022, 47, 24136–24154. [Google Scholar] [CrossRef]
- Panchenko, V.A.; Daus, Y.V.; Kovalev, A.A.; Yudaev, I.V.; Litti, Y.V. Prospects for the production of green hydrogen: Review of countries with high potential. Int. J. Hydrogen Energy 2023, 48, 4551–4571. [Google Scholar] [CrossRef]
- Felseghi, R.A.; Carcadea, E.; Raboaca, M.S.; Trufin, C.N.; Filote, C. Hydrogen Fuel Cell Technology for the Sustainable Future of Stationary Applications. Energies 2019, 12, 4593. [Google Scholar] [CrossRef]
- Sharma, S.; Agarwal, S.; Jain, A. Significance of Hydrogen as Economic and Environmentally Friendly Fuel. Energies 2021, 14, 7389. [Google Scholar] [CrossRef]
- Rivard, E.; Trudeau, M.; Zaghib, K. Hydrogen Storage for Mobility: A Review. Materials 2019, 12, 1973. [Google Scholar] [CrossRef] [PubMed]
- Glenk, G.; Reichelstein, S. Economics of converting renewable power to hydrogen. Nat. Energy 2019, 4, 216–222. [Google Scholar] [CrossRef]
- Noussan, M.; Raimondi, P.P.; Scita, R.; Hafner, M. The Role of Green and Blue Hydrogen in the Energy Transition—A Technological and Geopolitical Perspective. Sustainability 2021, 13, 298. [Google Scholar] [CrossRef]
- Osman, A.I.; Mehta, N.; Elgarahy, A.M.; Hefny, M.; Al-Hinai, A.; Al-Muhtaseb, A.H.; Rooney, D.W. Hydrogen production, storage, utilisation and environmental impacts: A review. Environ. Chem. Lett. 2022, 20, 153–188. [Google Scholar] [CrossRef]
- Sun, X.; Cao, X.; Zeng, B.; Zhai, Q.; Guan, X. Multistage Dynamic Planning of Integrated Hydrogen-Electrical Microgrids under Multiscale Uncertainties. IEEE Trans. Smart Grid 2022, 14, 3482–3498. [Google Scholar] [CrossRef]
- Zhang, R.; Li, X.; Wang, X.; Wang, Q.; Qi, Z. Optimal Scheduling for Hydrogen-electric Hybrid Microgrid with Vehicle to Grid Technology. In Proceedings of the 2021 China Automation Congress (CAC), Beijing, China, 22–24 October 2021; pp. 6296–6300. [Google Scholar] [CrossRef]
- Alluraiah, N.C.; Vijayapriya, P. Optimization, Design, and Feasibility Analysis of a Grid-Integrated Hybrid AC/DC Microgrid System for Rural Electrification. IEEE Access 2023, 11, 67013–67029. [Google Scholar] [CrossRef]
- Zhong, Z.; Huang, D.; Hu, K.; Ai, X.; Fang, J. Real-time Optimal Operation of Microgrid with Power-to-hydrogen. In Proceedings of the 2020 IEEE Sustainable Power and Energy Conference (iSPEC), Chengdu, China, 23–25 November 2020; pp. 2275–2280. [Google Scholar] [CrossRef]
- Ghezelbash, A.; Khaligh, V.; Liu, J.; Ryu, J.H. Scheduling of a Multi-energy Microgrid Enhanced with Hydrogen Storage. In Proceedings of the 2022 IEEE PES 14th Asia-Pacific Power and Energy Engineering Conference (APPEEC), Melbourne, Australia, 20–23 November 2022; pp. 1–6. [Google Scholar] [CrossRef]
- Villa Londono, J.E.; Mazza, A.; Pons, E.; Lok, H.; Bompard, E. Modelling and Control of a Grid-Connected RES-Hydrogen Hybrid Microgrid. Energies 2021, 14, 1540. [Google Scholar] [CrossRef]
- Sahri, Y.; Belkhier, Y.; Tamalouzt, S.; Ullah, N.; Shaw, R.N.; Chowdhury, M.S.; Techato, K. Energy Management System for Hybrid PV/Wind/Battery/Fuel Cell in Microgrid-Based Hydrogen and Economical Hybrid Battery/Super Capacitor Energy Storage. Energies 2021, 14, 5722. [Google Scholar] [CrossRef]
- Arsalis, A.; Georghiou, G.E.; Papanastasiou, P. Recent Research Progress in Hybrid Photovoltaic–Regenerative Hydrogen Fuel Cell Microgrid Systems. Energies 2022, 15, 3512. [Google Scholar] [CrossRef]
- Abdelsalam, R.A.; Abdallah, Y.S.; Shabar, N.M.; Afifi, O.A.; Fouda, M.H.; El-Deib, A.A. Energy Management and Techno-Economic Optimization of an Isolated Hybrid AC/DC Microgrid with Green Hydrogen Storage System. In Proceedings of the 2023 IEEE Conference on Power Electronics and Renewable Energy (CPERE), Luxor, Egypt, 19–21 February 2023; pp. 1–7. [Google Scholar] [CrossRef]
- Cao, X.; Sun, X.; Xu, Z.; Zeng, B.; Guan, X. Hydrogen-Based Networked Microgrids Planning Through Two-Stage Stochastic Programming with Mixed-Integer Conic Recourse. IEEE Trans. Autom. Sci. Eng. 2022, 19, 3672–3685. [Google Scholar] [CrossRef]
- Wang, J.; Li, D.; Lv, X.; Meng, X.; Zhang, J.; Ma, T.; Pei, W.; Xiao, H. Two-Stage Energy Management Strategies of Sustainable Wind-PV-Hydrogen-Storage Microgrid Based on Receding Horizon Optimization. Energies 2022, 15, 2861. [Google Scholar] [CrossRef]
- Alzahrani, A.; Ramu, S.K.; Devarajan, G.; Vairavasundaram, I.; Vairavasundaram, S. A Review on Hydrogen-Based Hybrid Microgrid System: Topologies for Hydrogen Energy Storage, Integration, and Energy Management with Solar and Wind Energy. Energies 2022, 15, 7979. [Google Scholar] [CrossRef]
- Hou, H.; Chen, Y.; Liu, P.; Xie, C.; Huang, L.; Zhang, R.; Zhang, Q. Multisource Energy Storage System Optimal Dispatch Among Electricity Hydrogen and Heat Networks from the Energy Storage Operator Prospect. IEEE Trans. Ind. Appl. 2022, 58, 2825–2835. [Google Scholar] [CrossRef]
- Ganeshan, A.; Holmes, D.G.; Meegahapola, L.; McGrath, B.P. Enhanced control of a hydrogen energy storage system in a microgrid. In Proceedings of the 2017 Australasian Universities Power Engineering Conference (AUPEC), Melbourne, Australia, 19–22 November 2017; pp. 1–6. [Google Scholar] [CrossRef]
- Oliveira, A.M.; Beswick, R.R.; Yan, Y. A green hydrogen economy for a renewable energy society. Curr. Opin. Chem. Eng. 2021, 33, 100701. [Google Scholar] [CrossRef]
- Behera, M.K.; Saikia, L.C. A Novel Resilient Control of Grid-Integrated Solar PV-Hybrid Energy Storage Microgrid for Power Smoothing and Pulse Power Load Accommodation. IEEE Trans. Power Electron. 2023, 36, 3965–3980. [Google Scholar] [CrossRef]
- Shanbog, N.S.; Agalgaonkar, Y.; Rajarathnam, U. A Financial Feasibility Analysis of Hydrogen in Microgrids. In Proceedings of the 2019 2nd International Conference on Power and Embedded Drive Control (ICPEDC), Chennai, India, 21–23 August 2019; pp. 58–63. [Google Scholar] [CrossRef]
- Gong, X.; Dong, F.; Mohamed, M.A.; Abdalla, O.M.; Ali, Z.M. A Secured Energy Management Architecture for Smart Hybrid Microgrids Considering PEM-Fuel Cell and Electric Vehicles. IEEE Access 2020, 8, 47807–47823. [Google Scholar] [CrossRef]
- Li, B. Build 100% renewable energy based power station and microgrid clusters through hydrogen-centric storage systems. In Proceedings of the 2020 4th International Conference on HVDC (HVDC), Xi’an, China, 6–9 November 2020; pp. 1253–1257. [Google Scholar] [CrossRef]
- Fan, F.; Zhang, R.; Xu, Y.; Ren, S. Robustly Coordinated Operation of an Emission-free Microgrid with Hybrid Hydrogen-battery Energy Storage. CSEE J. Power Energy Syst. 2022, 8, 369–379. [Google Scholar] [CrossRef]
- Serra, F.; Petrollese, M.; Lucariello, M.; Cau, G. Assessment of a hydrogen production, storage and utilization system in a demonstrative microgrid. In Proceedings of the 2020 2nd IEEE International Conference on Industrial Electronics for Sustainable Energy Systems (IESES), Cagliari, Italy, 1–3 September 2020; pp. 157–162. [Google Scholar] [CrossRef]
- Khaligh, V.; Ghezelbash, A.; Liu, J.; Ryu, J.H. Cooperative Energy Management of a Microgrid with Bidirectional Electricity-Hydrogen Energy Conversion. In Proceedings of the 2022 IEEE PES 14th Asia-Pacific Power and Energy Engineering Conference (APPEEC), Melbourne, Australia, 20–23 November 2022; pp. 1–6. [Google Scholar] [CrossRef]
- Valverde, L.; Rosa, F.; Bordons, C. Design, Planning and Management of a Hydrogen-Based Microgrid. IEEE Trans. Ind. Inform. 2013, 9, 1398–1404. [Google Scholar] [CrossRef]
- Cecilia, A.; Carroquino, J.; Roda, V.; Costa-Castelló, R.; Barreras, F. Optimal Energy Management in a Standalone Microgrid, with Photovoltaic Generation, Short-Term Storage, and Hydrogen Production. Energies 2020, 13, 1454. [Google Scholar] [CrossRef]
- Naseri, N.; El Hani, S.; El Harouri, K.; Mediouni, H. Primary and secondary control of an autonomous solar microgrid based power-to-X: Renewable hydrogen conversion. Int. J. Hydrogen Energy 2022, 47, 24421–24438. [Google Scholar] [CrossRef]
- Hossain, B.; Islam, R.; Muttaqi, K.M.; Sutanto, D.; Agalgaonkar, A.P. Modeling and performance analysis of renewable hydrogen energy hub connected to an ac/dc hybrid microgrid. Int. J. Hydrogen Energy 2022, 47, 28626–28644. [Google Scholar] [CrossRef]
- Bovo, A.; Poli, N.; Trovò, A.; Marini, G.; Guarnieri, M. Hydrogen energy storage system in a Multi–Technology Microgrid:technical features and performance. Int. J. Hydrogen Energy 2023, 48, 12072–12088. [Google Scholar] [CrossRef]
- Van, L.P.; Chi, K.D.; Duc, T.N. Review of hydrogen technologies based microgrid: Energy management systems, challenges and future recommendations. Int. J. Hydrogen Energy 2023, 48, 14127–14148. [Google Scholar] [CrossRef]
- Califano, M.; Califano, G.; Sorrentino, M.; Rosen, M.A.; Pianese, C. Hydrogen-based microgrid: Development of medium level controls in a multilevel algorithm framework. Int. J. Hydrogen Energy, 2023; in press. [Google Scholar] [CrossRef]
- Mah, A.X.Y.; Ho, W.S.; Hassim, M.H.; Hashim, H.; Ling, G.H.T.; Ho, C.S.; Muis, Z.A. Optimization of a standalone photovoltaic-based microgrid with electrical and hydrogen loads. Energy 2021, 235, 121218. [Google Scholar] [CrossRef]
- Mansour-Saatloo, A.; Mirzaei, M.A.; Mohammadi-Ivatloo, B.; Zare, K. A Risk-Averse Hybrid Approach for Optimal Participation of Power-to-Hydrogen Technology-Based Multi-Energy Microgrid in Multi-Energy Markets. Sustain. Cities Soc. 2020, 63, 102421. [Google Scholar] [CrossRef]
- Alam, M.; Kumar, K.; Verma, S.; Dutta, V. Renewable sources based DC microgrid using hydrogen energy storage: Modelling and experimental analysis. Sustain. Energy Technol. Assess. 2020, 42, 100840. [Google Scholar] [CrossRef]
- Hafsi, O.; Abdelkhalek, O.; Mekhilef, S.; Soumeur, M.A.; Hartani, M.A.; Chakar, A. Integration of hydrogen technology and energy management comparison for DC-Microgrid including renewable energies and energy storage system. Sustain. Energy Technol. Assess. 2022, 52, 102121. [Google Scholar] [CrossRef]
- Yang, H.; Li, Q.; Zhao, S.; Chen, W.; Liu, H. A Hierarchical Self-Regulation Control for Economic Operation of AC/DC Hybrid Microgrid with Hydrogen Energy Storage System. IEEE Access 2019, 7, 89330–89341. [Google Scholar] [CrossRef]
- Gugulothu, R.; Nagu, B.; Pullaguram, D. Energy management strategy for standalone DC microgrid system with photovoltaic/fuel cell/battery storage. J. Energy Storage 2023, 57, 106274. [Google Scholar] [CrossRef]
- Förster, R.; Kaiser, M.; Wenninger, S. Future vehicle energy supply-sustainable design and operation of hybrid hydrogen and electric microgrids. Appl. Energy 2023, 334, 120653. [Google Scholar] [CrossRef]
- Abo-Elyousr, F.K.; Guerrero, J.M.; Ramadan, H.S. Prospective hydrogen-based microgrid systems for optimal leverage via metaheuristic approaches. Appl. Energy 2021, 300, 117384. [Google Scholar] [CrossRef]
- Zhang, X.; Pei, W.; Mei, C.; Deng, W.; Tan, J.; Zhang, Q. Transform from gasoline stations to electric-hydrogen hybrid refueling stations: An islanding DC microgrid with electric-hydrogen hybrid energy storage system and its control strategy. Int. J. Electr. Power Energy Syst. 2022, 136, 107684. [Google Scholar] [CrossRef]
- Tostado-Véliz, M.; Arévalo, P.; Jurado, F. A comprehensive electrical-gas-hydrogen Microgrid model for energy management applications. Energy Convers. Manag. 2021, 228, 113726. [Google Scholar] [CrossRef]
- Navas, S.J.; Cabello González, G.M.; Pino, F.J. Hybrid power-heat microgrid solution using hydrogen as an energy vector for residential houses in Spain. A case study. Energy Convers. Manag. 2022, 263, 115724. [Google Scholar] [CrossRef]
- Yousri, D.; Farag, H.E.Z.; Zeineldin, H.; El-Saadany, E.F. Integrated model for optimal energy management and demand response of microgrids considering hybrid hydrogen-battery storage systems. Energy Convers. Manag. 2023, 280, 116809. [Google Scholar] [CrossRef]
- K/bidi, F.; Damour, C.; Grondin, D.; Hilairet, M.; Benne, M. Multistage power and energy management strategy for hybrid microgrid with photovoltaic production and hydrogen storage. Appl. Energy 2022, 280, 119549. [Google Scholar] [CrossRef]
- Fang, X.; Dong, W.; Wang, Y.; Yang, Q. Multiple time-scale energy management strategy for a hydrogen-based multi-energy microgrid. Appl. Energy 2022, 328, 120195. [Google Scholar] [CrossRef]
- Heidary, H.; El-Kharouf, A.; Steinberger-Wilckens, R.; Bozorgmehri, S.; Salimi, M.; Golmohammad, M. Life cycle assessment of solid oxide fuel cell vehicles in a natural gas producing country; comparison with proton electrolyte fuel cell, battery and gasoline vehicles. Sustain. Energy Technol. Assess. 2023, 59, 103396. [Google Scholar] [CrossRef]
- Robledo, C.B.; Oldenbroek, V.; Abbruzzese, A.; van Wijk, A.J.M. Integrating a hydrogen fuel cell electric vehicle with vehicle-to-grid technology, photovoltaic power and a residential building. Appl. Energy 2018, 215, 615–629. [Google Scholar] [CrossRef]
- Mukherjee, U.; Maroufmashat, A.; Ranisau, J.; Barbouti, M.; Trainor, A.; Juthani, N.; El-Shayeb, H.; Fowler, M. Techno-economic, environmental, and safety assessment of hydrogen powered community microgrids; case study in Canada. Int. J. Hydrogen Energy 2017, 40, 14333–14349. [Google Scholar] [CrossRef]
- Sánchez-Sáinz, H.; García-Vázquez, C.-A.; Llorens Iborra, F.; Fernández-Ramírez, L.M. Methodology for the Optimal Design of a Hybrid Charging Station of Electric and Fuel Cell Vehicles Supplied by Renewable Energies and an Energy Storage System. Sustainability 2019, 11, 5743. [Google Scholar] [CrossRef]
- Dulău, L.I.; Abrudean, M.; Bică, D. Distributed Generation Technologies and Optimization. Procedia Technol. 2014, 12, 687–692. [Google Scholar] [CrossRef]
- U.S. Department of Energy, Hydrogen and Fuel Cell Technologies Office. Available online: https://www.energy.gov/eere/fuelcells/hydrogen-and-fuel-cell-technologies-office (accessed on 23 October 2023).
- Nadeem, F.; Hussain, S.M.S.; Tiwari, P.K.; Goswami, A.K.; Ustun, T.S. Comparative Review of Energy Storage Systems, Their Roles, and Impacts on Future Power Systems. IEEE Access 2019, 7, 4555–4585. [Google Scholar] [CrossRef]
- Elio, J.; Phelan, P.; Villalobos, R. A Review of Energy Storage Technologies for Demand-Side Management in Industrial Facilities. J. Clean. Prod. 2021, 307, 127322. [Google Scholar] [CrossRef]
- Mongird, K.; Viswanathan, V.; Alam, J. 2020 Grid Energy Storage Technology Cost and Performance Assessment; Technical Report; U.S. Department of Energy: Washington, DC, USA, 2020.
- Taylor, M.; Ralon, P.; Al-Zoghoul, S. Renewable Power Generation Costs in 2021; Technical Report; International Renewable Energy Agency (IRENA): Abu Dhabi, United Arab Emirates, 2022. [Google Scholar]
- Mongird, K.; Fotedar, V.; Viswanathan, V. Energy Storage Technology and Cost Characterization Report; Technical Report; U.S. Department of Energy: Washington, DC, USA, 2019.
- Faria, R.; Moura, P.; Delgado, J.; de Almeida, A.T. A sustainability assessment of electric vehicles as a personal mobility system. Energy Convers. Manag. 2012, 61, 19–30. [Google Scholar] [CrossRef]
- Ramachandran, S.; Stimming, U. Well to wheel analysis of low carbon alternatives for road traffic. Energy Environ. Sci. 2015, 8, 3313–3324. [Google Scholar] [CrossRef]
- Longden, T.; Beck, F.J.; Jotzo, F.; Andrews, R.; Prasad, M. ‘Clean’ hydrogen?—Comparing the emissions and costs of fossil fuel versus renewable electricity based hydrogen. Appl. Energy 2022, 306, 118145. [Google Scholar] [CrossRef]
- Howarth, R.W.; Jacobson, M.Z. How green is blue hydrogen? Energy Sci. Eng. 2021, 9, 1676–1687. [Google Scholar] [CrossRef]
- Dulău, L.I. CO2 Emissions of Battery Electric Vehicles and Hydrogen Fuel Cell Vehicles. Clean Technol. 2023, 5, 696–712. [Google Scholar] [CrossRef]
- Tong, F.; Michalek, J.; Azevedo, I.L. A review of hydrogen production pathways, cost and decarbonization potential. In Proceedings of the 35th USAEE/IAEE North American Conference, Houston, TX, USA, 12–15 November 2017. [Google Scholar]
- Tenhumberg, N.; Büker, K. Ecological and Economic Evaluation of Hydrogen Production by Different Water Electrolysis Technologies. Chem. Ing. Tech. 2020, 92, 1586–1595. [Google Scholar] [CrossRef]
- MATLAB R2023b. Available online: https://www.mathworks.com/products/matlab.html (accessed on 1 September 2023).
Figure 1.
Microgrid with hydrogen storage, BEVs and FCEVs.
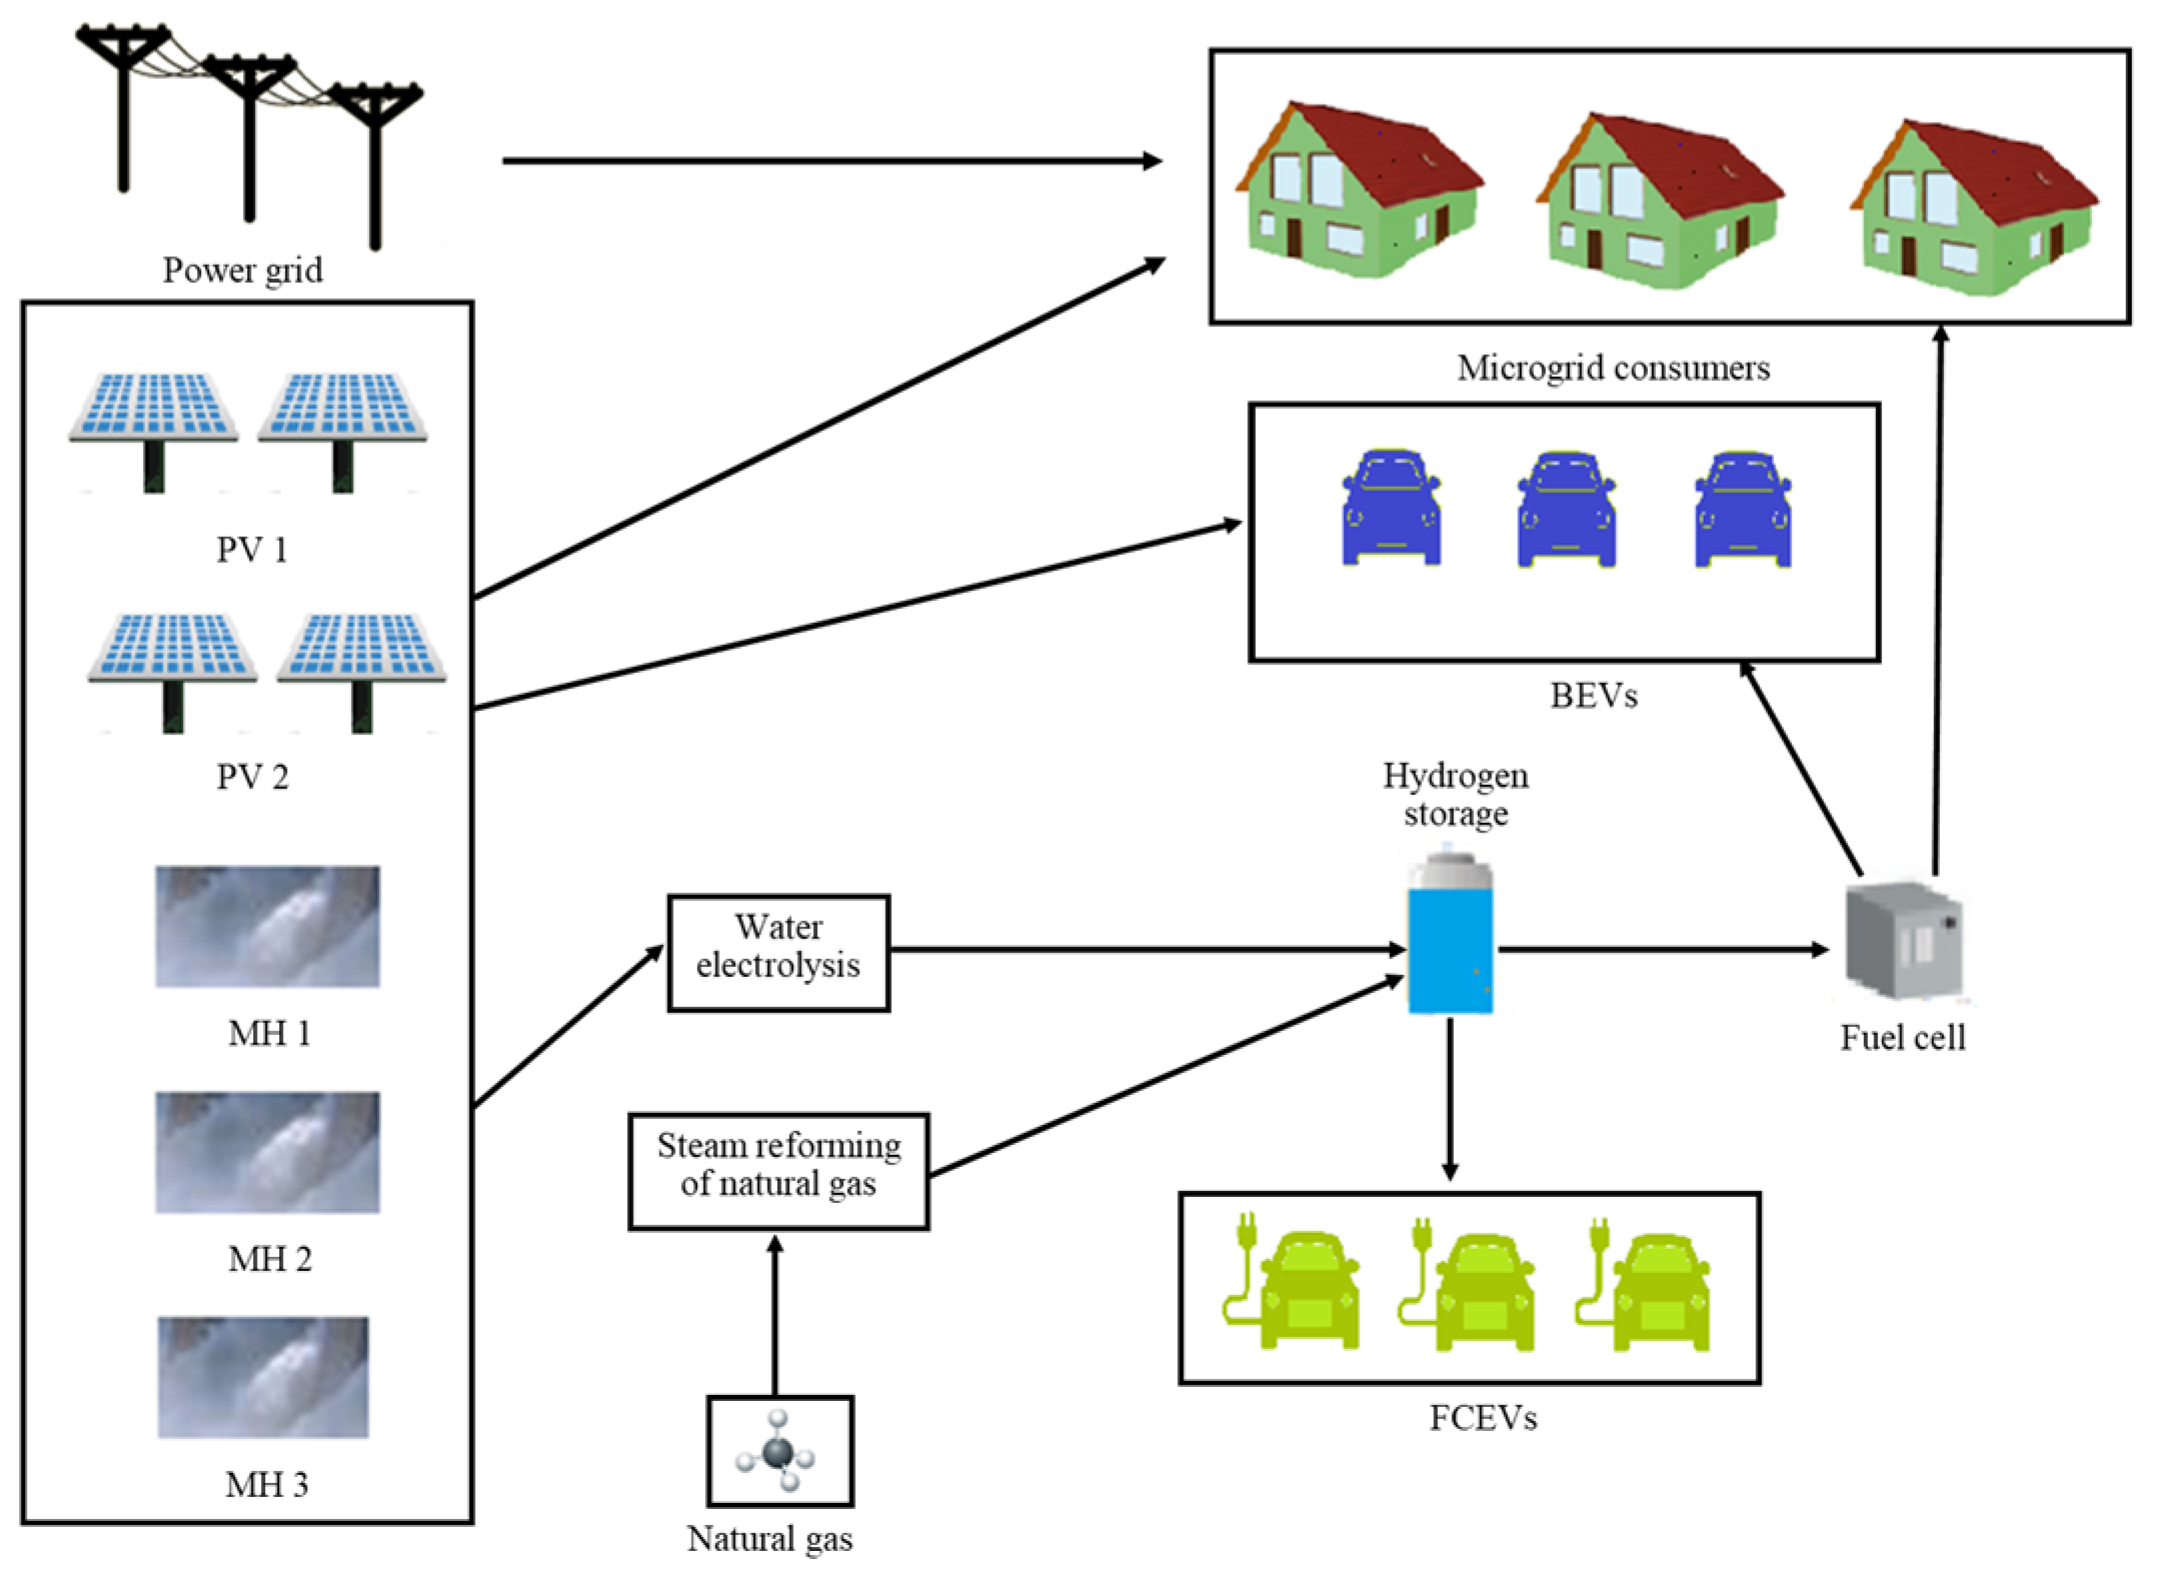
Figure 2.
Power cost (spring).

Figure 3.
Power cost (summer).
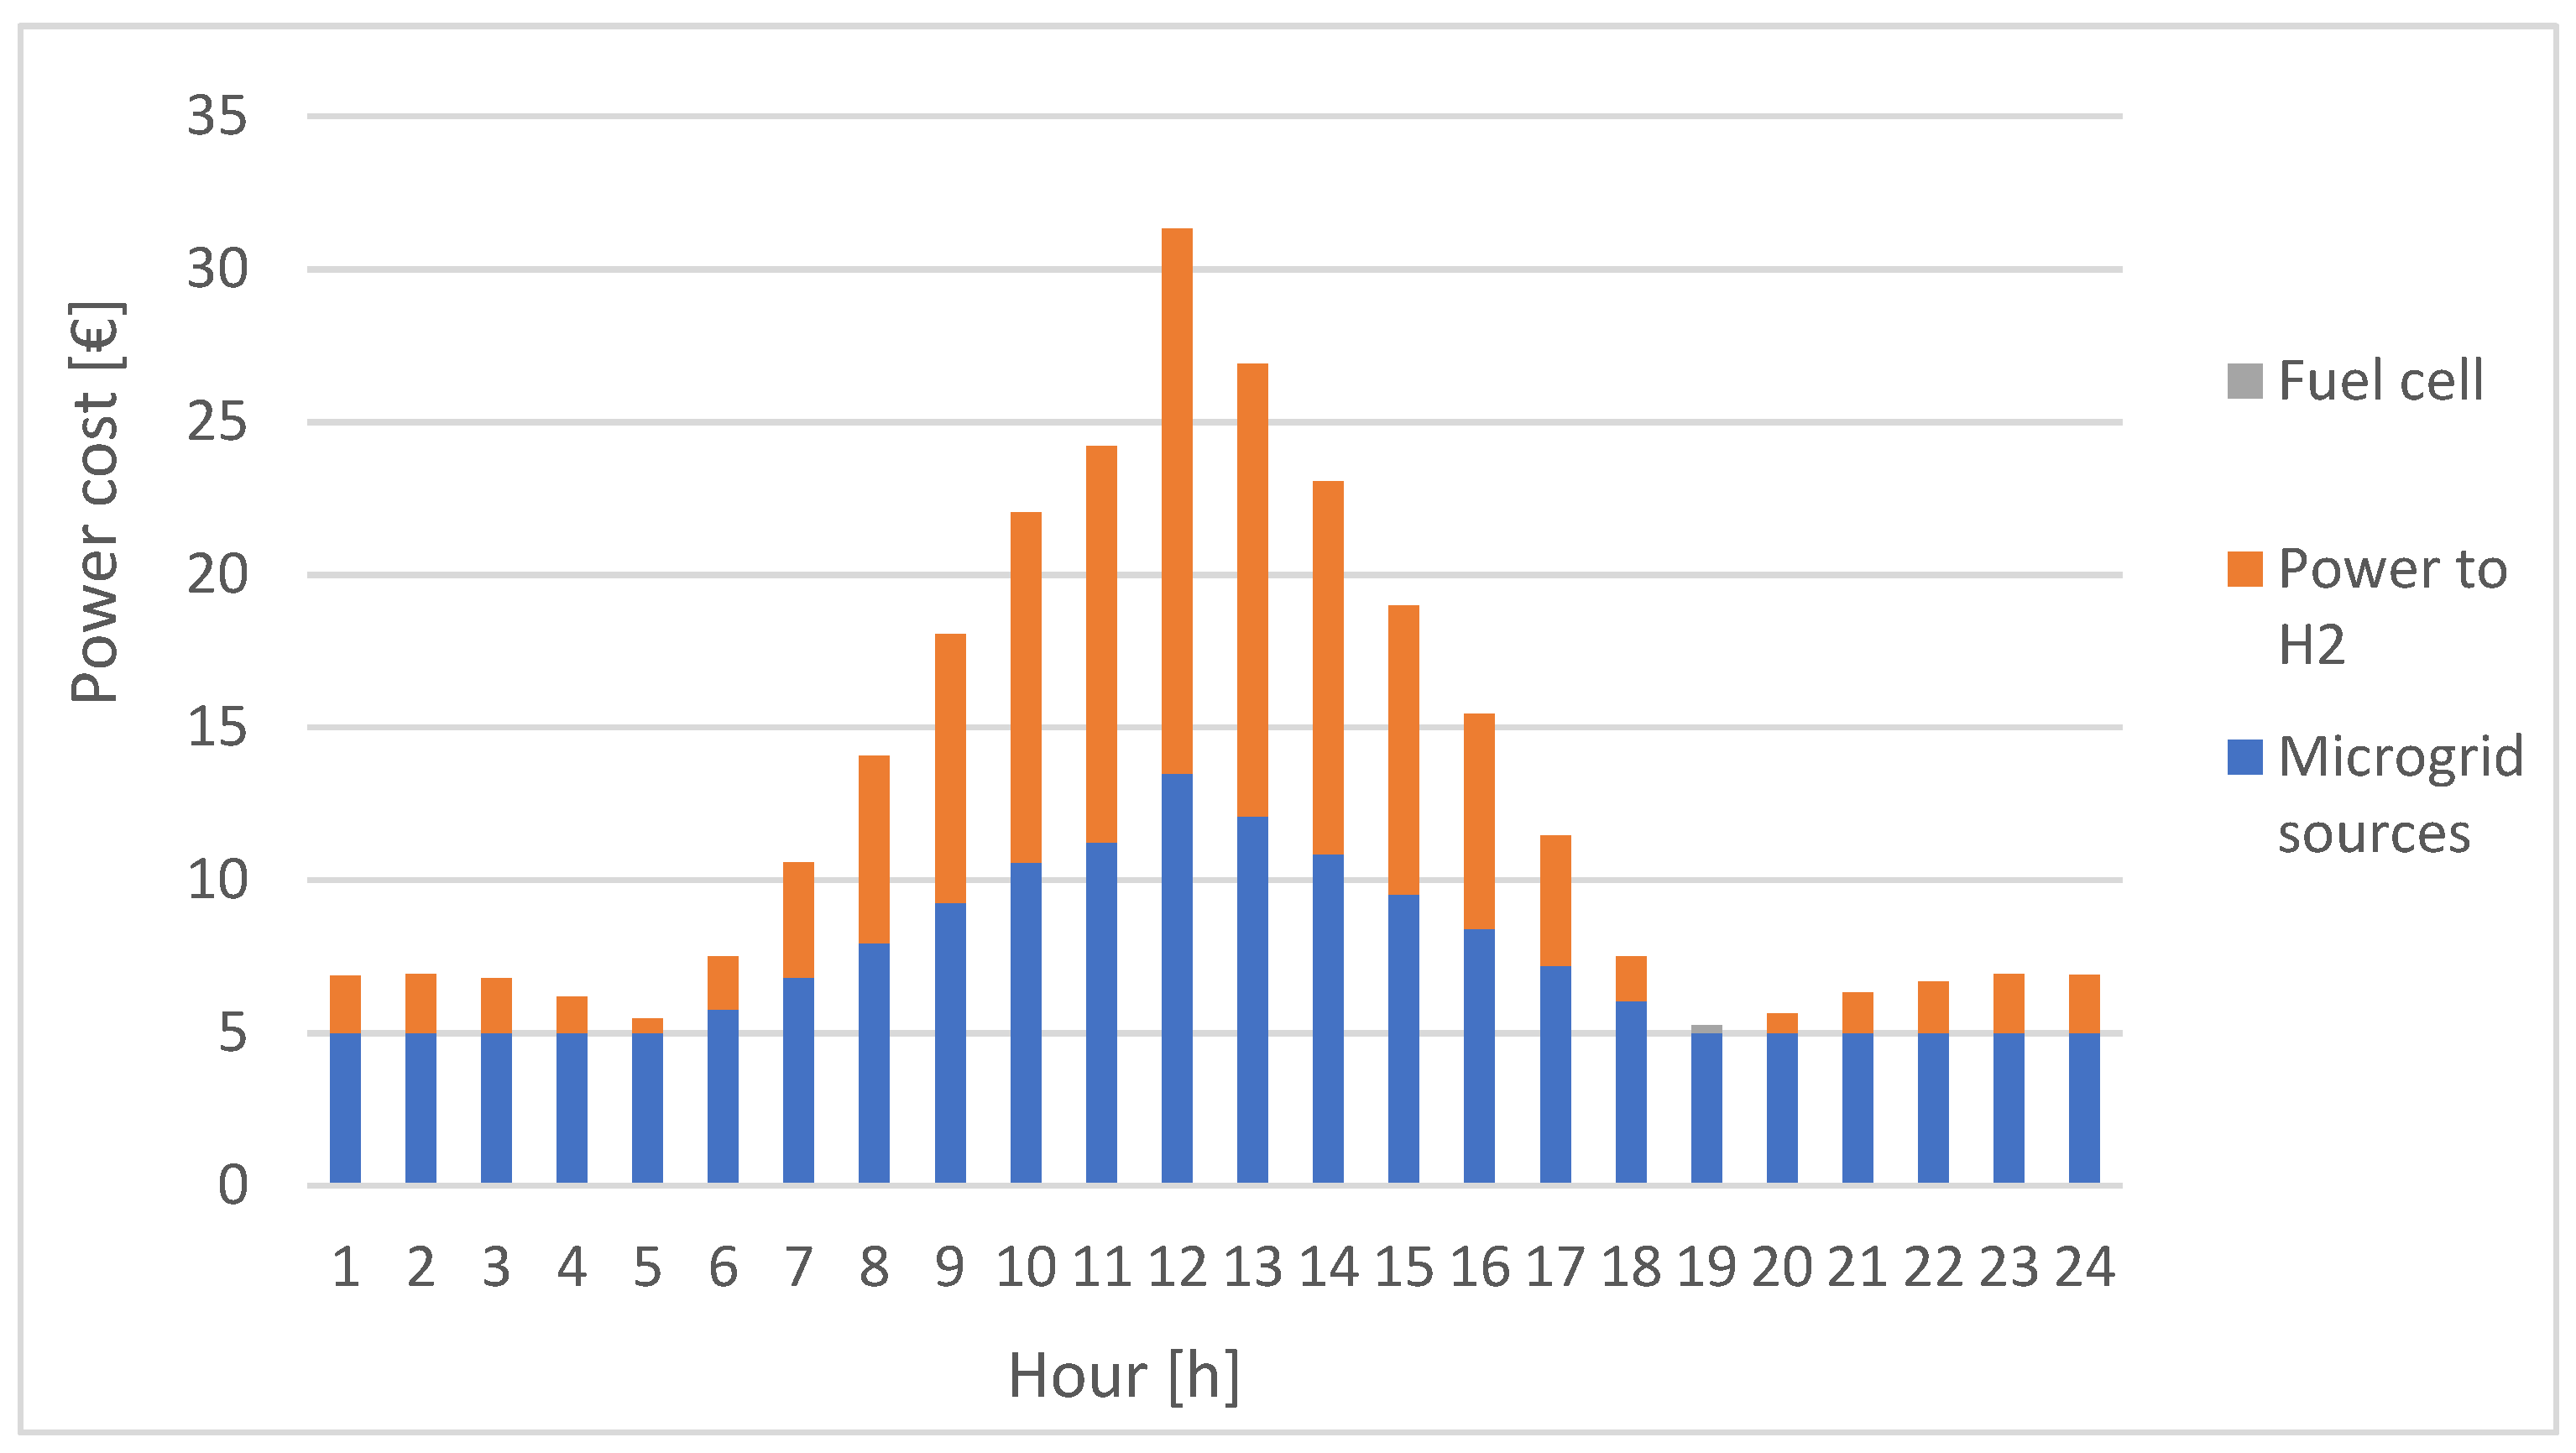
Figure 4.
Power cost (autumn).
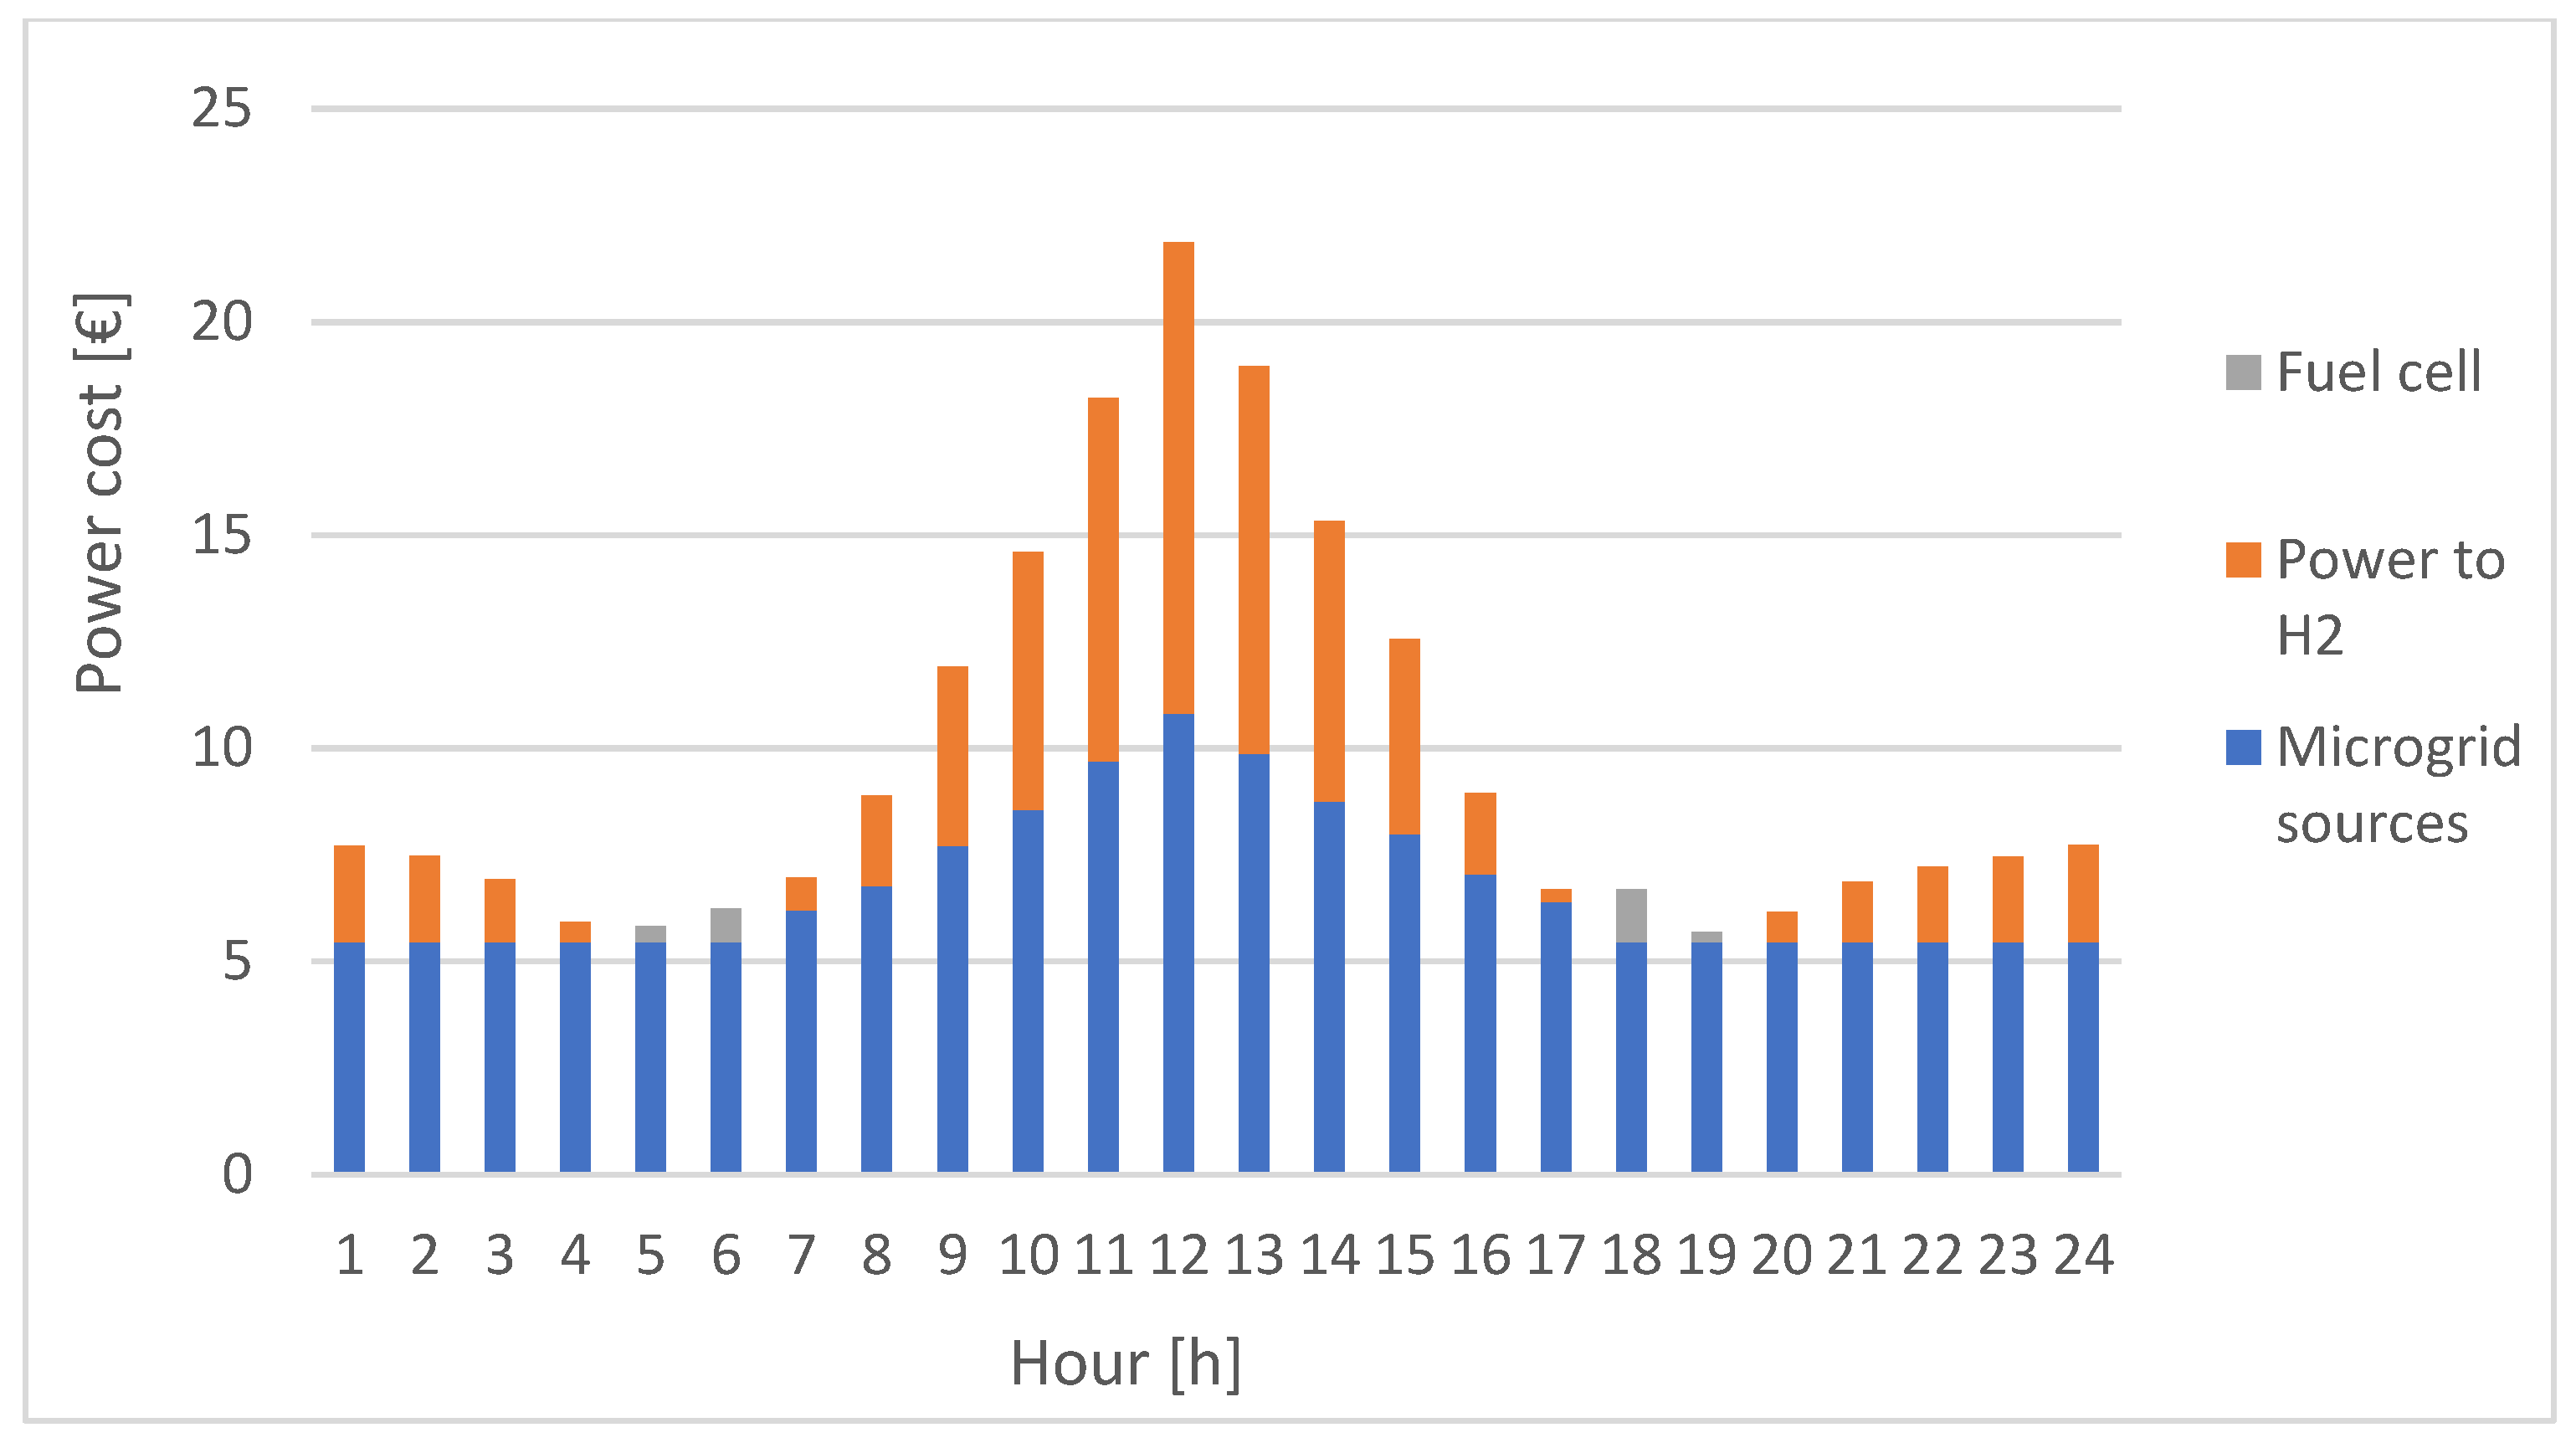
Figure 5.
Power cost (winter).
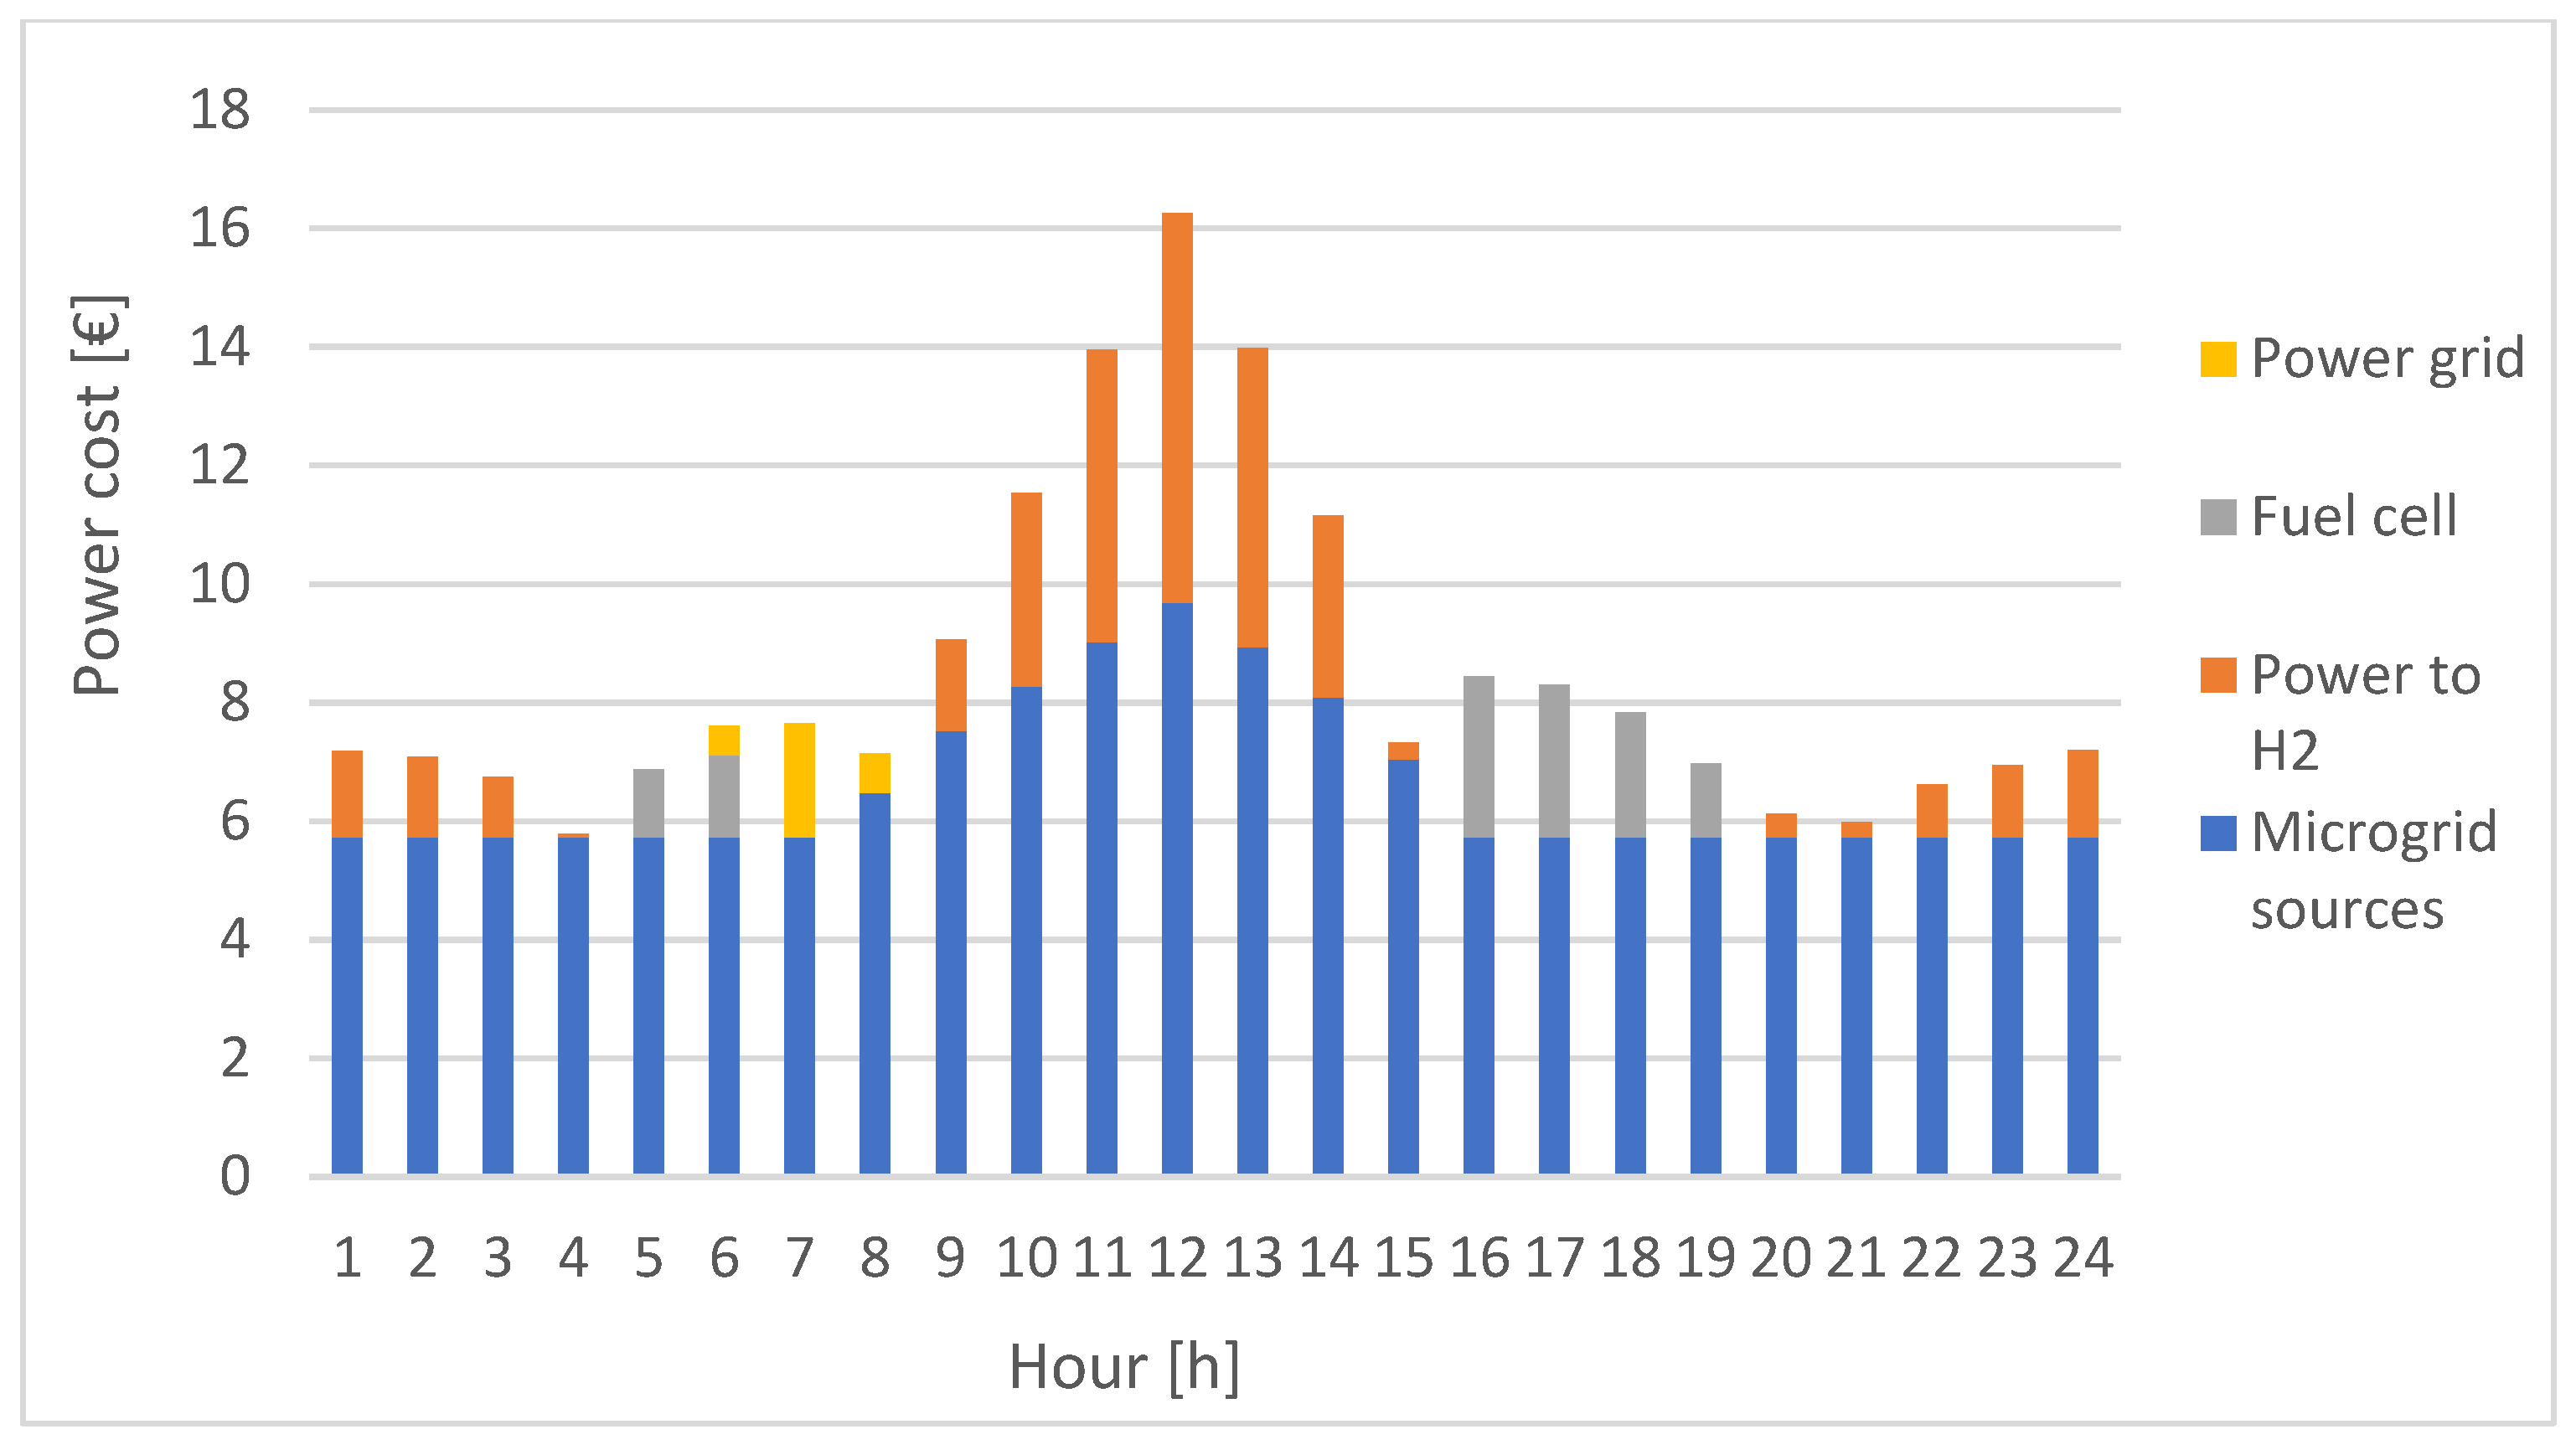
Figure 6.
CO2 emissions (spring).
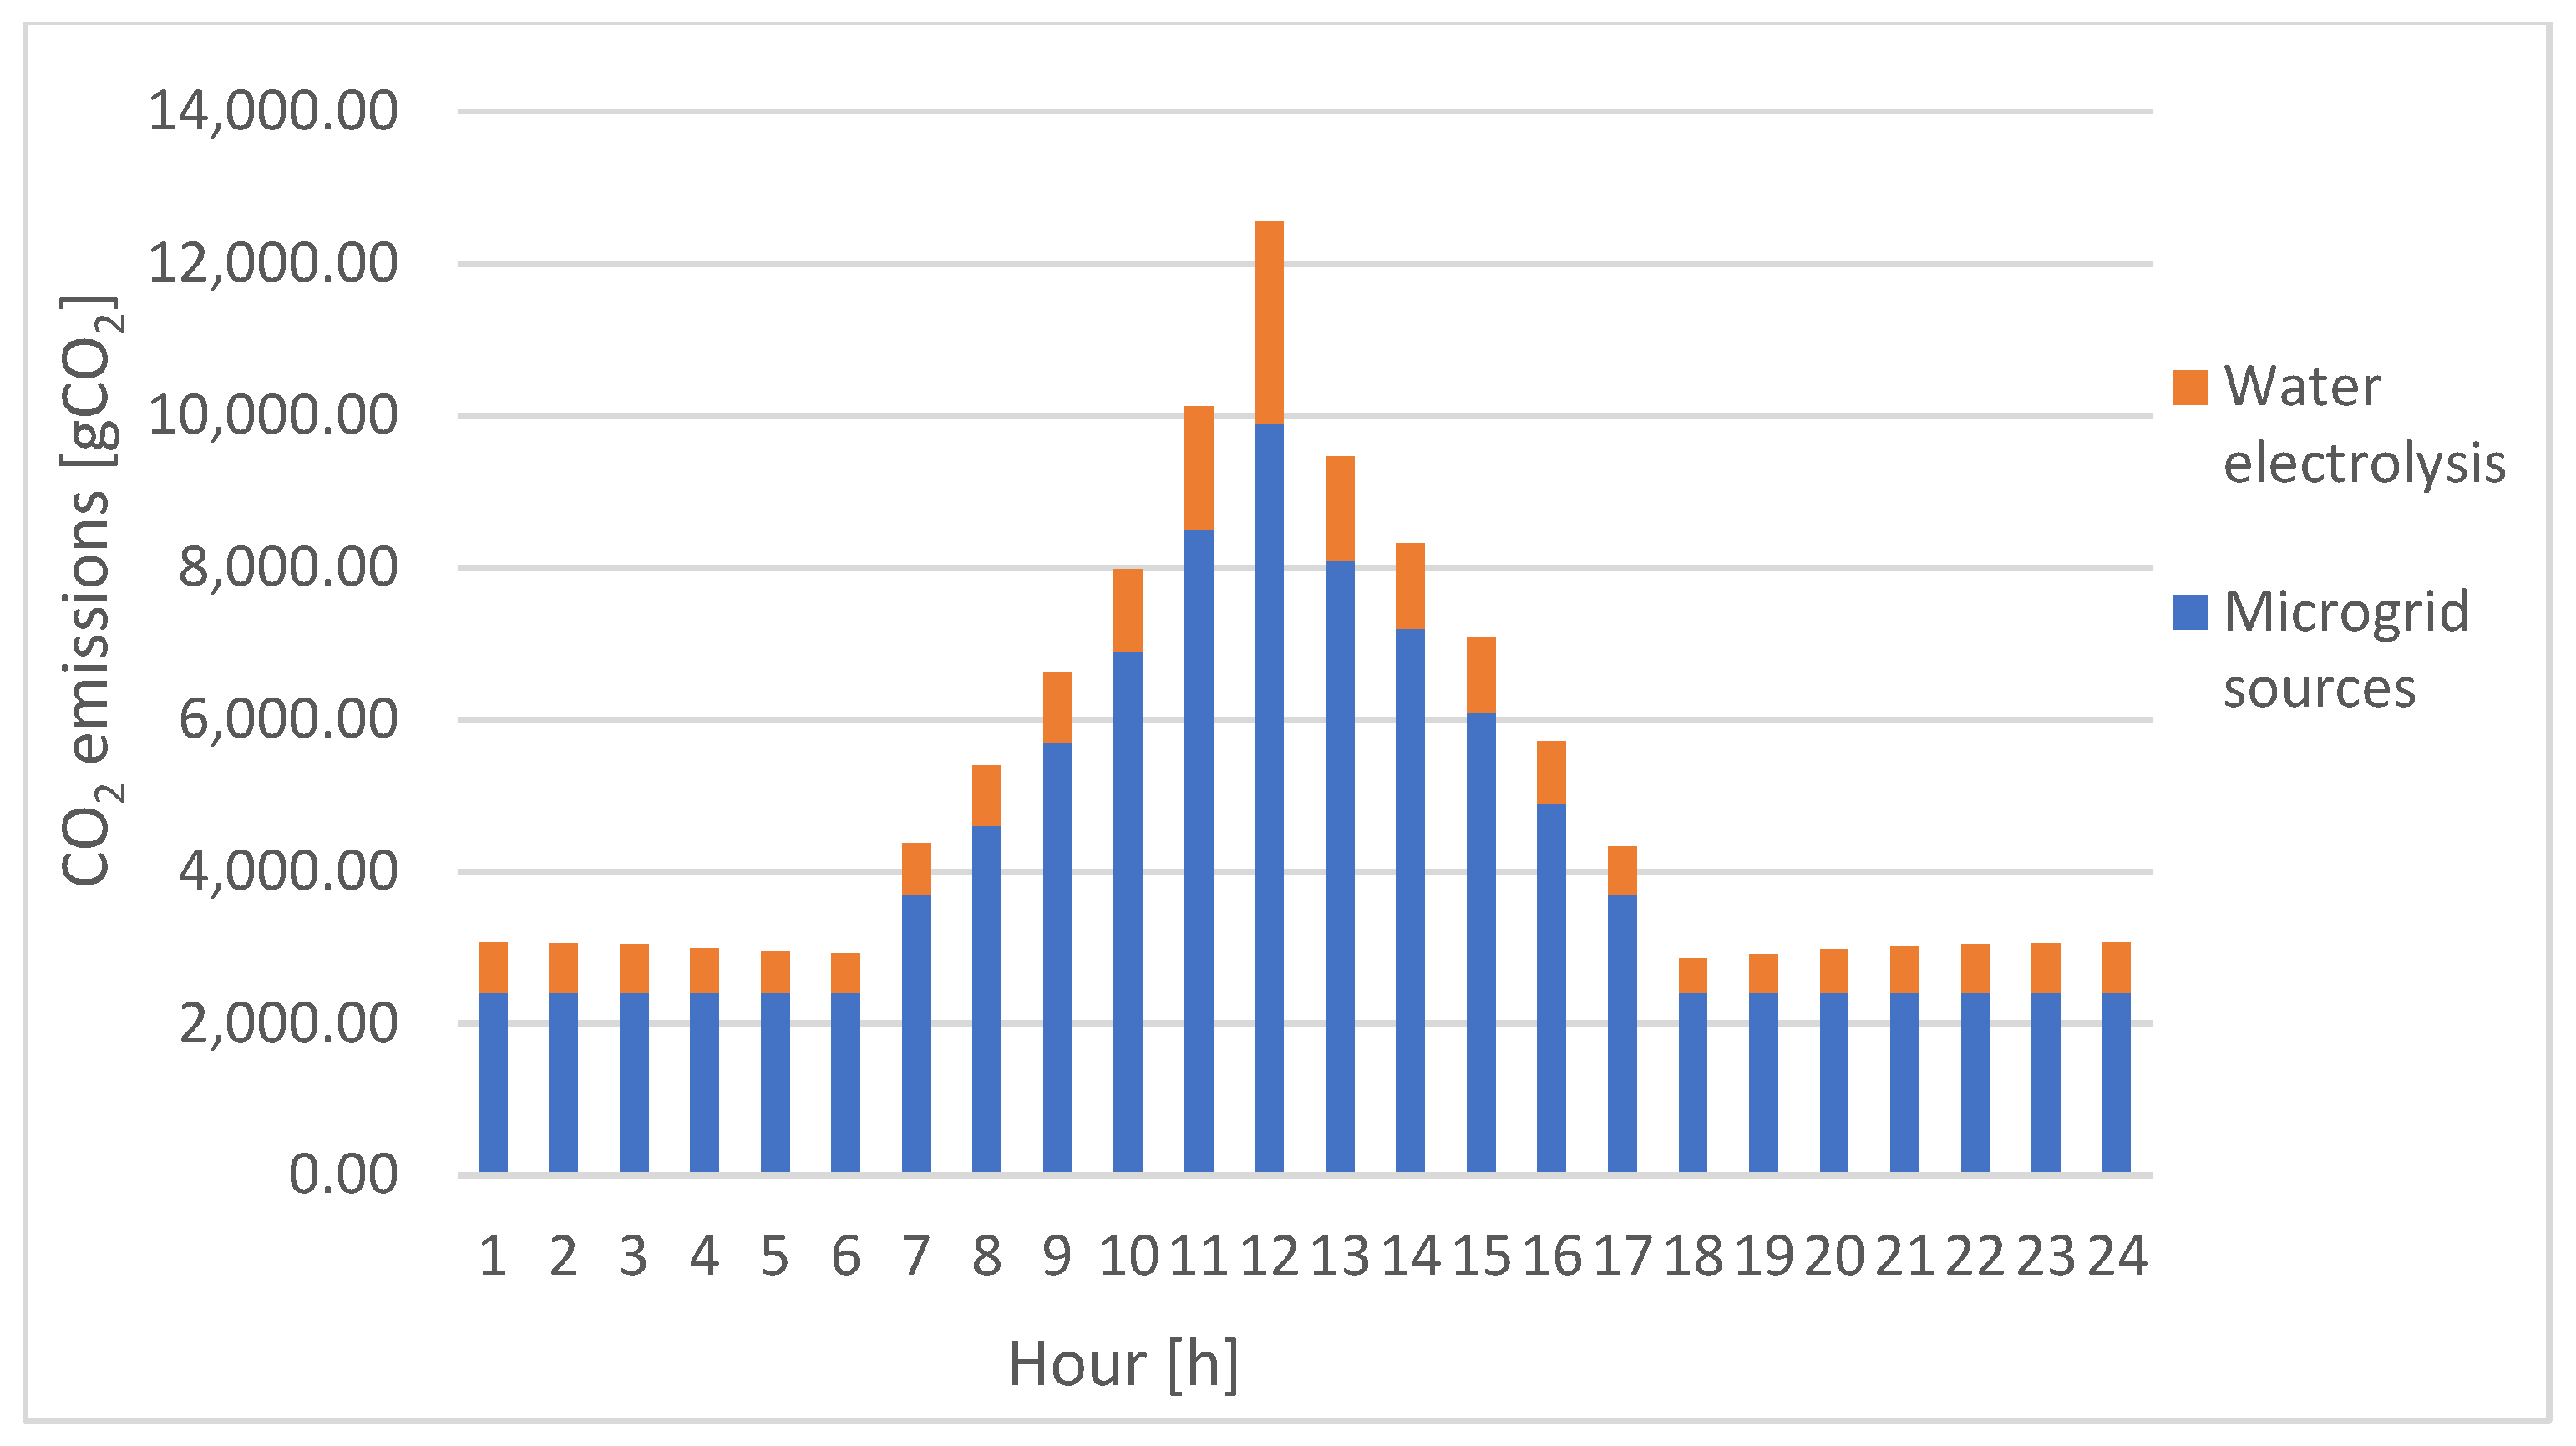
Figure 7.
CO2 emissions (summer).
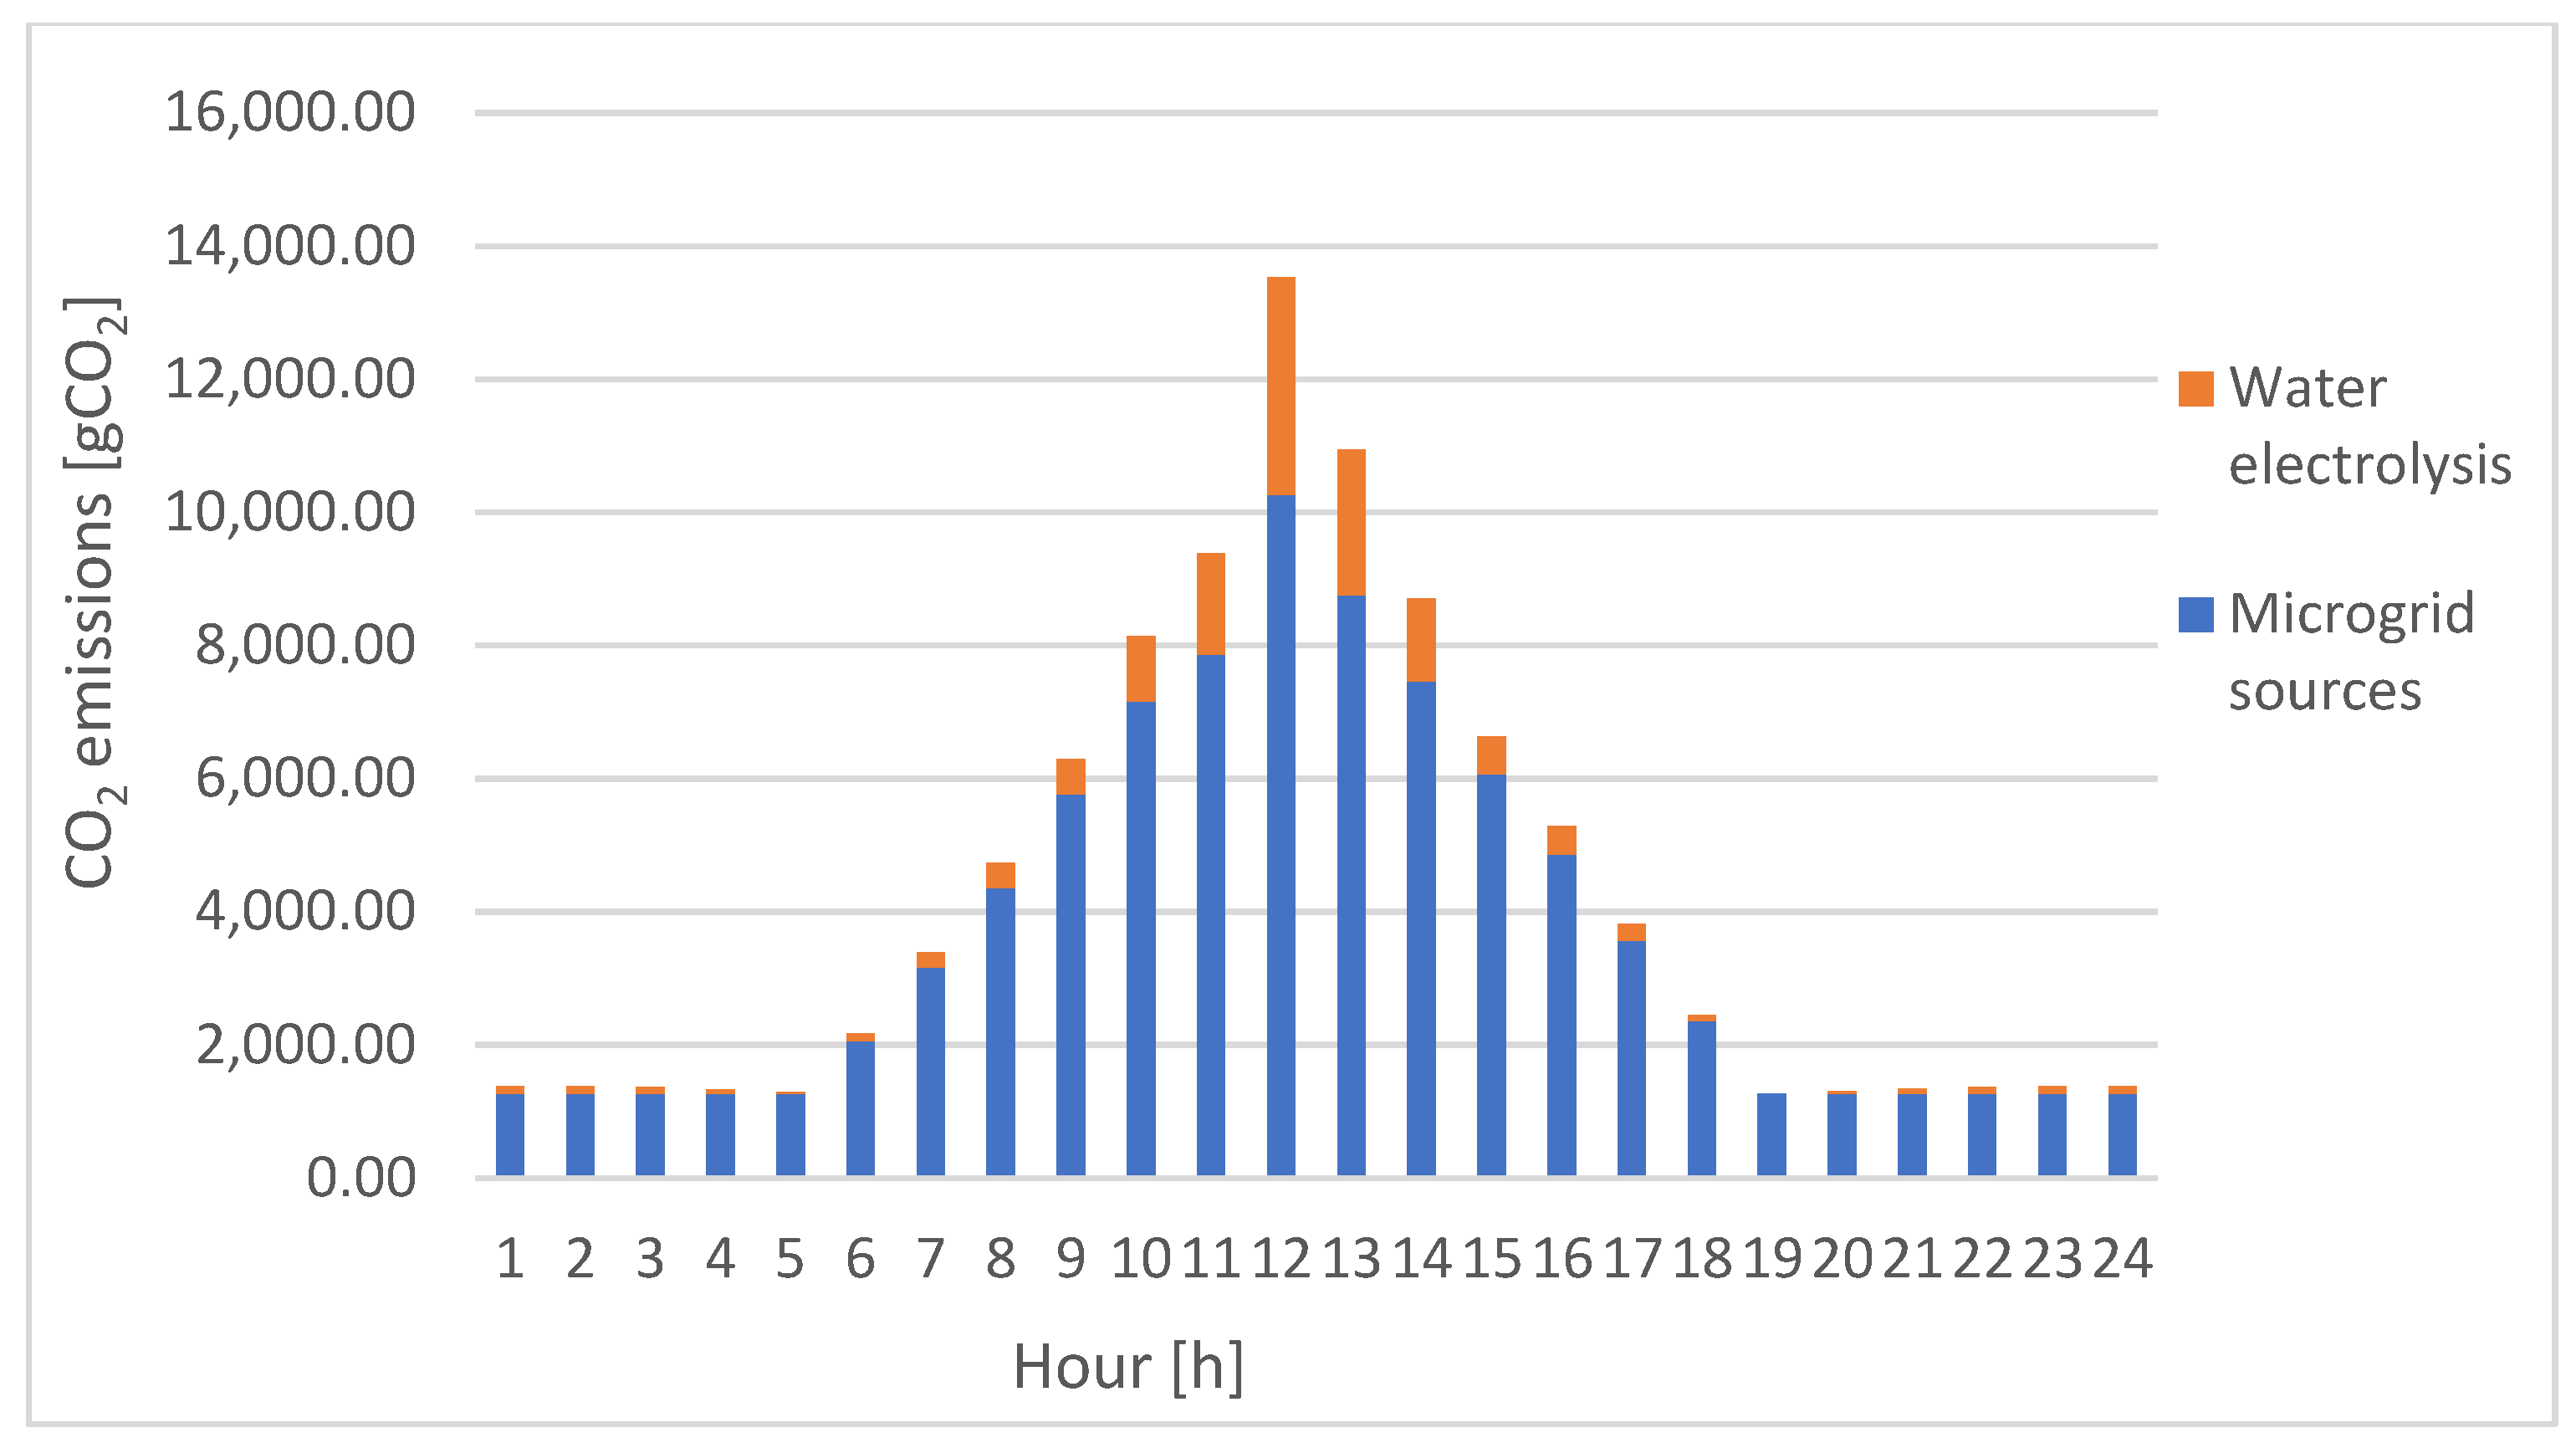
Figure 8.
CO2 emissions (autumn).
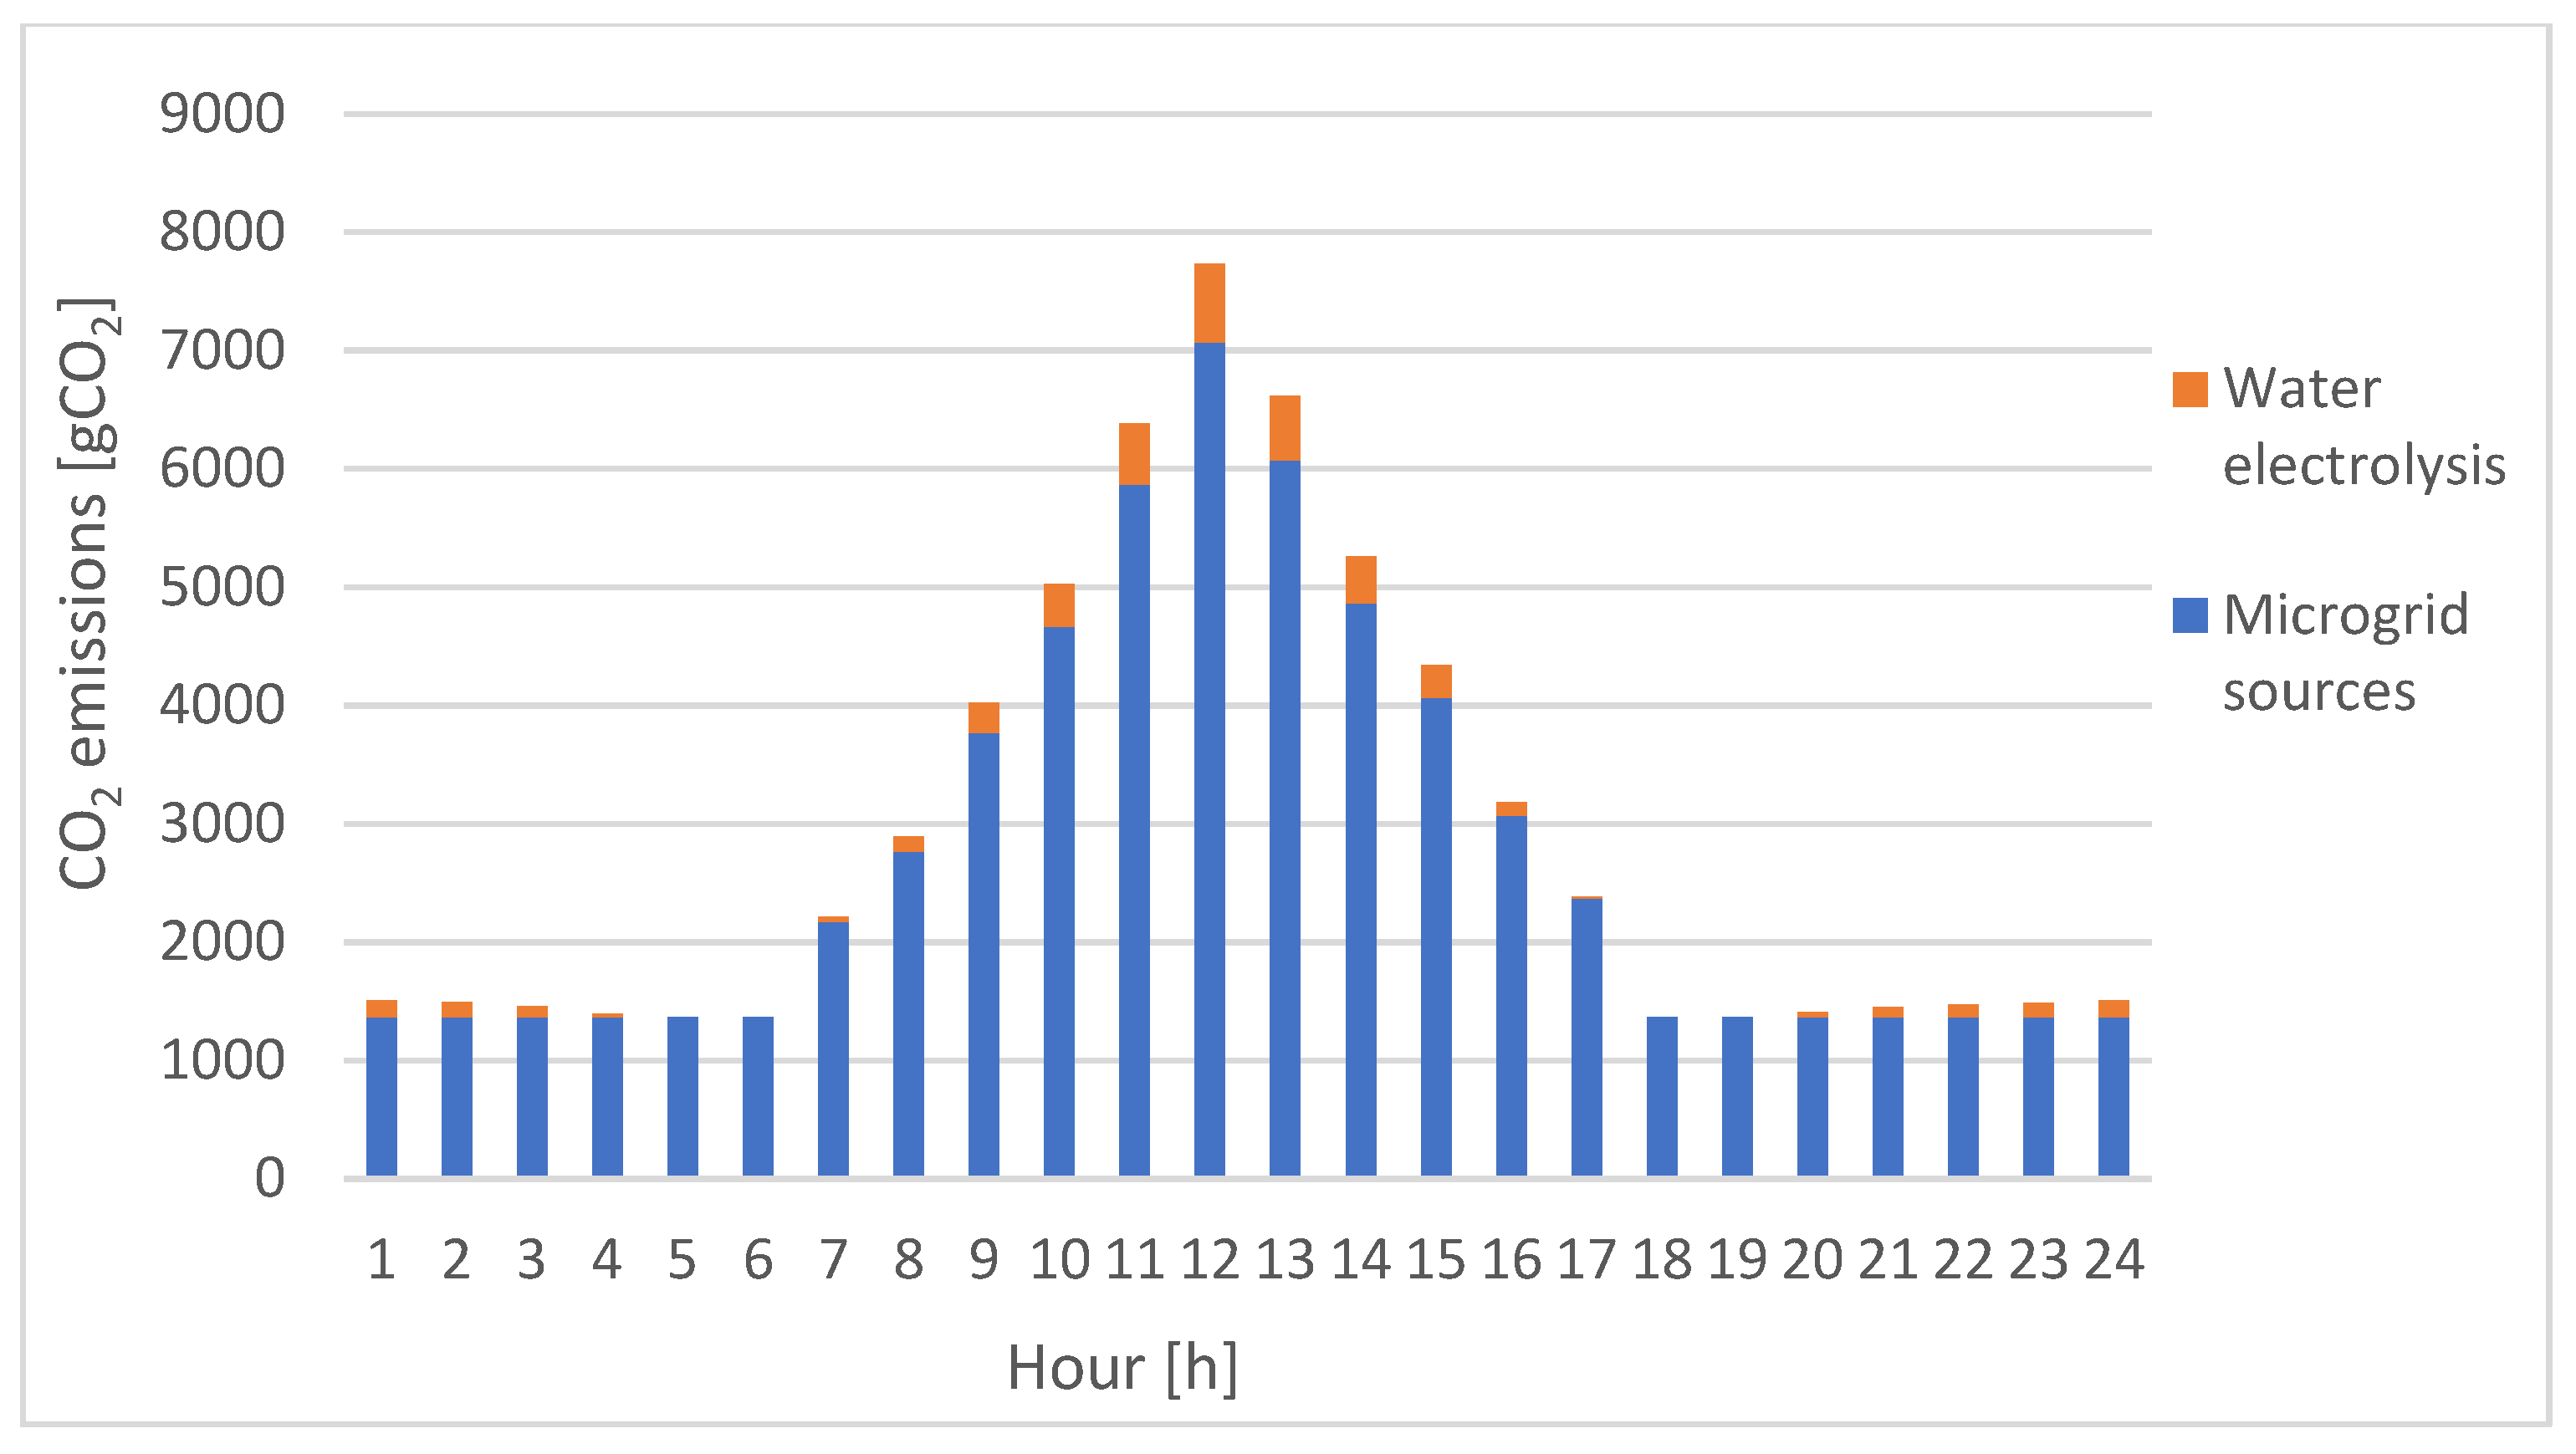
Figure 9.
CO2 emissions (winter).


Table 1.
Power demand of the microgrid loads.
| Hour (h) | Power Demand [kw] | |||
|---|---|---|---|---|
| Spring | Summer | Autumn | Winter | |
| 1 | 90.59 | 86.52 | 91.33 | 105.5 |
| 2 | 91.74 | 85.99 | 93.66 | 106.38 |
| 3 | 94.43 | 87.25 | 99.28 | 109.86 |
| 4 | 102.11 | 93.48 | 109.28 | 119.44 |
| 5 | 109.87 | 100.65 | 117.79 | 131.54 |
| 6 | 113.62 | 103.73 | 121.98 | 140.23 |
| 7 | 113.66 | 105.18 | 122.27 | 144.08 |
| 8 | 112.08 | 105.77 | 120.8 | 144.23 |
| 9 | 111.43 | 107.12 | 119.89 | 142.5 |
| 10 | 111.37 | 108.42 | 119.57 | 141.43 |
| 11 | 110.23 | 107.28 | 118.65 | 140.76 |
| 12 | 109.27 | 106.75 | 117.5 | 138.35 |
| 13 | 109.48 | 106.83 | 117.18 | 137.52 |
| 14 | 109.58 | 106.92 | 118.18 | 139.25 |
| 15 | 110.89 | 106.56 | 122.27 | 145.27 |
| 16 | 115 | 106.78 | 129.03 | 147.42 |
| 17 | 122.61 | 108.34 | 131.07 | 146.1 |
| 18 | 123.96 | 112.55 | 126.05 | 141.28 |
| 19 | 115.23 | 107.5 | 116.42 | 132.6 |
| 20 | 104.68 | 98.87 | 106.83 | 116.06 |
| 21 | 97.39 | 92.15 | 99.73 | 117.45 |
| 22 | 93.95 | 88.38 | 96.31 | 111.17 |
| 23 | 91.62 | 85.94 | 93.93 | 107.87 |
| 24 | 90.3 | 86.13 | 91.24 | 105.33 |
Table 2.
Power supplied (spring).
| Hour (h) | Power Supplied [kw] | ||||
|---|---|---|---|---|---|
| PV1 | MH1 | PV2 | MH2 | MH3 | |
| 1 | 0 | 50 | 0 | 70 | 80 |
| 2 | 0 | 50 | 0 | 70 | 80 |
| 3 | 0 | 50 | 0 | 70 | 80 |
| 4 | 0 | 50 | 0 | 70 | 80 |
| 5 | 0 | 50 | 0 | 70 | 80 |
| 6 | 0 | 50 | 0 | 70 | 80 |
| 7 | 14 | 50 | 12 | 70 | 80 |
| 8 | 24 | 50 | 20 | 70 | 80 |
| 9 | 36 | 50 | 30 | 70 | 80 |
| 10 | 50 | 50 | 40 | 70 | 80 |
| 11 | 70 | 50 | 52 | 70 | 80 |
| 12 | 84 | 50 | 66 | 70 | 80 |
| 13 | 66 | 50 | 48 | 70 | 80 |
| 14 | 56 | 50 | 40 | 70 | 80 |
| 15 | 42 | 50 | 32 | 70 | 80 |
| 16 | 28 | 50 | 22 | 70 | 80 |
| 17 | 16 | 50 | 10 | 70 | 80 |
| 18 | 0 | 50 | 0 | 70 | 80 |
| 19 | 0 | 50 | 0 | 70 | 80 |
| 20 | 0 | 50 | 0 | 70 | 80 |
| 21 | 0 | 50 | 0 | 70 | 80 |
| 22 | 0 | 50 | 0 | 70 | 80 |
| 23 | 0 | 50 | 0 | 70 | 80 |
| 24 | 0 | 50 | 0 | 70 | 80 |
Table 3.
Power supplied (summer).
| Hour (h) | Power Supplied [kw] | ||||
|---|---|---|---|---|---|
| PV1 | MH1 | PV2 | MH2 | MH3 | |
| 1 | 0 | 25 | 0 | 35 | 45 |
| 2 | 0 | 25 | 0 | 35 | 45 |
| 3 | 0 | 25 | 0 | 35 | 45 |
| 4 | 0 | 25 | 0 | 35 | 45 |
| 5 | 0 | 25 | 0 | 35 | 45 |
| 6 | 10 | 25 | 6 | 35 | 45 |
| 7 | 22 | 25 | 16 | 35 | 45 |
| 8 | 38 | 25 | 24 | 35 | 45 |
| 9 | 54 | 25 | 36 | 35 | 45 |
| 10 | 68 | 25 | 50 | 35 | 45 |
| 11 | 82 | 25 | 64 | 35 | 45 |
| 12 | 100 | 25 | 80 | 35 | 45 |
| 13 | 84 | 25 | 66 | 35 | 45 |
| 14 | 72 | 25 | 52 | 35 | 45 |
| 15 | 58 | 25 | 38 | 35 | 45 |
| 16 | 42 | 25 | 30 | 35 | 45 |
| 17 | 26 | 25 | 20 | 35 | 45 |
| 18 | 14 | 25 | 8 | 35 | 45 |
| 19 | 0 | 25 | 0 | 35 | 45 |
| 20 | 0 | 25 | 0 | 35 | 45 |
| 21 | 0 | 25 | 0 | 35 | 45 |
| 22 | 0 | 25 | 0 | 35 | 45 |
| 23 | 0 | 25 | 0 | 35 | 45 |
| 24 | 0 | 25 | 0 | 35 | 45 |
Table 4.
Power supplied (autumn).
| Hour (h) | Power Supplied [kw] | ||||
|---|---|---|---|---|---|
| PV1 | MH1 | PV2 | MH2 | MH3 | |
| 1 | 0 | 28 | 0 | 38 | 48 |
| 2 | 0 | 28 | 0 | 38 | 48 |
| 3 | 0 | 28 | 0 | 38 | 48 |
| 4 | 0 | 28 | 0 | 38 | 48 |
| 5 | 0 | 28 | 0 | 38 | 48 |
| 6 | 0 | 28 | 0 | 38 | 48 |
| 7 | 10 | 28 | 6 | 38 | 48 |
| 8 | 18 | 28 | 10 | 38 | 48 |
| 9 | 32 | 28 | 16 | 38 | 48 |
| 10 | 42 | 28 | 24 | 38 | 48 |
| 11 | 56 | 28 | 34 | 38 | 48 |
| 12 | 68 | 28 | 46 | 38 | 48 |
| 13 | 58 | 28 | 36 | 38 | 48 |
| 14 | 44 | 28 | 26 | 38 | 48 |
| 15 | 36 | 28 | 18 | 38 | 48 |
| 16 | 22 | 28 | 12 | 38 | 48 |
| 17 | 12 | 28 | 8 | 38 | 48 |
| 18 | 0 | 28 | 0 | 38 | 48 |
| 19 | 0 | 28 | 0 | 38 | 48 |
| 20 | 0 | 28 | 0 | 38 | 48 |
| 21 | 0 | 28 | 0 | 38 | 48 |
| 22 | 0 | 28 | 0 | 38 | 48 |
| 23 | 0 | 28 | 0 | 38 | 48 |
| 24 | 0 | 28 | 0 | 38 | 48 |
Table 5.
Power supplied (winter).
| Hour (h) | Power Supplied [kw] | ||||
|---|---|---|---|---|---|
| PV1 | MH1 | PV2 | MH2 | MH3 | |
| 1 | 0 | 30 | 0 | 40 | 50 |
| 2 | 0 | 30 | 0 | 40 | 50 |
| 3 | 0 | 30 | 0 | 40 | 50 |
| 4 | 0 | 30 | 0 | 40 | 50 |
| 5 | 0 | 30 | 0 | 40 | 50 |
| 6 | 0 | 30 | 0 | 40 | 50 |
| 7 | 0 | 30 | 0 | 40 | 50 |
| 8 | 10 | 30 | 6 | 40 | 50 |
| 9 | 24 | 30 | 14 | 40 | 50 |
| 10 | 32 | 30 | 22 | 40 | 50 |
| 11 | 42 | 30 | 28 | 40 | 50 |
| 12 | 50 | 30 | 34 | 40 | 50 |
| 13 | 38 | 30 | 30 | 40 | 50 |
| 14 | 26 | 30 | 24 | 40 | 50 |
| 15 | 16 | 30 | 12 | 40 | 50 |
| 16 | 0 | 30 | 0 | 40 | 50 |
| 17 | 0 | 30 | 0 | 40 | 50 |
| 18 | 0 | 30 | 0 | 40 | 50 |
| 19 | 0 | 30 | 0 | 40 | 50 |
| 20 | 0 | 30 | 0 | 40 | 50 |
| 21 | 0 | 30 | 0 | 40 | 50 |
| 22 | 0 | 30 | 0 | 40 | 50 |
| 23 | 0 | 30 | 0 | 40 | 50 |
| 24 | 0 | 30 | 0 | 40 | 50 |
| Source | gc (EUR/kWh) |
|---|---|
| PV 1 | 0.047 |
| PV 2 | 0.0473 |
| MH 1 | 0.0481 |
| MH 2 | 0.0478 |
| MH 3 | 0.0475 |
| Hydrogen fuel cell | 3.26 |
| Power grid | 0.08 |
Table 7.
CO2 emissions for the considered sources and for different hydrogen production methods [70,71,72,73,74,75,76].
| Power Plant Type | Carbon Dioxide Emissions |
|---|---|
| Hydro | 12 gCO2/kWh |
| Solar | 50 gCO2/kWh |
| Power grid | 203 gCO2/kWh |
| Hydro-powered electrolysis | 300 gCO2/kg |
| Solar-powered electrolysis | 1800 gCO2/kg |
| Steam reforming of natural gas | 9000 gCO2/kg |
Table 8.
Power supplied by the sources in order to cover the power demand (spring).
| Hour (h) | Power Supplied [kw] | ||||
|---|---|---|---|---|---|
| PV1 | MH1 | PV2 | MH2 | MH3 | |
| 1 | 0 | 0 | 0 | 10.59 | 80 |
| 2 | 0 | 0 | 0 | 11.74 | 80 |
| 3 | 0 | 0 | 0 | 14.43 | 80 |
| 4 | 0 | 0 | 0 | 22.11 | 80 |
| 5 | 0 | 0 | 0 | 29.87 | 80 |
| 6 | 0 | 0 | 0 | 33.62 | 80 |
| 7 | 14 | 0 | 12 | 7.66 | 80 |
| 8 | 24 | 0 | 20 | 0 | 68.08 |
| 9 | 36 | 0 | 30 | 0 | 45.43 |
| 10 | 50 | 0 | 40 | 0 | 21.37 |
| 11 | 70 | 0 | 40.23 | 0 | 0 |
| 12 | 84 | 0 | 25.27 | 0 | 0 |
| 13 | 66 | 0 | 43.48 | 0 | 0 |
| 14 | 56 | 0 | 40 | 0 | 13.58 |
| 15 | 42 | 0 | 32 | 0 | 36.89 |
| 16 | 28 | 0 | 22 | 0 | 65 |
| 17 | 16 | 0 | 10 | 16.61 | 80 |
| 18 | 0 | 0 | 0 | 43.96 | 80 |
| 19 | 0 | 0 | 0 | 35.23 | 80 |
| 20 | 0 | 0 | 0 | 24.68 | 80 |
| 21 | 0 | 0 | 0 | 17.39 | 80 |
| 22 | 0 | 0 | 0 | 13.95 | 80 |
| 23 | 0 | 0 | 0 | 11.62 | 80 |
| 24 | 0 | 0 | 0 | 10.3 | 80 |
Table 9.
Power supplied by the sources in order to cover the power demand (summer).
| Hour (h) | Power Supplied [kw] | ||||
|---|---|---|---|---|---|
| PV1 | MH1 | PV2 | MH2 | MH3 | |
| 1 | 0 | 6.52 | 0 | 35 | 45 |
| 2 | 0 | 5.99 | 0 | 35 | 45 |
| 3 | 0 | 7.25 | 0 | 35 | 45 |
| 4 | 0 | 13.48 | 0 | 35 | 45 |
| 5 | 0 | 20.65 | 0 | 35 | 45 |
| 6 | 10 | 7.73 | 6 | 35 | 45 |
| 7 | 22 | 0 | 16 | 22.18 | 45 |
| 8 | 38 | 0 | 24 | 0 | 43.77 |
| 9 | 54 | 0 | 36 | 0 | 17.12 |
| 10 | 68 | 0 | 40.42 | 0 | 0 |
| 11 | 82 | 0 | 25.28 | 0 | 0 |
| 12 | 100 | 0 | 6.75 | 0 | 0 |
| 13 | 84 | 0 | 22.83 | 0 | 0 |
| 14 | 72 | 0 | 34.92 | 0 | 0 |
| 15 | 58 | 0 | 38 | 0 | 10.56 |
| 16 | 42 | 0 | 30 | 0 | 34.78 |
| 17 | 26 | 0 | 20 | 17.34 | 45 |
| 18 | 14 | 10.55 | 8 | 35 | 45 |
| 19 | 0 | 25 | 0 | 35 | 45 |
| 20 | 0 | 18.87 | 0 | 35 | 45 |
| 21 | 0 | 12.15 | 0 | 35 | 45 |
| 22 | 0 | 8.38 | 0 | 35 | 45 |
| 23 | 0 | 5.94 | 0 | 35 | 45 |
| 24 | 0 | 6.13 | 0 | 35 | 45 |
Table 10.
Power supplied by the sources in order to cover the power demand (autumn).
| Hour (h) | Power Supplied [kw] | ||||
|---|---|---|---|---|---|
| PV1 | MH1 | PV2 | MH2 | MH3 | |
| 1 | 0 | 5.33 | 0 | 38 | 48 |
| 2 | 0 | 7.66 | 0 | 38 | 48 |
| 3 | 0 | 13.28 | 0 | 38 | 48 |
| 4 | 0 | 23.28 | 0 | 38 | 48 |
| 5 | 0 | 28 | 0 | 38 | 48 |
| 6 | 0 | 28 | 0 | 38 | 48 |
| 7 | 10 | 20.27 | 6 | 38 | 48 |
| 8 | 18 | 6.8 | 10 | 38 | 48 |
| 9 | 32 | 0 | 16 | 23.89 | 48 |
| 10 | 42 | 0 | 24 | 5.57 | 48 |
| 11 | 56 | 0 | 34 | 0 | 28.65 |
| 12 | 68 | 0 | 46 | 0 | 3.5 |
| 13 | 58 | 0 | 36 | 0 | 23.18 |
| 14 | 44 | 0 | 26 | 0.18 | 48 |
| 15 | 36 | 0 | 18 | 20.27 | 48 |
| 16 | 22 | 9.03 | 12 | 38 | 48 |
| 17 | 12 | 25.07 | 8 | 38 | 48 |
| 18 | 0 | 28 | 0 | 38 | 48 |
| 19 | 0 | 28 | 0 | 38 | 48 |
| 20 | 0 | 20.83 | 0 | 38 | 48 |
| 21 | 0 | 13.73 | 0 | 38 | 48 |
| 22 | 0 | 10.31 | 0 | 38 | 48 |
| 23 | 0 | 7.93 | 0 | 38 | 48 |
| 24 | 0 | 5.24 | 0 | 38 | 48 |
Table 11.
Power supplied by the sources in order to cover the power demand (winter).
| Hour (h) | Power Supplied [kw] | ||||
|---|---|---|---|---|---|
| PV1 | MH1 | PV2 | MH2 | MH3 | |
| 1 | 0 | 15.5 | 0 | 40 | 50 |
| 2 | 0 | 16.38 | 0 | 40 | 50 |
| 3 | 0 | 19.86 | 0 | 40 | 50 |
| 4 | 0 | 29.44 | 0 | 40 | 50 |
| 5 | 0 | 30 | 0 | 40 | 50 |
| 6 | 0 | 30 | 0 | 40 | 50 |
| 7 | 0 | 30 | 0 | 40 | 50 |
| 8 | 10 | 30 | 6 | 40 | 50 |
| 9 | 24 | 14.5 | 14 | 40 | 50 |
| 10 | 32 | 0 | 22 | 37.43 | 50 |
| 11 | 42 | 0 | 28 | 20.76 | 50 |
| 12 | 50 | 0 | 34 | 4.35 | 50 |
| 13 | 38 | 0 | 30 | 19.52 | 50 |
| 14 | 26 | 0 | 24 | 39.25 | 50 |
| 15 | 16 | 27.27 | 12 | 40 | 50 |
| 16 | 0 | 30 | 0 | 40 | 50 |
| 17 | 0 | 30 | 0 | 40 | 50 |
| 18 | 0 | 30 | 0 | 40 | 50 |
| 19 | 0 | 30 | 0 | 40 | 50 |
| 20 | 0 | 26.06 | 0 | 40 | 50 |
| 21 | 0 | 27.45 | 0 | 40 | 50 |
| 22 | 0 | 21.17 | 0 | 40 | 50 |
| 23 | 0 | 17.87 | 0 | 40 | 50 |
| 24 | 0 | 15.33 | 0 | 40 | 50 |
Table 12.
Power surplus (spring).
| Hour (h) | Power Surplus [kw] | |||
|---|---|---|---|---|
| MH1 | PV2 | MH2 | MH3 | |
| 1 | 50 | 0 | 59.41 | 0 |
| 2 | 50 | 0 | 58.26 | 0 |
| 3 | 50 | 0 | 55.57 | 0 |
| 4 | 50 | 0 | 47.89 | 0 |
| 5 | 50 | 0 | 40.13 | 0 |
| 6 | 50 | 0 | 36.38 | 0 |
| 7 | 50 | 0 | 62.34 | 0 |
| 8 | 50 | 0 | 70 | 11.92 |
| 9 | 50 | 0 | 70 | 34.57 |
| 10 | 50 | 0 | 70 | 58.63 |
| 11 | 50 | 11.77 | 70 | 80 |
| 12 | 50 | 40.73 | 70 | 80 |
| 13 | 50 | 4.52 | 70 | 80 |
| 14 | 50 | 0 | 70 | 66.42 |
| 15 | 50 | 0 | 70 | 43.11 |
| 16 | 50 | 0 | 70 | 15 |
| 17 | 50 | 0 | 53.39 | 0 |
| 18 | 50 | 0 | 26.04 | 0 |
| 19 | 50 | 0 | 34.77 | 0 |
| 20 | 50 | 0 | 45.32 | 0 |
| 21 | 50 | 0 | 52.61 | 0 |
| 22 | 50 | 0 | 56.05 | 0 |
| 23 | 50 | 0 | 58.38 | 0 |
| 24 | 50 | 0 | 59.7 | 0 |
Table 13.
Power surplus (summer).
| Hour (h) | Power Surplus [kw] | |||
|---|---|---|---|---|
| MH1 | PV2 | MH2 | MH3 | |
| 1 | 18.48 | 0 | 0 | 0 |
| 2 | 19.01 | 0 | 0 | 0 |
| 3 | 17.75 | 0 | 0 | 0 |
| 4 | 11.52 | 0 | 0 | 0 |
| 5 | 4.35 | 0 | 0 | 0 |
| 6 | 17.27 | 0 | 0 | 0 |
| 7 | 25 | 0 | 12.82 | 0 |
| 8 | 25 | 0 | 35 | 1.23 |
| 9 | 25 | 0 | 35 | 27.88 |
| 10 | 25 | 9.58 | 35 | 45 |
| 11 | 25 | 24.72 | 35 | 45 |
| 12 | 25 | 73.25 | 35 | 45 |
| 13 | 25 | 43.17 | 35 | 45 |
| 14 | 25 | 17.08 | 35 | 45 |
| 15 | 25 | 0 | 35 | 34.44 |
| 16 | 25 | 0 | 35 | 10.22 |
| 17 | 25 | 0 | 17.66 | 0 |
| 18 | 14.45 | 0 | 0 | 0 |
| 19 | 0 | 0 | 0 | 0 |
| 20 | 6.13 | 0 | 0 | 0 |
| 21 | 12.85 | 0 | 0 | 0 |
| 22 | 16.62 | 0 | 0 | 0 |
| 23 | 19.06 | 0 | 0 | 0 |
| 24 | 18.87 | 0 | 0 | 0 |
Table 14.
Power surplus (autumn).
| Hour (h) | Power Surplus [kw] | ||
|---|---|---|---|
| MH1 | MH2 | MH3 | |
| 1 | 22.67 | 0 | 0 |
| 2 | 20.34 | 0 | 0 |
| 3 | 14.72 | 0 | 0 |
| 4 | 4.72 | 0 | 0 |
| 5 | 0 | 0 | 0 |
| 6 | 0 | 0 | 0 |
| 7 | 7.73 | 0 | 0 |
| 8 | 21.2 | 0 | 0 |
| 9 | 28 | 14.11 | 0 |
| 10 | 28 | 32.43 | 0 |
| 11 | 28 | 38 | 19.35 |
| 12 | 28 | 38 | 44.5 |
| 13 | 28 | 38 | 24.82 |
| 14 | 28 | 37.82 | 0 |
| 15 | 28 | 17.73 | 0 |
| 16 | 18.97 | 0 | 0 |
| 17 | 2.93 | 0 | 0 |
| 18 | 0 | 0 | 0 |
| 19 | 0 | 0 | 0 |
| 20 | 7.17 | 0 | 0 |
| 21 | 14.27 | 0 | 0 |
| 22 | 17.69 | 0 | 0 |
| 23 | 20.07 | 0 | 0 |
| 24 | 22.76 | 0 | 0 |
Table 15.
Power surplus (winter).
| Hour (h) | Power Surplus [kw] | |
|---|---|---|
| MH1 | MH2 | |
| 1 | 14.5 | 0 |
| 2 | 13.62 | 0 |
| 3 | 10.14 | 0 |
| 4 | 0.56 | 0 |
| 5 | 0 | 0 |
| 6 | 0 | 0 |
| 7 | 0 | 0 |
| 8 | 0 | 0 |
| 9 | 15.5 | 0 |
| 10 | 30 | 2.57 |
| 11 | 30 | 19.24 |
| 12 | 30 | 35.65 |
| 13 | 30 | 20.48 |
| 14 | 30 | 0.75 |
| 15 | 2.73 | 0 |
| 16 | 0 | 0 |
| 17 | 0 | 0 |
| 18 | 0 | 0 |
| 19 | 0 | 0 |
| 20 | 3.94 | 0 |
| 21 | 2.55 | 0 |
| 22 | 8.83 | 0 |
| 23 | 12.13 | 0 |
| 24 | 14.67 | 0 |
Table 16.
Hydrogen production due to power surplus.
| Hour (h) | Hydrogen Produced (Spring) (kg) | Hydrogen Produced (Summer) (kg) | Hydrogen Produced (Autumn) (kg) | Hydrogen Produced (Winter) (kg) |
|---|---|---|---|---|
| 1 | 2.1882 | 0.3696 | 0.4534 | 0.29 |
| 2 | 2.1652 | 0.3802 | 0.4068 | 0.2724 |
| 3 | 2.1114 | 0.355 | 0.2944 | 0.2028 |
| 4 | 1.9578 | 0.2304 | 0.0944 | 0.0112 |
| 5 | 1.8026 | 0.087 | 0 | 0 |
| 6 | 1.7276 | 0.3454 | 0 | 0 |
| 7 | 2.2468 | 0.7564 | 0.1546 | 0 |
| 8 | 2.6384 | 1.2246 | 0.424 | 0 |
| 9 | 3.0914 | 1.7576 | 0.8422 | 0.31 |
| 10 | 3.5726 | 2.2916 | 1.2086 | 0.6514 |
| 11 | 4.2354 | 2.5944 | 1.707 | 0.9848 |
| 12 | 4.8146 | 3.565 | 2.21 | 1.313 |
| 13 | 4.0904 | 2.9634 | 1.8164 | 1.0096 |
| 14 | 3.7284 | 2.4416 | 1.3164 | 0.615 |
| 15 | 3.2622 | 1.8888 | 0.9146 | 0.0546 |
| 16 | 2.7 | 1.4044 | 0.3794 | 0 |
| 17 | 2.0678 | 0.8532 | 0.0586 | 0 |
| 18 | 1.5208 | 0.289 | 0 | 0 |
| 19 | 1.6954 | 0 | 0 | 0 |
| 20 | 1.9064 | 0.1226 | 0.1434 | 0.0788 |
| 21 | 2.0522 | 0.257 | 0.2854 | 0.051 |
| 22 | 2.121 | 0.3324 | 0.3538 | 0.1766 |
| 23 | 2.1676 | 0.3812 | 0.4014 | 0.2426 |
| 24 | 2.194 | 0.3774 | 0.4552 | 0.2934 |
Table 17.
Power cost (spring).
| Hour (h) | Power Cost [EUR] | |
|---|---|---|
| Microgrid Sources | Power to H2 | |
| 1 | 9.551 | 10.941 |
| 2 | 9.551 | 10.826 |
| 3 | 9.551 | 10.557 |
| 4 | 9.551 | 9.789 |
| 5 | 9.551 | 9.013 |
| 6 | 9.551 | 8.638 |
| 7 | 10.7766 | 11.234 |
| 8 | 11.625 | 13.192 |
| 9 | 12.662 | 15.457 |
| 10 | 13.793 | 17.863 |
| 11 | 15.3006 | 21.177 |
| 12 | 16.6208 | 24.073 |
| 13 | 14.9234 | 20.452 |
| 14 | 14.075 | 18.642 |
| 15 | 13.0386 | 16.311 |
| 16 | 11.9076 | 13.5 |
| 17 | 10.776 | 10.339 |
| 18 | 9.551 | 7.604 |
| 19 | 9.551 | 8.477 |
| 20 | 9.551 | 9.532 |
| 21 | 9.551 | 10.261 |
| 22 | 9.551 | 10.605 |
| 23 | 9.551 | 10.838 |
| 24 | 9.551 | 10.97 |
Table 18.
Power cost (summer).
| Hour (h) | Power Cost [EUR] | ||
|---|---|---|---|
| Microgrid Sources | Power to H2 | Fuel Cell | |
| 1 | 5.013 | 1.848 | 0 |
| 2 | 5.013 | 1.901 | 0 |
| 3 | 5.013 | 1.775 | 0 |
| 4 | 5.013 | 1.152 | 0 |
| 5 | 5.013 | 0.435 | 0 |
| 6 | 5.7668 | 1.727 | 0 |
| 7 | 6.8038 | 3.782 | 0 |
| 8 | 7.9342 | 6.123 | 0 |
| 9 | 9.2538 | 8.788 | 0 |
| 10 | 10.574 | 11.458 | 0 |
| 11 | 11.232 | 12.972 | 0 |
| 12 | 13.497 | 17.825 | 0 |
| 13 | 12.0828 | 14.817 | 0 |
| 14 | 10.8566 | 12.208 | 0 |
| 15 | 9.5364 | 9.444 | 0 |
| 16 | 8.406 | 7.022 | 0 |
| 17 | 7.181 | 4.266 | 0 |
| 18 | 6.0494 | 1.445 | 0 |
| 19 | 5.013 | 0 | 0.24776 |
| 20 | 5.013 | 0.613 | 0 |
| 21 | 5.013 | 1.285 | 0 |
| 22 | 5.013 | 1.662 | 0 |
| 23 | 5.013 | 1.906 | 0 |
| 24 | 5.013 | 1.887 | 0 |
Table 19.
Power cost (autumn).
| Hour (h) | Power Cost [EUR] | ||
|---|---|---|---|
| Microgrid Sources | Power to H2 | Fuel Cell | |
| 1 | 5.4432 | 2.267 | 0 |
| 2 | 5.4432 | 2.034 | 0 |
| 3 | 5.4432 | 1.472 | 0 |
| 4 | 5.4432 | 0.472 | 0 |
| 5 | 5.4432 | 0 | 0.374574 |
| 6 | 5.4432 | 0 | 0.788594 |
| 7 | 6.197 | 0.773 | 0 |
| 8 | 6.7622 | 2.12 | 0 |
| 9 | 7.704 | 4.211 | 0 |
| 10 | 8.5524 | 6.043 | 0 |
| 11 | 9.6834 | 8.535 | 0 |
| 12 | 10.815 | 11.05 | 0 |
| 13 | 9.872 | 9.082 | 0 |
| 14 | 8.741 | 6.582 | 0 |
| 15 | 7.9866 | 4.573 | 0 |
| 16 | 7.0448 | 1.897 | 0 |
| 17 | 6.3856 | 0.293 | 0 |
| 18 | 5.4432 | 0 | 1.234888 |
| 19 | 5.4432 | 0 | 0.239284 |
| 20 | 5.4432 | 0.717 | 0 |
| 21 | 5.4432 | 1.427 | 0 |
| 22 | 5.4432 | 1.769 | 0 |
| 23 | 5.4432 | 2.007 | 0 |
| 24 | 5.4432 | 2.276 | 0 |
Table 20.
Power cost (winter).
| Hour (h) | Power Cost [EUR] | |||
|---|---|---|---|---|
| Microgrid Sources | Power to H2 | Fuel Cell | Power Grid | |
| 1 | 5.73 | 1.45 | 0 | 0 |
| 2 | 5.73 | 1.362 | 0 | 0 |
| 3 | 5.73 | 1.014 | 0 | 0 |
| 4 | 5.73 | 0.056 | 0 | 0 |
| 5 | 5.73 | 0 | 1.140022 | 0 |
| 6 | 5.73 | 0 | 1.391042 | 0.492 |
| 7 | 5.73 | 0 | 0 | 1.9264 |
| 8 | 6.4838 | 0 | 0 | 0.6584 |
| 9 | 7.5202 | 1.55 | 0 | 0 |
| 10 | 8.2746 | 3.257 | 0 | 0 |
| 11 | 9.0284 | 4.924 | 0 | 0 |
| 12 | 9.6882 | 6.565 | 0 | 0 |
| 13 | 8.935 | 5.048 | 0 | 0 |
| 14 | 8.0872 | 3.075 | 0 | 0 |
| 15 | 7.0496 | 0.273 | 0 | 0 |
| 16 | 5.73 | 0 | 2.70906 | 0 |
| 17 | 5.73 | 0 | 2.57866 | 0 |
| 18 | 5.73 | 0 | 2.102374 | 0 |
| 19 | 5.73 | 0 | 1.244994 | 0 |
| 20 | 5.73 | 0.394 | 0 | 0 |
| 21 | 5.73 | 0.255 | 0 | 0 |
| 22 | 5.73 | 0.883 | 0 | 0 |
| 23 | 5.73 | 1.213 | 0 | 0 |
| 24 | 5.73 | 1.467 | 0 | 0 |
Table 21.
CO2 emissions (spring).
| Hour (h) | CO2 Emissions [gCO2] | |
|---|---|---|
| Microgrid Sources | Water Electrolysis | |
| 1 | 2400 | 656.46 |
| 2 | 2400 | 649.56 |
| 3 | 2400 | 633.42 |
| 4 | 2400 | 587.34 |
| 5 | 2400 | 540.78 |
| 6 | 2400 | 518.28 |
| 7 | 3700 | 674.04 |
| 8 | 4600 | 791.52 |
| 9 | 5700 | 927.42 |
| 10 | 6900 | 1071.78 |
| 11 | 8500 | 1623.72 |
| 12 | 9900 | 2666.28 |
| 13 | 8100 | 1362.72 |
| 14 | 7200 | 1118.52 |
| 15 | 6100 | 978.66 |
| 16 | 4900 | 810 |
| 17 | 3700 | 620.34 |
| 18 | 2400 | 456.24 |
| 19 | 2400 | 508.62 |
| 20 | 2400 | 571.92 |
| 21 | 2400 | 615.66 |
| 22 | 2400 | 636.3 |
| 23 | 2400 | 650.28 |
| 24 | 2400 | 658.2 |
Table 22.
CO2 emissions (summer).
| Hour (h) | CO2 Emissions [gCO2] | |
|---|---|---|
| Microgrid Sources | Water Electrolysis | |
| 1 | 1260 | 110.88 |
| 2 | 1260 | 114.06 |
| 3 | 1260 | 106.5 |
| 4 | 1260 | 69.12 |
| 5 | 1260 | 26.1 |
| 6 | 2060 | 103.62 |
| 7 | 3160 | 226.92 |
| 8 | 4360 | 367.38 |
| 9 | 5760 | 527.28 |
| 10 | 7160 | 974.88 |
| 11 | 7860 | 1519.92 |
| 12 | 10,260 | 3267 |
| 13 | 8760 | 2184.12 |
| 14 | 7460 | 1244.88 |
| 15 | 6060 | 566.64 |
| 16 | 4860 | 421.32 |
| 17 | 3560 | 255.96 |
| 18 | 2360 | 86.7 |
| 19 | 1260 | 0 |
| 20 | 1260 | 36.78 |
| 21 | 1260 | 77.1 |
| 22 | 1260 | 99.72 |
| 23 | 1260 | 114.36 |
| 24 | 1260 | 113.22 |
Table 23.
CO2 emissions (autumn).
| Hour (h) | CO2 Emissions [gCO2] | |
|---|---|---|
| Microgrid Sources | Water Electrolysis | |
| 1 | 1368 | 136.02 |
| 2 | 1368 | 122.04 |
| 3 | 1368 | 88.32 |
| 4 | 1368 | 28.32 |
| 5 | 1368 | 0 |
| 6 | 1368 | 0 |
| 7 | 2168 | 46.38 |
| 8 | 2768 | 127.2 |
| 9 | 3768 | 252.66 |
| 10 | 4668 | 362.58 |
| 11 | 5868 | 512.1 |
| 12 | 7068 | 663 |
| 13 | 6068 | 544.92 |
| 14 | 4868 | 394.92 |
| 15 | 4068 | 274.38 |
| 16 | 3068 | 113.82 |
| 17 | 2368 | 17.58 |
| 18 | 1368 | 0 |
| 19 | 1368 | 0 |
| 20 | 1368 | 43.02 |
| 21 | 1368 | 85.62 |
| 22 | 1368 | 106.14 |
| 23 | 1368 | 120.42 |
| 24 | 1368 | 136.56 |
Table 24.
CO2 emissions (winter).
| Hour (h) | CO2 Emissions [gCO2] | ||
|---|---|---|---|
| Microgrid Sources | Water Electrolysis | Power Grid | |
| 1 | 1440 | 87 | 0 |
| 2 | 1440 | 81.72 | 0 |
| 3 | 1440 | 60.84 | 0 |
| 4 | 1440 | 3.36 | 0 |
| 5 | 1440 | 0 | 0 |
| 6 | 1440 | 0 | 1248.45 |
| 7 | 1440 | 0 | 4888.24 |
| 8 | 2240 | 0 | 1670.69 |
| 9 | 3340 | 93 | 0 |
| 10 | 4140 | 195.42 | 0 |
| 11 | 4940 | 295.44 | 0 |
| 12 | 5640 | 393.9 | 0 |
| 13 | 4840 | 302.88 | 0 |
| 14 | 3940 | 184.5 | 0 |
| 15 | 2840 | 16.38 | 0 |
| 16 | 1440 | 0 | 0 |
| 17 | 1440 | 0 | 0 |
| 18 | 1440 | 0 | 0 |
| 19 | 1440 | 0 | 0 |
| 20 | 1440 | 23.64 | 0 |
| 21 | 1440 | 15.3 | 0 |
| 22 | 1440 | 52.98 | 0 |
| 23 | 1440 | 72.78 | 0 |
| 24 | 1440 | 88.02 | 0 |
Disclaimer/Publisher’s Note: The statements, opinions and data contained in all publications are solely those of the individual author(s) and contributor(s) and not of MDPI and/or the editor(s). MDPI and/or the editor(s) disclaim responsibility for any injury to people or property resulting from any ideas, methods, instructions or products referred to in the content. |
© 2023 by the author. Licensee MDPI, Basel, Switzerland. This article is an open access article distributed under the terms and conditions of the Creative Commons Attribution (CC BY) license (https://creativecommons.org/licenses/by/4.0/).
Share and Cite
MDPI and ACS Style
Dulău, L.-I. Power Cost and CO2 Emissions for a Microgrid with Hydrogen Storage and Electric Vehicles. Sustainability 2023, 15, 15750. https://doi.org/10.3390/su152215750
AMA Style
Dulău L-I. Power Cost and CO2 Emissions for a Microgrid with Hydrogen Storage and Electric Vehicles. Sustainability. 2023; 15(22):15750. https://doi.org/10.3390/su152215750
Chicago/Turabian StyleDulău, Lucian-Ioan. 2023. "Power Cost and CO2 Emissions for a Microgrid with Hydrogen Storage and Electric Vehicles" Sustainability 15, no. 22: 15750. https://doi.org/10.3390/su152215750
Note that from the first issue of 2016, this journal uses article numbers instead of page numbers. See further details here.