
The Relationship between Residential Block Forms and Building Carbon Emissions to Achieve Carbon Neutrality Goals: A Case Study of Wuhan, China

Abstract
:1. Introduction
1.1. Background
- (1)
- Building a green, low-carbon, and circular economic system for the new era: China has made systematic developments for a green, low-carbon, and circular economic system, promoting comprehensive coverage in the areas of production, distribution, and consumption, accelerating the greening of agriculture and industry, developing green industries, and building green supply chains.
- (2)
- Enhancing energy-use efficiency: Optimizing and adjusting China’s industrial structure are its fundamental approach to improve its energy-use efficiency, strengthen the refined management of enterprises, accelerate the construction of a modern industrial system, and obtain the highest economic and social benefits while minimizing the toll on resources and the environment, which will result in an all-around improvement in the efficiency of resource use.
- (3)
- Increasing the proportion of non-fossil energy consumption: In order to reduce its proportion of fossil energy consumption, China has begun to vigorously develop new types of energy, increase the proportion of renewable energy it uses, promote the development of wind power and photovoltaic power generation, and develop hydroelectric energy, geothermal energy, ocean energy, hydrogen energy, biomass energy, and photothermal power generation tailored to regional conditions.
- (4)
- Reducing its levels of carbon dioxide emissions: China is currently accelerating the promotion of a comprehensive green transformation of industrial development, integrating the requirements of the carbon peak and carbon neutrality targets into the entire process of economic and social development and within all areas. It is vigorously promoting energy conservation and emissions reduction, comprehensively implementing cleaner production, accelerating the development of the recycling economy, strengthening the comprehensive use of resources, and continuously upgrading its levels of green, low-carbon, and recycling development.
- (5)
- Enhancing the carbon sink capacity of ecosystems: For China to achieve its goals for the carbon peak and carbon neutrality on schedule, an important aspect will be to enhance the capacity of ecological carbon sinks, strengthen land use spatial planning and use regulation, and effectively bring into play the carbon sequestration functions of forests, grasslands, wetlands, oceans, soils, and permafrost so as to enhance the incremental amounts of ecosystem carbon sinks [6].
1.2. Literature Review
1.2.1. Building Carbon Emissions (CEs) Assessments
1.2.2. The Influence of Urban Form on Building CEs
1.2.3. Research Gap
1.3. Research Objectives and Questions
- How much do the building CEI levels in different residential blocks vary?
- Which residential block form parameters have impacts on the buildings’ CEI? Which ones do not matter? What is the most significant form parameter affecting the buildings’ CEI?
- What are the combined parameters that most significantly affect the buildings’ CEI?
2. Materials
2.1. The Framework
2.2. Case Selection and Classification
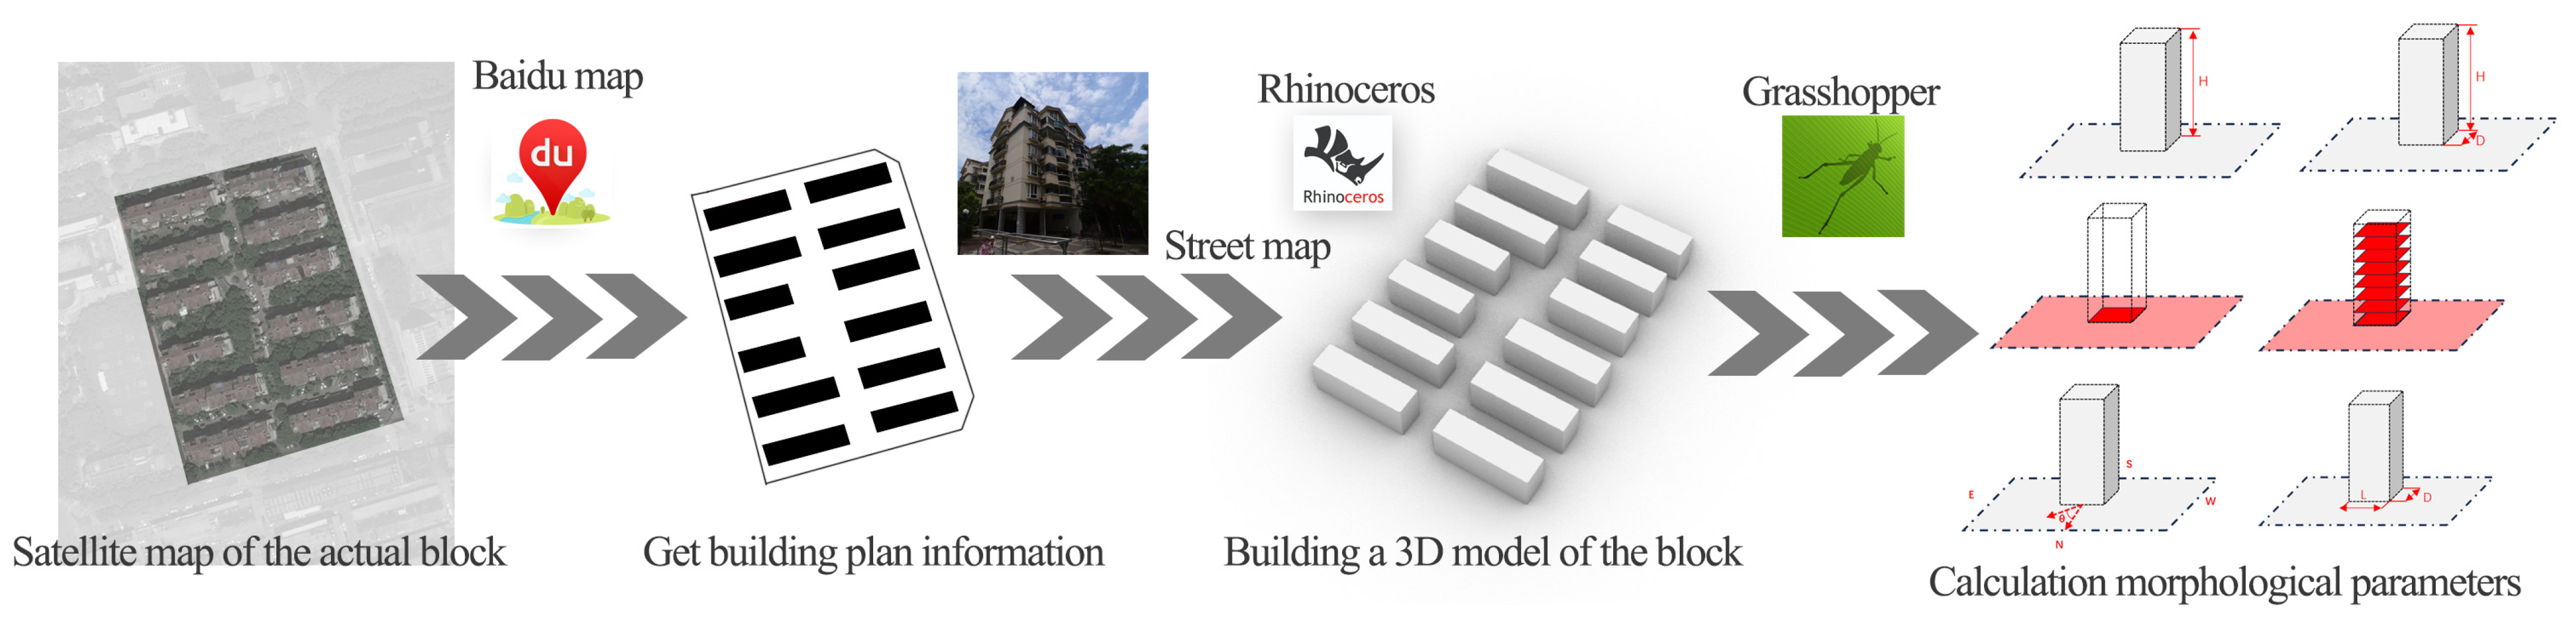
2.3. Urban Block form Parameter Calculation
2.4. Building CE Calculation Method and Simulation Tool
2.4.1. Calculation Method for the Building CEs
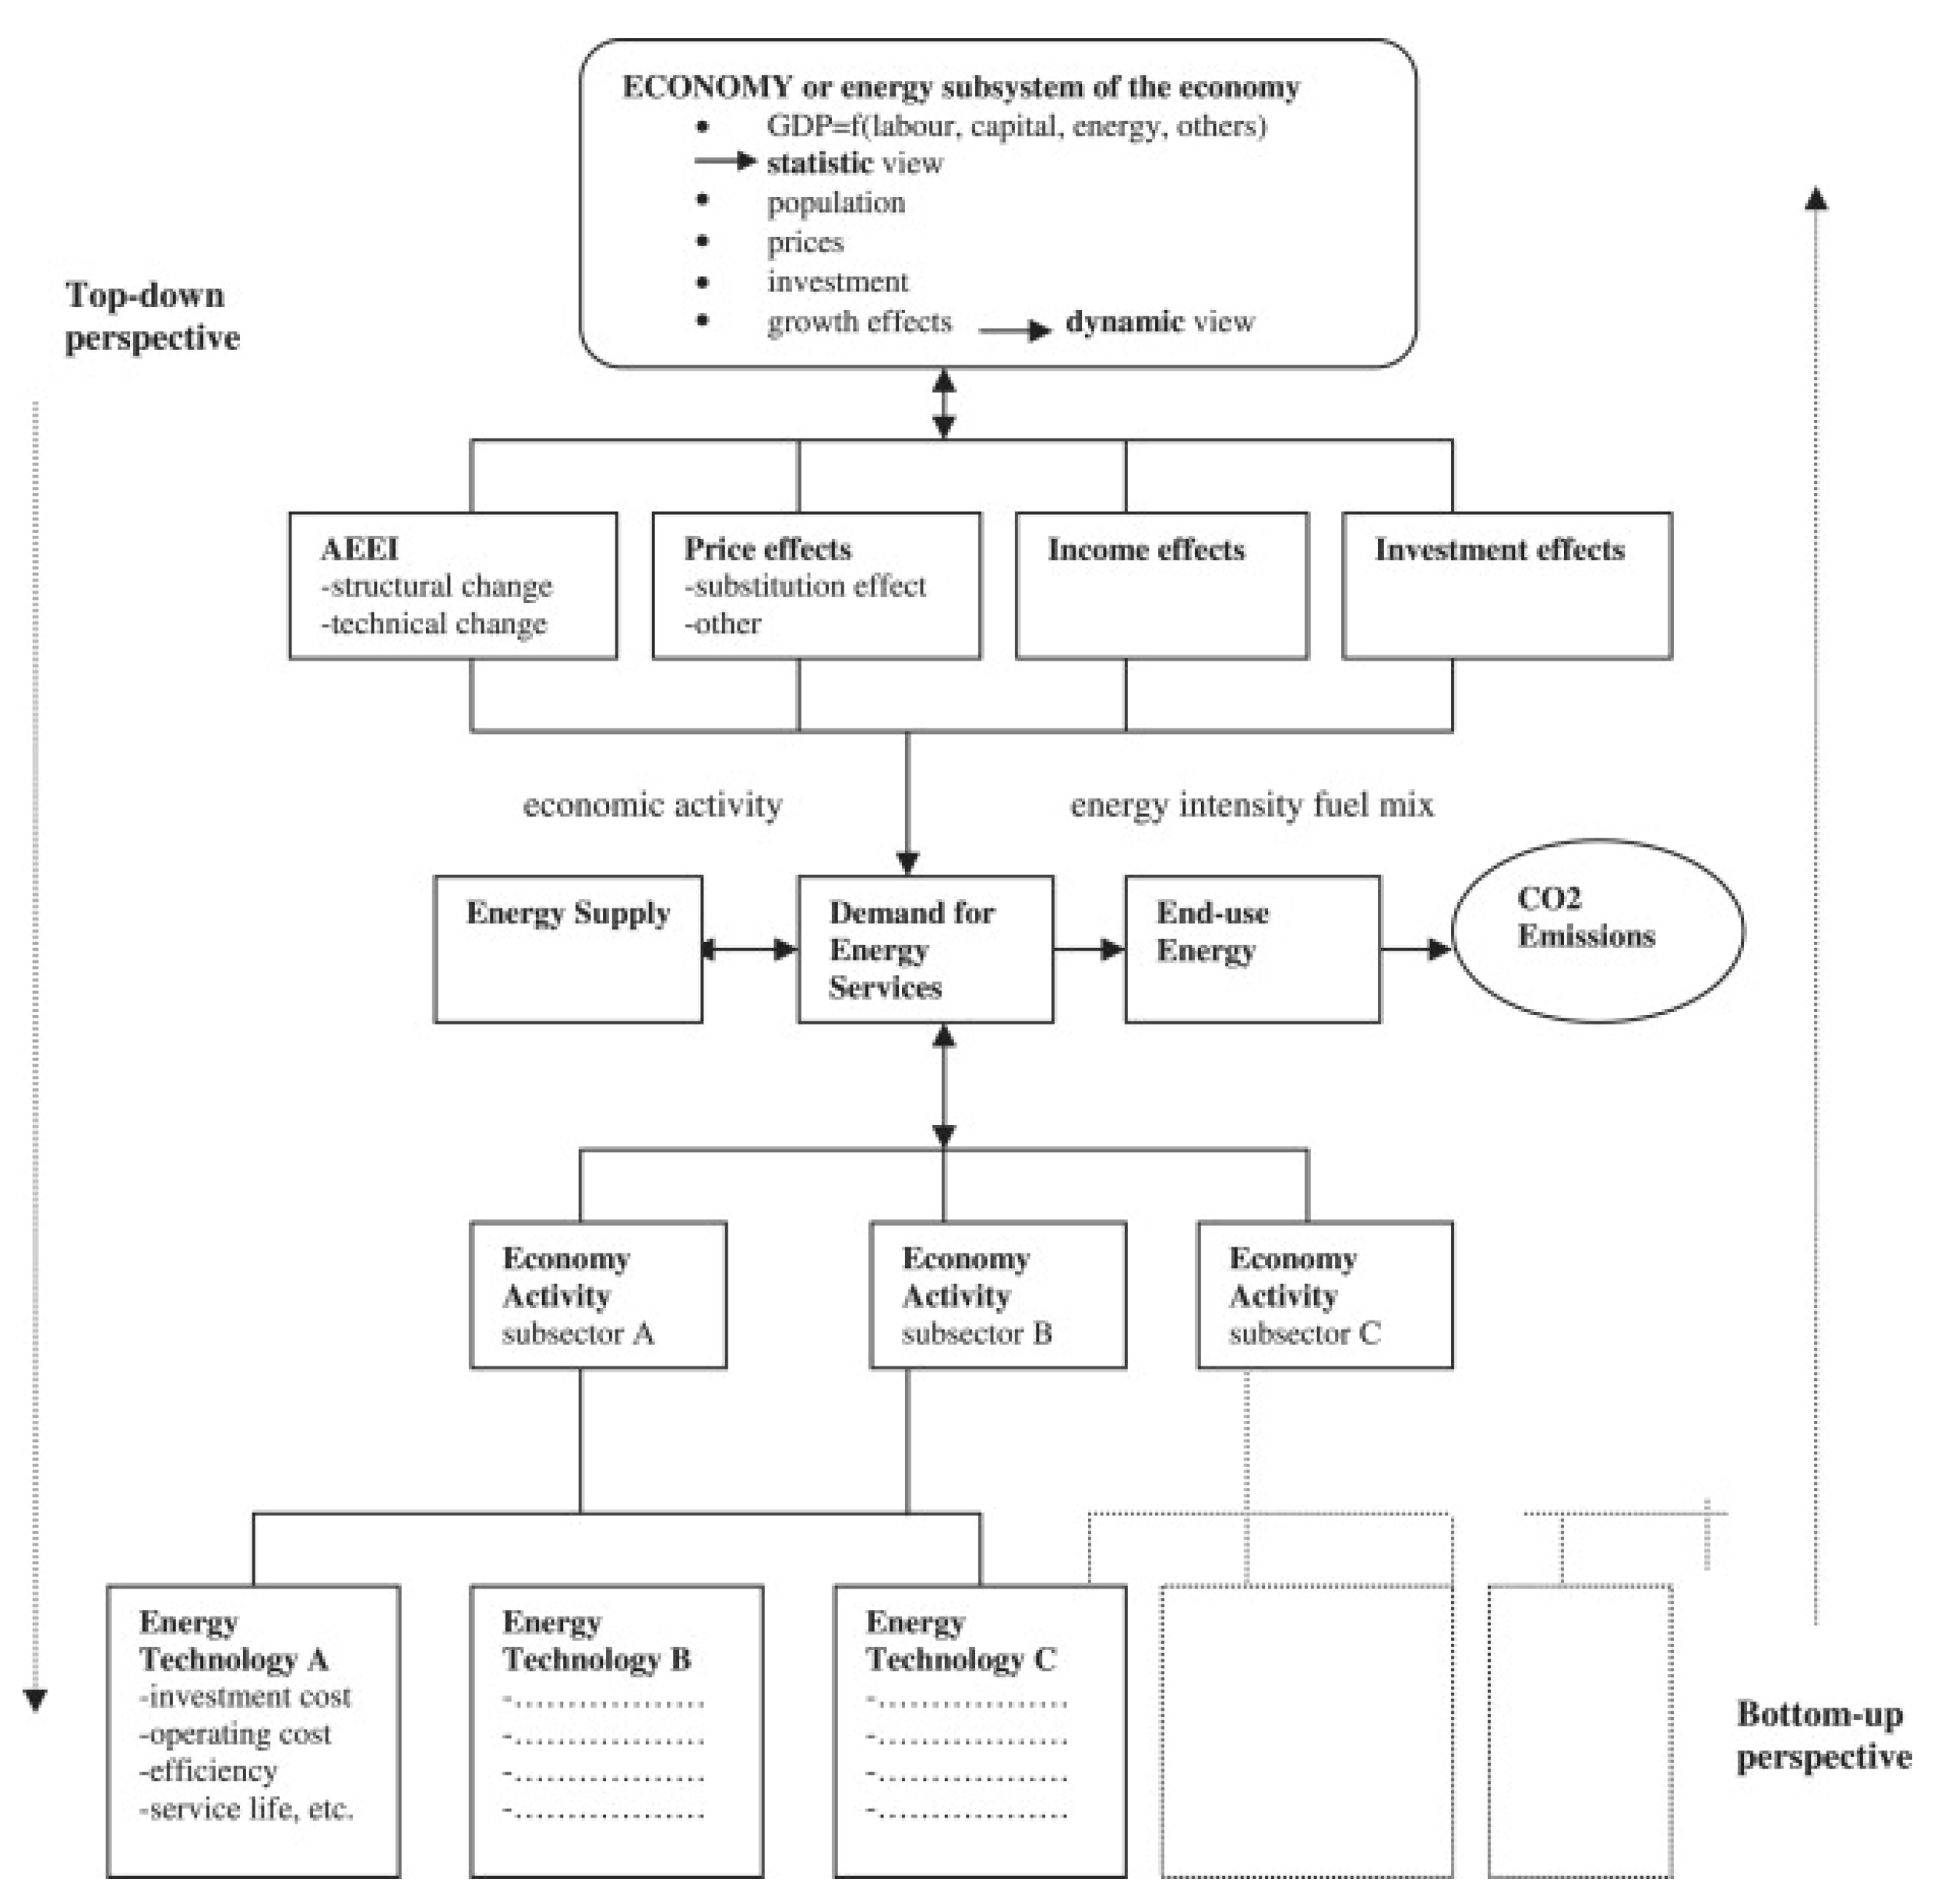
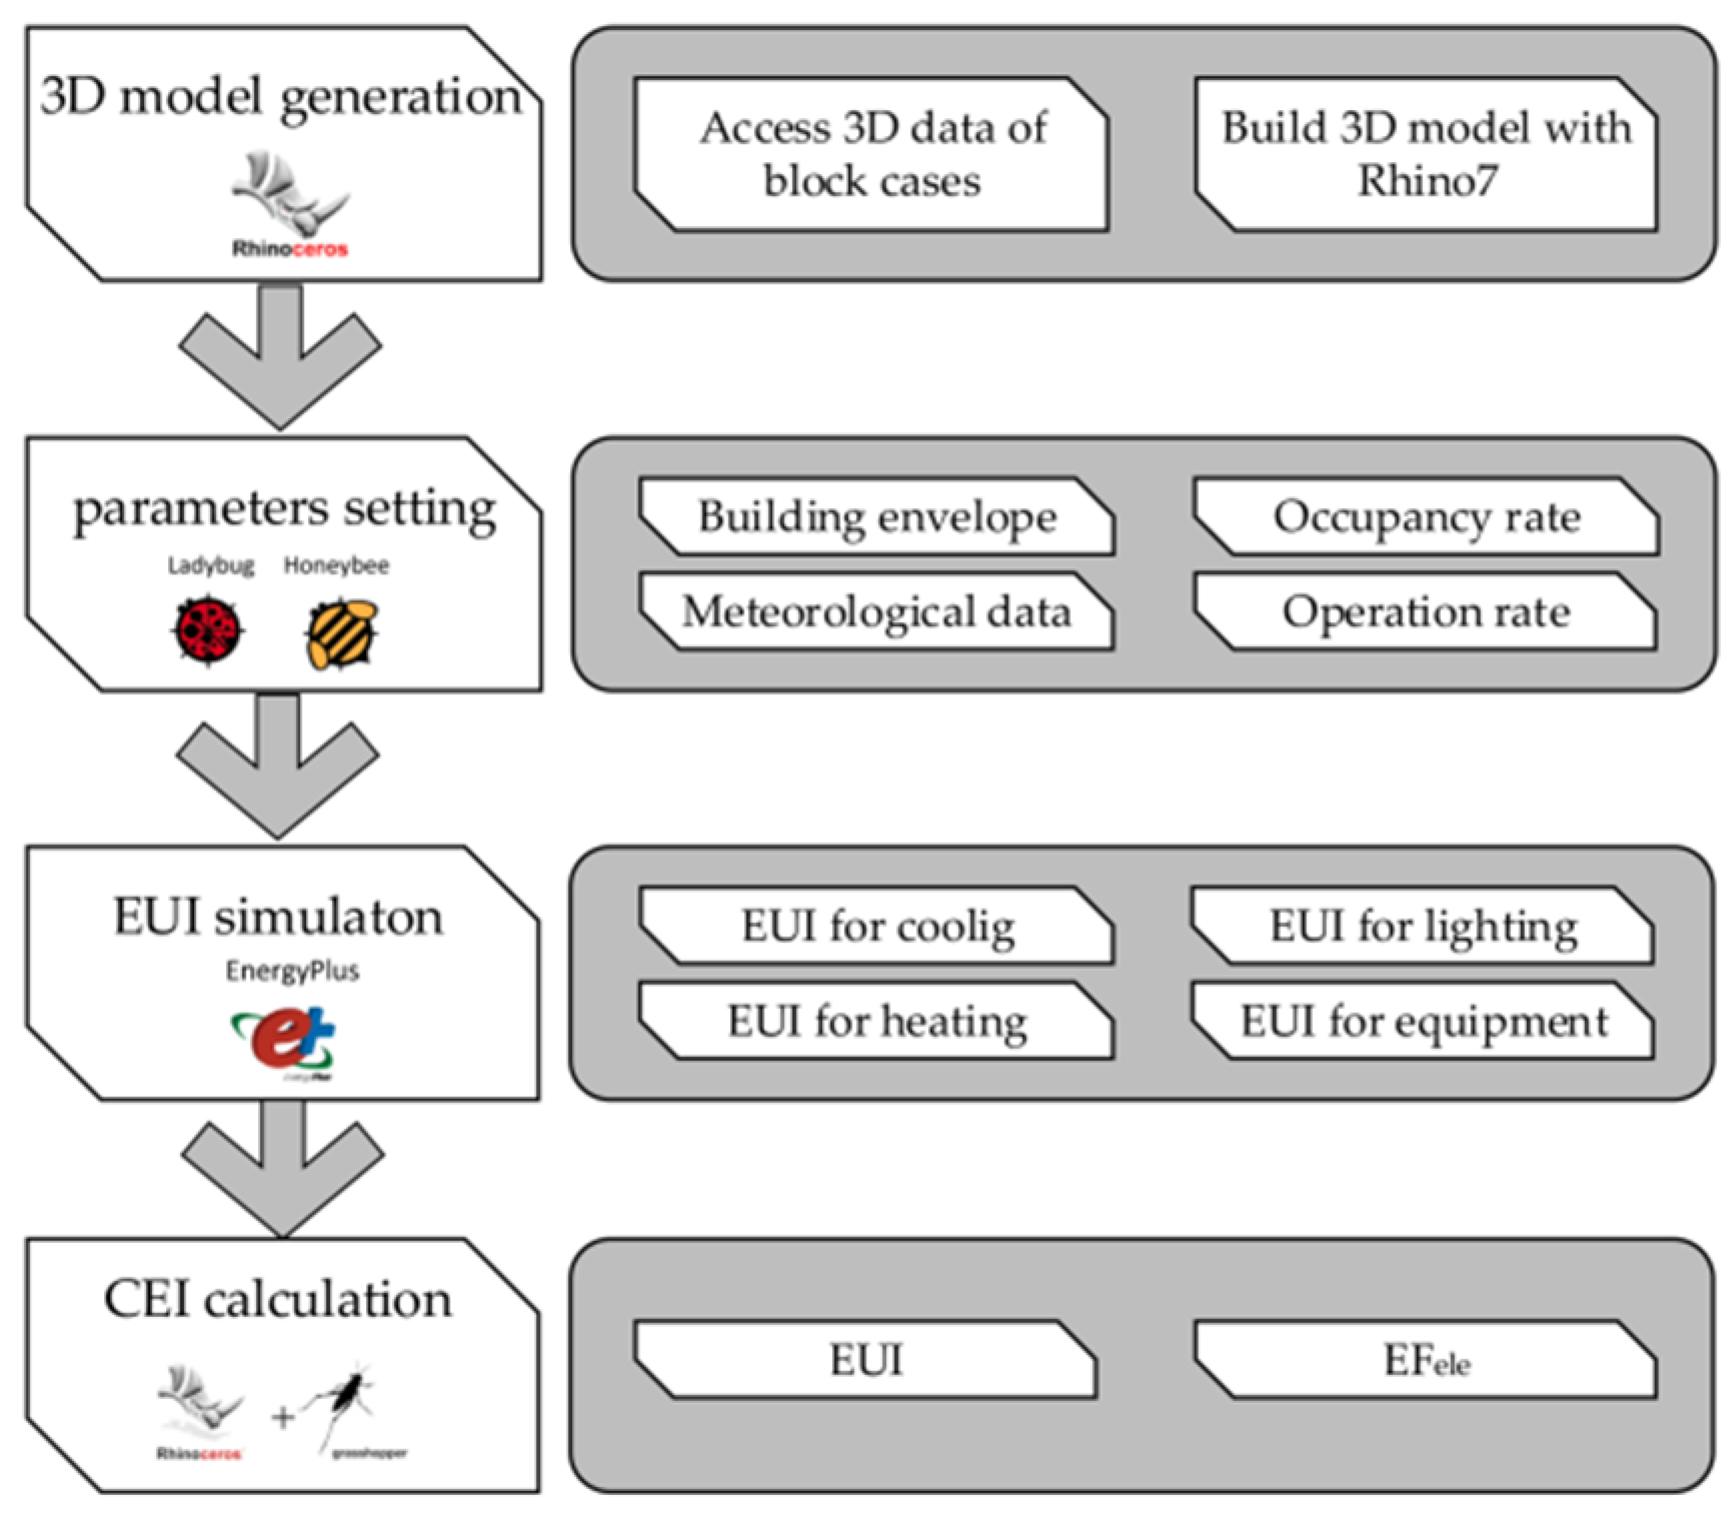
2.4.2. Building Carbon Emissions Simulation Tool
- 1
- Simulation Parameter Setting
- 2
- Building carbon emissions (CE) calculation
3. Results and Discussion
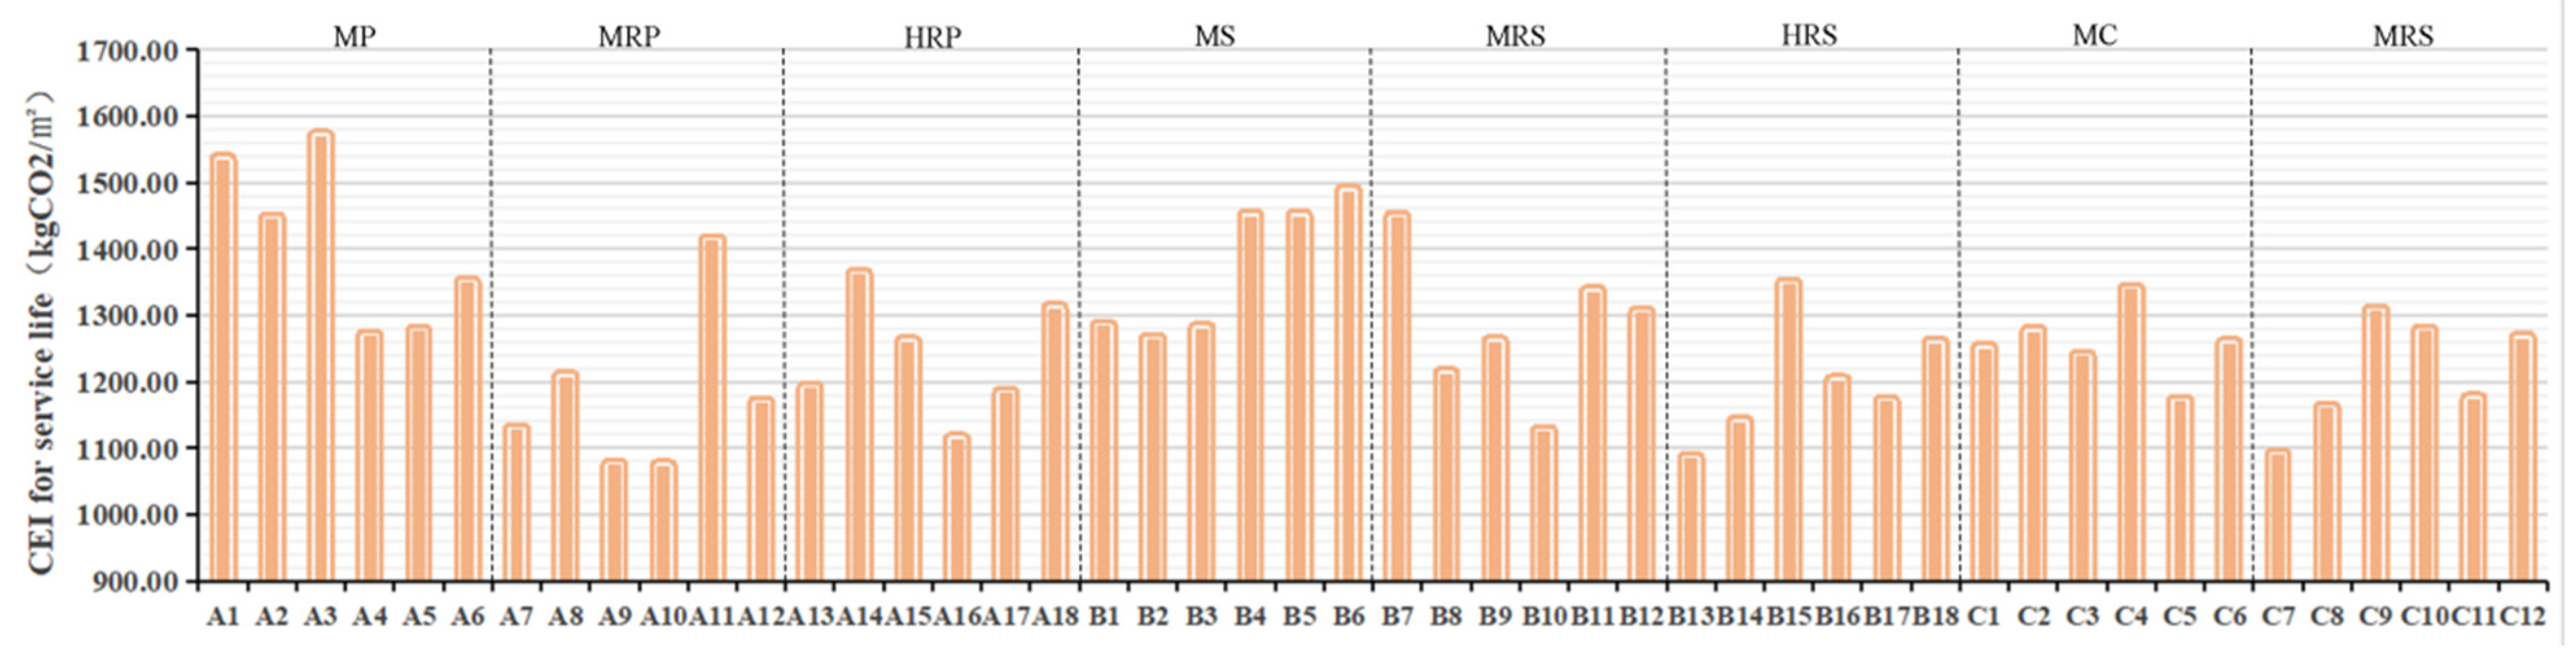
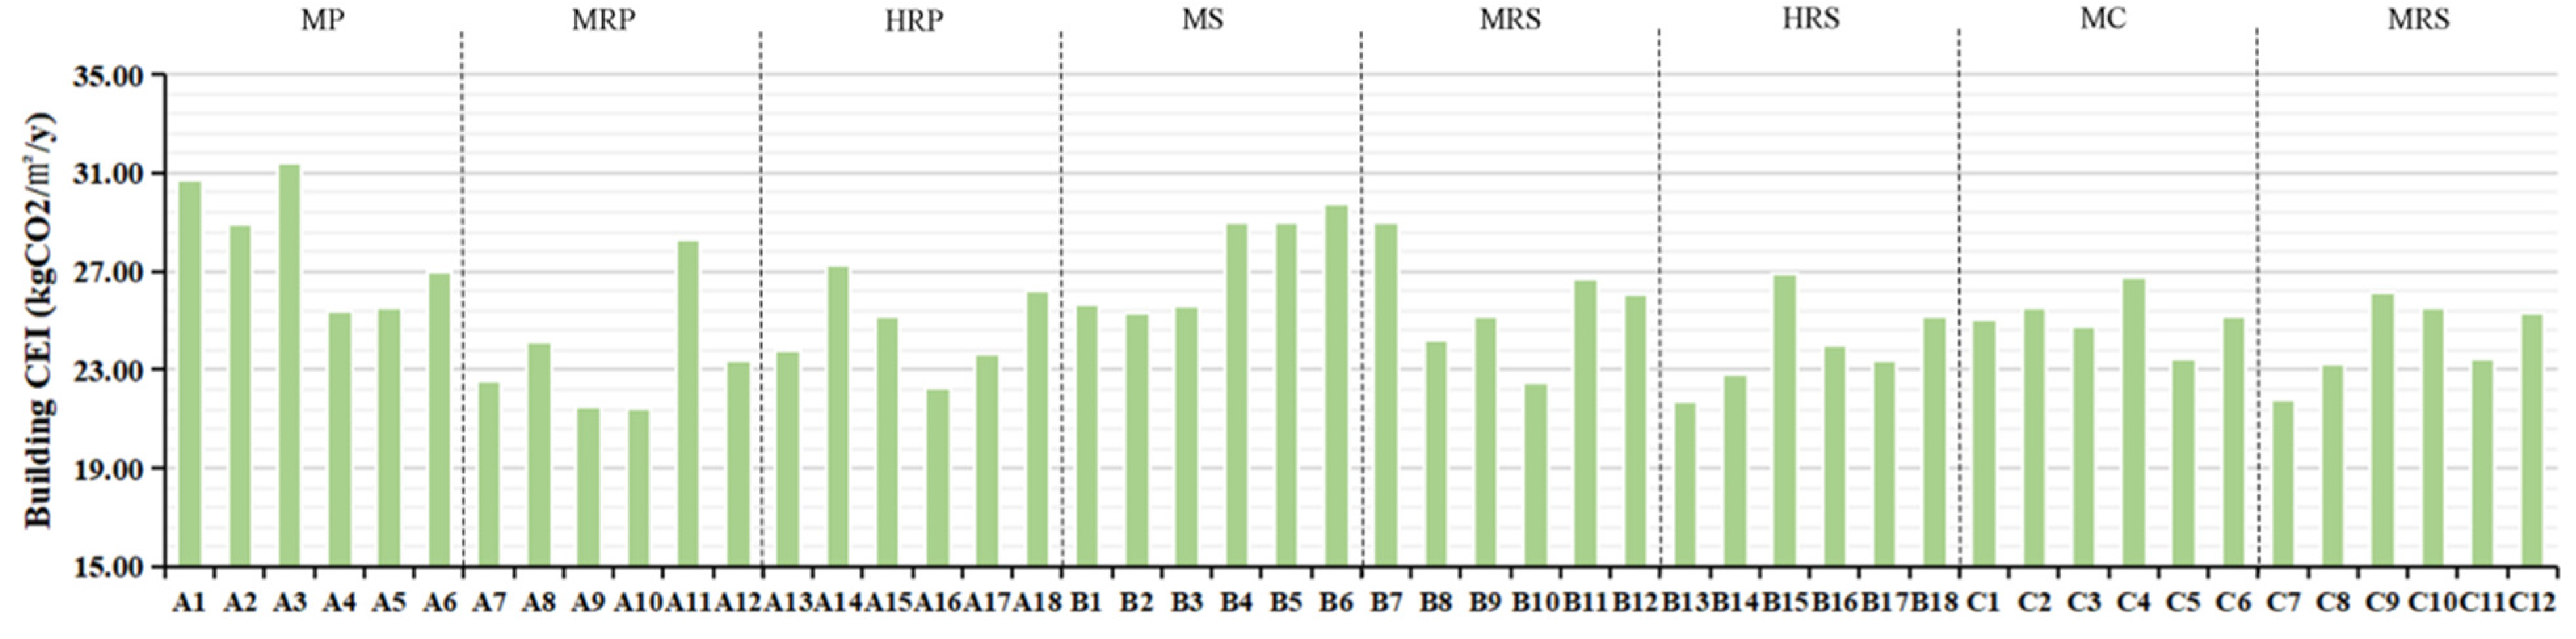
3.1. Building CE Distribution Characteristics of the Residential Blocks
3.1.1. Building CE Distribution Characteristics of All the Blocks
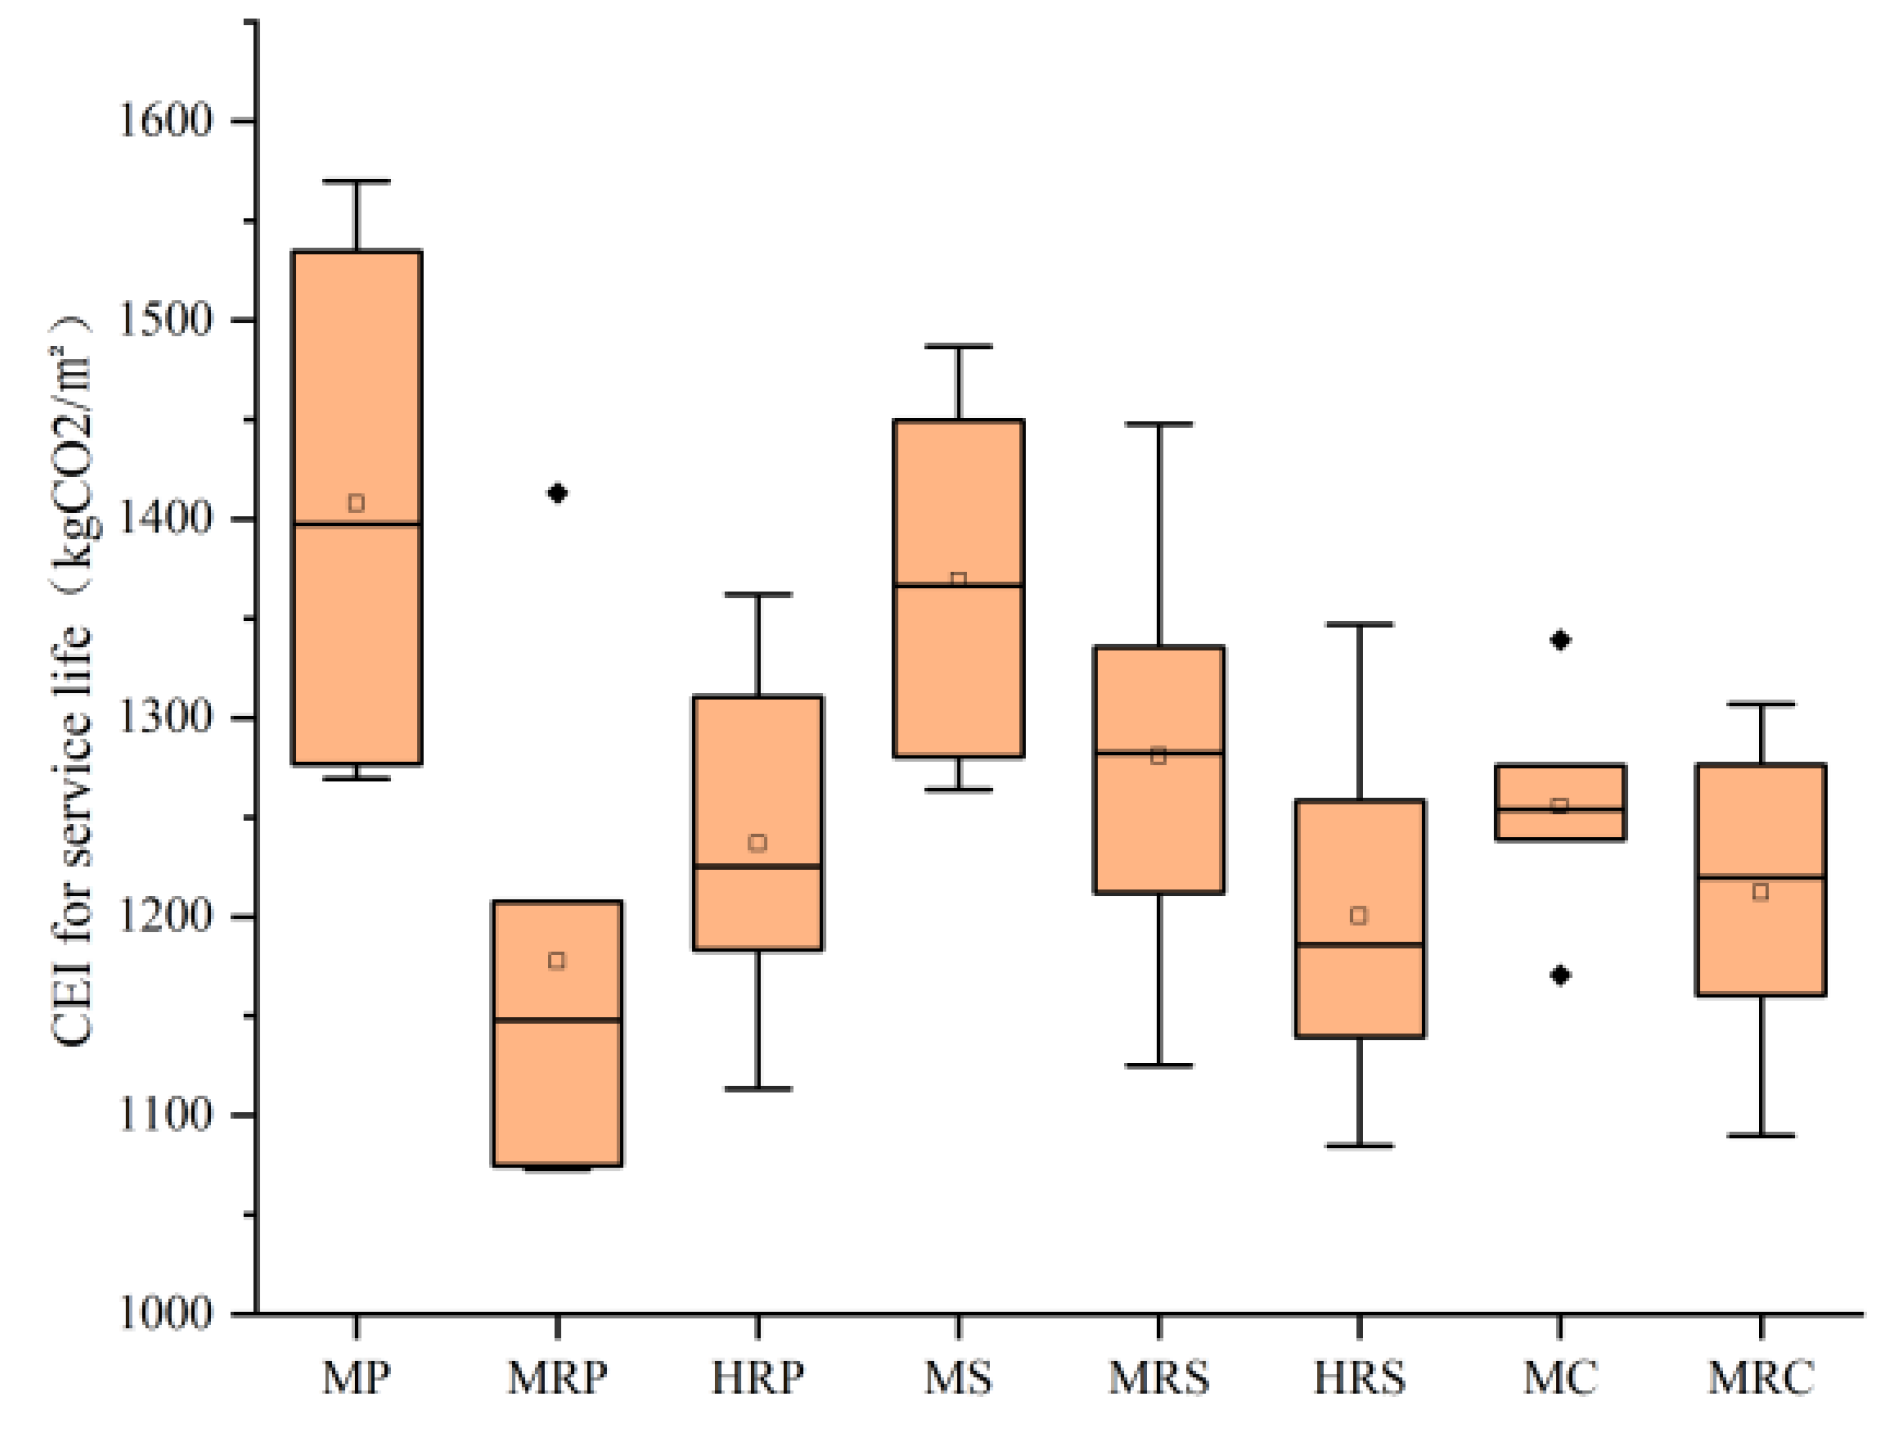
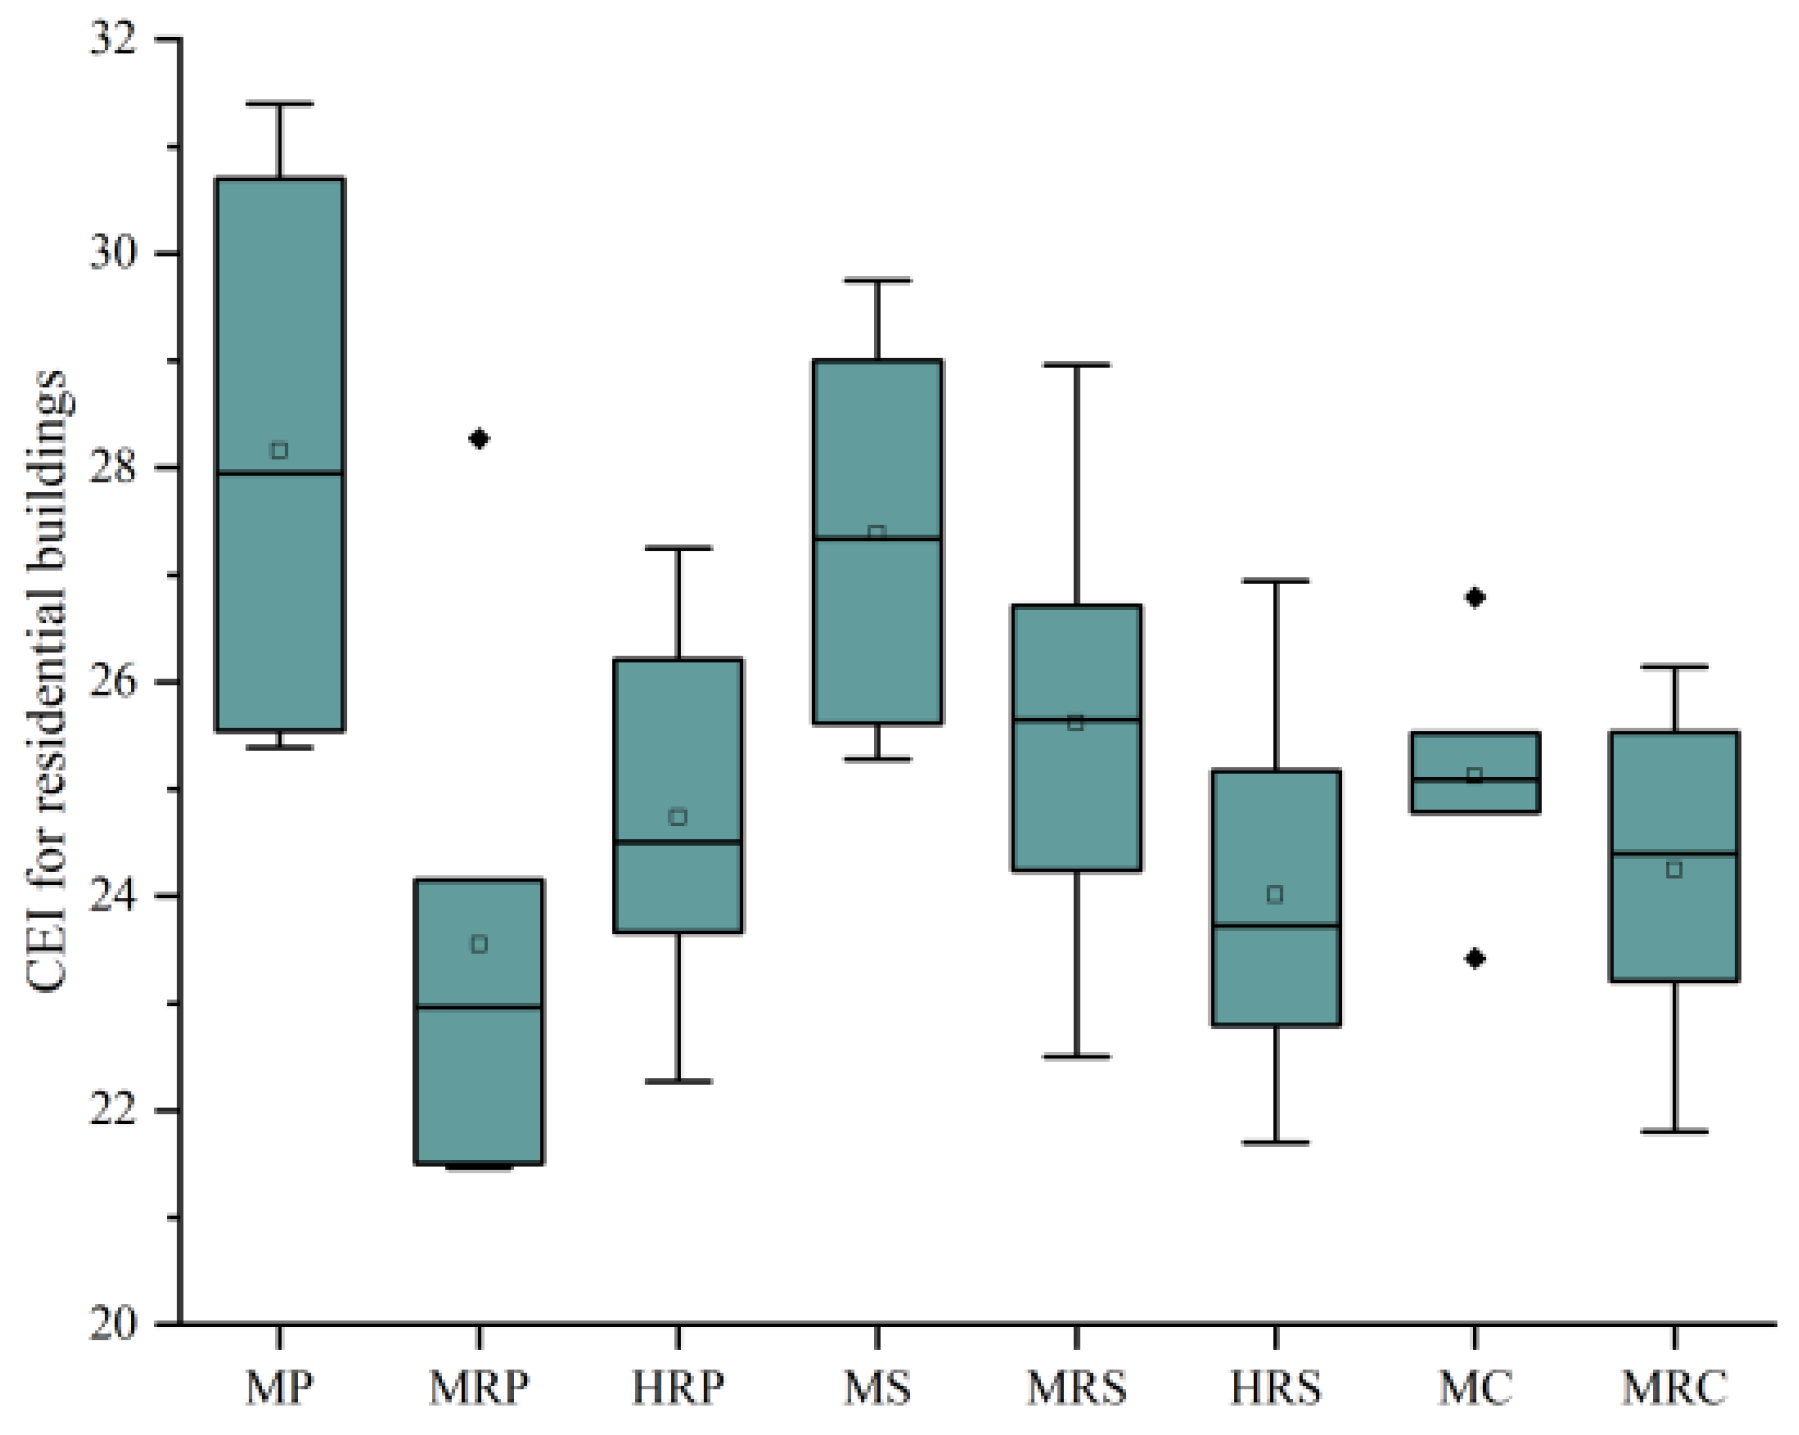
3.1.2. Building CE Distribution Characteristics for Different Block Typologies
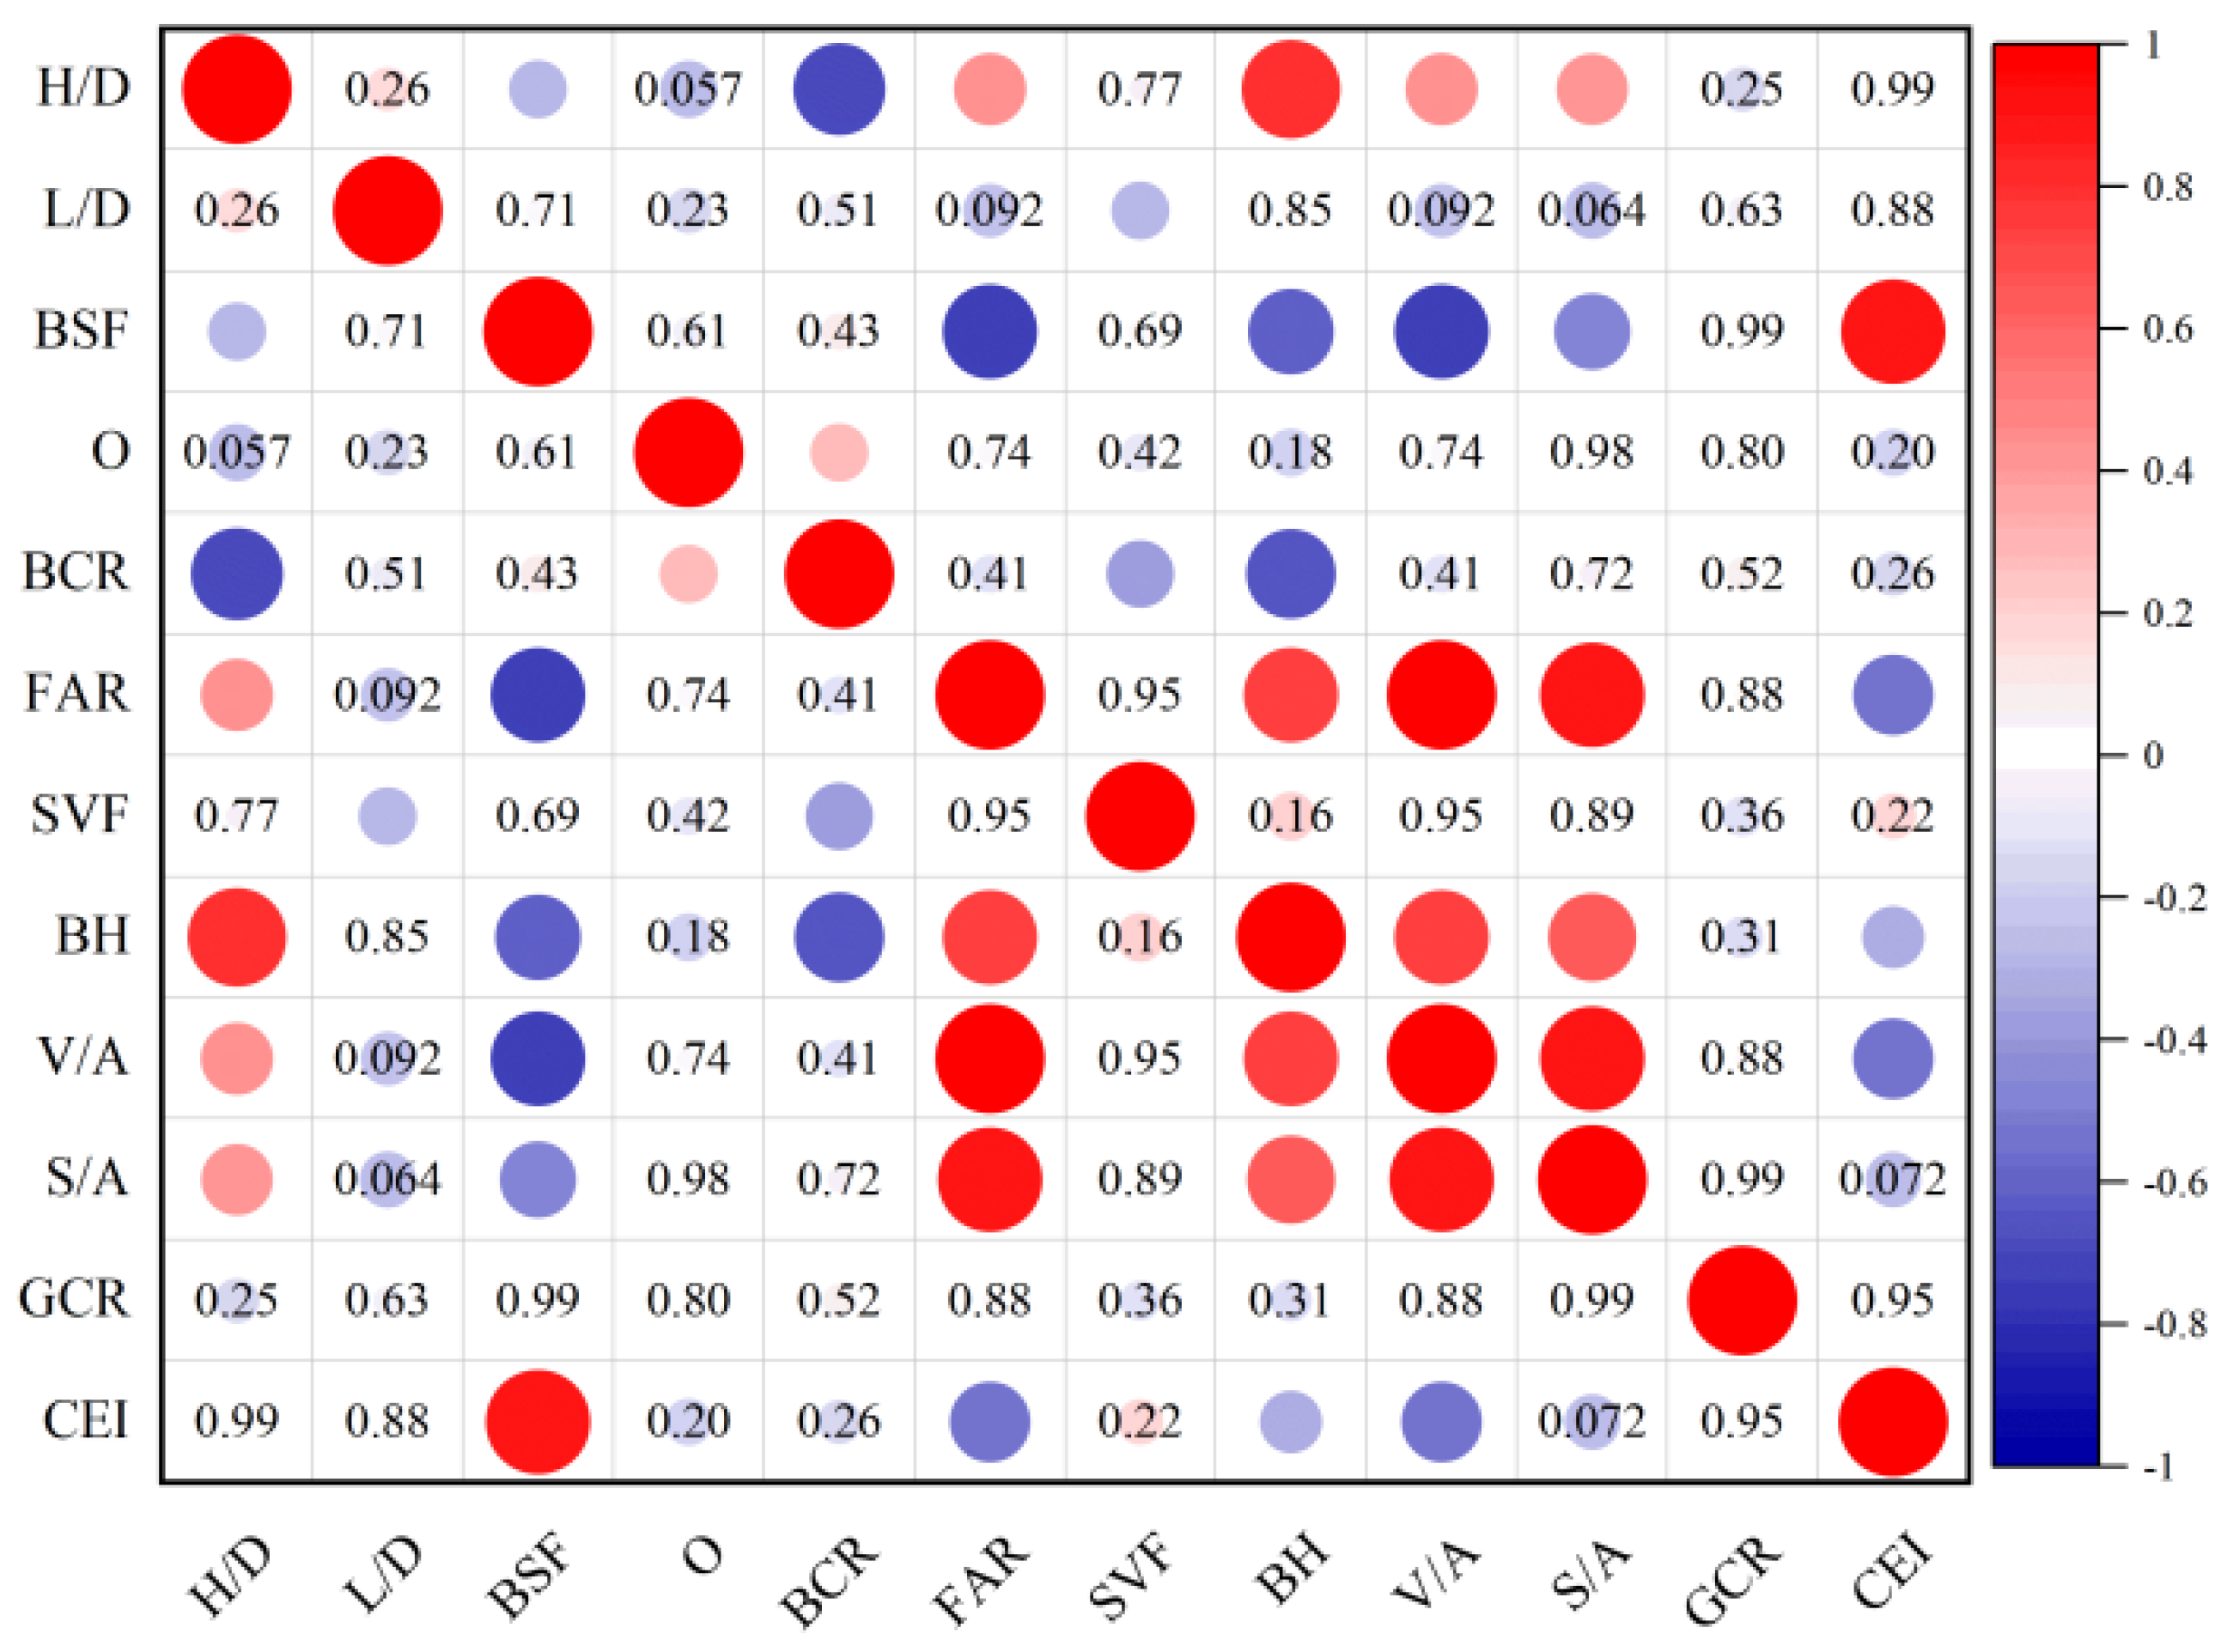
3.2. The Relationship between Block Form and Building CE
3.2.1. Building CE Distributions for the Different Block Typologies
3.2.2. The Combined Impact of Block Form Parameters on a Building’s CEI
3.3. Low-Carbon Planning Strategies for Residential Blocks under the Goal of Carbon Neutrality
3.3.1. Block Typology Selection Strategies
3.3.2. Form Index Control Strategies
3.4. Limitations and Future Research
4. Conclusions
- The results demonstrated that the block form influenced the building CEI by 31.66%.
- The residential block with the smallest building CEI for its service life was A10, with 1073.08 kg CO2/m2. The residential block with the largest building CEI for its service life was A3, with 1569.79 kg CO2/m2.
- The BSF had the greatest influence on a building’s CEI, with r = 0.910, and this was followed by the FAR (r = −0.547), the V/A (r = −0.547), and the BH (r = −0.328).
- The BSF, S/A, and BCR had a combined impact on a building’s CEI. The influence weight of the BSF on a building’s CEI was 3.84 times that of the BCR, which was 4.46 times that of the S/A.
- For the low-carbon planning of residential blocks, a form index was the strategy used to control the BSF, S/A, and BCR to achieve the lowest building carbon emissions for residential blocks within a reasonable range, and the control priority of the form index was the BSF, BCR, and S/A.
Supplementary Materials
Author Contributions
Funding
Data Availability Statement
Acknowledgments
Conflicts of Interest
Nomenclature
| H/D | height–depth ratio of block |
| L/D | length–depth ratio of block |
| BSF | building shape factor |
| O | building orientation |
| BCR | building cover ratio |
| FAR | floor area ratio |
| SVF | sky view factor |
| BH | building height of block |
| V/S | building volume–site area ratio |
| S/A | building surface–site area ratio |
| GSR | green space ratio |
| CEI | building carbon emissions intensity |
| CE | carbon emissions |
| BEC | building energy consumption |
References
- Stocker, T. Climate Change 2013: The Physical Science Basis: Working Group I Contribution to the Fifth Assessment Report of the Intergovernmental Panel on Climate Change; Cambridge University Press: Cambridge, UK, 2014. [Google Scholar]
- International Energy Agency (IEA). Cities, Towns and Renewable Energy: Yes in My Front Yard; OECD Publishing: Paris, France, 2009. [Google Scholar]
- Dhakal, S. Urban Energy Use and Carbon Emissions from Cities in China and Policy Implications. Energy Policy 2009, 37, 4208–4219. [Google Scholar] [CrossRef]
- China Association of Building Energy Efficiency. China Building Energy Consumption Research Report 2020; China Association of Building Energy Efficiency: Shanghai, China, 2020. [Google Scholar]
- Central People’s Government of the People’s Republic of China. Actively and Steadily Promoting Carbon Peaking and Carbon Neutrality. 2023. Available online: https://www.gov.cn/yaowen/2023-04/06/content_5750183.htm (accessed on 6 October 2023).
- Qudong China. What We Have Done to Prepare for the "Dual-Carbon" Goal. 2021. Available online: https://www.qudong.com/article/783763.shtml (accessed on 6 October 2023).
- Li, Z.; Lin, B.; Zheng, S.; Liu, Y.; Wang, Z.; Dai, J. A Review of Operational Energy Consumption Calculation Method for Urban Buildings. In Building Simulation; Springer: Berlin/Heidelberg, Germany, 2020; Volume 13, pp. 739–751. [Google Scholar]
- Kavgic, M.; Mavrogianni, A.; Mumovic, D.; Summerfield, A.; Stevanovic, Z.; Djurovic-Petrovic, M. A review of bottom-up building stock models for energy consumption in the residential sector. Build. Environ. 2021, 45, 1683–1697. [Google Scholar] [CrossRef]
- Yang, Y.; Li, H.; Zheng, H. Research on Factors of Beijing’s Building Carbon Emissions. Ecol. Econ. 2016, 32, 72–75. [Google Scholar]
- Yang, T.; Pan, Y.; Yang, Y.; Lin, M.; Qin, B.; Xu, P.; Huang, Z. CO2 emissions in China’s building sector through 2050: A scenario analysis based on a bottom-up model. Energy 2017, 128, 208–223. [Google Scholar] [CrossRef]
- Huo, T.; Xu, L.; Feng, W.; Cai, W.; Liu, B. Dynamic Scenario Simulations of Carbon Emission Peak in China’s City-Scale Urban Residential Building Sector through 2050. Energy Policy 2021, 159, 112612. [Google Scholar] [CrossRef]
- Böhringer, C.; Rutherford, T.F. Integrated Assessment of Energy Policies: Decomposing Top-down and Bottom-Up. J. Econ. Dyn. Control 2009, 33, 1648–1661. [Google Scholar] [CrossRef]
- Hübler, M.; Löschel, A. The EU Decarbonisation Roadmap 2050—What Way to Walk? Energy Policy 2013, 55, 190–207. [Google Scholar] [CrossRef]
- Thepkhun, P.; Limmeechokchai, B.; Fujimori, S.; Masui, T.; Shrestha, R.M. Thailand’s Low-Carbon Scenario 2050: The AIM/CGE Analyses of CO2 Mitigation Measures. Energy Policy 2013, 62, 561–572. [Google Scholar] [CrossRef]
- Ciscar, J.-C.; Saveyn, B.; Soria, A.; Szabo, L.; Van Regemorter, D.; Van Ierland, T. A Comparability Analysis of Global Burden Sharing GHG Reduction Scenarios. Energy Policy 2013, 55, 73–81. [Google Scholar] [CrossRef]
- Tan, X.; Dong, L.; Chen, D.; Gu, B.; Zeng, Y. China’s Regional CO2 Emissions Reduction Potential: A Study of Chongqing City. Appl. Energy 2016, 162, 1345–1354. [Google Scholar] [CrossRef]
- Kang, J.; Zhao, T.; Liu, N.; Zhang, X.; Xu, X.; Lin, T. A Multi-Sectoral Decomposition Analysis of City-Level Greenhouse Gas Emissions: Case Study of Tianjin, China. Energy 2014, 68, 562–571. [Google Scholar] [CrossRef]
- Zhu, W.; Huang, B.; Zhao, J.; Chen, X.; Sun, C. Impacts on the Embodied Carbon Emissions in China’s Building Sector and Its Related Energy-Intensive Industries from Energy-Saving Technologies Perspective: A Dynamic CGE Analysis. Energy Build. 2023, 287, 112926. [Google Scholar] [CrossRef]
- Yang, D.; Liu, D.; Huang, A.; Lin, J.; Xu, L. Critical Transformation Pathways and Socio-Environmental Benefits of Energy Substitution Using a LEAP Scenario Modeling. Renew. Sustain. Energy Rev. 2021, 135, 110116. [Google Scholar] [CrossRef]
- Tsai, M.-S.; Chang, S.-L. Taiwan’s 2050 Low Carbon Development Roadmap: An Evaluation with the MARKAL Model. Renew. Sustain. Energy Rev. 2015, 49, 178–191. [Google Scholar] [CrossRef]
- Chiodi, A.; Gargiulo, M.; Rogan, F.; Deane, J.P.; Lavigne, D.; Rout, U.K.; Gallachóir, B.P.Ó. Modelling the Impacts of Challenging 2050 European Climate Mitigation Targets on Ireland’s Energy System. Energy Policy 2013, 53, 169–189. [Google Scholar] [CrossRef]
- Wen, Z.; Meng, F.; Chen, M. Estimates of the Potential for Energy Conservation and CO2 Emissions Mitigation Based on Asian-Pacific Integrated Model (AIM): The Case of the Iron and Steel Industry in China. J. Clean. Prod. 2014, 65, 120–130. [Google Scholar] [CrossRef]
- Su, X.; Zhou, W.; Sun, F.; Nakagami, K. Possible Pathways for Dealing with Japan’s Post-Fukushima Challenge and Achieving CO2 Emission Reduction Targets in 2030. Energy 2014, 66, 90–97. [Google Scholar] [CrossRef]
- Chen, R.; Rao, Z.H.; Liu, J.X.; Chen, Y.Y.; Liao, S.M. Prediction of energy demand and policy analysis of Changsha based on LEAP Model. Resour. Sci. 2017, 39, 482–489. [Google Scholar] [CrossRef]
- Nieves, J.A.; Aristizábal, A.J.; Dyner, I.; Báez, O.; Ospina, D.H. Energy Demand and Greenhouse Gas Emissions Analysis in Colombia: A LEAP Model Application. Energy 2019, 169, 380–397. [Google Scholar] [CrossRef]
- Mirjat, N.H.; Uqaili, M.A.; Harijan, K.; Walasai, G.D.; Mondal, M.A.H.; Sahin, H. Long-Term Electricity Demand Forecast and Supply Side Scenarios for Pakistan (2015–2050): A LEAP Model Application for Policy Analysis. Energy 2018, 165, 512–526. [Google Scholar] [CrossRef]
- Ye, Z.D.; Wang, J.Y. Carbon Accounting for Chinese Cities Green District Plans: Methodology, Data and Evaluation Guidelines; China Architecture & Building Press: Beijing, China, 2015. [Google Scholar]
- Peng, C. Calculation of a Building’s Life Cycle Carbon Emissions Based on Ecotect and Building Information Modeling. J. Clean. Prod. 2016, 112, 453–465. [Google Scholar] [CrossRef]
- Yang, X.; Hu, M.; Wu, J.; Zhao, B. Building-Information-Modeling Enabled Life Cycle Assessment, a Case Study on Carbon Footprint Accounting for a Residential Building in China. J. Clean. Prod. 2018, 183, 729–743. [Google Scholar] [CrossRef]
- Wu, X.; Peng, B.; Lin, B. A Dynamic Life Cycle Carbon Emission Assessment on Green and Non-Green Buildings in China. Energy Build. 2017, 149, 272–281. [Google Scholar] [CrossRef]
- Gardezi, S.S.S.; Shafiq, N. Operational Carbon Footprint Prediction Model for Conventional Tropical Housing: A Malaysian Prospective. Int. J. Environ. Sci. Technol. 2019, 16, 7817–7826. [Google Scholar] [CrossRef]
- Zhang, X.; Yan, F.; Liu, H.; Qiao, Z. Towards Low Carbon Cities: A Machine Learning Method for Predicting Urban Blocks Carbon Emissions (UBCE) Based on Built Environment Factors (BEF) in Changxing City, China. Sustain. Cities Soc. 2021, 69, 102875. [Google Scholar] [CrossRef]
- Carpio, A.; Ponce-Lopez, R.; Lozano-García, D.F. Urban Form, Land Use, and Cover Change and Their Impact on Carbon Emissions in the Monterrey Metropolitan Area, Mexico. Urban Clim. 2021, 39, 100947. [Google Scholar] [CrossRef]
- Yuan, Q.; Guo, R.; Leng, H.; Song, S. Research on the Impact of Urban Form of Small and Medium-Sized Cities on Carbon Emission Efficiency in the Yangtze River Delta. J. Hum. Settl. West China 2021, 36, 8–15. [Google Scholar]
- Dong, Q.; Huang, Z.; Zhou, X.; Guo, Y.; Scheuer, B.; Liu, Y. How Building and Street Morphology Affect CO2 Emissions: Evidence from a Spatially Varying Relationship Analysis in Beijing. Build. Environ. 2023, 236, 110258. [Google Scholar] [CrossRef]
- Ou, J.; Liu, X.; Li, X.; Chen, Y. Quantifying the Relationship between Urban Forms and Carbon Emissions Using Panel Data Analysis. Landsc. Ecol. 2013, 28, 1889–1907. [Google Scholar] [CrossRef]
- Fang, C.; Wang, S.; Li, G. Changing Urban Forms and Carbon Dioxide Emissions in China: A Case Study of 30 Provincial Capital Cities. Appl. Energy 2015, 158, 519–531. [Google Scholar] [CrossRef]
- Deng, Q.; Wang, G.; Wang, Y.; Zhou, H.; Ma, L. A Quantitative Analysis of the Impact of Residential Cluster Layout on Building Heating Energy Consumption in Cold IIB Regions of China. Energy Build. 2021, 253, 111515. [Google Scholar] [CrossRef]
- Tian, J.; Xu, S. A Morphology-Based Evaluation on Block-Scale Solar Potential for Residential Area in Central China. Sol. Energy 2021, 221, 332–347. [Google Scholar] [CrossRef]
- Xu, S.; Li, G.; Zhang, H.; Xie, M.; Mendis, T.; Du, H. Effect of Block Morphology on Building Energy Consumption of Office Blocks: A Case of Wuhan, China. Buildings 2023, 13, 768. [Google Scholar] [CrossRef]
- Urquizo, J.; Calderón, C.; James, P. Understanding the Complexities of Domestic Energy Reductions in Cities: Integrating Data Sets Generally Available in the United Kingdom’s Local Authorities. Cities 2018, 74, 292–309. [Google Scholar] [CrossRef]
- Leng, H.; Chen, X.; Ma, Y.; Wong, N.H.; Ming, T. Urban Morphology and Building Heating Energy Consumption: Evidence from Harbin, a Severe Cold Region City. Energy Build. 2020, 224, 110143. [Google Scholar] [CrossRef]
- Filogamo, L.; Peri, G.; Rizzo, G.; Giaccone, A. On the Classification of Large Residential Buildings Stocks by Sample Typologies for Energy Planning Purposes. Appl. Energy 2014, 135, 825–835. [Google Scholar] [CrossRef]
- He, B.-J.; Ding, L.; Prasad, D. Enhancing Urban Ventilation Performance through the Development of Precinct Ventilation Zones: A Case Study Based on the Greater Sydney, Australia. Sustain. Cities Soc. 2019, 47, 101472. [Google Scholar] [CrossRef]
- Shashua-Bar, L.; Tsiros, I.X.; Hoffman, M.E. A Modeling Study for Evaluating Passive Cooling Scenarios in Urban Streets with Trees. Case Study: Athens, Greece. Build. Environ. 2010, 45, 2798–2807. [Google Scholar] [CrossRef]
- Liu, K.; Xu, X.; Zhang, R.; Kong, L.; Wang, W.; Deng, W. Impact of Urban Form on Building Energy Consumption and Solar Energy Potential: A Case Study of Residential Blocks in Jianhu, China. Energy Build. 2023, 280, 112727. [Google Scholar] [CrossRef]
- GBT 51366-2019; Ministry of Housing and Urban-Rural Development, PRC. Standard for Calculation of Building Carbon Emissions. China Architecture & Building Press: Beijing, China, 2019.
- Pan, Y.Q.; Liang, Y.M.; Zhu, M.Y. Review of Building Carbon Emission Calculation Models in Context of Carbon Neutrality. Heat. Vent. Air Cond. 2021, 51, 37–48. [Google Scholar]
- National Development and Reform Commission. Guidelines for the Preparation of Provincial GHG Inventories (for Trial Implementation); National Development and Reform Commission, PRC: Beijing, China, 2011. [Google Scholar]
- Wang, D.S. Studies on Net Carbon Reserves in Beijing Urban Landscape Green Based on Biomass Measurement. PhD Thesis, Beijing Forestry University, Beijing, China, 2010. [Google Scholar]
- Xu, S.; Sang, M.; Xie, M.; Xiong, F.; Mendis, T.; Xiang, X. Influence of Urban Morphological Factors on Building Energy Consumption Combined with Photovoltaic Potential: A Case Study of Residential Blocks in Central China. Build. Simul. 2023, 16, 1777–1792. [Google Scholar] [CrossRef]
- DB 42/T559-2013; Wuhan Building Energy Efficiency Office, Hubei Province Construction Technology Development Center Design Standard for Energy Efficiency of Residential Buildings. Chinese Building Materials Press: Beijing, China, 2013.
- Strømann-Andersen, J.; Sattrup, P.A. The urban canyon and building energy use: Urban density versus daylight and passive solar gains. Energy Build. 2011, 43, 2011–2020. [Google Scholar] [CrossRef]
- Xie, M.; Wang, M.; Zhong, H.; Li, X.; Li, B.; Mendis, T.; Xu, S. The Impact of Urban Morphology on the Building Energy Consumption and Solar Energy Generation Potential of University Dormitory Blocks. Sustain. Cities Soc. 2023, 96, 104644. [Google Scholar] [CrossRef]
- Sandberg, N.H.; Bergsdal, H.; Brattebø, H. Historical Energy Analysis of the Norwegian Dwelling Stock. Build. Res. Inf. 2011, 39, 1–15. [Google Scholar] [CrossRef]
- Goldstein, B.; Gounaridis, D.; Newell, J.P. The Carbon Footprint of Household Energy Use in the United States. Proc. Natl. Acad. Sci. USA 2020, 117, 19122–19130. [Google Scholar] [CrossRef]
- Mousavi Sarvine Baghi, E.S.; Ranjbar, E. Seeking Low Carbon Urban Design through Modelling of Carbon Emission from Different Sources in Urban Neighbourhoods, Case Study: Semnan. Int. J. Urban Sustain. Dev. 2021, 13, 546–568. [Google Scholar] [CrossRef]
- He, P.; Xue, J.; Shen, G.Q.; Ni, M.; Wang, S.; Wang, H.; Huang, L. The Impact of Neighborhood Layout Heterogeneity on Carbon Emissions in High-Density Urban Areas: A Case Study of New Development Areas in Hong Kong. Energy Build. 2023, 287, 113002. [Google Scholar] [CrossRef]
- Tso, G.K.; Guan, J. A Multilevel Regression Approach to Understand Effects of Environment Indicators and Household Features on Residential Energy Consumption. Energy 2014, 66, 722–731. [Google Scholar] [CrossRef]
- Fumo, N.; Biswas, M.R. Regression Analysis for Prediction of Residential Energy Consumption. Renew. Sustain. Energy Rev. 2015, 47, 332–343. [Google Scholar] [CrossRef]
- Song, S.; Leng, H.; Guo, R. Planning Strategy for Urban Building Energy Conservation Supported by Agent-Based Modeling. Buildings 2022, 12, 2171. [Google Scholar] [CrossRef]


| Typologies | Building Height (m) | Block Case | Block 3D Model |
|---|---|---|---|
| Multi-story pavilion | H ≤ 27 m | 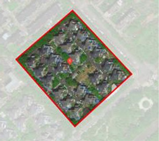 |  |
| Multi-story slab | H ≤ 27 m | 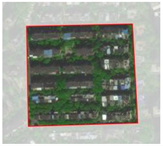 |  |
| Multi-story courtyard | H ≤ 27 m |  |  |
| Mid-rise pavilion | 27 < H ≤ 54 m | 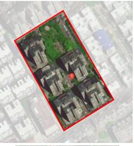 |  |
| Mid-rise slab | 27 < H ≤ 54 m |  |  |
| Mid-rise courtyard | 27 < H ≤ 54 m | 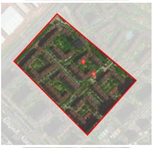 |  |
| High-rise pavilion | 54 < H ≤ 99 m | 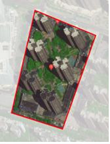 | 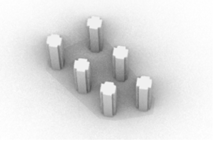 |
| High-rise slab | 54 < H ≤ 99 m |  |  |
| Parameters | Formula | Definition | Diagram |
|---|---|---|---|
| H/D | denoted building height of building i; denoted building volume of building i; denoted building length of building i; denoted the total building volume |  | |
| L/D | represented building depth of building i | 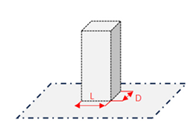 | |
| BSF | represented the total building surface area | 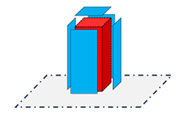 | |
| O | represented the building orientation of building i | 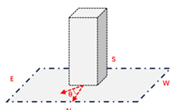 | |
| BCR | denoted the total footprint area | 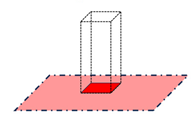 | |
| FAR | denoted the total floor area; represented the total site area | 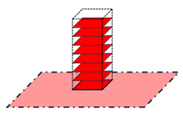 | |
| SVF | was the solar radiation received from the visible sky at a point on the block; was the global horizontal radiation received by the unobstructed hemisphere of the sky |  | |
| BH | / |  | |
| V/A | / | 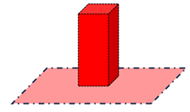 | |
| S/A | / |  | |
| GSR | represented the green space area |  |
| Parameter | Parameter Data | Source of Data | |
|---|---|---|---|
| Climate Data | The Meteorological Data | Meteorological Data of Wuhan | China Meteorological Data Network |
| Human Thermal Load | 108 W/Person | JGJ/T449-2018 | |
| Occupancy Rate | 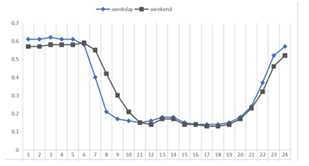 | ||
| Air Conditioning System | System Type | Split air conditioner for home use | Investigate and research |
| Temperature Set | Cooling Set Point 26 °C | JGJ134-2010 | |
| Heating Set Point 18 °C | |||
| Operation Rate of Cooling | 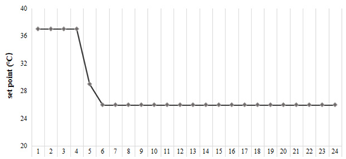 | JGJ/T449-2018 | |
| Operation Rate of Heating | 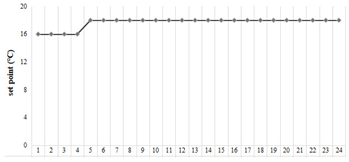 | JGJ/T449-2018 | |
| Lighting | Power Density | 3 W/m2 | Validation of experimental corrections |
| Operation Rate of Lighting |  | JGJ/T449-2018 | |
| Equipment | Power Density | 4 W/m2 | Validation of experimental corrections |
| Operation Rate of Equipment | 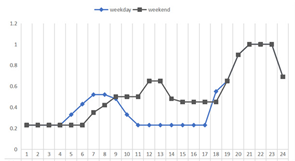 | JGJ/T449-2018 |
| Building Envelope | Heat Transfer Coefficient K (W/m2·K) | |
|---|---|---|
| Transparent envelope | Window | 2.30 |
| Opaque envelope | Roof | 0.35 |
| Exterior wall | 1.18 | |
| Floor | 1.14 | |
| Interior wall | 0.79 | |
| H/D | L/D | BSF | O | BCR | FAR | |
|---|---|---|---|---|---|---|
| r | 0.002 | −0.023 | 0.910 ** | −0.19 | −0.164 | −0.547 ** |
| p | 0.978 | 0.877 | 0.000 | 0.195 | 0.265 | 0.000 |
| SVF | BH | V/A | S/A | GCR | ||
| r | 0.181 | −0.328 * | −0.547 ** | −0.262 | −0.005 | |
| p | 0.219 | 0.023 | 0.000 | 0.072 | 0.947 |
| Unstandardized Coefficients | Beta | t | p | VIF | R2 | |||
|---|---|---|---|---|---|---|---|---|
| Dependent Variables | Independent Variables | B | Standard Error | |||||
| CEI | (Constants) | 641.271 | 37.671 | - | 17.023 | 0.000 | - | 0.944 |
| BSF | 3169.088 | 122.897 | 1.057 | 25.789 | 0.000 | 1.323 | ||
| S/A | 46.056 | 7.930 | 0.237 | 5.808 | 0.000 | 1.309 | ||
| BCR | −400.613 | 52.338 | −0.275 | −7.654 | 0.000 | 1.014 | ||
Disclaimer/Publisher’s Note: The statements, opinions and data contained in all publications are solely those of the individual author(s) and contributor(s) and not of MDPI and/or the editor(s). MDPI and/or the editor(s) disclaim responsibility for any injury to people or property resulting from any ideas, methods, instructions or products referred to in the content. |
© 2023 by the authors. Licensee MDPI, Basel, Switzerland. This article is an open access article distributed under the terms and conditions of the Creative Commons Attribution (CC BY) license (https://creativecommons.org/licenses/by/4.0/).
Share and Cite
Lian, H.; Zhang, J.; Li, G.; Ren, R. The Relationship between Residential Block Forms and Building Carbon Emissions to Achieve Carbon Neutrality Goals: A Case Study of Wuhan, China. Sustainability 2023, 15, 15751. https://doi.org/10.3390/su152215751
Lian H, Zhang J, Li G, Ren R. The Relationship between Residential Block Forms and Building Carbon Emissions to Achieve Carbon Neutrality Goals: A Case Study of Wuhan, China. Sustainability. 2023; 15(22):15751. https://doi.org/10.3390/su152215751
Chicago/Turabian StyleLian, Haitao, Junhan Zhang, Gaomei Li, and Rui Ren. 2023. "The Relationship between Residential Block Forms and Building Carbon Emissions to Achieve Carbon Neutrality Goals: A Case Study of Wuhan, China" Sustainability 15, no. 22: 15751. https://doi.org/10.3390/su152215751