Article

Decarbonization in the Automotive Sector: A Holistic Status Quo Analysis of Original Equipment Manufacturer Strategies and Carbon Management Activities

by
Joseph Poligkeit
1,2,*,
Thomas Fugger
1,2 and
Christoph Herrmann
1
1
Institute of Machine Tools and Production Technology (IWF), Sustainable Manufacturing and Life Cycle Engineering, Technische Universität Braunschweig, 38106 Braunschweig, Germany
2
Volkswagen AG, Berliner Ring 2, 38440 Wolfsburg, Germany
*
Author to whom correspondence should be addressed.
Sustainability 2023, 15(22), 15753; https://doi.org/10.3390/su152215753
Submission received: 16 August 2023 / Revised: 27 October 2023 / Accepted: 6 November 2023 / Published: 8 November 2023

Abstract

:
The automotive sector is a significant contributor to global carbon emissions and, as such, to climate change. However, there is currently no publicly available sector-wide insight into the extent to which Original Equipment Manufacturers (OEMs) in the automotive sector have implemented decarbonization strategies and carbon management activities. This paper addresses this issue by collecting and analyzing the implementation status of all OEMs with annual sales of more than 500,000 light-duty vehicles. For this purpose, a structured set of criteria is developed that allows conclusions to be drawn for several areas of corporate carbon management. The analysis shows a sector-wide implementation of decarbonization strategies and carbon management activities. However, significant regional differences in external communication, data transparency and methodological inconsistencies emerge. This study provides both academics and practitioners in the automotive industry with valuable insights into current reporting practices, target setting and communicated mitigation actions. On this basis, scientists can project possible greenhouse gas (GHG) emission pathways, align their research with the focus of practitioners to provide them with science-based data, and work on the methodological inconsistencies. Furthermore, the developed criteria provide a useful toolbox for the holistic analysis of other industries.

1. Introduction

Anthropogenic GHG emissions are a major contributor to climate change. According to unanimous scientific opinion, this is one of the most pressing issues, posing a severe threat to humanity [1]. To limit the effects of climate change, the international community largely ratified the 2015 Paris Agreement, committing themselves to the goal of limiting global warming by 2100 to a maximum of 2 °C [2]. In addition, the Intergovernmental Panel on Climate Change (IPCC) Special Report on the impacts of global warming of 1.5 °C further emphasized the need to increase efforts in climate protection [3]. Due to its high reliance on fossil fuels, the transport sector accounted for 37% of carbon emissions from end-use sectors in 2021, making it a major emission contributor [4]. Within the transport sector, road transport is the largest emitter, accounting for more than 76% of the total transport carbon emissions [5]. Despite the policies implemented worldwide to reduce carbon emissions from road transport, fulfilling this ambition is demanding due to the ongoing dependence on fossil fuels, a primary source of GHG emissions.
By producing and selling millions of passenger and light commercial vehicles, automotive OEMs contribute to a substantial share of transport related carbon emissions. The Volkswagen Group, for instance, published a statement in 2020 that their annual product emissions over the life cycle are responsible for more than 1% of global annual carbon emissions, exceeding the emissions of many European countries [6]. Due to the demand for more environmentally conscious products by internal and external stakeholders, OEMs have committed themselves to engaging in carbon emission reduction over the whole product life cycle. This begins with the definition of a corporate-wide decarbonization strategy, and consequently leads to its implementation via carbon management activities, namely carbon reporting, carbon reduction target setting, as well as the planning and implementation of carbon reduction measures [7]. However, until the establishment of the Science Based Targets initiative (SBTi) in 2015, corporate GHG emission targets were largely disconnected from the challenge of global decarbonization [8,9,10]. The main focus of their efforts were concerns like competitors’ targets or national climate policies [11,12]. With the establishment of the SBTi, however, the perspective has gradually changed towards a global scope [13]. To emphasize their commitment to the required overall emissions reduction, many automotive OEMs nowadays pledge to climate targets in line with the sector-specific carbon budgets of the transport sector. To achieve a “science-based” foundation for their reduction target, OEMs commit to align their activities in a manner consistent with the framework of diverse climate scenarios. For this purpose, the measurand of temperature alignment, indicating the degree of global temperature increase (1.5 °C, well-below 2 °C, or 2 °C) compared to preindustrial levels, is applied [14].
Nevertheless, the decarbonization strategies, carbon reduction targets and carbon reduction measures differ among the OEMs. Furthermore, they are published in several individual ways via company reports (e.g., sustainability reports), news on company websites or through external rating surveys (e.g., Carbon Disclosure Project (CDP)). So far, analyses of data from these different sources have focused on a small portion of the automotive sector, e.g., German OEMs or the biggest OEMs [15,16,17,18,19]. As a result, a holistic status quo analysis of OEMs’ decarbonization strategies and carbon management activities is missing. Our study addresses this issue by capturing and analyzing the status of decarbonization strategies, reporting activities, and reduction targets, as well as communicated reduction measures. Therefore, data for 29 OEMs from a variety of countries of origin with annual vehicle sales above 500,000 light-duty vehicles in the calendar year 2020 is analyzed. This includes, but is not limited to, insights regarding covered scopes in carbon reporting, ambition levels and SBTi certification in carbon reduction target setting, most commonly communicated carbon reduction measures and the identification of regional trends among all these.

2. Materials and Method

2.1. Theoretical Framework

In the following, the importance of reducing GHG emissions as part of the sustainability efforts of automotive OEMs is briefly outlined. Afterwards, the current state of research on carbon management and the operationalization of carbon reduction targets is described.

2.1.1. Corporate Decarbonization in the Automotive Industry

OEMs are currently facing a multitude of challenges because of regulatory requirements (e.g., EU fleet emission regulations), an increasing diversified market, and the powertrain technology change with the accompanying competition for raw materials [20,21]. To gain advantage, the development of a corporate decarbonization strategy and its implementation via corporate carbon management activities is essential. However, their form of implementation varies greatly [15]. To illustrate the spectrum of companies between a holistic penetration of the corporate strategy and a superficial preoccupation with the topic of decarbonization, a wide-ranging analysis is required.

2.1.2. Decarbonization Communication and Implementation

In the course of carbon reporting, the carbon emissions caused by the company are measured and evaluated in the context of carbon accounting [22]. To increase transparency and consistency when assessing their GHG inventory, companies from various industrial sectors use the GHG Protocol’s Corporate Accounting and Reporting Standard [23]. This does not limit the assessment of emissions to the direct sphere of influence of the company (scope 1 and 2 emissions), but also extends the horizon of consideration to all upstream and downstream emissions in the company’s value chain (scope 3 emissions) (According to the GHG Protocol’s Corporate Value Chain (Scope 3) Accounting and Reporting Standard, scope 3 emissions are further distinguished into 15 categories, namely “purchased goods and services” (scope 3 category 1), “capital goods” (scope 3 category 2), “fuel- and energy-related activities” (scope 3 category 3), “upstream transportation and distribution” (Scope 3 category 4), “waste generated in operations” (scope 3 category 5), “business travel” (scope 3 category 6), “employee commuting” (scope 3 category 7), “upstream leased assets” (scope 3 category 8), “downstream transportation and distribution” (scope 3 category 9), “processing of sold products” (scope 3 category 10), “use of sold products” (scope 3 category 11), “end-of-life treatment of sold products” (scope 3 category 12), “downstream leased assets” (scope 3 category 13), “franchises” (scope 3 category 14) and “investments” (scope 3 category 15) [24]. Note that in this paper, scope 3 category 1 will also be called “supply chain”, scope 3 categories 4 and 9 will be combined as “logistics” and scope 3 category 11 will additionally be named as “use phase”.). This holistic view of emissions in the context of the company under consideration enables the implementation of an effective strategy to manage and reduce GHG emissions. The publication of emissions, for example, via a sustainability report or ratings by relevant institutions such as the CDP, enables the public to gain an insight into absolute emissions and emission hotspots. An analysis of the scope 1–3 emissions of various automotive OEMs indicates that their major emissions are located in their supply chain (scope 3 category 1) and also indicates up- and downstream logistics (scope 3 categories 4 and 9) and use phase of their products (scope 3 category 11) [25]. Furthermore, reporting plays an important role in the internal view of the company, as it enables the status quo of the emissions caused by the company to be understood and establishes a starting point for further action, e.g., reduction target setting [17].
One way of giving targets a higher credibility is their certification by the SBTi. Science-based carbon reduction targets allow the company to show how much they need to decarbonize to be in line with climate scenarios of different ambition levels. The commitment to this, as well as external validation and tracking, is an essential part of the internal and external strategic direction. The SBTi is the most widespread corporate target tracking organization, with over 4500 targets submitted [26]. To operationalize the reduction targets set within the organization, the key element is the development and implementation of reduction measures. Essentially, three types of reduction measures can be distinguished here: (i) reductions through changes in the product portfolio (e.g., electrification of automobiles), (ii) measures in the direct scope 1–2 emissions (e.g., green electricity in vehicle production), and (iii) measures in the upstream and downstream value chains (e.g., procurement of materials with lower carbon footprints).

2.2. Methods

The research objective guided us towards a multicriterial analysis of the decarbonization implementation and communication of OEMs. On this basis, an analysis of the decarbonization strategies and their implementation via carbon emission reporting activities, carbon emission reduction targets and communicated reduction measures of multinational automotive manufacturers was carried out. This exploratory analysis is limited to the automotive activities of these corporations, which clearly dominate their business model, as well as their public perception.
The following analysis is based on a four-phase process. As a first step, a sample of OEMs to consider is created (see Section 2.2.1). For this, a filter criterion is defined, using global sales numbers as an indicator of relevance. After an OEM passes this criterion, accessible information on corporate GHG emission topics published before a predefined closing date are systematically searched and read (see Section 2.2.2). Based on the insights gained, a criteria set for a structured analysis of the status of decarbonization strategies and their implementation via carbon emission reporting activities, carbon emission reduction targets and communicated reduction measures in the automotive sector is developed (see Section 2.2.3). Thereupon, all scouted documents are re-read and the provided data are evaluated (see Section 3).

2.2.1. Sampling

For a comprehensive understanding of the status quo of decarbonization strategies and carbon management activities in the automotive industry, the OEMs considered were selected based on their official global vehicle sales statements. Following this, OEMs which sold at least 500,000 light-duty vehicles in the calendar year 2020 are considered. As light-duty vehicles, all motorized vehicles with four wheels aimed at the mobility of persons on all types of roads with up to nine persons per vehicle and 3.5 t of gross vehicle weight were considered, according to the definitions of the SBTi [14]. Thereby, 29 companies from a variety of countries of origin covering the regions of Asia, excluding China (10 OEMs), China (9 OEMs), Europe (7 OEMs) and the USA (3 OEMs) are included, as shown in Figure 1. Their total light-duty vehicle sales amounts to 83.8 Mio. Vehicles (this includes double countings due to the partly overlapping reporting schemes of the OEMs, e.g., in case of joint venture activities. The Volkswagen Group, for example, communicates its sales numbers including the Chinese joint ventures. SAIC, a Chinese joint venture partner of the Volkswagen Group, does the same. Subsequently, the vehicle sales of the VW-SAIC joint venture are reported twice. Since not all OEMs are completely transparent about their reporting schemes, the exact number of double countings cannot be quantified. According to the International Organization of Motor Vehicle Manufacturers, the global sales of all passenger cars and commercial vehicles (incl. trucks and buses) totaled roughly 79 Mio. vehicles in 2020 [27]), with all four regions being represented by OEMs, with a total sales number of at least 11 Mio. vehicles. This diverse sample allows conclusions to be drawn and compared on a global and regional level and allows recent developments and trends, as well as industry standards, to be analyzed.

2.2.2. Sustainability Reports and Other Sources of Information

The databases used include the annual reports, sustainability reports or combined reports of the OEMs or the organizations to which the automotive companies belong (e.g., the data of Mercedes-Benz Cars is part of the official publications of the Mercedes-Benz Group AG) [28,29,30,34,35,36,37,39,42,44,46,48,50,52,53,54,60,61,63,64,65,66,67,68,69,70,71,72,73,74,75,76,77,78,79,80,81,82,83,84,85,86]. All of these publications are publicly available; therefore, no confidential data were used. For reasons of comparability, the sustainability reports for the 2020 reporting year are analyzed, as the 2021 sustainability reports were not uniformly available at our deadline on 18 July 2022. For consistency reasons, claims, publications, or reinforced target submissions were not considered retrospectively.
Further, the publicly available data handed in to CDP are analyzed. Being the most prominent reporting scheme in this context, CDP has the most extensive collection of voluntarily reported carbon emission data [87]. To obtain the most up-to-date information on officially committed carbon reduction targets, the targets submitted via the SBTi are analyzed as well [26]. These only include OEM commitments already reviewed and confirmed by the SBTi. Targets submitted but not yet published are not communicated via the SBTi and can therefore not be considered. In addition, commitments to the SBTi Net-Zero target are considered. However, as there is no official transport sector target pathway from the SBTi for this ambition level yet, their feasibility, and thus also the requirement for them, is difficult to assess. Another direct source of information from the companies is formal announcements and notices via their corporate websites and other official channels.

2.2.3. Method of Analysis

To obtain a multidimensional evaluation of the OEMs’ efforts, the method of a multicriteria evaluation is applied. First, the decarbonization strategies of the OEMs are analyzed. Here, the focus is on the implementation of decarbonization within the company’s corporate strategy. This is conducted by analyzing the existence and extent of said aspect of implementation, as well the covered aspects via a defined criteria set, as depicted in Table 1, which is based on Sukitsch et al. (2015) [16].
Secondly, the quantitative statements of the automotive manufacturers are evaluated. Here, the carbon reporting is reviewed with regard to its presence and availability, the emissions covered (direct and indirect), and the application of and references to established standards such as the GHG protocol [88]. Furthermore, the carbon reduction statements and officially announced targets of the OEMs are analyzed. Here, the following criteria are covered: covered scope, target ambition level, SBTi certification, timeframe (base and target year) and the availability of base year data and whether the application of compensation measures is considered for target achievement. In addition, the carbon reduction measures considered by the OEMs in terms of the amount and scope of planned measures, as well as specific statements considering the product portfolio changes justified by their decarbonization effect, are evaluated.
Table 1. Criteria set applied for the analyzation of OEMs’ decarbonization in this study.
CategoriesCriteriaAspects of Evaluation
Decarbonization strategySustainability reportingExistence of sustainability report/joint report/environmental, social und governance (ESG) report or corporate social responsibility (CSR) report
Implementation within the companyEnvironmental management/policy: decarbonization vision, strategy, (goal and target)
Integration: steering committees,
responsibility tools: environmental management system (EMS) and ISO 14001 [89]
Management controlKey facts and data/assessment and indicators: Global Reporting Initiative (GRI), key figures, life cycle assessment, key performance indicators, supplier decarbonization engagement, scorecard
Carbon reportingReporting practiceExistence of carbon reporting
Reporting scopeReporting of direct (scope 1 and 2) emissions, reporting of indirect (scope 3) emissions, reported scope 3 categories
Calculation standardStandard(s) used for scope 1–3 emission calculations
Carbon reduction targetsTarget settingExistence of carbon reduction targets
Target characteristicAbsolute target (incl. carbon neutrality target), relative target
SBTi certificationTarget certification by SBTi
Target ambitionAmbition level
ScopeScope 1 and 2, scope 3, scope 3 categories
TimeframeBase year, target year
TransparencyAvailability of base year data
Carbon reduction measuresScope of reduction measuresReduction measures in scope 1 and 2, scope 3, scope 3 categories
Form of reduction measuresIndividual reduction measures according to frequency

3. Results

In the following, the OEMs’ decarbonization strategies are analyzed before comparing their carbon reporting. Furthermore, carbon reduction targets are compared, as well as the measures planned by the automotive manufacturers to achieve them. Furthermore, an overview of results is provided in this section, offering the possibility of comparing the OEMs with each other.

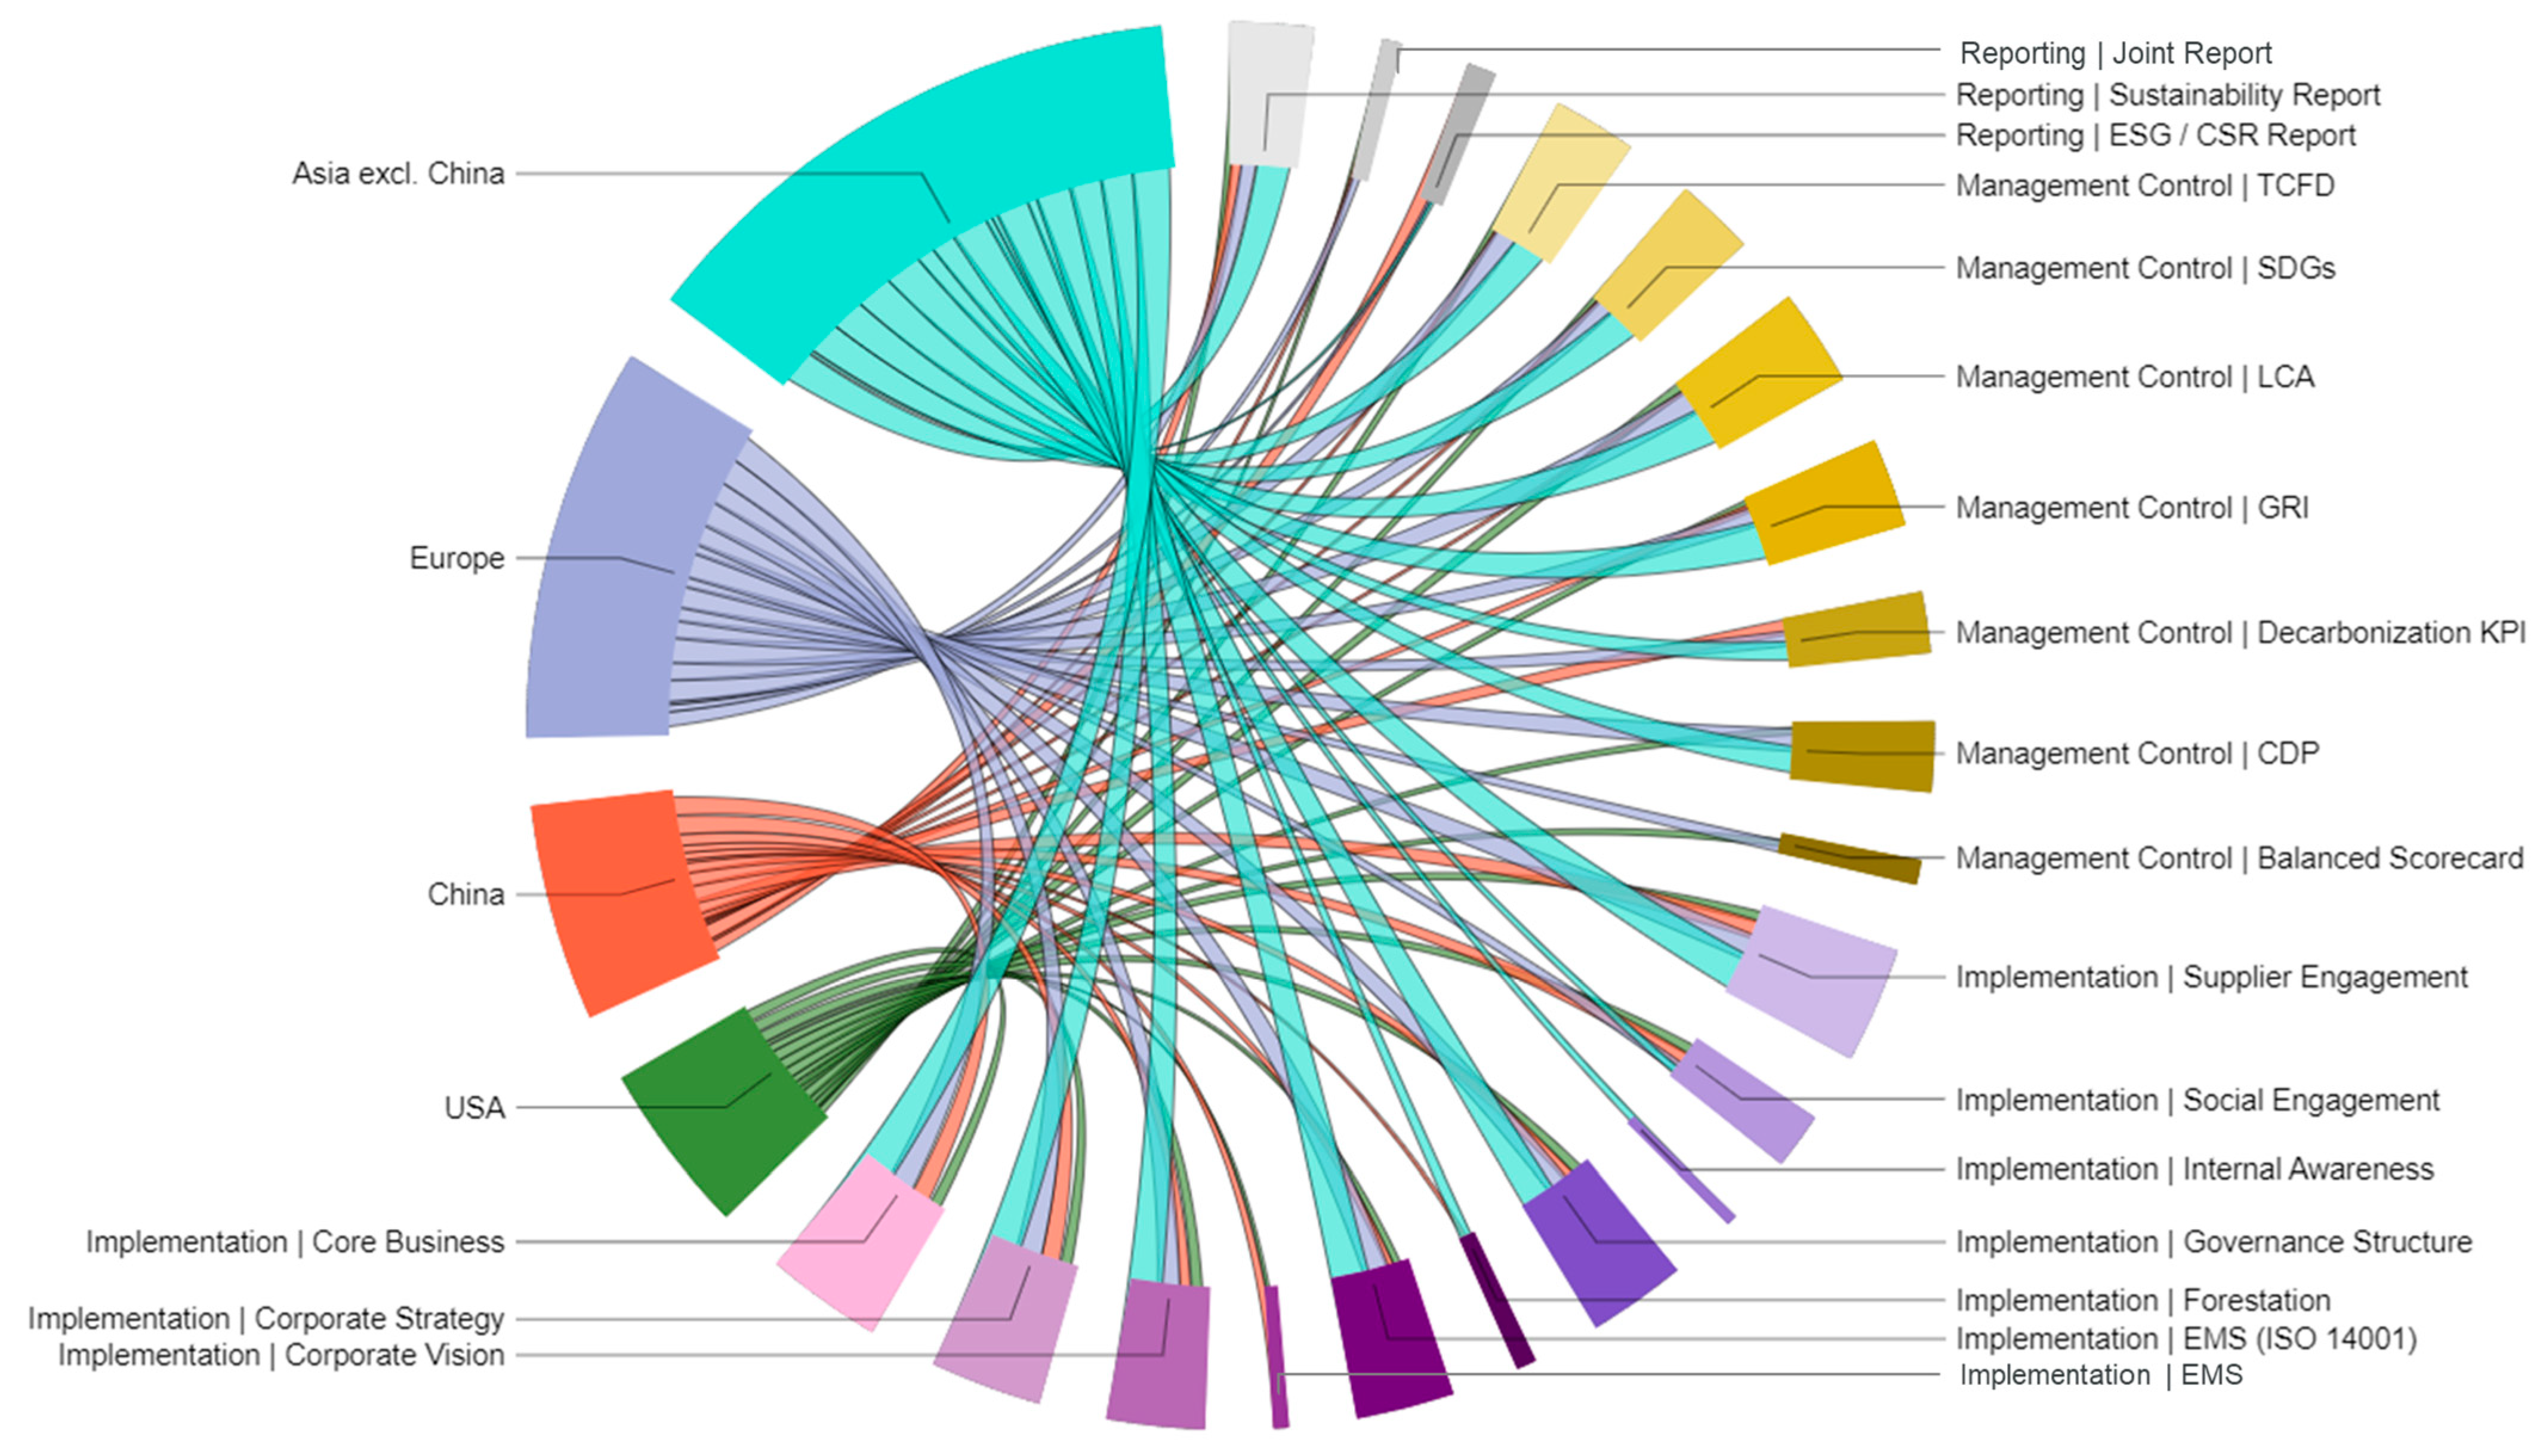
3.1. Comparison of Decarbonization Strategies

First, available information from the OEMs studied is analyzed with regard to decarbonization strategies and evaluated according to the defined criteria and aspects, as shown in Figure 2.
In order to compare the decarbonization efforts of OEMs, access to public data are of utmost importance. Access is mostly given in the form of company reporting. In the analysis of the 29 OEMs, it was found that 18 publish a specific sustainability report, which in most cases focuses strongly on the topic of decarbonization. Three OEMs each publish an environmental, social and governance (ESG) or (corporate social responsibility) CSR report. It is noticeable here that—apart from one European car manufacturer—these are exclusively Asian OEMs. Four other OEMs published so-called joint reports, in which both the annual financial report and sustainability-related key figures can be found. One Chinese manufacturer did not publish any specific sustainability report for the 2020 reporting year. The sustainability reports of the Chinese OEMs Chery Automobile Company Limited, China FAW Group Corporation Limited and SAIC Motor Corporation Limited could only be found in the Chinese language and therefore could not be evaluated.
In order to assess the implementation of decarbonization efforts within the OEMs considered, first the internal management and policy are analyzed. Therefore, the OEMs’ sustainability visions are evaluated. Among the companies considered, 14 have published explicit visions of their decarbonization efforts. A further seven refer indirectly to sustainability in their corporate visions.
Of the 25 OEMs that could be evaluated, 24 have already formulated a specific corporate decarbonization strategy. Apart from two OEMs, all of them refer to climate change and the resulting need to decarbonize their products. Only in the CSR report of an Indian OEM could no corporate decarbonization strategy be identified. The evaluation of specific decarbonization goals and targets has been given its own sub-chapter (see Section 3.3).
Concerning the integration of decarbonization into the management process, it was possible to find a detailed description of the sustainability governance structure for 19 OEMs. In all cases, this included the board of directors and specialized decarbonization teams of the company. Toyota Motor Corporation and Tesla Incorporated describe the existence of a committee in their reports, but unlike the other OEMs, no detailed description or organigram could be found. Only a single OEM does not mention any environmental management structures at all. Regarding the standardization of an environmental management system (EMS), it can be stated that 22 of the OEMs examined have an EMS in accordance with the ISO 14001 standard, 6 of which are striving for this or are already making it a requirement for suppliers to also be certified in accordance with ISO 14001 [89]. Three other OEMs mention an EMS, but do not refer to the common ISO standard.
Regarding management control, the standards used and the published data and facts are analyzed. In their published reports, 20 of the 28 publishing OEMs refer to compliance with the Global Reporting Initiative guidelines in the composition of their reports. Furthermore, 18 of the OEMs refer to the TCFD standard and therefore also consider climate-related information in their financial filings. Additionally, about half of the companies examined (15 out of 29) refer to the CDP in their reports and, thus, create transparency with the publication of their emission data. With the exception of the Chinese companies, OEMs from Asia, Europe and the USA are represented here. Moreover, 18 of the automotive manufacturers refer to the UN’s Sustainable Development Goals (SDGs). Among other things, they use these to direct their activities toward climate protection. In order to track their progress towards meeting (self-imposed) decarbonization targets, 45% (13 out of the 29 companies considered) refer to a key performance indicator (KPI) tracking their respective emissions. These comprise three manufacturers from Europe, as well as nine Asian automotive OEMs. To make their strategic decarbonization goals and metrics visible in a simple way, five of the OEMs additionally use sustainability-based scorecards (three European and two USA-based OEMs).
Almost 72% of the OEMs (21 out of 29) surveyed disclose life cycle assessments (LCA) as a tool to determine the environmental impact of their products. This includes all of the European, American and non-Chinese Asian manufacturers surveyed. With regard to the Chinese OEMs, it is striking that only one OEM reports using LCAs as a tool for determining emissions. In addition, it is worth noting that each of the automotive companies included in the analysis have taken their suppliers to task on the issue of decarbonization, which underscores the importance of the automotive supply chain in this issue.

3.2. Carbon Reporting in the Automotive Industry

Our analysis of the reporting practice shows that 24 of the 29 analyzed OEMs reported their scope 1 and 2 and/or scope 3 GHG emissions for the year 2020, as shown in Figure 3. This includes all considered manufacturers from Europe and Asia, excluding China. Out of nine Chinese car producers, only five did report these numbers. Of the three US-based OEMs, one did not report their scope 1 and 2 and/or scope 3 GHG emissions.
If an OEM has carbon reporting in place, it always covers at least their scope 1 and 2 emissions. With regard to scope 3 emissions, not a single Chinese car manufacturer published data. All remaining OEMs (19) provide information on their scope 3 emissions to a certain extent. Four companies reported a total scope 3 number covering several scope 3 categories. One of them does not additionally provide data on individual scope 3 categories. Thus, 18 OEMs separately report their scope 3 category emissions. In their case, the most frequently addressed categories are category 11, with 17 car manufacturers reporting on this category, and categories 1, 4 and 9, with 16 OEMs reporting on them each. Categories 10 and 15 were separately reported in three cases, the lowest amount of all scopes. Only one OEM separately reported GHG emissions for scope 1 and 2 and all scope 3 categories. Even though a car manufacturer reports their scope 1 and 2 and/or scope 3 GHG emissions, information on which calculation standards were used is not always given. Only 18 from the 24 OEMs with a carbon reporting in place referred to it. The most frequent standard used is the GHG Protocol. Fifteen companies mentioned this calculation standard in their reports. This follows the ISO 14040/44 standards (ISO 14040:2006 describes the principles and framework for life cycle assessment (LCA) [90]. ISO 14044:2006 specifies requirements and provides guidelines for life cycle assessment (LCA) [91]) with five mentions and the EN 16258 standard (EN 16258:2012 establishes a common methodology for the calculation and declaration of energy consumption and GHG emissions related to any transport service. It applies for passenger and freight transport services [92].) with three mentions.
The GHG Protocol is especially common in Europe and the USA. All reporting European and US-based car manufacturers refer to this standard. In contrast, the ISO 14040/44 standards are only mentioned by OEMs located in Germany or France. Furthermore, many different local standards are used in Asia including China and the USA.

3.3. Carbon Reduction Targets

For 8 of the 29 OEMs analyzed, no carbon reduction targets could be identified in their 2020 reports or via SBTi, as shown in Figure 4. This includes six Chinese car manufacturers (67% of all Chinese OEMs analyzed), of which three published their data in Chinese language only (see Section 3.1), one European company (14% of all European OEMs analyzed) and one from the USA (33% of all US-based OEMs analyzed). For the other 21 OEMs, a total of 99 carbon reduction targets were identified. These include 44 relative reduction targets and 55 absolute reduction targets, of which 22 are carbon neutrality targets. A total of 19 targets have been certified by the SBTi, of which six targets fulfill a 1.5 °C ambition, nine targets fulfill a well-below 2 °C ambition and the remaining four fulfill a 2 °C ambition.
More than half (52) of the identified carbon reduction targets include the scope 1 and 2 emissions of a car manufacturer. A total of 18 different OEMs cover this scope with their targets. With regard to scope 3 emissions, the most frequently addressed categories are category 11, with 41 targets from 17 OEMs, categories 4 and 9, with 19 targets from 9 OEMs and category 1, with 12 targets from 7 OEMs. Not explicitly addressed by carbon reduction targets are the scope 3 categories 2, 3, 5, 8 and 15.
Nevertheless, six communicated carbon neutrality targets give the impression to cover all scopes and categories. The other 16 carbon neutrality targets include at least scope 1 and 2. Some of them have an extended scope, additionally covering one or more scope 3 categories, e.g., scope 3 category 1, category 4, category 9 or category 11.
When looking at the ratio of absolute and relative reduction targets, it can be seen that in the case of scope 1 and 2, there is a higher number of absolute targets implemented. Conversely, for scope 3 category 11, there is a higher number of relative reduction targets communicated. In other categories like scope 3 category 1 and scope 3 categories 4 and 9, a more balanced picture can be identified.
If an OEM develops a carbon reduction target, they do not only have to decide on the scope and characteristic (e.g., absolute or relative) of the target, but also have to decide which base year to take as a starting point and which target year to focus on for achieving the aspired reduction. The following figure, Figure 5, gives an overview of the chosen base years and target years for the identified carbon reduction targets. With regard to the chosen base years, a wide range can be seen. The OEM choices reach from 2000 to 2020, with three peaks in 2010 (16 targets by 8 OEMs), 2018 (14 targets by 7 OEMs) and 2019 (13 targets by 4 OEMs). Furthermore, regional differences can be identified. Whilst in Asia, excluding China, mostly earlier years have been chosen as a base year, European and US-based car manufacturers tend to use later base years.
Concerning target years, most OEMs aim for a target of 2025 (17 targets by 6 OEMs) and 2030 (31 targets by 13 OEMs) or a target of 2050 (17 targets by 11 OEMs). Again, regional differences can be seen. Whilst it seems like European car manufacturers set their focus currently more on the near future, with a high number of targets for 2025 and 2030, the companies from Asia, excluding China, have already announced a high number of targets, not only for the near term but for the long term as well. Between these two are the US-based OEMs, which mainly aim for carbon reductions until 2035.
When looking at the target years chosen for the OEMs carbon neutrality targets a trend towards a long-term target setting can be seen. Whilst five targets have been set in the timeframe 2020–2030, an increasing number of carbon neutrality targets focus on 2030–2040 (7) or 2050 (8). One Chinese car manufacturer chose to follow the Chinese governmental ambitions, and thus focuses on a carbon neutrality target of 2060. Additionally, it can be noted that all carbon neutrality targets until 2035 completely focus on scope 1 and 2, whereas from target year 2039 onwards, certain carbon neutrality targets have an extended scope, including one or more scope 3 categories. A closer look at the target years furthermore reveals the aim of certain OEMs to act as front runners. This can be seen as, e.g., due to the existence of carbon reduction targets for the years 2034 and 2039, each one year ahead of a small peak of targets in 2035 and 2040.

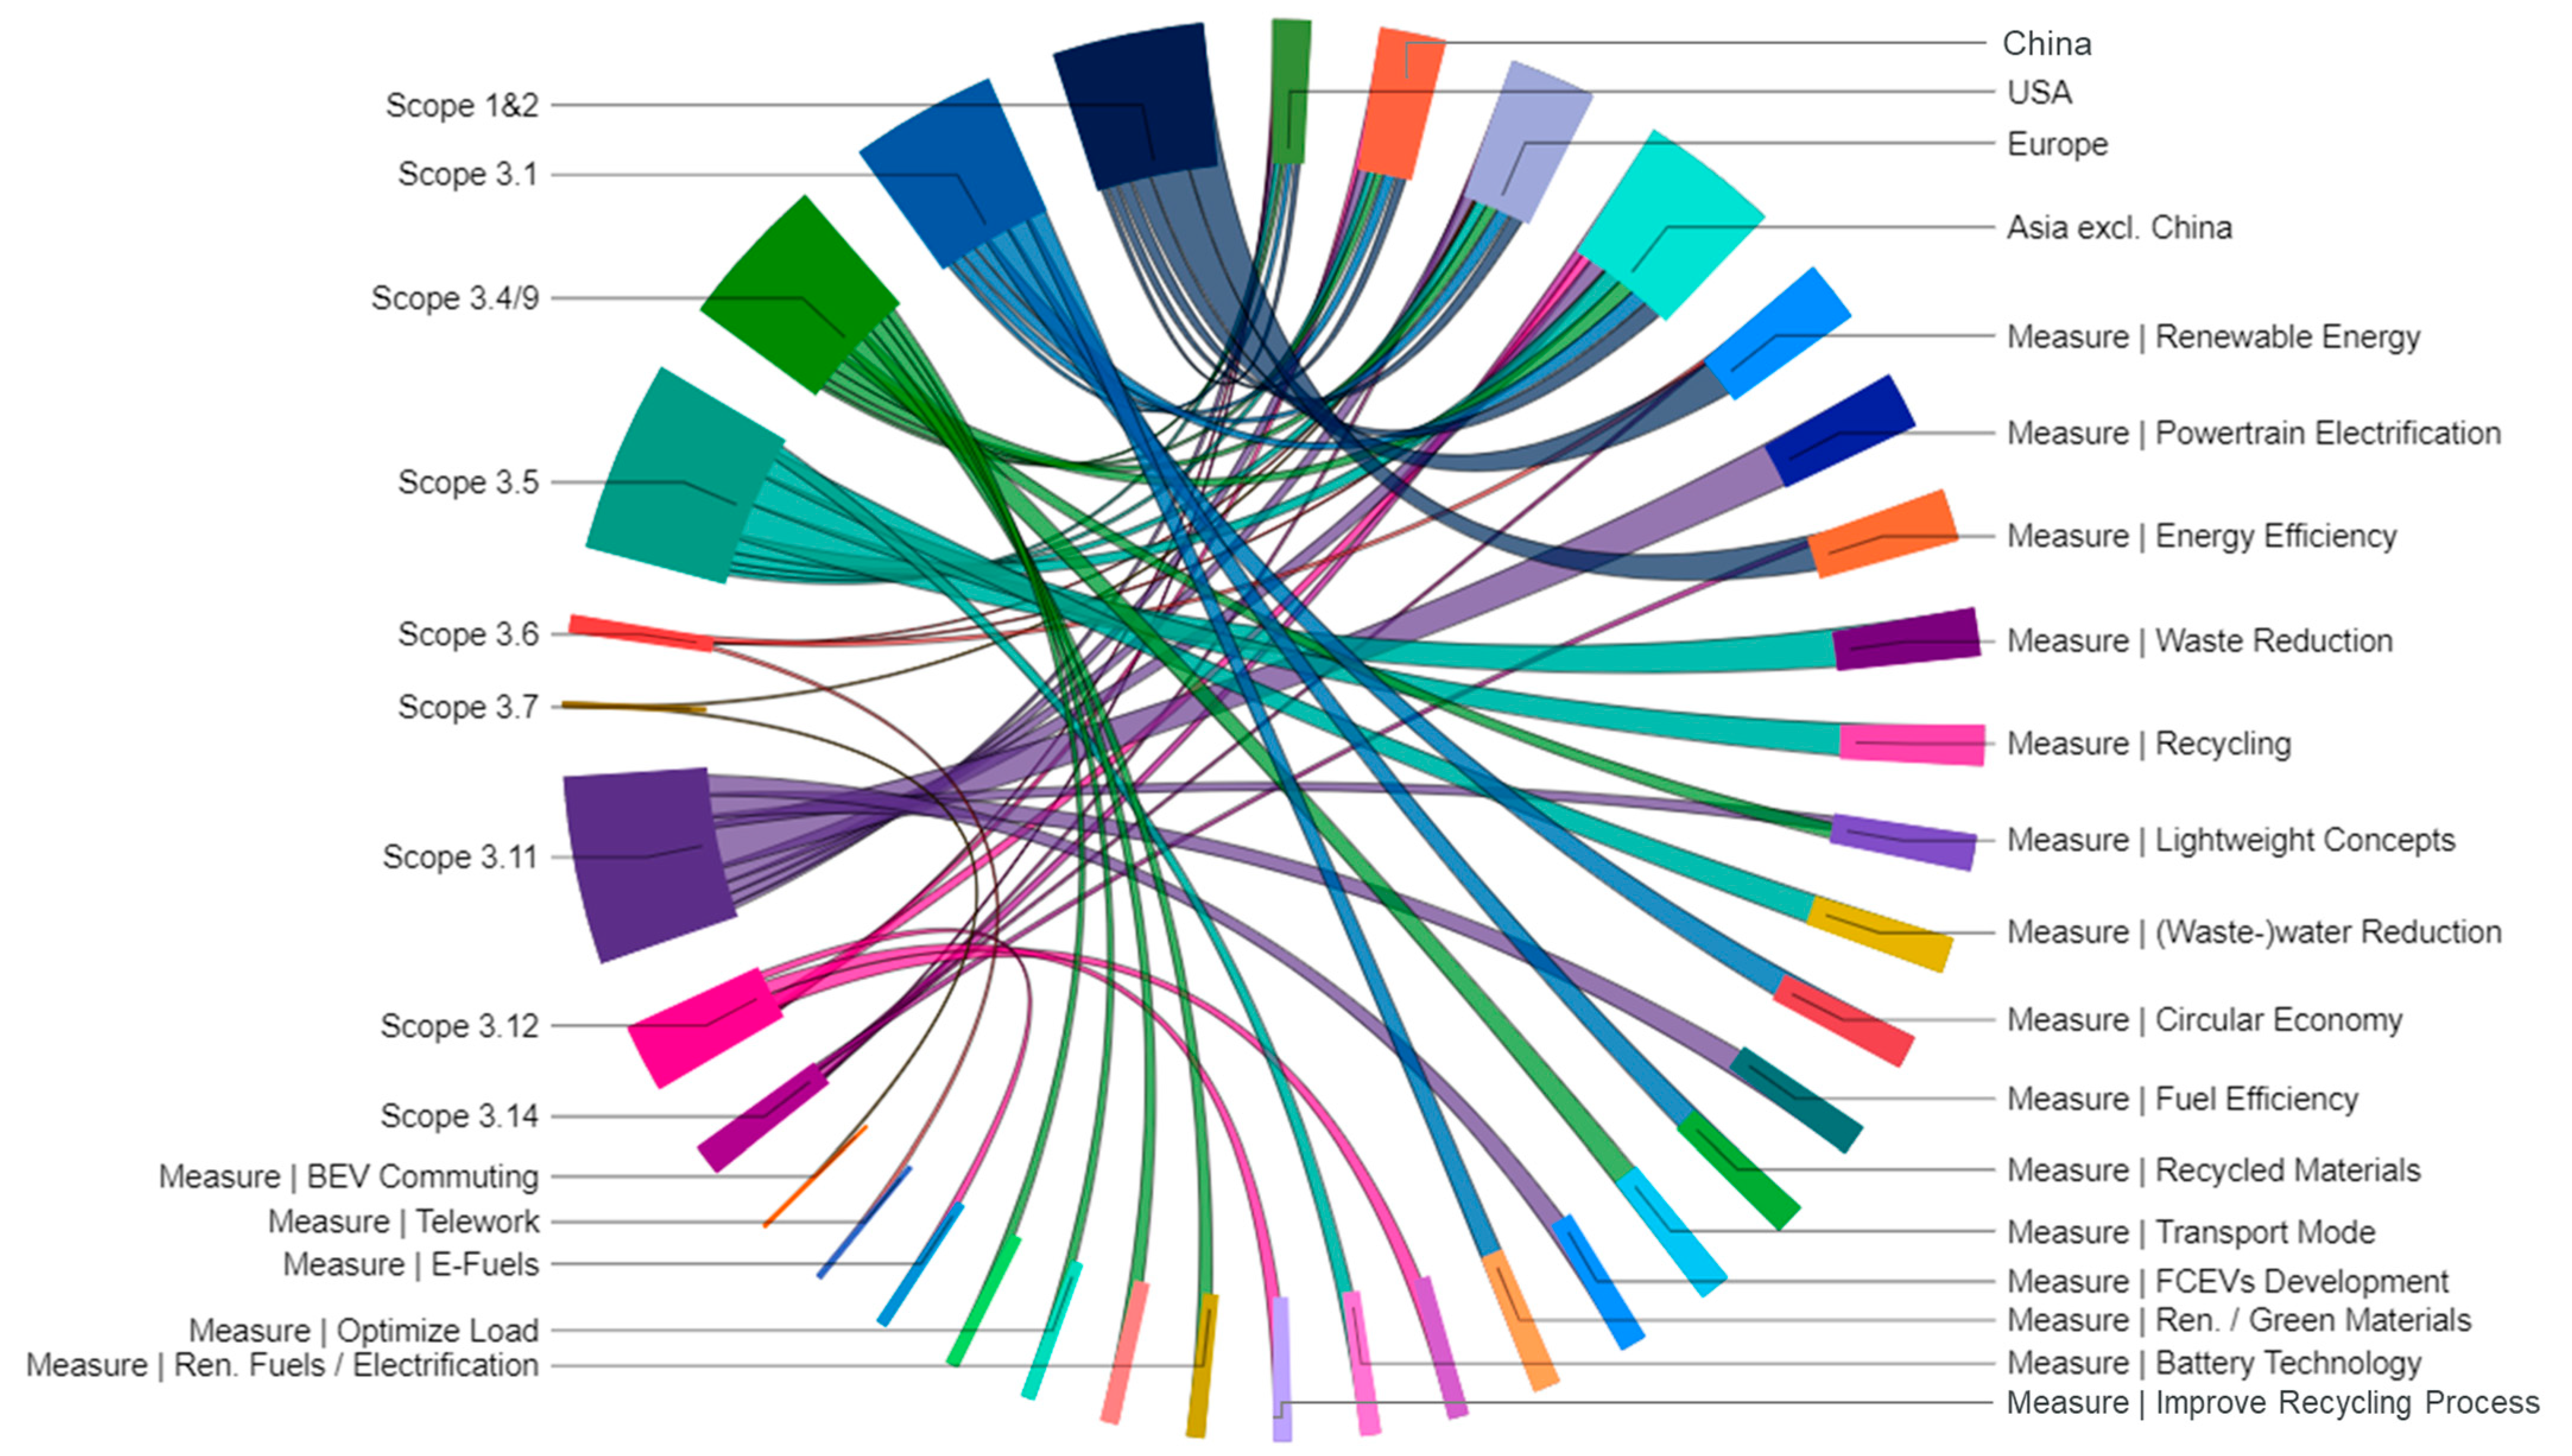
3.4. Comparison of Carbon Reduction Measures

In the following, the reduction measures planned by the OEMs investigated and communicated via official channels are evaluated, as can be seen in Figure 6.
The evaluation considers regional differences and the emission category on which the measures have an effect. As in Section 3.1, it was possible to evaluate 26 of the 29 reports. Of those, all but one automotive manufacturer has planned measures for their direct scope 1 and 2 emissions. Here, the focus is on the use of renewable energies in the manufacturing stage (21 out of 26), as well as the reduction in the energy demand—for example, through efficiency measures (19).
In the area of scope 3 category 1 emissions, it is striking that a variety of measures is described. Many OEMs mention striving for a circular economy (14) and the use of recycled materials (13). Here, there is particular emphasis on non-Chinese OEMs. Furthermore, the use of renewable/green materials (11) and the promotion of lightweight concepts (8) are among the OEMs’ main concerns. However, none of the automotive corporations based in the USA mentions lightweight concepts.
Logistics (scope 3 categories 4 and 9) were assigned with measures by a total of 21 of the OEMs. The focus of the measures is on the change of transport mode (13), the use of renewable fuels and the electrification of the means of transport (7). Other measures mentioned include the recycling of packaging materials (7), optimized loading and the shortening of transport routes (both 5). In the area of waste emissions (scope 3 category 5), 20 of the OEMs mention reducing the total amount of waste as a measure. As many as 17 of the automotive manufacturers want to improve the recycling of their waste. The reduction in water consumption and wastewater is mentioned by 15 OEMs. Two of the companies surveyed increasingly used teleworking and online conferencing to reduce their business travel (scope 3 category 6) emissions. One OEM mentions the increased use of BEV and PHEV vehicles for employee commuting (scope 3 category 7) as a measure.
Another focus of reduction measures can be identified in the most emission-intensive area, the use phase (scope 3 category 11). All OEMs surveyed specified measures in this area. The emphasis here is on the composition of the portfolio. Thus, 24 of the automotive companies monitored are endeavoring to intensify the focus on the electrification through battery electric vehicles (BEVs) of their product range. The use of fuel cell electric vehicles (FCEVs) was mentioned by 11 of the OEMs, of which 9 are from Asia. Other measures mentioned include improving ICE fuel efficiency (13) and working on lightweight concepts (11). Another four automotive companies are considering adopting e-fuels.
In the end-of-life phase (scope 3 category 12), the companies mentioned battery recycling (8) and a general improvement of the recycling process (7). However, no measure from a European OEM could be identified. In addition, emission reduction through energy reduction and efficiency measures (3) and the use of renewable energies (2) are mentioned in the area of franchises (scope 3 category 14) by OEMs from all regions observed except China. None of the OEMs addressed scope 3 categories 2, 3 and 8 (capital goods and fuel and energy-related activities, leased assets) and categories 13 and 15 (end-of-life treatment of sold products and investments) with the implementation or promotion of reduction measures.

4. Discussion

This paper presents a novel structured approach towards analyzing and comparing corporate carbon strategies and management activities in the global automotive industry based on a developed set of criteria. The previously presented findings from its application are discussed in the following.

4.1. Decarbonization Strategies

With one exception, all 29 investigated corporations are reporting on sustainability; however, regional differences in their reporting format are identified. Whereas OEMs from Europe and USA favor publishing a sustainability report or a joint annual and sustainability report, it is far more common in Asia to publish information in the form of CSR or ESG reports. Regardless of their form of publication, the overwhelming majority of OEMs show their dedication to decarbonization through the formulation of a corporate decarbonization strategy with a focus on the reduction in product-related GHG emissions. More than half of all reports that could be analyzed even included corporate visions, including statements about sustainability, which underlines the extent to which this topic has now arrived in the automotive industry, especially in Europe and non-Chinese Asia. Nevertheless, the findings of Sukitsch et al. (2015) persist that despite the existing awareness on the part of automotive companies, the implementation of strategic measures is not uniform across the industry [16]. Further, the majority of OEMs are also taking internal management measures in the form of a sustainability governance structure, the establishment of specialized teams and the establishment of key performance indicators. This supports the research of Brammer et al. (2012), as the issue of sustainability has already been institutionalized through integration into the corporate management structure [93].
This is endorsed by the spread of international reporting standards such as the Global Reporting Initiative (GRI) and Task Force on Climate-Related Financial Disclosures (TCFD) [94,95]. In addition to the comparability of data and key figures, this also supports external transparency. In the case of the disclosure of carbon emissions within the framework of the CDP, however, regional differences become apparent, as it becomes clear that this form of transparency is not widespread for Chinese automotive manufacturers.

4.2. Carbon Reporting

In terms of carbon reporting, a high number of OEMs publish information on their scope 1 and 2 and/or scope 3 GHG emissions. This is especially true for car manufacturers from Europe and Asia, excluding China, where carbon reporting and its external communication is common practice. In contrast, their Chinese competitors are somewhat more reticent about such external reporting. Only half of the analyzed Chinese OEMs publish carbon emission data, which, additionally, only focuses on their scope 1 and 2 emissions. Due to this, it remains unclear how well-established the decarbonization topic is among Chinese OEMs. Due to their high market share, this poses a risk for the whole sector’s decarbonization pace. Furthermore, this reticence could poses the risk of conflicts with other car manufacturers from, e.g., Europe in joint venture activities when it comes to data exchanges and carbon reduction target setting.
Since all OEMs with an active carbon reporting publish their scope 1 and 2 emissions, this can be seen as a first step into an extended scope 1–3 emission reporting. The latter is currently not fully established, since only 18 out of 29 car manufacturers separately report their scope 3 category emissions. In the case of extended scope 1–3 emission reporting, the OEMs seem to follow a hotspot approach initially focusing on major scope 3 emission contributors in terms of category 1, category 4, category 9 and category 11 [25]. Other scope 3 categories with a lower relevance are neglected in most cases. Since only one car company is separately reporting GHG emissions for scope 1 and 2 and all scope 3 categories, there is still room for improvements with regard to carbon reporting in the automotive industry. The same applies for the calculation standards used for scope 1–3 emission calculations. Only a few OEMs provide information about it. Furthermore, many different international and even local standards are used. This is an issue, especially for comparisons of emission data between different companies. A possible reason for the restraint could be pending legislation. For example, the End-of-Life Vehicles Directive is still undecided in the EU [96]. In China, standards on the carbon foot printing of vehicles will soon be introduced [97]. This could lead OEMs to be cautious about publishing information about the calculation standards used for the time being. However, for reasons of comparability, higher data transparency and methodological harmonization across all regions would be helpful for a better comparison and interpretation of the data. This would also enhance the significance of scientific studies on the status of decarbonization.

4.3. Carbon Reduction Targets

Based on the regional variations in the presence of carbon reduction targets, a relationship between active carbon reporting and the announcement of carbon reduction targets is evident. This is logical, since it is only prudent for a company to establish a carbon reduction goal after obtaining dependable data on its carbon emissions.
Another similarity between reporting and targeting can be seen in terms of scopes covered. Since over half of the identified carbon reduction targets incorporate scope 1 and 2 emissions, creating a scope 1 and 2 reduction target can be considered an initial step for companies before expanding their scope to indirect emissions. In particular, absolute reduction targets for scope 1 and 2 are set according to the predefined logic of the SBTi [14]. For scope 3 targeting, OEMs again seem to follow a hotspot approach focusing on major scope 3 categories 1, 4 and 9 and 11 initially [25]. However, in the case of scope 3 category 1 emissions, carbon reductions are not that straightforward. Here, an OEM has to engage many different suppliers within its complex supply chain before carbon reductions can take place [98]. Consequently, scope 3 category 1 is not as often targeted than addressed in carbon reporting.
Whereas for scope 3 category 1 and scope 3 categories 4 and 9 a balanced picture between absolute and relative targets was identified, for scope 3 category 11 a higher number of relative reduction targets is communicated. A reason for this could be the logic of national fleet regulations, which often use relative units, e.g., g CO2/km. Subsequently, a relative carbon reduction target allows an OEM to more easily incorporate future national fleet emission limits into its carbon management. Furthermore, the SBTi targeting logic presupposes a relative reduction target for scope 3 targets [14]. The different target setting logics for different types of emissions (direct and indirect emissions), even within the same company, make it difficult to analyze and compare data from an external perspective and can lead to misinterpretation if not clearly communicated by the car manufacturer concerned.
The lack of transparency about the level of ambition of a published carbon reduction target is another issue for external analysts. Here, a certification via the SBTi is helpful, since this includes a commitment to align target-related activities in a manner consistent with the respective climate scenario. Focusing on the targets certified by the SBTi, the majority of car manufacturers are aiming for a limitation of temperature rise well below 2 °C. However, only a small number of OEMs carbon reduction targets have gone through this process. Subsequently, for the majority of publicly available targets no information about aimed ambition levels is obtainable. This leaves the question of which decarbonization pathway the whole automotive sector is and, consequently, which sectoral GHG budget can be met.
With regard to the chosen base years, big ranges with regional differences were identified. For external scientists, these differences hinder a comparison of carbon reduction targets between OEMs. Currently, the only way to compare them would be a manual recalculation of the targets of a unified base year. But, due to the low availability of base year data, this is not always feasible. For this purpose, a higher data transparency would be helpful. Since the analysis has shown a higher base year data availability for SBTi-certified carbon reduction targets, one step towards a higher transparency could be a higher share of these. Nevertheless, the current SBTi targeting logic does not include a sector-wide harmonized base year. Here, a methodological harmonization would be helpful.
There are also regional differences in the choice of target years. In general, both European and Asian automakers are targeting carbon reductions in the short and long term. However, all European targets for 2050 are carbon neutrality targets, mostly covering several scopes/categories, which is in line with the European Green Deal aiming to make Europe climate neutral by 2050 [99]. Asian companies, however, set many targets covering individual categories, resulting in a higher number of targets in later years. Concerning public ambition communication, the analyzed data have revealed the aim of certain OEMs to act as front runners, and thus to be faster than the others. This can be interpreted as a sign of the importance of carbon reduction targets as communication instruments for stakeholders. Outpacing the competitors in terms of carbon reductions seems to be an incentive to aim to reach a certain emission level earlier. These differences in target ambitions and communication again make it difficult to compare targets.

4.4. Carbon Reduction Measures

With regard to the reduction measures, it is clear that the scopes or categories, in particular, are assigned measures that also have explicit targets. Here, the focus is particularly on the area of direct emissions by the companies (scope 1 and 2), as well as the scope 3 categories of the supply chain, logistics and the use phase. When taking a broader look at the planned measures, it becomes clear that these are highly dependent on the development of related sectors. For example, the further increasing transition to renewable energies plays a significant role in the plans to reduce their scope 1 and 2 emissions, and is even more relevant for scope 3 emissions. The situation is similar with regard to the reduction in their use phase emissions. The envisaged change in propulsion technology (from ICEs to electronically powered vehicles) increases the dependence on developments in the electricity sector. This applies equally to BEVs and to the discussed introduction of FCEVs by Asian OEMs. Possible complementary measures, such as the introduction of renewable fuels on the market, play at best a secondary role in the decarbonization strategies of the global automotive industry. Electricity from renewable sources also plays a huge role in the reduction plans in corporate supply chains, with the use of renewable energies in raw material production, or the reduction in franchise emissions through the use of renewable energies use in the retail outlets.
Furthermore, recycling measures continue to gain in importance. A large number of the companies surveyed are working on the integration of circular economy measures and the increased use of recovered materials. In addition to a reduced dependence on the materials sector, circular economy measures also have the potential for significant carbon emission reductions, as stated by Patel and Singh (2023) [100]. Furthermore, various measures, such as the development of new battery technologies or the promotion of renewable materials, support the assumption that sustainability has also been incorporated into the development processes of OEMs and their supply chain [101,102]. This highlights the decarbonization potential and importance of these emissions, as identified by Fugger et al. (2023) [25].

5. Conclusions

In this article, a meta-analytical technique to capture and analyze the current status of decarbonization strategies and carbon management activities in the automotive sector is applied. Unlike existing studies, it covers several strategic and operational points of attention, within the categories “decarbonization strategy”, “carbon reporting”, “carbon reduction targets” and “carbon reduction measures”. This study undoubtedly represents the broadest insight into the current status of the topic of decarbonization in the light-duty vehicle industry, covering a vast number of car manufacturers across the globe. With our analysis, it was unveiled that the decarbonization topic is widely implemented into OEM strategies and business activities. Regular carbon reporting, predominantly following the GHG Protocol, and an implementation of a decarbonization strategy and carbon reduction measures combined with a carbon reduction target setting are common practice.
However, a gap in industry-wide harmonization can also be identified. For example, regional differences are apparent with regard to the communication of carbon emission data. Additionally, from a scientist’s perspective, a higher data transparency and methodological harmonization across all regions would be helpful. Different ways of publishing decarbonization information, different target characteristics, a diverse base year setting, the use of several local calculation standards and an untransparent carbon emission calculation lead to an overall limited accessibility and comparability of data. This results in a restricted predictability of the decarbonization pace of the industry. Thus, a sector-wide forecast based on the information gathered and enriched with different scenarios of future developments in coupled sectors is a next logical step to provide a more comprehensive indication of OEMs’ emission targets.
Furthermore, this also highlights the importance of multi-stakeholder initiatives like the GHG Protocol or SBTi. Their harmonization and standardization efforts bring benefits not only for the credibility of published OEMs’ decarbonization information, but also for external scientists, who profit from transparent and comparable data for their analyses. However, our analysis has shown that further harmonization efforts would be helpful.
Overall, decarbonization in the automotive sector is on a solid footing, with regional differences.

Author Contributions

Conceptualization, J.P. and T.F.; methodology, J.P. and T.F.; validation, J.P. and T.F.; formal analysis, J.P. and T.F.; investigation, J.P. and T.F.; resources, J.P. and T.F.; data curation, J.P. and T.F.; writing—original draft preparation, J.P. and T.F.; writing—review and editing, J.P., T.F. and C.H.; visualization, J.P. and T.F.; supervision, C.H. All authors have read and agreed to the published version of the manuscript.

Funding

This research received no external funding.

Institutional Review Board Statement

Not applicable.

Informed Consent Statement

Not applicable.

Data Availability Statement

Data are available on request from the corresponding author due to restrictions, e.g., privacy or ethical. The data are not publicly available due to confidential information.

Conflicts of Interest

The authors declare no conflict of interest. The results, opinions and conclusions expressed in this paper are not necessarily those of Volkswagen AG.

Abbreviations

BEV—battery electric vehicle; CDP—Carbon Disclosure Project; CSR—corporate social responsibility; EMS—environmental management system; ESG—environmental, social and governance; FCEV—fuel cell electric vehicle; GHG—greenhouse gas; GRI—Global Reporting Initiative; ICE—internal combustion engine vehicle; IPCC—Intergovernmental Panel on Climate Change; OEM—Original Equipment Manufacturer; SBTi—Science-based Targets initiative; TCFD—Task Force on Climate-related Financial Disclosures.

References

  1. Li, B.; Gasser, T.; Ciais, P.; Piao, S.; Tao, S.; Balkanski, Y.; Hauglustaine, D.; Boisier, J.-P.; Chen, Z.; Huang, M.; et al. The Contribution of China’s Emissions to Global Climate Forcing. Nature 2016, 531, 357–361. [Google Scholar] [CrossRef] [PubMed]
  2. United Nations. Adoption of the Paris Agreement—Framework Convention on Climate Change. In Proceedings of the 21st Conference of the Parties, Paris, France, 30 November–11 December 2015. [Google Scholar]
  3. Masson-Delmotte, V.; Pörtner, H.-O.; Skea, J.; Zhai, P.; Roberts, D.; Shukla, P.R.; Pirani, A.; Pidcock, R.; Chen, Y.; Lonnoy, E.; et al. Global Warming of 1.5 °C. An IPCC Special Report on the Impacts of Global Warming of 1.5 °C above Pre-Industrial Levels and Related Global Greenhouse Gas Emission Pathways, in the Context of Strengthening the Global Response to the Threat of Climate Change, Sustainable Development, and Efforts to Eradicate Poverty; Cambridge University Press: Cambridge, UK, 2018; p. 630. [Google Scholar]
  4. International Energy Agency Transport. Improving the Sustainability of Passenger and Freight Transport. Available online: https://www.iea.org/topics/transport (accessed on 28 October 2022).
  5. International Energy Agency. Transport: Tracking Progress 2022. Available online: https://www.iea.org/reports/transport (accessed on 28 October 2022).
  6. Volkswagen AG. Sustainability at Volkswagen Group. In Proceedings of the ESG SRI Conference2020, Virtual, 17–19 November 2020. [Google Scholar]
  7. Neef, M.A. Carbon Budget Compliance: A Life-Cycle-Based Model for Carbon Emissions of Automotive Original Equipment Manufacturers; Verein zur Förderung des Institutes IWAR der Technischen Universität Darmstadt: Darmstadt, Germany, 2020. [Google Scholar]
  8. Mathews, M.R. Twenty-five Years of Social and Environmental Accounting Research: Is There a Silver Jubilee to Celebrate? Account. Audit. Account. J. 1997, 10, 481–531. [Google Scholar] [CrossRef]
  9. Haffar, M.; Searcy, C. Target-Setting for Ecological Resilience: Are Companies Setting Environmental Sustainability Targets in Line with Planetary Thresholds? Bus. Strat. Environ. 2018, 27, 1079–1092. [Google Scholar] [CrossRef]
  10. Bjørn, A.; Bey, N.; Georg, S.; Røpke, I.; Hauschild, M.Z. Is Earth Recognized as a Finite System in Corporate Responsibility Reporting? J. Clean. Prod. 2017, 163, 106–117. [Google Scholar] [CrossRef]
  11. Margolick, M.; Russell, D. Corporate Greenhouse Gas Reduction Targets; Global Change Strategies International Inc.: Ottawa, ON, Canada, 2001. [Google Scholar]
  12. Rietbergen, M.G.; van Rheede, A.; Blok, K. The Target-Setting Process in the CO2 Performance Ladder: Does It Lead to Ambitious Goals for Carbon Dioxide Emission Reduction? J. Clean. Prod. 2015, 103, 549–561. [Google Scholar] [CrossRef]
  13. Bjørn, A.; Lloyd, S.; Matthews, D. From the Paris Agreement to Corporate Climate Commitments: Evaluation of Seven Methods for Setting ‘Science-Based’ Emission Targets. Environ. Res. Lett. 2021, 16, 054019. [Google Scholar] [CrossRef]
  14. SBTi. Transport Science-Based Target Setting Guidance; SBTi, 2017. [Google Scholar]
  15. Busch, T.; Schwarzkopf, J. Carbon Management Strategies—A Quest for Corporate Competitiveness. Prog. Ind. Ecol. 2013, 8, 4–29. [Google Scholar] [CrossRef]
  16. Sukitsch, M.; Engert, S.; Baumgartner, R. The Implementation of Corporate Sustainability in the European Automotive Industry: An Analysis of Sustainability Reports. Sustainability 2015, 7, 11504–11531. [Google Scholar] [CrossRef]
  17. Damert, M.; Paul, A.; Baumgartner, R.J. Exploring the Determinants and Long-Term Performance Outcomes of Corporate Carbon Strategies. J. Clean. Prod. 2017, 160, 123–138. [Google Scholar] [CrossRef]
  18. Shinkle, G.A.; Spencer, J.W. The Social Construction of Global Corporate Citizenship: Sustainability Reports of Automotive Corporations. J. World Bus. 2012, 47, 123–133. [Google Scholar] [CrossRef]
  19. Thun, J.-H.; Müller, A. An Empirical Analysis of Green Supply Chain Management in the German Automotive Industry. Bus. Strat. Environ. 2009, 19, 119–132. [Google Scholar] [CrossRef]
  20. Regulation (EU) 2019/631 of the European Parliament and of the Council of 17 April 2019 Setting CO2 Emission Performance Standards for New Passenger Cars and for New Light Commercial Vehicles, and Repealing Regulations (EC) No 443/2009 and (EU) No 510/2011. Off. J. Eur. Union 2019, L 111, 13–53.
  21. Schmid, M. Challenges to the European Automotive Industry in Securing Critical Raw Materials for Electric Mobility: The Case of Rare Earths. MinMag 2020, 84, 5–17. [Google Scholar] [CrossRef]
  22. Stechemesser, K.; Guenther, E. Carbon Accounting: A Systematic Literature Review. J. Clean. Prod. 2012, 36, 17–38. [Google Scholar] [CrossRef]
  23. World Business Council for Sustainable Development; World Resources Institute. The Greenhouse Gas Protocol: A Corporate Accounting and Reporting Standard; World Business Council for Sustainable Development; World Resources Institute: Geneva, Switzerland; Washington, DC, USA, 2004; ISBN 1-56973-568-9. [Google Scholar]
  24. World Business Council for Sustainable Development; World Resources Institute. The Greenhouse Gas Protocol: Corporate Value Chain (Scope 3) Accounting and Reporting Standard; World Business Council for Sustainable Development; World Resources Institute: Geneva, Switzerland; Washington, DC, USA, 2011; ISBN 978-1-56973-772-9. [Google Scholar]
  25. Fugger, T.; Poligkeit, J.; Herrmann, C. Integration of Coupled Sectors Decarbonization Pathways across the Value Chain into Corporate Carbon Management Processes. Procedia CIRP 2023, 16, 1–6. [Google Scholar] [CrossRef]
  26. SBTi. Science Based Targets: Companies Taking Action. Available online: https://sciencebasedtargets.org/companies-taking-action (accessed on 23 October 2022).
  27. International Organization of Motor Vehicle Manufacturers Global Sales Statistics 2019–2022. Sales Statistics. Available online: www.oica.net (accessed on 31 August 2023).
  28. BAIC Motor Corporation Limited. 2020 Annual Report; Beijing Automotive Group: Beijing, China, 2021. [Google Scholar]
  29. BMW Group. BMW Group Bericht 2020; BMW Group: Munich, Germany, 2021. [Google Scholar]
  30. Changan Automobile Company Limited. 2020 Annual Report; Changan Automobile Company Limited: Chongqing, China, 2021. [Google Scholar]
  31. Chery Automobile Company Limited. Chery Automobile Grew 8.6% against the Trend in 2020, and Its Total Sales Reached 449,000 Units. Available online: https://www.chery.cn/BrandShow/News?newsid=6020708e-4069-4646-8101-649b02e96d92 (accessed on 18 July 2022).
  32. China FAW Group Corporation Limited. FAW’s First-Half Sales Up 2.3% YoY to 1,630,923 Units. Available online: http://www.faw.com/fawen/xwzt/xwbd/5264023/index.html (accessed on 29 December 2022).
  33. China FAW Group Corporation Limited. Financial Data. Available online: http://www.faw.com/fawen/gyjt36/jtgl59/jysj87/index.html (accessed on 29 December 2022).
  34. Dongfeng Motor Group Company Limited. 2020 Annual Report; Dongfeng Motor Group Company Limited: Wuhan, China, 2021. [Google Scholar]
  35. Ford Motor Company. Annual Report; Ford Motor Company: Dearborn, MI, USA, 2021. [Google Scholar]
  36. Ford Motor Company. Climate Change 2021; Ford Motor Company: Dearborn, MI, USA, 2021. [Google Scholar]
  37. General Motors Company. 2020 Sustainability Report: Driving Sustainable Value; General Motors Company: Detroit, MI, USA, 2021. [Google Scholar]
  38. Great Wall Motor Company Limited. Annual Report 2020; Great Wall Motor Company Limited: Baoding, China, 2021. [Google Scholar]
  39. Guangzhou Automobile Group Company Limited. Environmental, Social and Governance Report 2020; Guangzhou Automobile Group Company Limited: Guangzhou, China, 2021. [Google Scholar]
  40. Honda Motor Company Limited. Consolidated Financial Summary for the Fiscal 4th Quarter and the Fiscal Year Ended March 31, 2020. Available online: https://global.honda/newsroom/news/2020/c200512eng.html (accessed on 29 December 2022).
  41. Honda Motor Company Limited. Consolidated Financial Summary for the Fiscal 3rd Quarter Ended December 31, 2020 and Forecasts for the Fiscal Year Ending March 31, 2021. Available online: https://global.honda/newsroom/news/2021/c210209eng.html (accessed on 29 December 2022).
  42. Hyundai Motor Company. 2021 Sustainability Report: Road to Sustainability; Hyundai Motor Company: Seoul, Republic of Korea, 2021. [Google Scholar]
  43. Jaguar Land Rover. Jaguar Land Rover Retail Sales Continue to Recover in Quarter Ending December 2020 with China Sales Growing Year-on-Year; Tata Group: Coventry, UK, 2021. [Google Scholar]
  44. Kia Corporation. MOVE: Kia Sustainability Magazine 2021; Kia Corporation: Seoul, Republic of Korea, 2021. [Google Scholar]
  45. Mazda Motor Corporation. Mazda Production and Sales Results for December 2020 and for January through December 2020 (Flash Report); Mazda Motor Corporation: Hiroshima, Japan, 2021. [Google Scholar]
  46. Mercedes-Benz Group AG. Geschäftsbericht 2020; Mercedes-Benz Group AG: Stuttgart, Germany, 2021. [Google Scholar]
  47. Mitsubishi Motors Corporation. Production, Sales and Export Data. Available online: https://www.mitsubishi-motors.com/en/investors/finance_result/result.html (accessed on 27 December 2022).
  48. Mitsubishi Motors Corporation. Sustainability Report 2021; Mitsubishi Motors Corporation: Minato, Japan, 2021. [Google Scholar]
  49. Nissan Motor Corporation Limited. Nissan Production, Sales and Exports for December and 2020; Nissan Motor Corporation Limited: Yokohama, Japan, 2021. [Google Scholar]
  50. Nissan Motor Corporation Limited. Sustainability Report 2021; Nissan Motor Co., Ltd.: Yokohama, Japan, 2021. [Google Scholar]
  51. Renault Group. Monthly Sales. Available online: https://www.renaultgroup.com/en/finance-2/financial-information/key-figures/monthly-sales/ (accessed on 1 November 2021).
  52. SAIC Motor Corporation Limited. Annual Report 2020; SAIC Motor Corporation Limited: Shanghai, China, 2021. [Google Scholar]
  53. Stellantis, N.V. 2020 Corporate Social Responsibility Report: Peugeot S.A. Scope; Stellantis N.V.: Hoofddorp, The Netherlands, 2021. [Google Scholar]
  54. Stellantis, N.V. 2020 Sustainability Report: FCA N.V. Scope; Stellantis N.V.: Hoofddorp, The Netherlands, 2021. [Google Scholar]
  55. Subaru Corporation. Global Sales Results. Available online: https://www.subaru.co.jp/en/ir/finance/performance.html (accessed on 2 April 2023).
  56. Suzuki Motor Corporation. Automobile Monthly Results of Production, Sales & Exports. Available online: https://www.globalsuzuki.com/ir/library/data/ (accessed on 10 April 2022).
  57. Tata Motors Limited. TML Volumes—Flash Figures. Available online: https://www.tatamotors.com/investors/volumes/ (accessed on 27 November 2021).
  58. Tesla Incorporated. Q4 and FY2020 Update; Tesla Incorporated: Austin, TX, USA, 2021. [Google Scholar]
  59. Toyota Motor Corporation. Toyota Global Sales, Production, and Export Data. Available online: https://global.toyota/pages/global_toyota/company/profile/production-sales-figures/production_sales_figures_en.xls (accessed on 15 November 2021).
  60. Volkswagen Group. Die Zukunft in der Hand—Geschäftsbericht 2020; Volkswagen Group: Wolfsburg, Germany, 2021. [Google Scholar]
  61. Volvo Car Group. Sustainability Management and Governance; Volvo Car Group: Gothenburg, Sweden, 2021. [Google Scholar]
  62. Zhejiang Geely Holding Group Company Limited. Geely Auto 2020 Sales Reach 1.32 Million Units. Available online: http://global.geely.com/media-center/news/geely-auto-2020-sales-reach-1-32-million-units/ (accessed on 28 October 2022).
  63. Chery Automobile Company Limited. Environmental Information 2021; Chery Automobile Company Limited: Wuhu, China, 2022. [Google Scholar]
  64. China FAW Group Corporation Limited. 2021 Sustainable Development Report; China FAW Group Corporation Limited: Changchun, China, 2022. [Google Scholar]
  65. Dongfeng Motor Group Company Limited. 2020 Environmental, Social and Governance Report; Dongfeng Motor Group Company Limited: Wuhan, China, 2021. [Google Scholar]
  66. Ford Motor Company. Integrated Sustainability and Financial Report 2021; Ford Motor Company: Dearborn, MI, USA, 2021. [Google Scholar]
  67. General Motors Company. Climate Change 2021; General Motors Company: Detroit, MI, USA, 2021. [Google Scholar]
  68. Great Wall Motor Company Limited. Corporate, Social and Responsibility Report 2020; Great Wall Motor Company Limited: Baoding, China, 2021. [Google Scholar]
  69. Honda Motor Company Limited. Honda Sustainability Report 2021; Honda Motor Copmany Limited: Minato, Japan, 2021. [Google Scholar]
  70. Kia Corporation. ESG Special Report 2021; Kia Motors Corporation: Seoul, Republic of Korea, 2021. [Google Scholar]
  71. Mazda Motor Corporation. Sustainability Report 2020: In-Depth Version; Mazda Motor Corporation: Hiroshima, Japan, 2020. [Google Scholar]
  72. Mazda Motor Corporation. Sustainability Report 2021: In-Depth Version; Mazda Motor Corporation: Hiroshima, Japan, 2022. [Google Scholar]
  73. Mercedes-Benz Group AG. Nachhaltigkeitsbericht 2020; Mercedes-Benz Group AG: Stuttgart, Germany, 2021. [Google Scholar]
  74. Renault Group. Climate Report: On the Road to Carbon Neutrality; Renault Group: Boulogne-Billancourt, France, 2021. [Google Scholar]
  75. SAIC Motor Corporation Limited. Social Responsibility Report 2020; SAIC Motor Corporation Limited: Shanghai, China, 2021. [Google Scholar]
  76. Subaru Corporation. Sustainability Report 2021; Subaru Corporation: Shibuya, Japan, 2021. [Google Scholar]
  77. Suzuki Motor Corporation. Integrated Report 2021; Suzuki K.K.: Hamamatsu, Japan, 2022. [Google Scholar]
  78. Suzuki Motor Corporation. Sustainability Report 2021; Suzuki K.K.: Hamamatsu, Japan, 2022. [Google Scholar]
  79. Tata Motors Group. 76th Integrated Annual Report 2020–2021; Tata Group: Mumbai, India, 2021. [Google Scholar]
  80. Tata Motors Group. Annual CSR Report 2020–2021; Tata Group: Mumbai, India, 2021. [Google Scholar]
  81. Tesla Incorporated. Impact Report 2020; Tesla Incorporated: Austin, TX, USA, 2021. [Google Scholar]
  82. Toyota Motor Corporation. Sustainability Data Book; Toyota Motor Corporation: Toyota, Japan, 2021. [Google Scholar]
  83. Volkswagen Group. Nachhaltigkeitsbericht 2020; Volkswagen Group: Wolfsburg, Germany, 2021. [Google Scholar]
  84. Volvo Car Group. Annual Report 2020; Volvo Car Group: Gothenburg, Sweden, 2021. [Google Scholar]
  85. Zhejiang Geely Holding Group Company Limited. Annual Report 2020; Zhejiang Geely Holding Group Company Limited: Hangzhou, China, 2021. [Google Scholar]
  86. Zhejiang Geely Holding Group Company Limited. 2020 Environmental, Social and Governance Report; Zhejiang Geely Holding Group Company Limited: Hangzhou, China, 2021. [Google Scholar]
  87. Busch, T.; Lewandowski, S. Corporate Carbon and Financial Performance a Meta-Analysis. J. Ind. Ecol. 2018, 22, 745–759. [Google Scholar] [CrossRef]
  88. World Business Council for Sustainable Development; World Resources Institute. The Greenhouse Gas Protocol; World Resources Institute and World Business Council for Sustainable Development: Washington, DC, USA, 2004. [Google Scholar]
  89. ISO 14001:2015; Environmental Management Systems—Requirements with Guidance for Use. International Organization for Standardization: Geneva, Switzerland, 2015.
  90. ISO 14040:2006; Environmental Management—Life Cycle Assessment—Principles and Framework. International Organization for Standardization: Geneva, Switzerland, 2006.
  91. ISO 14044:2006; Environmental Management—Life Cycle Assessment—Requirements and Guidelines. International Organization for Standardization: Geneva, Switzerland, 2006.
  92. EN 16258:2012; Methodology for Calculation and Declaration of Energy Consumption and GHG Emissions of Transport Services (Freight and Passengers). European Committee for Standardization: Brussels, Belgium, 2012.
  93. Brammer, S.; Jackson, G.; Matten, D. Corporate Social Responsibility and Institutional Theory: New Perspectives on Private Governance. Socio-Econ. Rev. 2012, 10, 3–28. [Google Scholar] [CrossRef]
  94. Consolidated Set of the GRI Standards; GRI Standards: Amsterdam, The Netherlands, 2023; ISBN 978-90-8866-133-4.
  95. Task Force on Climate-Related Financial Disclosures Guidance on Metrics, Targets, and Transition Plans; TCFD: Basel, Switzerland, 2021.
  96. European Parliament; European Council. Directive 2000/53/EC of the European Parliament and of the Council of 18 September 2000 on End-of Life Vehicles; European Council: Brussels, Belgium, 2000; pp. 34–43.
  97. CATARC. LCA Research Progress of CATARC; China Automotive Technology and Research Center Co., Ltd.: Tianjin, China, 2022. [Google Scholar]
  98. Petavratzi, E.; Gunn, G. Decarbonising the Automotive Sector: A Primary Raw Material Perspective on Targets and Timescales. Min. Econ 2022, 36, 545–561. [Google Scholar] [CrossRef]
  99. European Council Council and Parliament. Reach Provisional Deal on Renewable Energy Directive. Available online: https://www.consilium.europa.eu/en/press/press-releases/2023/03/30/council-and-parliament-reach-provisional-deal-on-renewable-energy-directive/#:~:text=The%20Council%20and%20the%20Parliament,contribute%20to%20this%20common%20target (accessed on 15 August 2023).
  100. Patel, A.; Singh, S. Implementing Circular Economy Strategies in the Automobile Industry—A Step toward Creating Sustainable Automobiles. BIJ 2023, 30, 2225–2233. [Google Scholar] [CrossRef]
  101. Grenz, J.; Ostermann, M.; Käsewieter, K.; Cerdas, F.; Marten, T.; Herrmann, C.; Tröster, T. Integrating Prospective LCA in the Development of Automotive Components. Sustainability 2023, 15, 10041. [Google Scholar] [CrossRef]
  102. Muslemani, H.; Liang, X.; Kaesehage, K.; Ascui, F.; Wilson, J. Opportunities and Challenges for Decarbonizing Steel Production by Creating Markets for ‘Green Steel’ Products. J. Clean. Prod. 2021, 315, 128127. [Google Scholar] [CrossRef]
Figure 1. Overview of all OEMs considered in this study with their area of origin (the total sales number of a region equals the worldwide sales of all OEMs based in this region) and light-duty vehicle sales in calendar year 2020 [28,29,30,31,32,33,34,35,36,37,38,39,40,41,42,43,44,45,46,47,48,49,50,51,52,53,54,55,56,57,58,59,60,61,62].
Sustainability 15 15753 g001
Figure 2. Analysis of the decarbonization strategy of the OEMs of the four regions considered, subdivided into the evaluation criteria “reporting”, “implementation (within the company)” and “management control”, further subdivided into the respective aspects considered.
Sustainability 15 15753 g002
Figure 3. Overview of the OEM carbon reporting scopes for the reporting year 2020 (A black square symbolizes an active carbon reporting by an OEM for a respective scope.). The emission scopes are defined according to the GHG Protocol (see Section 2.1.2).
Sustainability 15 15753 g003
Figure 4. Scopes and characteristics of carbon reduction targets published by OEMs. (A multi-scope target, e.g., for scope 3 categories 1 and 11, contributes to several columns. The number in the squares gives the number of targets per OEM, and the scope and characteristic of these targets; the higher the number, the darker the square color. Example: OEM 6 has three relative targets for scope 3 category 11).
Sustainability 15 15753 g004
Figure 5. Overview of OEMs base years and target years for identified carbon reduction targets. (The number in the squares gives the amount of targets per OEM, year and characteristic; the higher the number, the darker the square color. Note that all absolute reduction targets with a 100% reduction ambition, as well as all carbon neutrality targets, do not have a base year, and thus are not included in the left part of the diagram. Furthermore, one OEM did not mention a base year for one of their targets, for which reason this target is not included as well. Additionally, one OEM did not mention a target year for its carbon neutrality target. This target is not included in the right part of the diagram, accordingly. Therefore, there are 70 base year entries and 98 target year entries in total).
Sustainability 15 15753 g005
Figure 6. Evaluation of carbon reduction measures communicated for each of the scope 1–3 categories, including the number of OEMs that have formulated measures in those emission categories.
Sustainability 15 15753 g006
Disclaimer/Publisher’s Note: The statements, opinions and data contained in all publications are solely those of the individual author(s) and contributor(s) and not of MDPI and/or the editor(s). MDPI and/or the editor(s) disclaim responsibility for any injury to people or property resulting from any ideas, methods, instructions or products referred to in the content.

