Abstract
Southwest China’s arid river valleys represent ecologically vulnerable areas with intense human activity. Understanding the historical changes in LULC and land cover and projecting the impacts of various development scenarios on future LULC have become crucial for regional spatial information management and territorial spatial planning. This research analyzes the land-use changes in the Yuanmou dry-hot valley over a 30-year span from 1990 to 2020. Building upon the PLUS model, we established a coupled habitat quality spatial and multi-scenario land-use simulation model. Four development scenarios were proposed: natural progression, economic development, ecological conservation, and balanced development. We conducted simulations and evaluations of land-use in the Yuanmou dry-hot valley for 2030 using the PLUS mode, assessing the sustainability of future development scenarios under varying ecological constraints. During the simulation, three distinct RESI regions were employed as restricted development zones, integrating the three ecological constraints with the four simulation scenarios. We introduced a novel approach based on ecological environmental quality as the ecological constraint, providing a scientific reference for sustainable development in ecologically vulnerable areas. The results indicate that under ecological conservation scenarios with high-to-low RESI constraints, the ecological environment is superior to the other three scenarios. The results show the following: (1) From 1990 to 2020, aside from a continuous decrease in grassland area, there was an increasing trend in the areas of water bodies, forests, croplands, construction lands, and unused lands in the Yuanmou dry-hot valley. (2) By 2030, under all four development scenarios, the cropland area is expected to expand rapidly, while forested areas will decrease; grassland areas will decline under natural and economic development scenarios but show opposite trends under the other scenarios; and construction land and unused land areas will decrease under the ecological conservation and balanced development scenarios. (3) Land-use intensity analysis for the four scenarios indicated that, by 2030, unused lands in the Yuanmou dry-hot valley are more likely to be converted into water bodies, forests are more likely to be converted into croplands and grasslands, grasslands are more likely to be converted into croplands, croplands are more likely to be converted into grasslands, and construction lands are more likely to become unused lands. (4) Sustainable LULC management evaluations based on landscape indices reveal that ecological conservation and balanced development scenarios exhibit superior landscape connectivity and clustering. Thus, the balanced development scenario is the most appropriate LULC strategy for the Yuanmou dry-hot valley in the future. These findings provide scientific references for balancing ecological conservation and economic development in the arid river valleys of Southwest China.
1. Introduction
Land cover and human-induced activities form a critical nexus between human society and the natural environment [1]. Land-use and land cover (LULC) change reflects the dual structure of natural ecology and socioeconomics [1,2]. Over the past several decades, in addition to extensive human alterations to the land, the structure of LULC has evolved, exacerbating the ecological environment of already-vulnerable dry-hot valleys. Driven by economic interests, the unique climatic conditions of the dry-hot valleys have led to an increasing conversion of grasslands and pristine forests to arable land, constantly expanding the cultivated area. This has, in turn, created issues related to water body resources, air quality, natural disasters, and biodiversity [3,4]. As a quintessential region characterized by specialized agricultural development and ecological vulnerability, the dry-hot valley is endowed with abundant resources. Intense human interference has led to the degradation of its natural environment, manifested in the rapid deterioration of the natural landscape, increased desertification, intensified vegetation destruction, reduced biodiversity, and increased severe soil erosion [5]. The driving mechanisms behind regional LULC changes are intricate and are influenced by the interplay of natural ecology and socioeconomic factors [6,7,8].
The multi-scenario simulation of future LULC changes based on related models is a pivotal method used to explore LULC optimization [9,10]. Simulating various scenarios to depict potential future LULC trends is a theme of many current and upcoming studies [3] which incorporate models such as the CA-Markov [11], SLEUTH [12], FLUS [13], and PLUS models [14]. However, both the CA-Markov and FLUS models, essentially based on the CA model, lack the ability to elucidate how driving factors lead to LULC changes. The SLEUTH model falls short in simulating dynamic changes in LULC patches and cannot precisely capture shifts across multiple LULC types [15]. The PLUS model is rooted in the Land Expansion Analysis Strategy (LEAS) rule-mining framework and the CA model is based on multitype random seeds (CARS). Compared to other models, the PLUS model can achieve superior simulation accuracy and a more analogous landscape, retaining the advantages of adaptive inertia and roulette competition mechanisms from the future LULC simulation (FLUS) model. Moreover, the LEAS module assists researchers in investigating potential LULC conversion rules [14]. Additionally, this model amalgamates the strengths of the existing CA-Markov and FLUS models, bypassing the analysis of transformation types that grow exponentially with category count [16].
Ecosystem services (ESs) refer to the various benefits derived from natural ecological processes [17]. Analyzing the spatial and temporal patterns of ESs can help quantify the extent to which natural ecosystems benefit human society to allow decision-makers and managers to manage and allocate environmental resources more effectively [18]. In studies related to ecological constraints, large areas such as nature reserves [19], wildlife habitats [20], ecological red lines [21], and ecosystem service zones [22] are typically considered ecological restrictions. However, these constraints are mostly fixed patches and are not adjusted according to different simulation scenarios. Moreover, the environment is not static. Modifying the ecological constraint areas based on changes in the ecological environment might represent a practical approach to ecological restriction. Habitat quality refers to the capability of a specific region to sustainably provide suitable conditions for the survival and development of individual organisms or populations. It plays an essential role in maintaining the stability of biodiversity in natural ecosystems and promoting human well-being. Therefore, incorporating habitat quality as a constraining factor in simulating LULC changes is of paramount importance for precisely conserving ecological lands in the region, rationally exploiting land resources, and formulating ecological protection policies [23,24,25]. National research institutions typically utilize a range of indices to reflect the ecological condition of an area [26]. These indices encompass various facets of the ecological environment, such as the air quality index (AQI) [27], the water bodies quality index [28], and soil health [29]. Rather than focusing on singular metrics, these indices integrate multiple crucial parameters to offer a comprehensive and accurate assessment of the environmental condition. In 2013, considering the rationality of the EI weight, the setting of the normalization coefficient, the easy accessibility of relevant indicators, and the visualization of ecological conditions, an indicator was proposed, called the Remote Sensing Ecological Index (RSEI) [30]. Hence, this study employed the RSEI to construct the spatial quality of habitats as a constraining factor, aiming to more precisely safeguard the ecological environment.
In summary, a plethora of impactful studies have been addressing regional ecological issues. However, there remains a conspicuous absence of systematic evaluations on how different development paradigms influence the economic, social, and ecological shifts in future dry-hot valley areas, leading to inefficiencies in regional integrated development management. Additionally, current ecological protection planning mainly targets broader scopes at the county level or higher, making practical guidance challenging [31]. The PLUS model was used to simulate LULC changes and their differences in the study area by 2030 under four scenarios: natural progression, ecological protection, economic development, and balanced development. This study aims to provide a scientific reference for the formulation of coordinated economic, social, and ecological development plans in the fragile ecological regions of dry-hot valleys, as exemplified by Yuanmou.
2. Materials and Methods
2.1. Study Area
The Yuanmou dry-hot valley is situated in the southwestern region of China (25°23′~26°06′ N, 101°35′~102°06′ E) and lies within the catchment of the Longchuan River, a primary tributary of the Jinsha River. The valley covers an area of 2025.58 km2. The topography of the region predominantly slopes from south to north toward the Jinsha River Valley, declining from the southeast toward the Longchuan River Valley. This gives the area its characteristic concave shape. It is elevated in the southeast and depressed in the northwest, with surrounding heights and a central depression. Influenced by the Foehn effect, the valley experiences a hot and dry climate, characterized as a subtropical monsoon climate with concentrated rainfall and distinct wet and dry seasons. The average annual temperature is 21.9 °C, peaking at 42 °C, while the average yearly precipitation amounts to 613.8 mm. The zonal vegetation primarily consists of sparse shrubs and grasses, and the predominant soil type is dry red soil. Given its unique natural and geographical conditions, the valley experiences severe gully erosion and fragmented terrain, making it a representative of the ecologically vulnerable region in the southwest. To achieve the dual objectives of ecological management and economic growth, extensive areas of gullies and grasslands in the valley are being transformed into arable land (Figure 1).
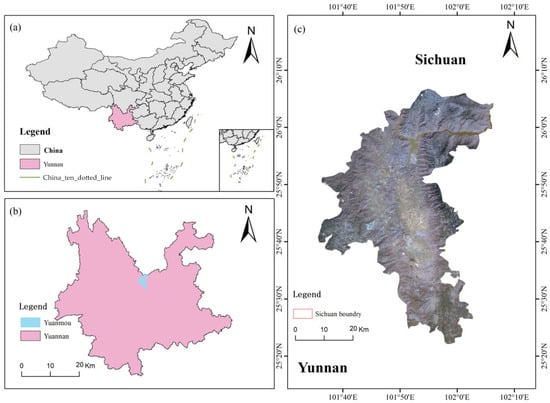
Figure 1.
Overview map of the study area: (a,b) are the locations of the study area in China and the provincial scale; (c) is the boundary of Yuanmou.
2.2. Data Source and Pre–Processing
The foundational datasets encompass land cover data, climatic data, topographic data, and socioeconomic data. Since 1990, the Yuanmou dry-hot valley initiated the cultivation of tropical characteristic crops, marking the onset of vegetation restoration [32]. Consequently, this study utilized Landsat series remote sensing images from 1990 to 2020, divided into four periods, each spanning ten years. These images were classified using the random forest method on the GEE platform., The first-level land use classification system was used to categorize the LULC types in the Yuanmou dry-hot valley into six categories: woodland, grassland, cultivated land, construction land, water bodies, and unused land. The accuracy assessment of the classified LULC data revealed an overall accuracy exceeding 88% and a kappa coefficient consistently above 80%. The RSEI was graded using the natural breakpoint method, resulting in various levels of habitat quality space. Administrative zoning data was accessed from the National Geographic Information Resources Catalogue Service (www.resdc.cn/Data.aspx (accessed on 10 May 2023)). The spatial analysis module of ArcGIS was utilized on the foundation of the digital elevation model (DEM) to obtain slope distribution data, with a grid resolution of 30 m × 30 m. Attributes were extracted and Euclidean distances to various roads were computed using ArcGIS. Specific data are presented in Table 1.

Table 1.
Data parameters.
2.3. Study Methods
Building upon the PLUS model, this study introduces a land-use simulation model coupled with RESI ecological constraints, termed RESI-PLUS. In this model, RESI values under different scenarios serve as the ecological constraints. Subsequently, from the perspective of ecological conservation, 2020 served as the base year. The study employed RESI to construct spatial habitat quality, which acted as an ecological constraint factor. Using the PLUS model, the study projected LULC patterns for the year 2030. The objective was to delineate the most suitable future development trajectory for the Yuanmou dry-hot valley under ecological protection constraints. The research framework is as follows (Figure 2):
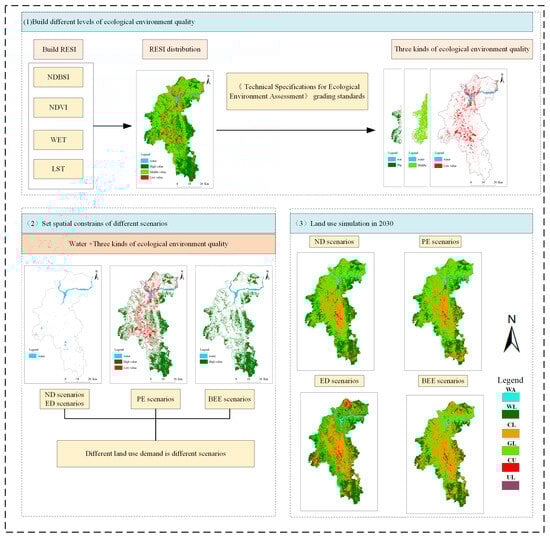
Figure 2.
Research framework (NDBSI: dryness, NDVI: greenness, WET: humidity, LST: heat; WA: Water, WL: Woodland, CL: Cultivated land, GL: Grassland, CU: Construction land, UL: Unused land).
- (1)
- The Remote Sensing Ecological Index (RSEI) was constructed using four indicators: vegetation greenness (NDVI), wetness (WET), dryness (NDBSI), and temperature (LST). Based on the RSEI, three different levels of habitat quality spaces were generated to serve as ecological constraints.
- (2)
- Different ecological constraint conditions were coupled with corresponding simulation scenarios. Four distinct scenarios were designed based on regional development trends from 1990–2020, including the Natural Development Scenario (NDS), Protective Ecological Scenario (PES), Economic Development Scenario (EDS), and Balanced Ecological-Economic Development Scenario (BEE). Specifically, under the PES, areas with inferior ecological conditions were prohibited from development, while areas with superior ecological conditions were preserved. Both superior and inferior spatial habitat quality served as ecological constraints. Under the BEE, economic development considerations were incorporated with inferior spatial habitat quality as the ecological constraint. Water bodies were considered critical zones and acted as ecological constraints across all scenarios.
- (3)
- Utilizing the CARS (cellular automata for research in simulation) module in the PLUS model, LULC data for 2020 were simulated and underwent accuracy verification. After ensuring that the data met the required precision standards, LULC-type demand data for 2030 were obtained using a Markov chain. These data, in addition to spatial habitat quality, were input into the PLUS model as restrictions for development zones. Simulations were run to generate LULC data for all four scenarios.
2.3.1. PLUS Model
To ensure the correctness of the model, parameter configuration and model validation for the PLUS model were necessary. PLUS is a model designed for simulating LULC changes based on grid data. This model consists of the LEAS and the CARS. LEAS combines the advantages of the transition analysis strategy (TAS) and the pattern analysis strategy (PAS). The module requires overlaying LULC data from two different periods and extracting grid cells where changes occurred. Utilizing the random forest algorithm, it systematically investigates the factors driving expansion for various LULC types. This helps in obtaining the probability of development for each category, as well as the contribution of each driving factor to the expansion during that period [14,33]. This study selected 11 driving factors from natural, socioeconomic, and human activity dimensions (Figure 3).
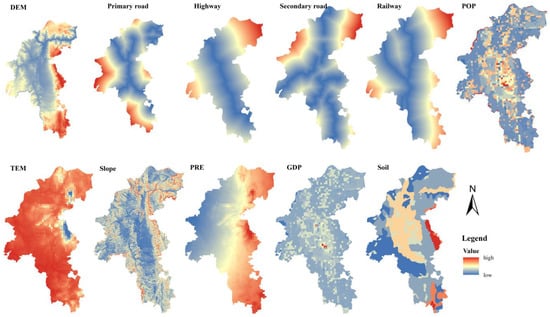
Figure 3.
The drivers of the PLUS model (DEM, Primary road, Highway, Secondary road, Railway, POP, TEM, Slope, PRE, GDP, Soil).
The cost matrix for different LULC types indicates whether various land types can be converted to another: a “0” denotes non-convertibility, while a “1” denotes convertibility (Table 2).
Table 2.
Cost matrix of LULC types.
The neighborhood weight parameter chiefly reflects the intensity of conversions between different LULC types. The parameter ranges from 0 to 1, with a higher value indicating a stronger conversion intensity. The total area of the six LULC-type changes from 1990 to 2020 was normalized to represent the neighborhood weight for each LULC type (Table 3).
Table 3.
Weight of the neighborhood.
Based on land-use data from 2010, a simulation of LULC for 2020 was performed. The results were then compared with the actual LULC in 2020. Parameter configurations were as follows: patch generation threshold of 0.5, expansion coefficient of 0.1, and percentage of seeds of 0.01. The simulation results revealed a kappa coefficient of 0.8196. According to related studies, a kappa coefficient greater than 0.7 is deemed acceptable, indicating that the simulation results were relatively precise and that the parameters set for the PLUS model were appropriate [22].
2.3.2. Construction of Habitat Quality Factors
Based on Xu’s proposition [34], the RESI was constructed using four indicators: vegetation greenness (i.e., normalized difference vegetation index, NDVI), wetness (WET), dryness (NDBSI), and land surface temperature (LST). Following the “Technical Specifications for Ecological Environment Assessment”, the index grading method was employed to construct three RESI levels as constraint spaces: namely, low RESI (0–0.4), indicating poor habitat quality, medium RESI (0.4–0.8), indicating good habitat quality, and high RESI (0.8–1), indicating optimal habitat quality (Figure 4).
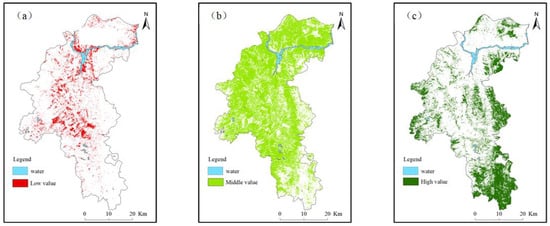
Figure 4.
Spatial distribution of three habitat masses: (a) bad habitat quality; (b) good habitat quality; (c) optimal habitat quality.
2.3.3. Construction of the Four Regional Development Scenarios
The study area is in a dry and hot river valley that is rich in resources and has a hot climate conducive to the growth of special crops. However, it possesses a fragile ecological environment with sparse vegetation. As per the “Yunnan Provincial Territorial Space Planning (2021–2035)” mid-term plan for 2030, Yuanmou’s dry-hot river valley must address both ecological conservation and agricultural development responsibilities. Hence, to accommodate possible future regional developmental scenarios, this study devised four scenarios for land-use simulation. These are the Natural Development Scenario, Ecological Conservation Scenario, Economic Development Scenario, and Balanced Ecological-Economic Development Scenario. Different simulated scenarios combined with corresponding RESI-generated habitat quality spaces established ecological constraints (areas where LULC is prohibited). Changes in the area of each LULC type modified the probability of LULC transitions under the respective scenarios. Based on related studies, this approach ensured more coherent LULC between different simulated scenarios [35,36]. The specific design of each scenario is as follows:
- (1)
- Natural Development Scenario (NDS): Under this scenario, the probability of conversions between LULC types remained unchanged. LULC data from 2010 and 2020 were input into the Markov chain model to calculate LULC demands for 2030. Water bodies served as constraint areas.
- (2)
- Protection Ecological Scenario (PES): This scenario aimed to expand ecological conservation areas and reduce anthropogenic interferences, thus minimizing human-induced invasions. The specific settings were as follows: the probability of land conversions from other types to construction land decreased by 30%, while the conversion from construction to other types increased by 20%. Conversions from other LULC types to forest and grassland increased by 20%. Corresponding ecological constraints were poor and optimal habitat quality spaces, respectively. Considering that low RESI areas are highly impacted by human activities, adjustments can be made.
- (3)
- Economic Development Scenario (EDS): Prioritizing economic development, this region is a typical agricultural county. The focus was on expanding arable lands by increasing the likelihood of other LULC types transitioning to cultivated land and decreasing their rate of conversion to other types. Specifically, the probabilities of converting grasslands, forests, and unused lands to cultivated land increased by 30%, while the probability of these types being converted to construction lands increased by 10%. Conversely, the probabilities of transitions from cultivated lands and construction lands to other categories decreased by 30%. However, in line with cultivated land conservation principles, the likelihood of cultivated land being converted to construction land remained unchanged.
- (4)
- Balanced Ecological-Economic Development Scenario (BEE): This scenario strives for harmony between economic growth and ecological conservation. On the economic side, the probability of other LULC types transitioning to Cultivated land and construction land increased, albeit less than in the EDS. From an ecological standpoint, the likelihood of ecological lands transitioning to Cultivated land and construction lands was reduced, albeit not as drastically as in the PES. Detailed settings: the probability of cultivated land transitioning to construction land decreased by 10%, while the probability of cultivated land transitioning to water bodies, forests, and grasslands increased by 20%. Transition probabilities from water bodies and grasslands to construction lands decreased by 20%. The conversion of cultivated land to forests increased by 10%, while transitions to water bodies, grasslands, and unused lands decreased by 5%. The likelihood of woodland reduction was less than that for water bodies and unused lands, given the expansive forest cover and its continuing environmental carrying capacity. Furthermore, considering the low ecological value and cultivation challenges of unused lands, the transition probability to construction lands increased by 20%, while that to cultivated land decreased by 20%. The corresponding ecological constraint was a low habitat quality space.
Considering the nondevelopable nature of water bodies, they acted as constraint areas in all scenarios. Additionally, the transition probabilities set for each LULC scenario were based on LULC data previously computed in the Markov chain.
2.3.4. LULC Transition Intensity
Utilizing the methodology construction by Li [37], the LULC transition intensity was constructed. This method established criteria for determining trends in absolute quantities of land category transitions, assessing potential relationships between regional LULC structures and land class transformations. The analysis involved understanding the tendencies or inhibitions of certain end-term land categories to obtain transitions from a specific initial land category. This transition behavior either promoted or hindered significant changes in the regional proportion of the initial land category. Whether a certain initial land category inhibited its area from transitioning to a specific end-term category and whether it significantly impacted the proportion of the end-term category were also explored. In this study, an intensity map was used to compute the LULC transition intensity between 1990 and 2020 and under the four scenarios. The transition probabilities for each scenario are shown in Table 4, Table 5 and Table 6.
Table 4.
PES of transition probability (X represents the transition probability that does not increase).
Table 5.
EDS of transition probability (X represents the transition probability that does not increase).
Table 6.
BEE of transition probability (X represents the transition probability that does not increase).
2.3.5. Optimal Scenario Selection
Landscape-level indices were used to compare scenarios and select the most suitable development scenario. These indices are widely applied for analyzing the structural features of LULC. The number of patches (NP) and the landscape division index (DIVISION) were chosen to describe the degree of landscape fragmentation. The Shannon diversity index (SHDI) and the Shannon evenness index (SHEI) were used to depict the richness and evenness of the landscape. The cohesion index (COHESION) and the contagion index (CONTAG) were chosen to describe patch aggregation and dispersion. This study utilized Fragstats4.2 to calculate landscape-level indices for the four scenarios.
3. Results
3.1. Spatial and Temporal Evolution of LULC
3.1.1. Analysis of LULC Transition Intensity
The LULC intensity map constructed provides an intuitive depiction of land category transformations, analyzing them from both absolute and relative intensity perspectives. While the transformation characteristics in each time-period map were not identical, similarities existed. From 1990–2000, water bodies → agricultural land/grassland/construction land, woodland → agricultural land/construction land/grassland, and construction land/unutilized land → unutilized land showed systematic inhibitory transformation characteristics. Water bodies → woodland/unutilized land, agricultural land → water bodies/construction land/unutilized land, grassland → construction land/unutilized land, construction land → water bodies/grassland/unutilized land, and unutilized land → water bodies/agricultural land/unutilized land exhibited relative inhibition transformation characteristics; and woodland → agricultural land/grassland demonstrated absolute inhibition transformation characteristics. From 2000–2010, transformation characteristics exhibited both systematic inhibitory and relative inhibition features, whereas, from 2010–2020, other specific transformation characteristics were observed under different land categories.
Under the Natural Development scenario for 2030, systematic inhibitory, systematic inhibition, and relative inhibition transformation features were observed across various land categories. Under the ecological priority scenario, systematic inhibitory and relative inhibition transformation features were predominant. The economic development and balanced scenarios also showed similar but specific patterns. The intensity map intuitively expressed the region-specific transformation patterns in the Yuanmou dry-hot valley, an ecologically fragile area under “dry” and “hot” climatic conditions, such as agricultural land transitioning from grassland and construction land showing lower transition intensity compared to grassland, among others (Figure 5).
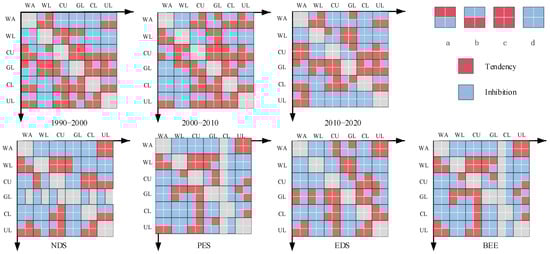
Figure 5.
Intensity map unit of land-use/cover change (LULC) in 1990–2020 and four scenarios in 2030: (a) Absolute tendency; (b) Relative tendency; (c) Systemic tendency; (d) Systemic inhibition.
3.1.2. Analysis of LULC Transition
The analysis of LULC transition through Sankey diagrams revealed that, from 1990 to 2000, except for water bodies and grasslands, all other LULC categories showed an increasing trend in area. Agricultural land increased by 53.74 km2, primarily converted from grasslands, while woodland expanded by 312.14 km2, also mainly due to conversions from grasslands. The areas of construction land and unutilized land increased marginally by 11.94 km2 and 5.83 km2, respectively. Water bodies decreased by 6.13 km2 and grasslands decreased by 373.95 km2. From 2000 to 2010, the magnitude of change for each land category was not significant. Woodland and grassland showed increasing trends, adding 7.81 km2 and 79.67 km2, respectively, and were mainly converted from agricultural land. Water bodies, agricultural land, construction land, and unutilized land all showed downward trends, decreasing by 1.93 km2, 72.11 km2, 11.47 km2, and 2.07 km2, respectively. Between 2010 and 2020, the changes were more pronounced. Woodland and grassland showed decreasing trends, losing 279.29 km2 and 146.46 km2, respectively. In contrast, water bodies, agricultural land, construction land, and unutilized land all showed increasing trends, gaining 25.58 km2, 276.76 km2, 108.93 km2, and 14.53 km2, respectively. Overall, from 2000 to 2020, all categories—water bodies, woodland, agricultural land, construction land, and unutilized land—exhibited an increasing trend. Agricultural land had the most significant increase, from 191.86 km2 to 450.25 km2, while grassland decreased from 843.77 km2 in 2000 to 776.97 km2, indicating that most current LULC types were primarily converted from grasslands (Figure 6).
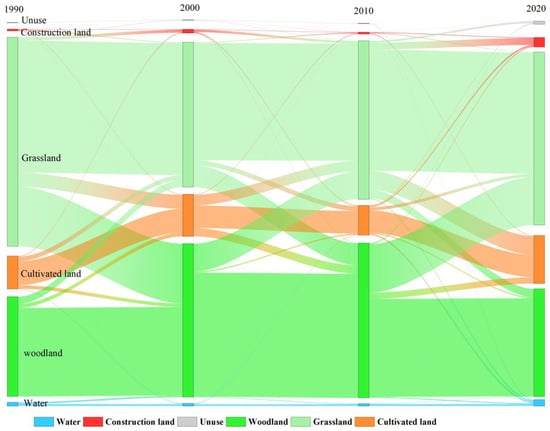
Figure 6.
LULC transfer in years 1990–2020.
Using habitat quality spatial data as an ecological constraint, the LULC situation for 2030 was simulated, resulting in the following LULC area and conversion scenarios under four scenarios: Agricultural land consistently showed an upward trend (Figure 7). Under the economic development scenario, it experienced the most significant increase of 222.33 km2, primarily by conversions from grassland and woodland. In the natural development, ecological protection, and balanced development scenarios, the agricultural land area increased by 69.84 km2, 71.55 km2, and 152.05 km2, respectively. However, the sources of conversion differed: the natural development scenario mainly converts from grasslands, while the balanced development scenario mainly converts from woodland. Water bodies showed minimal change in area. The most substantial increase, 28.79 km2, was under the economic development scenario, with conversions from various land categories. In other scenarios, the water body areas remained almost unchanged, each less than 2 km2. Woodland consistently showed a declining trend, with notable differences in the extent of decrease across scenarios. The largest decrease, 184.04 km2, was under the economic development scenario, primarily converting to agricultural land. This was followed by the balanced development scenario with a reduction of 169.92 km2, primarily converting to agricultural land. The ecological protection scenario resulted in a decrease of 105.30 km2, with conversions to various land categories, while the lowest reduction was under the natural development scenario at 14.27 km2. Grassland area decreased by 63.6 km2 and 130.12 km2 under the natural development and economic development scenarios, respectively. Under the natural development scenario, grassland was mainly converted to agricultural land. However, under the ecological protection and balanced development scenarios, grasslands increased by 36.82 km2 and 50.99 km2, respectively. Construction land and grassland exhibited opposite trends. Construction land decreased by 8.40 km2 and 88.44 km2 under the ecological protection and balanced development scenarios, respectively. However, it increased by 5.06 km2 and 65.54 km2 under the natural development and economic development scenarios, respectively. Unutilized land followed the same trend as construction land, but the changes were minor, with none exceeding 10 km2.
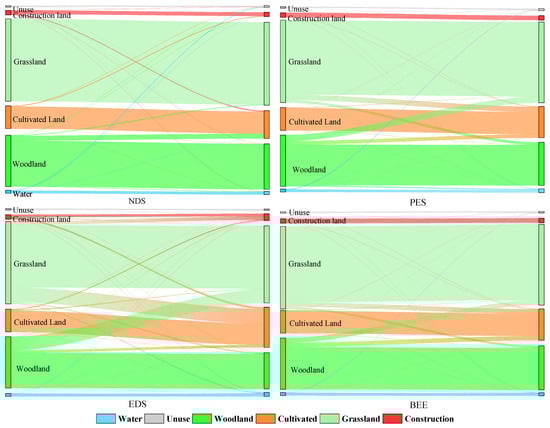
Figure 7.
LULC transfer under four scenarios in 2030.
Based on the contribution analysis of the PLUS model, the primary driving factor influencing land-use change is the Digital Elevation Model (DEM). This is due to the unique climatic conditions of the arid and hot river valley regions, which result in farmlands being more likely to cluster in valley areas. Low-altitude regions with gentle slopes are the main drivers for agricultural land development. Grasslands are mostly located at medium DEM levels, transitioning to farmlands at lower levels and to forests at higher levels, exhibiting extensive continuity predominantly on sun-facing slopes. The next significant factor is GDP. Areas with high GDP are primarily used for construction, leading to a highly clustered expansion of built-up land. Distances to roads, as well as climate, and precipitation, have a relatively minor impact on land types.
To compare the expansion capacities of each LULC type under different scenarios, we extracted the expansion parts of LULC in 2030 relative to 2020 to explore and compare the changes in LULC. The results indicated that the LULC expansion distribution varied across different scenarios in the dry-hot river valley area of Yuanmou. Under the natural development scenario, agricultural land was the primary expanding LULC type, exhibiting scattered expansion throughout the study area. A small amount of construction land was distributed in the northern part of the region, while grassland, woodland, water bodies, and unused lands did not significantly expand. Under the ecological protection scenario, the expansion of agricultural land was pronounced and was distributed throughout the study area. Grasslands primarily expanded linearly from top to bottom in the western part of the study area. Woodland and construction land mainly expanded around the perimeter of the study area. Again, no noticeable expansion was observed for water bodies and unused lands. Under the economic development scenario, with the exception of unused lands, all land categories demonstrated significant expansion with clear demarcations between them. Agricultural land displayed the largest expansion, covering the entire region. Grasslands were distributed in a ring-like pattern on the edges of the study area, while woodlands primarily expanded in the southern part. Construction lands were predominantly clustered in the northern part, forming a vertical band distribution in the west. Water body expansion regions were mainly found surrounding agricultural land. Under the balanced development scenario, agricultural land expansion was the most noticeable, spreading sporadically within the study area. Grasslands mainly expanded in a band-like pattern from top to bottom in the western part, while construction lands focused on the central part of the study area. No apparent expansion was observed for water bodies, woodlands, and unused lands. From a spatial and topographic distribution perspective, the expanded agricultural lands were mainly located around the county town in gully areas with elevations less than 1600 m. They were predominantly found in the lower valley bottoms and valley slopes of approximately 1500 m in the central county region. Woodlands were mainly located around the county’s perimeter and in areas with elevations of 1700 m and above. Construction lands were primarily found in more concentrated areas of various towns and villages. Some construction areas around the central city expanded outward, but not prominently, while the rest were scattered amidst agricultural lands.
3.2. Optimal Scenario Comparative Analysis
Differences in landscape patterns under each scenario were compared by calculating six landscape indices. As depicted in Figure 8, the number of patches under the natural development scenario exceeded that of the other scenarios. Furthermore, the scenario with high habitat quality spatial constraints and optimal ecological protection exhibited the fewest patches, indicating that spatial constraints on habitat quality reduced landscape fragmentation. Scenarios without constraints tended to result in an increase in patch numbers. Except for the balanced development scenario, the changes in NP value and DIVISION were consistent across other scenarios. Under natural development, the NP and DIVISION values were the highest, registering at 68.7 and 0.89, respectively, suggesting that as NP values increased, the aggregation degree of original patches in the area also increased. Overall, the degree of landscape fragmentation under the ecological protection and economic development scenarios was lower than that under the other two scenarios. Regarding landscape diversity indices, the trend in the SHDI values was as follows: economic development scenario > natural development scenario > balanced development scenario > ecological protection scenario, with the highest value reaching 1.45. This result indicates a direct correlation between human activity interference intensity and landscape heterogeneity. Under the ecological protection and balanced development scenarios with habitat quality spatial constraints, the SHDI values were lower than those in the unconstrained natural development and economic development scenarios. This result implies that the RESI can effectively reduce landscape heterogeneity. The SHEI changes aligned with the SHDI. In terms of aggregation indices, differences in COHESION across scenarios were not pronounced, essentially remaining stable and all exceeding 98. There was a noticeable variation in CONTAG values; those in the ecological protection and balanced development scenarios surpassed those in the natural development and economic development scenarios, with the highest reaching 50.6. This result demonstrates that, under ecological constraints, landscape transitions in the area were more concentrated, with higher aggregation and connectivity. In general, the greater the intensity of unconstrained agricultural and urban development in the region is, the lower the aggregation and connectivity between patches, underscoring the importance of using ecological constraints to safeguard biological connectivity. In conclusion, under habitat quality spatial and PLUS model numerical and spatial constraints, there were significant differences in landscape level indices across the four scenarios. Fragmentation and heterogeneity in the ecological protection scenario were less than those in the other three scenarios, with higher aggregation. Moreover, in the economic development scenario, which experienced the most agricultural and urban expansion, fragmentation and heterogeneity exceeded those of the other three scenarios, but its aggregation surpassed that of the other three scenarios. This result emphasized that future development scenarios without ecological constraints will aggravate landscape fragmentation and heterogeneity.
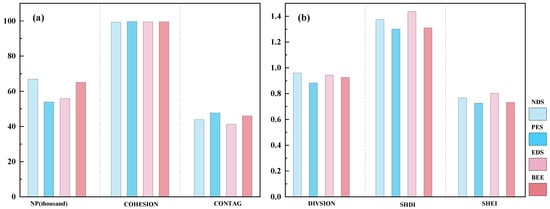
Figure 8.
Comparison of landscape metrics under different scenarios:(a) includes NP, COHESION and CONTAG, (b) includes DIVIDION, SHDI and SHEI.
4. Discussion
4.1. LULC Transition Intensity
The inhibition and suppression patterns in LULC transition intensity effectively captured the changes between land categories. Under the natural scenario for 2030, the study area’s water bodies tended to replace forests and unused land to augment their overall area, inhibiting area acquisition from cultivated lands and the other four categories. Six categories transformed into forested areas showed suppression, leading to limited or no increase in forested areas. During expansion, cultivated lands tended to replace grasslands, forests, and unused lands, and acquisition from water bodies and construction areas was limited. Grasslands tended to expand from forest areas, inhibiting acquisition from water bodies and the other five categories. Construction areas tended to expand from cultivated lands and unused lands. Unused lands leaned toward occupying areas from water bodies, grasslands, and construction areas. Under the ecological protection scenario, water bodies preferred to replace forested and unused lands; forests aimed to acquire areas from grasslands; cultivated lands aimed to occupy areas from forests, grasslands, and unused lands; all six categories transitioning into construction lands were suppressed; and unused lands leaned toward occupying construction areas while inhibiting expansion into other categories. Under the economic development scenario, water bodies tended to acquire areas from unused lands; all categories transitioning into forests were suppressed; and unused lands leaned toward acquiring areas from water bodies and construction lands. In the balanced scenario, water bodies preferred to occupy forest and unused areas, aligning with the dry periods and the arid valley climate, leading to exposed rock becoming unused land.
4.2. LULC Change
The study selected 1990 as the time node when tropical crops began to be planted in the Yuanmou dry-hot valley [38]. During this period, the development of cultivated land was slow, the economy lagged, and the landscape was primarily grassland. Due to the ecological forest restoration plan initiated in 2000 in the upper reaches of the Yangtze River, protective forests began to be planted in the region, leading to an increase in woodland and a decrease in cultivated land from 2000 to 2010 [39]. In 2010, farmers spontaneously initiated an unofficial action called the “Gully Reclamation Project”, transforming severely eroded areas into fruit and vegetable gardens [40]. The reservoir created by the Wudongde Hydropower Station in the upper reaches of the Jinsha River in 2020 led to a significant increase in the water body area and a decline in grassland between 2010 and 2020. During the LULC simulation, the RESI was utilized for ecological constraints, ensuring future scenario construction in ecologically sound environments. This increased the aggregation of LULC changes, making transfers between land types more compact, and, to some extent, altering the original direction of LULC conversion. Under these constraints, forest and grassland with higher ecosystem services were not converted to cultivated and construction land. However, forest and grassland not within the spatial constraint scope increased their conversion to cultivated and construction areas. This result indicates that this method can minimize the adverse impacts of regional development on the environment and simulate LULC changes more accurately. The spatial distribution of habitat quality was closely linked to the spatial distribution of LULC types. Areas with poor habitat quality were primarily construction lands, good quality areas were mainly cultivated lands, and optimal quality areas were predominantly forests. This information can provide a scientific basis for optimizing LULC patterns. However, excluding the ecological protection scenario, there was a declining trend in forest area, with an increasing trend for cultivated land, grassland, and water bodies. Nevertheless, simulations based on historical LULC data (1990 and 2020) resulted in a similar declining trend for forests by 2030. This aligns with existing research suggesting that models struggle to fully simulate policy and economic influences. Given the low forest coverage in the Yuanmou dry-hot valley area and the dominant vegetation being sparse trees and shrubs, this study categorized them as grasslands [5,41]. Using the PLUS model, predictions were made for the quantity and spatial distribution of LULC types in the Yuanmou dry-hot valley by 2030. As a typical agricultural county with excellent heat and sunlight conditions, cultivated land became the leading LULC type in this research area, covering the most extensive area [42]. As a dry-hot valley area with hot and arid climates and water body shortages, the water body area grew synchronously with cultivated land area. Unused lands were mainly distributed around rivers in recession zones and river beaches. These areas are challenging to convert into other LULC types but can easily be submerged during the flood season, turning into water bodies. Meanwhile, existing studies have shown that grading ecological constraints during the LULC simulation process and combining them with different simulation scenarios can more accurately simulate the complex process of LULC change [3,43]. Low habitat quality indicates a poor ecological environment in the area. In such cases, the area should be prioritized for ecological protection. Good habitat quality indicates a relatively healthy ecological environment that is suitable for some development to compensate for the lack of development in low-quality habitats. Areas with optimal habitat quality are generally forests. Limited development on the basis of ecological protection benefits regional growth. Using habitat quality space for multi-scenario simulation ecological constraints, compared to broad ecological regional divisions, was more conducive to the ecological protection of smaller research areas, offering more precise protection for ecology.
4.3. Landscape-Level Indices
Landscape patterns offer a straightforward quantitative analysis of landscape composition and spatial features within a region [44,45]. Under different simulation scenarios, the landscape patterns varied significantly. Natural development and economic development scenarios resulted in more fragmented landscapes. The economic development scenario offered the best landscape richness and evenness and maintained the best landscape heterogeneity. However, due to spatial constraints in the ecological protection scenario, both landscape richness and aggregation were lower. The balanced scenario, which considered both ecological protection and economic development, was at a moderate level across all landscape indices. Hence, depending on various urban planning and ecological protection goals, it is essential to choose the best development approach. The PLUS model can simultaneously constrain both the quantity and spatial distribution of future LULC/cover. This allows for a more flexible transition between LULC types under ecological constraints, greatly improving the balance between ecological conservation and urban development. Moreover, the model proposed in this study can be integrated with the fuzzy multi-objective linear programming model (FMOLP) to establish a combined multi-objective scenario simulation [46], ensuring that future LULC simulations align better with regional development by incorporating natural factors, social aspects, and government policies to improve accuracy.
5. Conclusions
The RESI-PLUS model was proposed, which takes different RESI levels as ecological constraints and couples them with a multi-scenario simulation of LULC. The model was used to simulate LULC in the Yuanmou in 2030 under four scenarios, and the LULC change and landscape pattern characteristics of the simulation results were analyzed at the study. The conclusions are as follows:
- 1.
- Between 1990 and 2020, over a 30-year span, all land categories, except for grassland, expanded. Nonetheless, grassland remained the predominant land type. The area of cultivated land saw the most significant increase, indicating that it will be the primary region for expansion in the future.
- 2.
- The three ecological constraints constructed using RESI play a positive role in the protection of the ecological environment and land resources. This effect is most pronounced under the PES scenario, where the proportion of ecological land-use increases. However, under the BEE scenario, due to intense human activities, there is a decrease in the proportion of ecological land-use. The extent of ecological damage in this scenario is still greater than that in the NDS scenario.
- 3.
- Analysis of LULC (Land-use and Land Cover) transition intensity indicates that water bodies tend to transition to unused land, followed by grasslands and forests. Forests have a tendency to transition to grasslands; cultivated lands are inclined to acquire areas from grasslands and forests; grasslands favor acquisition from forests; and built-up areas tend to derive from unused land and grasslands; while unused lands lean towards transitioning from water bodies and grasslands.
- 4.
- Based on the analysis of landscape-level indices, the PES scenario exhibits a favorable ecological environment. However, the BEE scenario presents a relatively low overall level of landscape pattern disruption. Considering the economic development and ecological characteristics of the region, an optimal development scenario was selected.
The RESI-PLUS model, by introducing RESI as an ecological land protection objective in future land-use simulations, provides a reference for ecological conservation and sustainable economic development in the Yuanmou dry-hot valley. Future scenario studies aim to integrate regional policy-driven factors with a diversified ecological function evaluation approach, thereby integrating ecological civilization protection into land planning policies more objectively.
Author Contributions
Q.J. designed the idea, conducted the data analysis, and wrote the paper. Z.S. and L.Z. helped revise the manuscript. Q.L., G.H. and L.H. helped with the validation. All authors have read and agreed to the published version of the manuscript.
Funding
This study was funded by the Yunnan Provincial Science and Technology Key Research Program Project (Grant No. 202101AS070019), the Natural Ecological Monitoring Network Monitoring Project of Yunnan Province (Grant No. 2023-YN-18), the Yunnan Normal University Graduate Student Research Innovation Fund (Grant No. YJSJJ23-B140), the Yunnan Normal University Graduate Student Research Innovation Fund (Grant No. YJSJJ23-B152), and the Yunnan Normal University Graduate Student Research Innovation Fund (Grant No. YJSJJ23-A22).
Informed Consent Statement
Written informed consent has been obtained from the patient(s) to publish this paper.
Data Availability Statement
All relevant data sets in this study are described in the manuscript.
Conflicts of Interest
The authors declare no conflict of interest.
References
- Peng, W.; Zhou, J. Development of Land Resources in Transitional Zones Based on Ecological Security Pattern: A Case Study in China. Nat. Resour. Res. 2018, 28, 43–60. [Google Scholar] [CrossRef]
- Samat, N.; Hasni, R.; Elhadary, Y.A.E. Modelling LULC Changes at the Peri-Urban Areas using Geographic Information Systems and Cellular Automata Model. J. Sustain. Dev. 2011, 4, 72–84. [Google Scholar] [CrossRef]
- Li, Y.; Liu, X.; Wang, Y.; He, Z. Simulating multiple scenarios of LULC/cover change using a coupled model to capture ecological and economic effects. Land Degrad. Dev. 2023, 34, 2862–2879. [Google Scholar] [CrossRef]
- Zeng, B.; Zhang, F.; Zeng, W.; Yan, K.; Cui, C. Spatiotemporal Heterogeneity in Runoff Dynamics and Its Drivers in a Water Conservation Area of the Upper Yellow River Basin over the Past 35 Years. Remote Sens. 2022, 14, 3628. [Google Scholar] [CrossRef]
- Luo, J.; Ma, X.; Wang, L.; Zhang, B.; Yang, X.; Yue, T. The Influence of Short-Term Heavy Rainfall on Hydraulic Characteristics and Rill Formation in the Yuanmou Dry-Hot Valley. Int. J. Environ. Res. Public Health 2022, 19, 15232. [Google Scholar] [CrossRef]
- Lambin, E.F.; Turner, B.L.; Geist, H.J.; Agbola, S.B.; Angelsen, A.; Bruce, J.W.; Coomes, O.T.; Dirzo, R.; Fischer, G.; Folke, C.; et al. The causes of land-use and land-cover change: Moving beyond the myths. Glob. Environ. Chang. 2001, 11, 261–269. [Google Scholar] [CrossRef]
- Lambin, E.F.; Geist, H.J.; Lepers, E. Dynamics of Land-Use and Land-Cover Change in Tropical Regions. Annu. Rev. Environ. Resour. 2003, 28, 205–241. [Google Scholar] [CrossRef]
- Lan, Y.; Chen, J.; Yang, Y.; Ling, M.; You, H.; Han, X. Landscape Pattern and Ecological Risk Assessment in Guilin Based on LULC Change. Int. J. Environ. Res. Public Health 2023, 20, 2045. [Google Scholar] [CrossRef]
- Li, J.; Oyana, T.J.; Mukwaya, P.I. An examination of historical and future LULC changes in Uganda using change detection methods and agent-based modelling. Afr. Geogr. Rev. 2016, 35, 247–271. [Google Scholar] [CrossRef]
- Sun, X.; Crittenden, J.C.; Li, F.; Lu, Z.; Dou, X. Urban expansion simulation and the spatio-temporal changes of ecosystem services, a case study in Atlanta Metropolitan area, USA. Sci. Total Environ. 2018, 622, 974–987. [Google Scholar] [CrossRef] [PubMed]
- Zhou, L.; Dang, X.; Sun, Q.; Wang, S. Multi-scenario simulation of urban land change in Shanghai by random forest and CA-Markov model. Sustain. Cities Soc. 2020, 55, 102045. [Google Scholar] [CrossRef]
- Clarke, K.C.; Hoppen, S.; Gaydos, L. A Self-Modifying Cellular Automaton Model of Historical Urbanization in the San Francisco Bay Area. Environ. Plan. B Plan. Des. 1997, 24, 247–261. [Google Scholar] [CrossRef]
- Liang, X.; Liu, X.; Li, X.; Chen, Y.; Tian, H.; Yao, Y. Delineating multi-scenario urban growth boundaries with a CA-based FLUS model and morphological method. Landsc. Urban Plan. 2018, 177, 47–63. [Google Scholar] [CrossRef]
- Liang, X.; Guan, Q.; Clarke, K.C.; Liu, S.; Wang, B.; Yao, Y. Understanding the drivers of sustainable land expansion using a patch-generating LULC simulation (PLUS) model: A case study in Wuhan, China. Comput. Environ. Urban Syst. 2021, 85, 101569. [Google Scholar] [CrossRef]
- Boumans, R.; Roman, J.; Altman, I.; Kaufman, L. The Multiscale Integrated Model of Ecosystem Services (MIMES): Simulating the interactions of coupled human and natural systems. Ecosyst. Serv. 2015, 12, 30–41. [Google Scholar] [CrossRef]
- Li, X.; Fu, J.; Jiang, D.; Lin, G.; Cao, C. LULC optimization in Ningbo City with a coupled GA and PLUS model. J. Clean. Prod. 2022, 375, 134004. [Google Scholar] [CrossRef]
- Yang, J.; Li, J.; Fu, G.; Liu, B.; Pan, L.; Hao, H.; Guan, X. Spatial and Temporal Patterns of Ecosystem Services and Trade-Offs/Synergies in Wujiang River Basin, China. Remote Sens. 2023, 15, 4099. [Google Scholar] [CrossRef]
- Carpenter, S.R.; Mooney, H.A.; Agard, J.; Capistrano, D.; DeFries, R.S.; Díaz, S.; Dietz, T.; Duraiappah, A.K.; Oteng-Yeboah, A.; Pereira, H.M. Science for managing ecosystem services: Beyond the Millennium Ecosystem Assessment. Proc. Natl. Acad. Sci. USA 2009, 106, 1305–1312. [Google Scholar] [CrossRef] [PubMed]
- Nie, W.; Xu, B.; Ma, S.; Yang, F.; Shi, Y.; Liu, B.; Hao, N.; Wu, R.; Lin, W.; Bao, Z. Coupling an Ecological Network with Multi-Scenario LULC Simulation: An Ecological Spatial Constraint Approach. Remote Sens. 2022, 14, 6099. [Google Scholar] [CrossRef]
- Li, F.; Wang, L.; Chen, Z.; Clarke, K.C.; Li, M.; Jiang, P. Extending the SLEUTH model to integrate habitat quality into urban growth simulation. J. Environ. Manag. 2018, 217, 486–498. [Google Scholar] [CrossRef] [PubMed]
- Li, Y.; Ma, Q.; Song, Y.; Han, H. Bringing conservation priorities into urban growth simulation: An integrated model and applied case study of Hangzhou, China. Resour. Conserv. Recycl. 2019, 140, 324–337. [Google Scholar] [CrossRef]
- Nie, W.; Xu, B.; Yang, F.; Shi, Y.; Liu, B.; Wu, R.; Lin, W.; Pei, H.; Bao, Z. Simulating future LULC by coupling ecological security patterns and multiple scenarios. Sci. Total Environ. 2023, 859, 160262. [Google Scholar] [CrossRef] [PubMed]
- Tonra, C.M.; Marra, P.P.; Holberton, R.L. Migration phenology and winter habitat quality are related to circulating androgen in a long-distance migratory bird. J. Avian Biol. 2011, 42, 397–404. [Google Scholar] [CrossRef]
- Wei, W.; Bao, Y.; Wang, Z.; Chen, X.; Luo, Q.; Mo, Y. Response of habitat quality to urban spatial morphological structure in multi-mountainous city. Ecol. Indic. 2023, 146, 109877. [Google Scholar] [CrossRef]
- Li, S.; Congmou, Z.; Li, Y.; Dong, B.; Tan, K.; Deng, X. Agricultural space function transitions in rapidly urbanizing areas and their impacts on habitat quality: An urban–Rural gradient study. Environ. Impact Assess. Rev. 2023, 99, 107019. [Google Scholar] [CrossRef]
- Zhu, D.; Chen, T.; Wang, Z.; Niu, R. Detecting ecological spatial-temporal changes by Remote Sensing Ecological Index with local adaptability. J. Environ. Manag. 2021, 299, 113655. [Google Scholar] [CrossRef] [PubMed]
- Bajaj, R.; Sen, R.; Sengupta, A.; Sen, A.; Karmakar, S.; Ghosh, S.; Kumar, V.; Debabhuti, N.; Sharma, P.; Tudu, B.; et al. Low-Cost Air Pollution Monitoring Device Based on Air Quality Index. SSRN Electron. J. 2020. [Google Scholar] [CrossRef]
- Hosseini, H.; Shakeri, A.; Rezaei, M.; Dashti Barmaki, M.; Shahraki, M. Application of water quality index (WQI) and hydro-geochemistry for surface water quality assessment, Chahnimeh reservoirs in the Sistan and Baluchestan Province. Iran. J. Health Environ. 2019, 11, 575–586. [Google Scholar]
- Mizuta, K.; Grunwald, S.; Phillips, M.A. New Soil Index Development and Integration with Econometric Theory. Soil Sci. Soc. Am. J. 2018, 82, 1017–1032. [Google Scholar] [CrossRef]
- Xu, H.; Wang, M.; Shi, T.; Guan, H.; Fang, C.; Lin, Z. Prediction of ecological effects of potential population and impervious surface increases using a remote sensing based ecological index (RSEI). Ecol. Indic. 2018, 93, 730–740. [Google Scholar] [CrossRef]
- Yuan, Z.; Gong, Y.; Chen, M. Quantity-Flexibility Contract Models for the Supply Chain with Green-Sensitive Demand in the Automotive Manufacturing Industry. In Proceedings of the IFIP International Conference on Advances in Production Management Systems, Novi Sad, Serbia, 30 August–3 September 2020; Springer: Cham, Switzerland, 2021; pp. 441–449. [Google Scholar]
- Xu, Z.; Bin, Z.; Gang-Cai, L. Monitoring of vegetation change in Yuanmou dry-hot valley based on remote sensing. Resour. Environ. Yangtze Basin 2010, 19, 1309–1313. [Google Scholar]
- Gao, L.; Tao, F.; Liu, R.; Wang, Z.; Leng, H.; Zhou, T. Multi-scenario simulation and ecological risk analysis of LULC based on the PLUS model: A case study of Nanjing. Sustain. Cities Soc. 2022, 85, 104055. [Google Scholar] [CrossRef]
- Xu, H.Q. A remote sensing index for assessment of regional ecological changes. China Environ. Sci. 2013, 33, 889–897. [Google Scholar]
- Li, C.; Gao, B.; Wu, Y.; Zheng, K.; Wu, Y. Dynamic simulation of landscape ecological risk in mountain towns based on PLUS model. J. Zhejiang AF Univ. 2022, 39, 84–94. [Google Scholar] [CrossRef] [PubMed]
- Liu, X.; Liu, Y.; Wang, Y.; Liu, Z. Evaluating potential impacts of LULC changes on water supply–demand under multiple development scenarios in dryland region. J. Hydrol. 2022, 610, 127811. [Google Scholar] [CrossRef]
- Li, S.; Jian, G.; Jianxin, Y.; Guang, C. Characteristics of LULC patterns of the lanzhou-linking urban agglomeration: Based on an intensity analysis framework. Resour. Sci. 2023, 45, 480–493. [Google Scholar] [CrossRef]
- Zhang, D.; Long, H.Y. Research of Four Leguminous Forages Application in an Ecologic Mangifera Indica Orchard of the Dry-hot Valley. Acta Agrestia Sin. 2017, 25, 612. [Google Scholar]
- Lu, S.; Tang, X.; Guan, X.; Qin, F.; Liu, X.; Zhang, D. The assessment of forest ecological security and its determining indicators: A case study of the Yangtze River Economic Belt in China. J. Environ. Manag. 2020, 258, 110048. [Google Scholar] [CrossRef]
- Liu, L.; Xiong, D.Z.; Li, W.; Yuan, Y.; Zhang, B.; Zhang, X. Benefits and ecological risks of Gully Reclamation Project in Yuanmou Dry-hot Valley region. Trans. Chin. Soc. Agric. Eng. 2020, 36, 251–258. [Google Scholar] [CrossRef]
- Su, Z.; Xiong, D.; Dong, Y.; Li, J.; Yang, D.; Zhang, J.; He, G. Simulated headward erosion of bank gullies in the Dry-hot Valley Region of southwest China. Geomorphology 2014, 204, 532–541. [Google Scholar] [CrossRef]
- Peng, S.; Chen, A.; Fang, H.; Wu, J.; Liu, G. Effects of vegetation restoration types on soil quality in Yuanmou dry-hot valley, China. Soil Sci. Plant Nutr. 2013, 59, 347–360. [Google Scholar] [CrossRef]
- Li, Y.; Liu, W.; Feng, Q.; Zhu, M.; Yang, L.; Zhang, J.; Yin, X. The role of LULC change in affecting ecosystem services and the ecological security pattern of the Hexi Regions, Northwest China. Sci. Total Environ. 2023, 855, 158940. [Google Scholar] [CrossRef] [PubMed]
- Ma, X.; Zhang, J.; Wang, P.; Zhou, L.; Sun, Y. Estimating the nonlinear response of landscape patterns to ecological resilience using a random forest algorithm: Evidence from the Yangtze River Delta. Ecol. Indic. 2023, 153, 110409. [Google Scholar] [CrossRef]
- Lilong, L.M.W.; Qiang, X.; Bao, W.Y. Analysis of LULC conversion and landscape pattern change in Taiping lake national wetland park. Environ. Sci. Technol. 2023, 46, 1–11. [Google Scholar] [CrossRef]
- Jakhar, S.K. Performance evaluation and a flow allocation decision model for a sustainable supply chain of an apparel industry. J. Clean. Prod. 2015, 87, 391–413. [Google Scholar] [CrossRef]
Disclaimer/Publisher’s Note: The statements, opinions and data contained in all publications are solely those of the individual author(s) and contributor(s) and not of MDPI and/or the editor(s). MDPI and/or the editor(s) disclaim responsibility for any injury to people or property resulting from any ideas, methods, instructions or products referred to in the content. |
© 2023 by the authors. Licensee MDPI, Basel, Switzerland. This article is an open access article distributed under the terms and conditions of the Creative Commons Attribution (CC BY) license (https://creativecommons.org/licenses/by/4.0/).