Article

Exploring the Impact of Potassium on Growth, Photosynthetic Performance, and Nutritional Status of Lemon Trees (cv. Adamopoulou) Grafted onto Sour Orange and Volkamer Lemon Rootstocks

by
Ioannis E. Papadakis
1,*,
Evangelia-Vasiliki Ladikou
1,
Alexia Oikonomou
1,
Theocharis Chatzistathis
2 and
Georgia Chatziperou
1
1
Laboratory of Pomology, Department of Crop Science, Agricultural University of Athens, Iera Odos 75, 11855 Athens, Greece
2
Hellenic Agricultural Organization (ELGO) ‘DIMITRA’, Institute of Soil and Water Resources, Thermi, 57001 Thessaloniki, Greece
*
Author to whom correspondence should be addressed.
Sustainability 2023, 15(22), 15858; https://doi.org/10.3390/su152215858
Submission received: 29 September 2023 / Revised: 7 November 2023 / Accepted: 10 November 2023 / Published: 11 November 2023
(This article belongs to the Section Sustainable Agriculture)

Abstract

:
(1) Background: This study investigates the effects of potassium (K) and rootstock on the growth, photosynthetic activity, and mineral nutrition of lemon trees; (2) Methods: Lemon trees (cv. Adamopoulou) grafted onto sour orange (Citrus aurantium) (SO) or Volkamer lemon (Citrus volkameriana) (VL) rootstock were cultivated hydroponically under 0.00, 0.75, 1.50, 3.00, and 6.00 mM K. Plant growth and nutrition parameters, as well as leaf photosynthetic rate, stomatal conductance, transpiration rate, intracellular CO2, chlorophyll, and carotenoid concentration were assessed; (3) Results: Under K deficiency (0 mM K), plants exhibited chlorotic and necrotic symptoms, more pronounced in older leaves. Potassium deficiency adversely affected various physiological processes in lemon leaves, including a decrease in photosynthesis rate, stomatal conductance, transpiration rate, intercellular CO2 concentration, water use efficiency, CO2 utilization efficiency, chlorophyll a/b ratio, and carotenoid concentrations (some effects were rootstock-dependent). Low photosynthetic rates under K deficiency were due to both stomatal- and non-stomatal limitations. Elevated K in the nutrient solution consistently reduced the total plant uptake of P, Ca, Mg, B, Mn, and Zn, resulting in nutrient imbalances, as evidenced by the significant decrease in P, Ca, Mg, and Zn concentrations found in scion tissues (especially at the 6 mM K treatment). Rootstock-dependent responses were also observed in scion leaf and stem growth and in mineral nutrient concentrations, uptake, and distribution across plant parts; (4) Conclusions: Our study reveals interesting aspects on how to optimize K fertilization in lemon trees in the context of sustainable agriculture by considering nutrient interactions and rootstock-dependent effects. Understanding these complex interactions and improving K fertilization practices is expected to improve lemon tree performance, yield, and fruit quality.

1. Introduction

Lemon (Citrus limon L. Burm.f.) is a highly valued fruit crop, with significant economic and nutritional value worldwide. Lemons are widely used in culinary, medicinal, and industrial applications, making them an integral part of the global economy [1]. Lemon juice is a popular ingredient in marinades, dressings, beverages, and desserts [2,3], while lemon essential oil and lemon peels can be diversely used in food, beverage, cosmetic, and pharmaceutical industries [3]. In addition to their versatility, lemons are known for their high nutritional value. They are rich in vitamins, phenolic compounds (particularly flavonoids and phenolic acids), minerals, antioxidants, and other health-promoting compounds [2,4,5]. Bioactive components in lemons protect against inflammation, microbes, parasites, and cancer and improve the immune system [2,4].
Lemon production crucially contributes to the citrus industry, and its success relies on a variety of factors. In order to obtain high-quality lemons, trees need a specific environment, which includes warm and humid weather, well-drained soil, and plenty of nutrients. However, lemon trees are sensitive to different stresses, including pests, diseases, drought, nutrient deficiencies and toxicities. These stresses may harm their growth and productivity and may affect fruit quality. To sustain the productivity of lemon trees, proper nutrient management is essential. Nutrient deficiencies can cause stunted growth, diminished yields, and compromised fruit quality. Conversely, excessive nutrient levels can be detrimental and induce toxicity in lemon trees. Consequently, maintaining a balanced supply of essential nutrients is crucial in order to optimize the growth of lemon trees [6].
Among the essential nutrients, potassium (K) is a macronutrient that plays a crucial role in the growth and development of plants by regulating numerous physiological and biochemical processes. Potassium is involved in the activation of enzymes, in the control of stomatal opening, as well as in the maintenance of osmotic potential [6,7,8,9]. It is also crucial for essential physiological functions, such as photosynthesis, osmoregulation, enzyme activation, carbohydrate metabolism, and stress tolerance [7,8,10,11]. Insufficient K levels can lead to reduced growth, lower yields, and lower fruit quality, both at the harvest and postharvest stages. In addition, K deficiency increases susceptibility to pests, diseases, drought, chilling, high light intensity, and salinity stresses [8,9,11,12]. On the other hand, limited data exist regarding the impact of excessive K on plants. However, a high K supply may negatively affect (i) plant performance, (ii) growth, (iii) yields, (iv) fruit quality, and (v) mineral nutrition [11,13,14]. Therefore, both insufficient and excessive K may have detrimental effects on lemon trees.
In addition to its direct effects on plant growth, K may also influence the uptake and the distribution of other essential nutrients, including phosphorus, nitrogen, calcium, magnesium, zinc, boron, and copper [6,15,16,17]. The interrelation between K and other mineral elements in plants is complicated and relies on various factors, like plant species, rootstock, developmental stage, and environmental conditions. In Citrus, many studies have investigated the immediate or indirect effects of K on tree growth, yield, fruit quality, nutritional status, and physiological functions among different species, cultivars, and cultivar/rootstock combinations [18,19,20,21]. However, most of these studies were conducted in Citrus orchards worldwide, which encompassed diverse edaphic and climatic conditions. These varying conditions may introduce variability and instability into the results, making it challenging to draw definitive conclusions from a fundamental science perspective. While open orchards have their advantages, controlled environments, such as greenhouses and hydroponics, provide several benefits for plant experimentation, including better control over environmental factors, reduced pest and disease pressure, increased experimental precision, accelerated growth, and shorter experiment duration. In our study, lemon plants were hydroponically cultivated in pots filled with inert material under greenhouse conditions. This approach allowed us to regulate water and nutrient delivery precisely, facilitating the manipulation of K treatments and ensuring an accurate record of the differential effects of K supply on the plants.
Rootstocks play a crucial role in determining the growth, yield, and stress tolerance of Citrus trees by influencing water and nutrient uptake, transport, and distribution, as well as their interaction with soil environment [22,23,24,25]. In lemon cultivation, selecting the appropriate variety based on productivity and fruit quality is essential. However, the choice of rootstock is equally important, since it has a significant impact on crop management, fruit yield, and quality, providing enhanced disease resistance and adaptation to specific edaphoclimatic conditions [23,26]. Hence, evaluating the effects of K on lemon trees that are grafted onto different rootstocks is essential in order to comprehensively understand their interaction and optimize cultivation practices, especially in the context of sustainable agriculture [26].
The aim of this study was to investigate the influence of K on the growth, photosynthetic activity, and mineral nutrition of lemon trees (cv. Adamopoulou) grafted onto sour orange (Citrus aurantium) (SO) and Volkamer lemon (Citrus volkameriana) (VL) rootstocks. The specific goals were:
  • To assess the impact of K fertilization on plant growth parameters, such as dry matter production and its allocation among various plant parts;
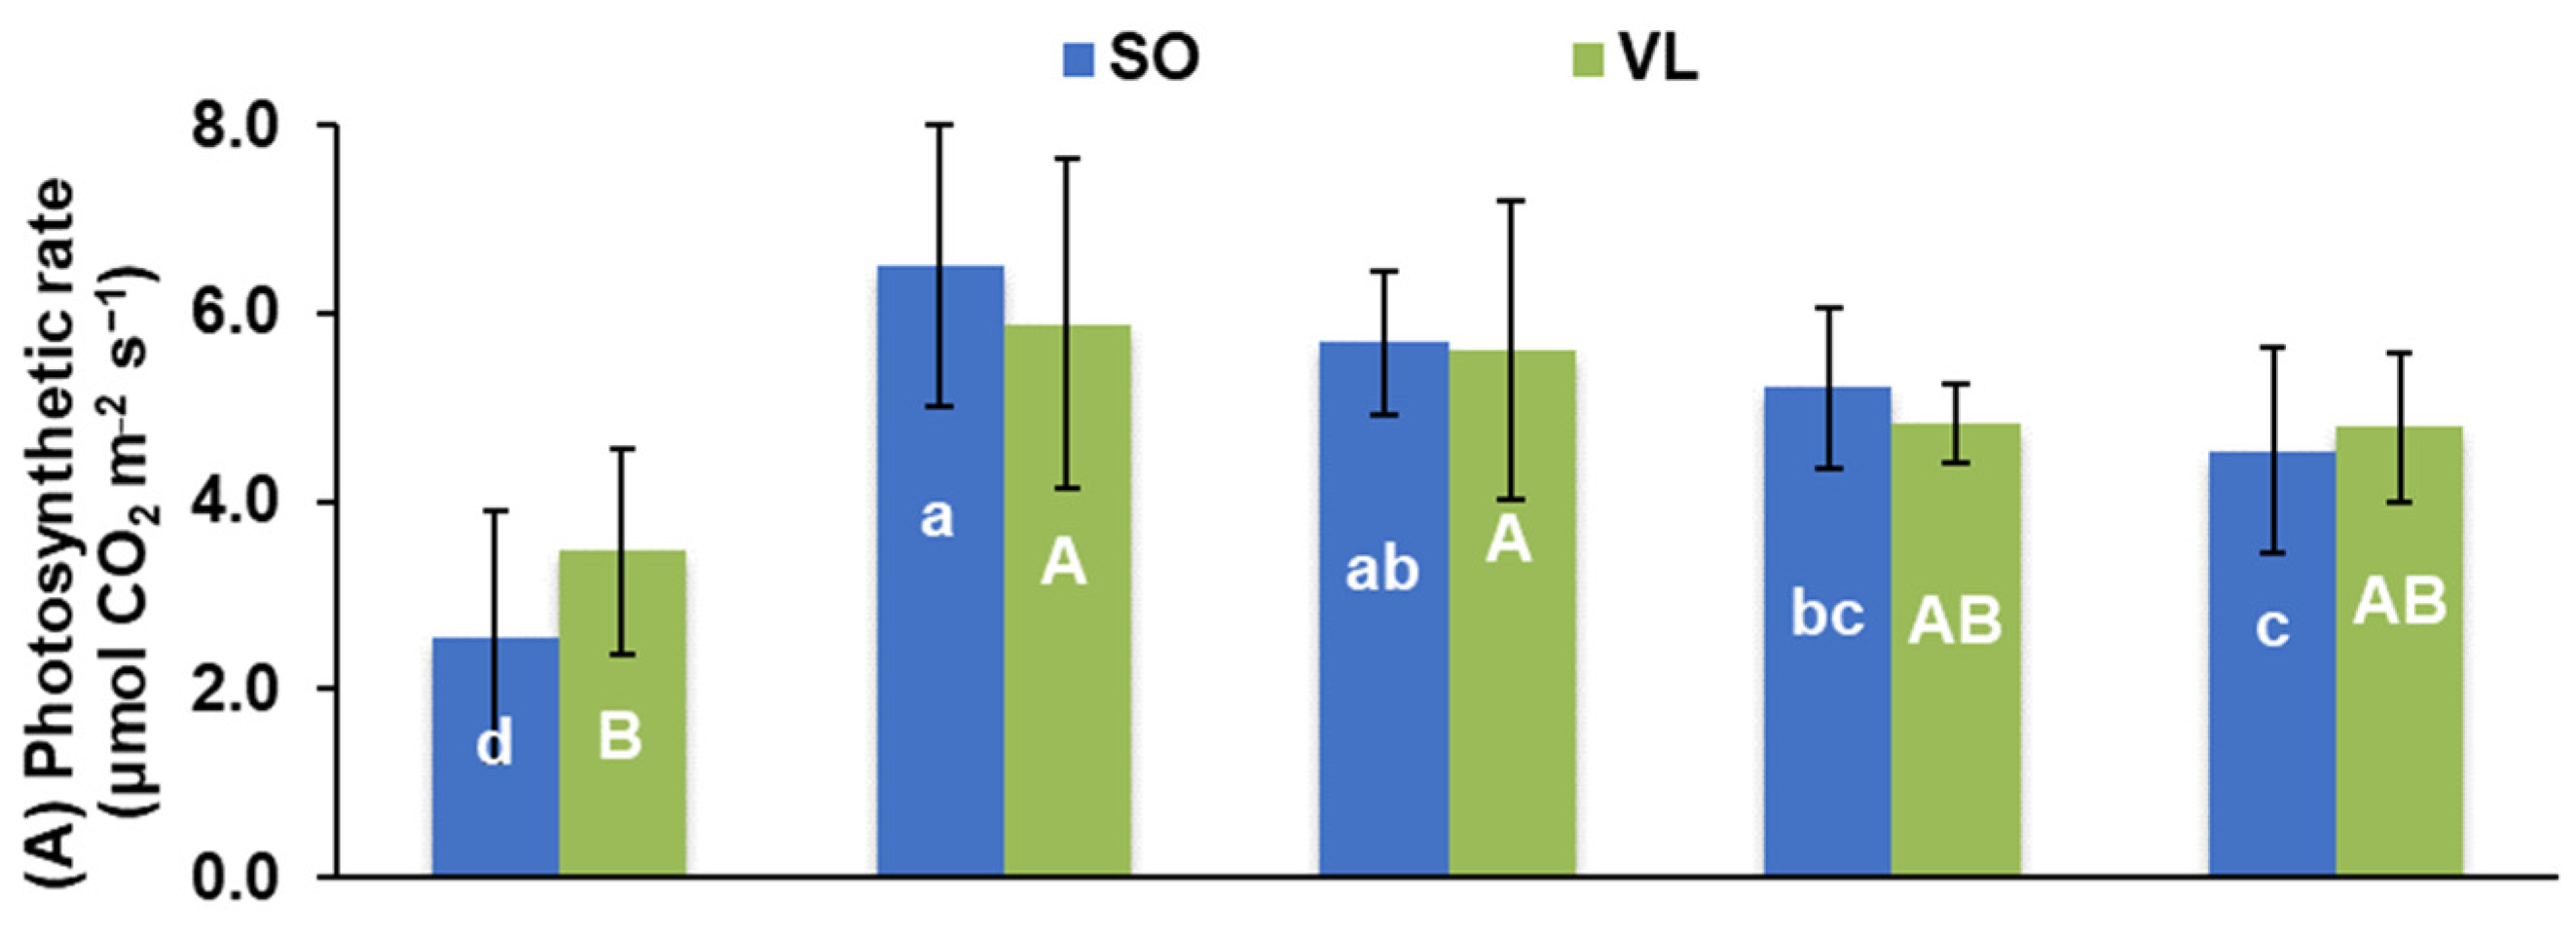
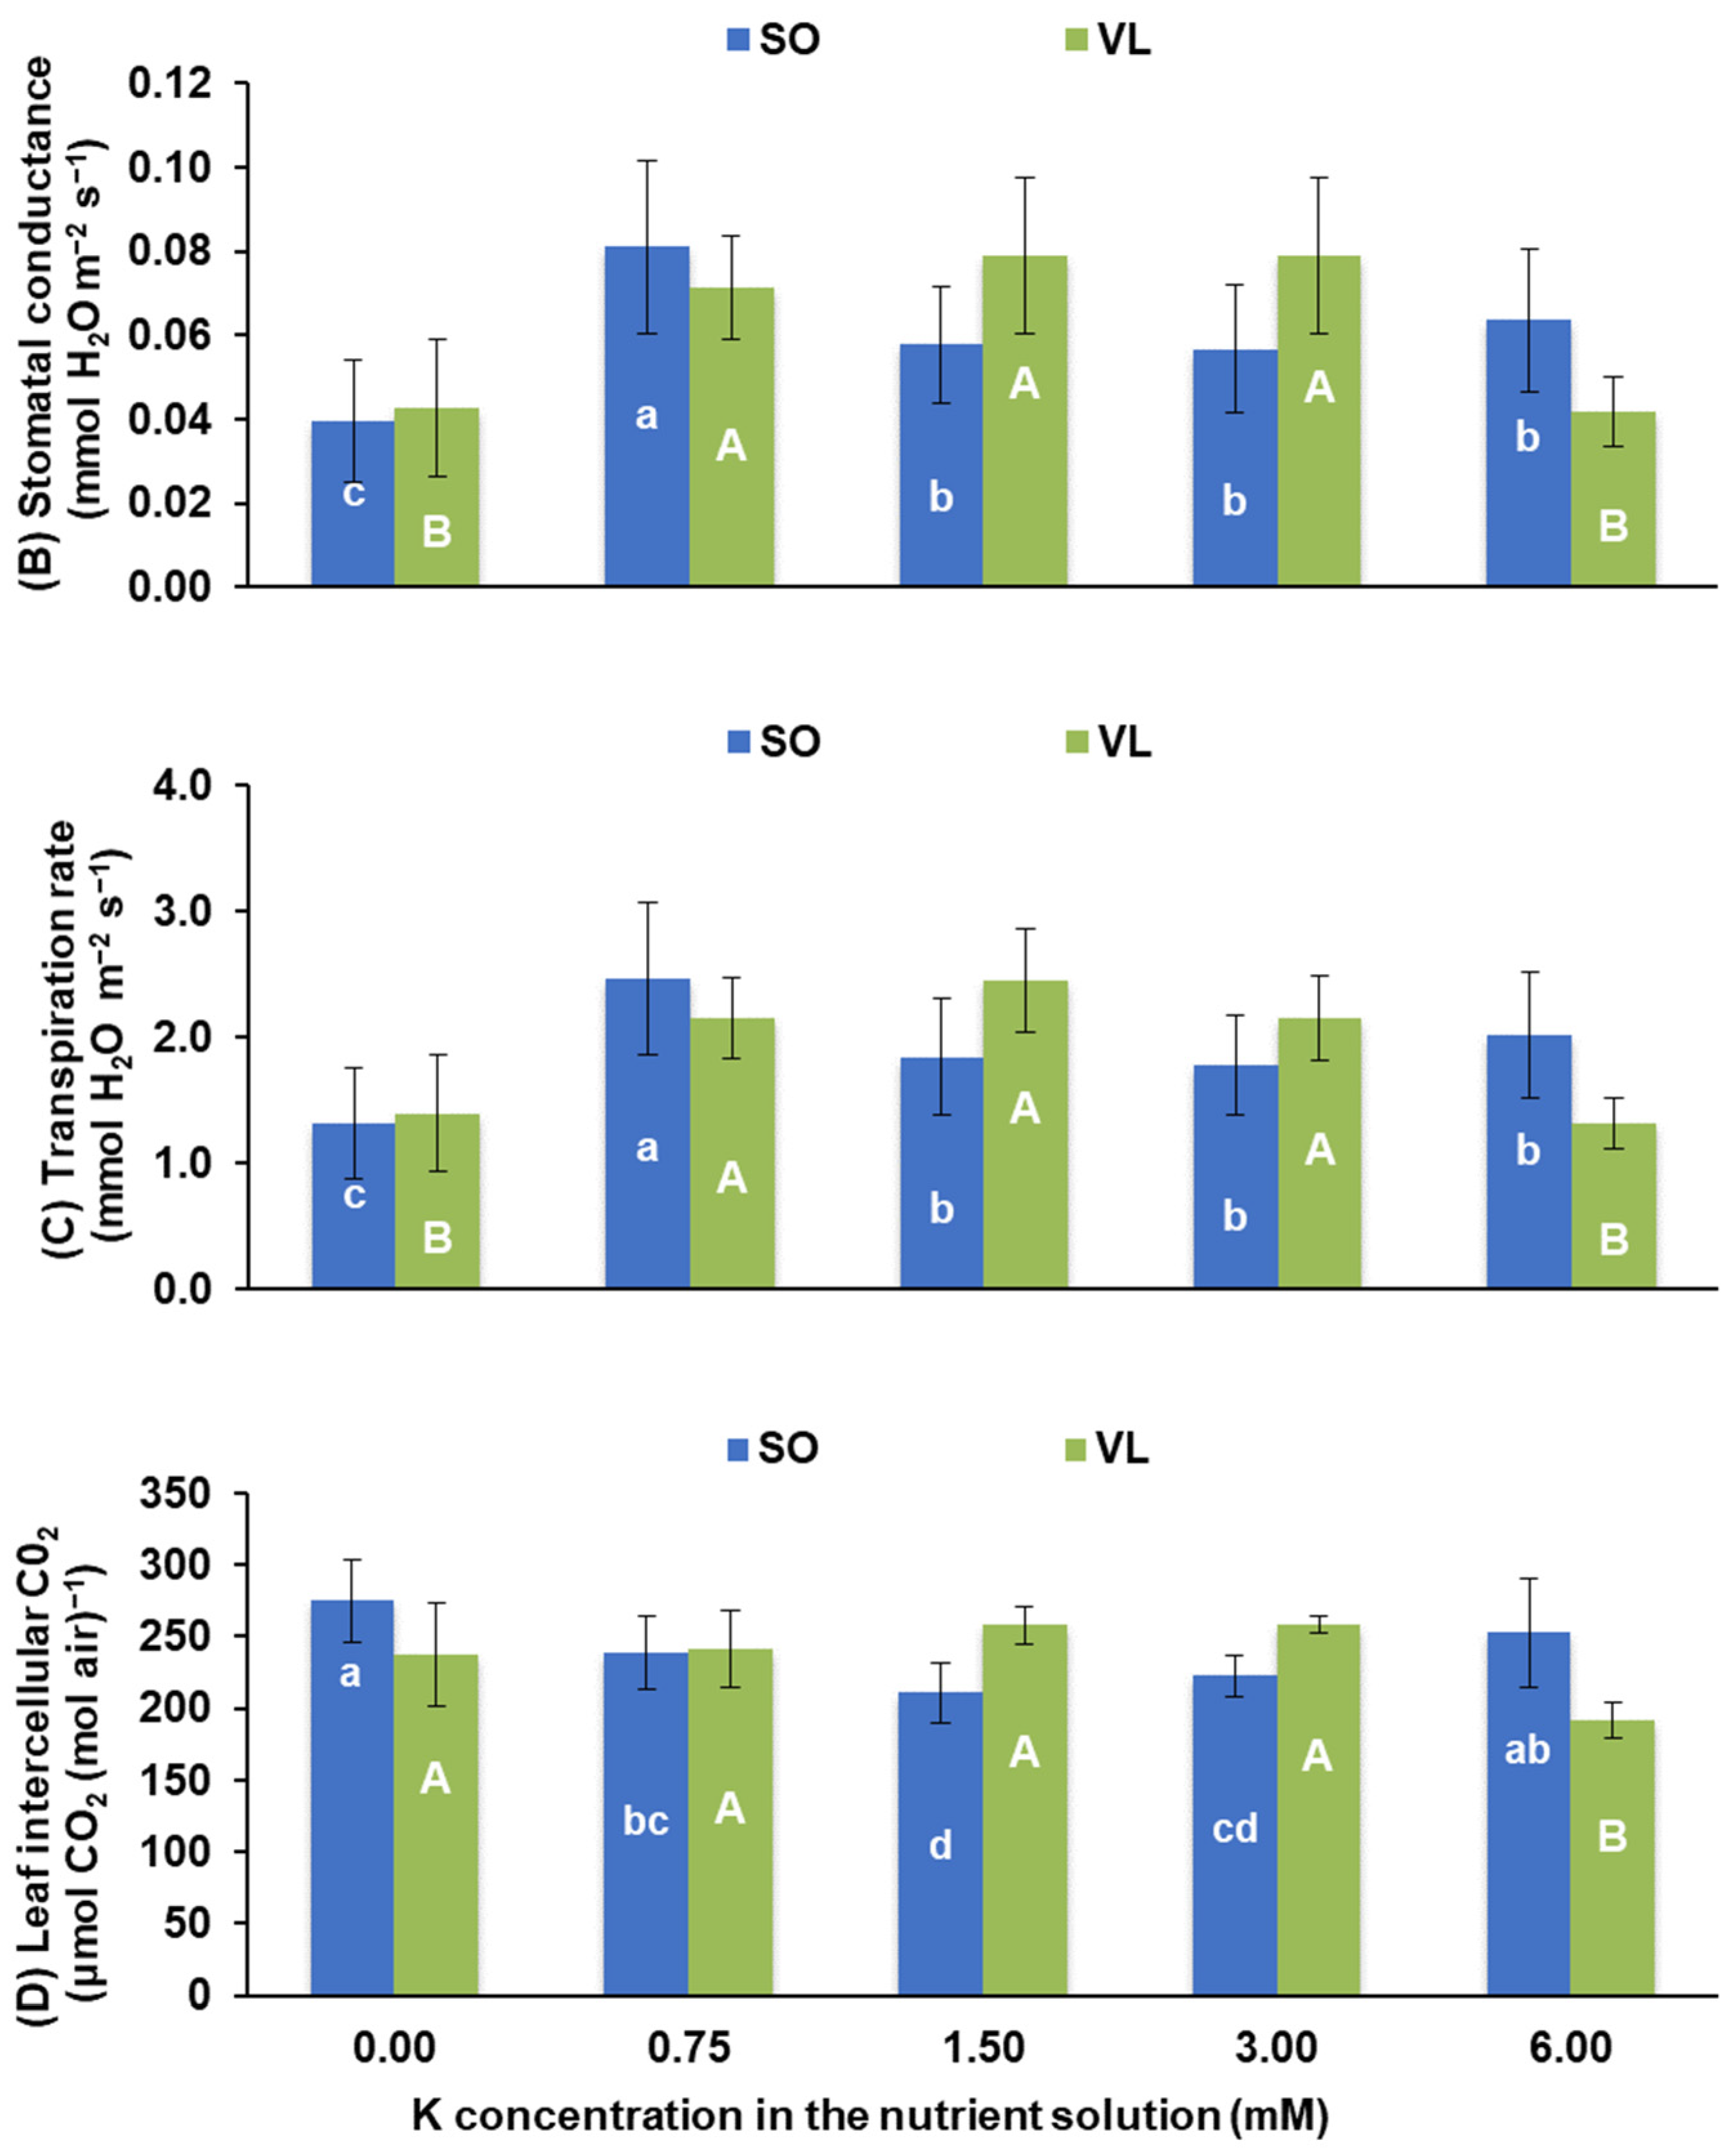
  • To investigate how K influences leaf gas exchange parameters like net photosynthesis, stomatal conductance, and transpiration rate;
  • To investigate how K affects nutrient uptake and distribution within plant tissues.
The findings of the current study will provide interesting insights into the role of K in the growth and physiological processes of lemon trees. By using this information, agronomists and farmers may enhance crop yield in lemon orchards through better K fertilization strategies and may boost their sustainability. Finally, this study will contribute to our understanding of the interaction between rootstock and K in influencing the performance of lemon trees.

2. Materials and Methods

2.1. Plant Material and Experimental Setup

Forty (40) one-and-a-half-year-old bare-rooted lemon plants (Citrus limon cv. Adamopoulou) obtained from a commercial citrus nursery were used in this study. The lemon plants were grafted onto either SO or VL rootstock. Prior to the main experimental activities, the plants underwent rigorous pruning, which involved removing the majority of their root system and a significant portion of the graft, leaving behind only a central stem of the scion approximately 20 cm above the grafting zone. The root system of the plants was washed with tap water so as to remove any residual soil substrate, followed by rinsing with distilled water. The plants were then transplanted into 5 L plastic pots filled with an experimental substrate consisting of 1 part quartz sand and 2 parts perlite, serving as an inert growing medium.
The transplantation of the plants into the experimental cultivation substrate took place in late March. Over the next 2 months, plants received regular irrigation based on their requirements. Additionally, every 15 days, they were fertigated with 0.5 L of a solution created by dissolving 50 g of compound fertilizer 20-20-20 (including trace elements) and 2.5 g of chelated Fe (6% Fe) in 25 L of tap water.

2.2. Experimental Procedure

Once the desirable leaf area was reached (late May), with approximately 12–15 leaves per plant, the main experimental procedure was initiated. All the plants were pruned to achieve an equal number of new shoots and leaves and were divided into five groups of five plants each (replicates) for each rootstock.
From the initiation of K treatments until the end of the experiment, the plants were fertigated three times a week with a modified Hoagland nutrient solution [27]. Macronutrients, excluding K, were supplied at 50% of the recommended concentration in Hoagland’s solution, while micronutrients were supplied at a full-strength (100%) concentration. Different levels of K (treatments) were achieved by adding varying amounts of potassium sulfate (K2SO4, 99+%, for analysis, anhydrous powder, Thermo Fisher Scientific, Waltham, MA, USA) to the nutrient solution, resulting in K levels ranging from 0 mM to 6 mM, i.e., 0.00, 0.75, 1.50, 3.00, and 6.00 mM K. The pH of the nutrient solutions was adjusted to a range of 5.85 to 5.95. Every 15 days, the substrate was flushed with distilled water to eliminate any accumulated salts. The experiment was conducted in a glasshouse, located at the arboretum of the Agricultural University of Athens, with the following coordinates: latitude 37.981860 and longitude 23.705629 (37°58’54.7″ N 23°42’20.3″ E).
After 211 days of experimentation, the first visible symptoms of K deficiency appeared in the basal leaves of the plants treated without K (0 mM K). To assess the physiological response of lemon plants to varying K levels, several measurements were then carried out, including plant growth parameters, evaluation of leaf photosynthetic performance, determination of leaf chlorophyll and carotenoid concentrations, and assessment of the overall nutritional status of the plants.

2.3. Plant Growth

At the end of the experiment, the lemon plants were divided into different parts, including leaves, scion stem, rootstock stem, and roots. In order to remove external contaminants, each plant part was washed with tap water and then washed twice using distilled water. Subsequently, the plant parts were placed in paper bags and dried out in an oven at 75 °C for a minimum of 72 h, or until a constant weight was achieved.
After drying, the plant parts were weighed individually using an analytical balance, and their dry weights were recorded. The weights of the individual plant parts were added in order to calculate the total plant dry weight.

2.4. Leaf Photosynthesis, Chlorophylls, and Carotenoids

To assess the photosynthetic activity of lemon leaves and determine the concentrations of chlorophyll and carotenoids, the following procedures were conducted:
Photosynthetic measurements: At the end of the experiment, fully expanded leaves from the middle of the shoots were selected for photosynthetic measurements. A portable photosynthesis measurement device, Li-6400XT (Li-COR, Lincoln, NE, USA) was used to measure various photosynthetic parameters. The following measurements were performed: (i) net photosynthetic rate (rate of CO2 assimilation by the leaves), (ii) transpiration rate (rate of water vapor loss from the leaves), (iii) intercellular CO2 concentration, and (iv) stomatal conductance (ability of stomata to regulate gas exchange). All these measurements were taken under stable conditions of 1000 μmol m−2 s−1 PAR (photosynthetically active radiation) and a CO2 concentration of 400 mg L−1 air.
Calculation of biologically significant ratios: In addition to photosynthetic parameters, the below-mentioned biologically significant ratios were calculated. CO2 use efficiency was determined by dividing the photosynthetic rate by the intercellular CO2 concentration in the leaves. This ratio provides insights into the efficiency of CO2 utilization during photosynthesis. Instantaneous and intrinsic water use efficiencies were calculated by dividing the photosynthetic rate by either the transpiration rate or stomatal conductance, respectively, indicating the efficiency of water consumption during photosynthesis.
Determination of chlorophylls and carotenoids: Concerning the analysis of chlorophylls and carotenoids, 10 leaf discs, with a diameter of 5 mm each, were collected from the leaves used for the photosynthetic measurements. The fresh weight of the leaf discs was recorded. Then, additional leaf samples were collected and weighed (fresh weight). These samples were then placed in an oven and dried out until a constant weight was achieved. The dry weight of the samples was measured.
To extract chlorophylls and carotenoids, the leaf samples were ground in a mortar, and an 80% acetone (ACS reagent, ≥99.5%, Sigma-Aldrich, St. Louis, MI, USA) solution was gradually added until a final volume of 10 mL was reached. The samples were kept in darkness for 2 h; they were subjected to vortex every fifteen minutes using a Vortex device to facilitate pigment extraction. Afterward, the samples were centrifuged at 3000 rpm for 5 min. The supernatant from each sample was measured in a spectrophotometer at three specific wavelengths: 470 nm, 647 nm, and 663 nm.
Using the absorbance values obtained from the spectrophotometer, the concentrations of chlorophyll a (Chla), chlorophyll b (Chlb), and carotenoids (Car) were calculated using the specific mathematical formulas described by Lichtenthaler and Buschmann [28]:
C h l a = 12.25 A 663 2.79 A 647
C h l b = 21.5 A 647 5.1 A 663
C a r = 1000 A 470 1.82 C h l a 85.02 C h l b 198
These measurements and calculations provided insights into the photosynthetic performance of the lemon leaves and the concentrations of photosynthetic pigments, which are essential for understanding leaf physiological status and their ability to capture and utilize light energy for photosynthesis.

2.5. Determination of Plant Nutrient Concentrations

The following procedures were performed in order to determine nutrient concentrations in plant tissues:
Sample preparation: A laboratory grinding mill was used to turn the dried plant parts into a fine powder. One gram of ground dry plant material was accurately weighed and placed in porcelain crucibles. The plant samples in the crucibles were subjected to dry ashing in a laboratory furnace at a temperature of 550 °C for 5.5 h.
Extraction of inorganic elements: To extract nutrients, 5 mL of concentrated HNO3 (68–70%, Penta) was added to each crucible containing the ashed plant material. The extracts were then filtered into 50 mL volumetric flasks using a filter paper. The volumetric flasks were filled with deionized water to their marks, resulting in solutions containing the extracted elements. These solutions were transferred into plastic bottles for further analysis.
Measurement of inorganic elements: The concentrations of zinc (Zn), copper (Cu), manganese (Mn), and iron (Fe) were directly determined in the extracted solution. For K, calcium (Ca), phosphorus (P), and magnesium (Mg), appropriate dilutions were made before their measurement. The analysis of these elements was performed using inductively coupled plasma optical emission spectroscopy (ICP-OES, OPTIMA 2100 DV optical emission spectrometer, PerkinElmer, Waltham, MA, USA), a technique that can detect and quantify multiple elements simultaneously.
In addition to ICP-OES analysis, the total nitrogen concentration was determined using the Kjeldahl method (VAPODEST 500/500 Carousel distillation system, C. Gerhardt GmbH & Co. KG, Königswinter, Germany), and the concentration of boron (B) was determined spectrophotometrically (Varian AA-10 spectrophotometer, Varian Inc., Houten, The Netherlands) using the Azomethine-H method.
Determination of nutrient contents (quantities): The contents (quantities) of inorganic elements (N, P, K, Ca, Mg, B, Mn, Zn, Fe, and Cu) present in different plant parts (leaves, scion stem, rootstock stem, roots, above-ground parts, scion, rootstock) as well as total plant nutrient content were calculated. This calculation was performed by multiplying the dry weights of each individual plant part with their respective nutrient concentrations, which were measured on a dry weight basis.
Clear definitions: Providing clear definitions for certain terms used in the study is important for clarity in the results. So, the term “concentration” refers to the amount of each element expressed on a unit of dry weight (d.w.) basis, expressed as a percentage of dry weight (% d.w.) or milligrams per kilogram of dry weight (mg kg−1 d.w.). The term “content” (or “quantity”) is used to describe the amount of each element in a plant part, expressed in grams (g) or milligrams (mg) per plant part.

2.6. Statistical Data Analysis

The experimental design consisted of a 5 × 2 completely randomized factorial design, including 5 treatments and 2 rootstocks. Five replicates per treatment and per rootstock were included, leading to a total of 50 experimental plants. The collected data were subjected to statistical analysis (one-way analysis of variance; ANOVA), using the SPSS-21.0.1 software program (SPSS, Inc., Chicago, IL, USA). To compare the mean values of K treatments for each rootstock, we used Duncan’s multiple range test with a significance level of p ≤ 0.05. Furthermore, Pearson’s correlation test was performed to investigate potential linear correlations between specific data within the entire set of plants. This analysis was conducted separately for each cultivar and rootstock combination, with a total sample size of 25 plants. The resulting correlation coefficients (r) were calculated and selected pairs of parameters that were interesting are presented in tables.

3. Results and Discussion

3.1. Plant Growth

The experiment ended when visible symptoms of K deficiency became apparent in the lemon plants grown under 0.00 mM K. As shown in Figure 1, K deficiency resulted in characteristic chlorotic and necrotic symptoms in lemon leaves, primarily observed in the basal part of the stems. These symptoms were more pronounced in plants grafted onto SO rootstock and less so in plants grafted onto VL rootstock.
Table 1 presents the effects of K levels in the nutrient solution (0.00, 0.75, 1.50, 3.00, and 6.00 mM K) and rootstock types (SO, VL) on the growth parameters of lemon plants. The data are expressed on a dry weight basis for leaves, scion stems, rootstock stem, roots, and the total plant. Statistical analysis revealed that when VL was used as the rootstock, there were no significant effects on the dry weight of individual plant parts and the total plant, except for the roots, which showed a significant decrease at higher K treatments (3.00 and 6.00 mM K) (Table 1). In contrast, when plants were grafted onto SO, a significant decrease in total plant weight was observed at 0.00 and 6.00 mM K compared to 0.75 mM K (Table 1). This reduction in growth was primarily attributed to a decrease in the weight of scion tissues (leaves and stems) at 0.00 and 6.00 mM K, while the growth of rootstock tissues (root and stem) was unaffected by K treatment (Table 1). Additionally, the contribution of leaves to the final dry weight of plants grafted on SO was found to be reduced in the 6.00 mM K treatment compared to 0.75 mM K. These findings align with previous studies by Fageria and Oliveira [29], who reported negative impacts of potassium deficiency on the dry weight of leaves, shoots, and roots in rice, and Hamouda et al. [30], who observed increased plant growth in wheat through foliar application of K, resulting in higher plant height and fresh and dry weights of stems and leaves. Similarly, Gerardeaux et al. [31] found that an insufficient K supply hindered cotton plant growth, particularly in terms of dry matter production and leaf area. Çelik et al. [32] documented comparable results in maize, where increased potassium doses positively influenced the dry weight of leaves and roots, except at very high potassium levels combined with high iron supply, which resulted in decreased plant dry weights, especially in leaves. In another study, Sun et al. [33] reported negative impacts of both low and high K levels on total plant growth in apple plants. Overall, increased K concentrations have been shown to have varying positive effects on plant growth, depending on the plant species. Xu et al. [34] conducted a study on an apple dwarf rootstock (M9T337) and demonstrated that an appropriate and consistent K supply maintains hormone and nutrient balance, enhances enzyme activities, upregulates gene expression related to nitrogen uptake and assimilation, and optimizes carbon and nitrogen allocation within the plant. These mechanisms ultimately promote plant growth by optimizing hormone and nutrient levels, as well as carbon and nitrogen metabolism.

3.2. Photosynthesis and Pigments

Potassium plays a vital role in many physiological and biochemical processes, including energy transfer, activation of enzymes, stomatal movement, protein synthesis, osmoregulation and cell extension, carbohydrate metabolism, phloem transport of assimilates/metabolites, and oil production [7,8,35,36,37,38]. Among these processes, photosynthesis is of utmost importance as it assists with plant growth and overall biomass production [39,40]. Although photosynthesis rates remain relatively stable across a wide range of leaf K concentrations, it is crucial to maintain optimal K nutrition by ensuring an appropriate and constant K supply to sustain photosynthetic activity in crops [34]. Bednarz et al. [41] reported that in the case of mild potassium deficiency, the initial decline in net CO2 assimilation is primarily attributed to an increase in stomatal resistance (stomatal limitations). However, as the deficiency becomes more severe, biochemical factors also contribute to the reduction in photosynthetic rate (non-stomatal limitations). In other words, the study of Bednarz et al. [41] highlights that while stomatal limitations play a significant role in the early stages of potassium deficiency, non-stomatal factors become more prominent as the deficiency worsens.
In the current study (Figure 2A), a significant reduction in photosynthetic rate was observed in the 0.00 mM K treatment for plants grafted onto SO rootstock compared to the other treatments (0.75–6.00 mM). Similarly, significant differences were observed in VL between the 0.00 mM K treatment (reduced photosynthetic rate) and the 0.75–1.50 mM K treatments (increased photosynthetic rate). In both rootstocks, the highest photosynthetic rates were found in plants treated with 0.75 mM K. Likewise, stomatal conductance (Figure 2B) and transpiration rate (Figure 2C) were significantly decreased in the 0.00 mM K treatment compared to the 0.75–3.00 mM K treatments for VL and 0.75–6.00 mM K treatments for SO. On the other hand, an increased leaf intercellular concentration of CO2 was found in plants grown under 0.00 mM K compared to those fertigated with 0.75–3.00 mM K when SO was the rootstock (Figure 2D). In plants grafted onto VL, a significant reduction in leaf intercellular CO2 concentration was observed in the 6.00 mM K treatment compared to all other K treatments (0.00–3.00 mM) (Figure 2D). Comparing the 0.00 mM K treatment to the 0.75–3.00 mM K treatments, significantly lower values of instantaneous and intrinsic water use efficiency were found in the leaves of plants grafted onto SO and grown under 0.00 mM K, while no differences were recorded in plants grafted onto VL (Figure 3A,B). Regarding CO2 use efficiency, it was reduced under 0.00 mM K compared to the other K treatments (0.75–6.00 mM) for SO, while in VL rootstock, a reduction in CO2 use efficiency was found in plants grown under 0.00 mM K compared to 0.75 and 6.00 mM K (Figure 3C).
We also evaluated the effects of K on photosynthetic pigments (Table 2). The concentrations of chlorophyll a (Chla), chlorophyll b (Chlb), and total chlorophyll (Chla + Chlb) in lemon leaves were not significantly affected by K concentration in the nutrient solution, regardless of the rootstock. Similar results were observed concerning total carotenoids and the ratio between Chla and Chlb in leaves of plants grafted onto VL rootstock. However, in plants grafted onto SO rootstock, significantly lower carotenoid concentrations and a lower Chla-to-Chlb ratio were observed under the 0.00 mM K treatment compared to all other K treatments (Table 2).
In the following part of this section, we will delve deeper into the results of our study concerning photosynthetic performance (Figure 2 and Figure 3) and photosynthetic pigments (Table 2) in lemon leaves. Our focus will be on examining the effects of K deprivation by comparing the 0.00 mM K treatment, where K deficiency was evident based on the observed symptoms in the plants (Figure 1), with two intermediate K treatments (0.75 and 1.50 mM K). These two intermediate K treatments exhibited higher values in terms of scion plant growth (leaves, stem of scion) as well as total plant growth in both rootstocks when compared to the 0.00 mM K treatment (Table 1). By analyzing various key physiological parameters related to photosynthesis, we aim to gain a better understanding of the responses of lemon plants to K deficiency.
Our results showed that K deficiency had a significant impact on leaf photosynthesis in lemon plants, regardless of the rootstock. The photosynthetic rate was notably lower in K-deficient plants compared to those at intermediate K levels (0.75–1.50 mM K) (Figure 2A). This reduction in photosynthetic rate indicated impaired photosynthesis, which could lead to limitations in energy production and overall growth. Notably, when comparing the mean photosynthetic rate values between the 0.00 mM K treatment and the intermediate K treatments, the percentage decrease in photosynthesis under K deficiency was more pronounced in lemon plants grafted on SO rootstock than on VL rootstock (Figure 2A). This finding is consistent with the higher percentage of total plant growth decrement observed in SO-grafted plants compared to VL-grafted plants when comparing the 0.75–1.50 mM and 0.00 mM K treatments (Table 1). Hu et al. [42] observed a decrease in leaf area in winter oilseed rape plants under K deficiency prior to a reduction in photosynthetic rates. Conversely, when oilseed rape plants received sufficient K nutrition, both leaf area and photosynthetic rates increased simultaneously, leading to improved plant growth and crop yield. In line with these findings, our experiment demonstrated that plants grown with an elevated K supply in the nutrient solution (0.75–1.50 mM K) exhibited higher leaf dry weights, total growth, and photosynthetic rates compared to K-deficient plants (0.00 mM K), regardless of the rootstock. According to Jákli et al. [37] and references therein, there is a widespread observation of a decrease in photosynthetic rate in K-deficient plants. However, there is an ongoing debate regarding the specific mechanism through which low K affects photosynthesis. The debate revolves around whether K directly influences photosynthetic rate by reducing leaf chlorophyll concentration, impeding photochemical energy conversion, or disrupting biochemical processes related to photosynthesis. Alternatively, it is also suggested that K deficiency may indirectly affect photosynthetic rate by hindering the diffusion of CO2 from the atmosphere to the chloroplasts, creating a substrate limitation for photosynthesis [37]. In any case, both stomatal and non-stomatal limitations to photosynthesis can occur under conditions of K deficiency in plants [8].
The efficient functioning of stomata is essential for facilitating the uptake of CO2 during photosynthesis while minimizing water loss. Therefore, the precise regulation of stomatal opening and closing plays a crucial role in ensuring optimal plant growth and productivity [8]. Stomatal movement, which plays a pivotal role in this process, is primarily regulated by turgor pressure, with the concentration of K ions (K+) being a key determinant [7,8]. In our study, stomatal conductance, responsible for gas exchange through leaf stomata, was lower in K-deficient plants grafted onto either SO or VL rootstock, indicating limitations in photosynthesis due to stomatal factors (Figure 2B). This reduced stomatal conductance suggested an impaired regulation of gas exchange, particularly the release of water vapor and the entry of CO2 into internal leaf intercellular spaces. Consequently, the transpiration rate was significantly reduced in K-deficient plants on both rootstocks compared to the 0.75–1.50 mM K treatments (Figure 2C), indicating compromised water balance regulation. Water use efficiency is a critical factor in plant performance, and our data demonstrated lower intrinsic (Figure 3A) and instantaneous (Figure 3B) water use efficiency exclusively in K-deficient plants grafted onto SO rootstock. This finding indicates that plants grafted onto SO rootstock had a diminished capacity to use water effectively for growth and photosynthesis when experiencing K deficiency. In contrast, plants grafted on VL did not exhibit such impaired water use efficiency in the context of photosynthesis. In accordance with our findings in lemon plants grafted onto SO rootstock, Sousa and Freire [43] reported that increasing the K supply to oiticica plants resulted in an improvement in intrinsic water use efficiency. Similarly, Pervez et al. [44] observed a significant enhancement of 24.6% in instantaneous water use efficiency in cotton plants when the highest dose of K was applied, compared to zero K conditions. Another study by Mohd Zain and Ismail [45] further supported the idea that an adequate K supply can enhance water use efficiency in plants by regulating turgor pressure and facilitating osmotic adjustment in plant tissues.
Apart from stomatal factors, a decrease in photosynthesis can also arise from various non-stomatal factors, including the impairment of the photosynthetic system, disruption of thylakoid membranes, reduced ATP synthesis, compromised electron transport in photosystem II (PSII), diminished capacity and efficiency of ribulose bisphosphate carboxylase/oxygenase enzyme (Rubisco) regeneration, impaired regeneration of ribulose 1,5-bisphosphate (RuBP), and decreased chlorophyll concentration [43]. Based on our results, leaf intercellular CO2 concentration was higher only in K-deficient lemon plants grafted onto SO rootstock, suggesting alterations primarily in gas diffusion. This disruption in the balance of CO2 supply and assimilation during photosynthesis was particularly evident in SO-grafted plants. Potassium-deficiency-induced decreases in stomatal conductance, mesophyll diffusion conductance, and transpiration rate in various plant species and an increase in leaf intercellular CO2 have been reported in studies conducted or cited by Jin et al. [40], Jákli et al. [37], and Hu et al. [42]. However, a lower photosynthetic rate observed in K-deficient hickory seedlings, compared to those with sufficient K, was primarily attributed to increased limitations in the biochemical processes of photosynthesis, specifically maximum carboxylation rate (RubisCo activity) and maximum electron transport rate [40]. This decrease in photosynthetic rate was not influenced by changes in mesophyll conductance and stomatal conductance. In contrast, a study conducted by Jákli et al. [37] found that K deficiency in sunflower did not directly impact maximum quantum use efficiency (Fv/Fm) or in vivo RubisCo activity. Instead, this decrease in net CO2 assimilation in sunflower was primarily caused by a reduction in mesophyll conductance. In our study, the efficiency of CO2 utilization during photosynthesis (carboxylation efficiency) was lower in K-deficient lemon plants on both rootstocks (Figure 3C), indicating a compromised capacity to convert absorbed CO2 into carbohydrates and other essential organic compounds. These observations suggest that non-stomatal factors also contributed to the limited photosynthetic performance of lemon plants under K deficiency conditions, regardless of the rootstock. According to the results of Hu et al. [42], as the level of K deficiency stress intensified in winter oilseed rape plants, there was a decrease in the exposed mesophyll surface area that connects with the intercellular space, as well as a reduction in chloroplast density. This resulted in longer distances between neighboring chloroplasts and a decrease in the chloroplast surface area exposed to the intercellular space. Consequently, the transport of CO2 was further impeded by the cytosol, leading to a significant reduction in the photosynthetic rate. Moreover, the decrease in diffusion resistance caused a decline in the concentration of CO2 at the carboxylation sites, leading to a more pronounced reduction in photosynthetic rate [37,40]. In detail, the findings of Jákli et al. [37] showed that the decrease in photosynthetic rate observed in K-deficient plants can be attributed to a reduction in CO2 mesophyll conductance. K deficiency hinders the efficient transport of CO2 through the mesophyll in the leaf, thus restricting its availability for photosynthesis. This decrease in CO2 diffusion through the leaf mesophyll results in a lower net CO2 assimilation during photosynthesis, ultimately leading to a reduced photosynthetic rate.
The concentrations of chlorophyll a, chlorophyll b, and total chlorophyll were comparable between K-deficient (0.00 mM K) lemon plants and those treated with adequate K levels (0.75–1.50 mM K) on both rootstocks. However, the ratio of chlorophyll a to chlorophyll b (Chl a/b) was lower in K-deficient plants on the SO rootstock, suggesting alterations in chlorophyll composition or distribution. These changes may impact light absorption and energy transfer within the photosynthetic apparatus, contributing to the reduced photosynthetic capacity observed in SO-grafted plants. Moreover, the concentration of total carotenoids was lower in the leaves of K-deficient plants on the SO rootstock, indicating a differential response to K deficiency between the rootstocks. This suggests that VL-grafted plants were better able to sustain chlorophyll and carotenoid synthesis, even under K deficiency, while SO-grafted plants exhibited a diminished ability to do so. Similarly to the differential responses found in lemon plants grafted onto either the SO or VL rootstock, a study conducted by Du et al. [46] revealed significant genotype-dependent differences in maize cultivars when subjected to K deficiency stress. In K-tolerant cultivars, slight variations were observed in chlorophyll concentration, including Chl a, Chl (a + b), and Chl a/b ratio, compared to plants grown under adequate K supply. However, in K-sensitive cultivars, significant reductions were observed in all these chlorophyll parameters under K deficiency stress. These findings highlight the influence of genotype on plants’ responses to K deficiency, underscoring the importance of selecting appropriate genotypes, such as plant species, cultivars, and rootstocks, in order to improve plant tolerance and sustain yield and product quality under K-limited conditions.
Overall, our findings highlight the adverse effects of K deficiency on multiple physiological processes in lemon leaves, including photosynthesis rate, stomatal conductance, transpiration rate, intercellular CO2, water use efficiency, CO2 utilization efficiency, chlorophylls, and carotenoids. Although some responses were similar between the two rootstocks, differential rootstock-dependent responses were observed in leaf intercellular CO2 concentration, water use efficiency, carboxylation efficiency, Chl a/b ratio, and total carotenoid concentration. These variations may be attributed to inherent differences in rootstock characteristics and their interaction with K availability. Further research is needed to elucidate the molecular mechanisms underlying these responses and develop strategies to mitigate the detrimental effects of K deficiency in citrus crops. Optimizing K nutrition is crucial for improving lemon tree performance, yield, and fruit quality.

3.3. Potassium Nutrition of Plants and Interactions with Other Elements

In the present experiment, an increasing concentration of K in the nutrient solution resulted in a gradual and significant increase in K concentrations in all plant parts, i.e., leaves, scion stem, rootstock stem, and roots, of lemon plants grafted onto the SO rootstock (Figure 4). Regarding the VL rootstock, although statistically significant increases in K concentrations were observed in different plant parts with increasing K concentration in the nutrient solution, no statistically significant differences were observed between the 1.50 mM K and 3.00 mM K treatments in the leaves (Figure 4A), between the 0.75 mM K and 1.50 mM K treatments in the scion stem (Figure 4B), and between the 1.50 mM K and 3.00 mM K treatments in the roots (Figure 4D). In the rootstock stem (Figure 4C), no statistically significant differences were observed between the 0.00 and 0.75 mM K treatments, nor between the 0.75, 1.50, and 3.00 mM K treatments. In short, increasing the concentration of K in the nutrient solution led to a gradual and significant increase in K concentrations in all parts of the lemon plants (leaves, scion stem, rootstock stem, and roots), irrespective of the rootstock. Many other studies have also reported that increasing K fertilizer rates significantly elevate leaf K concentrations in citrus trees, as evidenced by Quaggio et al. [47], Ashraf et al. [48], Khoshbakht et al. [49], and Singh et al. [50]. Moreover, in the current study, leaves exhibited higher K concentrations compared to other plant parts, with K concentration decreasing from the roots to the scion stem and the rootstock stem (Figure 4). This trend aligns with our previous research on orange plants [51], which also reported a similar hierarchy of K concentration in plant tissues: leaves > roots > scion stem, rootstock stem. These findings are corroborated by Khoshbakht et al. [49], who likewise identified a greater K concentration in leaves compared to roots in both orange and mandarin plants. This consistent pattern of K distribution underscores the prominence of leaves as the primary reservoirs of K in citrus trees. Indeed, regardless of the K treatments (0–6 mM) and rootstock (SO, VL), an increased distribution of K in the leaves of plants (accounting for 38–51% of total K quantity in the plant) was observed, followed by an intermediate distribution in the roots (21–28%) and a lower distribution in the scion stem (10–23%) and rootstock stem (10–21%) (Table 3). When compared to VL-grafted plants, those grafted onto SO rootstock and treated with moderate to high K (1.50–3.00 mM) had a higher K concentration in their parts (Figure 4A–C), except for the roots (Figure 4D). This was observed despite the significantly greater total K quantity per plant found in the VL rootstock compared to the SO rootstock (Figure 5A). Our previous research further corroborated these findings, with Valencia orange trees grafted on SO rootstock exhibiting significantly higher leaf K concentrations compared to VL rootstock [52]. Dubey and Sharma [53] underscored the dominant impact of rootstock on foliar K concentration in lemon trees. Other studies also identified significant variations in leaf mineral composition among citrus species and cultivars grafted on different rootstocks [54,55,56]. The higher K concentrations found in all plant parts of VL-grafted compared to SO-grafted plants under extreme K deficiency conditions (0 mM K) are of great significance as these findings collectively emphasize the pivotal role of rootstock selection in modulating leaf K concentrations and nutrient composition in citrus cultivars, illustrating the importance of this factor in citrus cultivation and management.
Enhancing nutrient use efficiency holds the potential to reduce crop production costs and boost economic returns for farmers. In the current study, in treatments with K supplementation ranging from 0.75 to 6.00 mM K, K use efficiency exhibited a consistent similarity between both rootstocks, SO and VL (Figure 5B). Surprisingly, when we subjected the plants to conditions of extreme K deficiency (0.00 mM K) by excluding any additional K from the nutrient solution, the K use efficiency of SO-grafted plants outperformed that of the VL rootstock (Figure 5B). Therefore, our results indicate that lemon plants, when grafted onto SO rootstock, exhibit remarkable efficiency in managing and utilizing K during its deficiency, demonstrating superior performance than the VL rootstock. According to White et al. [57], differences in K utilization efficiency among plant species or genotypes within a species can be mainly attributed to two key factors: (1) the capacity to reduce vacuolar K concentration while maintaining appropriate K levels in metabolically active compartments, potentially achieved through anatomical adaptations or greater substitution of K with other solutes in the vacuole, and (2) the ability to redistribute K from older to younger tissues, thereby sustaining growth and photosynthetic capacity.
Investigating nutrient concentrations in various plant parts, along with their uptake and distribution, is crucial for gaining insights into nutrient mobility, interactions, and overall plant nutrition. It also assists in diagnosing deficiencies or toxicities. Furthermore, interactions among inorganic nutrients in higher plants are a matter of immense importance in effectively managing crop nutrition and fertilization. Notably, the complexities of these interactions arise from the fact that one nutrient component may simultaneously interact with multiple other elements [58]. Therefore, understanding nutrient distribution within lemon plants and potential interactions among them is essential for assessing their impact on plant growth and yields. It is also critical for formulating balanced nutrient supply strategies that optimize nutrient use efficiency and promote sustainable agriculture. In light of these considerations, Table 4 and Table 5 present the concentrations of N, Ca, Mg, P, Fe, Mn, Cu, B, and Zn in different plant parts (leaves, scion stems, rootstock stem, and roots) of lemon plants grafted onto SO (Table 5) or VL (Table 6) rootstock, as affected by K level in the nutrient solution. Due to the extensive volume of data, Table 6 and Table 7 play a significant role in revealing the ultimate impact of differential K nutrition on the concentrations and quantities of all determined elements in individual plant parts (leaves, scion stems, rootstock stem, and roots), as well as on the total nutrient uptake by plants grafted onto the two tested rootstocks. In fact, Table 6 and Table 7 present linear correlation coefficients (r), a parameter ranging from −1 to +1, indicating whether K concentration in the nutrient solution had a negative (r < 0) or positive (r > 0) effect on any of the lemon plants’ nutrition aspects. More specifically, Table 7 indicates that in both rootstocks, an increase in K concentration in the nutrient solution supplied to the lemon trees resulted in a linear decrease (−0.903 < r < −0.526) in total plant quantity (uptake) of P, Ca, Mg, B, Mn, and Zn. Simultaneously, there was a negative impact on the concentrations of P, Ca, Mg, and Zn in scion tissues, including both leaves and scion stems, which are the most critical tissues for lemon growth and fruit production, observed in both rootstocks (−0.925 < r < −0.557 for VL and −0.893 < r < −0.726), as documented in Table 6. It is also worth mentioning that, in both rootstocks, K had a linear negative effect on lemon leaf B (−0.714 < r < −0.599) and Mn (−0.922 < r < −0.755) concentrations, while K supply contributed to a linear increase in leaf Fe concentration (0.446 < r < 0.537).
K-induced magnesium (Mg) deficiency is a widespread issue in agricultural production [59]. In cases where K is present in relatively high concentrations in the root zone, it can affect the uptake of other cations, such as Mg and Ca [16,32]. According to Fageria [16], the antagonistic effects of K on the absorption of Ca and Mg depend on the plant species and environmental conditions. While Xu et al. [34] found that a 6.00 mM K supply was optimal for the growth of apple dwarf rootstock (M9T337), in the conditions of our experiment, a concentration of 6.00 mM K in the nutrient solution was rather high and had a suppressing effect on the uptake and concentrations of most nutrient elements in lemon plants. This was the most important factor contributing to the highly negative values of the linear correlation coefficient (r) observed in the current study between K supply and the concentrations of most mineral elements within lemon trees. Similar antagonistic effects of K on other elements have been reported in other studies as well. For instance, in rice plants, a noticeable decline in the uptake of P and Ca was observed as the concentration of K increased in the nutrient solution. Additionally, the absorption of Mg showed an increase at lower K concentrations but exhibited a decrease at higher K concentrations [16]. The reduction in Ca uptake at elevated K levels can be attributed to the competitive nature of K and Ca due to their physiological properties. Furthermore, the inhibitory effect of higher K concentrations on Mg uptake may be elucidated by their competition for metabolically generated binding compounds [16]. According to Mengel [60], if K is absent in the nutrient solution, other cationic species are taken up at higher rates. While adequate K may be required for the efficient use of both Fe and other macronutrient elements, excessively high K concentrations can lead to competition with iron and other cations [32]. However, like in our findings, positive effects of K on leaf Fe levels have also been observed in rice plants. Increased K supplementation resulted in reduced Fe deficiency symptoms, indicating improved Fe plant nutrition [16]. The same authors also noted decreased boron (B) levels in plants with added K or when grown in soils with high K levels.

4. Conclusions

Our study highlights significant effects of K on lemon plants and how these effects vary depending on the rootstock selected (SO, VL):
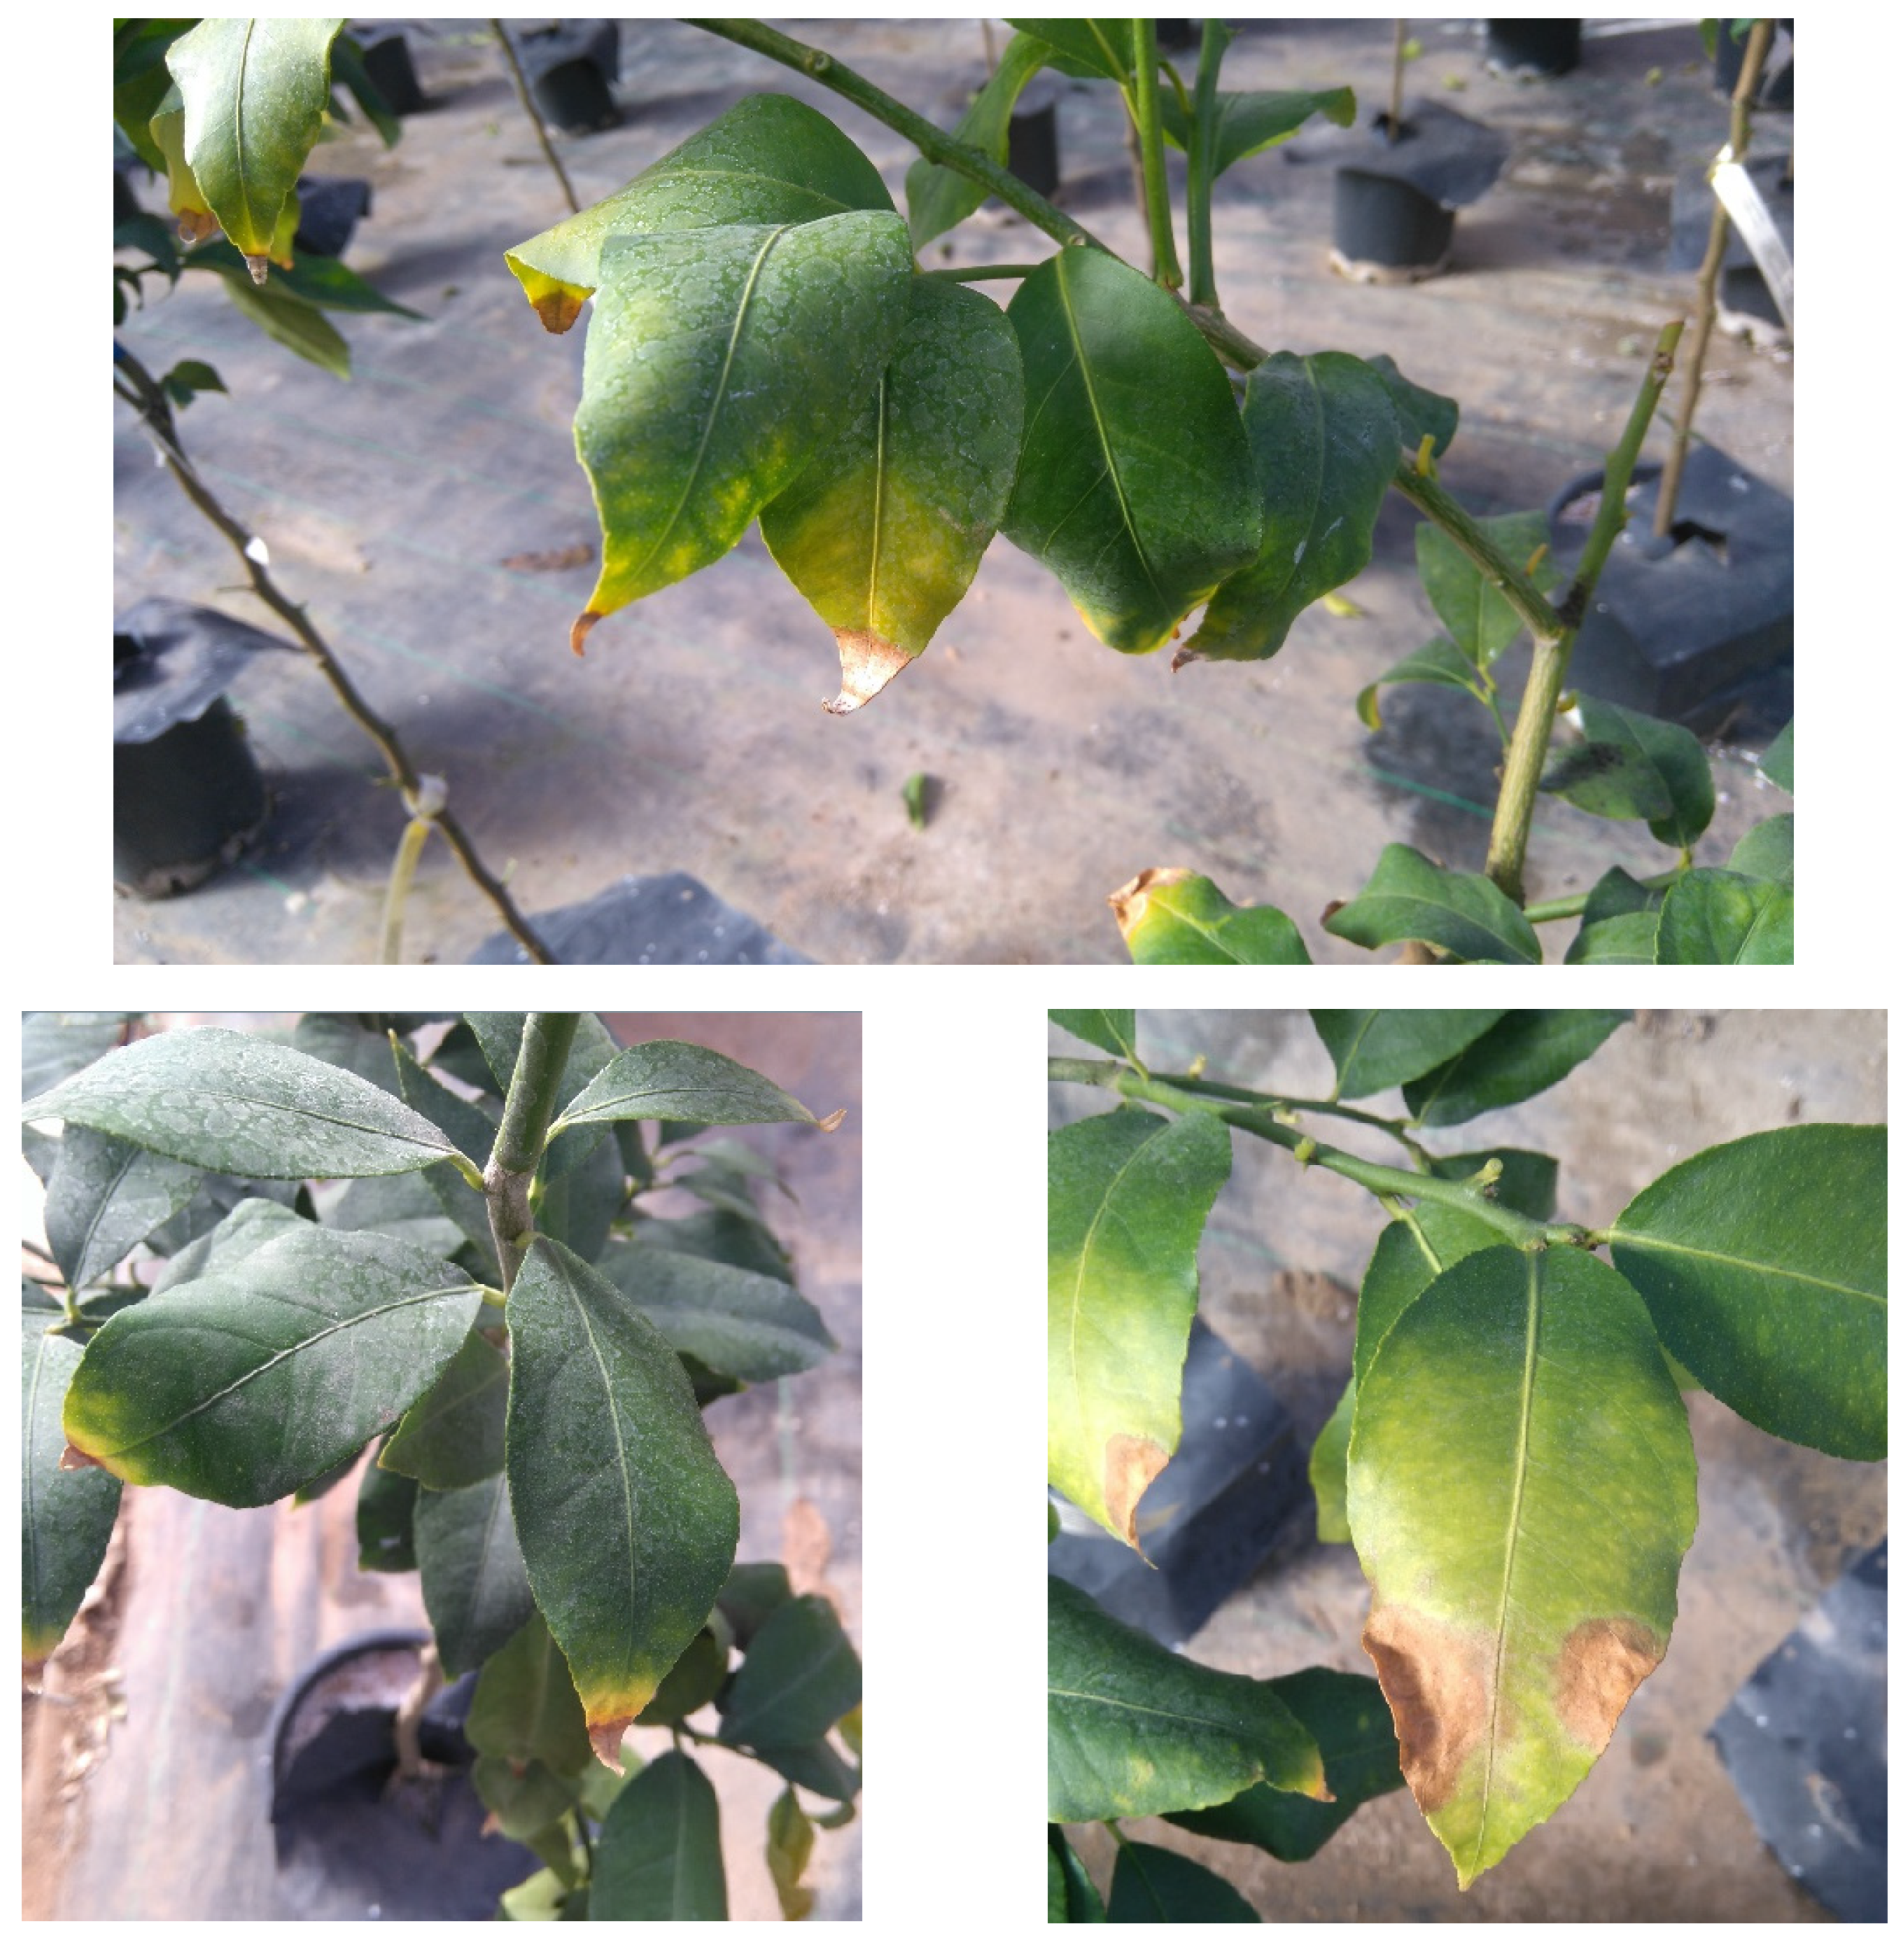
  • Potassium deficiency symptoms: when experiencing K deficiency, lemon plants displayed characteristic chlorotic and necrotic symptoms, which were more pronounced in older leaves and somewhat more severe in SO-grafted plants;
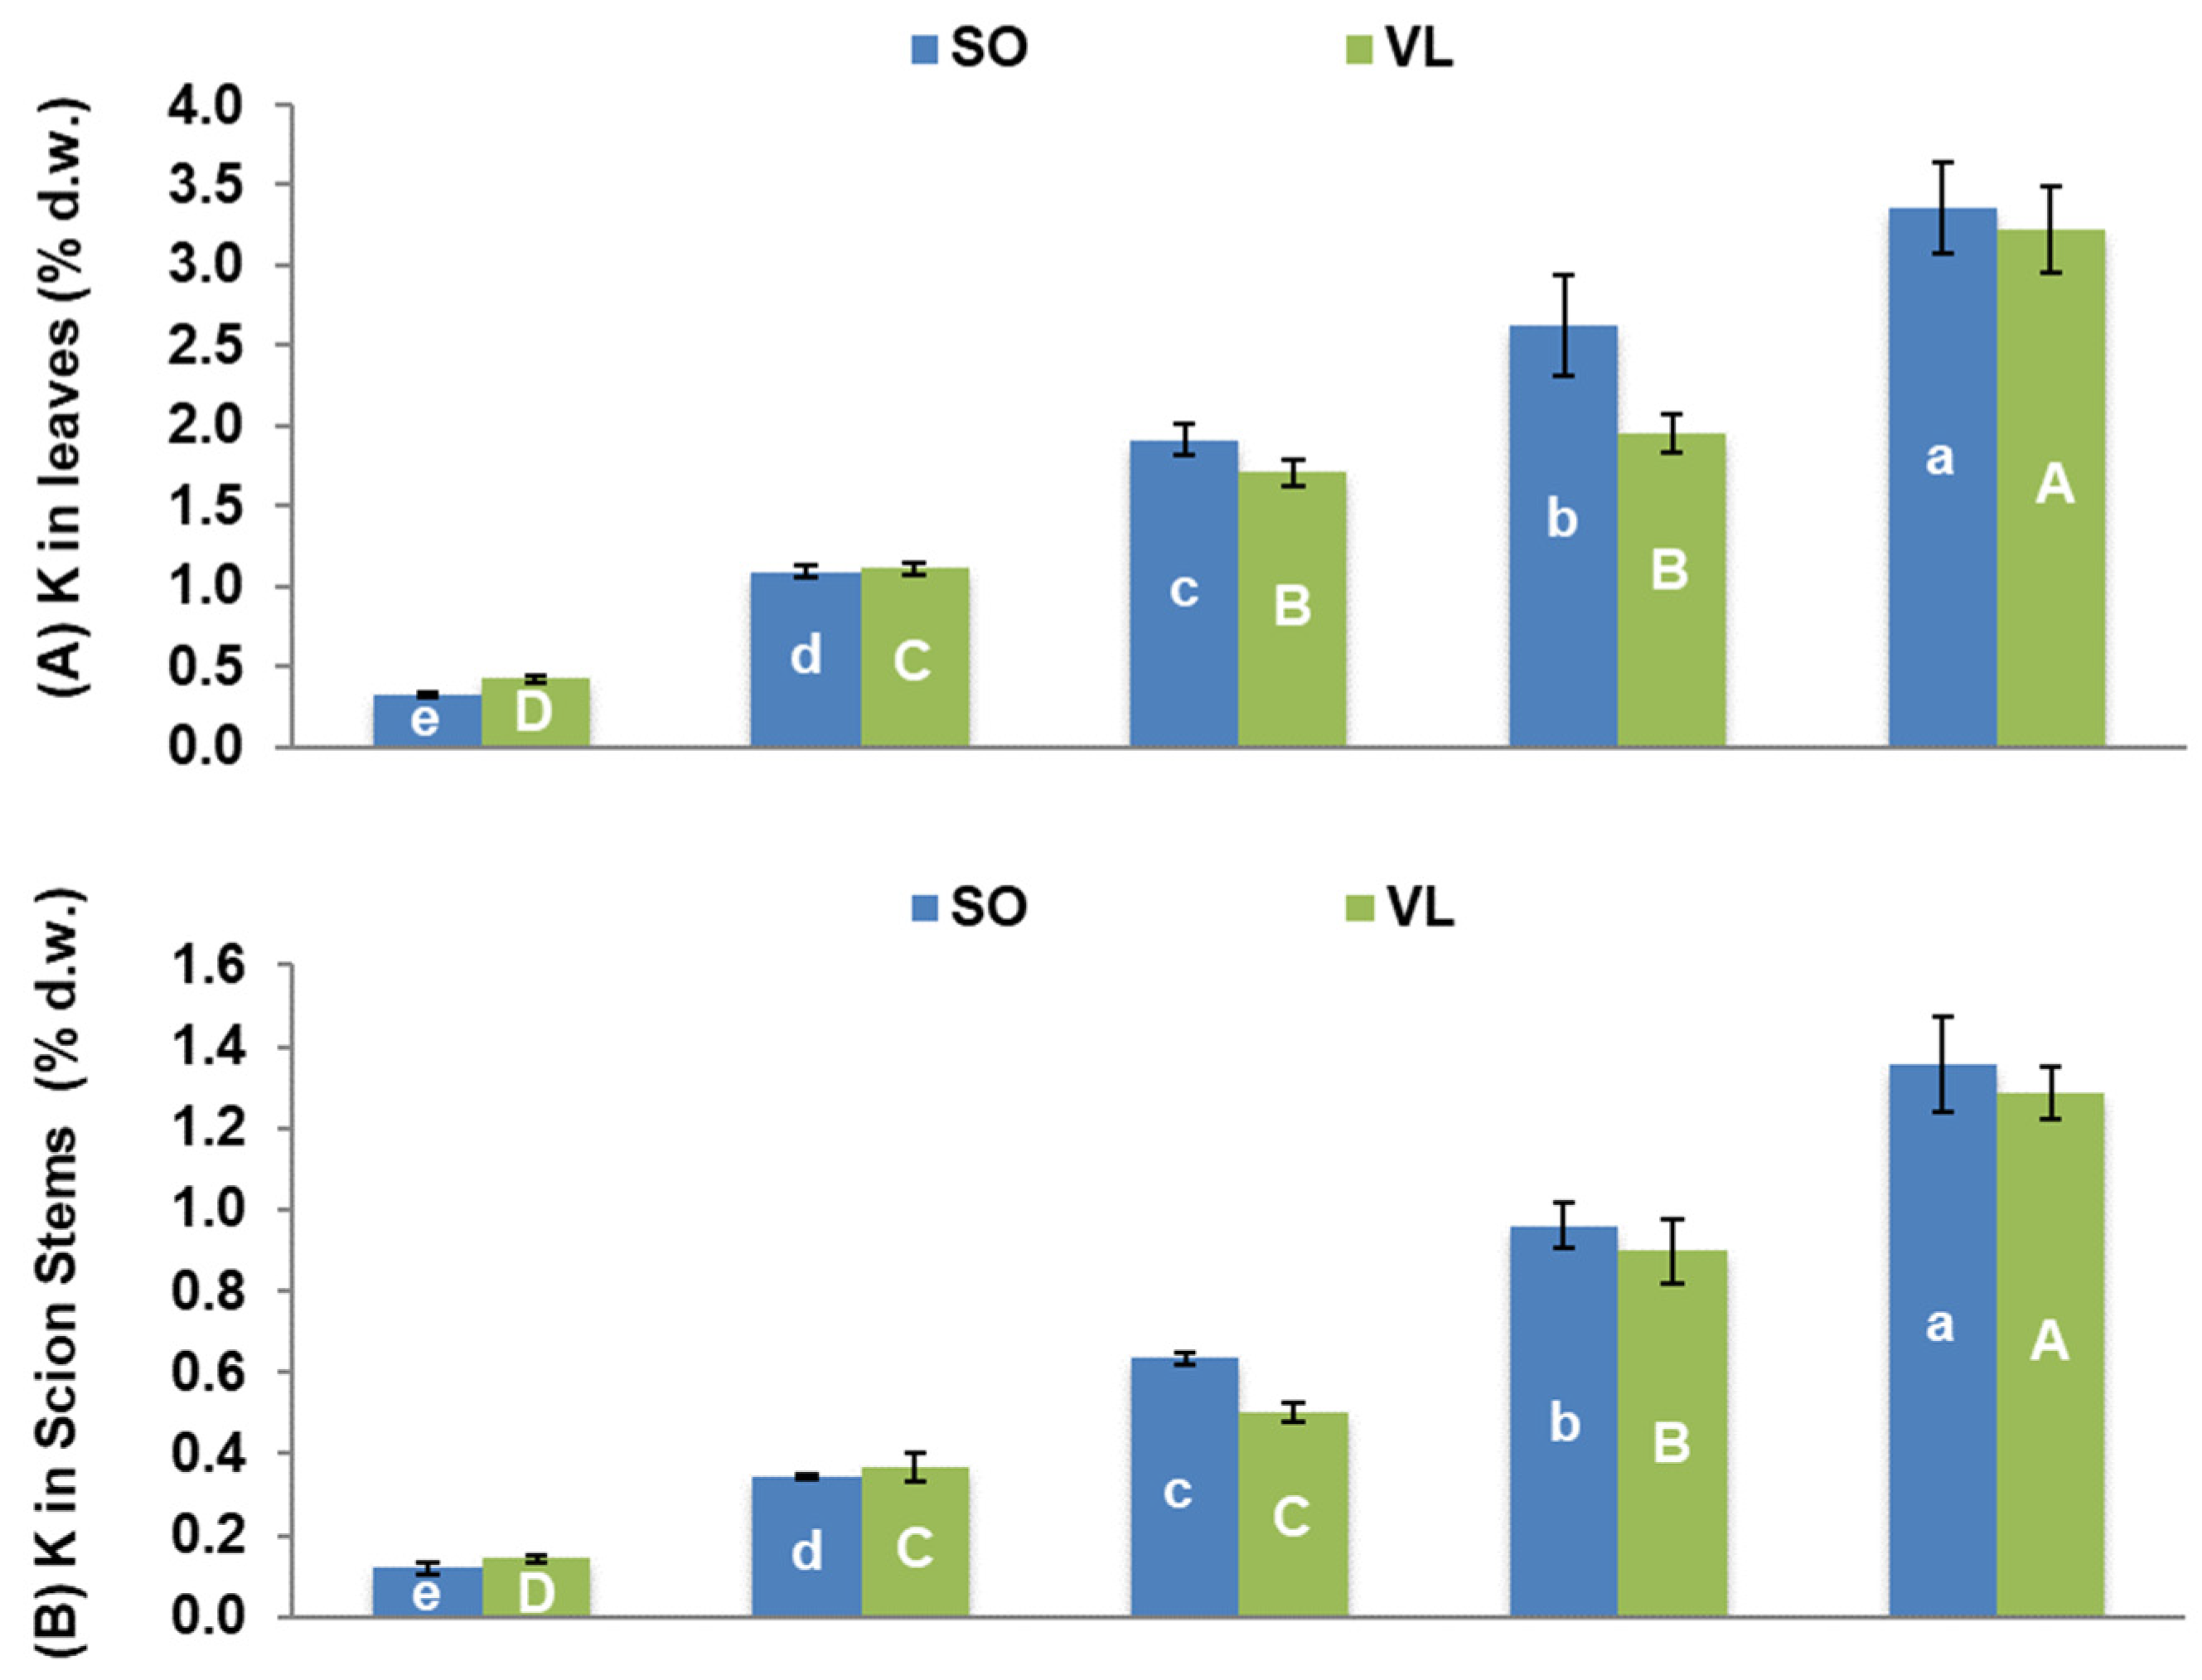
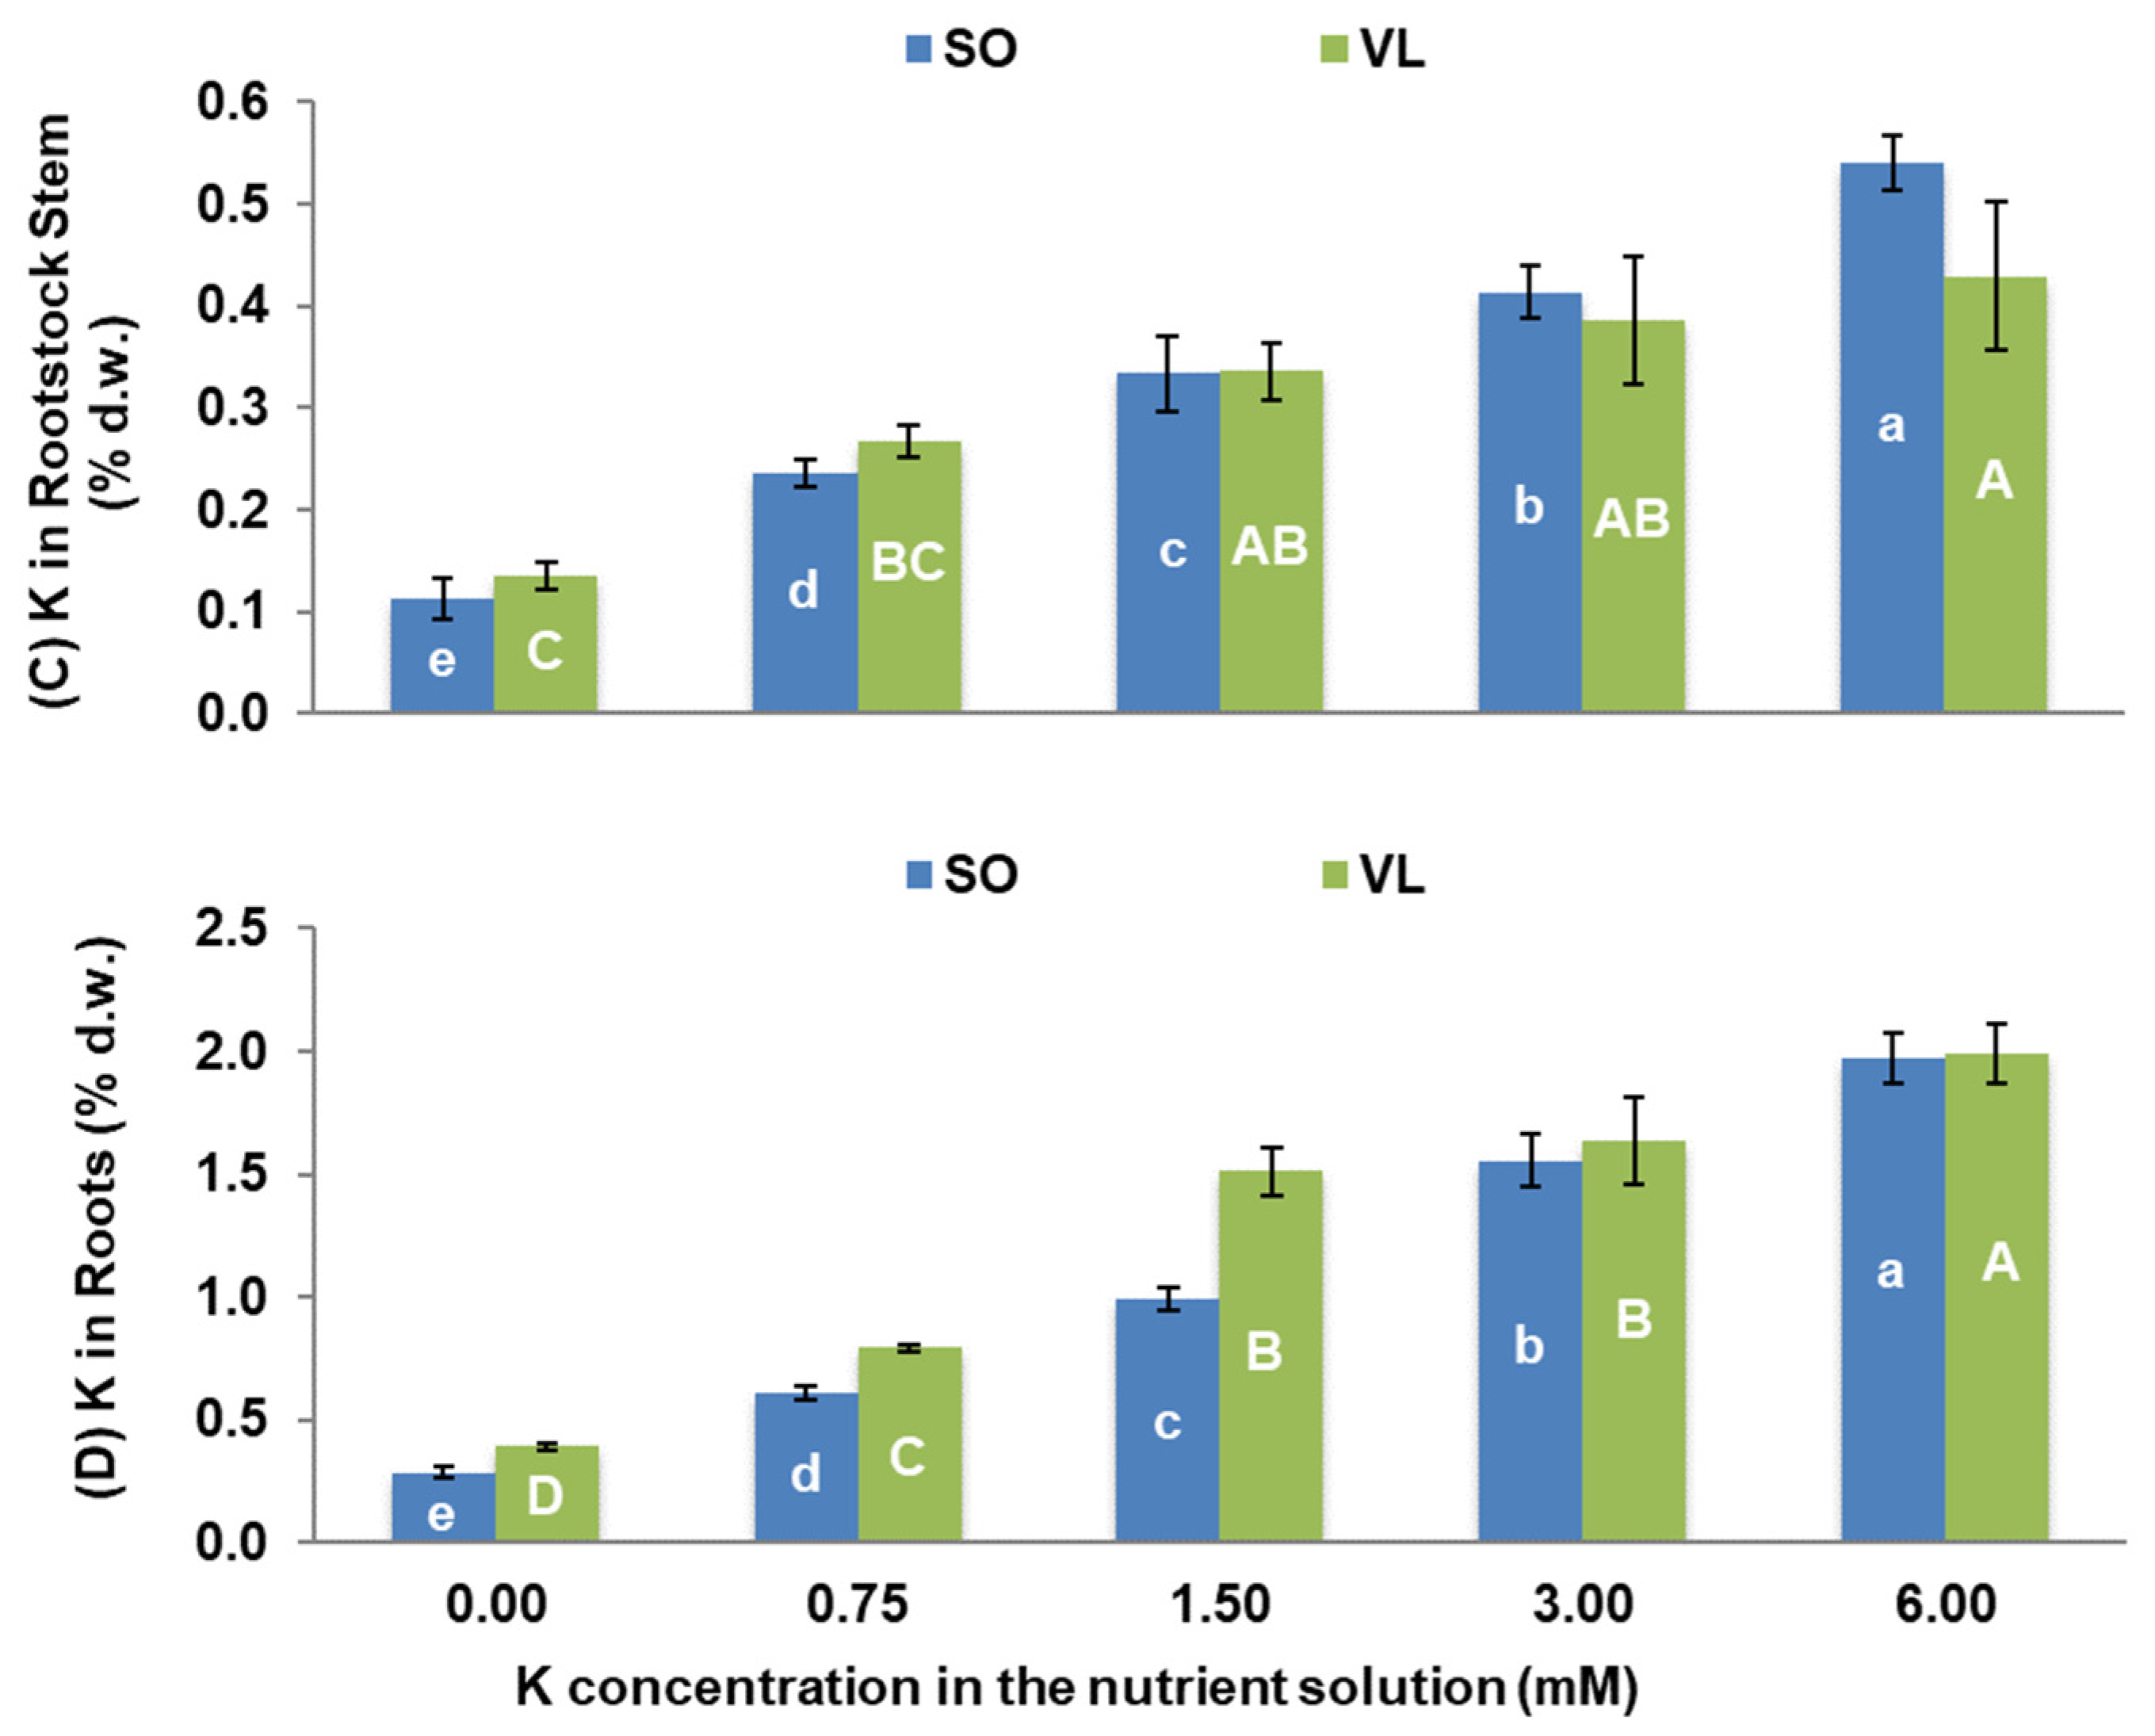
  • Rootstock-dependent K concentrations: lemon trees grafted onto SO rootstock had higher K concentrations in all plant parts, except for the roots, compared to those grafted onto VL rootstock, when they were treated with moderate to high K. The opposite was found for the 0 mM K treatment;
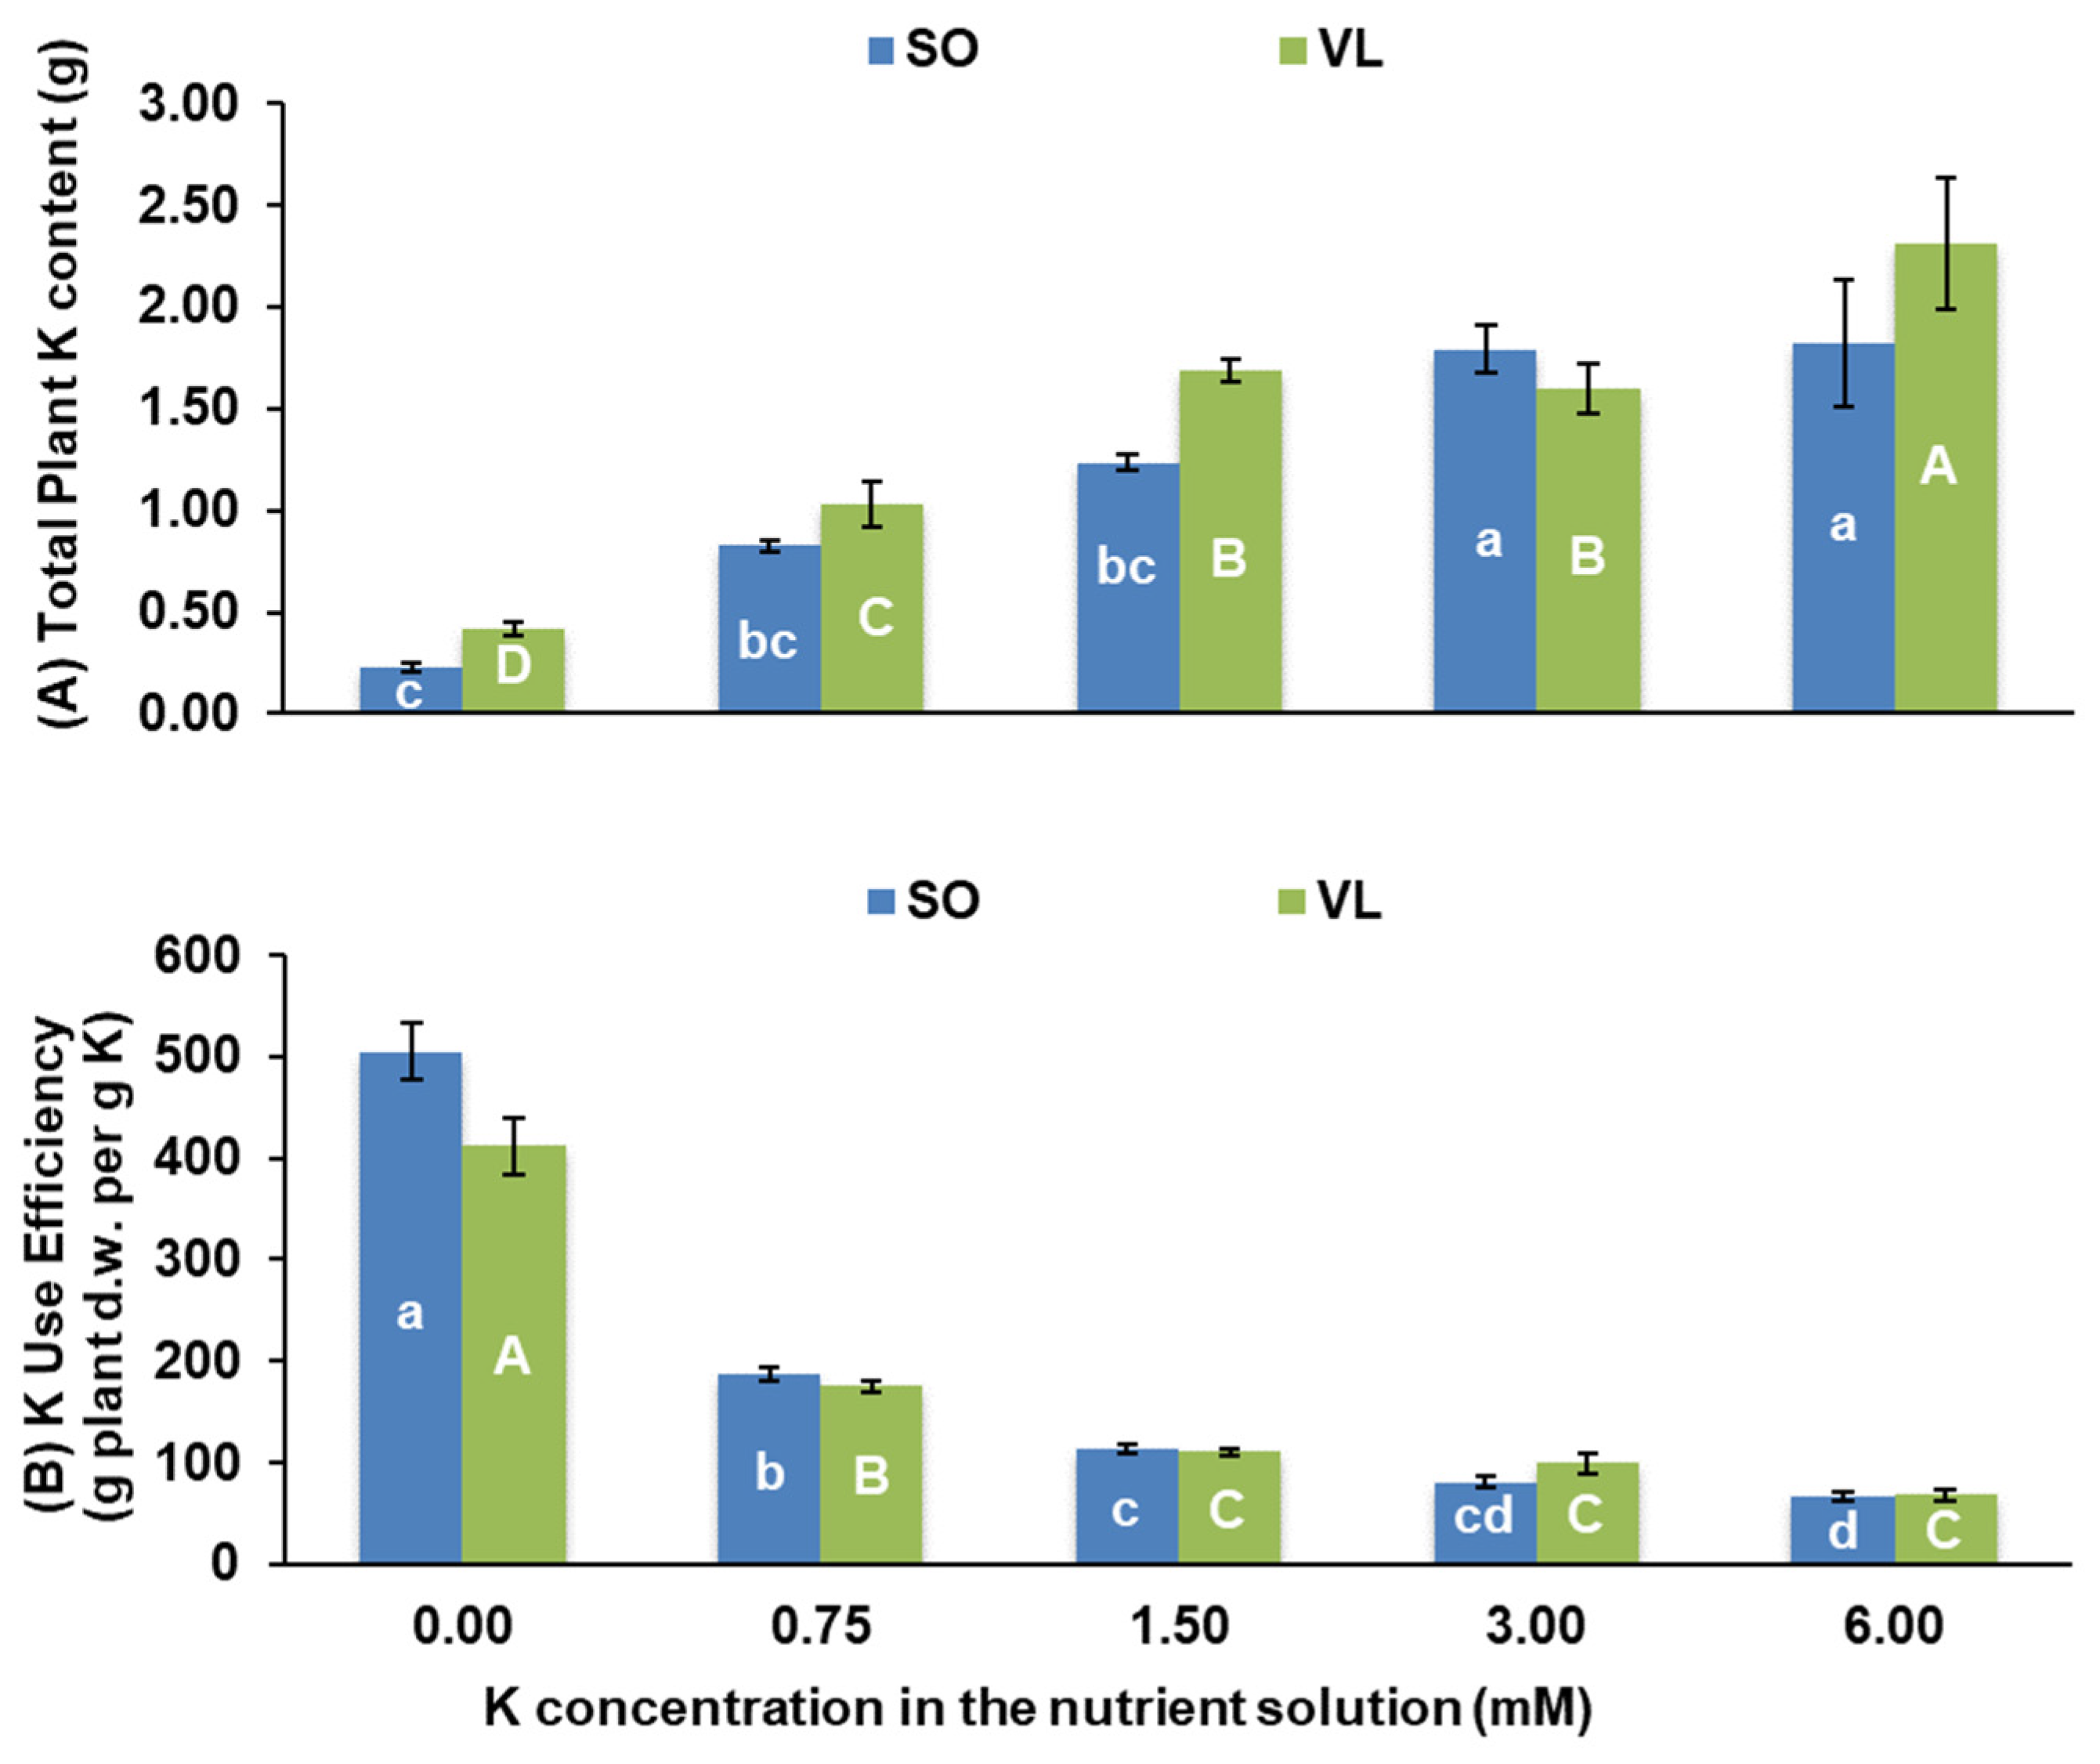
  • Efficient K management: SO-grafted plants exhibited superior K utilization and management during its deficiency, surpassing VL-grafted plants;
  • Reduced nutrient uptake: increasing K concentration in the nutrient solution consistently and linearly reduced the total uptake of essential nutrients, including P, Ca, Mg, B, Mn, and Zn, especially at the highest K treatment;
  • Impact on nutrient concentrations: elevated K levels negatively affected the concentrations of P, Ca, Mg, and Zn in scion tissues, including both leaves and scion stems, leading to mineral nutrient imbalances;
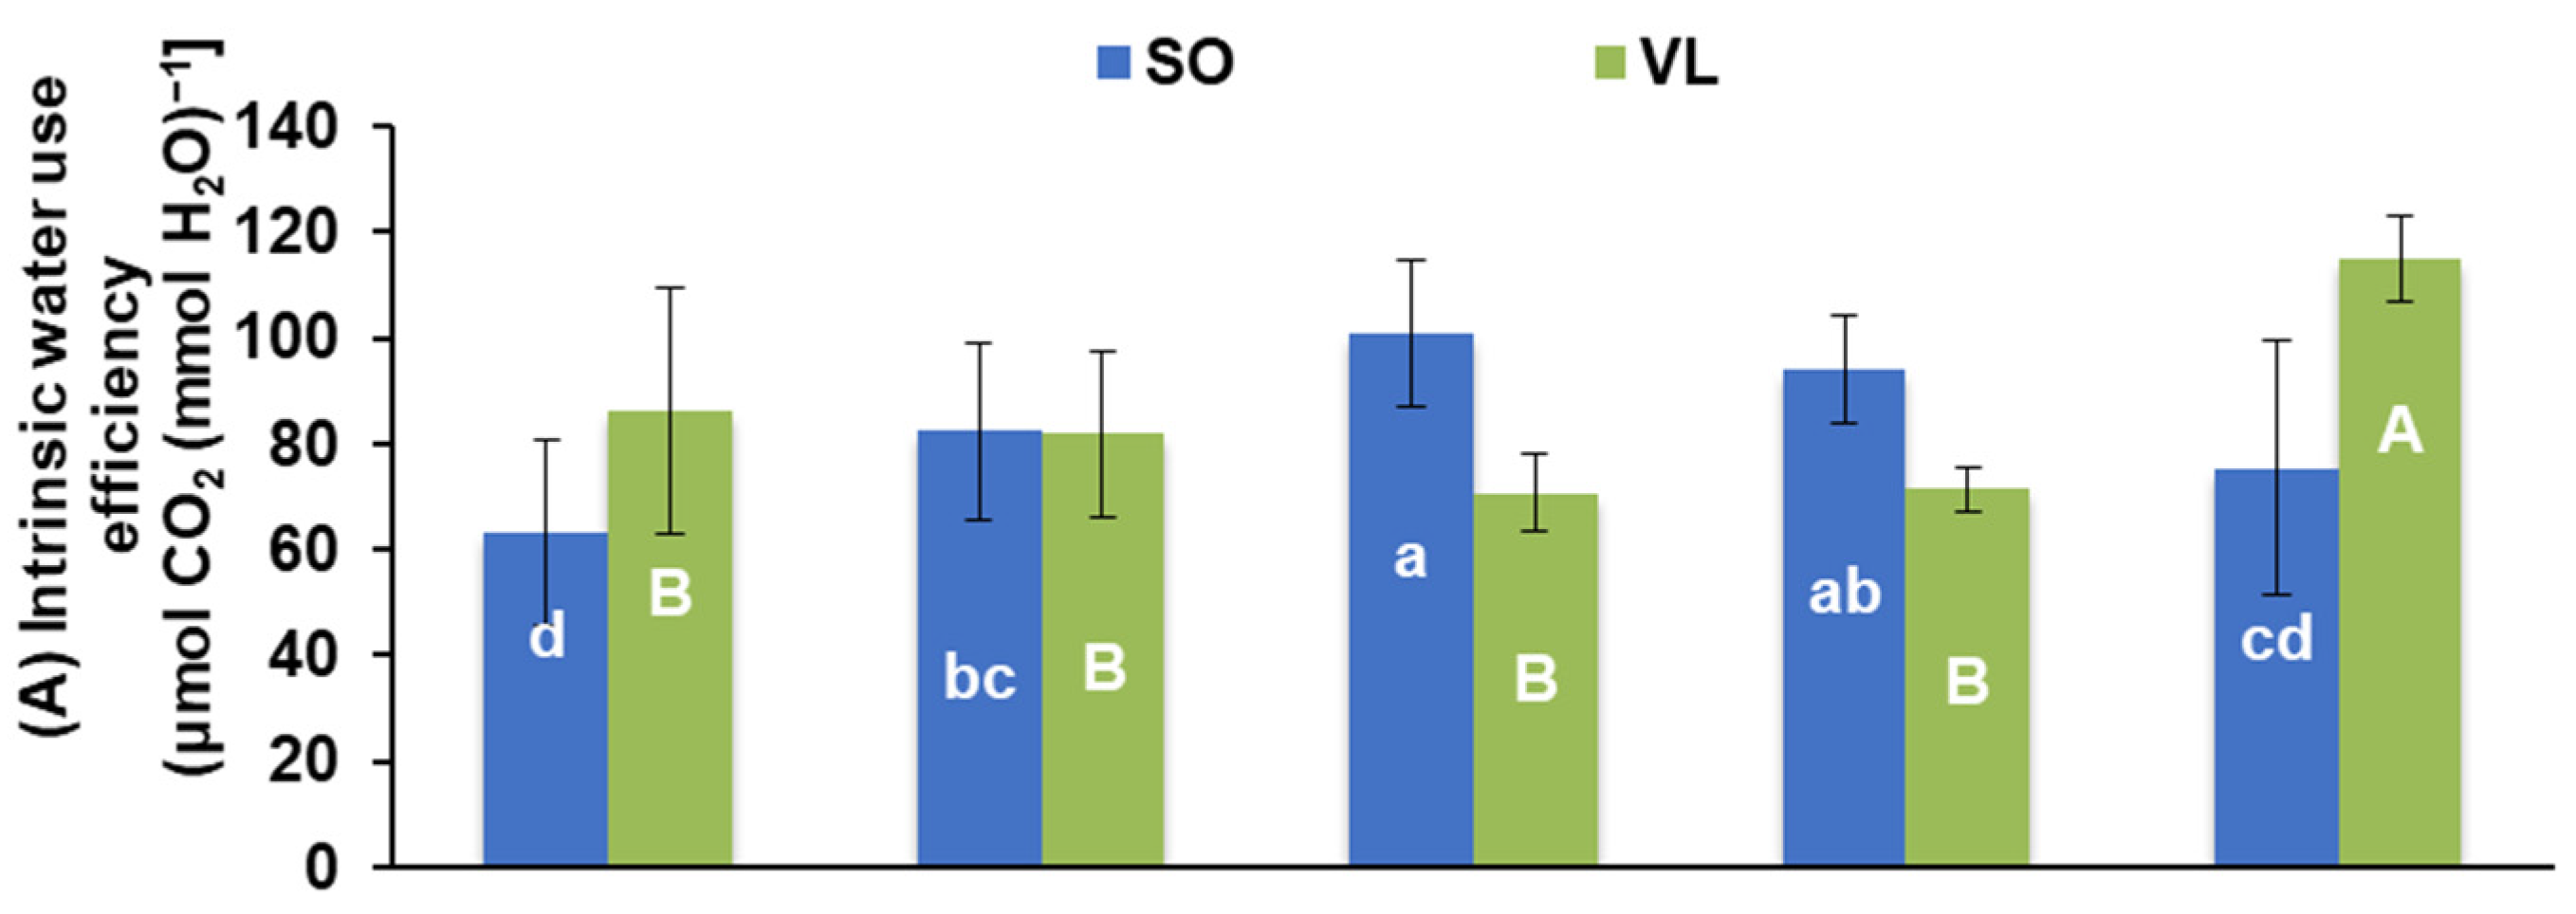
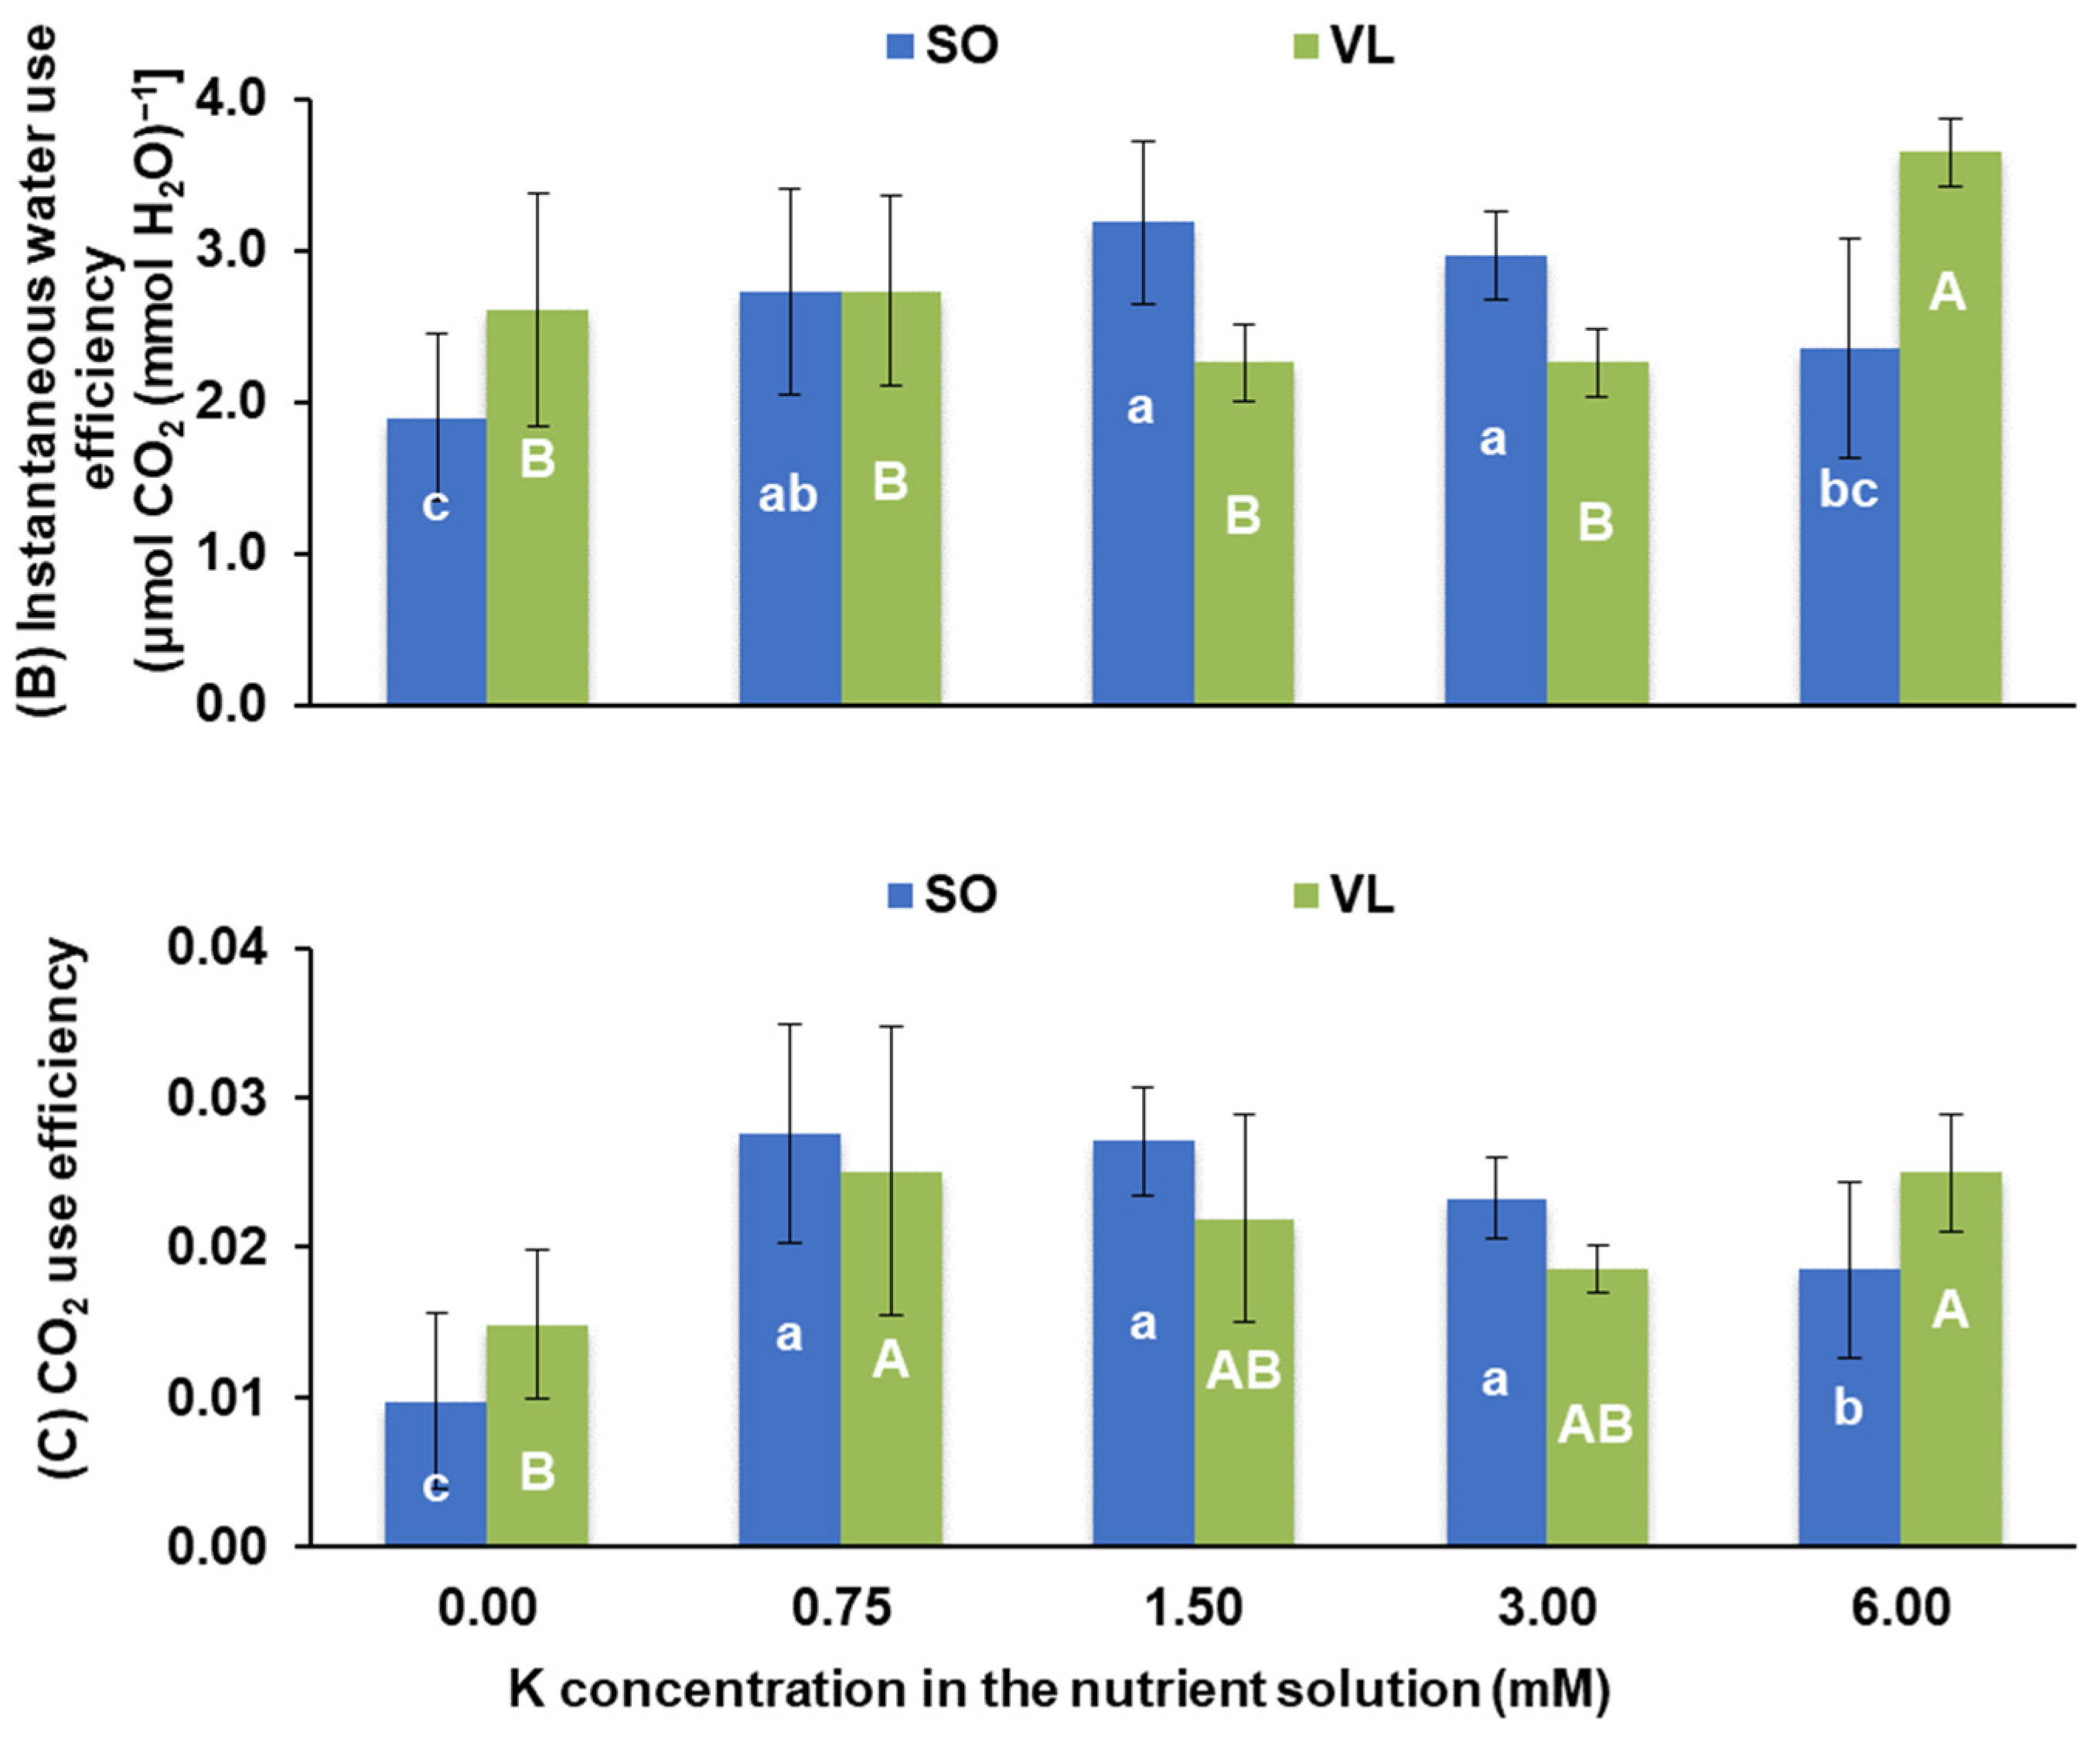
  • Physiological responses: potassium deficiency adversely affected various physiological processes in lemon leaves, including a decrease in photosynthesis rate, stomatal conductance, transpiration rate, intercellular CO2 concentration, water use efficiency, CO2 utilization efficiency, chlorophyll a/b ratio, and carotenoid concentrations. Low rates of leaf photosynthesis under K deficiency were due to both stomatal and non-stomatal limitations;
  • Rootstock-dependent effects: rootstock-dependent responses were observed in scion leaf and stem growth as well as mineral nutrient concentration, uptake, and distribution across plant parts. Additionally, variations were noted in leaf intercellular CO2 concentration, water use efficiency, carboxylation efficiency, Chl a/b ratio, and total carotenoid concentration under varying K conditions, highlighting the complexity of rootstock interactions.
These findings underscore the crucial role of rootstock selection in plant growth, photosynthetic performance, leaf K concentrations, and overall mineral nutrition in lemon trees. Understanding these rootstock-dependent effects is crucial for promoting sustainable farming, fine-tuning K fertilization techniques, and elevating lemon tree performance and fruit quality.

Author Contributions

Conceptualization, I.E.P.; methodology, I.E.P., A.O., E.-V.L., T.C. and G.C.; software, I.E.P., A.O. and E.-V.L.; validation, I.E.P., A.O., E.-V.L., G.C. and T.C.; formal analysis, I.E.P., E.-V.L. and A.O.; investigation, I.E.P., A.O., E.-V.L., T.C. and G.C.; resources, I.E.P.; data curation, I.E.P., A.O. and E.-V.L.; writing—original draft preparation, I.E.P. and E.-V.L.; writing—review and editing, I.E.P. and T.C.; visualization, I.E.P. and E.-V.L.; supervision, I.E.P.; project administration, I.E.P.; funding acquisition, I.E.P. All authors have read and agreed to the published version of the manuscript.

Funding

This research received no external funding.

Data Availability Statement

Data are contained within the article.

Acknowledgments

Authors would like to thank the “Hellenic Plants” nursery (Xylokastro, Greece) for preparing grafted plants.

Conflicts of Interest

The authors declare no conflict of interest.

References

  1. Food and Agriculture Organization of the United Nations Statistics Division, FAOSTAT DATABASE. Available online: https://www.fao.org/faostat/en/ (accessed on 29 September 2023).
  2. Matheyambath, A.C.; Padmanabhan, P.; Paliyath, G. Citrus Fruits. In Encyclopedia of Food and Health; Elsevier: Amsterdam, The Netherlands, 2016; pp. 136–140. [Google Scholar] [CrossRef]
  3. Lemon (Citrus limon). Available online: https://www.hort.purdue.edu/newcrop/morton/lemon.html (accessed on 29 September 2023).
  4. Klimek-Szczykutowicz, M.; Szopa, A.; Ekiert, H. Citrus limon (Lemon) Phenomenon—A Review of the Chemistry, Pharmacological Properties, Applications in the Modern Pharmaceutical, Food, and Cosmetics Industries, and Biotechnological Studies. Plants 2020, 9, 119. [Google Scholar] [CrossRef] [PubMed]
  5. Saini, R.K.; Ranjit, A.; Sharma, K.; Prasad, P.; Shang, X.; Gowda, K.G.M.; Keum, Y.S. Bioactive Compounds of Citrus Fruits: A Review of Composition and Health Benefits of Carotenoids, Flavonoids, Limonoids, and Terpenes. Antioxidants 2022, 11, 239. [Google Scholar] [CrossRef] [PubMed]
  6. Mattos, D.; Kadyampakeni, D.M.; Oliver, A.Q.; Boaretto, R.M.; Morgan, K.T.; Quaggio, J.A. Soil and Nutrition Interactions. In The Genus Citrus; Talon, M., Caruso, M., Gmitter, F.G., Eds.; Woodhead Publishing: Sawston, UK, 2020; pp. 311–331. [Google Scholar] [CrossRef]
  7. Marschner, P. Marschner’s Mineral Nutrition of Higher Plants, 3rd ed.; Elsevier: Amsterdam, The Netherlands, 2011; 672p. [Google Scholar]
  8. Oosterhuis, D.M.; Loka, D.A.; Kawakami, E.M.; Pettigrew, W.T. The Physiology of Potassium in Crop Production. Adv. Agron. 2014, 126, 203–233. [Google Scholar] [CrossRef]
  9. Rawat, J.; Sanwal, P.; Saxena, J. Potassium and Its Role in Sustainable Agriculture. In Potassium Solubilizing Microorganisms for Sustainable Agriculture; Springer: New Delhi, India, 2016; pp. 235–253. [Google Scholar] [CrossRef]
  10. Cakmak, I. The Role of Potassium in Alleviating Detrimental Effects of Abiotic Stresses in Plants. J. Plant Nutr. Soil Sci. 2005, 168, 521–530. [Google Scholar] [CrossRef]
  11. Johnson, R.; Vishwakarma, K.; Hossen, M.S.; Kumar, V.; Shackira, A.M.; Puthur, J.T.; Abdi, G.; Sarraf, M.; Hasanuzzaman, M. Potassium in Plants: Growth Regulation, Signaling, and Environmental Stress Tolerance. Plant Physiol. Biochem. 2022, 172, 56–69. [Google Scholar] [CrossRef] [PubMed]
  12. Hasanuzzaman, M.; Bhuyan, M.H.M.B.; Nahar, K.; Hossain, M.S.; Mahmud, J.A.; Hossen, M.S.; Masud, A.A.C.; Moumita; Fujita, M. Potassium: A Vital Regulator of Plant Responses and Tolerance to Abiotic Stresses. Agronomy 2018, 8, 31. [Google Scholar] [CrossRef]
  13. Morris, J.R.; Sims, C.A.; Cawthon, D.L. Effects of Excessive Potassium Levels On PH, Acidity and Color of Fresh and Stored Grape Juice. Am. J. Enol. Vitic. 1983, 34, 35–39. [Google Scholar] [CrossRef]
  14. Dibb, D.W.; Thompson, W.R. Interaction of Potassium with Other Nutrients. In Potassium in Agriculture; Wiley Online Library: Hoboken, NJ, USA, 2015; pp. 515–533. [Google Scholar] [CrossRef]
  15. Daliparthy, J.; Barker, A.V.; Mondal, S.S. Potassium Fractions with Other Nutrients in Crops: A Review Focusing on the Tropics. J. Plant Nutr. 1994, 17, 1859–1886. [Google Scholar] [CrossRef]
  16. Fageria, V.D. Nutrient Interactions in Crop Plants. J. Plant Nutr. 2001, 24, 1269–1290. [Google Scholar] [CrossRef]
  17. Xu, X.; Du, X.; Wang, F.; Sha, J.; Chen, Q.; Tian, G.; Zhu, Z.; Ge, S.; Jiang, Y. Effects of Potassium Levels on Plant Growth, Accumulation and Distribution of Carbon, and Nitrate Metabolism in Apple Dwarf Rootstock Seedlings. Front. Plant Sci. 2020, 11, 534048. [Google Scholar] [CrossRef] [PubMed]
  18. Quaggio, J.A.; Mattos, D.; Cantarella, H.; Almeida, E.L.E.; Cardoso, S.A.B. Lemon Yield and Fruit Quality Affected by NPK Fertilization. Sci. Hortic. 2002, 96, 151–162. [Google Scholar] [CrossRef]
  19. Alva, A.K.; Mattos, D.; Paramasivam, S.; Patil, B.; Dou, H.; Sajwan, K.S. Potassium Management for Optimizing Citrus Production and Quality. Int. J. Fruit Sci. 2006, 6, 3–43. [Google Scholar] [CrossRef]
  20. Vijay, V.; Dalal, R.P.S.; Beniwal, B.S.; Saini, H. Impact of Foliar Application of Potassium and Its Spray Schedule on Yield and Quality of Sweet Orange (Citrus sinensis) Cv. Jaffa. J. Appl. Nat. Sci. 2016, 8, 1893–1898. [Google Scholar] [CrossRef]
  21. Ben Mimoun, M.; Dbara, S.; Lahmar, K.; Marchand, M. Effects of Potassium Nutrition on Fruit Yield and Quality of ‘Maltaise’ Citrus (Citrus sinensis L.). Acta Hortic. 2018, 1217, 225–230. [Google Scholar] [CrossRef]
  22. Davies, F.S.; Albrigo, L.G. Citrus; CAB International: Wallingford, UK, 1994; 254p. [Google Scholar]
  23. Al-Jaleel, A.; Zekri, M.; Hammam, Y. Yield, Fruit Quality, and Tree Health of ‘Allen Eureka’ Lemon on Seven Rootstocks in Saudi Arabia. Sci. Hortic. 2005, 105, 457–465. [Google Scholar] [CrossRef]
  24. Papadakis, I.E.; Dimassi, K.N.; Bosabalidis, A.M.; Therios, I.N.; Patakas, A.; Giannakoula, A. Boron Toxicity in ‘Clementine’ Mandarin Plants Grafted on Two Rootstocks. Plant Sci. 2004, 166, 539–547. [Google Scholar] [CrossRef]
  25. Papadakis, I.E.; Dimassi, K.N.; Bosabalidis, A.M.; Therios, I.N.; Patakas, A.; Giannakoula, A. Effects of B Excess on Some Physiological and Anatomical Parameters of ‘Navelina’ Orange Plants Grafted on Two Rootstocks. Environ. Exp. Bot. 2004, 51, 247–257. [Google Scholar] [CrossRef]
  26. Martínez-Nicolas, J.J.; Núñez-Gómez, D.; Lidón, V.; Martínez-Font, R.; Melgarejo, P.; Hernández, F.; Legua, P. Physico-Chemical Attributes of Lemon Fruits as Affected by Growing Substrate and Rootstock. Foods 2022, 11, 2487. [Google Scholar] [CrossRef] [PubMed]
  27. Hoagland, D.R.; Arnon, D.I. The Water-Culture Method for Growing Plants without Soil. Circ. Calif. Agric. Exp. Stn. 1950, 347, 23–32. [Google Scholar]
  28. Lichtenthaler, H.K.; Buschmann, C. Chlorophylls and Carotenoids: Measurement and Characterization by UV-VIS Spectroscopy. Curr. Protoc. Food Anal. Chem. 2001, 1, F4.3.1–F4.3.8. [Google Scholar] [CrossRef]
  29. Fageria, N.K.; Oliveira, J.P. Nitrogen, Phosphorus and Potassium Interactions in Upland Rice. J. Plant Nutr. 2014, 37, 1586–1600. [Google Scholar] [CrossRef]
  30. Hamouda, H.A.; Eldahshouri, M.F.; Manal, F.M.; Thalooth, A.T. Growth, Yield and Nutrient Status of Wheat Plants as Affected by Potassium and Iron Foliar Application in Sandy Soil. Int. J. Chemtech Res. 2015, 8, 1473–1481. [Google Scholar]
  31. Gerardeaux, E.; Jordan-Meille, L.; Constantin, J.; Pellerin, S.; Dingkuhn, M. Changes in Plant Morphology and Dry Matter Partitioning Caused by Potassium Deficiency in Gossypium hirsutum (L.). Environ. Exp. Bot. 2010, 67, 451–459. [Google Scholar] [CrossRef]
  32. Çelik, H.; Aşik, B.; Gürel, S.; Katkat, A.V. Effects of Potassium and Iron on Macro Element Uptake of Maize. Zemdirb. Agric. 2010, 97, 11–22. [Google Scholar]
  33. Sun, T.; Zhang, J.; Zhang, Q.; Li, X.; Li, M.; Yang, Y.; Zhou, J.; Wei, Q.; Zhou, B. Transcriptional and Metabolic Responses of Apple to Different Potassium Environments. Front. Plant Sci. 2023, 14, 1131708. [Google Scholar] [CrossRef] [PubMed]
  34. Xu, X.; Wang, F.; Xing, Y.; Liu, J.; Lv, M.; Meng, H.; Du, X.; Zhu, Z.; Ge, S.; Jiang, Y. Appropriate and Constant Potassium Supply Promotes the Growth of M9T337 Apple Rootstocks by Regulating Endogenous Hormones and Carbon and Nitrogen Metabolism. Front. Plant Sci. 2022, 13, 827478. [Google Scholar] [CrossRef] [PubMed]
  35. Cavalcante, V.S.; Prado, R.; Almeida, H.J.; Cruz, F.; Santos, D.M.M. Gaseous Exchanges, Growth and Foliar Anatomy of Sugarcane Plants Grown in Potassium (K) Deprived Nutrient Solution. Aust. J. Crop Sci. 2015, 9, 577–584. [Google Scholar]
  36. Römheld, V.; Kirkby, E.A. Research on Potassium in Agriculture: Needs and Prospects. Plant Soil 2010, 335, 155–180. [Google Scholar] [CrossRef]
  37. Jákli, B.; Tavakol, E.; Tränkner, M.; Senbayram, M.; Dittert, K. Quantitative Limitations to Photosynthesis in K Deficient Sunflower and Their Implications on Water-Use Efficiency. J. Plant Physiol. 2017, 209, 20–30. [Google Scholar] [CrossRef]
  38. Çalişkan, B.; Çalişkan, A.C. Potassium Nutrition in Plants and Its Interactions with Other Nutrients in Hydroponic Culture. In Potassium—Improvement of Quality in Fruits and Vegetables Through Hydroponic Nutrient Management; InTechOpen: London, UK, 2018. [Google Scholar] [CrossRef]
  39. Pettigrew, W.T.; Gerik, T.J. Cotton Leaf Photosynthesis and Carbon Metabolism. Adv. Agron. 2007, 94, 209–236. [Google Scholar] [CrossRef]
  40. Jin, S.H.; Huang, J.Q.; Li, X.Q.; Zheng, B.S.; Wu, J.S.; Wang, Z.J.; Liu, G.H.; Chen, M. Effects of Potassium Supply on Limitations of Photosynthesis by Mesophyll Diffusion Conductance in Carya cathayensis. Tree Physiol. 2011, 31, 1142–1151. [Google Scholar] [CrossRef] [PubMed]
  41. Bednarz, C.W.; Oosterhuis, D.M.; Evans, R.D. Leaf Photosynthesis and Carbon Isotope Discrimination of Cotton in Response to Potassium Deficiency. Environ. Exp. Bot. 1998, 39, 131–139. [Google Scholar] [CrossRef]
  42. Hu, W.; Lu, Z.; Meng, F.; Li, X.; Cong, R.; Ren, T.; Sharkey, T.D.; Lu, J. The Reduction in Leaf Area Precedes That in Photosynthesis under Potassium Deficiency: The Importance of Leaf Anatomy. New Phytol. 2020, 227, 1749–1763. [Google Scholar] [CrossRef] [PubMed]
  43. de Sousa, R.R.; de Oliveira Freire, A.L. Gas Exchange of Oiticica Seedlings in Response to Potassium Fertilization and Water Turning. J. Exp. Agric. Int. 2022, 44, 35–46. [Google Scholar] [CrossRef]
  44. Pervez, H.; Ashraf, M.; Makhdum, M.I. Influence of Potassium Nutrition on Gas Exchange Characteristics and Water Relations in Cotton (Gossypium hirsutum L.). Photosynthetica 2004, 42, 251–255. [Google Scholar] [CrossRef]
  45. Mohd Zain, N.A.; Ismail, M.R. Effects of Potassium Rates and Types on Growth, Leaf Gas Exchange and Biochemical Changes in Rice (Oryza sativa) Planted under Cyclic Water Stress. Agric. Water Manag. 2016, 164, 83–90. [Google Scholar] [CrossRef]
  46. Du, Q.; Zhao, X.H.; Xia, L.; Jiang, C.J.; Wang, X.G.; Han, Y.; Wang, J.; Yu, H.-Q. Effects of Potassium Deficiency on Photosynthesis, Chloroplast Ultrastructure, ROS, and Antioxidant Activities in Maize (Zea mays L.). J. Integr. Agric. 2019, 18, 395–406. [Google Scholar] [CrossRef]
  47. Quaggio, J.A.; Mattos Junior, D.; Boaretto, R.M. Sources and Rates of Potassium for Sweet Orange Production. Sci. Agric. 2011, 68, 369–375. [Google Scholar] [CrossRef]
  48. Ashraf, M.Y.; Gul, A.; Ashraf, M.; Hussain, F.; Ebert, G. Improvement in Yield and Quality of Kinnow (Citrus deliciosa × Citrus nobilis) by Potassium Fertilization. J. Plant Nutr. 2010, 33, 1625–1637. [Google Scholar] [CrossRef]
  49. Khoshbakht, D.; Ghorbani, A.; Baninasab, B.; Naseri, L.A.; Mirzaei, M. Effects of Supplementary Potassium Nitrate on Growth and Gas-Exchange Characteristics of Salt-Stressed Citrus Seedlings. Photosynthetica 2014, 52, 589–596. [Google Scholar] [CrossRef]
  50. Singh, G.; Rattanpal, H.S.; Chahal, T.S.; Singh, K.; Gupta, M. Effects of Potassium Application on Vegetative Growth, Fruiting, and Nutrient Status of Kinnow Mandarin under Indian Sub-Tropical Conditions. J. Plant Nutr. 2023, 46, 1197–1206. [Google Scholar] [CrossRef]
  51. Papadakis, I.E.; Antonopoulou, C.; Sotiropoulos, T.; Chatzissavvidis, C.; Therios, I. Effect of Magnesium on Mineral Nutrition, Chlorophyll, Proline and Carbohydrate Concentrations of Sweet Orange (Citrus sinensis Cv. Newhall) Plants. Appl. Sci. 2023, 13, 7995. [Google Scholar] [CrossRef]
  52. Papadakis, I.E.; Antonopoulou, C.; Chatzissavvidis, C.; Protopapadakis, E.; Therios, I. Rootstock Effects on Nutritional Status, Yield and Fruit Quality of Washington Navel Sweet Orange [Citrus sinensis (L.) Osbeck] Trees. Agrochimica 2018, 62, 367–378. [Google Scholar] [CrossRef]
  53. Dubey, A.K.; Sharma, R.M. Effect of Rootstocks on Tree Growth, Yield, Quality and Leaf Mineral Composition of Lemon (Citrus limon (L.) Burm.). Sci. Hortic. 2016, 200, 131–136. [Google Scholar] [CrossRef]
  54. Taylor, B.K.; Dimsey, R.T. Rootstock and Scion Effects on the Leaf Nutrient Composition of Citrus Trees. Aust. J. Exp. Agric. 1993, 33, 363. [Google Scholar] [CrossRef]
  55. Toplu, C.; Uygur, V.; Kaplankiran, M.; Demirkeser, T.H.; Yildiz, E. Leaf Mineral Composition of “Nova”, “robinson” and “Fremont” Mandarin Cultivars on Different Rootstocks. J. Plant Nutr. 2010, 33, 602–612. [Google Scholar] [CrossRef]
  56. El-Sayed, O.M. Mutual Effect Between Three Orange Cvs. And Sour Orange and Volkameriana Rootstocks in Newly Reclaimed Lands. Arab Univ. J. Agric. Sci. 2013, 21, 219–233. [Google Scholar]
  57. White, P.J.; Bell, M.J.; Djalovic, I.; Hinsinger, P.; Rengel, Z. Potassium Use Efficiency of Plants. In Improving Potassium Recommendations for Agricultural Crops; Murrell, T.S., Mikkelsen, R.L., Sulewski, G., Norton, R., Thompson, M.L., Eds.; Springer: Cham, Switzerland, 2020; pp. 119–145. [Google Scholar] [CrossRef]
  58. Robson, A.D.; Pitman, M.G. Interactions Between Nutrients in Higher Plants. In Inorganic Plant Nutrition; Springer: Berlin/Heidelberg, Germany, 1983; pp. 147–180. [Google Scholar]
  59. Xie, K.; Cakmak, I.; Wang, S.; Zhang, F.; Guo, S. Synergistic and Antagonistic Interactions between Potassium and Magnesium in Higher Plants. Crop J. 2021, 9, 249–256. [Google Scholar] [CrossRef]
  60. Mengel, K. Potassium. In Handbook of Plant Nutrition; Barker, A.V., Pilbeam, D.J., Eds.; CRC Press: Boca Raton, FL, USA, 2007; pp. 91–120. [Google Scholar]
Figure 1. Symptoms of potassium deficiency showing characteristic chlorotic and necrotic areas in lemon leaves, predominantly observed in the basal part of the stems.
Sustainability 15 15858 g001
Figure 2. Leaf photosynthetic rate (A), stomatal conductance (B), transpiration rate (C), and intercellular CO2 concentration (D) of lemon plants (cv. Adamopoulou), as affected by K level in the nutrient solution (0.00, 0.75, 1.50, 3.00, and 6.00 mM K) and rootstock (sour orange, SO; Volkamer lemon, VL). For each parameter and rootstock, means (±S.E.), followed by different letter(s), indicate statistically significant differences, according to Duncan’s multiple range test, p ≤ 0.05, between K treatments within the same rootstock; n = 5. Particularly, in order to compare the mean values of K treatments for the SO rootstock, lowercase letters are used, while for the comparison of mean values of K treatments for the VL rootstock, capital letters are used.
Sustainability 15 15858 g002aSustainability 15 15858 g002b
Figure 3. Intrinsic water use efficiency (A), instantaneous water use efficiency (B), and carbon dioxide use efficiency (C) of lemon plants (cv. Adamopoulou), as affected by K level in the nutrient solution (0.00, 0.75, 1.50, 3.00, and 6.00 mM K) and rootstock (sour orange, SO; Volkamer lemon, VL). For each parameter and rootstock, means (±S.E.) followed by different letter(s) indicate statistically significant differences, according to Duncan’s multiple range test, p ≤ 0.05, between K treatments within the same rootstock; n = 5. Particularly, in order to compare the mean values of K treatments for the SO rootstock, lowercase letters are used, while for the comparison of mean values of K treatments for the VL rootstock, capital letters are used.
Sustainability 15 15858 g003aSustainability 15 15858 g003b
Figure 4. Potassium (K) concentrations (% d.w.) in leaves (A), scion stems (B), rootstock stem (C), and roots (D) of lemon plants (cv. Adamopoulou), as affected by K level in the nutrient solution (0.00, 0.75, 1.50, 3.00, and 6.00 mM K) and rootstock (sour orange, SO; Volkamer lemon, VL). For each parameter and rootstock, means (±S.E.) followed by different letter(s) indicate significant differences, according to Duncan’s multiple range test, p ≤ 0.05, among various K treatments within the same rootstock; n = 5. Particularly, in order to compare the mean values of K treatments for the SO rootstock, lowercase letters are used, while for the comparison of mean values of K treatments for the VL rootstock, capital letters are used.
Sustainability 15 15858 g004aSustainability 15 15858 g004b
Figure 5. Total plant K content (quantity) (A) and K use efficiency (B) in lemon plants (cv. Adamopoulou), as affected by K level in the nutrient solution (0.00, 0.75, 1.50, 3.00, and 6.00 mM K) and rootstock (sour orange, SO; Volkamer lemon, VL). For each parameter and rootstock, means (±S.E.), followed by different letter(s), indicate statistically significant differences, according to Duncan’s multiple range test, p ≤ 0.05, among various K treatments within the same rootstock; n = 5. Particularly, in order to compare the mean values of K treatments for the SO rootstock, lowercase letters are used, while for the comparison of mean values of K treatments for the VL rootstock, capital letters are used.
Sustainability 15 15858 g005
Table 1. Effects of K level in the nutrient solution (0.00, 0.75, 1.50, 3.00, and 6.00 mM K) and rootstock (sour orange, SO; Volkamer lemon, VL) on growth parameters of lemon plants (cv. Adamopoulou), as expressed on a dry weight basis of leaves, stems of scion, stem of rootstock, and roots. Total plant dry weight is also presented.
RootstockDry Weights (g)K Concentration in the Nutrient Solution (mM)
0.000.751.503.006.00
SOLeaves28.31 ± 3.69 b37.7 ± 1.75 a32.81 ± 1.99 ab34.13 ± 2.75 a23.45 ± 4.26 b
Scion Stems19.31 ± 2.04 c31.01 ± 1.51 a25.38 ± 0.93 abc29.4 ± 4.28 a21.87 ± 3.66 bc
Rootstock Stem43.48 ± 2.37 a56.22 ± 2.52 a54.87 ± 2.46 a53.05 ± 4.53 a48.09 ± 3.42 a
Root22.09 ± 3.95 a28.92 ± 1.86 a26.88 ± 1.11 a26.82 ± 1.57 a22.22 ± 2.56 a
Total Plant113.19 ± 11.19 b153.84 ± 7.11 a139.93 ± 4.95 ab143.4 ± 12.32 ab115.62 ± 12.27 b
VLLeaves37.96 ± 3.69 a43.39 ± 8.02 a44.76 ± 3.43 a32.39 ± 1.64 a32.98 ± 3.19 a
Scion Stems35.43 ± 2.13 a44.14 ± 8.67 a49.61 ± 3.38 a42.76 ± 3.74 a38.72 ± 3.78 a
Rootstock Stem64.49 ± 2.6 a62.45 ± 1.54 a60.07 ± 3.69 a58.06 ± 2.64 a54.74 ± 2.77 a
Root29.48 ± 0.77 ab29.4 ± 3.59 a32.15 ± 2.39 a21.97 ± 1.64 c24.46 ± 1.66 bc
Total Plant167.37 ± 5.3 a179.38 ± 20.84 a186.59 ± 8.73 a155.17 ± 5.99 a150.89 ± 8.45 a
The values are means (±S.E.) of 5 replicates for each rootstock; different letters in the same row indicate statistically significant differences among the K treatments (for the same plant part and rootstock), according to Duncan’s multiple range test, p ≤ 0.05.
Table 2. Effects of K level in the nutrient solution (0.00, 0.75, 1.50, 3.00, and 6.00 mM K) and rootstock (sour orange, SO; Volkamer lemon, VL) on leaf photosynthetic pigments (chlorophylls, Chl; carotenoids, Car) in lemon plants (cv. Adamopoulou). All measurements are expressed in mg g−1 f.w. (fresh weight).
RootstockParameterK Concentration in the Nutrient Solution (mM)
0.000.751.503.006.00
SOChla1.07 ± 0.31 a1.55 ± 0.16 a1.65 ± 0.19 a1.44 ± 0.44 a1.61 ± 0.22 a
Chlb0.44 ± 0.1 a0.56 ± 0.08 a0.6 ± 0.08 a0.53 ± 0.16 a0.6 ± 0.08 a
Chla + Chlb1.51 ± 0.41 a2.11 ± 0.24 a2.25 ± 0.27 a1.97 ± 0.59 a2.21 ± 0.3 a
Chla/Chlb2.41 ± 0.2 b2.78 ± 0.13 a2.75 ± 0.07 a2.72 ± 0.09 a2.69 ± 0.06 a
Carotenoids0.36 ± 0.08 b0.48 ± 0.04 a0.51 ± 0.06 a0.47 ± 0.1 ab0.52 ± 0.07 a
VLChla1.39 ± 0.32 a1.53 ± 0.15 a1.75 ± 0.26 a1.69 ± 0.46 a1.49 ± 0.11 a
Chlb0.56 ± 0.13 a0.57 ± 0.04 a0.73 ± 0.17 a0.7 ± 0.23 a0.62 ± 0.1 a
Chla + Chlb1.95 ± 0.44 a2.1 ± 0.19 a2.48 ± 0.42 a2.39 ± 0.68 a2.11 ± 0.21 a
Chla/Chlb2.46 ± 0.05 a2.69 ± 0.1 a2.42 ± 0.25 a2.44 ± 0.24 a2.43 ± 0.23 a
Carotenoids0.43 ± 0.09 a0.49 ± 0.05 a0.54 ± 0.03 a0.51 ± 0.09 a0.45 ± 0.02 a
The values are means (±S.E.) of 5 replicates for each rootstock; different letters in the same row indicate statistically significant differences between K treatments (for the same plant part and rootstock), according to Duncan’s multiple range test, p ≤ 0.05.
Table 3. Effects of K level in the nutrient solution (0.00, 0.75, 1.50, 3.00, and 6.00 mM K) on K distribution (% of total plant K) in different plant parts (leaves, scion stems, rootstock stem, roots, scion (total), and rootstock (total)) of lemon plants (cv. Adamopoulou) grafted onto SO (sour orange) or VL (Volkamer lemon) rootstock.
RootstockPlant PartK Concentration in the Nutrient Solution (mM)
0.000.751.503.006.00
SOLeaves40.96 ± 3.19 a49.79 ± 1.06 a50.59 ± 2.18 a48.95 ± 2.48 a43.03 ± 4.03 a
Scion Stems10.19 ± 0.68 b12.97 ± 0.62 ab13.1 ± 0.83 ab15.45 ± 1.12 a16.39 ± 1.81 a
Rootstock Stem21.8 ± 3.4 a15.99 ± 0.41 b14.67 ± 1.22 b12.34 ± 1.46 b15.04 ± 1.76 b
Roots27.05 ± 1.48 a21.25 ± 0.85 a21.64 ± 1.32 a23.26 ± 1.54 a25.53 ± 3.74 a
Scion (Total)51.16 ± 3.1 b62.76 ± 0.94 a63.69 ± 2.08 a64.4 ± 2.81 a59.42 ± 4.93 ab
Rootstock (Total)48.84 ± 3.1 a37.24 ± 0.94 b36.31 ± 2.08 b35.6 ± 2.81 b40.58 ± 4.93 ab
VLLeaves38.59 ± 2.4 a45.34 ± 2.49 a44.76 ± 1.04 a39.73 ± 1.86 a46.47 ± 2.66 a
Scion Stems12.37 ± 1.05 b15.23 ± 1.38 b14.7 ± 0.8 b23.75 ± 1.38 a22.04 ± 1.89 a
Rootstock Stem20.82 ± 0.86 a16.9 ± 2.34 ab12.06 ± 1.56 bc14.12 ± 2.28 bc9.98 ± 0.32 c
Roots28.22 ± 1.59 a22.54 ± 0.68 b28.47 ± 1.06 a22.41 ± 2.32 b21.5 ± 0.82 b
Scion (Total)50.96 ± 1.76 c60.57 ± 1.9 b59.47 ± 1.11 b63.47 ± 2.45 ab68.51 ± 0.78 a
Rootstock (Total)49.04 ± 1.76 a39.43 ± 1.9 b40.53 ± 1.11 b36.53 ± 2.45 bc31.49 ± 0.78 c
The values are means (±S.E.) of 5 replicates per each rootstock; different letters in the same row indicate statistically significant differences between K treatments (for the same plant part and rootstock), according to Duncan’s multiple range test, p ≤ 0.05.
Table 4. Effects of K level in the nutrient solution (0.00, 0.75, 1.50, 3.00, and 6.00 mM K) on K, N, Ca, Mg, P, Fe, Mn, Cu, B and Zn concentrations in different plant parts (leaves, scion stems, rootstock stem, roots) of lemon plants (cv. Adamopoulou) grafted onto SO (sour orange) rootstock.
ElementPlant PartK Concentration in the Nutrient Solution (mM)
0.000.751.503.006.00
N
(% d.w.)
Leaves2.98 ± 0.19 a3.01 ± 0.06 a2.99 ± 0.12 a2.93 ± 0.05 a2.75 ± 0.13 a
Scion Stems1.45 ± 0.05 a1.29 ± 0.11 ab1.25 ± 0.04 ab1.13 ± 0.05 bc0.95 ± 0.1 c
Rootstock Stem0.88 ± 0.01 a0.79 ± 0.03 a0.88 ± 0.02 a0.94 ± 0.08 a0.93 ± 0.05 a
Roots2.55 ± 0.12 a2.06 ± 0.06 b2.16 ± 0.08 b2.18 ± 0.05 b2.04 ± 0.06 b
Ca
(% d.w.)
Leaves4.44 ± 0.37 a3.56 ± 0.05 b2.73 ± 0.19 c2.07 ± 0.09 d1.49 ± 0.08 d
Scion Stems1.54 ± 0.08 ab1.4 ± 0.02 ab1.56 ± 0.06 a1.3 ± 0.13 b0.97 ± 0.05 c
Rootstock Stem0.99 ± 0.05 a1.13 ± 0.03 a1.14 ± 0.05 a1.12 ± 0.1 a0.98 ± 0.07 a
Roots0.98 ± 0.12 b1.72 ± 0.08 a1.7 ± 0.08 a1.74 ± 0.02 a1.92 ± 0.17 a
Mg
(% d.w.)
Leaves0.4 ± 0.03 a0.35 ± 0.01 ab0.32 ± 0.01 bc0.27 ± 0.01 c0.19 ± 0.02 d
Scion Stems0.18 ± 0.02 a0.16 ± 0 ab0.19 ± 0.01 a0.13 ± 0.01 bc0.1 ± 0.01 c
Rootstock Stem0.06 ± 0.01 a0.05 ± 0 a0.05 ± 0 a0.04 ± 0 a0.04 ± 0 a
Roots0.16 ± 0.01 a0.16 ± 0.01 a0.16 ± 0.01 a0.12 ± 0.01 b0.09 ± 0.01 c
P
(% d.w.)
Leaves0.68 ± 0.05 a0.67 ± 0.01 a0.63 ± 0.02 a0.63 ± 0.03 a0.5 ± 0.03 b
Scion Stems0.91 ± 0.06 a0.8 ± 0.04 ab0.85 ± 0.03 ab0.73 ± 0.03 b0.57 ± 0.05 c
Rootstock Stem0.47 ± 0.07 a0.43 ± 0.03 ab0.51 ± 0.03 a0.46 ± 0.03 ab0.35 ± 0.02 b
Roots1.02 ± 0.06 a0.98 ± 0.02 a0.89 ± 0.03 a0.96 ± 0.02 a0.9 ± 0.07 a
Fe
(mg kg−1 d.w.)
Leaves35.68 ± 1.21 c49.53 ± 1.83 bc51.19 ± 4.43 bc75.02 ± 13.43 a63.48 ± 5.1 ab
Scion Stems15.08 ± 1.29 a22.26 ± 3.18 a23.82 ± 1.66 a21.08 ± 1.75 a22.89 ± 3.81 a
Rootstock Stem18.74 ± 1.81 a19.34 ± 2.65 a16.61 ± 0.57 a15.89 ± 1.2 a16.04 ± 1.58 a
Roots361.28 ± 27.35 bc504.65 ± 33.93 a477.6 ± 41.48 a433.98 ± 37.37 ab308.68 ± 26.25 c
Mn
(mg kg−1 d.w.)
Leaves53.58 ± 2.38 a49.09 ± 1 a45.96 ± 1.16 ab40.16 ± 3.65 b22.61 ± 3.32 c
Scion Stems6.07 ± 0.28 b6.1 ± 0.2 b8.09 ± 0.35 a8.31 ± 0.8 a8.89 ± 0.9 a
Rootstock Stem5.87 ± 0.73 a5.61 ± 0.34 a6.22 ± 0.25 a6.93 ± 0.62 a6.93 ± 0.24 a
Roots585.08 ± 49 a593.35 ± 23.2 a539.95 ± 42.38 a498.15 ± 12.68 ab401.6 ± 25.19 b
Zn
(mg kg−1 d.w.)
Leaves29.58 ± 2.85 b36.91 ± 1.13 a29.35 ± 2.09 b28.92 ± 2.34 b16.93 ± 2.97 c
Scion Stems37.69 ± 3.99 a25.28 ± 0.87 b26.02 ± 0.67 b22.6 ± 1.56 bc17 ± 1.54 c
Rootstock Stem13.15 ± 2.29 a9.36 ± 0.23 a9.71 ± 0.58 a10.82 ± 1.39 a9.19 ± 0.54 a
Roots324.1 ± 26.91 a303.45 ± 17.05 ab257.25 ± 10.15 bc257.23 ± 18.19 bc209.75 ± 11.09 c
Cu
(mg kg−1 d.w.)
Leaves7.71 ± 0.99 b10.04 ± 0.17 a10 ± 0.22 a9.89 ± 0.74 a6.18 ± 0.13 b
Scion Stems7.67 ± 0.66 b8.48 ± 0.37 ab9.41 ± 0.14 a8.68 ± 0.5 ab5.94 ± 0.62 c
Rootstock Stem5.41 ± 0.23 a6.21 ± 0.2 a6.61 ± 0.44 a6.82 ± 0.62 a5.52 ± 0.5 a
Roots13.37 ± 0.4 b15.92 ± 0.51 a13.57 ± 0.52 b12.85 ± 0.4 b12.09 ± 0.46 b
B
(mg kg−1 d.w.)
Leaves103.72 ± 10.57 a88.52 ± 6.96 ab74.75 ± 7.91 bc60.8 ± 2.73 c67.49 ± 2.1 bc
Scion Stems19.02 ± 1.04 a15.64 ± 1.68 ab13.97 ± 0.6 b14.93 ± 1.61 b14.48 ± 1 b
Rootstock Stem16.1 ± 1 a14.05 ± 0.56 a15.78 ± 1.71 a15.2 ± 1.57 a13.71 ± 0.18 a
Roots14.51 ± 0.36 a15.84 ± 0.35 a16.6 ± 1.08 a16.04 ± 0.82 a15.45 ± 0.43 a
The values are means (±S.E.) of 5 replicates; different letters in the same row indicate statistically significant differences between K treatments (for the same plant part and SO rootstock), according to Duncan’s multiple range test, p ≤ 0.05.
Table 5. Effects of K level in the nutrient solution (0.00, 0.75, 1.50, 3.00, and 6.00 mM K) on K, N, Ca, Mg, P, Fe, Mn, Cu, B and Zn concentrations in different plant parts (leaves, scion stems, rootstock stem, roots) of lemon plants (cv. Adamopoulou) grafted onto VL (Volkamer lemon) rootstock.
ElementPlant PartK Concentration in the Nutrient Solution (mM)
0.000.751.503.006.00
N
(% d.w.)
Leaves2.93 ± 0.15 a2.89 ± 0.1 a3.02 ± 0.11 a3.02 ± 0.11 a2.86 ± 0.17 a
Scion Stems1.1 ± 0.06 b1.32 ± 0.07 a0.91 ± 0.05 c1.03 ± 0.05 bc0.85 ± 0.07 c
Rootstock Stem0.75 ± 0.05 a0.83 ± 0.07 a0.65 ± 0.03 a0.76 ± 0.03 a0.65 ± 0.03 a
Roots2.35 ± 0.11 ab2.23 ± 0.07 ab2.07 ± 0.12 b2.49 ± 0.04 a2.08 ± 0.09 b
Ca
(% d.w.)
Leaves4.6 ± 0.3 a3.6 ± 0.17 b3.06 ± 0.12 c2.18 ± 0.14 d1.27 ± 0.06 e
Scion Stems1.19 ± 0.07 ab1.37 ± 0.12 a1.21 ± 0.08 ab0.97 ± 0.1 b0.65 ± 0.03 c
Rootstock Stem0.7 ± 0.04 a0.68 ± 0.04 a0.65 ± 0.03 a0.63 ± 0.02 a0.51 ± 0.02 b
Roots0.96 ± 0.04 b1.02 ± 0.16 b0.82 ± 0.05 b1.52 ± 0.13 a1.16 ± 0.12 b
Mg
(% d.w.)
Leaves0.33 ± 0.01 a0.3 ± 0.02 a0.26 ± 0.01 b0.27 ± 0.01 b0.2 ± 0 c
Scion Stems0.14 ± 0.01 a0.15 ± 0.01 a0.13 ± 0.01 ab0.12 ± 0.01 b0.07 ± 0 c
Rootstock Stem0.07 ± 0 a0.07 ± 0 ab0.06 ± 0 bc0.06 ± 0 bc0.05 ± 0 c
Roots0.26 ± 0.03 a0.27 ± 0.01 b0.22 ± 0.01 b0.16 ± 0 c0.11 ± 0 c
P
(% d.w.)
Leaves0.71 ± 0.02 a0.7 ± 0.03 a0.67 ± 0.02 ab0.61 ± 0.01 bc0.58 ± 0.01 c
Scion Stems0.72 ± 0.04 a0.72 ± 0.03 a0.72 ± 0.05 a0.63 ± 0.01 ab0.56 ± 0.02 b
Rootstock Stem0.78 ± 0.03 a0.76 ± 0.04 a0.71 ± 0.04 ab0.63 ± 0.03 b0.47 ± 0.05 c
Roots1.43 ± 0.08 b1.54 ± 0.15 b1.38 ± 0.02 b2.02 ± 0.07 a1.41 ± 0.1 b
Fe
(mg kg−1 d.w.)
Leaves71.01 ± 14.24 a64.9 ± 3.13 a73.45 ± 4.71 a82.63 ± 3.8 a85.39 ± 4.6 a
Scion Stems22.12 ± 2.27 a24.97 ± 0.84 a22.94 ± 2.44 a24.44 ± 1.97 a20.1 ± 0.42 a
Rootstock Stem18.41 ± 1.49 a18.65 ± 1.23 a16.4 ± 2.65 a16.81 ± 0.85 a14.98 ± 0.25 a
Roots431.88 ± 23.1 ab524.25 ± 46.53 a489.88 ± 27.42 a475 ± 36.05 a339.4 ± 15.43 b
Mn
(mg kg−1 d.w.)
Leaves68.7 ± 6.02 a75.42 ± 5.31 a68.71 ± 5.35 a64.49 ± 2.63 a43.07 ± 2.5 b
Scion Stems5.88 ± 0.37 c7.62 ± 0.44 b8.2 ± 0.86 b10.18 ± 0.33 a10.59 ± 0.57 a
Rootstock Stem4.74 ± 0.1 a5.25 ± 0.27 a6.35 ± 1.13 a6.7 ± 0.27 a7.06 ± 0.42 a
Roots480.1 ± 36.33 a525.9 ± 57.71 a490.13 ± 58.66 a551.23 ± 35.95 a419.33 ± 31.24 a
Zn
(mg kg−1 d.w.)
Leaves31.98 ± 1.86 ab34.17 ± 2.46 a34.41 ± 0.23 a26.83 ± 1.95 b19.92 ± 1.47 c
Scion Stems27.38 ± 3.07 a31.01 ± 4.04 a24.71 ± 3.04 a22.17 ± 1.11 a19.58 ± 1.11 a
Rootstock Stem18.89 ± 1.18 a17.74 ± 1.12 a15.35 ± 2.65 a16.04 ± 0.84 a19.37 ± 2.01 a
Roots247.1 ± 11.46 a258.83 ± 31.12 a191.1 ± 19.58 a223.28 ± 20.3 a186.13 ± 13.11 a
Cu
(mg kg−1 d.w.)
Leaves4.69 ± 0.3 c6.19 ± 0.58 b7.86 ± 0.21 a7.13 ± 0.36 ab6.64 ± 0.17 b
Scion Stems5.78 ± 0.28 ab6.11 ± 0.35 ab6.57 ± 0.5 a5.41 ± 0.28 b4.36 ± 0.05 c
Rootstock Stem4.14 ± 0.16 ab4.72 ± 0.32 a3.91 ± 0.25 bc3.8 ± 0.09 bc3.3 ± 0.11 c
Roots15.09 ± 0.73 ab16.27 ± 1.33 a11.86 ± 1.35 bc12.57 ± 1.08 bc10.39 ± 0.39 c
B
(mg kg−1 d.w.)
Leaves107.39 ± 6.75 a101.07 ± 6.3 ab84.13 ± 5.34 bc74.62 ± 4.15 c70.52 ± 7.59 c
Scion Stems9.88 ± 0.67 a9.58 ± 1.39 a7.67 ± 0.29 a8.47 ± 0.8 a8.29 ± 0.67 a
Rootstock Stem14.33 ± 0.47 a14.15 ± 1.18 a11.42 ± 0.39 a12.62 ± 0.66 a12.42 ± 0.92 a
Roots12.33 ± 0.12 b13.68 ± 0.91 b13.32 ± 0.48 b16.3 ± 1.04 a14.02 ± 0.97 ab
The values are means (±S.E.) of 5 replicates for each rootstock; different letters in the same row indicate statistically significant differences between K treatments (for the same plant part and VL rootstock), according to Duncan’s multiple range test, p ≤ 0.05.
Table 6. Linear correlation coefficients (r) between K concentration (mM) in the nutrient solution and the concentrations of all determined elements in the individual parts (leaves, scion stems, rootstock stem, and roots) of “Adamopoulou” lemon plants grafted onto SO (sour orange) and VL (Volkamer lemon) rootstocks.
RootstockVL (Volkamer Lemon) SO (Sour Orange)
Plant Part Roots Rootstock
Stems
Scion Stems Leaves RootsRootstock
Stems
Scion Stems Leaves
Ν (% d.w.) −0.213 n.s. −0.357 n.s. −0.567 ** −0.082 n.s.−0.489 ** 0.382 n.s −0.764 *** −0.385 n.s
P (% d.w.) 0.083 n.s. −0.871 *** −0.712 *** −0.786 *** −0.336 n.s −0.483 * −0.810 *** −0.733 ***
Κ (% d.w.) 0.846 *** 0.685 ** 0.965 *** 0.944 *** 0.943 *** 0.910 *** 0.951 *** 0.901 ***
Ca (% d.w.) 0.368 n.s. −0.754 *** −0.805 *** −0.925 *** 0.622 ** −0.187 n.s −0.795 *** −0.874 ***
Mg (% d.w.) −0.891 *** −0.727 *** −0.867 *** −0.885 *** −0.877 *** −0.502 * −0.776 *** −0.893 ***
B (mg kg−1 d.w.) 0.326 n.s. −0.324 n.s. −0.275 n.s. −0.714 *** 0.078 n.s −0.268 n.s −0.376 n.s −0.599 **
Mn (mg kg−1 d.w.) −0.261 n.s. 0.586 ** 0.791 *** −0.755 *** −0.762 *** 0.465 * 0.651 ** −0.922 ***
Zn (mg kg−1 d.w.) −0.459 * 0.115 n.s. −0.557 ** −0.813 *** −0.744 *** −0.299 n.s −0.755 *** −0.726 ***
Fe (mg kg−1 d.w.) −0.558 * −0.411 n.s. −0.285 n.s. 0.446 * −0.449 * −0.332 n.s 0.289 n.s 0.537 *
Cu (mg kg−1 d.w.) −0.634 ** −0.665 ** −0.675 ** 0.347 n.s. −0.57 ** −0.064 n.s −0.531 ** −0.475 *
n = 25, for each rootstock; * p ≤ 0.05; ** p ≤ 0.010; *** p ≤ 0.001; n.s., non-significant.
Table 7. Linear correlation coefficients (r) between K concentration (mM) in the nutrient solution and the total quantity of nutrient elements per plant (total plant content), as well as their distribution (% of the total plant content of each mineral element) in the individual parts (leaves, scion stems, rootstock stem, and roots) of “Adamopoulou” lemon plants grafted onto SO (sour orange) and VL (Volkamer lemon).
Rootstock VL (Volkamer Lemon) SO (Sour Orange)
Plant Part Total Plant Content Roots Rootstock
Stems
Scion Stems Leaves Total Plant Content Roots Rootstock
Stems
Scion Stems Leaves
Ν −0.609 ** −0.091 n.s. −0.021 n.s. −0.076 n.s. 0.118 n.s. −0.439 n.s. 0.101 n.s. 0.680 ** −0.454 * −0.544 *
P −0.764 *** 0.506 * −0.606 ** 0.273 n.s. −0.088 n.s. −0.526 * 0.483 * 0.171 n.s. −0.318 n.s. −0.614 **
Κ 0.820 *** −0.509 * −0.657 ** 0.727 *** 0.300 n.s. 0.788 *** 0.095 n.s. −0.378 n.s. 0.681 ** −0.102 n.s.
Ca −0.903 *** 0.875 *** 0.744 *** 0.311 n.s. −0.882 *** −0.692 ** 0.879 *** 0.814 *** 0.012 n.s. −0.905 ***
Mg −0.829 *** −0.763 *** 0.581 ** 0.207 n.s. 0.656 ** −0.800 *** −0.344 n.s. 0.692 ** 0.422 n.s. −0.502 *
B −0.709 *** 0.736 *** 0.450 n.s. 0.520 ** −0.708 *** −0.713 *** 0.683 ** −0.646 ** 0.520 * −0.803 ***
Mn −0.653 ** 0.155 n.s. 0.805 *** 0.808 *** −0.595 ** −0.576 ** 0.331 n.s. 0.696 ** 0.877 *** −0.684 **
Zn −0.711 *** −0.171 n.s. 0.613 ** 0.120 n.s. −0.391 n.s. −0.650 ** 0.253 n.s. 0.277 n.s. −0.328 n.s. −0.451 *
Fe −0.582 ** −0.585 ** 0.110 n.s. 0.415 n.s. 0.561 * −0.297 n.s. −0.498 ** 0.083 n.s. 0.546 ** 0.510 *
Cu −0.603 * −0.510 * −0.082 n.s. 0.092 n.s. 0.571 ** −0.369 n.s. 0.097 n.s. 0.598 ** −0.138 n.s. −0.633 **
n = 25, for each rootstock; * p ≤ 0.05; ** p ≤ 0.010; *** p ≤ 0.001; n.s., non-significant.
Disclaimer/Publisher’s Note: The statements, opinions and data contained in all publications are solely those of the individual author(s) and contributor(s) and not of MDPI and/or the editor(s). MDPI and/or the editor(s) disclaim responsibility for any injury to people or property resulting from any ideas, methods, instructions or products referred to in the content.

