
Understanding the Visual Relationship between Function and Facade in Historic Buildings Using Deep Learning—A Case Study of the Chinese Eastern Railway

 ,
,
Abstract
:1. Introduction
2. Materials and Methods
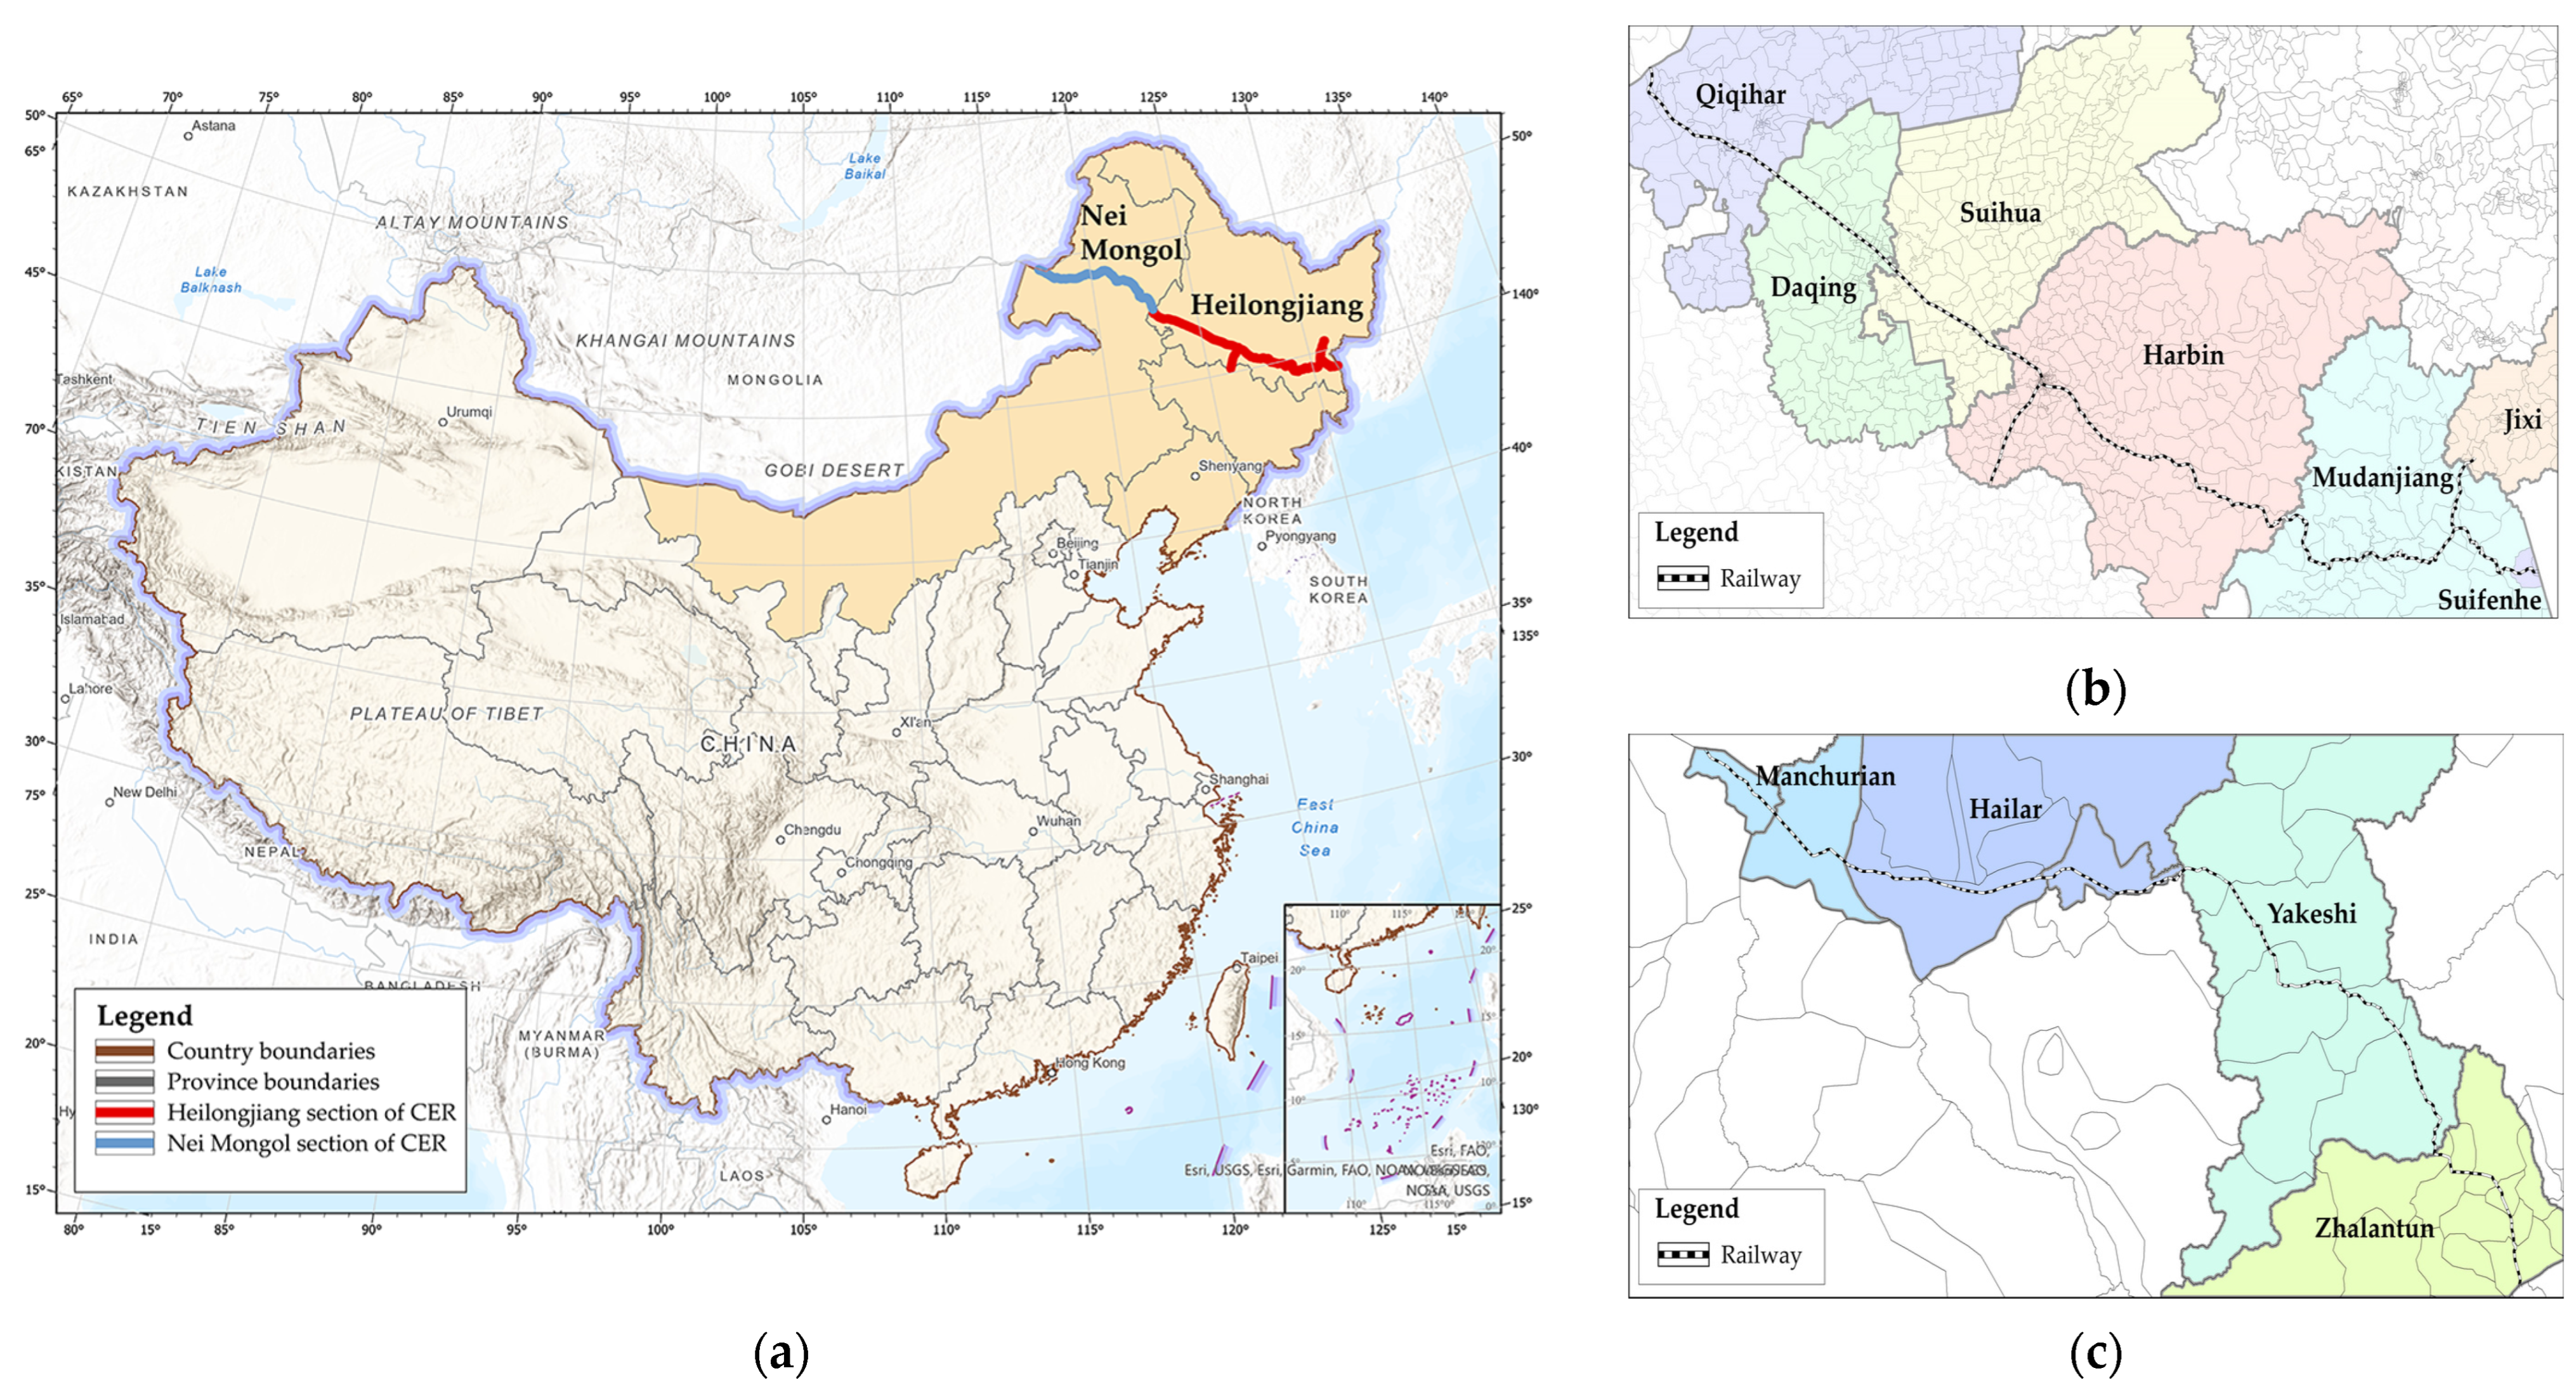
2.1. Study Area
2.2. Data Sources
2.2.1. Building Function Data
2.2.2. Building Facade Images
2.3. Research Methods
2.3.1. Dataset Building
2.3.2. Image Classification with Deep Learning Techniques
2.3.3. Metrics for Model Evaluation
2.3.4. Overall Feature and Prototype Extraction
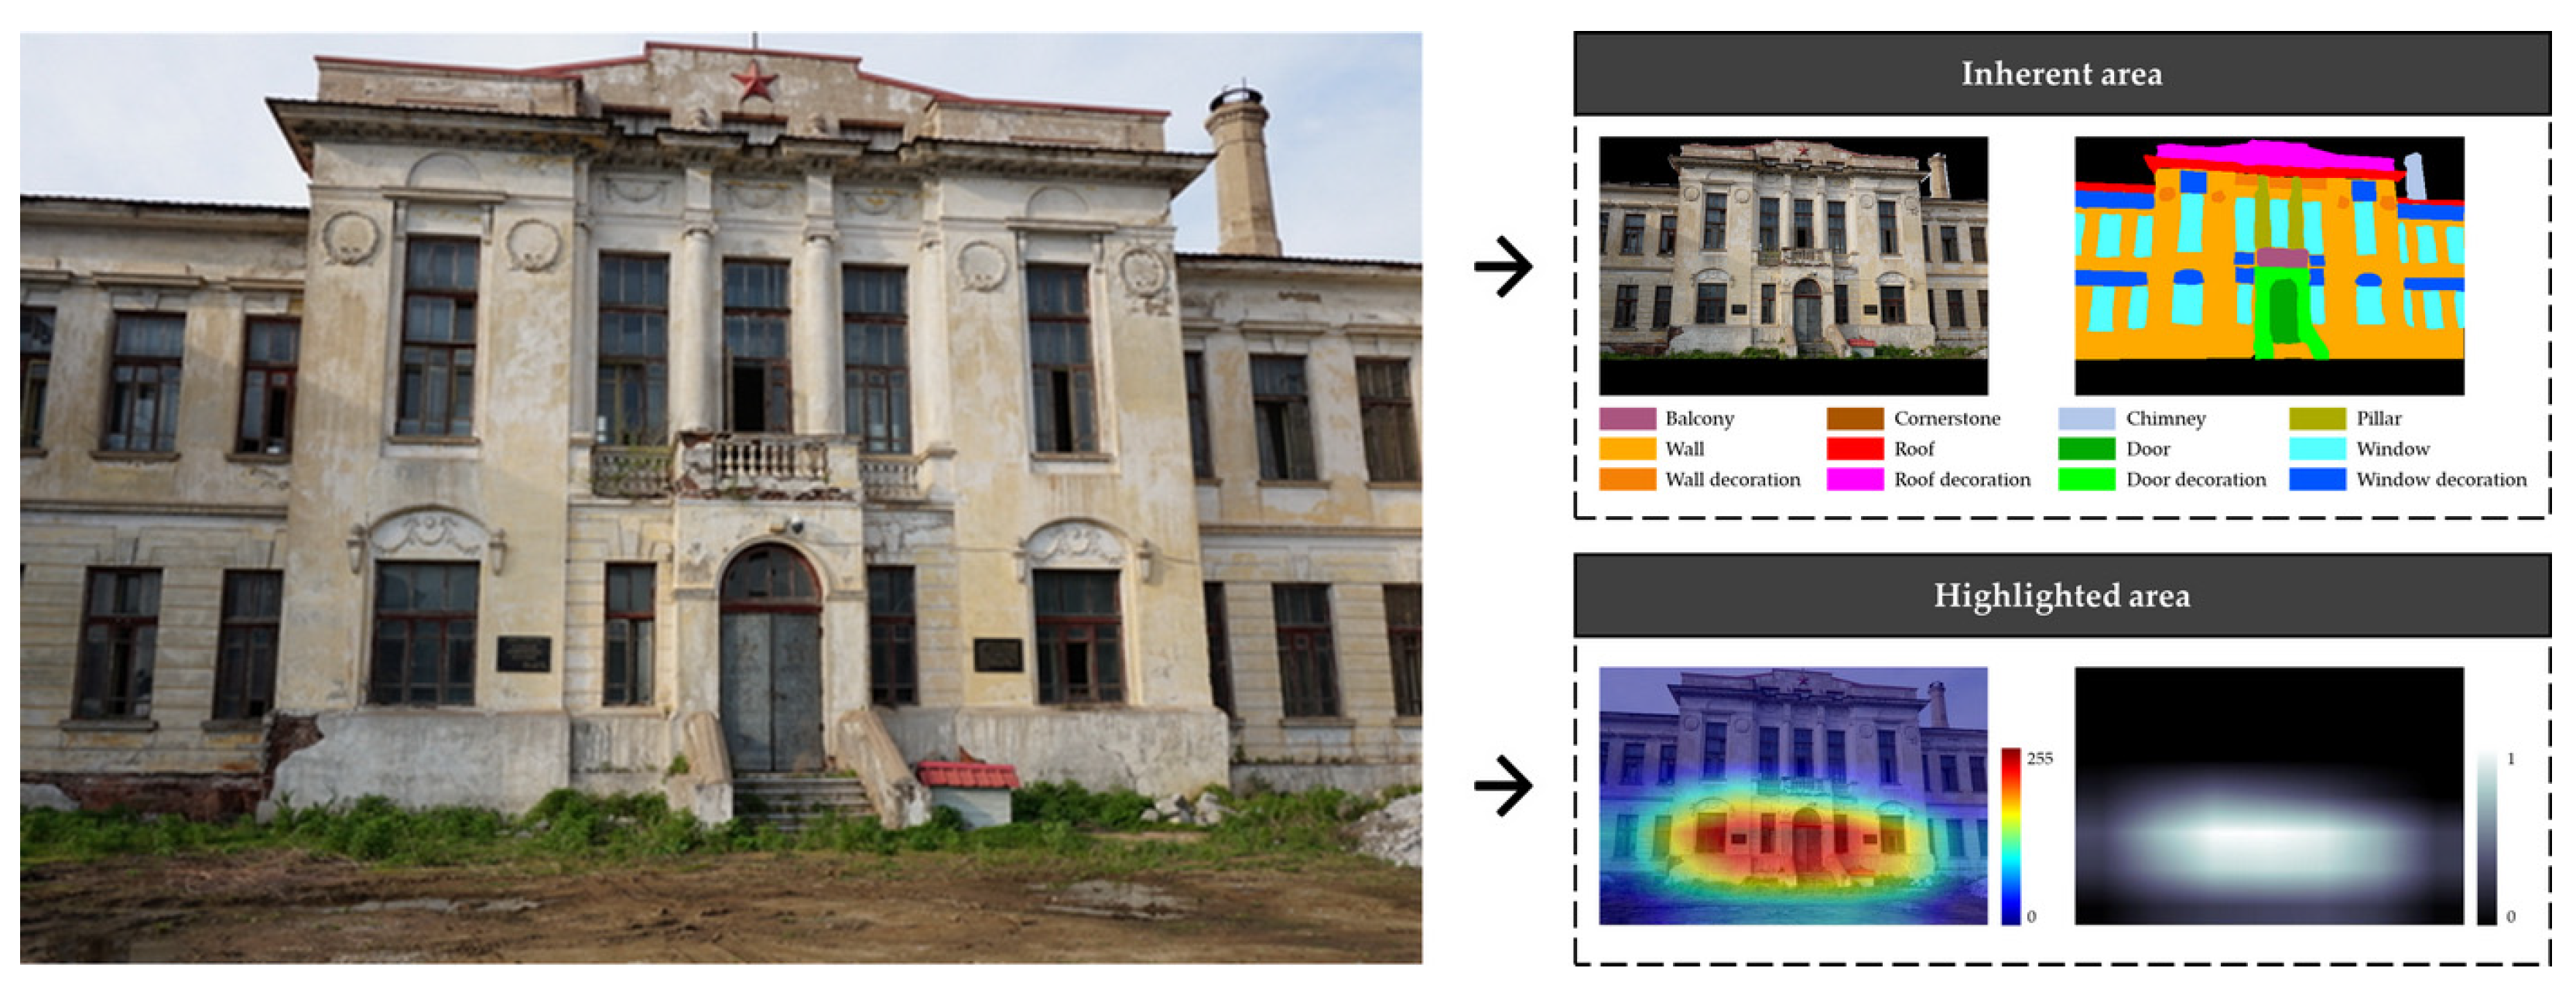
2.3.5. Facade Element Characteristic Areas
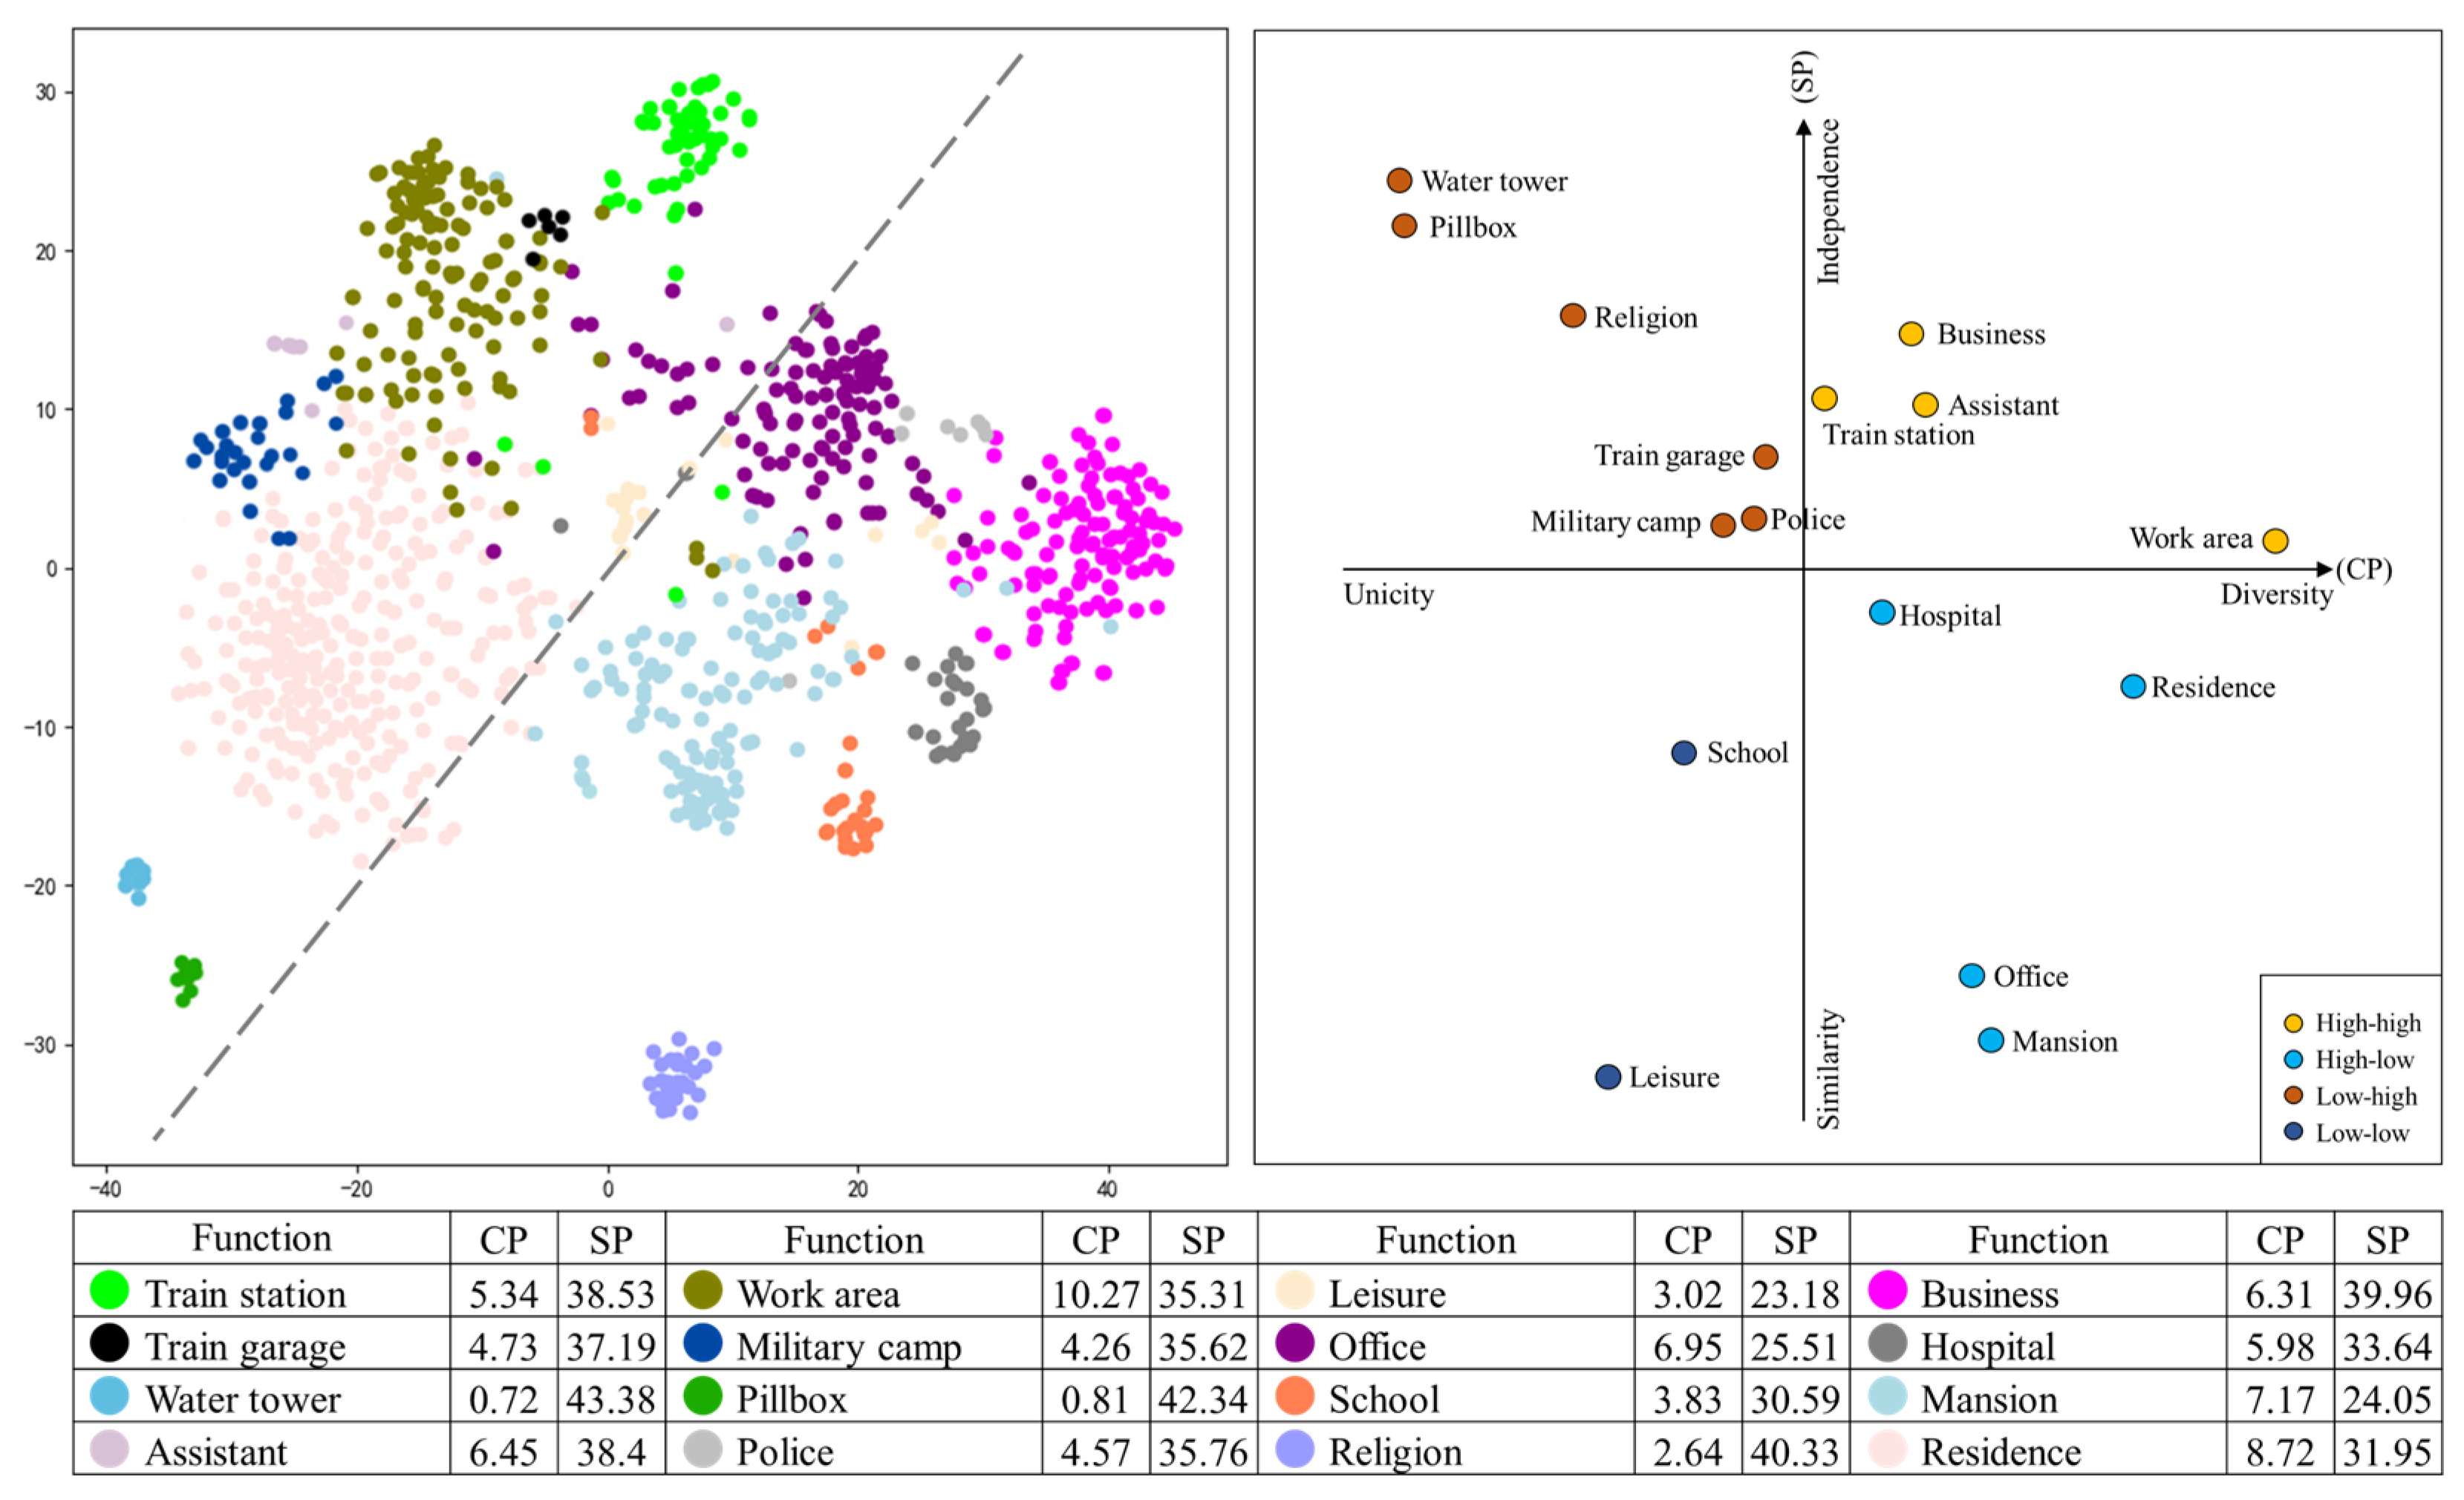
2.3.6. Metrics for Differential Expression
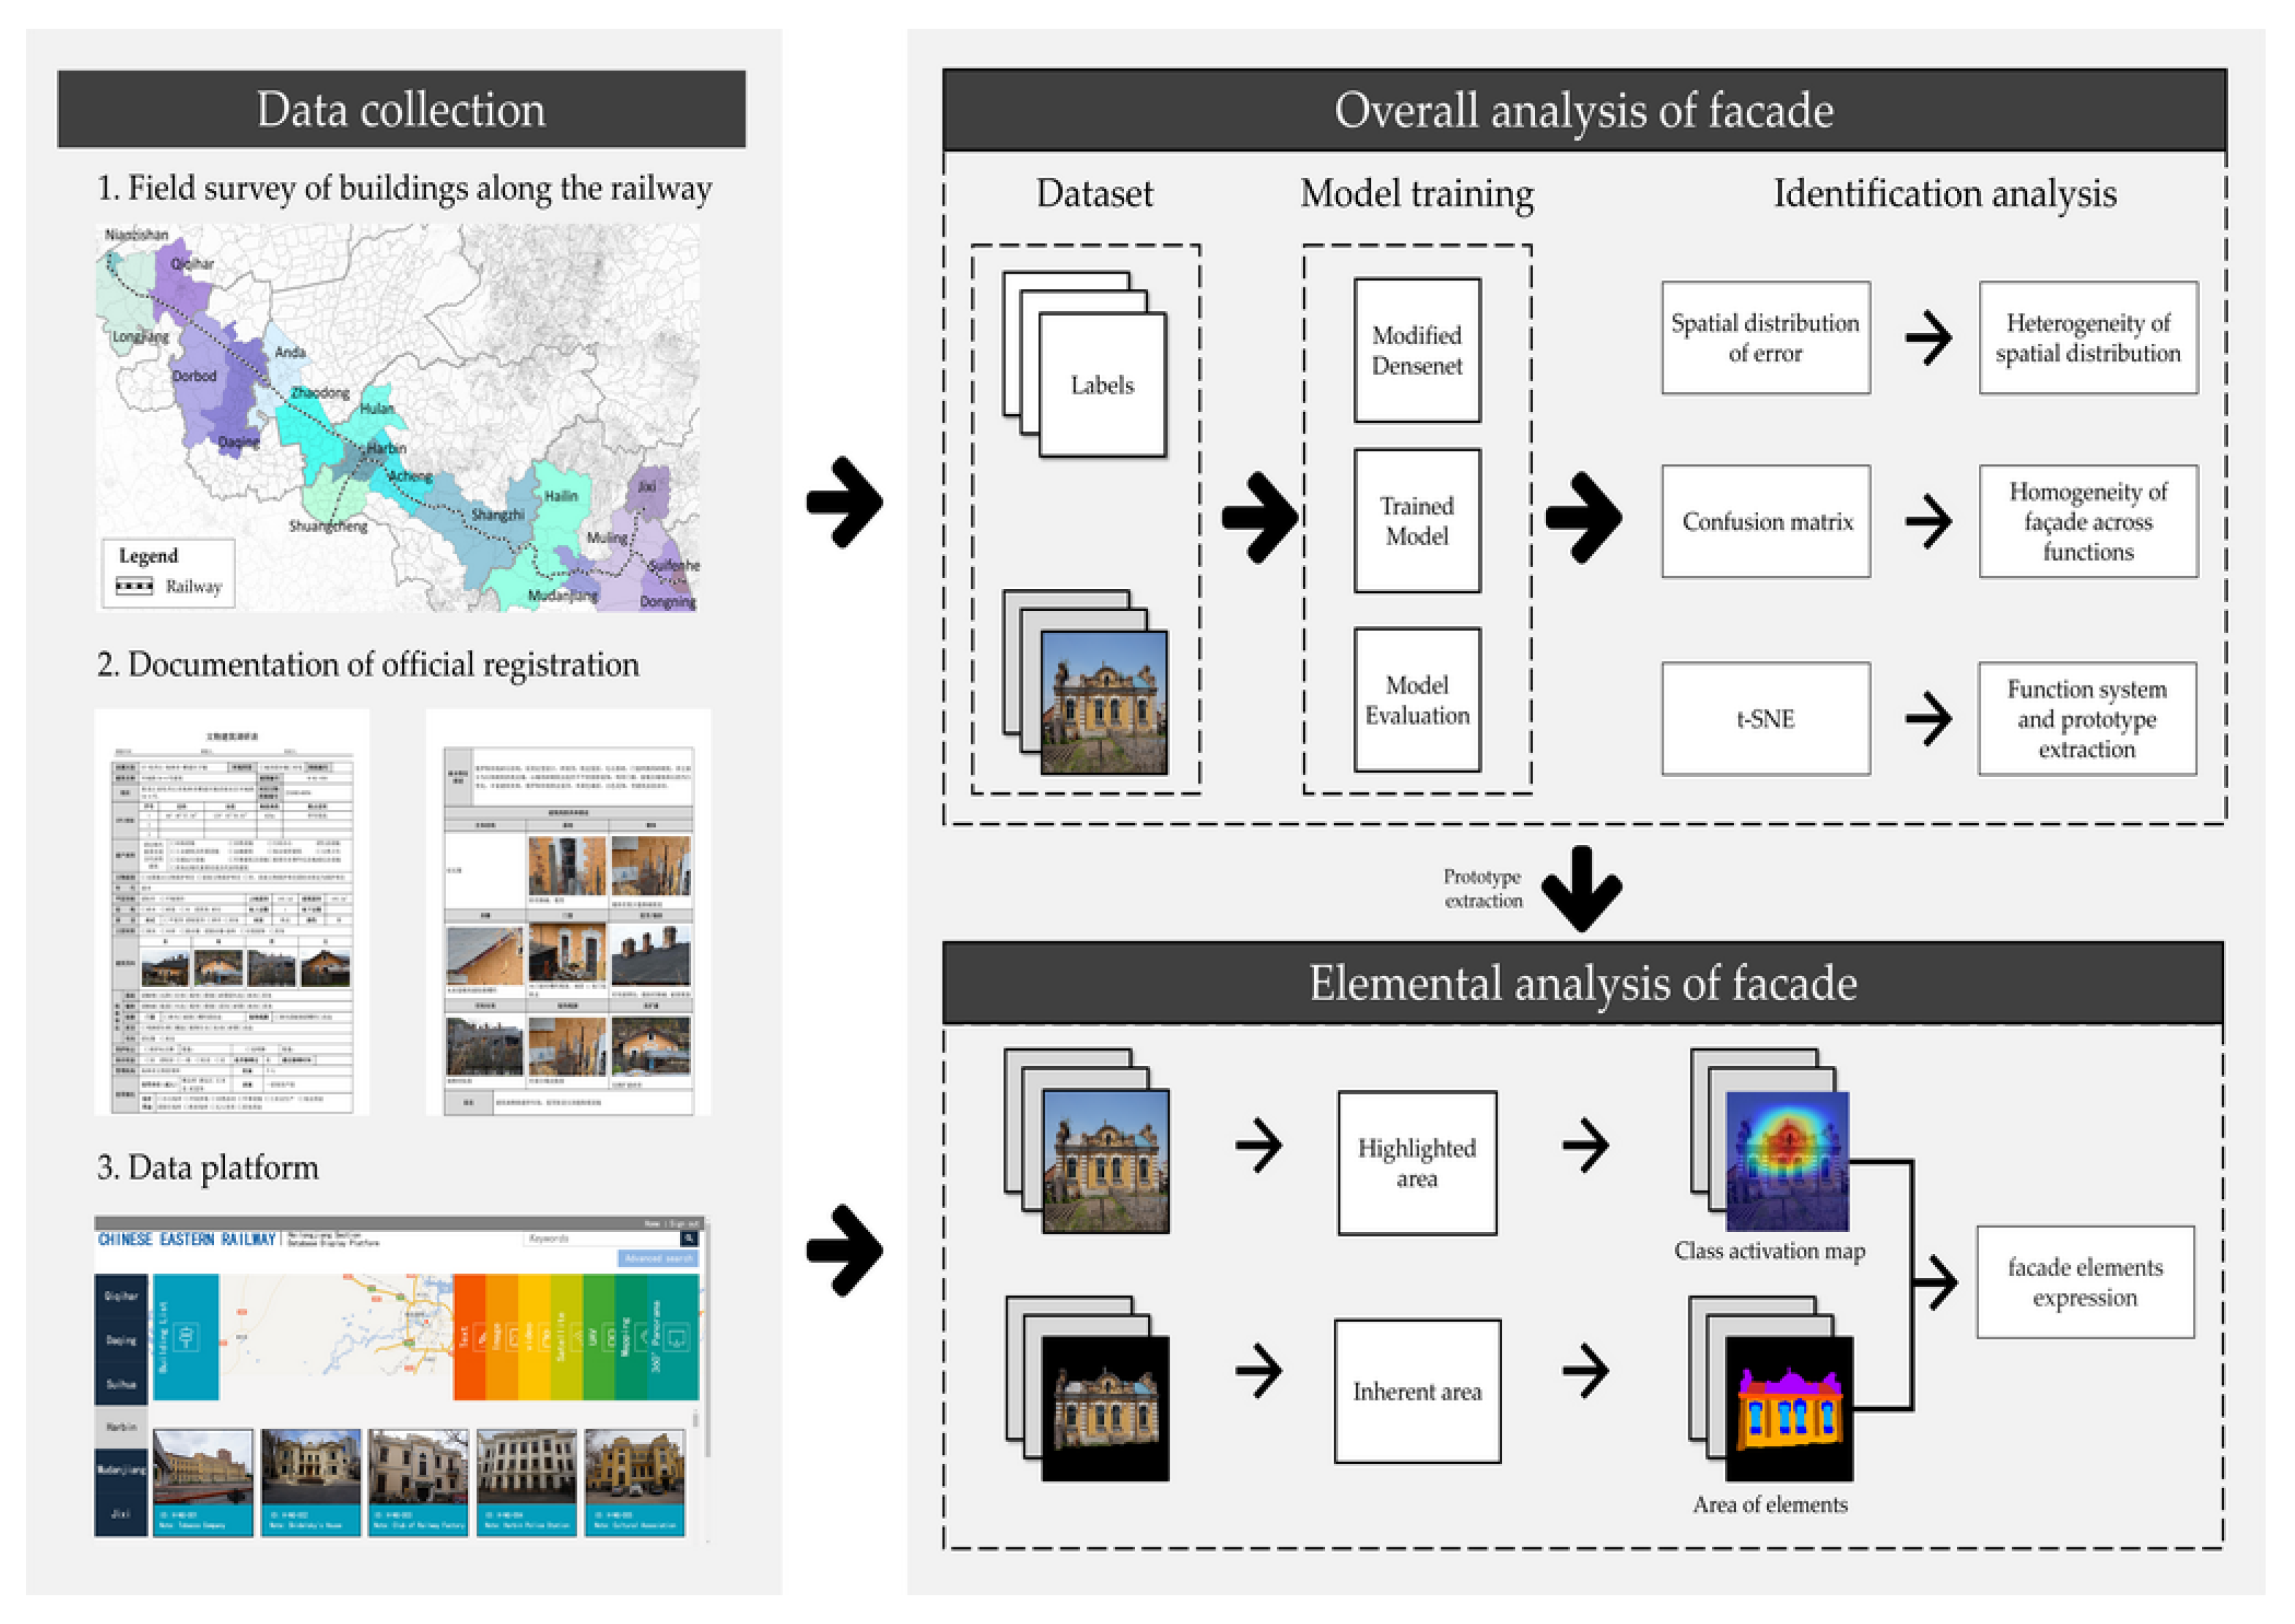
2.4. Research Framework
3. Results
3.1. Model Performance
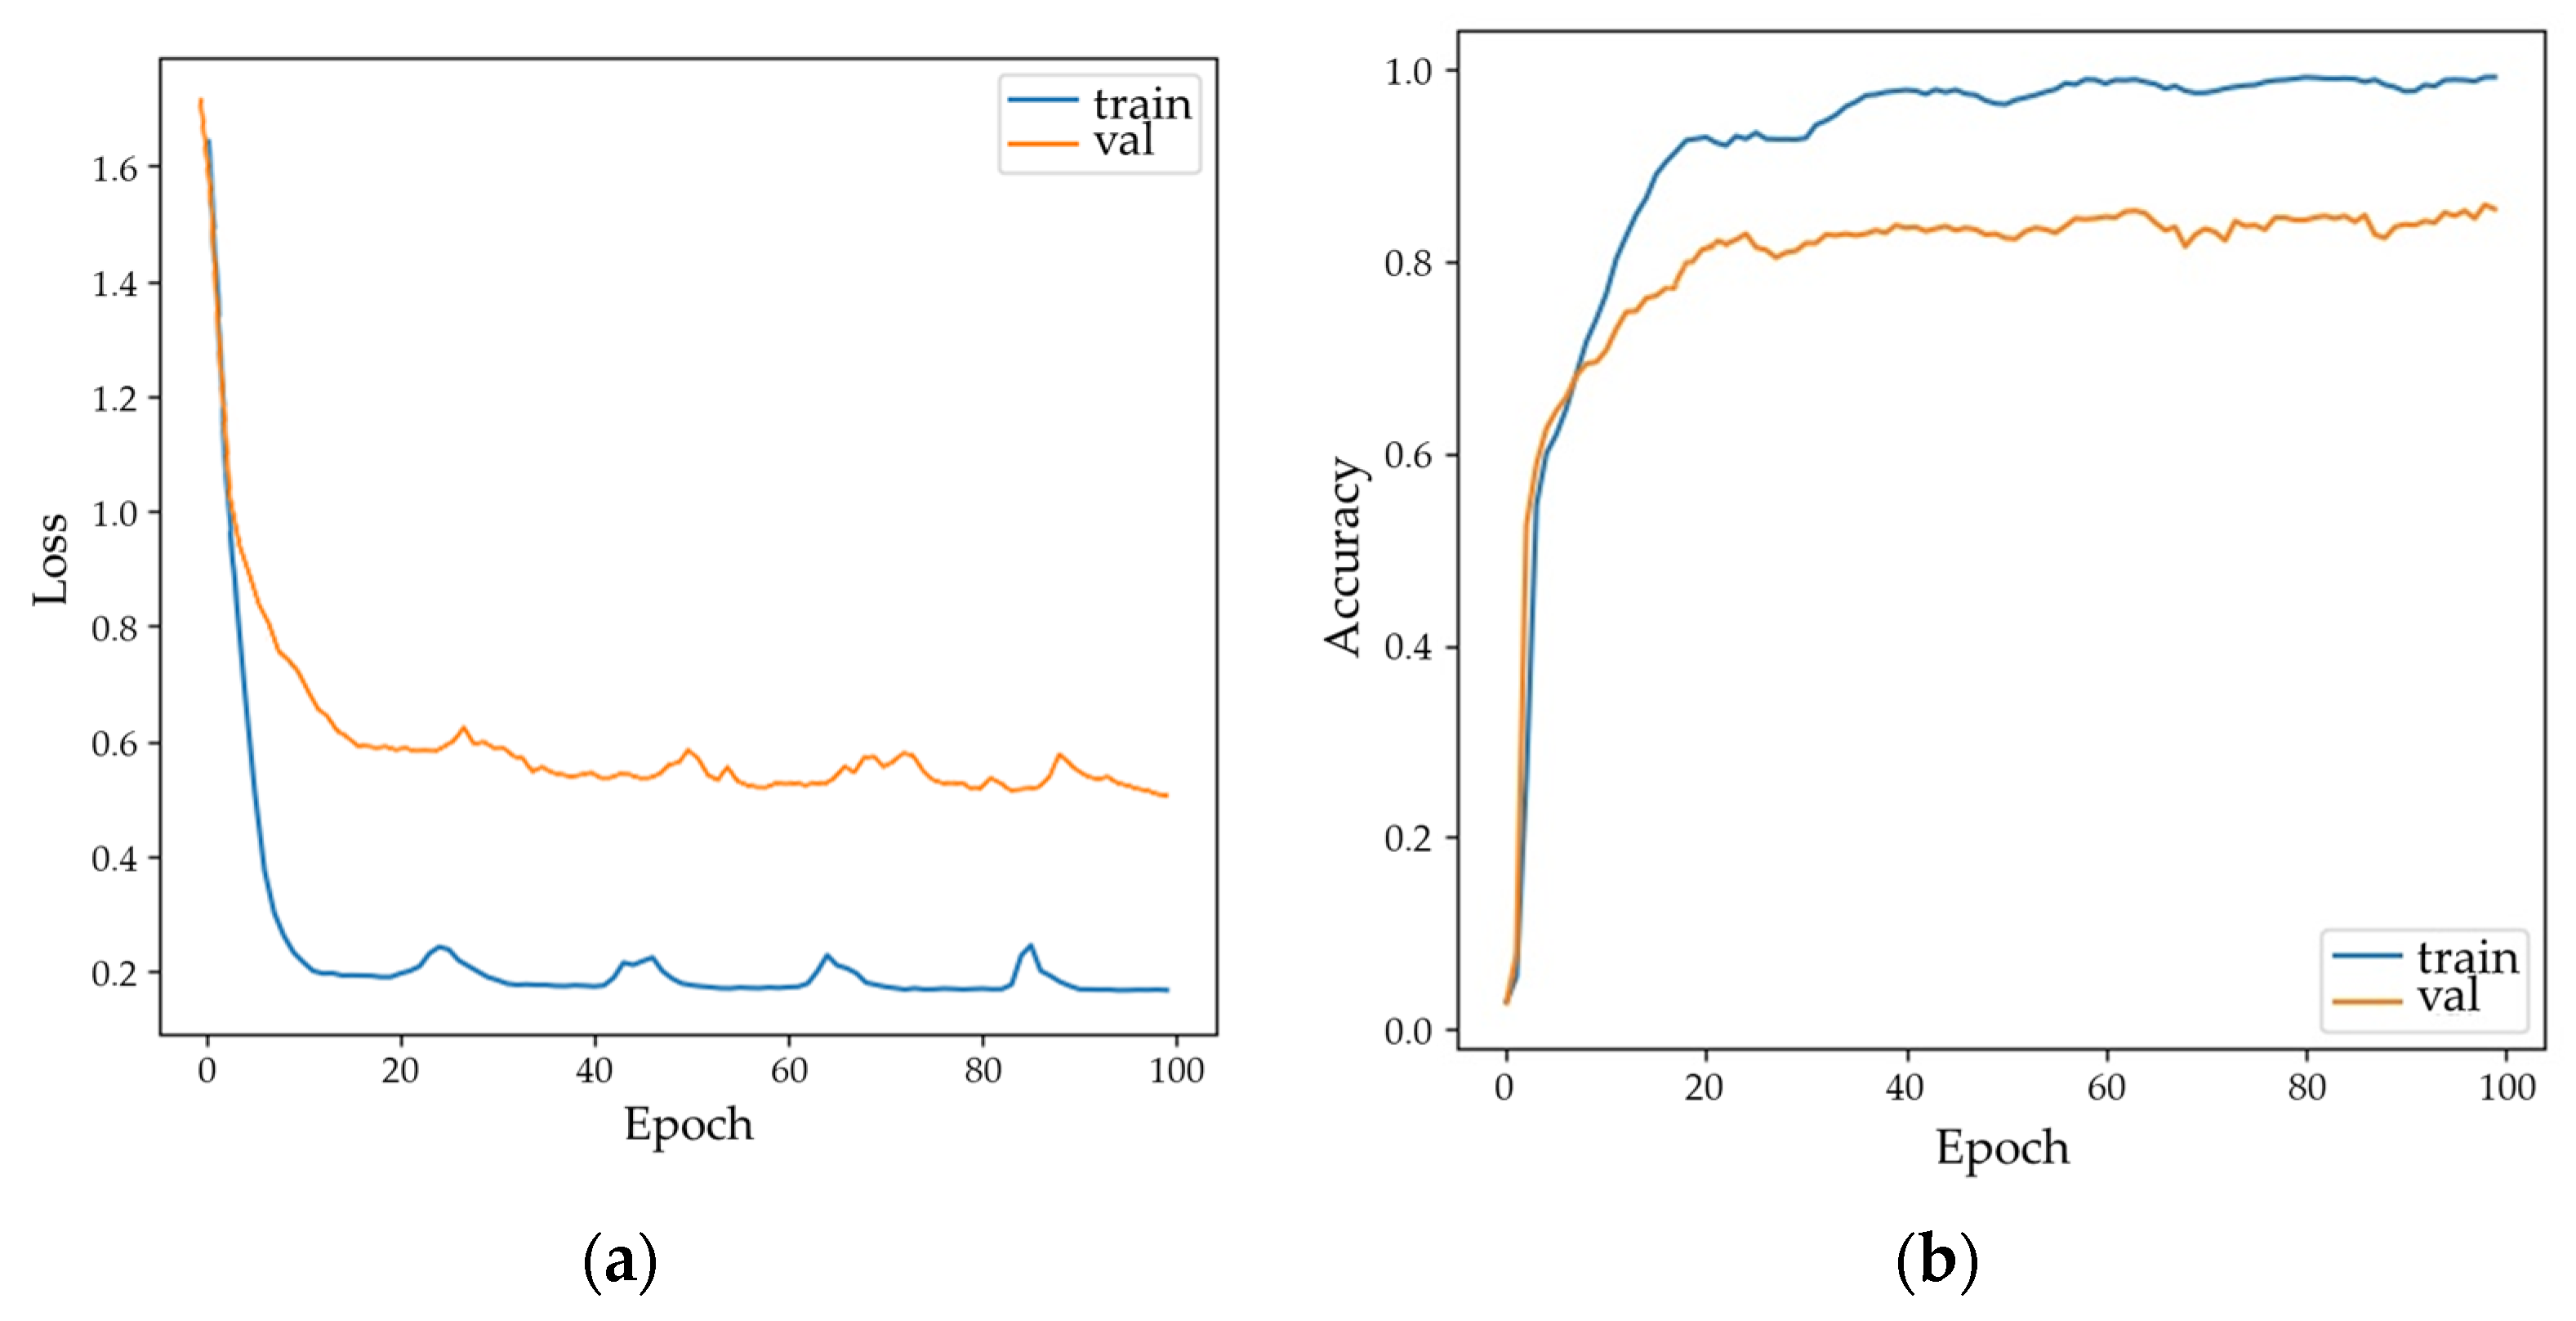
3.1.1. Experimental Procedure
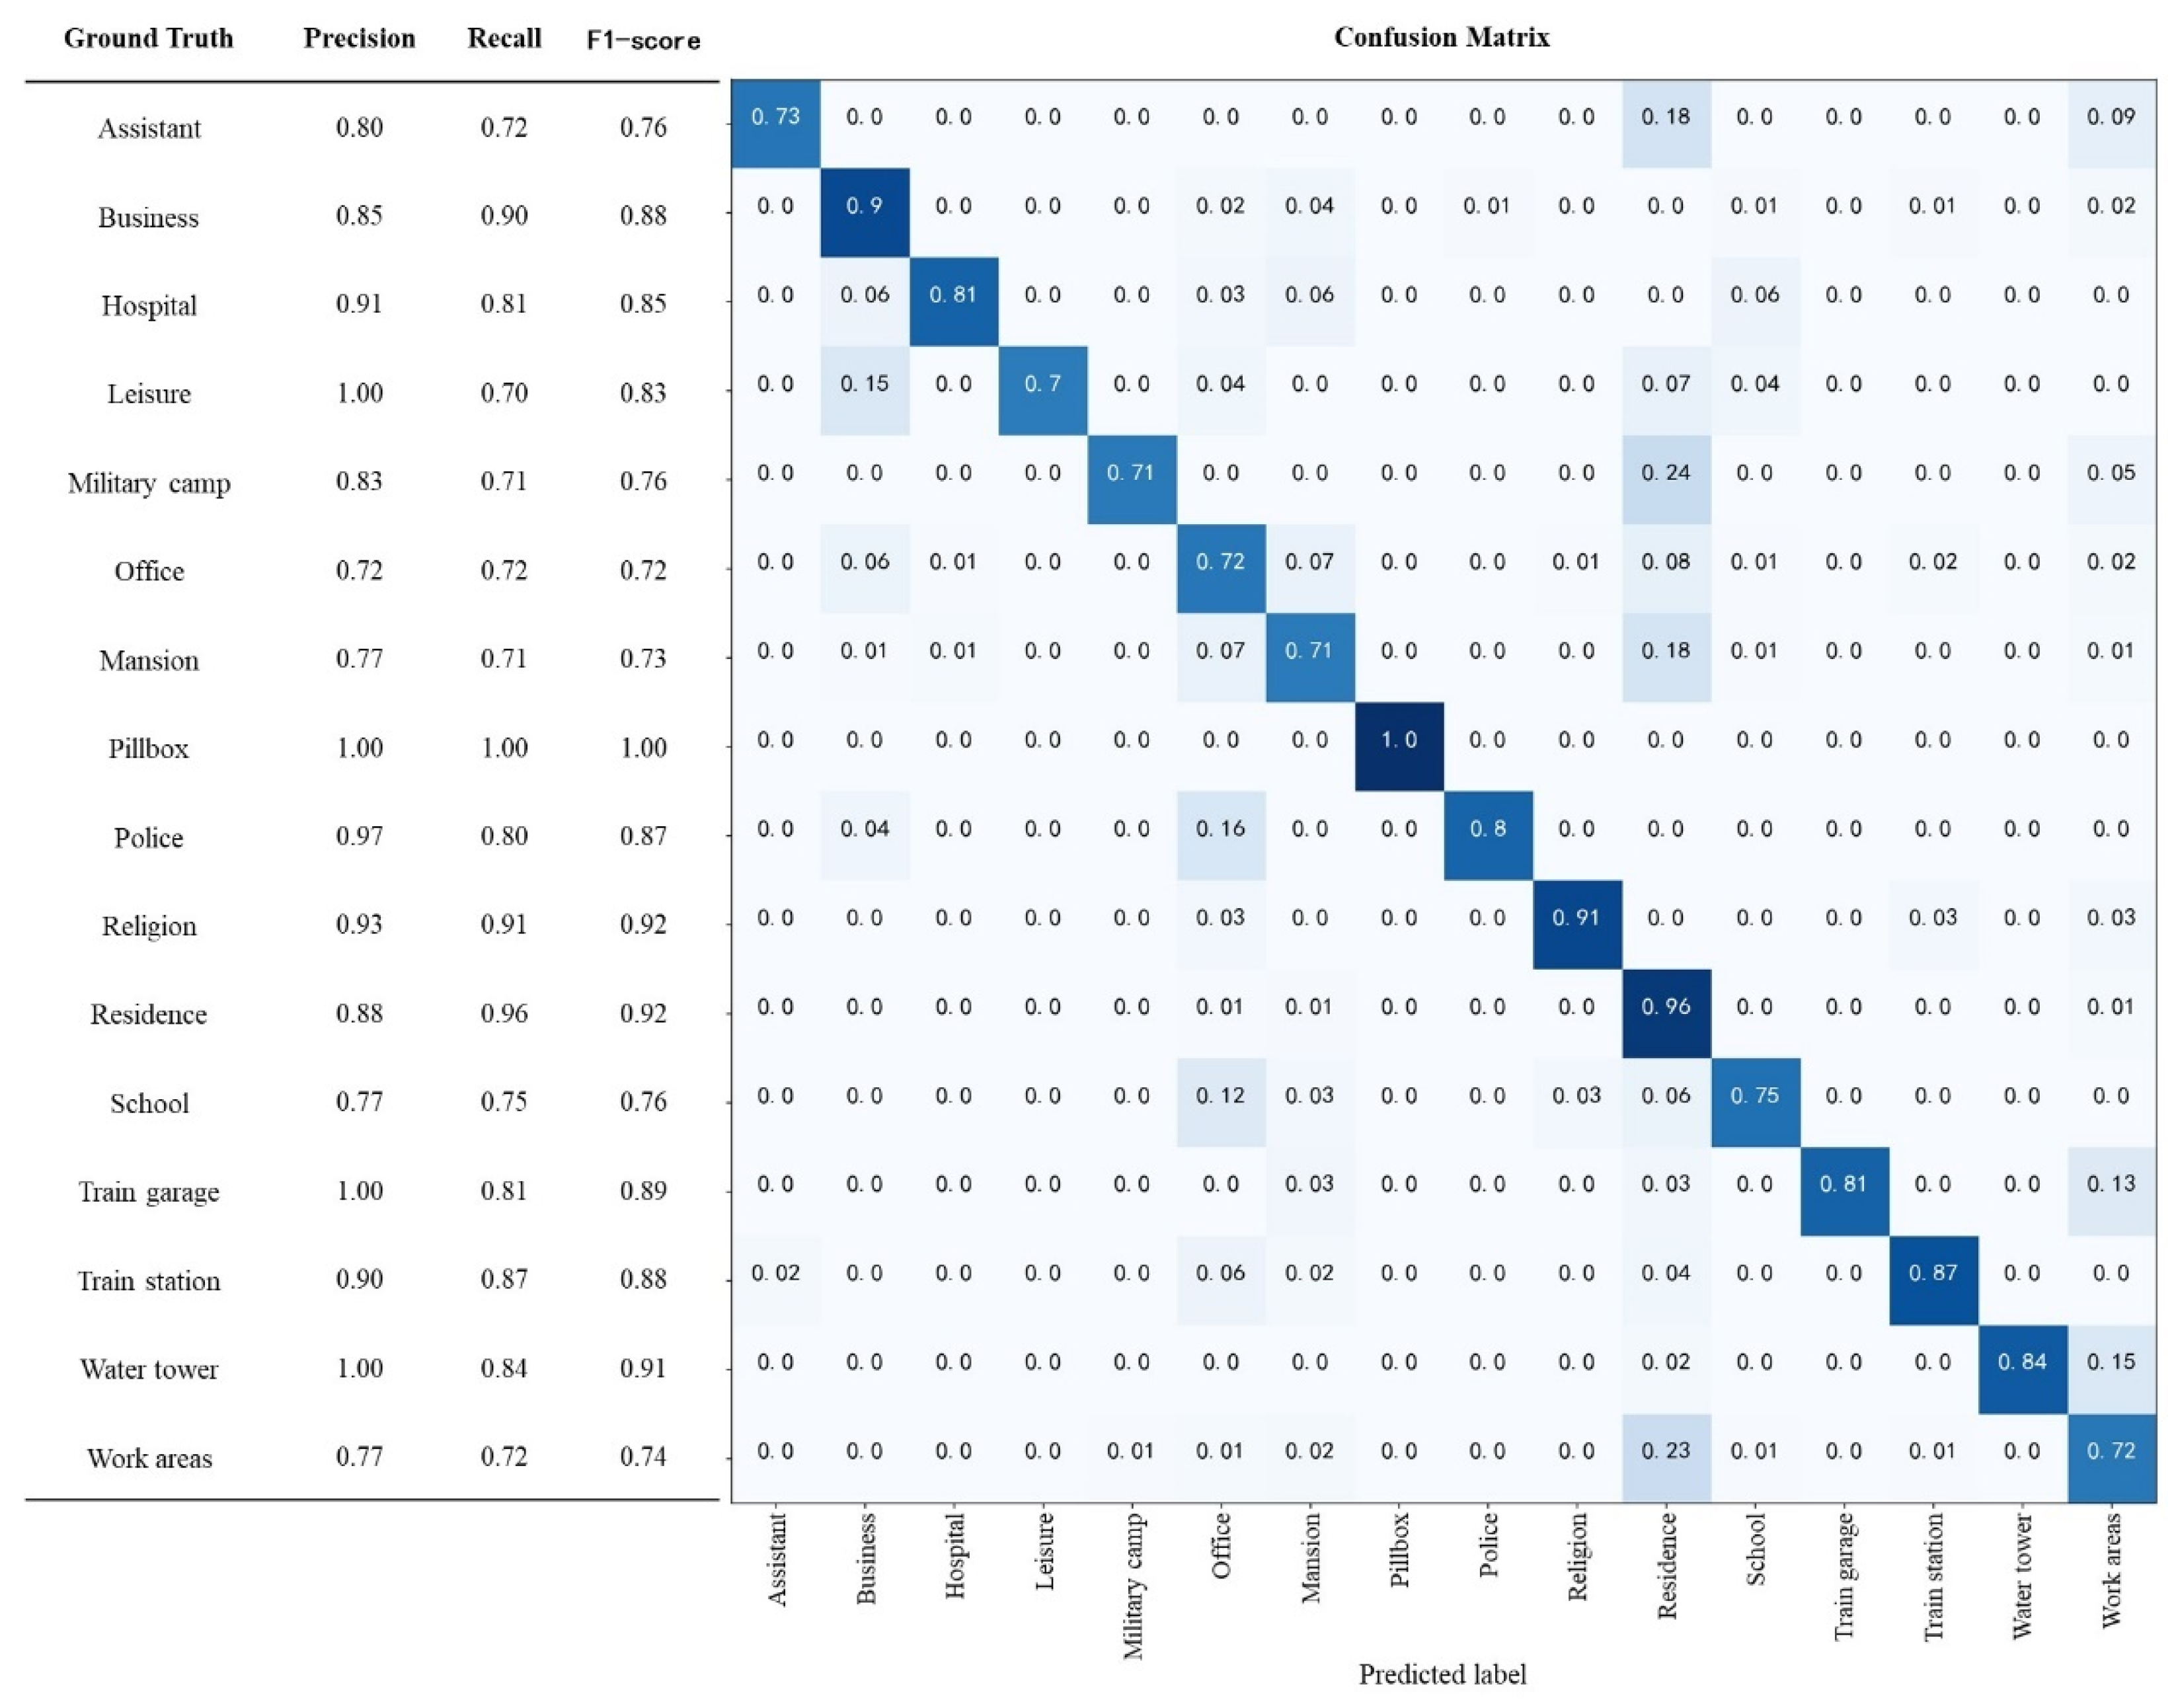
3.1.2. Classification Accuracy by Class
3.2. Overall Differences in Facades among Functions
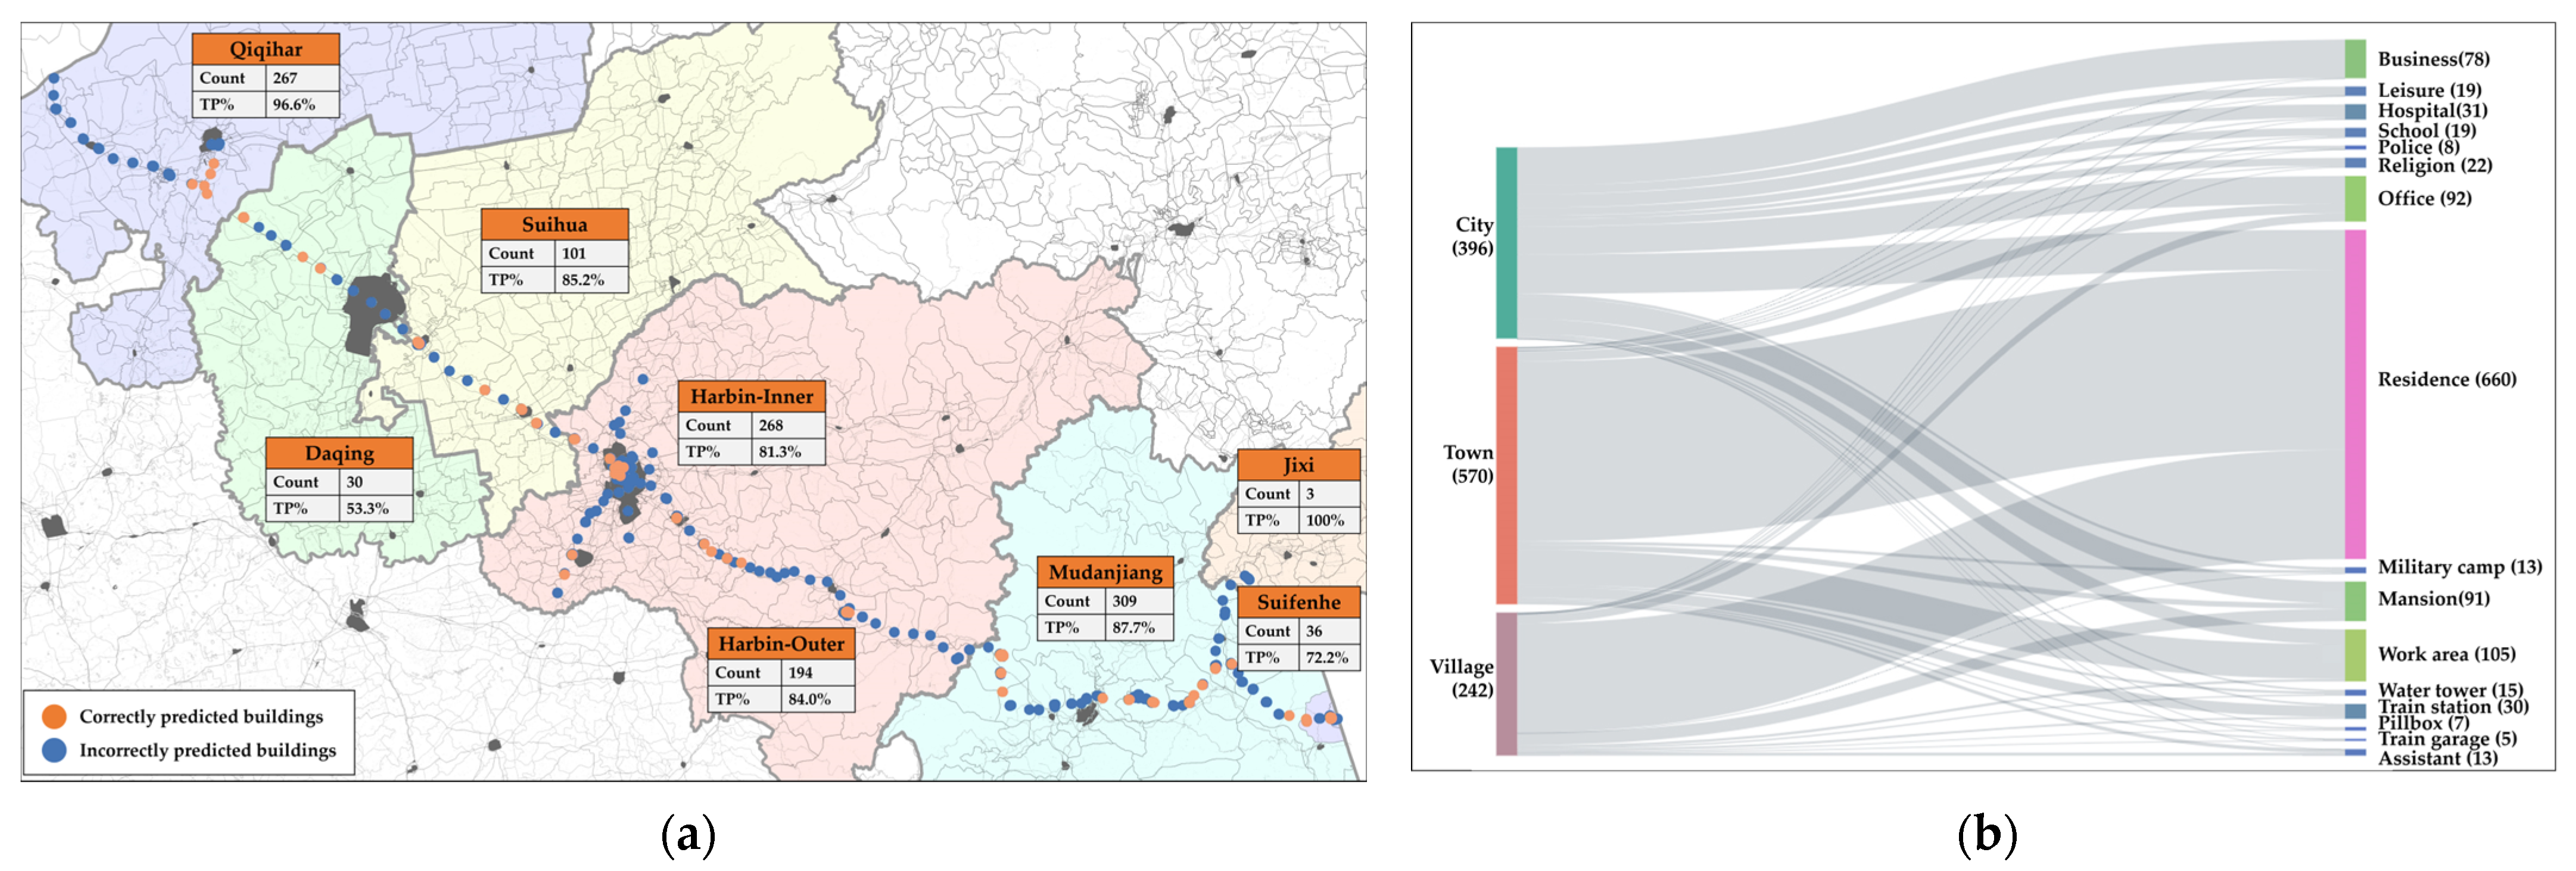
3.2.1. Spatial Distribution
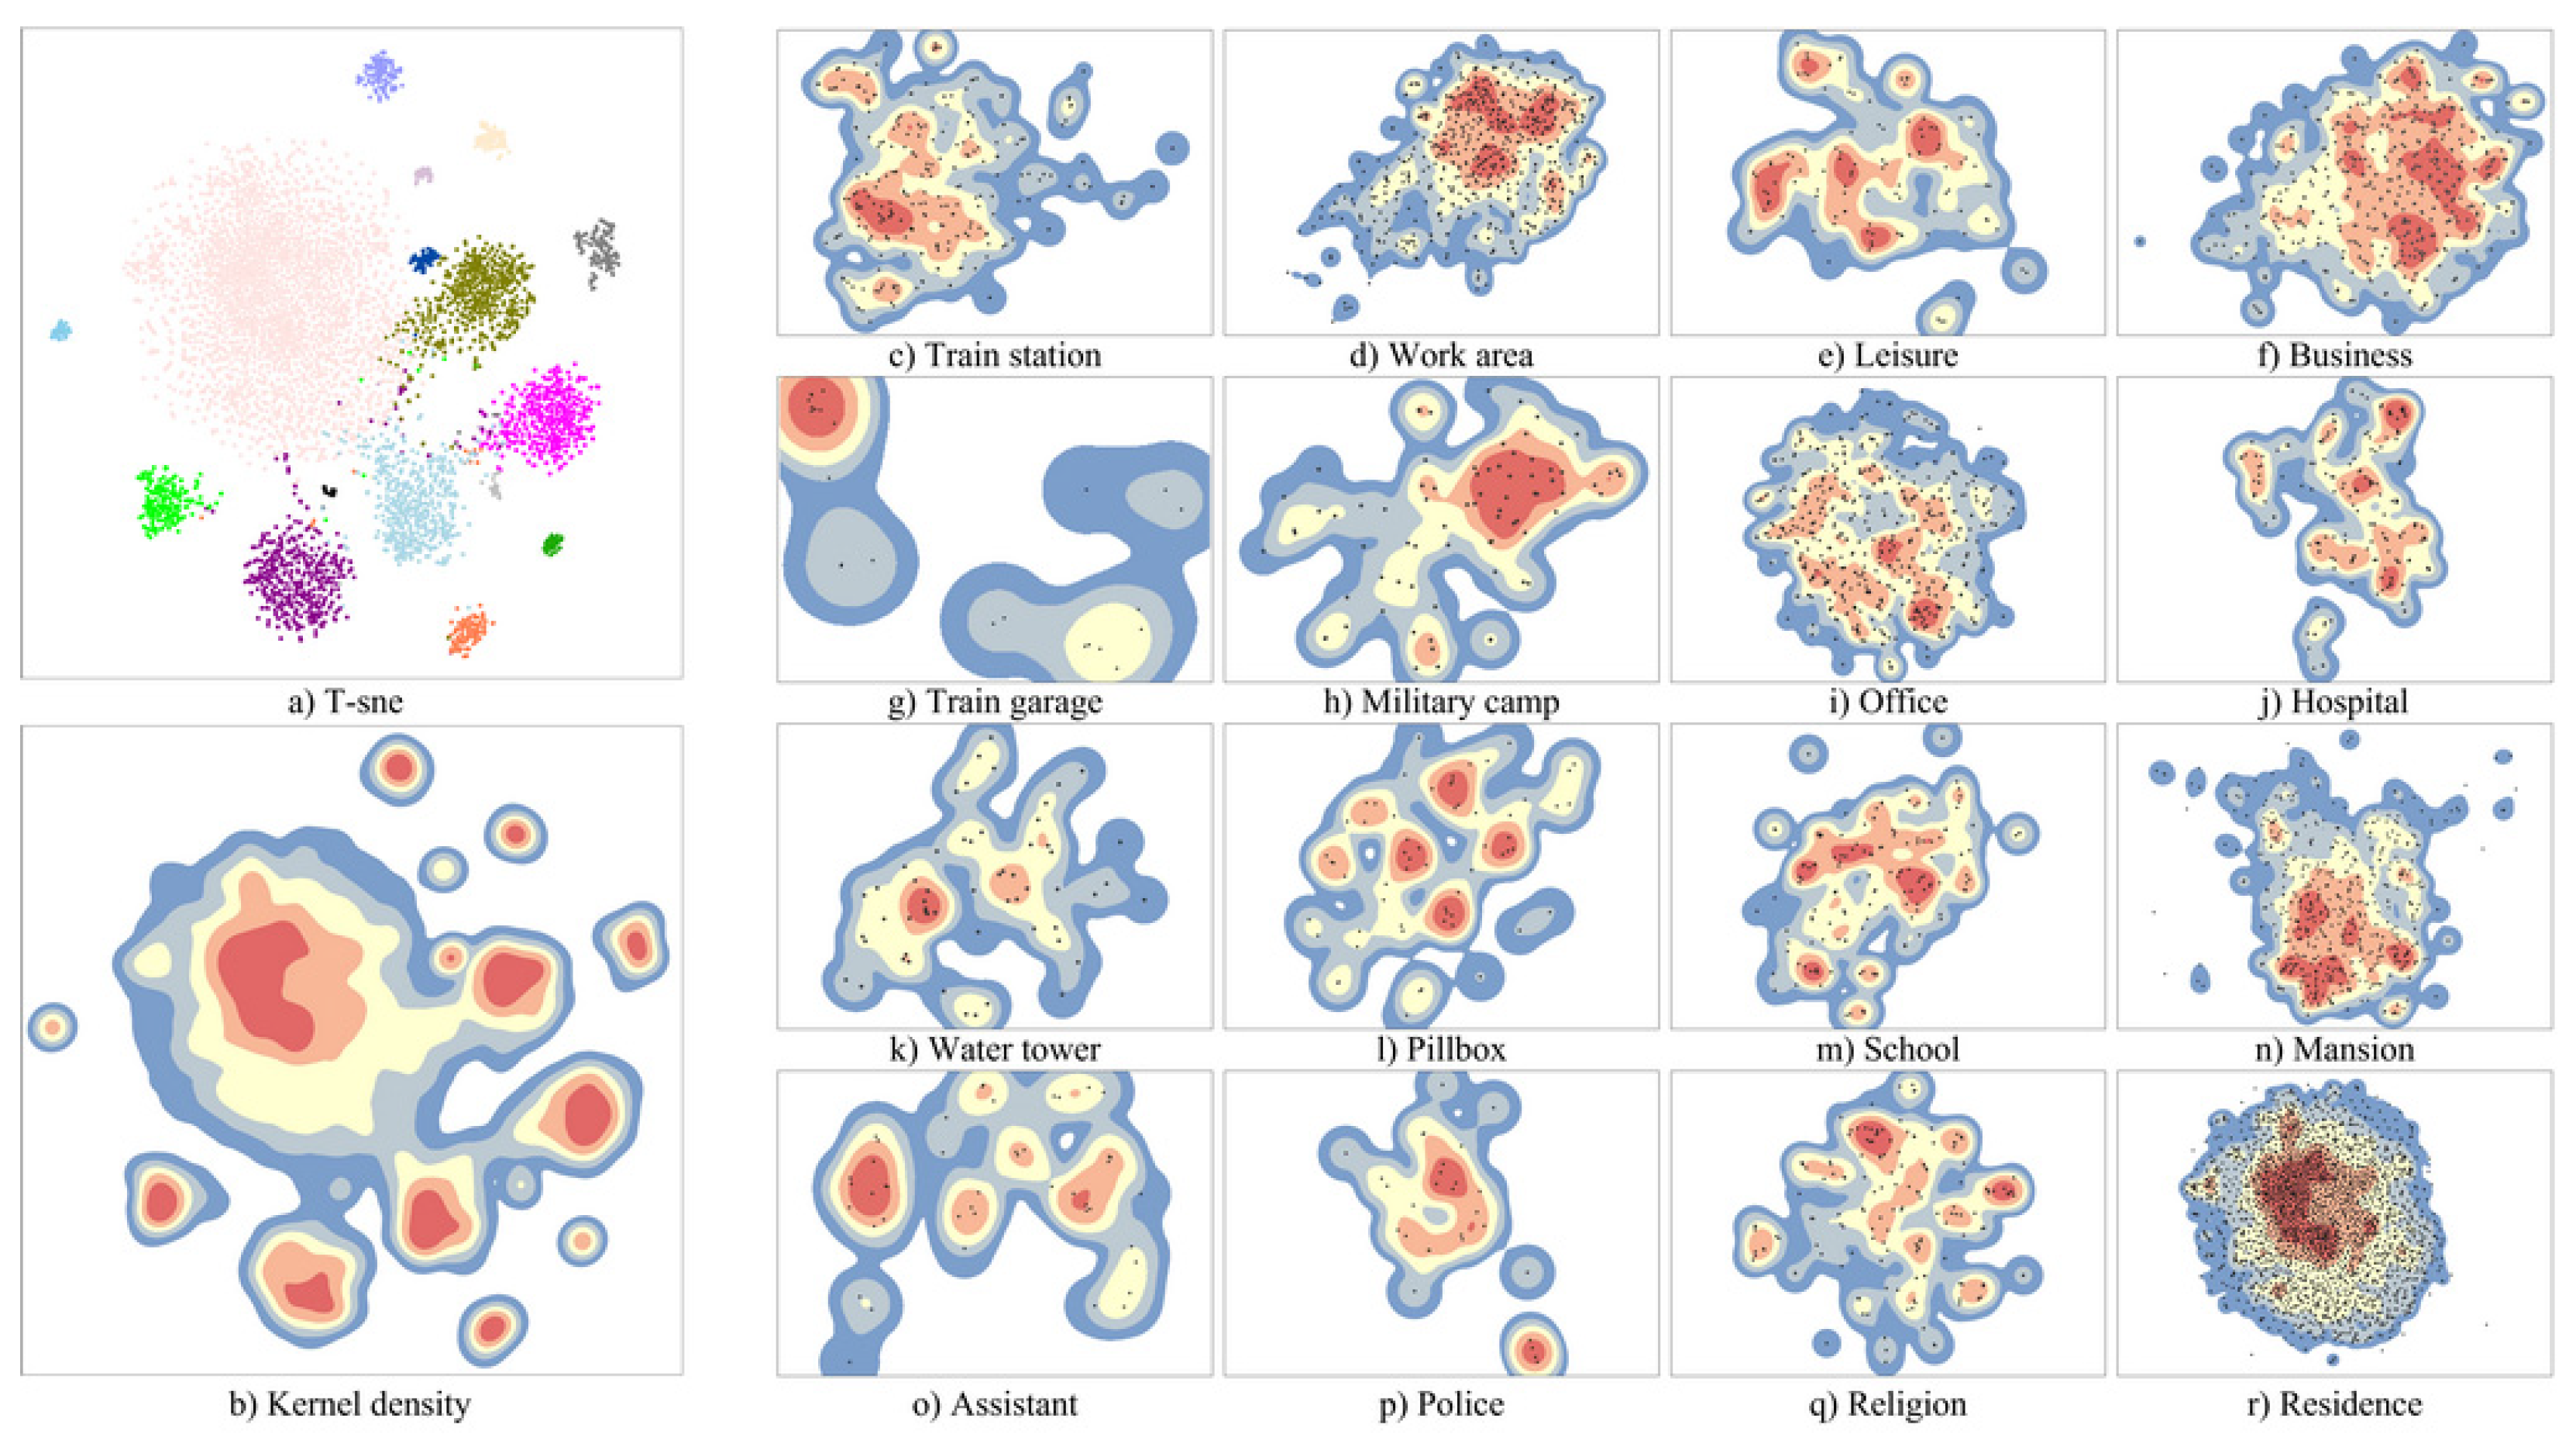
3.2.2. Classification Features
3.2.3. Classification Extraction Prototype
3.3. Elemental Differences in Facades among Functions
3.3.1. Elemental Areas of the Facade Features
3.3.2. Elemental Expression of Facade Features
4. Discussion
4.1. Visual Measurement of Historic Building Groups
4.2. Visual Relationship between Function and Facade
4.3. Limitations and Future Work
5. Conclusions
Author Contributions
Funding
Institutional Review Board Statement
Informed Consent Statement
Data Availability Statement
Acknowledgments
Conflicts of Interest
References
- Jiang, P.; Shao, L.; Baas, C. Interpretation of Value Advantage and Sustainable Tourism Development for Railway Heritage in China Based on the Analytic Hierarchy Process. Sustainability 2019, 11, 6492. [Google Scholar] [CrossRef]
- Orbaşli, A.; Woodward, S. A Railway ‘Route’ as a Linear Heritage Attraction: The Hijaz Railway in the Kingdom of Saudi Arabia. J. Herit. Tour. 2008, 3, 159–175. [Google Scholar] [CrossRef]
- Motevalian, N.; Yeganeh, M. Visually Meaningful Sustainability in National Monuments as an International Heritage. Sustain. Cities Soc. 2020, 60, 102207. [Google Scholar] [CrossRef]
- De Kock, P. The Meaning in Seeing: Visual Sustainability in the Built Environment; AMPS, Stevens Institute of Technology: Hoboken, NJ, USA, 2019. [Google Scholar]
- Motevallian, N.; Yeganeh, M. Analysis of the Influence of Time Dimension on the National Symbol and Its Immediate Field. Urban Des. Discourse A Rev. Contemp. Litreatures Theor. 2020, 1, 55–67. [Google Scholar]
- Li, Y.; Ren, S.; Geng, H. Integrated Preservation of Ethnic Cultural Heritage from the Perspective of “Cultural Gene Inheritance”. Urban Dev. Stud. 2021, 28, 74–82. [Google Scholar]
- Zhang, B. Historic Urban and Rural Settlements: A New Category towards Regional and Integral Conservation of Cultural Heritage. Urban Plan. Forum 2015, 6, 5–11. [Google Scholar] [CrossRef]
- Xiao, J. Study on the Classification and Conservation of Asian Heritage from the Perspective of Cultural Landscape. Archit. J. 2011, S2, 5–11. [Google Scholar]
- Yoshimura, Y.; Cai, B.; Wang, Z.; Ratti, C. Deep Learning Architect: Classification for Architectural Design through the Eye of Artificial Intelligence. In Computational Urban Planning and Management for Smart Cities; Geertman, S., Zhan, Q., Allan, A., Pettit, C., Eds.; Lecture Notes in Geoinformation and Cartography; Springer International Publishing: Cham, Switzerland, 2019; pp. 249–265. ISBN 978-3-030-19424-6. [Google Scholar]
- Ashrafi, B.; Kloos, M.; Neugebauer, C. Heritage Impact Assessment, beyond an Assessment Tool: A Comparative Analysis of Urban Development Impact on Visual Integrity in Four UNESCO World Heritage Properties. J. Cult. Herit. 2021, 47, 199–207. [Google Scholar] [CrossRef]
- Ranjazmayazari, M.; Ansari, M. Comparative Study of Facade Ornament, a Factor in Understanding of Scale, Function and Structural Expression; (Case Study: Modern and Postmodern Era). Hoviatshahr 2021, 15, 33–44. [Google Scholar] [CrossRef]
- Sullivan, L.H. The Tall Office Building Artistically Considered. Lippincott’s Magazine 1896, 57, 403–409. [Google Scholar]
- Burman, P.; Stratton, M. Conserving the Railway Heritage; Taylor & Francis: London, UK, 1997; ISBN 978-0-419-21280-5. [Google Scholar]
- Xie, X.; Liu, Y.; Xu, Y.; He, Z.; Chen, X.; Zheng, X.; Xie, Z. Building Function Recognition Using the Semi-Supervised Classification. Appl. Sci. 2022, 12, 9900. [Google Scholar] [CrossRef]
- Mendes Zancheti, S.; Piccolo Loretto, R. Dynamic Integrity: A Concept to Historic Urban Landscape. J. Cult. Herit. Manag. Sustain. Dev. 2015, 5, 82–94. [Google Scholar] [CrossRef]
- De Leão Dornelles, L.; Gandolfi, F.; Mercader-Moyano, P.; Mosquera-Adell, E. Place and Memory Indicator: Methodology for the Formulation of a Qualitative Indicator, Named Place and Memory, with the Intent of Contributing to Previous Works of Intervention and Restoration of Heritage Spaces and Buildings, in the Aspect of Sustainability. Sustain. Cities Soc. 2020, 54, 101985. [Google Scholar] [CrossRef]
- Seyedashrafi, B.; Ravankhah, M.; Weidner, S.; Schmidt, M. Applying Heritage Impact Assessment to Urban Development: World Heritage Property of Masjed-e Jame of Isfahan in Iran. Sustain. Cities Soc. 2017, 31, 213–224. [Google Scholar] [CrossRef]
- Roth, L.M. Understanding Architecture: Its Elements, History, and Meaning; Routledge: London, UK, 2018; ISBN 0-429-49558-7. [Google Scholar]
- Shan, L.; Zhang, L. Application of Intelligent Technology in Facade Style Recognition of Harbin Modern Architecture. Sustainability 2022, 14, 7073. [Google Scholar] [CrossRef]
- Khalaf, R.W. The Implementation of the UNESCO World Heritage Convention: Continuity and Compatibility as Qualifying Conditions of Integrity. Heritage 2020, 3, 384–401. [Google Scholar] [CrossRef]
- Yeganeh, M. Conceptual and Theoretical Model of Integrity between Buildings and City. Sustain. Cities Soc. 2020, 59, 102205. [Google Scholar] [CrossRef]
- Yi, Y.K.; Zhang, Y.; Myung, J. House Style Recognition Using Deep Convolutional Neural Network. Autom. Constr. 2020, 118, 103307. [Google Scholar] [CrossRef]
- Tang, P.; Li, H.; Wang, X.; Ludger, H. Generative Design on Conservation and Inheritance of Traditional Architecture and Settlement Based on Machine Learning: A Case Study on the Urban Renewal Design of Roma Termini Railway Station. Architecture 2019, 1, 100–105. [Google Scholar]
- Kiruthiga, K.; Thirumaran, K. Visual Perception on the Architectural Elements of the Built Heritage of a Historic Temple Town: A Case Study of Kumbakonam, India. Front. Archit. Res. 2017, 6, 96–107. [Google Scholar] [CrossRef]
- Lamas, A.; Tabik, S.; Cruz, P.; Montes, R.; Martínez-Sevilla, Á.; Cruz, T.; Herrera, F. MonuMAI: Dataset, Deep Learning Pipeline and Citizen Science Based App for Monumental Heritage Taxonomy and Classification. Neurocomputing 2021, 420, 266–280. [Google Scholar] [CrossRef]
- Zhang, F.; Zhou, B.; Liu, L.; Liu, Y.; Fung, H.H.; Lin, H.; Ratti, C. Measuring Human Perceptions of a Large-Scale Urban Region Using Machine Learning. Landsc. Urban Plan. 2018, 180, 148–160. [Google Scholar] [CrossRef]
- Chen, J.; Stouffs, R.; Biljecki, F. Hierarchical (Multi-Label) Architectural Image Recognition and Classification. In Proceedings of the 26th International Conference of the Association for Computer-Aided Architectural Design Research in Asia (CAADRIA) 2021, Hong Kong, China, 29 March–1 April 2021; pp. 161–170. [Google Scholar]
- Dai, M.; Ward, W.O.C.; Meyers, G.; Densley Tingley, D.; Mayfield, M. Residential Building Facade Segmentation in the Urban Environment. Build. Environ. 2021, 199, 107921. [Google Scholar] [CrossRef]
- Monna, F.; Rolland, T.; Denaire, A.; Navarro, N.; Granjon, L.; Barbé, R.; Chateau-Smith, C. Deep Learning to Detect Built Cultural Heritage from Satellite Imagery—Spatial Distribution and Size of Vernacular Houses in Sumba, Indonesia. J. Cult. Herit. 2021, 52, 171–183. [Google Scholar] [CrossRef]
- Cohen, J.P.; Ding, W.; Kuhlman, C.; Chen, A.; Di, L. Rapid Building Detection Using Machine Learning. Appl. Intell. 2016, 45, 443–457. [Google Scholar] [CrossRef]
- Sun, C.; Zhou, Y.; Han, Y. Automatic Generation of Architecture Facade for Historical Urban Renovation Using Generative Adversarial Network. Build. Environ. 2022, 212, 108781. [Google Scholar] [CrossRef]
- Zhang, J.; Fukuda, T.; Yabuki, N. Development of a City-Scale Approach for Façade Color Measurement with Building Functional Classification Using Deep Learning and Street View Images. ISPRS Int. J. Geo-Inf. 2021, 10, 551. [Google Scholar] [CrossRef]
- Zhang, L.; Song, M.; Liu, X.; Sun, L.; Chen, C.; Bu, J. Recognizing Architecture Styles by Hierarchical Sparse Coding of Blocklets. Inf. Sci. 2014, 254, 141–154. [Google Scholar] [CrossRef]
- Hoffmann, E.J.; Wang, Y.; Werner, M.; Kang, J.; Zhu, X.X. Model Fusion for Building Type Classification from Aerial and Street View Images. Remote Sens. 2019, 11, 1259. [Google Scholar] [CrossRef]
- Luo, J.; Zhao, T.; Cao, L.; Biljecki, F. Semantic Riverscapes: Perception and Evaluation of Linear Landscapes from Oblique Imagery Using Computer Vision. Landsc. Urban Plan. 2022, 228, 104569. [Google Scholar] [CrossRef]
- Kang, J.; Körner, M.; Wang, Y.; Taubenböck, H.; Zhu, X.X. Building Instance Classification Using Street View Images. ISPRS J. Photogramm. Remote Sens. 2018, 145, 44–59. [Google Scholar] [CrossRef]
- Kumar, P.; Ofli, F.; Imran, M.; Castillo, C. Detection of Disaster-Affected Cultural Heritage Sites from Social Media Images Using Deep Learning Techniques. J. Comput. Cult. Herit. 2020, 13, 1–31. [Google Scholar] [CrossRef]
- Llamas, J.; Lerones, P.M.; Zalama, E.; Gómez-García-Bermejo, J. Applying Deep Learning Techniques to Cultural Heritage Images within the INCEPTION Project. In Proceedings of the Digital Heritage. Progress in Cultural Heritage: Documentation, Preservation, and Protection, Nicosia, Cyprus, 31 October–5 November 2016; Springer International Publishing: Cham, Switzerland, 2016; pp. 25–32. [Google Scholar]
- Fiorucci, M.; Khoroshiltseva, M.; Pontil, M.; Traviglia, A.; Del Bue, A.; James, S. Machine Learning for Cultural Heritage: A Survey. Pattern Recognit. Lett. 2020, 133, 102–108. [Google Scholar] [CrossRef]
- Llamas, J.; Lerones, P.M.; Medina, R.; Zalama, E.; Gómez-García-Bermejo, J. Classification of Architectural Heritage Images Using Deep Learning Techniques. Appl. Sci. 2017, 7, 992. [Google Scholar] [CrossRef]
- Payntar, N.D.; Hsiao, W.-L.; Covey, R.A.; Grauman, K. Learning Patterns of Tourist Movement and Photography from Geotagged Photos at Archaeological Heritage Sites in Cuzco, Peru. Tour. Manag. 2021, 82, 104165. [Google Scholar] [CrossRef]
- Ma, K.; Wang, B.; Li, Y.; Zhang, J. Image Retrieval for Local Architectural Heritage Recommendation Based on Deep Hashing. Buildings 2022, 12, 809. [Google Scholar] [CrossRef]
- Ergün Hatir, M.; İnce, İ. Lithology Mapping of Stone Heritage via State-of-the-Art Computer Vision. J. Build. Eng. 2021, 34, 101921. [Google Scholar] [CrossRef]
- Dang, A.; Liang, Y.; Chen, M.; Wu, G. Research Progress and Trend of Information Technology Methods for the Conservation of Historic Cities. China Anc. City 2021, 35, 33–37. [Google Scholar] [CrossRef]
- Cui, W.; Hu, Y.; Wang, Z. Typology and Geographic Distribution Characteristics of Chinese Eastern Railway Heritages. Econ. Geogr. 2016, 36, 173–180. [Google Scholar] [CrossRef]
- Wang, F.; Zhao, Z.; Tao, G. Research on Survey Methods and Strategies of the Chinese Eastern Railway Groups: Case Study of the Comprehensive Conservation Plan of the Chinese Eastern Railway (Heilongjiang Section). In Proceedings of the Annual National Planning Conference 2018, Huangzhou, China, 24–26 November 2018; pp. 906–915. [Google Scholar]
- Liu, D.; Bian, B.; Li, Q. Architectural Cultural Heritage of Chinese Eastern Railway; Harbin Institute of Technology Press: Harbin, China, 2020; ISBN 978-7-5603-8520-4. [Google Scholar]
- Japkowicz, N.; Stephen, S. The Class Imbalance Problem: A Systematic Study. Intell. Data Anal. 2002, 6, 429–449. [Google Scholar] [CrossRef]
- Huang, G.; Liu, Z.; van der Maaten, L.; Weinberger, K.Q. Densely Connected Convolutional Networks. In Proceedings of the IEEE Conference on Computer Vision and Pattern Recognition 2017, Honolulu, HI, USA, 21–26 July 2017; pp. 4700–4708. [Google Scholar]
- Tao, Y.; Xu, M.; Lu, Z.; Zhong, Y. DenseNet-Based Depth-Width Double Reinforced Deep Learning Neural Network for High-Resolution Remote Sensing Image Per-Pixel Classification. Remote Sens. 2018, 10, 779. [Google Scholar] [CrossRef]
- Shi, Z.; Hao, H.; Zhao, M.; Feng, Y.; He, L.; Wang, Y.; Suzuki, K. A Deep CNN Based Transfer Learning Method for False Positive Reduction. Multimed. Tools Appl. 2019, 78, 1017–1033. [Google Scholar] [CrossRef]
- Hussain, M.; Bird, J.J.; Faria, D.R. A Study on CNN Transfer Learning for Image Classification. In Proceedings of the Advances in Computational Intelligence Systems, Savannah, GA, USA; Springer International Publishing: Cham, Switzerland, 2019; pp. 191–202. [Google Scholar]
- Hu, J.; Shen, L.; Sun, G. Squeeze-and-Excitation Networks. In Proceedings of the IEEE Conference on Computer Vision and Pattern Recognition 2018, Salt Lake City, UT, USA, 18–23 June 2018; pp. 7132–7141. [Google Scholar]
- Tong, W.; Chen, W.; Han, W.; Li, X.; Wang, L. Channel-Attention-Based DenseNet Network for Remote Sensing Image Scene Classification. IEEE J. Sel. Top. Appl. Earth Obs. Remote Sens. 2020, 13, 4121–4132. [Google Scholar] [CrossRef]
- Sun, M.; Zhang, F.; Duarte, F.; Ratti, C. Understanding Architecture Age and Style through Deep Learning. Cities 2022, 128, 103787. [Google Scholar] [CrossRef]
- Van der Maaten, L.; Hinton, G. Visualizing Data Using T-SNE. J. Mach. Learn. Res. 2008, 9, 2579–2605. [Google Scholar]
- Frey, B.J.; Dueck, D. Clustering by Passing Messages between Data Points. Science 2007, 315, 972–976. [Google Scholar] [CrossRef]
- Oliveira, M.; Gama, J. A framework to monitor clusters evolution applied to economy and finance problems. Intell. Data Anal. 2012, 16, 93–111. [Google Scholar] [CrossRef]
- Cardoso, M.G.M.S.; de Carvalho, A.P. de L.F. Quality indices for (practical) clustering evaluation. Intell. Data Anal. 2009, 13, 725–740. [Google Scholar] [CrossRef]
- Li, K.; Cao, X.; Ge, X.; Wang, F.; Lu, X.; Shi, M.; Yin, R.; Mi, Z.; Chang, S. Meta-Heuristic Optimization-Based Two-Stage Residential Load Pattern Clustering Approach Considering Intra-Cluster Compactness and Inter-Cluster Separation. IEEE Trans. Ind. Appl. 2020, 56, 3375–3384. [Google Scholar] [CrossRef]
- Deng, N.; Li, X. (Robert) Feeling a Destination through the “Right” Photos: A Machine Learning Model for DMOs’ Photo Selection. Tour. Manag. 2018, 65, 267–278. [Google Scholar] [CrossRef]
- Wang, H.; Zheng, X.; Yuan, T. Overview of Researches Based on DMSP/OLS Nighttime Light Data. Prog. Geogr. 2012, 31, 11–19. [Google Scholar]
- Xian, M.; Xu, F.; Cheng, H.D.; Zhang, Y.; Ding, J. EISeg: Effective Interactive Segmentation. In Proceedings of the 2016 23rd International Conference on Pattern Recognition (ICPR), Cancun, Mexico, 4–8 December 2016; pp. 1982–1987. [Google Scholar]
- Gadde, R.; Marlet, R.; Paragios, N. Learning Grammars for Architecture-Specific Facade Parsing. Int. J. Comput. Vis. 2016, 117, 290–316. [Google Scholar] [CrossRef]
- LIU, H.; ZHANG, J.; ZHU, J.; HOI, S.C.H. Deepfacade: A Deep Learning Approach to Facade Parsing. In Proceedings of the 26th International Joint Conference on Artificial Intelligence, IJCAI 2017, Melbourne, Australia, 19–25 August 2017; pp. 2301–2307. [Google Scholar] [CrossRef]
- Selvaraju, R.R.; Cogswell, M.; Das, A.; Vedantam, R.; Parikh, D.; Batra, D. Grad-CAM: Visual Explanations from Deep Networks via Gradient-Based Localization. In Proceedings of the IEEE International Conference on Computer Vision, Cambridge, MA, USA, 22–29 October 2017; pp. 618–626. [Google Scholar]
- Leng, Z.; Tan, M.; Liu, C.; Cubuk, E.D.; Shi, X.; Cheng, S.; Anguelov, D. PolyLoss: A Polynomial Expansion Perspective of Classification Loss Functions. arXiv 2022, arXiv:2204.12511. [Google Scholar]
- Llugsi, R.; Yacoubi, S.E.; Fontaine, A.; Lupera, P. Comparison between Adam, AdaMax and Adam W Optimizers to Implement a Weather Forecast Based on Neural Networks for the Andean City of Quito. In Proceedings of the 2021 IEEE Fifth Ecuador Technical Chapters Meeting (ETCM), Cuenca, Ecuador, 12–15 October 2021; pp. 1–6. [Google Scholar]
- Zhang, L.; Zhao, Z. Study on Characteristics of Typical Units of Middle East Railway Complex in Harbin (Jurisdictions), Heilongjiang Province, in Perspective of Type Differentiation. Urban. Archit. 2018, 32, 13–20. [Google Scholar] [CrossRef]
- Zhang, B.; Zhao, Z.; Li, P.; Wang, Q.; Zhang, X. Study on the Earlier Town’s Planning under the Application of Spatial Syntax: Taking the Secondary Station-Located Towns as an Example. Urban Dev. Stud. 2018, 25, 128–133. [Google Scholar]
- Lee, S.; Maisonneuve, N.; Crandall, D.; Efros, A.A.; Sivic, J. Linking Past to Present: Discovering Style in Two Centuries of Architecture. In Proceedings of the IEEE International Conference on Computational Photography, Houston, TX, USA, 24 April 2015. [Google Scholar]
- Glatolenkova, E.V. Railway Architecture Along the Chinese Eastern Railway at the Beginning of the 20th Century. In Proceedings of the IOP Conference Series: Materials Science and Engineering, Russky Island, Russia, 6–9 October 2020; IOP Publishing: Bristol, UK, 2021; Volume 1079, p. 042003. [Google Scholar]
- Xu, Z.; Tao, D.; Zhang, Y.; Wu, J.; Tsoi, A.C. Architectural Style Classification Using Multinomial Latent Logistic Regression. In Proceedings of the Computer Vision—ECCV 2014, Zurich, Switzerland, 6–12 September 2014; Springer International Publishing: Cham, Switzerland, 2014; pp. 600–615. [Google Scholar]
- Zhang, H.; Zhao, Z. Collaborative Conservation Framework of Historic Urban Landscape for Territorial Resources Total Elements and Total Space-Time Governance—Taking Mudanjiang, a Town along the Chinese Eastern Railway, as an Example. Chin. Landsc. Archit. 2022, 38, 68–73. [Google Scholar] [CrossRef]
- Perez, H.; Tah, J.H.M.; Mosavi, A. Deep Learning for Detecting Building Defects Using Convolutional Neural Networks. Sensors 2019, 19, 3556. [Google Scholar] [CrossRef] [PubMed]


| Location | ID | Document Number | Historic Function | Current Function | Coordinates | |
|---|---|---|---|---|---|---|
| HLJ | Qiqihar | Q-FLEJ-001 | 230206-0013 | Train station | Train station | 123.543169, 47.244953 |
| Harbin | H-DL-061 | 230102-0047 | Hospital | Hospital | 126.613617, 45.772577 | |
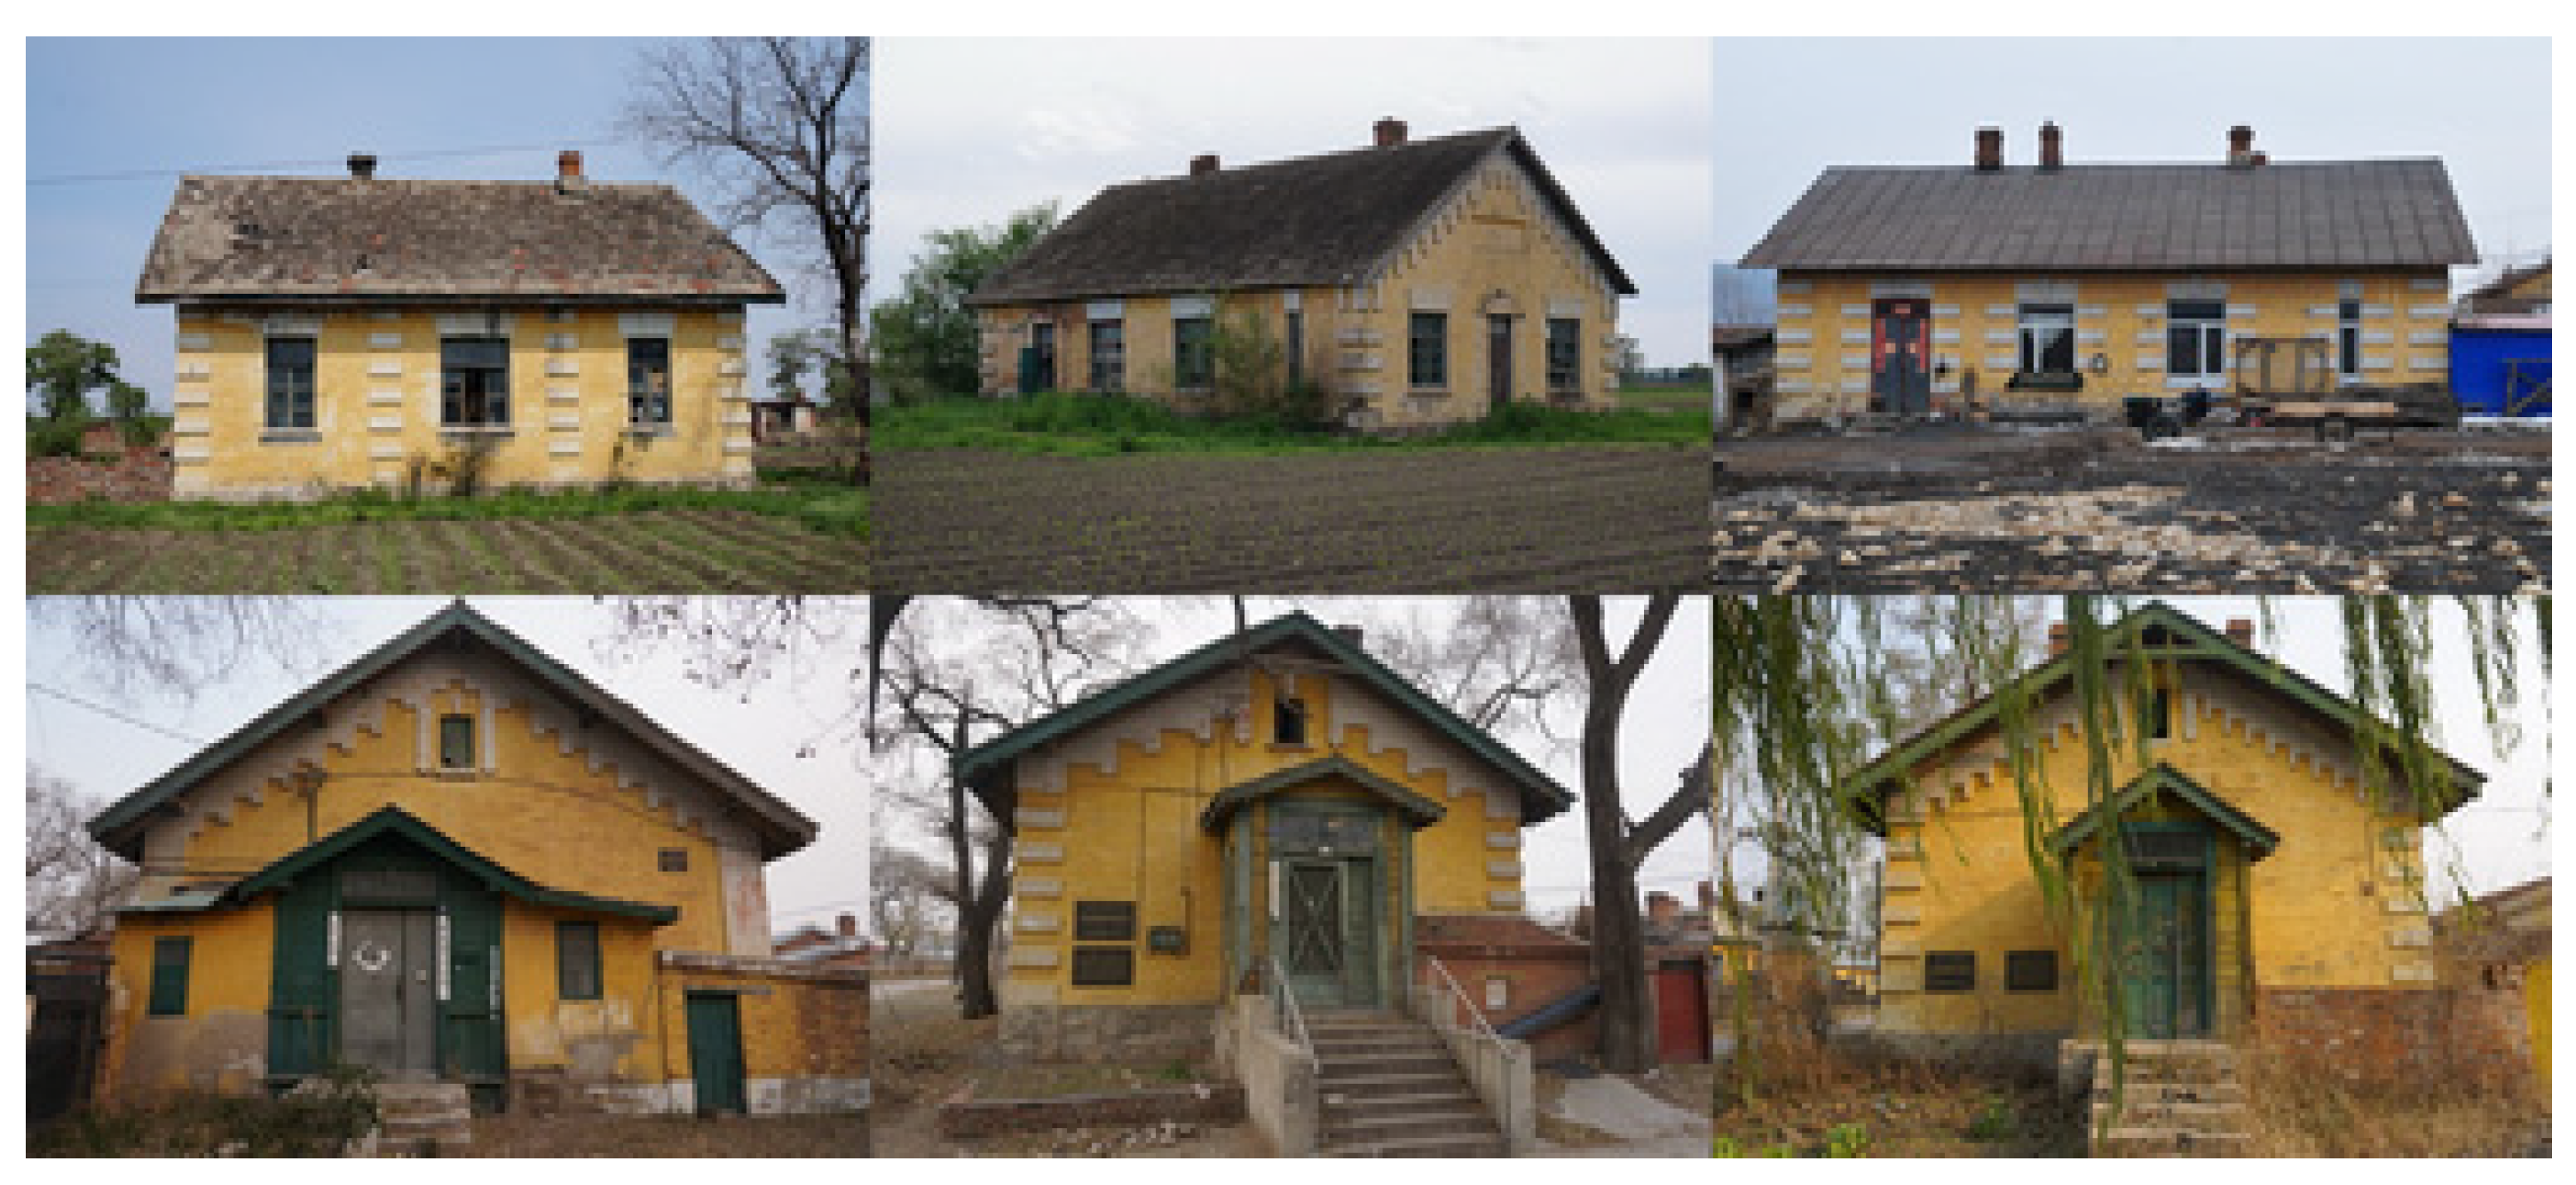
| Daqing | D-DM-019 | 230624-0003 | Work area | Residence | 124.438397, 46.870988 | |
| Suihua | S-ZD-013 | 231282-0070 | Office | Residence | 125.990628, 46.078661 | |
| Mudanjiang | M-HL-103 | 231083-0429 | Train garage | Exhibition | 129.069733, 44.818738 | |
| Jixi | J-LS-001 | 230305-0012 | Residence | Residences | 130.711617, 45.062775 | |
| Suifenhe | SF-SFH-004 | 231081-0004 | Religion | Churches | 131.153397, 44.390952 | |
| NM | Manchurian | N-MCR-063 | 150781-0088 | Mansion | Residence | 117.444027, 49.578333 |
| Hailar | N-HLR-009 | Unregistered | Water tower | Unoccupied | 120.071055, 49.191166 | |
| Yakeshi | N-YKS-015 | 150782-0014 | Military camp | Residence | 121.902555, 48.758416 | |
| Zhalantun | N-ZLT-023 | 150783-0040 | School | School | 122.733468, 48.016591 | |
| Category | Examples |
|---|---|
| Train station (268) |  |
| Train garage (26) | 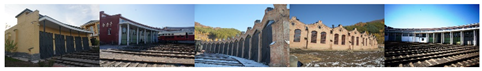 |
| Water tower (53) |  |
| Assistant (49) | 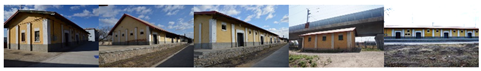 |
| Work area (690) |  |
| Military camp (91) |  |
| Pillbox (65) |  |
| Police (38) |  |
| Leisure (122) | 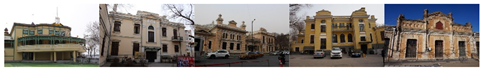 |
| Office (652) |  |
| School (161) |  |
| Religion (167) |  |
| Business (545) |  |
| Hospital (212) |  |
| Mansion (611) |  |
| Residence (3320) |  |
| Models | Accuracy | Precision | Recall | F1-Score | Kappa |
|---|---|---|---|---|---|
| VGG16 | 64.12% | 0.68563 | 0.42847 | 0.41324 | 0.49452 |
| mnasNet | 76.93% | 0.75818 | 0.68849 | 0.70065 | 0.68751 |
| ShuffleNet V2 | 78.35% | 0.76400 | 0.69833 | 0.7241 | 0.70299 |
| ConvnNxt-B | 80.13% | 0.81898 | 0.72112 | 0.76123 | 0.72445 |
| MobileNet v3 | 80.34% | 0.78627 | 0.70427 | 0.73068 | 0.72714 |
| Resnet 50 | 81.19% | 0.81127 | 0.7134 | 0.75584 | 0.73814 |
| Sequencer2d-M | 81.33% | 0.83392 | 0.73904 | 0.77813 | 0.74214 |
| EfficientNet V2 | 81.55% | 0.84747 | 0.73819 | 0.78192 | 0.74629 |
| DenseNet 121 | 83.22% | 0.85339 | 0.75298 | 0.78732 | 0.76778 |
| SE-DenseNet | 85.84% | 0.88355 | 0.80856 | 0.84190 | 0.81553 |
| Category | Examples |
|---|---|
| Train station (21) |  |
| Train garage (26) |  |
| Water tower (53) |  |
| Assistant (49) |  |
| Work area (690) |  |
| Military camp (91) |  |
| Pillbox (65) |  |
| Police (38) |  |
| Leisure (122) |  |
| Office (652) |  |
| School (161) |  |
| Religion (167) |  |
| Business (545) |  |
| Hospital (212) | 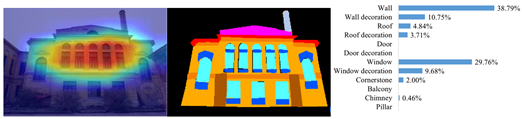 |
| Mansion (611) |  |
| Residence (3320) |  |
Disclaimer/Publisher’s Note: The statements, opinions and data contained in all publications are solely those of the individual author(s) and contributor(s) and not of MDPI and/or the editor(s). MDPI and/or the editor(s) disclaim responsibility for any injury to people or property resulting from any ideas, methods, instructions or products referred to in the content. |
© 2023 by the authors. Licensee MDPI, Basel, Switzerland. This article is an open access article distributed under the terms and conditions of the Creative Commons Attribution (CC BY) license (https://creativecommons.org/licenses/by/4.0/).
Share and Cite
Li, P.; Zhao, Z.; Zhang, B.; Chen, Y.; Xie, J. Understanding the Visual Relationship between Function and Facade in Historic Buildings Using Deep Learning—A Case Study of the Chinese Eastern Railway. Sustainability 2023, 15, 15857. https://doi.org/10.3390/su152215857
Li P, Zhao Z, Zhang B, Chen Y, Xie J. Understanding the Visual Relationship between Function and Facade in Historic Buildings Using Deep Learning—A Case Study of the Chinese Eastern Railway. Sustainability. 2023; 15(22):15857. https://doi.org/10.3390/su152215857
Chicago/Turabian StyleLi, Peilun, Zhiqing Zhao, Bocheng Zhang, Yuling Chen, and Jiayu Xie. 2023. "Understanding the Visual Relationship between Function and Facade in Historic Buildings Using Deep Learning—A Case Study of the Chinese Eastern Railway" Sustainability 15, no. 22: 15857. https://doi.org/10.3390/su152215857
APA StyleLi, P., Zhao, Z., Zhang, B., Chen, Y., & Xie, J. (2023). Understanding the Visual Relationship between Function and Facade in Historic Buildings Using Deep Learning—A Case Study of the Chinese Eastern Railway. Sustainability, 15(22), 15857. https://doi.org/10.3390/su152215857