
Investigation of Hydrokinetic Tidal Energy Harvesting Using a Mangrove-Inspired Device

Abstract
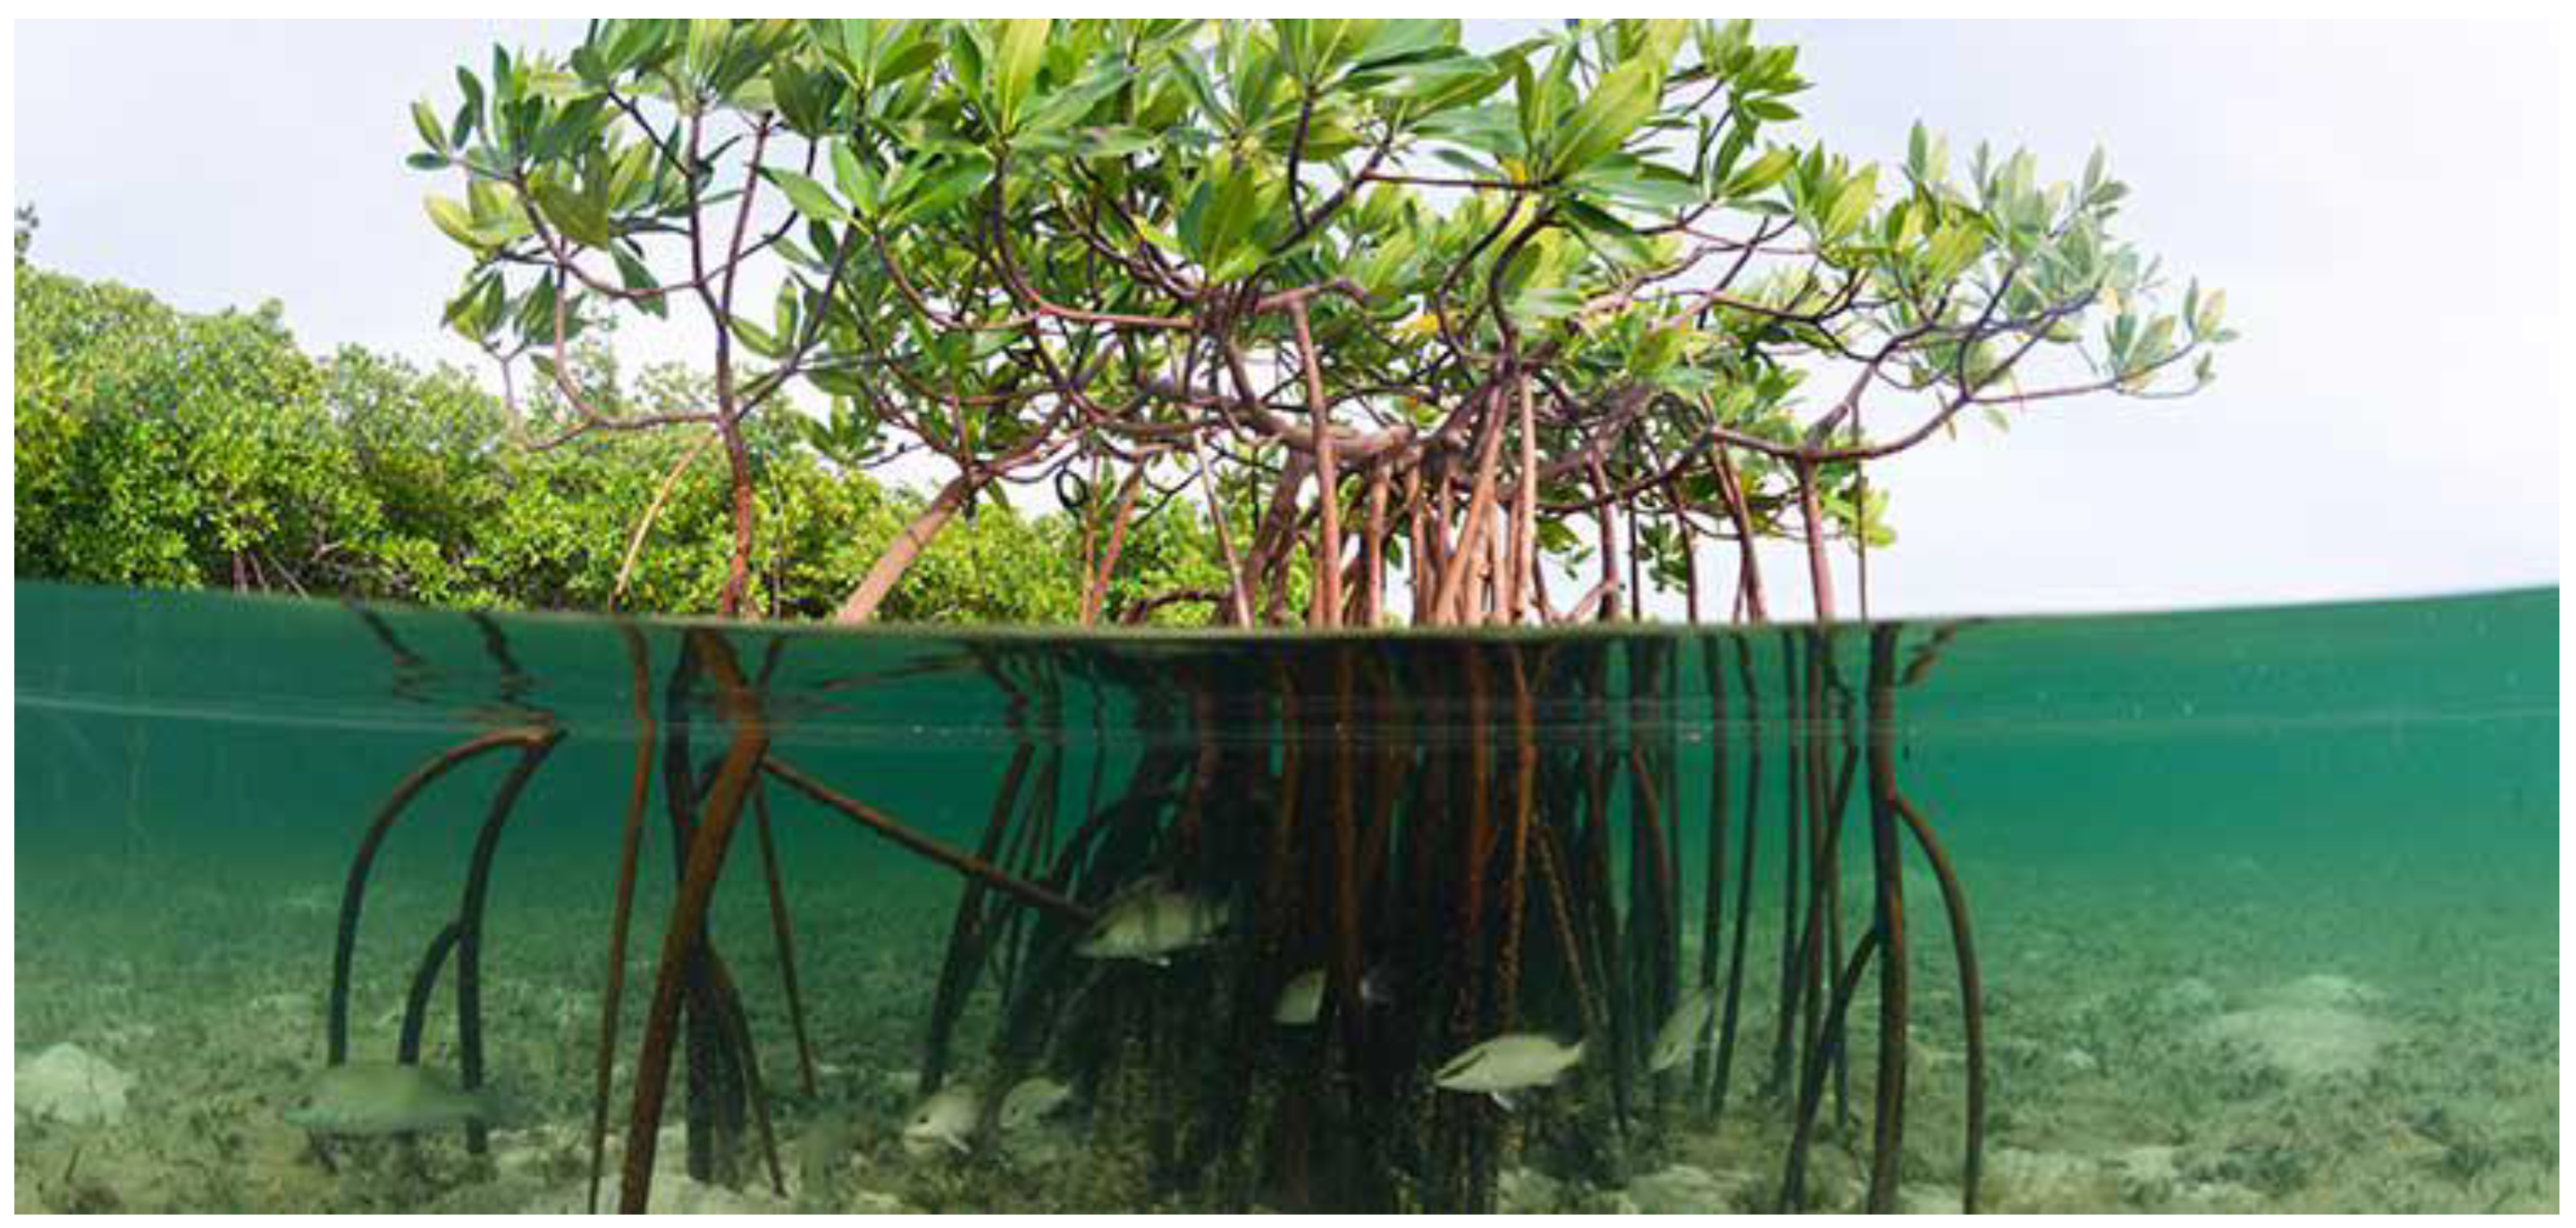
:1. Introduction
2. Methodologies
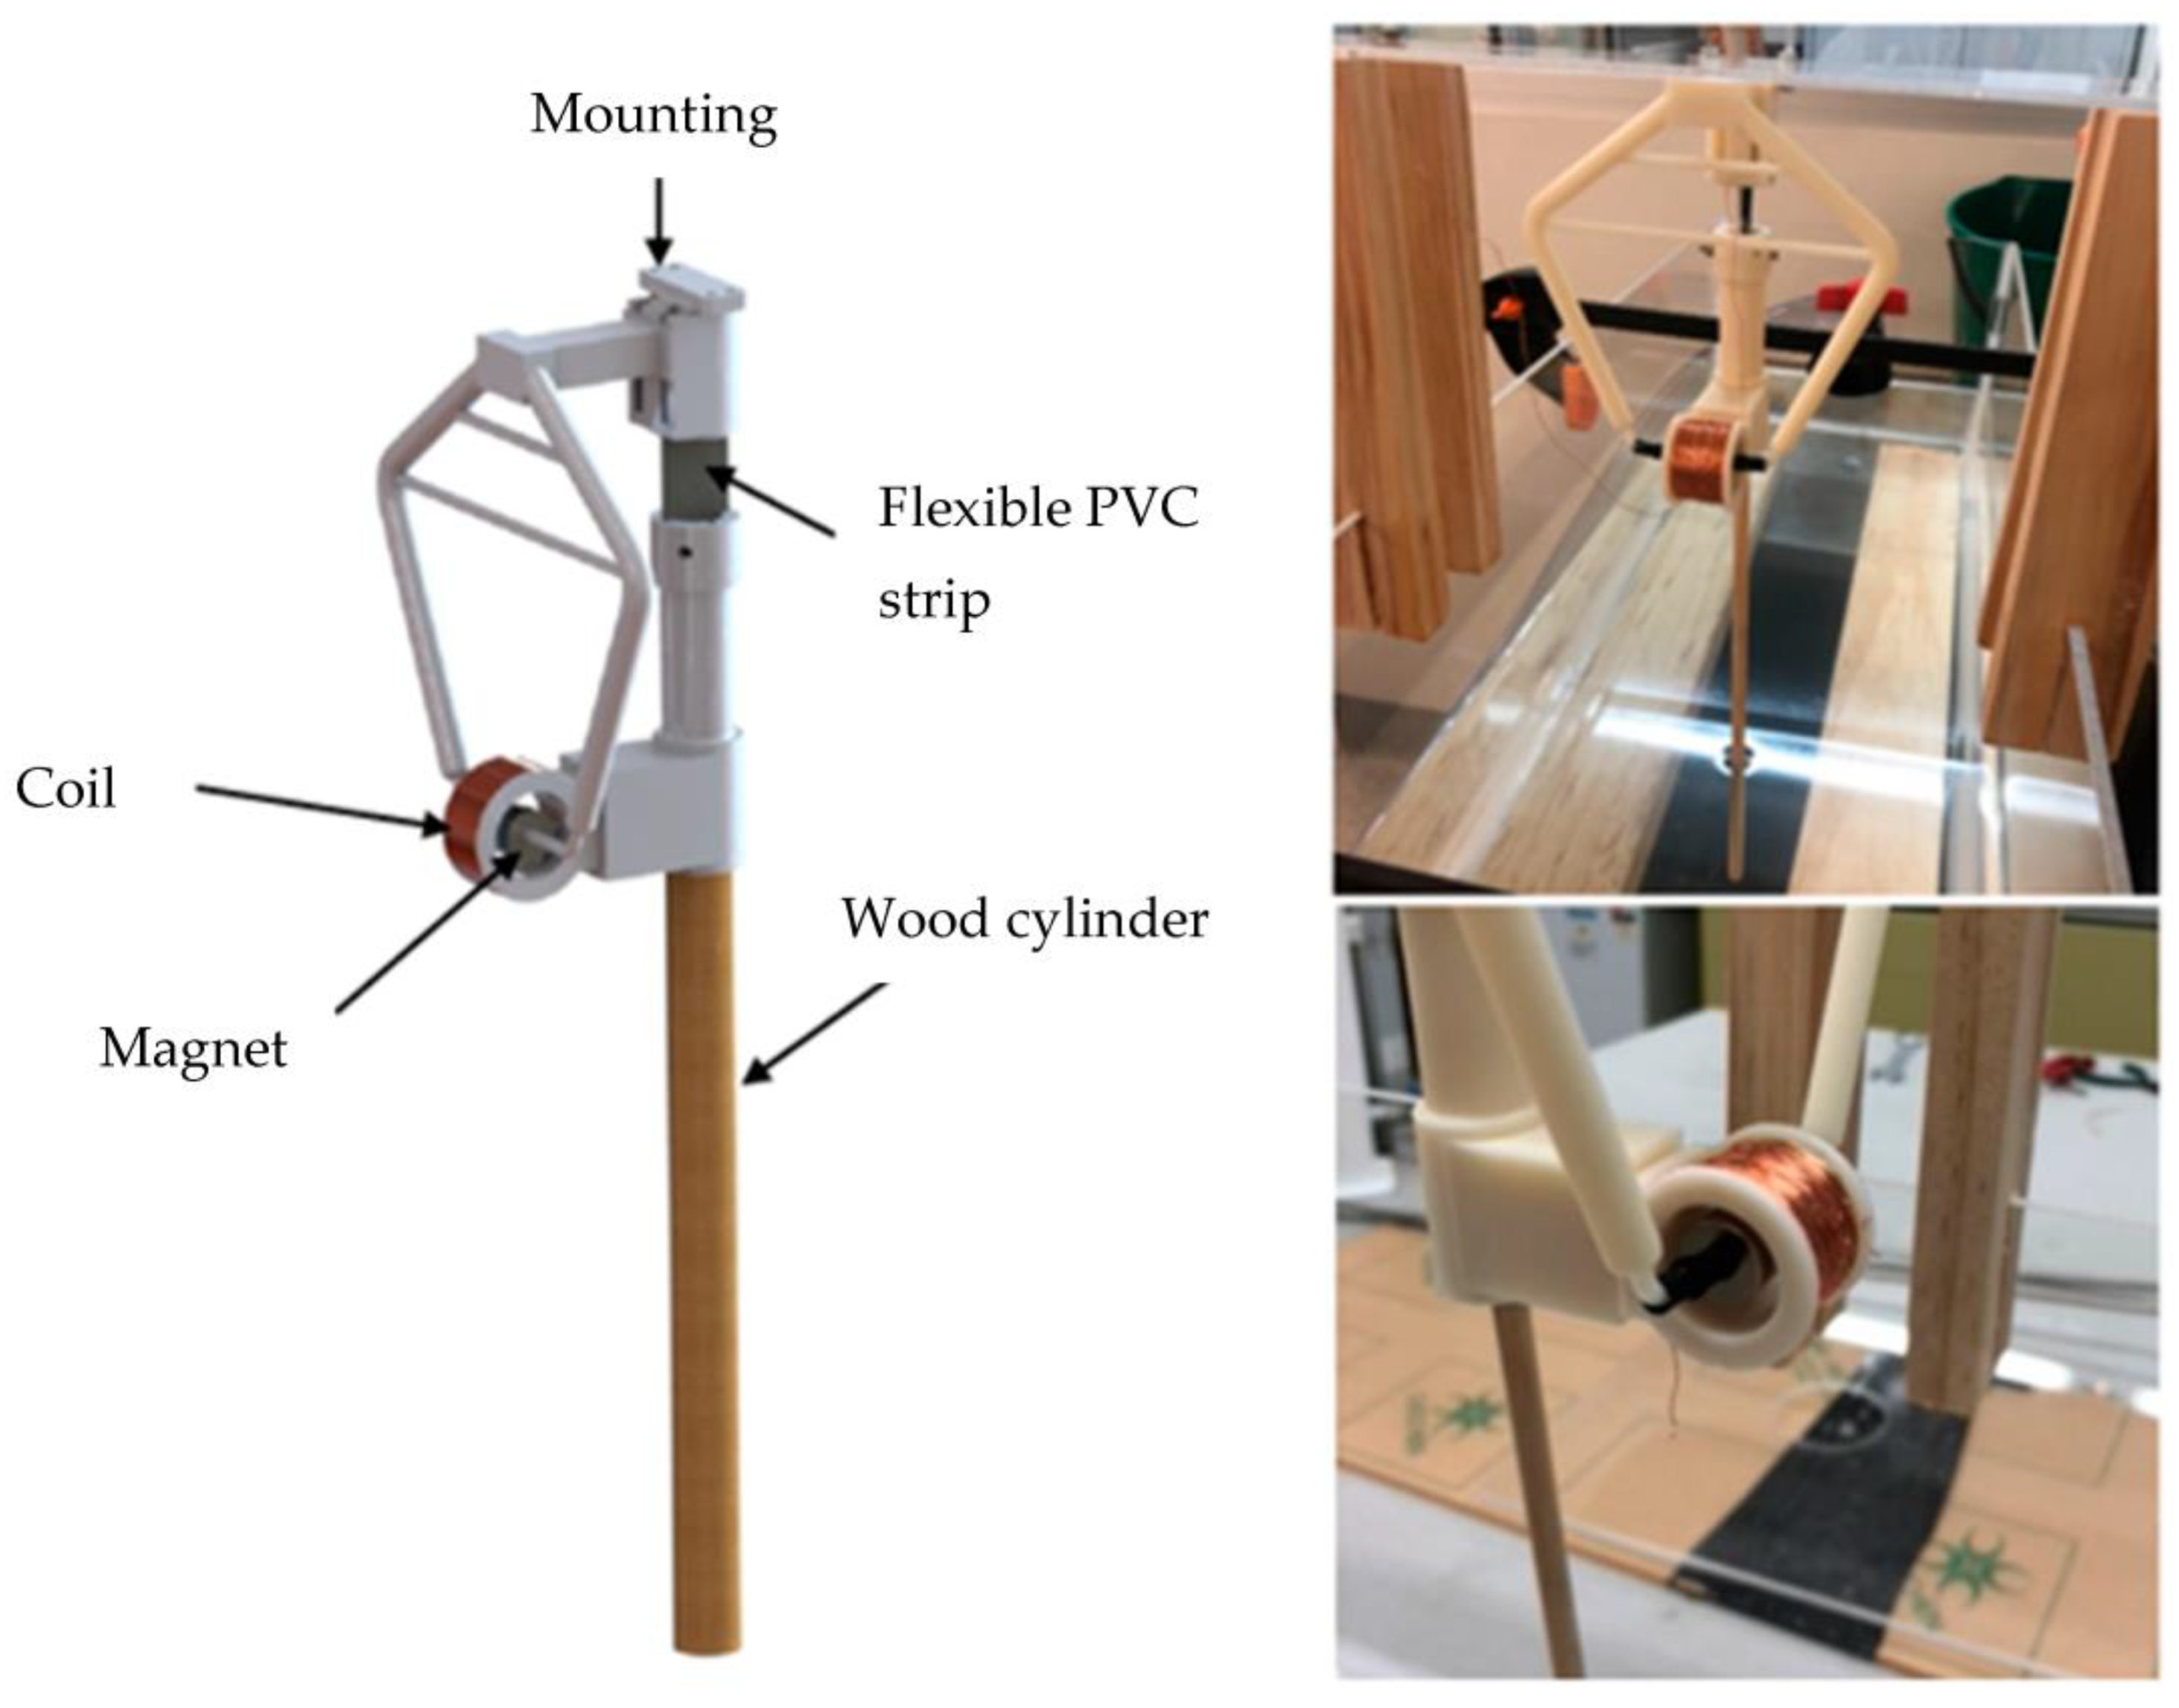
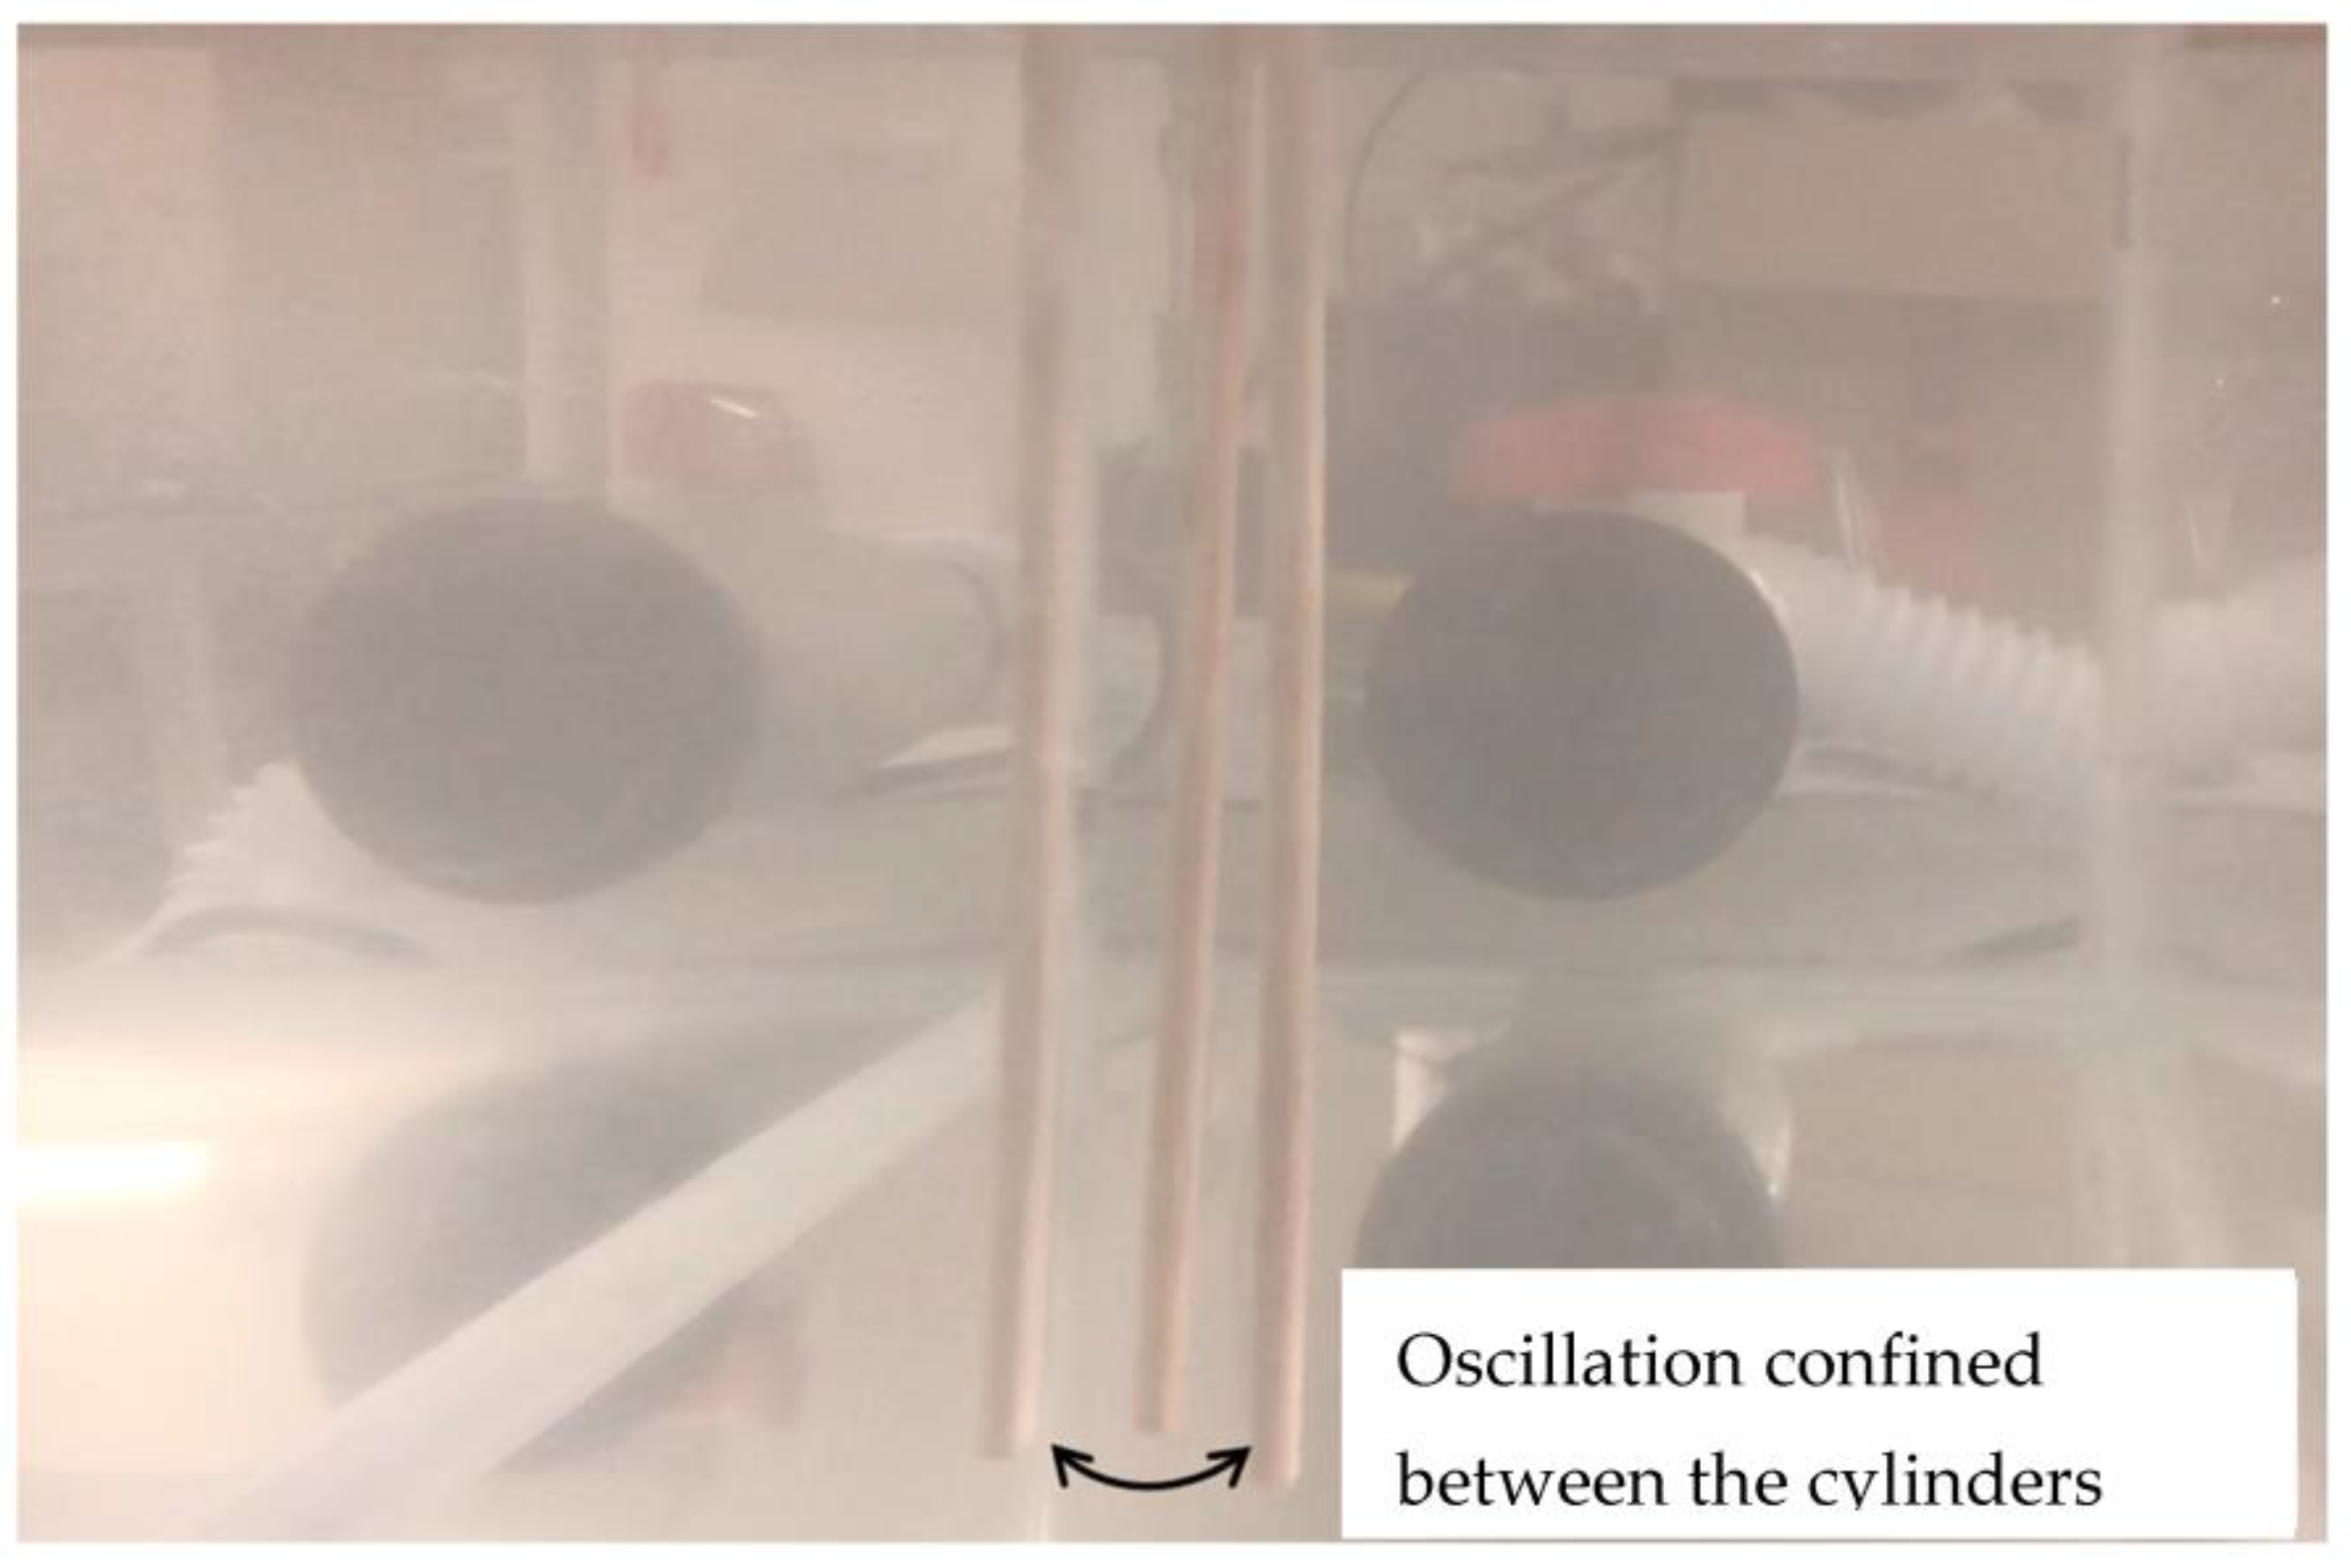
2.1. Experimental Setup
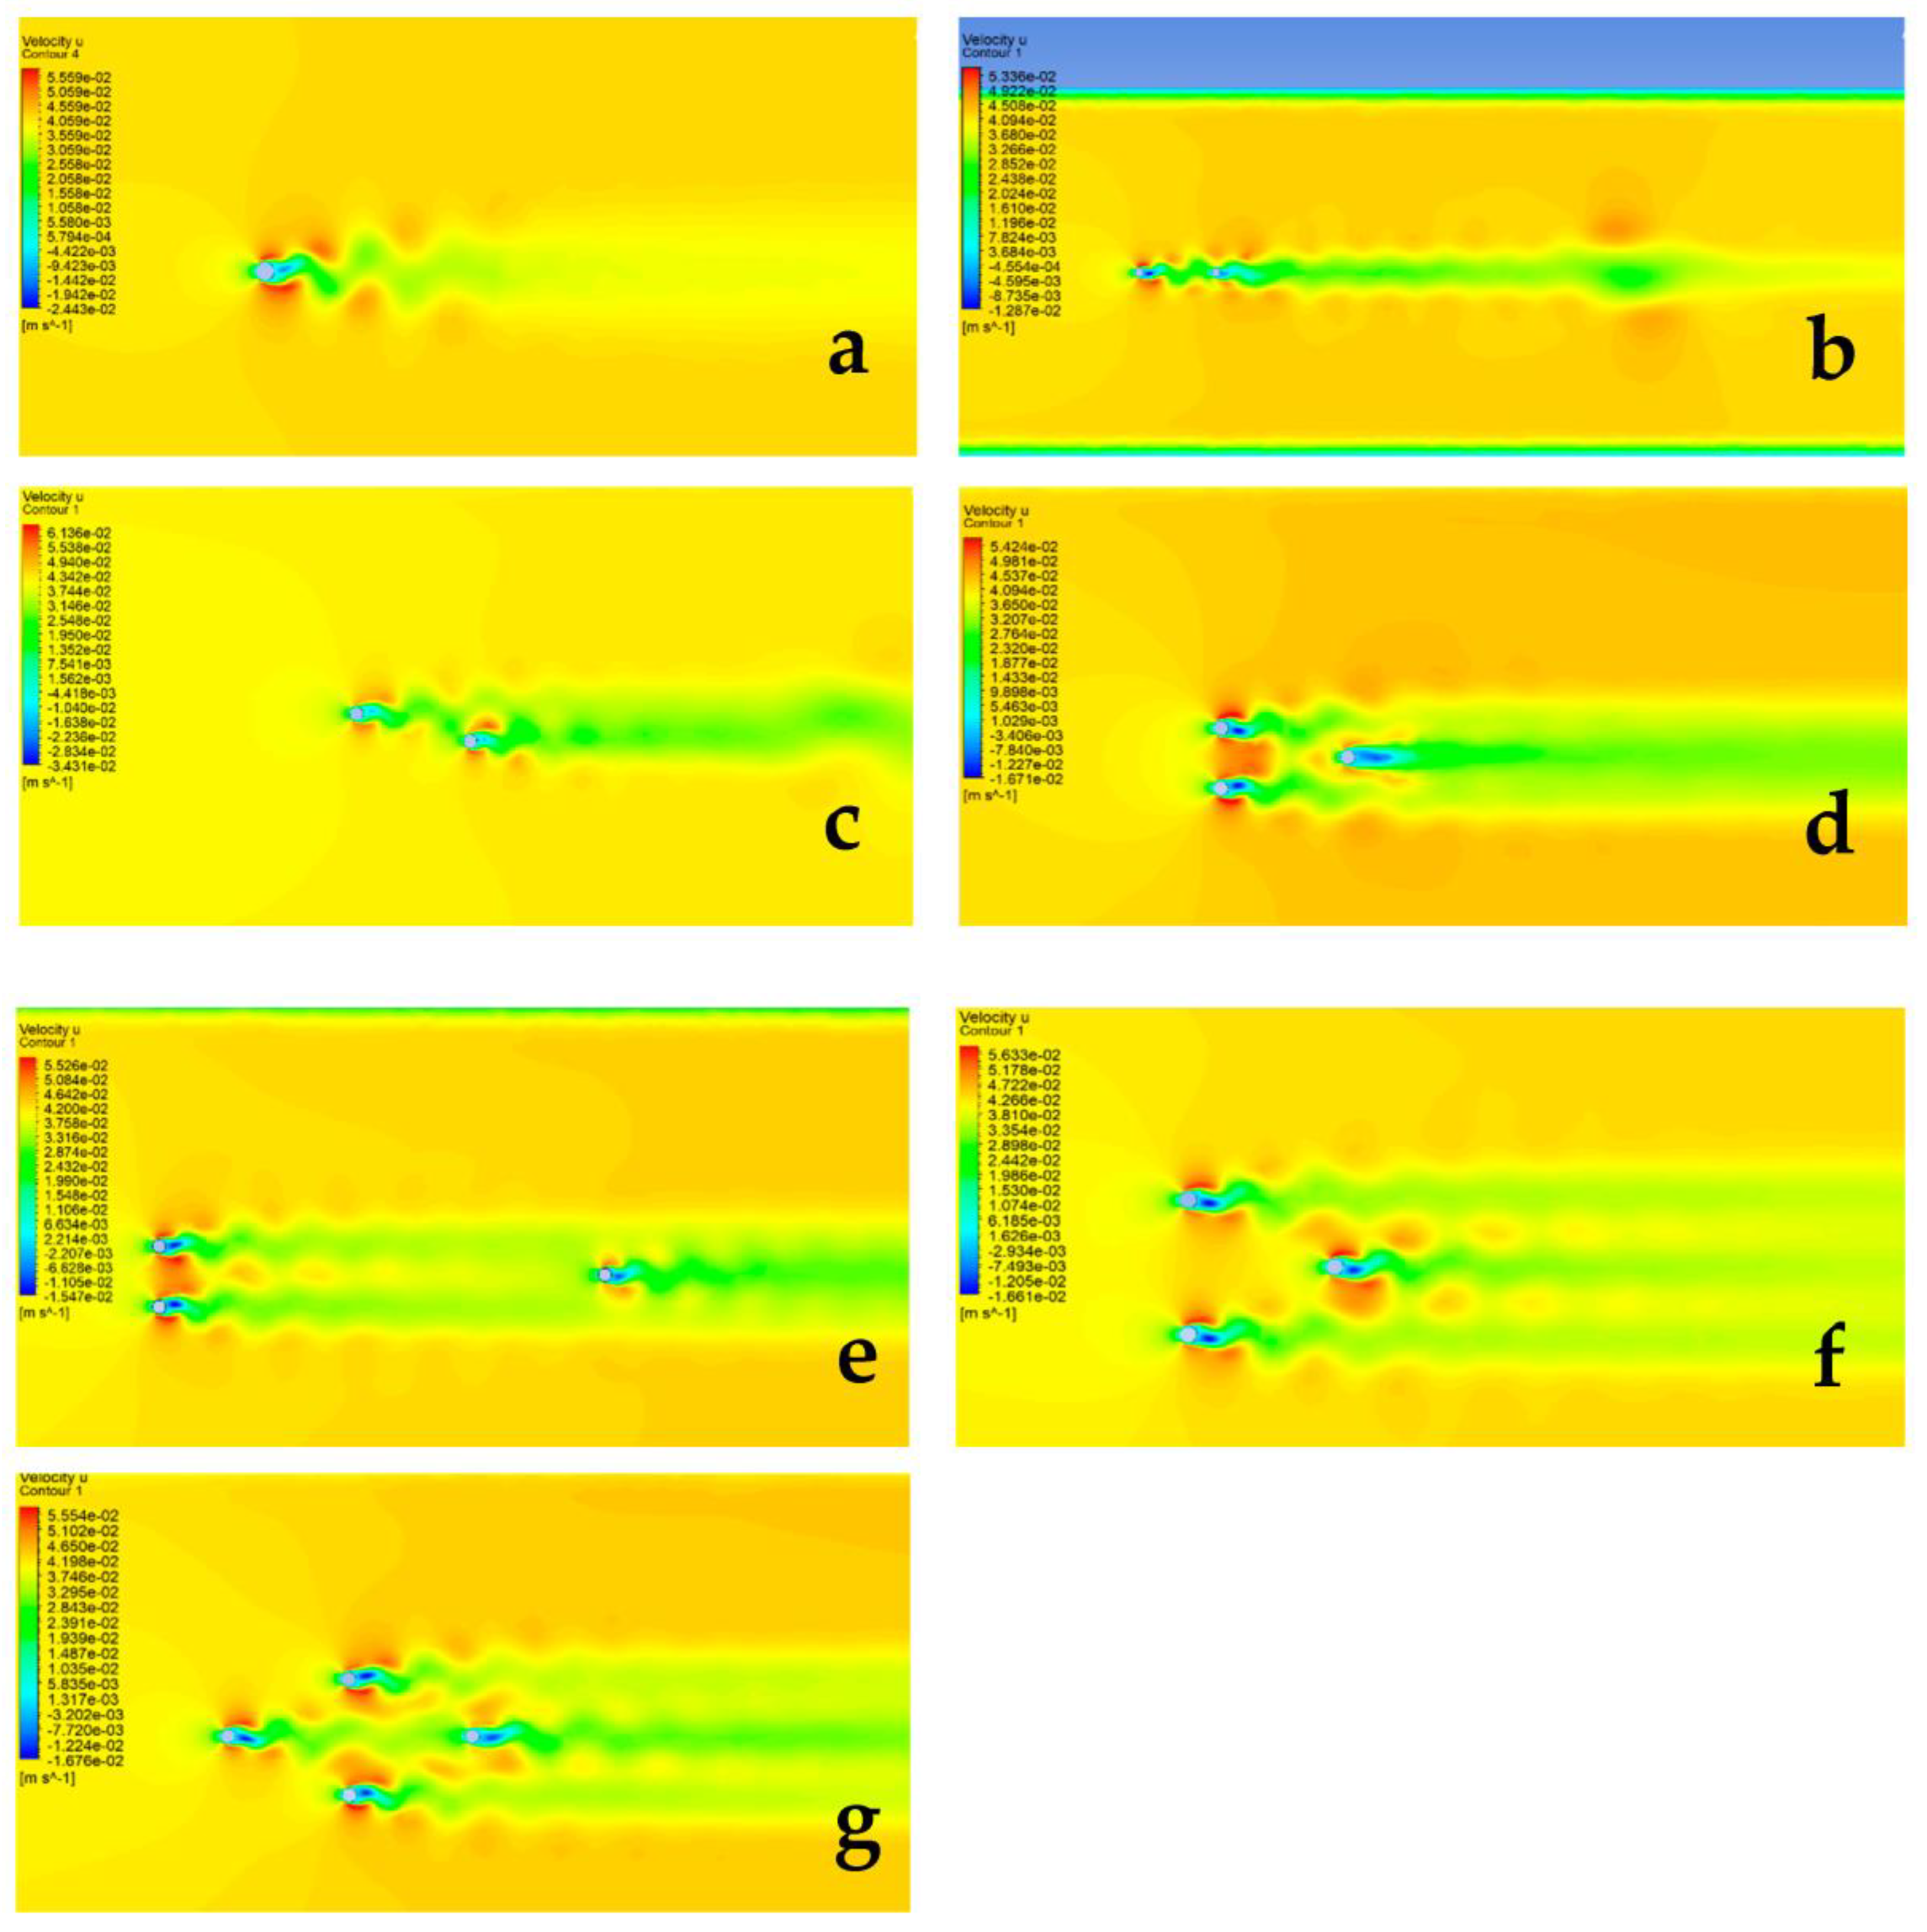
2.2. CFD Modelling
3. Results and Discussion
3.1. Experimental Results
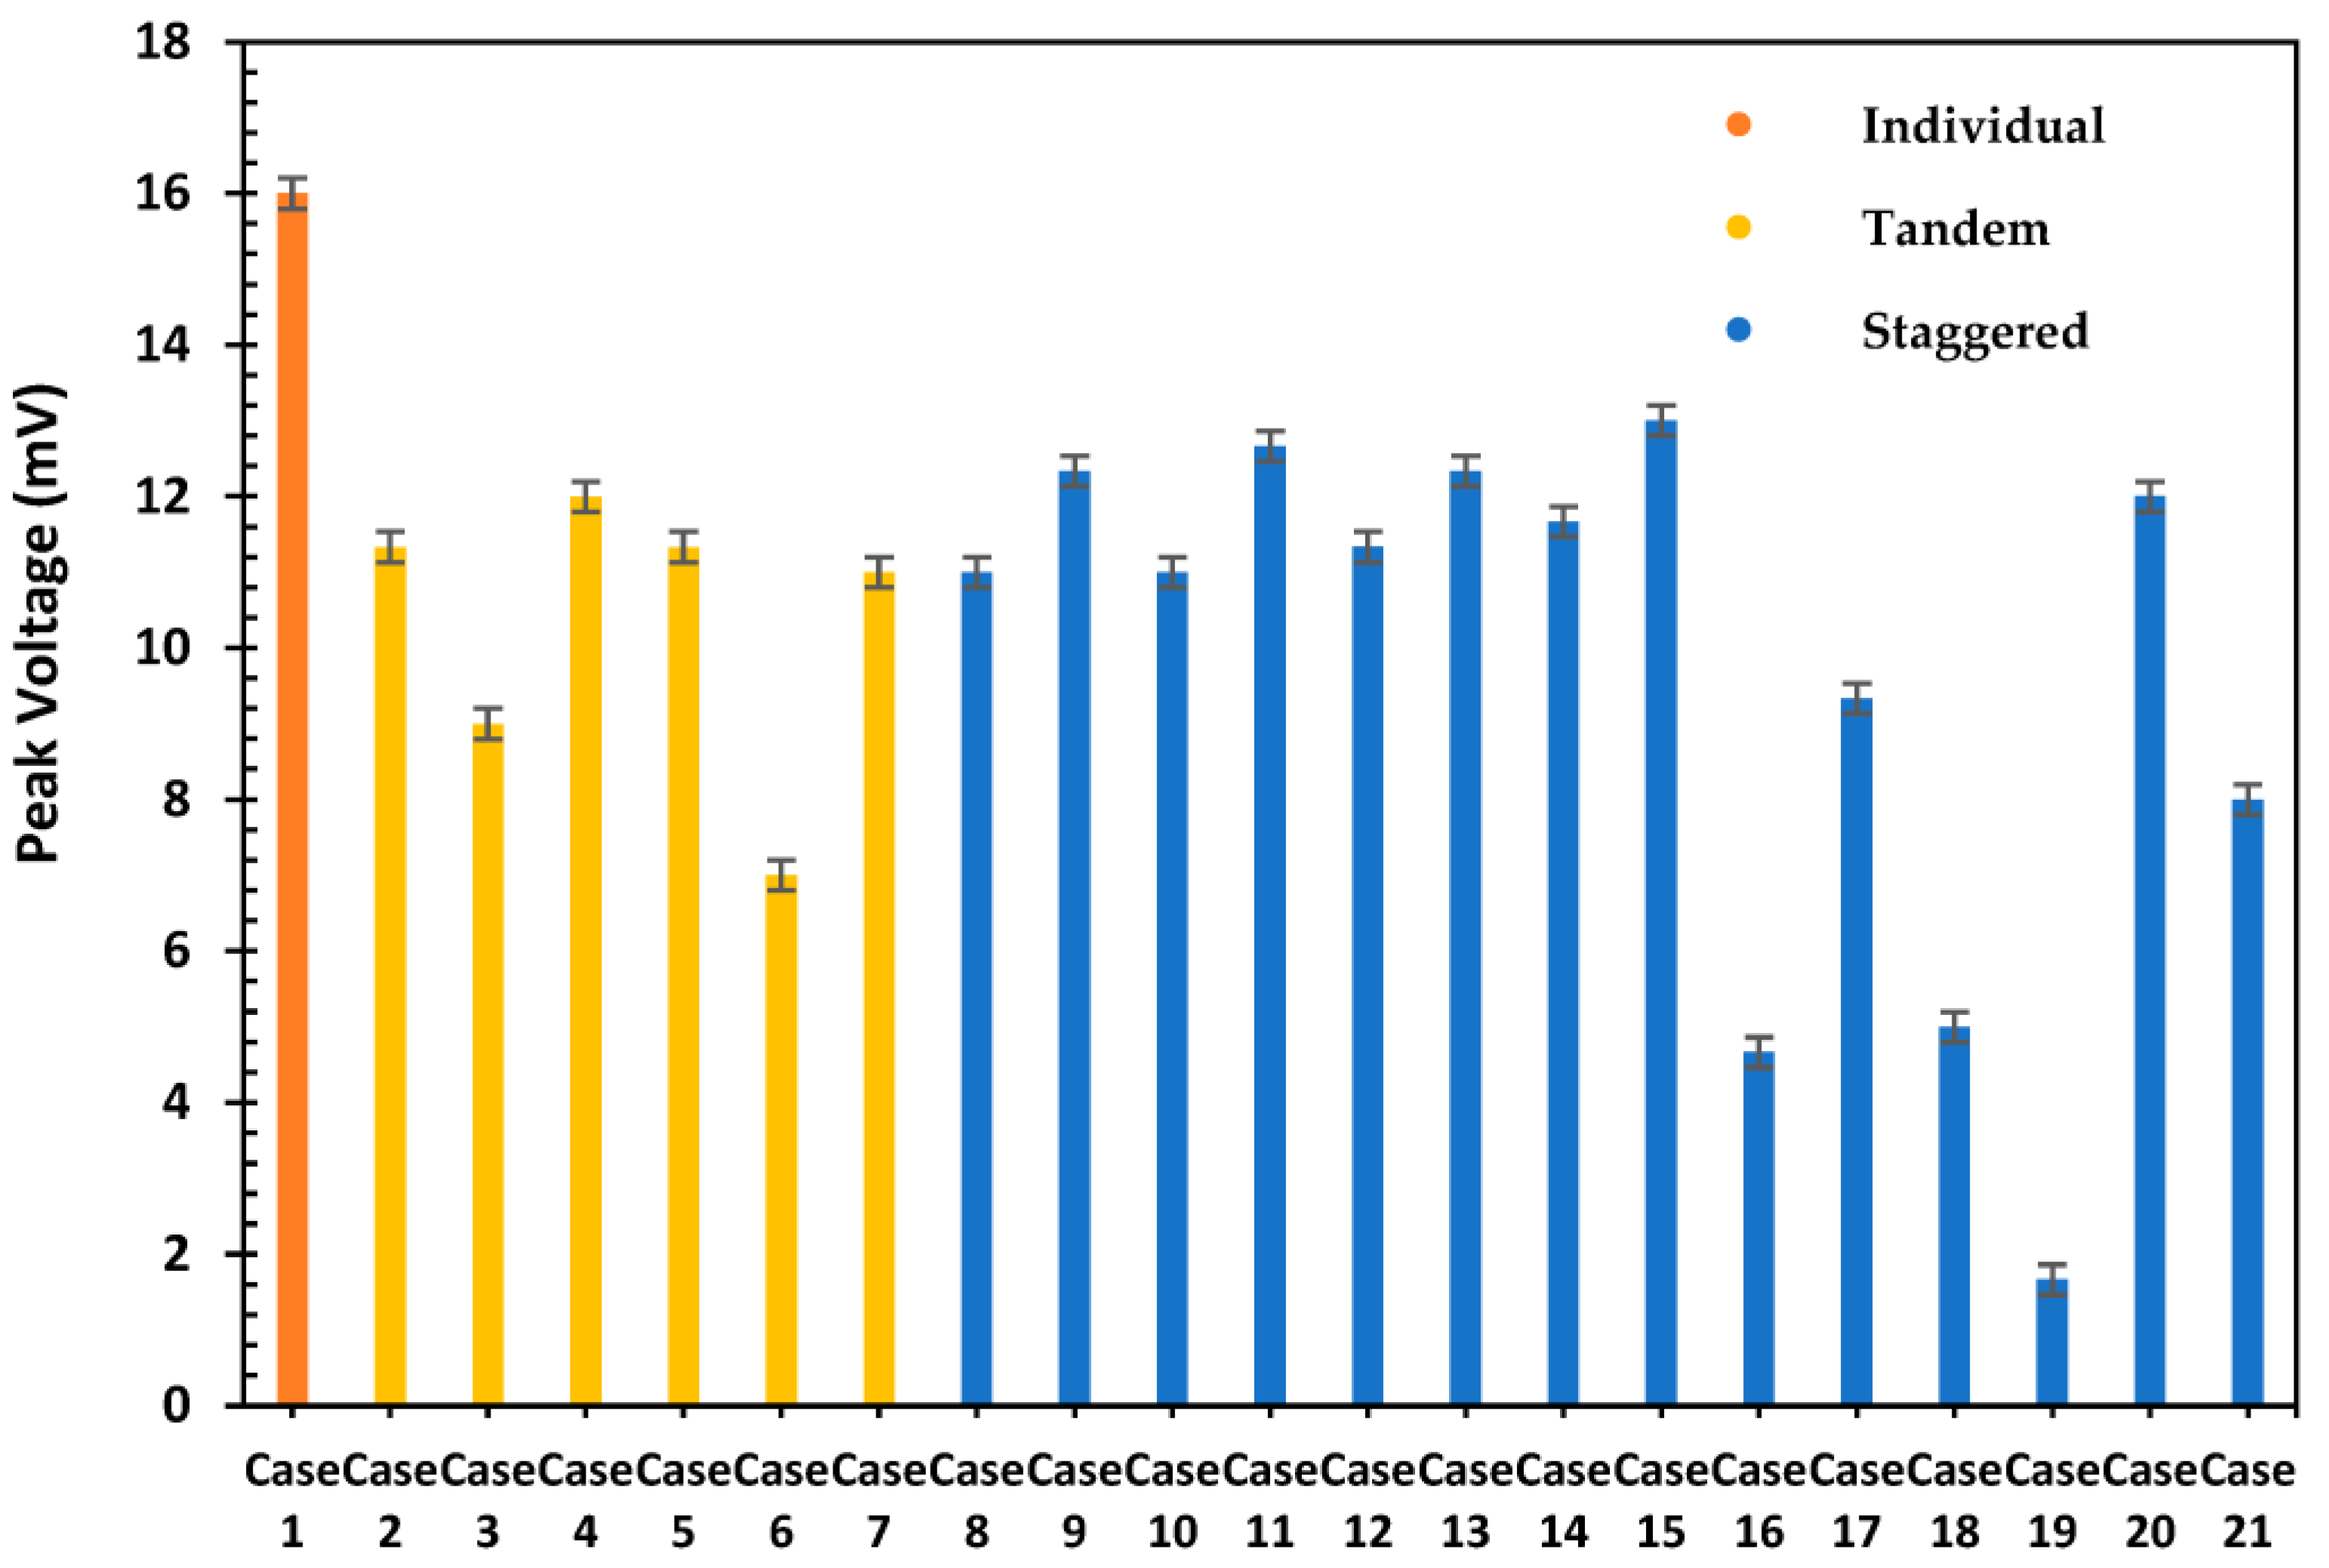
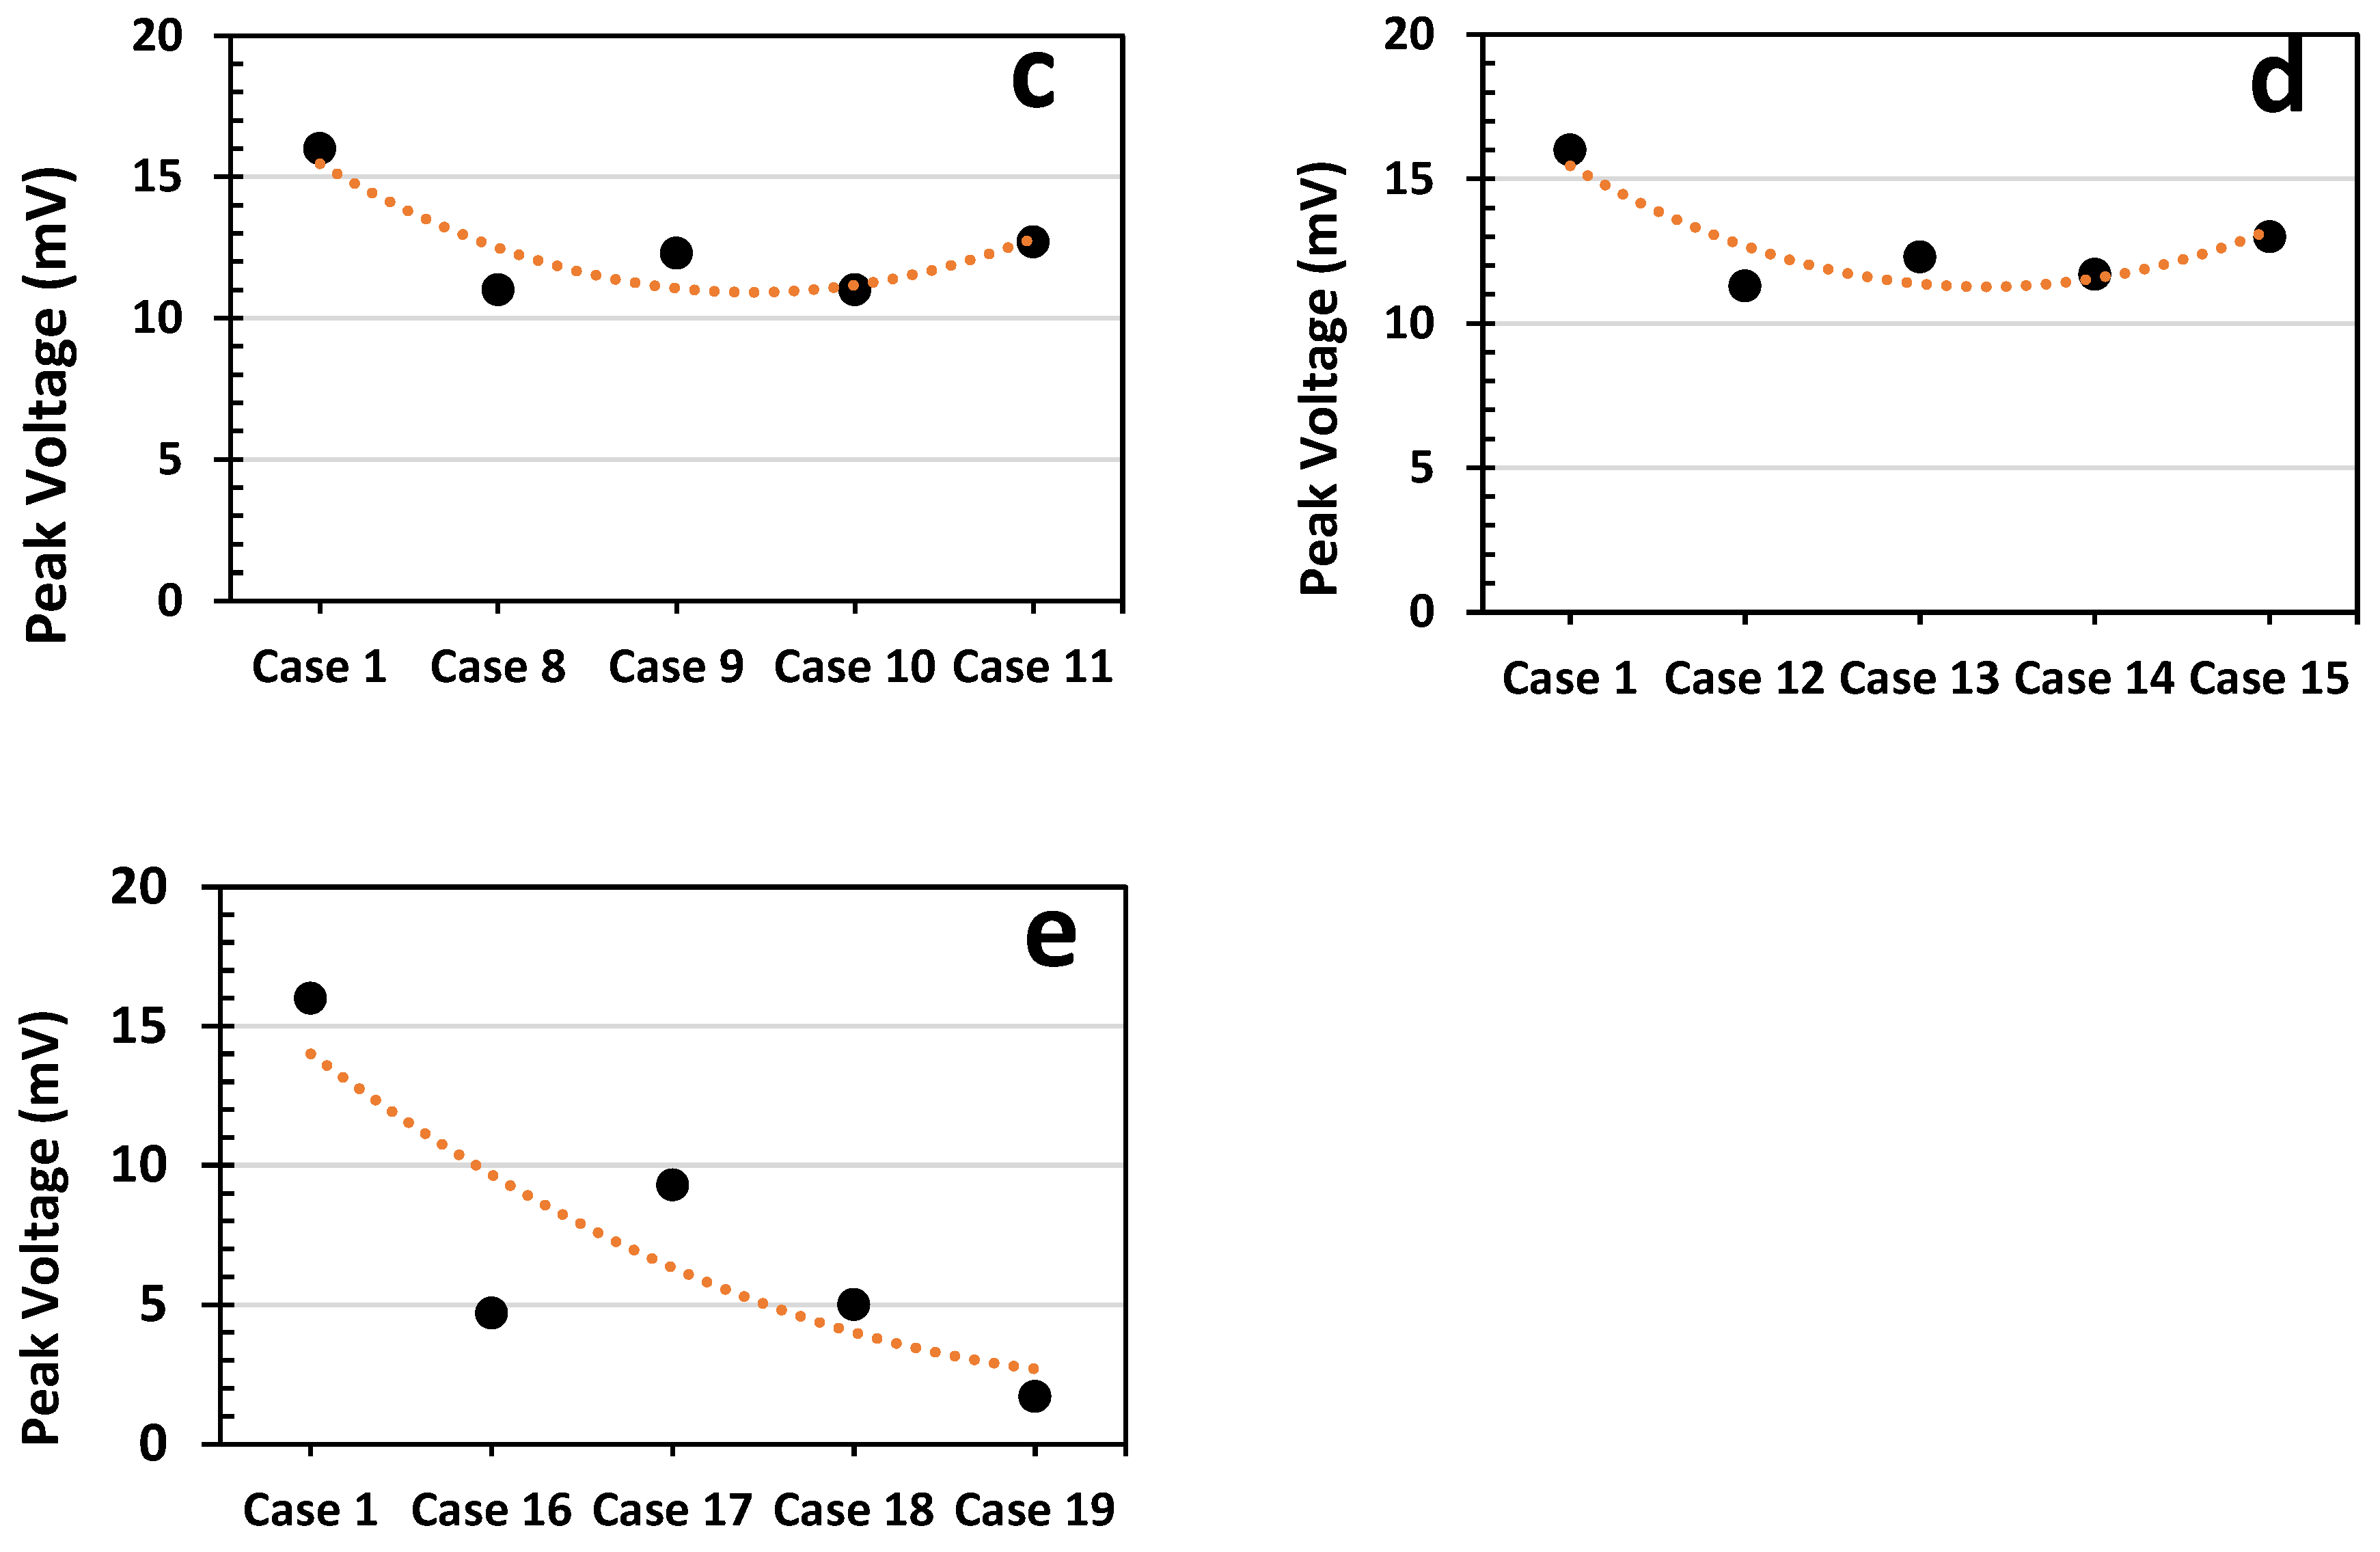
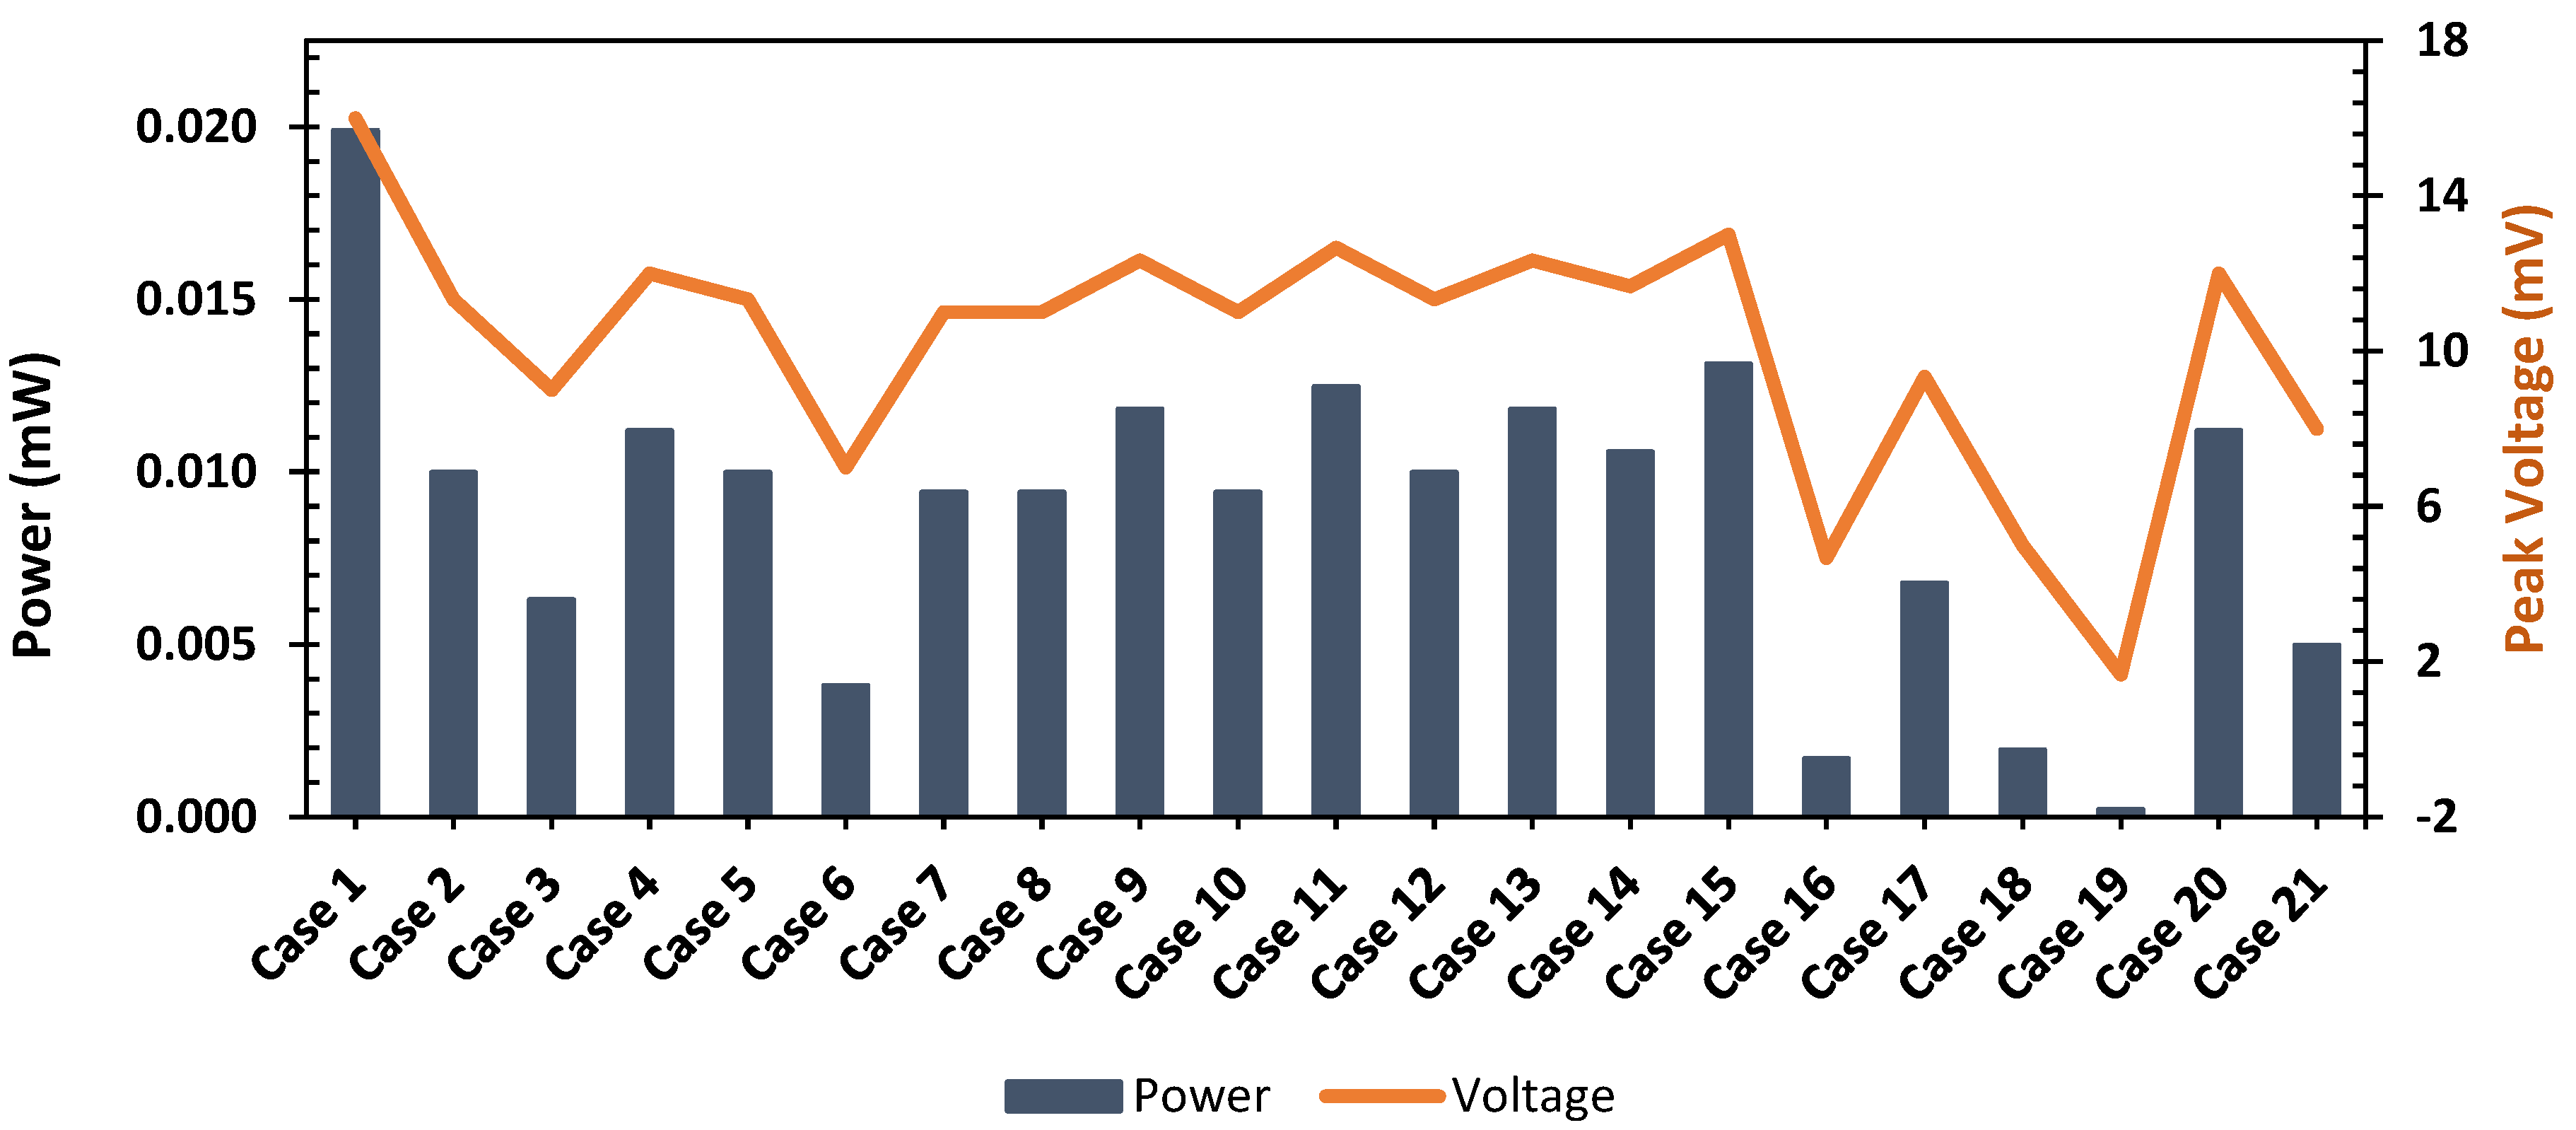
3.1.1. Voltage
3.1.2. System Power and Efficiency
3.1.3. Frequency and Amplitude
3.2. Energy Density
3.3. Wake Structure
4. Conclusions
Author Contributions
Funding
Institutional Review Board Statement
Informed Consent Statement
Data Availability Statement
Conflicts of Interest
Nomenclature
| Projected Area | ||
| Cylinder Diameter | ||
| Vortex Shedding Frequency | ||
| Electrical Current | ||
| Electrical Power | ||
| Electrical Power Induced by Device | ||
| Hydrokinetic Power of Water Flow | ||
| Volumetric Flow Rate | ||
| Electrical Resistance | ||
| Root Ratio | ||
| Reynolds Number | ||
| Strouhal Number | ||
| Flow Velocity | ||
| Voltage | ||
| Root-Mean-Square Voltage | ||
| Efficiency | ||
| Density | ||
| Porosity | ||
| Kinematic Viscosity |
References
- Chowdhury, M.S.; Rahman, K.S.; Selvanathan, V.; Nuthammachot, N.; Suklueng, M.; Mostafaeipour, A.; Habib, A.; Akhtaruzzaman; Amin, N.; Techato, K. Current trends and prospects of tidal energy technology. Environ. Dev. Sustain. 2021, 23, 8179–8194. [Google Scholar] [CrossRef] [PubMed]
- Penesis, I.; Hemer, M.; Cossu, R.; Nader, J.R.; Marsh, P.; Couzi, C.; Hayward, J.; Sayeef, S.; Osman, P.; Rosebrock, U. Tidal Energy in Australia: Assessing Resource and Feasibility in Australia’s Future Energy Mix; Australian Maritime College, University of Tasmania: Hobart, Australia, 2020. [Google Scholar]
- Neill, S.; Hemer, M.; Robins, P.E.; Griffiths, A.; Furnish, A.; Angeloudis, A. Tidal range resource of Australia. Renew. Energy 2021, 170, 683–692. [Google Scholar] [CrossRef]
- Feliciano, J.; Kazemi, A.; Carbajal, G.; Tutkun, M.; Bocanegra Evans, H.; Curet, O.; Castillo, L. Parametrization of Hydrodynamics of Mangrove Root-Inspired Model for Coastline Protection & Energy Harvesting. In Proceedings of the 70th Annual Meeting of the APS Division of Fluid Dynamics, Denver, CO, USA, 19–21 November 2017. [Google Scholar]
- Kazemi, A.; Parry, S.; Van de Riet, K.; Curet, O. The Effect of Porosity and Flexibility on the Hydrodynamics behind a Mangrove-like Root Model; American Physical Society Division of Fluid Dynamics: Boston, MA, USA, 2015. [Google Scholar]
- Roberts, A.; Thomas, B.; Sewell, P. Current tidal power technologies and their suitability for applications in coastal and marine areas. J. Ocean. Eng. Mar. Energy 2016, 2, 227–245. [Google Scholar] [CrossRef]
- Kazemi, A.; Van de Riet, K.; Curet, O. Hydrodynamics of mangrove-type root models: The effect of porosity, spacing ratio and flexibility. Bioinspiration Biomim. 2017, 12, 056003. [Google Scholar] [CrossRef] [PubMed]
- Aspinall, R. Mangroves in the Wild and in the Home Aquarium. Tropical Fish Hobbyist Magazine. 2020. Available online: https://www.tfhmagazine.com/articles/saltwater/mangroves-in-the-wild-and-in-the-home-aquarium-full-article (accessed on 6 September 2023).
- Gabbai, R.D.; Benaroya, H. An overview of modeling and experiments of vortex-induced vibration of circular cylinders. J. Sound Vib. 2005, 282, 575–616. [Google Scholar] [CrossRef]
- Kazemi, A. Volumetric PIV behind Mangrove-Type Root Models. In Proceedings of the APS Division of Fluid Dynamics, Denver, CO, USA, 19–21 November 2017. [Google Scholar]
- Kazemi, A.; Charris, E.C.; Gomez, D.; Evans, H.B.; Curet, O.; Castillo, L. Energy harvesting from the flow induced motion of flexible mangrove root-type models with different flexibilities. Authorea 2019. [CrossRef]
- Kazemi, A.; Curet, O.; Gómez, D.; Castillo, E.E. Energy Harvesting from the Tidal Currents Using A Mangrove-Like System. In Proceedings of the ASME 2020 39th International Conference on Ocean, Offshore and Arctic Engineering, Fort Lauderdale, FL, USA, 3–7 August 2020. [Google Scholar]
- Curet, O.; Kazemi, A.; Van de Riet, K. Drag coefficient and flow structure downstream of mangrove root-type models through PIV and direct force measurements. Phys. Rev. Fluids 2018, 3, 073801. [Google Scholar]
- Kazemi, A.; Evans, H.B.; Van de Riet, K.; Castillo, L.; Curet, O.M. Hydrodynamics of Mangrove Roots and its Applications in Coastal Protection. In Proceedings of the OCEANS 2018 MTS/IEEE Charleston, Charleston, SC, USA, 22–25 October 2018. [Google Scholar]
- Kazemi, A. Hydrodynamics of Mangrove Root-Type Models; Florida Atlantic University: Boca Raton, FL, USA, 2017. [Google Scholar]
- Kazemi, A.; Castillo, E.E.; Curet, O.; Hortensius, R.; Stamatios, P. Volumetric Three-Componential Velocity Measurements (V3V) of Flow Structure behind Mangrove-Root Type Models. In Proceedings of the ASME 2020 Fluids Engineering Division Summer Meeting, Orlando, FL, USA, 13–15 July 2020. [Google Scholar]
- Peng, Z.; Galvin, K.; Doroodchi, E. Influence of inclined plates on flow characteristics of a liquid-solid fluidised bed: A CFD-DEM study. Powder Technol. 2019, 343, 170–184. [Google Scholar] [CrossRef]
- Copper Wire-Electrical Resistance vs. Gauge. The Engineering Toolbox. 2008. Available online: https://www.engineeringtoolbox.com/copper-wire-d_1429.html (accessed on 6 September 2023).
- Wang, Z. A review on tidal power utilization and operation optimization. IOP Conf. Ser. Earth Environ. Sci. 2019, 240, 052015. [Google Scholar] [CrossRef]
- Blevins, R.D. The effect of sound on vortex shedding from cylinders. J. Fluid Mech. 1985, 161, 217–237. [Google Scholar] [CrossRef]
- Castillo, E.E.; Gomez Vazquez, D.O.; Kazemi, A.; Curet, O. Energy Harvesting from Mangrove-like Structure in Tandem and Staggered Arrangements. In Proceedings of the 72nd Annual Meeting of the APS Division of Fluid Dynamics, Seattle, WA, USA, 23–26 November 2019. [Google Scholar]
- Enevoldsen, P.; Jacobson, M. Data investigation of installed and output power densities of onshore and offshore wind turbines worldwide. Energy Sustain. Dev. 2021, 60, 40–51. [Google Scholar] [CrossRef]
- Miller, L.; Keith, D. Observation-based solar and wind power capacity factors and power densities. Environ. Res. Lett. 2018, 13, 104008. [Google Scholar] [CrossRef]
- Zhou, Y.; Alam, M. Wake of two interacting circular cylinders: A review. Int. J. Heat Fluid Flow 2016, 62, 510–537. [Google Scholar] [CrossRef]


| Case | Description | Flow Diagram (Not to Scale) | |||||
|---|---|---|---|---|---|---|---|
| 5 cm | 10 cm | 15 cm | 20 cm | ||||
| Singular | 1 | Individual device | →• | ||||
| Tandem | 2 | One cylinder 5 cm in front | →• | • | |||
| 3 | One cylinder 10 cm in front | →• | • | ||||
| 4 | One cylinder 15 cm in front | →• | • | ||||
| 5 | One cylinder 20 cm in front | →• | • | ||||
| 6 | Two cylinders 5 cm and 10 cm in front | →• | • | • | |||
| 7 | Two cylinders 10 cm and 15cm in front | →• | • | • | |||
| 8 | One cylinder 5 cm in front, staggered 1.25 cm | →• | • | ||||
| 9 | One cylinder 10 cm in front, staggered 1.25 cm | →• | • | ||||
| 10 | One cylinder 15 cm in front, staggered 1.25 cm | →• | • | ||||
| 11 | One cylinder 20 cm in front, staggered 1.25 cm | →• | • | ||||
| 12 | One cylinder 5 cm in front, staggered 2.5 cm | →• | • | ||||
| 13 | One cylinder 10 cm in front, staggered 2.5 cm | →• | • | ||||
| 14 | One cylinder 15 cm in front, staggered 2.5 cm | →• | • | ||||
| 15 | One cylinder 20 cm in front, staggered 2.5 cm | →• | • | ||||
| 16 | Two cylinders 5 cm in front, staggered 1.25 cm each | →• | |||||
| • | |||||||
| • | |||||||
| 17 | Two cylinders 10 cm in front, staggered 1.25 cm each | →• | |||||
| • | |||||||
| • | |||||||
| 18 | Two cylinders 15 cm in front, staggered 1.25 cm each | →• | |||||
| • | |||||||
| • | |||||||
| 19 | Two cylinders 20 cm in front, staggered 1.25 cm each | →• | |||||
| • | |||||||
| • | |||||||
| 20 | Two cylinders staggered 2.5 cm on opposite sides, 5 and 10 cm in front | →• | • | • | |||
| • | • | ||||||
| 21 | Two cylinders staggered 2.5 on opposite sides, 10 and 20 cm in front | →• | • | • | |||
| • | • | ||||||
Disclaimer/Publisher’s Note: The statements, opinions and data contained in all publications are solely those of the individual author(s) and contributor(s) and not of MDPI and/or the editor(s). MDPI and/or the editor(s) disclaim responsibility for any injury to people or property resulting from any ideas, methods, instructions or products referred to in the content. |
© 2023 by the authors. Licensee MDPI, Basel, Switzerland. This article is an open access article distributed under the terms and conditions of the Creative Commons Attribution (CC BY) license (https://creativecommons.org/licenses/by/4.0/).
Share and Cite
Zanganeh, J.; Gwynne, K.; Peng, Z.; Moghtaderi, B. Investigation of Hydrokinetic Tidal Energy Harvesting Using a Mangrove-Inspired Device. Sustainability 2023, 15, 15886. https://doi.org/10.3390/su152215886
Zanganeh J, Gwynne K, Peng Z, Moghtaderi B. Investigation of Hydrokinetic Tidal Energy Harvesting Using a Mangrove-Inspired Device. Sustainability. 2023; 15(22):15886. https://doi.org/10.3390/su152215886
Chicago/Turabian StyleZanganeh, Jafar, Kiva Gwynne, Zhengbiao Peng, and Behdad Moghtaderi. 2023. "Investigation of Hydrokinetic Tidal Energy Harvesting Using a Mangrove-Inspired Device" Sustainability 15, no. 22: 15886. https://doi.org/10.3390/su152215886