
Numerical and Experimental Investigation of a Compressive-Mode Hull Piezoelectric Energy Harvester under Impact Force

 , ,
, , 
Abstract
:1. Introduction
2. Numerical Analysis
3. Materials and Methods
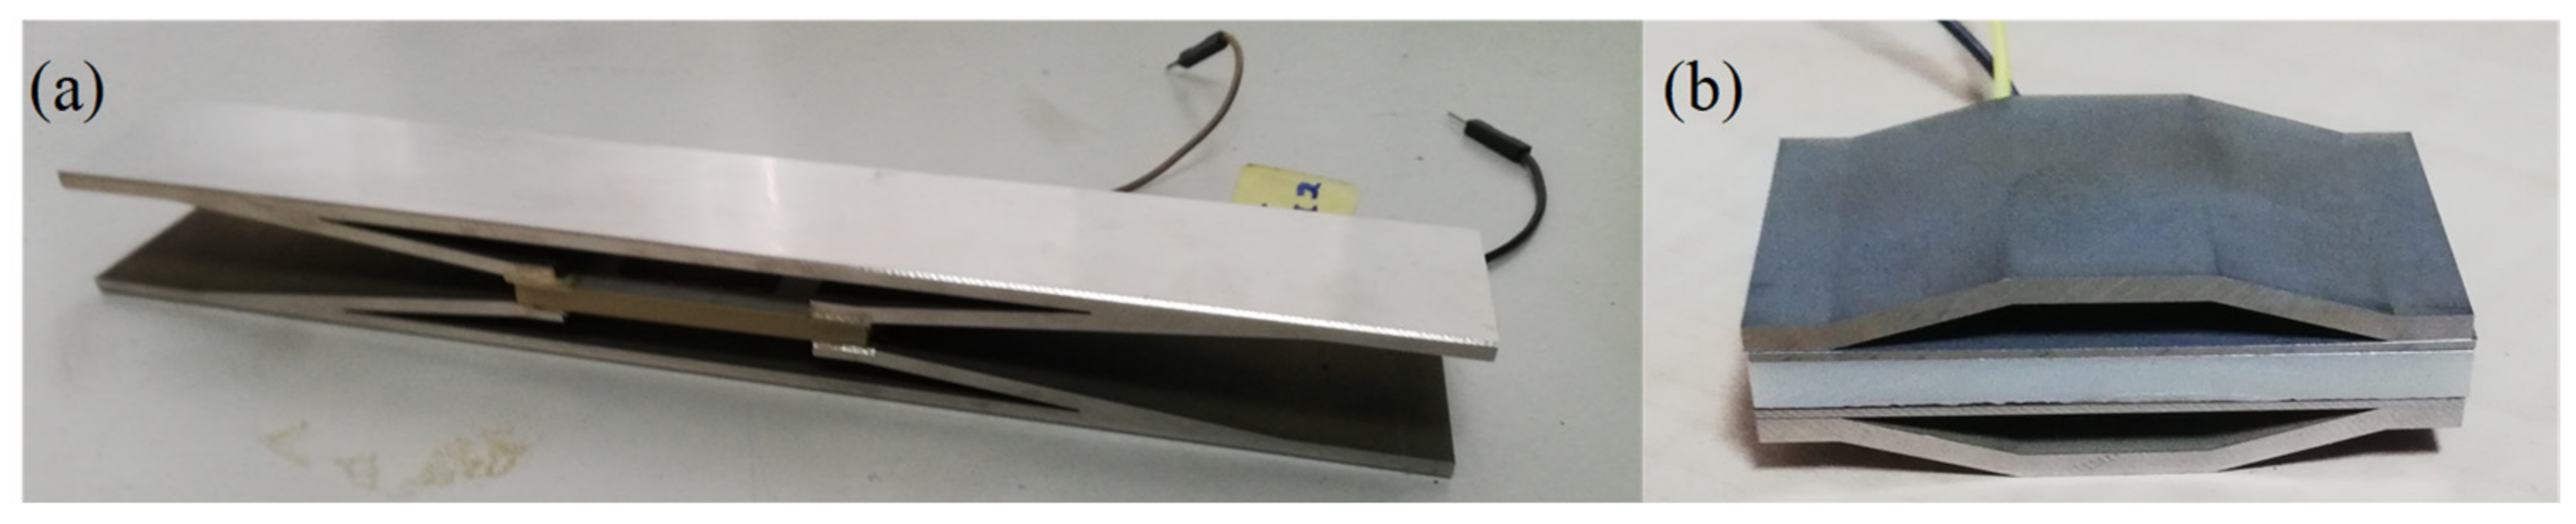
3.1. Fabrication
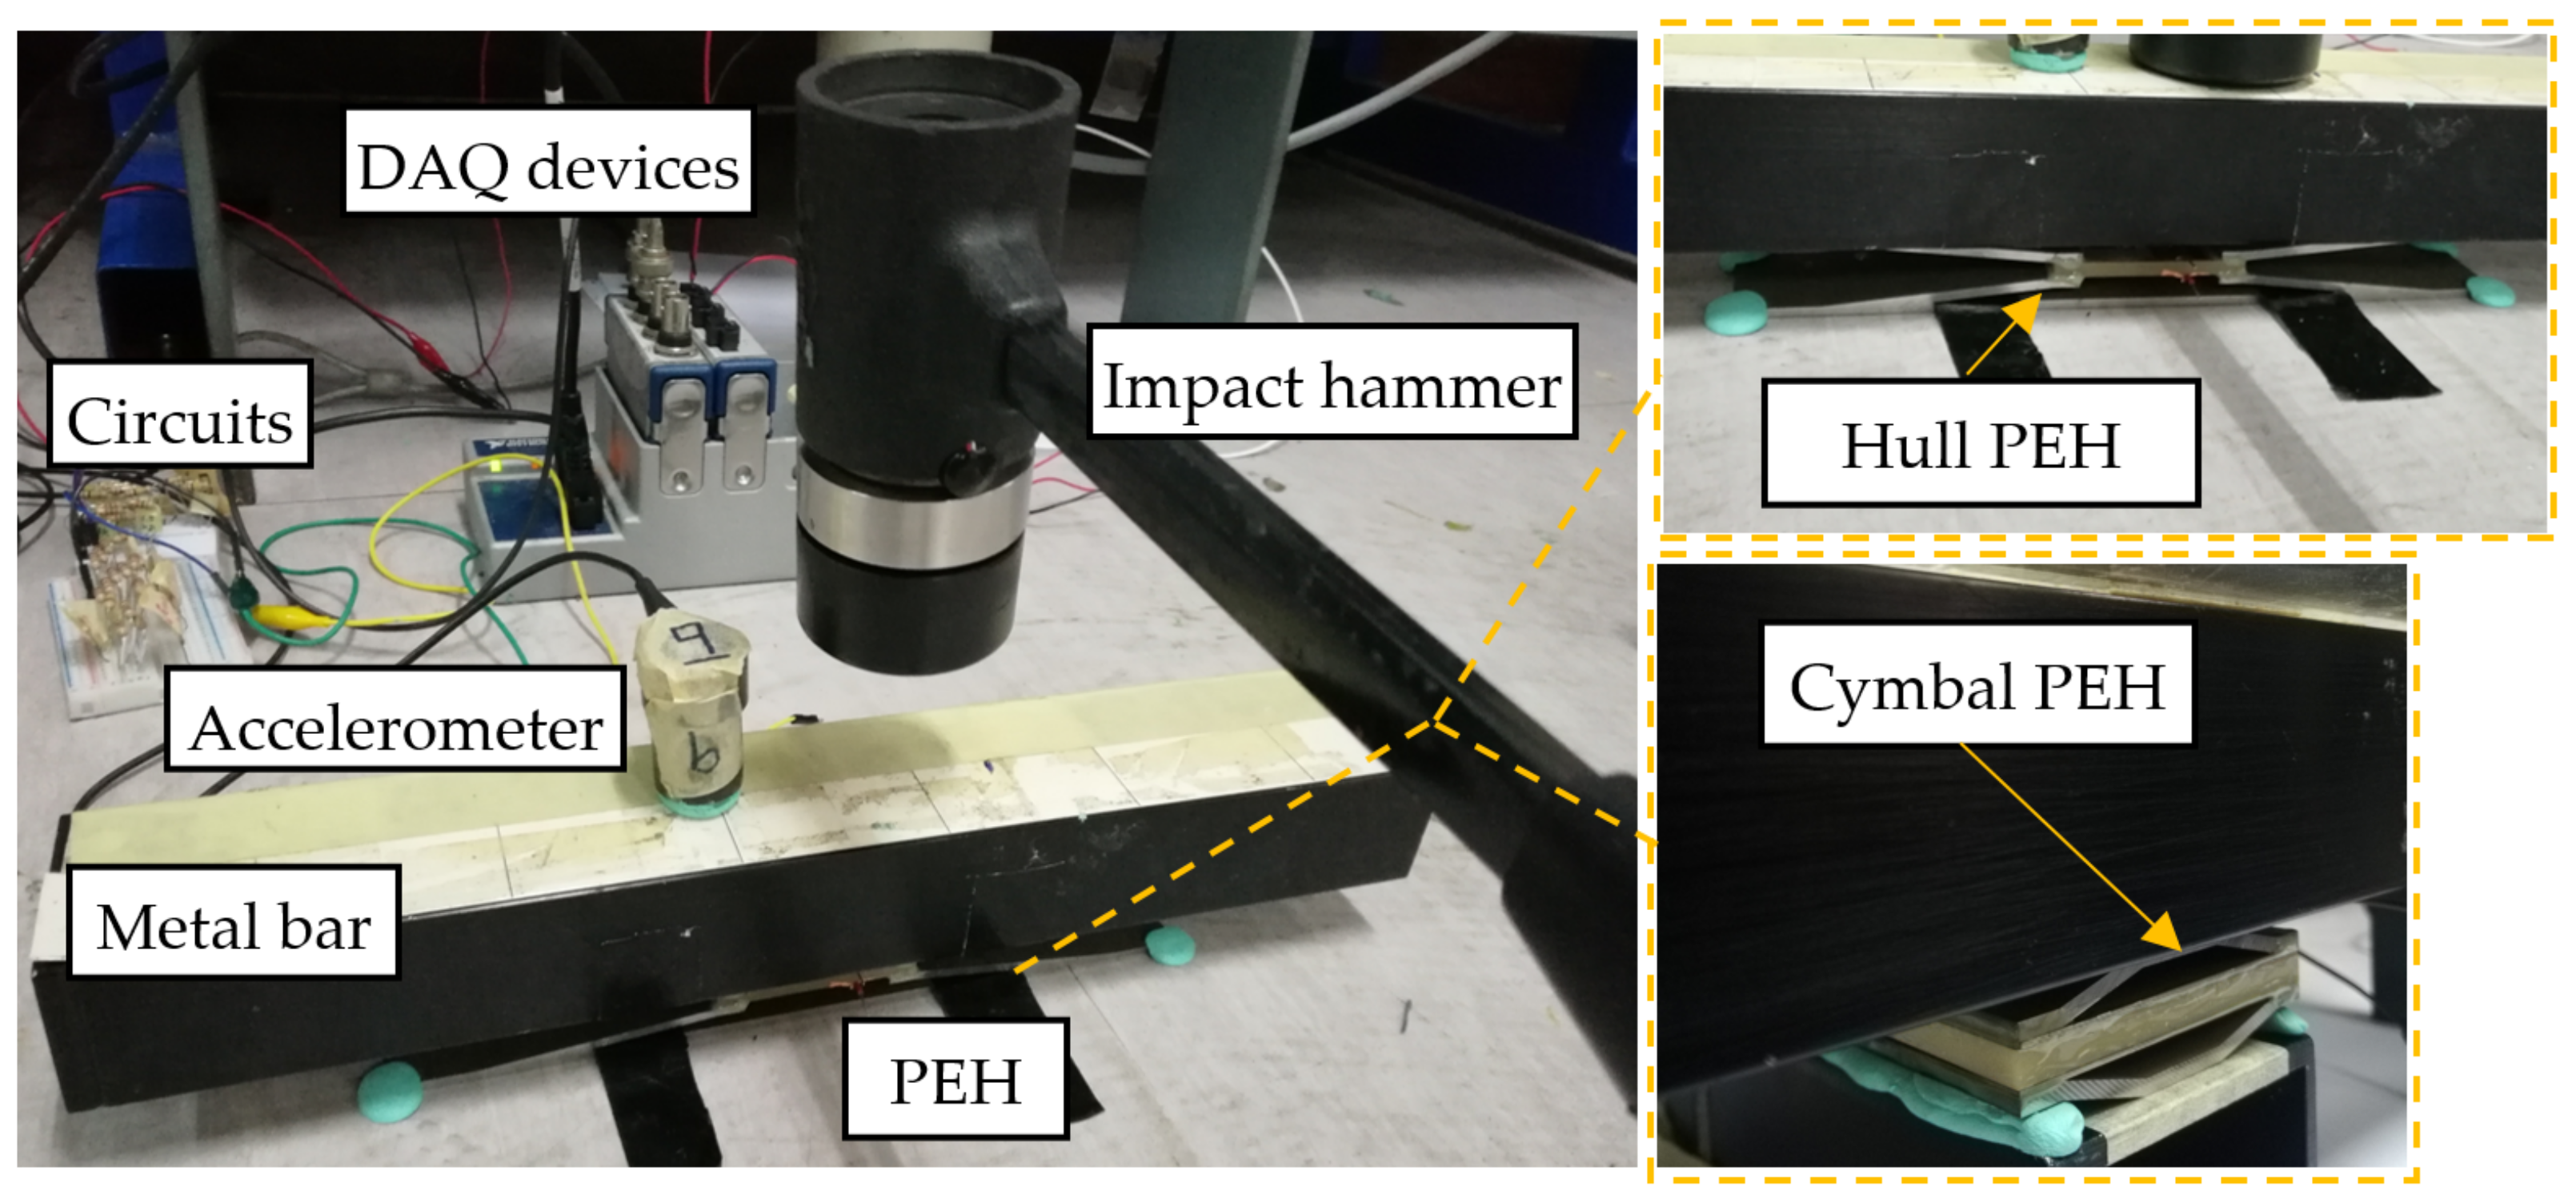
3.2. Experimental Setup
4. Experimental Results
4.1. Open-Circuit Voltage Test
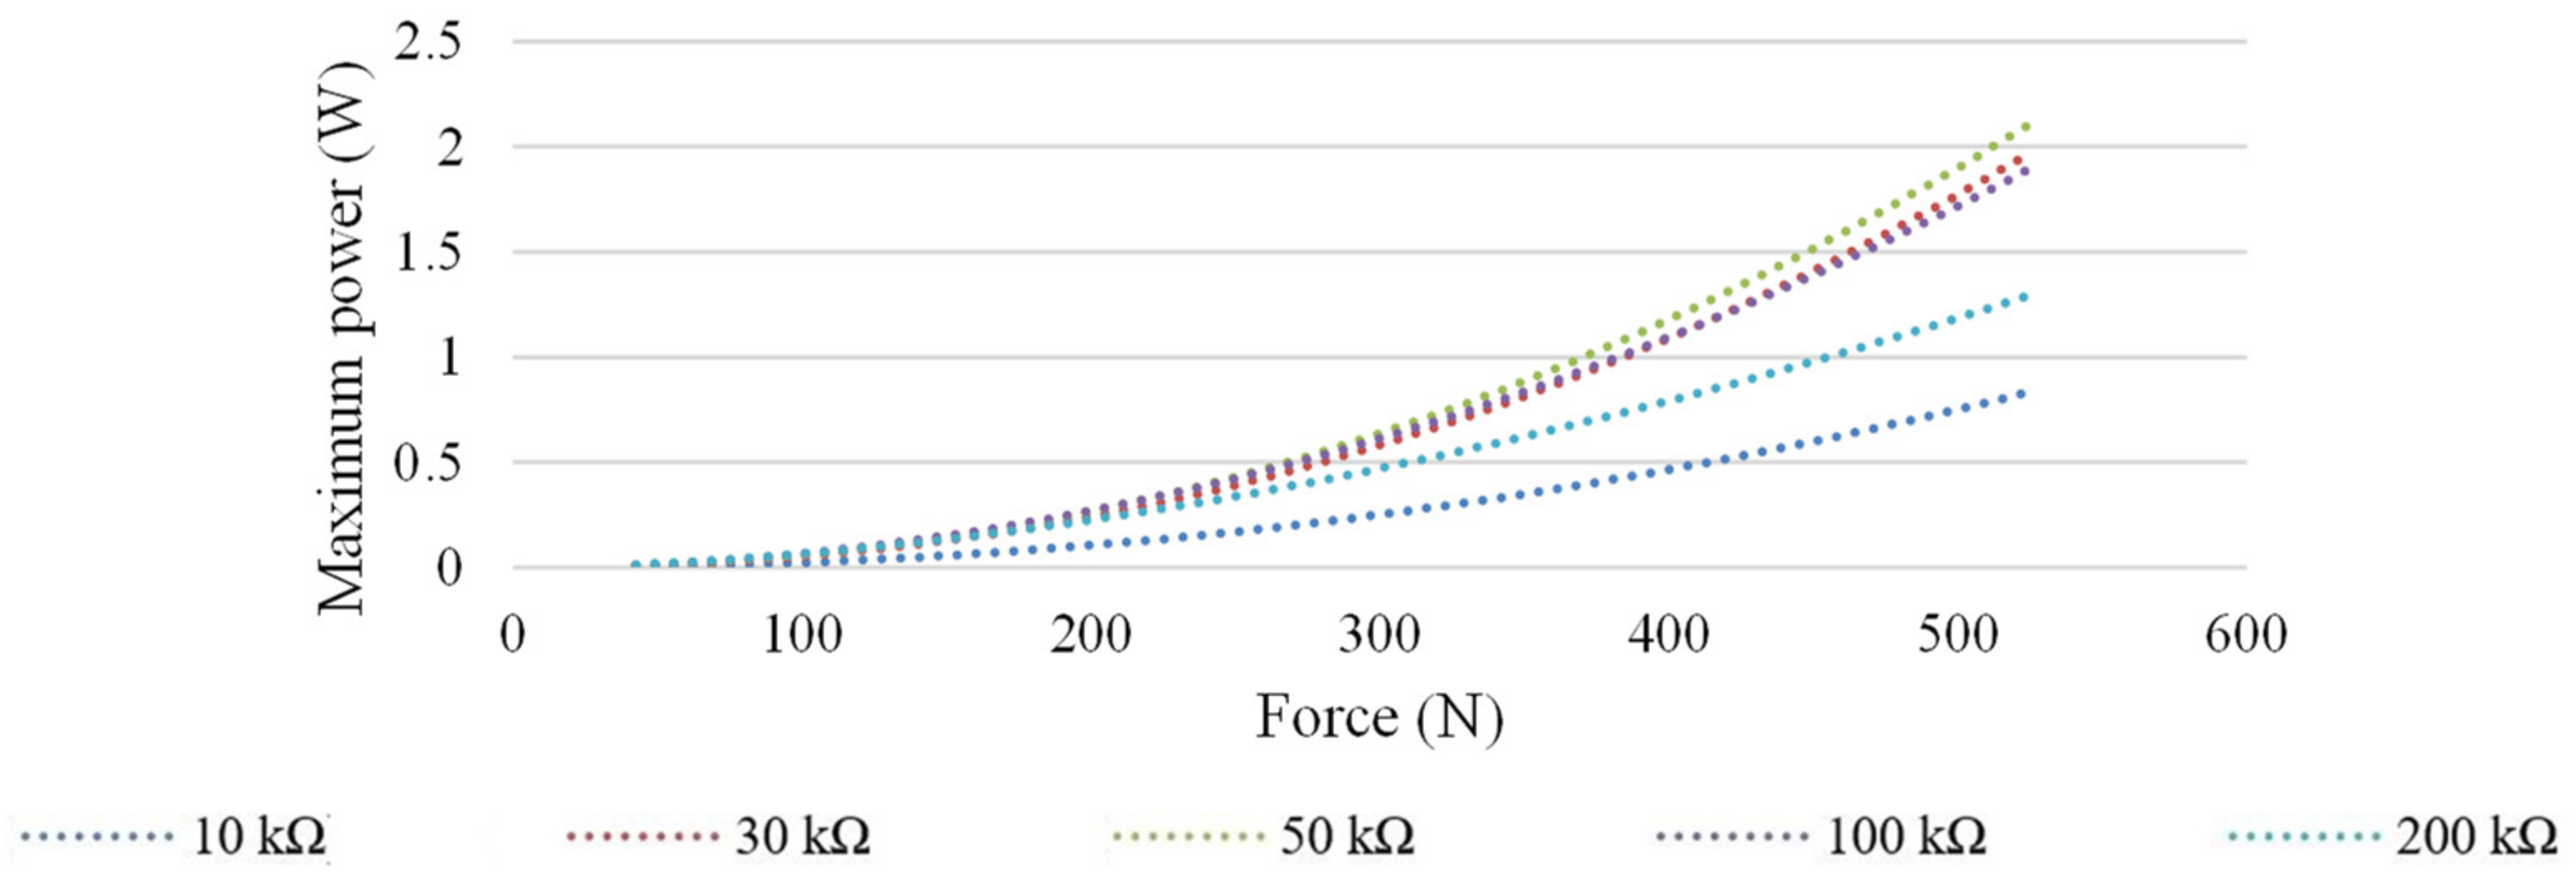
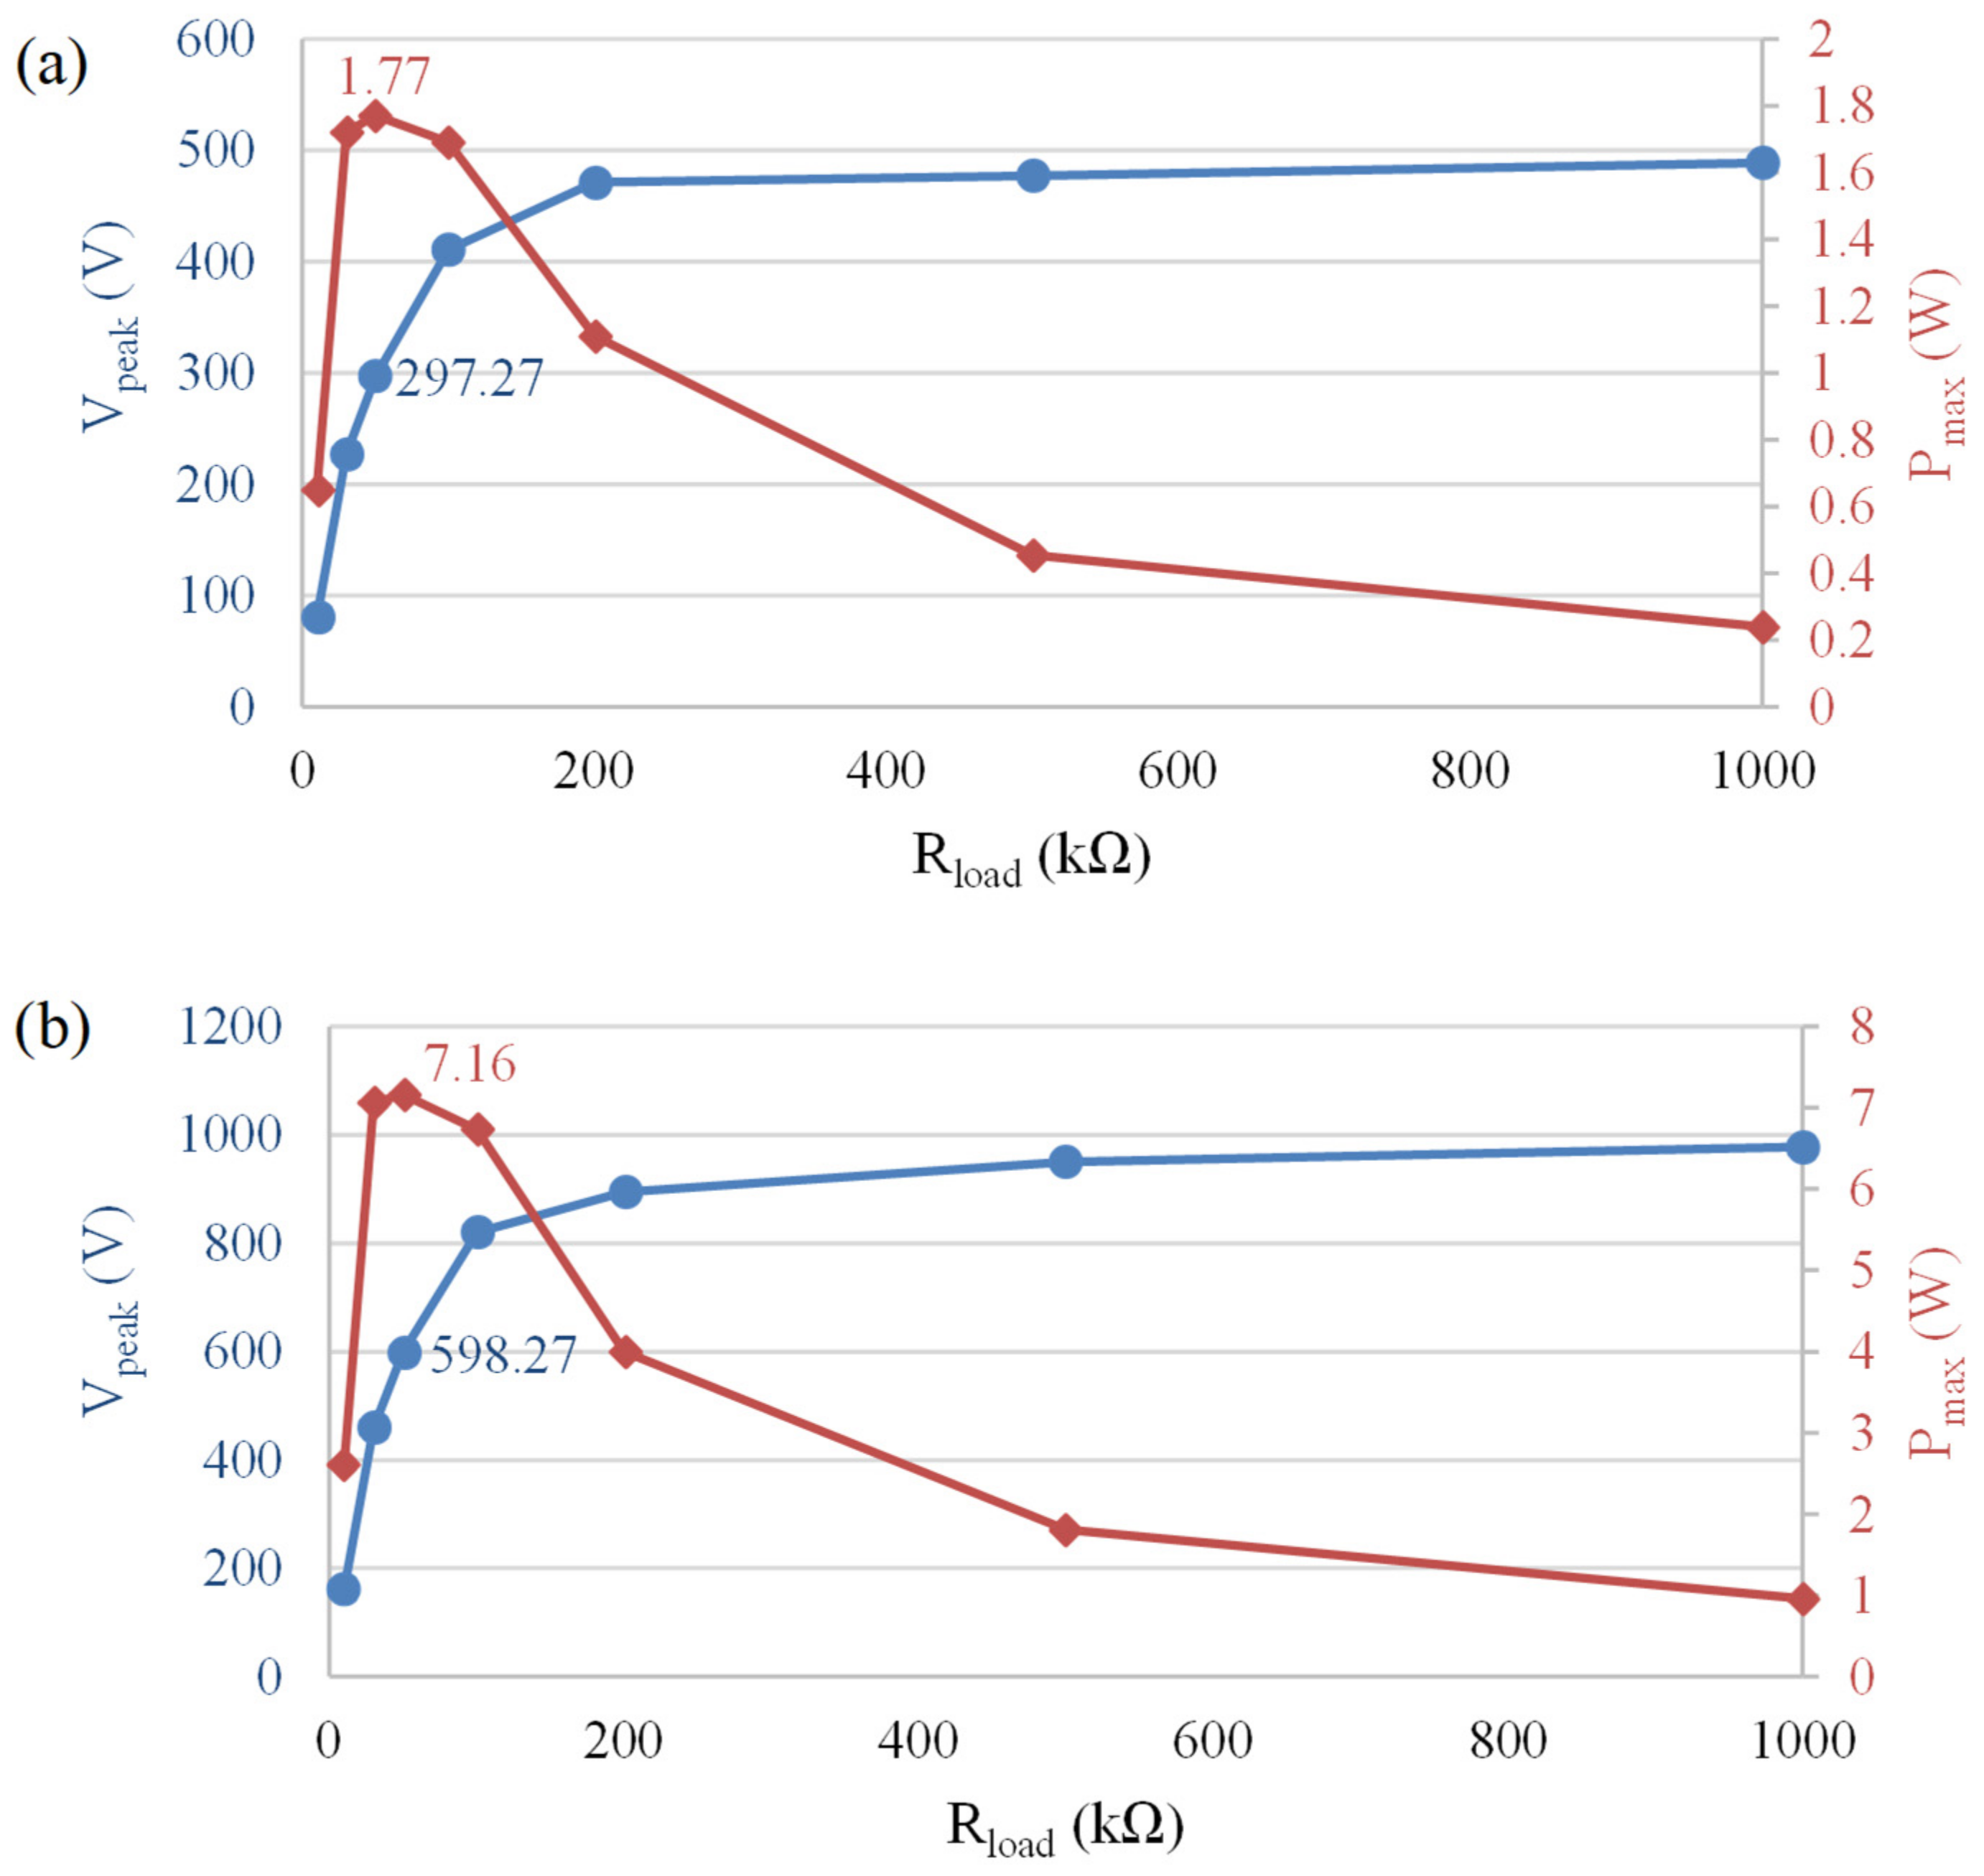
4.2. Power Output Test
4.3. FE Model Validation with Experimental Result and Further Simulation Analysis
4.4. Efficiency
5. Conclusions
Author Contributions
Funding
Institutional Review Board Statement
Informed Consent Statement
Data Availability Statement
Acknowledgments
Conflicts of Interest
References
- Ghenai, C.; Albawab, M.; Bettayeb, M. Sustainability indicators for renewable energy systems using multi-criteria decision-making model and extended SWARA/ARAS hybrid method. Renew. Energy 2020, 146, 580–597. [Google Scholar] [CrossRef]
- Evans, A.; Strezov, V.; Evans, T.J. Assessment of sustainability indicators for renewable energy technologies. Renew. Sustain. Energy Rev. 2009, 13, 1082–1088. [Google Scholar] [CrossRef]
- Østergaard, P.A.; Duic, N.; Noorollahi, Y.; Kalogirou, S. Renewable energy for sustainable development. Renew. Energy 2022, 199, 1145–1152. [Google Scholar] [CrossRef]
- Viet, N.V.; Xie, X.D.; Liew, K.M.; Banthia, N.; Wang, Q. Energy harvesting from ocean waves by a floating energy harvester. Energy 2016, 112, 1219–1226. [Google Scholar] [CrossRef]
- Kaur, N.; Mahesh, D.; Singamsetty, S. An experimental study on piezoelectric energy harvesting from wind and ambient structural vibrations for wireless structural health monitoring. Adv. Struct. Eng. 2020, 23, 1010–1023. [Google Scholar] [CrossRef]
- Li, C.; Liu, S.; Zhao, H.; Tian, Y. Performance Assessment and Comparison of Two Piezoelectric Energy Harvesters Developed for Pavement Application: Case Study. Sustainability 2022, 14, 863. [Google Scholar] [CrossRef]
- Wang, L.; Fei, Z.; Qi, Y.; Zhang, C.; Zhao, L.; Jiang, Z.; Maeda, R. Overview of Human Kinetic Energy Harvesting and Application. ACS Appl. Energy Mater. 2022, 5, 7091–7114. [Google Scholar] [CrossRef]
- Turkmen, A.C.; Celik, C. Energy harvesting with the piezoelectric material integrated shoe. Energy 2018, 150, 556–564. [Google Scholar] [CrossRef]
- Yingyong, P.; Thainiramit, P.; Jayasvasti, S.; Thanach-Issarasak, N.; Isarakorn, D. Evaluation of harvesting energy from pedestrians using piezoelectric floor tile energy harvester. Sens. Actuators A Phys. 2021, 331, 113035. [Google Scholar] [CrossRef]
- Sharma, S.; Kiran, R.; Azad, P.; Vaish, R. A review of piezoelectric energy harvesting tiles: Available designs and future perspective. Energy Convers. Manag. 2022, 254, 115272. [Google Scholar] [CrossRef]
- Cao, Y.; Sha, A.; Liu, Z.; Li, J.; Jiang, W. Energy output of piezoelectric transducers and pavements under simulated traffic load. J. Clean. Prod. 2021, 279, 123508. [Google Scholar] [CrossRef]
- Mota, B.C.; Neto, B.A.; Barroso, S.H.A.; Aragão, F.T.S.; Ferreira, A.J.L.; Soares, J.B.; Brito, L.A.T. Characterization of Piezoelectric Energy Production from Asphalt Pavements Using a Numerical-Experimental Framework. Sustainability 2022, 14, 9584. [Google Scholar] [CrossRef]
- Sheng, W.; Xiang, H.; Zhang, Z.; Yuan, X. High-efficiency piezoelectric energy harvester for vehicle-induced bridge vibrations: Theory and experiment. Compos. Struct. 2022, 299, 116040. [Google Scholar] [CrossRef]
- Yang, C.C.; Bin Noor Hanafi, N.F.R.; Bt Mohamad Hanif, N.H.H.; Ismail, A.F.; Chang, H.-H. A Novel Non-Intrusive Vibration Energy Harvesting Method for Air Conditioning Compressor Unit. Sustainability 2021, 13, 10300. [Google Scholar] [CrossRef]
- Zhang, L.; Zhang, F.; Qin, Z.; Han, Q.; Wang, T.; Chu, F. Piezoelectric energy harvester for rolling bearings with capability of self-powered condition monitoring. Energy 2022, 238, 121770. [Google Scholar] [CrossRef]
- Zhang, L.; Qin, L.; Qin, Z.; Chu, F. Energy harvesting from gravity-induced deformation of rotating shaft for long-term monitoring of rotating machinery. Smart Mater. Struct. 2022, 31, 125008. [Google Scholar] [CrossRef]
- Shan, X.; Tian, H.; Chen, D.; Xie, T. A curved panel energy harvester for aeroelastic vibration. Appl. Energy 2019, 249, 58–66. [Google Scholar] [CrossRef]
- Molino-Minero-Re, E.; Carbonell-Ventura, M.; Fisac-Fuentes, C.; Mànuel-Làzaro, A.; Toma, D.M. Piezoelectric energy harvesting from induced vortex in water flow. In Proceedings of the 2012 IEEE International Instrumentation and Measurement Technology Conference Proceedings, Graz, Austria, 13–16 May 2012; pp. 624–627. [Google Scholar]
- Huet, F.; Boitier, V.; Seguier, L. Tunable Piezoelectric Vibration Energy Harvester With Supercapacitors for WSN in an Industrial Environment. IEEE Sens. J. 2022, 22, 15373–15384. [Google Scholar] [CrossRef]
- Jettanasen, C.; Songsukthawan, P.; Ngaopitakkul, A. Development of Micro-Mobility Based on Piezoelectric Energy Harvesting for Smart City Applications. Sustainability 2020, 12, 2933. [Google Scholar] [CrossRef]
- Castillo-Mingorance, J.M.; Sol-Sánchez, M.; Moreno-Navarro, F.; Rubio-Gámez, M.C. A Critical Review of Sensors for the Continuous Monitoring of Smart and Sustainable Railway Infrastructures. Sustainability 2020, 12, 9428. [Google Scholar] [CrossRef]
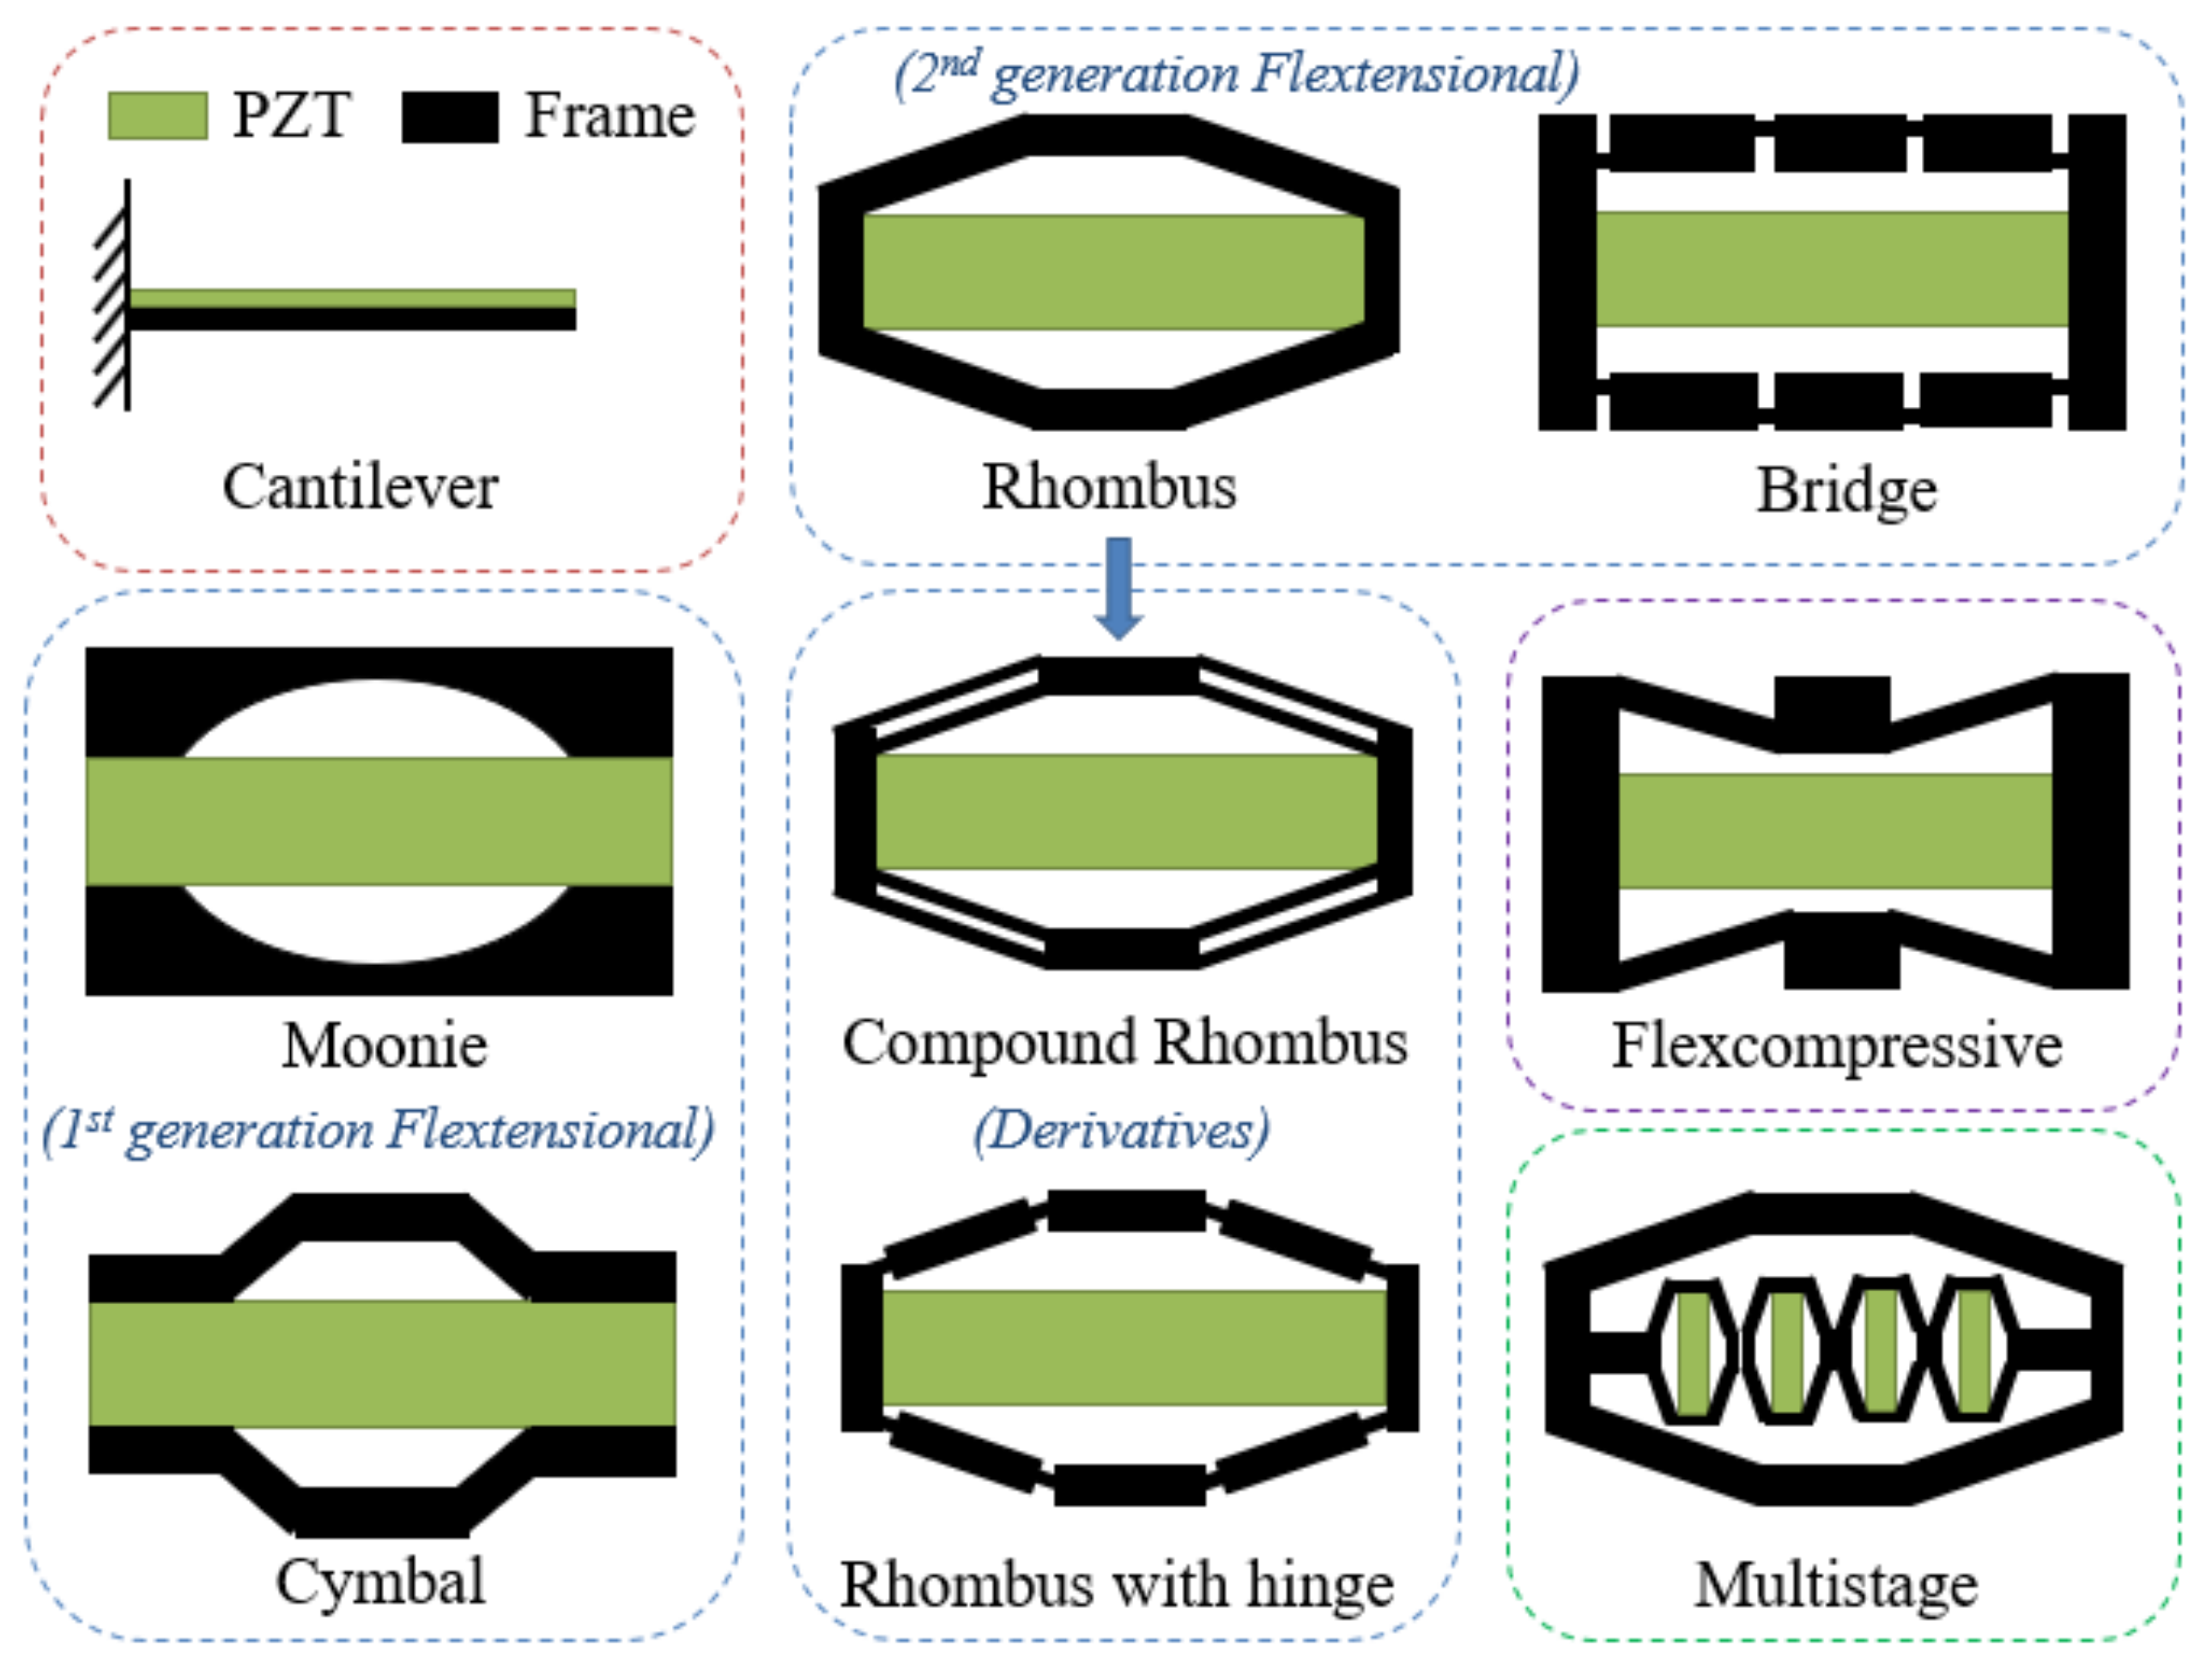
- Long, S.X.; Khoo, S.Y.; Ong, Z.C.; Soong, M.F.; Huang, Y.-H.; Prasath, N.; Noroozi, S. A comprehensive review on mechanical amplifier structures in piezoelectric energy harvesters. Mech. Adv. Mater. Struct. 2023, 1–30. [Google Scholar] [CrossRef]
- Zhao, H.; Yu, J.; Ling, J. Finite element analysis of Cymbal piezoelectric transducers for harvesting energy from asphalt pavement. J. Ceram. Soc. Jpn. 2010, 118, 909–915. [Google Scholar] [CrossRef]
- Bejarano, F.; Feeney, A.; Lucas, M. A cymbal transducer for power ultrasonics applications. Sens. Actuators A Phys. 2014, 210, 182–189. [Google Scholar] [CrossRef]
- Wu, Z.; Xu, Q. Design and testing of a novel bidirectional energy harvester with single piezoelectric stack. Mech. Syst. Signal Process. 2019, 122, 139–151. [Google Scholar] [CrossRef]
- Wen, S.; Xu, Q.; Zi, B. Design of a New Piezoelectric Energy Harvester Based on Compound Two-Stage Force Amplification Frame. IEEE Sens. J. 2018, 18, 3989–4000. [Google Scholar] [CrossRef]
- Feenstra, J.; Granstrom, J.; Sodano, H. Energy harvesting through a backpack employing a mechanically amplified piezoelectric stack. Mech. Syst. Signal Process. 2008, 22, 721–734. [Google Scholar] [CrossRef]
- Kuang, Y.; Chew, Z.J.; Zhu, M. Strongly coupled piezoelectric energy harvesters: Finite element modelling and experimental validation. Energy Convers. Manag. 2020, 213, 112855. [Google Scholar] [CrossRef]
- Long, S.X.; Khoo, S.Y.; Ong, Z.C.; Soong, M.F. Design, modeling and testing of a new compressive amplifier structure for piezoelectric harvester. Smart Mater. Struct. 2021, 30, 125010. [Google Scholar] [CrossRef]
- Wen, S.; Xu, Q. Design of a two-stage force amplification frame for piezoelectric energy harvesting. In Proceedings of the 2017 IEEE International Conference on Cybernetics and Intelligent Systems (CIS) and IEEE Conference on Robotics, Automation and Mechatronics (RAM), Ningbo, China, 19–21 November 2017; pp. 490–495. [Google Scholar]
- Wang, Y.; Chen, W.; Guzman, P. Piezoelectric stack energy harvesting with a force amplification frame: Modeling and experiment. J. Intell. Mater. Syst. Struct. 2016, 27, 2324–2332. [Google Scholar] [CrossRef]
- Kuang, Y.; Daniels, A.; Zhu, M. A sandwiched piezoelectric transducer with flex end-caps for energy harvesting in large force environments. J. Phys. D Appl. Phys. 2017, 50, 345501. [Google Scholar] [CrossRef]
- Kuang, Y.; Chew, Z.J.; Dunville, J.; Sibson, J.; Zhu, M. Strongly coupled piezoelectric energy harvesters: Optimised design with over 100 mW power, high durability and robustness for self-powered condition monitoring. Energy Convers. Manag. 2021, 237, 114129. [Google Scholar] [CrossRef]
- Avvari, P.V.; Yang, Y.; Soh, C.K. Long-term fatigue behavior of a cantilever piezoelectric energy harvester. J. Intell. Mater. Syst. Struct. 2016, 28, 1188–1210. [Google Scholar] [CrossRef]
- Long, S.X.; Khoo, S.Y.; Ong, Z.C.; Soong, M.F. Stress enhancement of a trapezoidal bridge piezoelectric transducer in high force environment. Ferroelectrics 2021, 573, 23–41. [Google Scholar] [CrossRef]


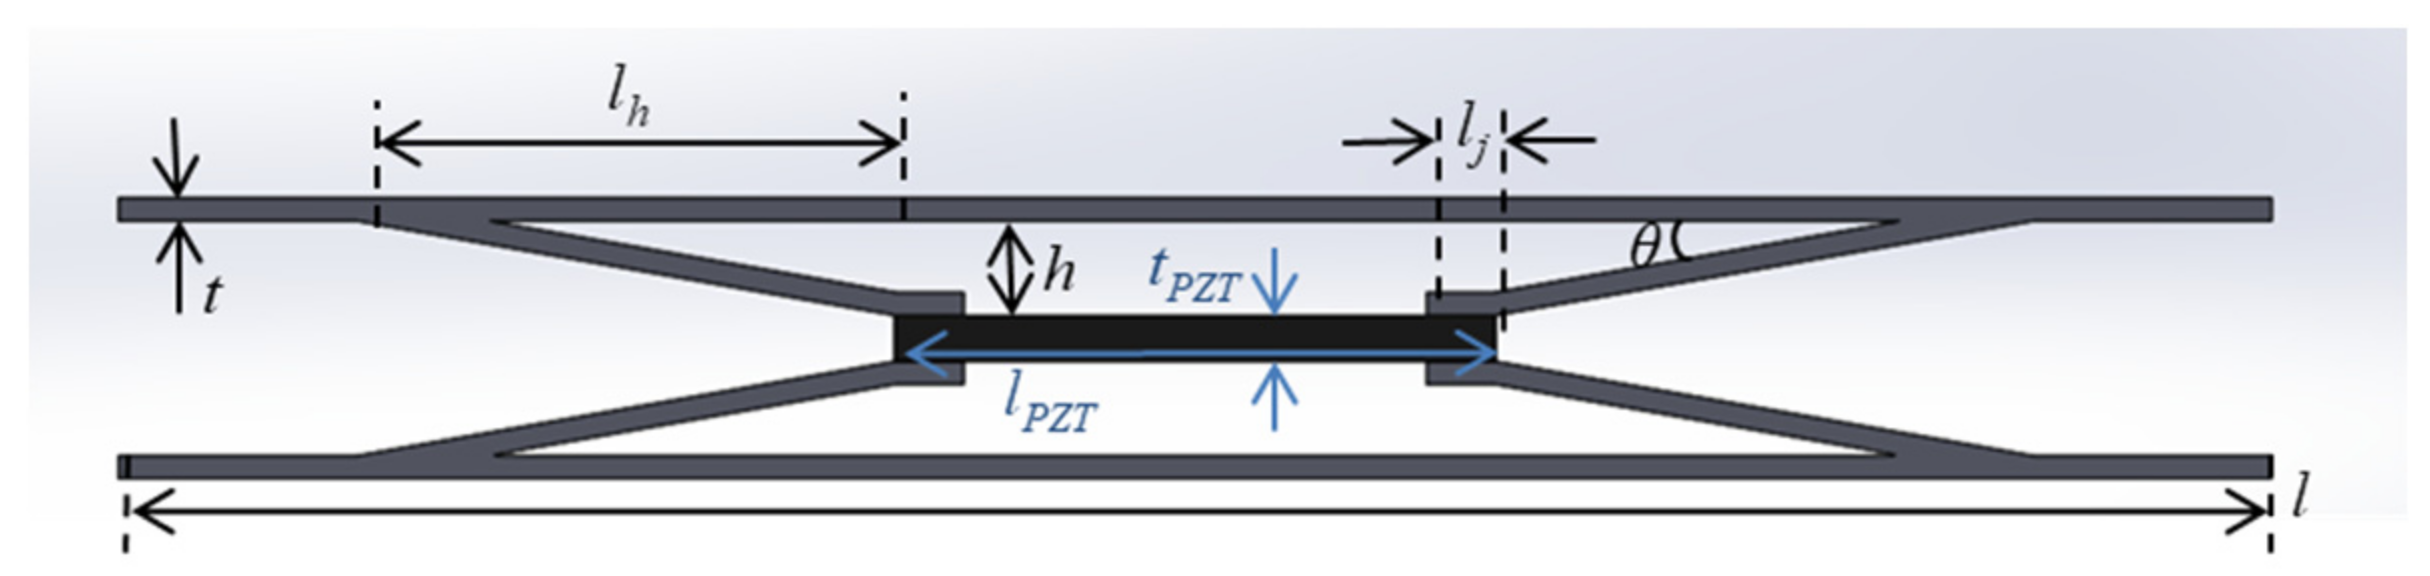
| Parameters | Symbol | Hull PEH [29] | Cymbal PEH [32] |
|---|---|---|---|
| PZT length (mm) | lPZT | 52 | 52 |
| PZT thickness (mm) | tPZT | 4 | 4 |
| Width (mm) | w | 30 | 30 |
| Frame length (mm) | l | 186 | 52 |
| Frame thickness (mm) | t | 2 | 2 |
| Cavity height (mm) | h | 4.9 | 3.5 |
| Horizontal linkage length (mm) | lh | 46.5 | 18 |
| Joint length (mm) | lj | 7 | 6 |
| Inclined angle (°) | θ | 6 | 15 |
| Apex length (mm) | la | - | 14 |
| Substrate thickness (mm) | ts | - | 0.6 |
| Parameters | Symbols | Values | |
|---|---|---|---|
| Density (kg/m3) | ρ | 7900 | |
| Elastic Coefficient | Stiffness constant (×1010 N/m2) | C11 | 16.9 |
| C12 | 11.8 | ||
| C13 | 10.9 | ||
| C33 | 12.3 | ||
| C44 | 2.7 | ||
| C55 | 2.7 | ||
| C66 | 2.5 | ||
| Elastic constant (×10−12 m2/N) | S11 | 15.1 | |
| S12 | −4.5 | ||
| S13 | −9.4 | ||
| S33 | 24.8 | ||
| S44 | 37.1 | ||
| S55 | 37.1 | ||
| S66 | 39.2 | ||
| Piezoelectric stress constant (C/m2) | e31 | −12 | |
| e33 | 18.2 | ||
| e15 | 21.9 | ||
| Piezoelectric strain constant (×10−12 C/N) | d31 | −300 | |
| d33 | 680 | ||
| d15 | 810 | ||
| Dielectric permittivity | Clamp dielectric constant, εS (At constant strain) | ε11 | 1550 |
| ε33 | 1390 | ||
| Free dielectric constant, εT (At constant stress) | ε11 | 3550 | |
| ε33 | 3850 | ||
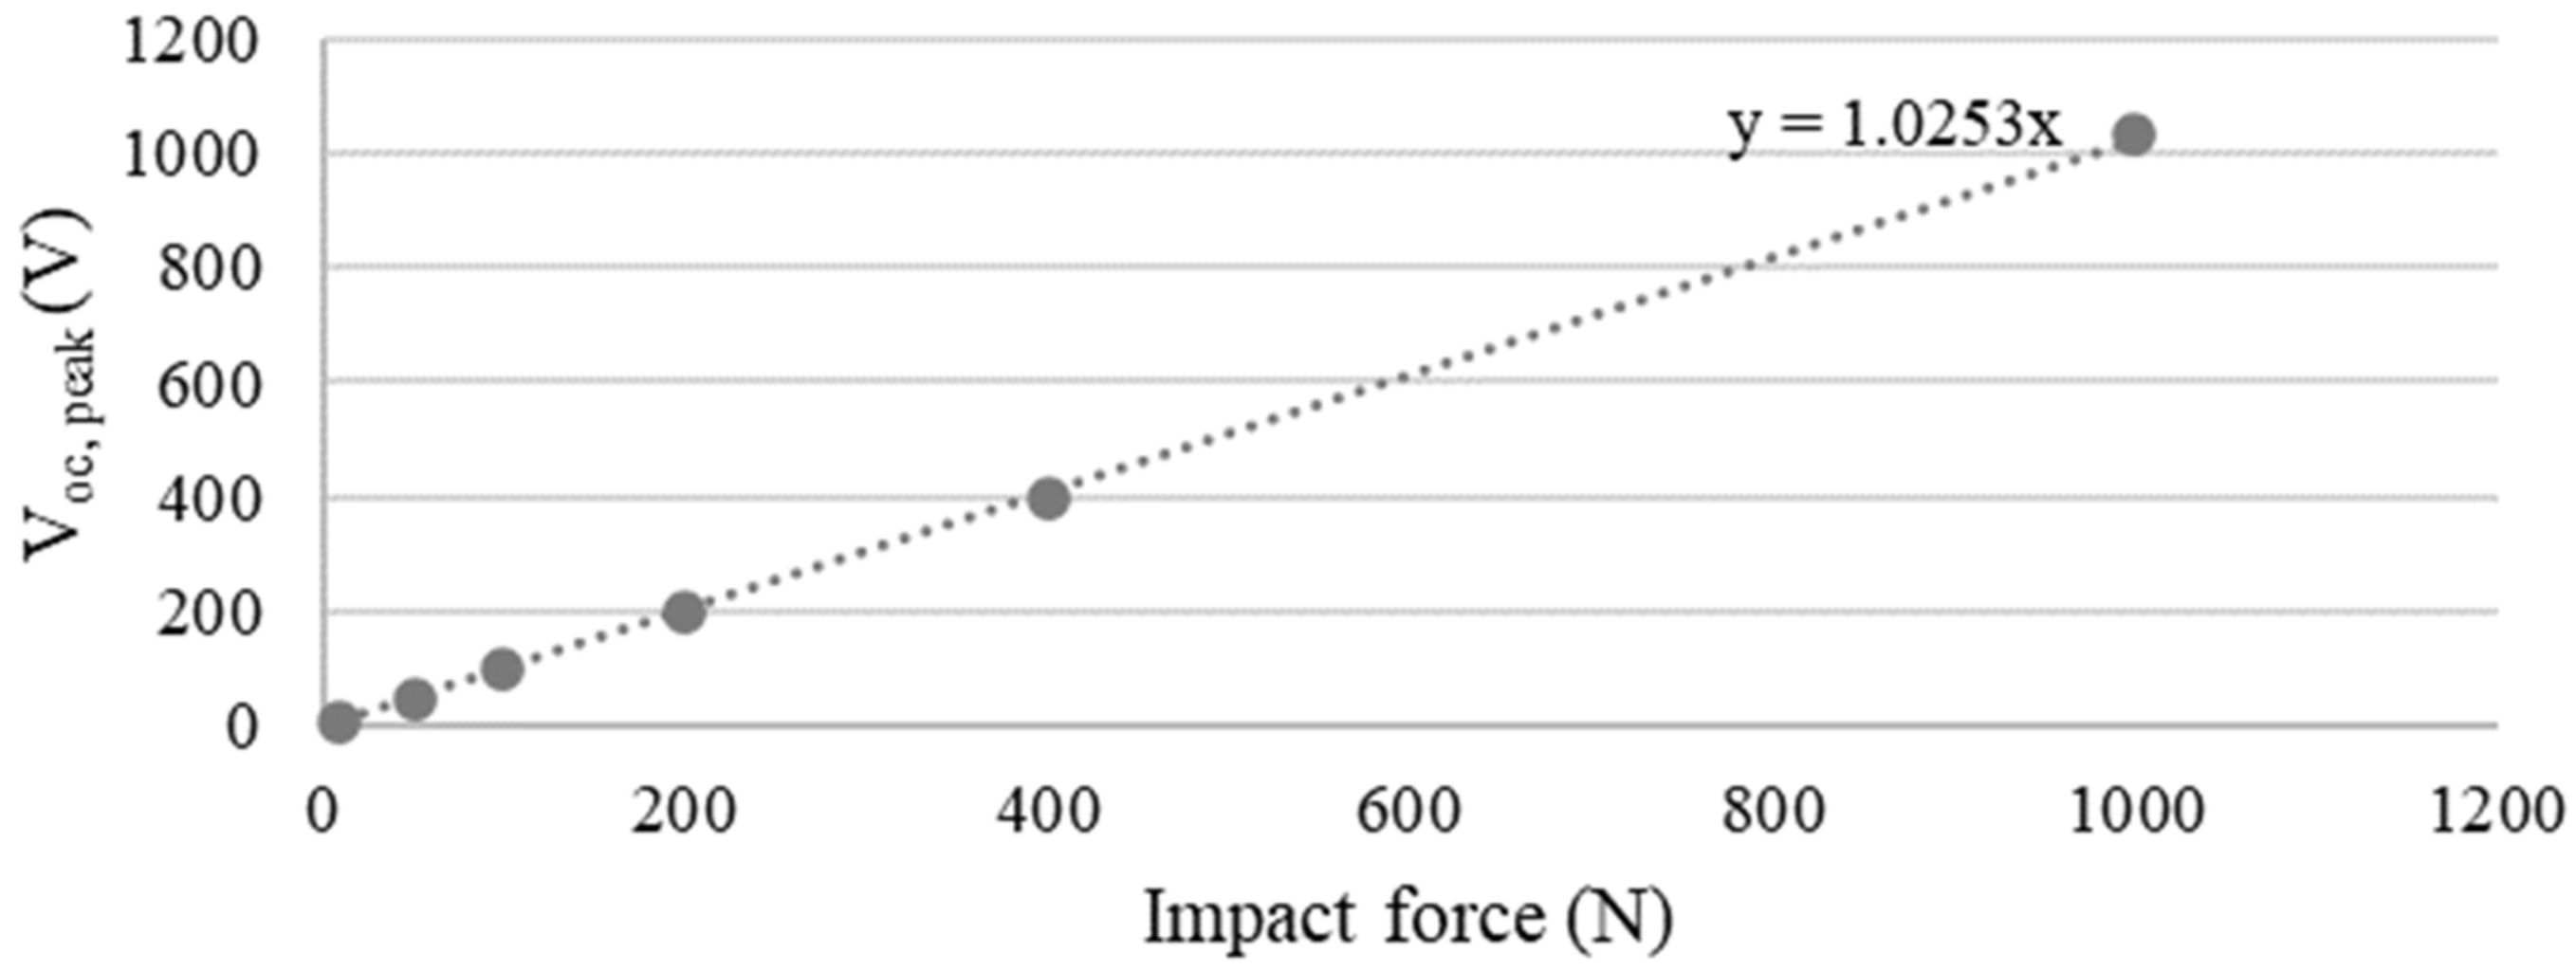
| Force (N) | 10 | 50 | 100 | 200 | 400 | 1000 |
|---|---|---|---|---|---|---|
| FEA simulation Voc, peak (V) | 9.64 | 48.80 | 98.14 | 197.81 | 400.76 | 1031.12 |
| Experimental Voc, peak (V) | 9.78 | 48.88 | 97.75 | 195.50 | 391.00 | 977.50 |
| Percentage error (%) | 1.40 | 0.15 | 0.39 | 1.17 | 2.44 | 5.20 |
| Force (kN) | 1.0 | 2.0 | 2.5 |
|---|---|---|---|
| Vpeak (V) | 619.96 | 1163.94 | 1624.14 |
| Pmax (W) | 7.69 | 27.10 | 52.76 |
| PZT maximum stress (MPa) | 62.37 | 124.17 | 163.63 |
| Frame maximum stress (MPa) | 254.53 | 610.85 | 609.29 |
| PZT average nodal stress (MPa) | 33.10 | 56.20 | 88.30 |
Disclaimer/Publisher’s Note: The statements, opinions and data contained in all publications are solely those of the individual author(s) and contributor(s) and not of MDPI and/or the editor(s). MDPI and/or the editor(s) disclaim responsibility for any injury to people or property resulting from any ideas, methods, instructions or products referred to in the content. |
© 2023 by the authors. Licensee MDPI, Basel, Switzerland. This article is an open access article distributed under the terms and conditions of the Creative Commons Attribution (CC BY) license (https://creativecommons.org/licenses/by/4.0/).
Share and Cite
Long, S.X.; Khoo, S.Y.; Ong, Z.C.; Soong, M.F.; Huang, Y.-H. Numerical and Experimental Investigation of a Compressive-Mode Hull Piezoelectric Energy Harvester under Impact Force. Sustainability 2023, 15, 15899. https://doi.org/10.3390/su152215899
Long SX, Khoo SY, Ong ZC, Soong MF, Huang Y-H. Numerical and Experimental Investigation of a Compressive-Mode Hull Piezoelectric Energy Harvester under Impact Force. Sustainability. 2023; 15(22):15899. https://doi.org/10.3390/su152215899
Chicago/Turabian StyleLong, Su Xian, Shin Yee Khoo, Zhi Chao Ong, Ming Foong Soong, and Yu-Hsi Huang. 2023. "Numerical and Experimental Investigation of a Compressive-Mode Hull Piezoelectric Energy Harvester under Impact Force" Sustainability 15, no. 22: 15899. https://doi.org/10.3390/su152215899
APA StyleLong, S. X., Khoo, S. Y., Ong, Z. C., Soong, M. F., & Huang, Y.-H. (2023). Numerical and Experimental Investigation of a Compressive-Mode Hull Piezoelectric Energy Harvester under Impact Force. Sustainability, 15(22), 15899. https://doi.org/10.3390/su152215899