Abstract
This study aimed to conduct a comprehensive Life Cycle Assessment (LCA) of lignin-based polyol production through organosolv fractionation of cardoon stalks and subsequent lignin liquefaction. The LCA employed a cradle-to-gate approach, encompassing cardoon cultivation and all processing steps leading to polyol production. The research involved laboratory-scale optimization of the organosolv and liquefaction processes, followed by industrial-scale implementation. The analysis revealed that all stages of the production chain, including crop cultivation, organosolv, and liquefaction, significantly influenced overall environmental impacts. Specific materials and processes played pivotal roles, such as harvesting machinery and fertilizers in crop production, γ-Valerolactone (GVL) as the primary contributor (72–100%) to environmental impacts in the organosolv phase, and materials like polyethylene glycol 400 (PEG 400) and glycerin in the liquefaction phase, accounting for the majority (96–100%) of environmental impacts in this stage. When considering endpoint damage categories, it became evident that this production chain had a notable impact on human health, primarily due to emissions in air, water, and soil from agricultural processes. Lignin-based polyols demonstrated a moderate improvement compared to their petroleum-based counterparts, with an approximate reduction of 3–16% in environmental impact.
1. Introduction
Polyols, crucial for making polyurethanes (PUs), are either monomeric or polymeric based on their size, with the latter commonly used in the polymer industry [1]. However, their petrochemical origins raise environmental concerns. The polyurethane market was valued at USD 72.82 billion in 2021 and is projected to grow at 4.3% annually from 2022 to 2030 [2]. Yet, this demand for polyols from petrochemical sources intensifies reliance on finite petroleum resources, notably polyether and polyester polyols, worsening environmental impacts [1].
Due to significant environmental concerns, industrial stakeholders and academic researchers are innovating to reduce their impact. They seek eco-friendly polyol sources like hydroxyl-rich biomass residues (e.g., vegetable oils, sugars, lignin) as substitutes for petrochemical polyols, aiming for a more sustainable polyurethane production.
Residual or byproduct streams from various processes can serve as sources for polyols. An abundant and valuable source is lignin, which constitutes approximately 20% of lignocellulosic biomasses. Lignin is notable for its high concentration of hydroxyl groups (OH). This hydroxyl-rich characteristic of lignin presents a promising opportunity for developing bio-based polyols crucial for polyurethane production [3,4]. This approach not only improves the economic viability of industries generating lignin as a byproduct but also reduces the environmental impact associated with traditional polyol synthesis methods [4,5,6].
Commercial lignin production, known as technical lignin, primarily involves kraft, soda, and lignosulfonates methods, corresponding to industrial processes for wood delignification and cellulosic pulp production. Organosolv lignin offers an alternative. Derived from wood using mainly ethanol, water, and catalysts, this process minimally alters native lignin’s structure, making it well-suited for subsequent modifications [7]. An important benefit of organosolv is obtaining nearly pure lignin. Organosolv is a technique for fractionating lignocellulosic biomass. It deploys organic solvents (e.g., ethanol, methanol, acetone) at 35–70% concentration, with a solid/liquid ratio of 1:4 to 1:10. Operating at 120–200 °C for 30–90 min, an acidic pH aids effective feedstock decomposition [8,9]. Within the organosolv reactor, lignocellulosic biomass, solvent, and catalyst interact, resulting in two phases—solid (cellulose, hemicellulose) and liquid (solvent, water, solubilized lignin, hemicellulose, minor compounds). Lignin precipitates by diluting the liquid phase with water, separating it from the liquid, yielding the primary product: organosolv lignin [9]. This approach efficiently taps into lignocellulosic resources, offering a sustainable pathway to valuable products. Lignin is a renewable source of aromatic polymer; however, its viability hinges on wood type and extraction process, influencing the quantity and nature of OH groups [1]. The intricate and diverse structure of lignin, particularly phenolic OH groups, poses challenges for reactions with isocyanate groups. To address this, chemical modifications are necessary, converting lignin into liquid polyols [10]. This entails functionalizing lignin’s OH groups to enhance their accessibility and reactivity.
Lignin conversion into liquid polyols involves three key methods: oxyalkylation with alkylene oxides or cyclic carbonates, liquefaction using polyhydric alcohols, and their combination [11,12,13]. In the method proposed by this study, the liquefaction using polyhydric alcohols can utilize polyethylene glycol (PEG), polypropylene glycol (PPG), ethylene glycol (EG), or glycerol, alongside acid or base catalysts, typically employing sulfuric acid (H2SO4) and temperatures of 110–180 °C at atmospheric pressure [12,14,15,16]. Acid liquefaction of lignin primarily involves degradation and repolymerization processes. Hydroxyl groups in lignin link to PEG or glycerol through ether bonds and the reaction is driven by condensation reactions between aromatic lignin subunits, resulting in decreased phenolic hydroxyl content. The product is obtained as a liquefaction mixture of lignin and solid residue [17]. Optimization of reaction parameters such as temperature, time, catalyst loading, and lignin/solvent ratio mitigates residue formation and recondensation reactions [18]. The commonly used solvent mixture for liquefaction is a blend of PEG 400 (Mw: 400 g/mol) and glycerol, facilitating polyol production for polyurethane foam [14]. Glycerol use helps prevent recondensation [11,19,20], and the optimal solvent/lignin ratio is often found to be 5:1. Microwave heating has successfully facilitated lignin liquefaction, offering shorter reaction times and cost reduction [21]. Nonetheless, acid liquefaction’s adoption faces challenges due to side reactions and significant solid residue formation, necessitating further optimization [21,22,23]. Characterizing lignin-based polyols is crucial due to lignin’s intricate and variable structure, aiding predictions of polyol behavior and resulting polyurethane properties. Key characteristics include hydroxyl number (IOH), viscosity, and molecular weight, paralleling the assessment of petroleum-based polyols [1].
This study employs IOH to characterize produced polyols, representing available hydroxyl groups for isocyanate reactions. The required IOH range for polyol production spans various values. For instance, rigid foam-producing polyether polyols have IOH values between 300–800 mg KOH/g, while polyurethane adhesive production generally requires lower IOH values [24].
1.1. Relevance of the Study
This study addresses critical limitations in the environmental analysis of lignin-based polyol production. While previous research has examined these polyols using organosolv/liquefaction processes, it often lacked clarity when attributing environmental impacts to specific production phases, impeding effective process optimization. Many studies attributed these impacts to broad product groups like ethanol, cellulose, sugars, and polyurethanes without providing precise allocations, hindering impact assessment. Furthermore, in previous process chain analyses, processes were grouped into larger phases, such as lignin extraction and polyurethane production, without examining detailed mass and energy flows, thus limiting a comprehensive analysis.
The significance and novelty of this study are prominently highlighted by the introduction of a comprehensive production chain inventory statement. This statement meticulously delineates the mass and energy flows for each unit process within the study. This crucial addition greatly contributes to the advancement of Life Cycle Assessment (LCA) within this specific field. It substantially bolsters the reproducibility of the study’s findings and offers insight into the intricate environmental impacts inherent in the production of lignin-based polyols.
1.2. Objectives
The primary objective of this study is to assess the environmental performance of producing lignin-based polyols extracted from the lignocellulosic material of Cynara cardunculus L., also known as cardoon, using the organosolv and liquefaction methods. To achieve this goal, the Life Cycle Assessment methodology was employed with a cradle-to-gate approach, from cultivating the plant to obtaining the polyols. Finally, a comparison was drawn between the resulting polyol and polyols obtained from fossil sources and other alternative ones.
2. Materials and Methods
2.1. Life Cycle Assessment Methodology
The Life Cycle Assessment was developed following the International Organization for Standardization (ISO) standards 14040:2006a [25] and 14044:2006b [26]. Aligned with the framework proposed by the ISO standards, this article includes the goal and scope definition, life cycle inventory analysis, life cycle impact assessment, and interpretation of the results. The life cycle models were created using the software SimaPro V9.5.0.1 [27] and the database ecoinvent V3.9.1 [28].
2.2. Goal and Scope Definition
This study conducted a thorough environmental impact analysis of lignin-based polyol production. The process involved organosolv treatment of cardoon lignocellulosic biomass, followed by lignin liquefaction. The assessment revealed significant impacts across life cycle phases, materials, and processes. Furthermore, the study explored avenues to enhance overall sustainability and process chain efficiency.
2.3. System Boundaries and Functional Unity
The system boundaries, depicted in Figure 1, covers all processes from raw material cultivation to polyol production.
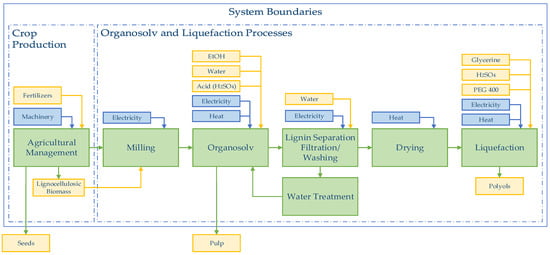
Figure 1.
System Boundaries.
The dataset for this study came from the European Union, with raw materials sourced from Sardinia, Italy, and processing conducted in central Italy over one year. The functional unit was 1 kg of polyols produced.
2.4. Life Cycle Inventory
2.4.1. Data Quality
Table 1 presents data quality, including reference sources of the data and methodology employed in developing the life cycle inventory.

Table 1.
Data Quality Declaration.
2.4.2. Crop Production
Polyol production used cardoon as the raw material, with data on mass flows, yields, and machinery drawn from Novamont SpA., Ramoon et al. [30], and Totoroli et al. [29]. Metadata for cardoon production came from Porto Torres, Sardinia, with Novamont S.p.A providing production details and input information such as nitrogen and phosphate fertilizers and compost. The analysis covered 1 hectare of cultivation, yielding approximately 1.38 tons of seeds, 13.5 tons of epigeon lignocellulosic fraction, and 1.5 tons of ipogeon lignocellulosic faction. Machinery assumptions were based on research by Ramoon et al. [30] and Totoroli et al. [29]. Machinery usage was calculated aligning with harvested output and cultivated area. Operations modelled encompassed ploughing, harrowing, sowing, fertilizing, weeding, and harvesting. Nitrous oxide emissions from cultivation were estimated at approximately 15% of total ammonia nitrogen consumption [28], while carbon dioxide emissions were calculated to be around 20% of total urea usage [33]. Cultivation took place approximately 20 km from the processing plant, with transportation handled by 30-ton trucks.
2.5. Organosolv and Liquefaction Processes
2.5.1. Laboratory Processes and Optimization
The study used cardoon steam as raw material (RM), milled into 1 mm using a laboratory rotary blade mill (RETSCH, Haan, Germany) [31]. All reagents used in the study were of analytical grade and purchased from Sigma-Aldrich (Saint Louis, MO, USA). An HB43-S Halogen Classic plus (Mettler Toledo, Columbus, OH, USA) was used to perform moisture analysis of solid samples. Cellulose and hemicellulose content was evaluated as monosaccharides concentration using an ultra-high performance liquid chromatography (UHPLC) Dionex Ultimate 3000 HPLC system equipped with a Bio-Rad Aminex HPX-87H column (Bio-rad, Hercules, CA, USA) and a refractive index detector (ERC RefractoMax 520, Thermo Scientific, Waltham, MA, USA). Lignin was assessed as a residual fraction after an acid hydrolysis of biomass [34]. Lignin extraction and liquefaction were conducted using an Ethos One Microwave-assisted extractor (Milestone srl, Sorisole, BG, Italy).
2.5.2. Organosolv-Mediated Lignin Extraction
The RM underwent microwave-assisted organosolv fractionation using an acidified GVL/water solution to yield cellulose-rich pulp and technical lignin, following the procedure described by Giannoni et al. [31]. In summary, 2.5 g of RM and an acidified GVL/water solution with a GVL concentration of 60% (w/w) and H2SO4 concentration of 2.2% (w/w) were added into a vessel using a 1:10 solid-to-liquid ratio. The reaction was carried out at 140 °C for 30 min under constant stirring. After the reaction time, the cellulose-rich pulp was separated from the liquid containing the dissolved lignin by filtration. The lignin was isolated from the organosolv liquor by adding seven volumes of water to the liquid fraction, followed by centrifugation and oven drying at 50 °C. The lignin content of the liquor was determined by weighing the mass of precipitated organosolv lignin (OL) from the liquid fraction. The OL was characterized to determine the residual holocellulose content.
2.5.3. OL Liquefaction
The liquefaction followed the procedure by Sequeiros et al. [35]. PEG 400 with a hydroxyl value of 178–197 (mg KOH/g sample) and glycerol served as solvents, while 98% w/w sulfuric acid acted as the catalyst. A mixture of PEG 400 and glycerol (80/20 w/w) served as the solvent, and microwave-assisted extraction was conducted at 155 °C with a 3% catalyst concentration, lasting 5 min. Stirring was maintained throughout, and the reaction mixtures were loaded into the vessel with the OL using a solvent ratio of 15/85 w/v. After liquefaction, the pressurized vessel cooled for 15 min before being opened safely.
To determine the liquefaction yield (LY), the liquefaction product (polyols and unreacted material) was diluted with dioxane/water (80/20 v/v), filtered to remove remaining solids, and dried to a constant mass. LY was calculated as a weight percentage based on the initial sample material using Equation (1).
where:
MI: mass of initial organosolv lignin (g);
M: mass of the insoluble residue in dioxane/water (g).
The polyols obtained by the liquefaction method were labelled as LL1.
2.5.4. Hydroxyl Number and Acid Number
The IOH was determined following the American Society for Testing and Materials (ATSM) procedure [36]. A sample of 0.5–1.0 g was dissolved in 25 mL of a phthalation reagent and heated at 115 °C for 1 h under reflux. Subsequently, 50 mL of pyridine was added through the condenser, and the mixture was removed from reflux and back-titrated with 0.5 M sodium hydroxide solution using 1% phenolphthalein solution in pyridine as the indicator. The phthalation reagent was previously made by dissolving 115 g of phthalic anhydride in 700 mL of pyridine.
The hydroxyl number, defined as mg KOH/g of sample, was calculated as follows using Equation (2).
where:
A: volume of the 0.5 M sodium hydroxide solution required for the titration of the sample (mL);
B: volume of the sodium hydroxide solution required for the titration of the blank solution (mL);
M: molarity of the sodium hydroxide solution;
w: amount of the sample (g).
If the sample was acidic, the hydroxyl number was corrected accordingly, as the acid uses the phthalation reagent during the analysis. To determine the acid number, a total of 0.4 g of the sample was weighed into a 400 mL Erlenmeyer flask and dissolved in 50 mL of a solvent mixture consisting of dioxane and water (4:1 v/v). Then, 0.5 mL of phenolphthalein indicator solution (1% in ethanol) was added, and the mixture was titrated with 0.1 M KOH solution in ethanol to the equivalent point. The acid number (mg KOH/g of sample) was calculated using Equation (3):
where:
C: titration volume of the potassium hydroxide solution (mL);
B: titration volume of the blank solution (mL);
M: molarity of the potassium hydroxide solution;
w: amount of the sample (g).
2.6. Scale Up
Typically, in life cycle assessments for biorefineries, impact assessments have primarily focused on factors like raw materials, end products, waste management, and utilities. A common convention in these assessments has been to overlook the impacts associated with the construction and ongoing maintenance of the production plant [37,38,39]. This simplification, as shown in other studies, has also been applied in this analysis. The inventory used in the modeling was based on scaling up laboratory processes involving a production facility designed for an annual processing capacity of 40,000 tons of RM.
The energy requirement for the milling process was estimated using the equation proposed by Ladan et al. [40] (Equation (4)), which relies on a data-based equation for predicting power demand. This calculation assumed kr to be 164 J∙mm/g and Lp to be 4 mm.
where:
kr: slope of the Rittinger constant (J∙mm/g);
Lp: product mean size (mm).
The mass flows of the organosolv unit process were determined using the methodology outlined by Piccino et al. [32]. This method involved linearly scaling reactants from the laboratory scale, while solvent quantities were reduced by 20% in accordance with the proposed framework. The solvents considered for this unit process calculation included water, GVL, and sulfuric acid. The GVL solvent was modeled separately since it’s not part of the ecoinvent V3.9.1 database. We adapted the model from Han et al.’s study [41], where GVL was produced from Kenaf biomass. Calculations were performed based on a 1000 L reactor with a 90% fill capacity.
The necessary heat for the organosolv process was computed by assessing the energy required to raise the temperature of reagents and solvents from 25 °C to 140 °C (as determined by the optimal temperature calculated by Tommaso et al. [31]) in an isochoric process.
Furthermore, the energy needed to heat the reactor body was accounted for, along with energy losses during the process. To estimate heat loss to the environment a reactor insulated with 75 mm-thick fiberglass, consistent with industry standards [42], was considered. The heat loss calculation employed the equation proposed by Picino et al. [32] (Equation (5)), factoring in a total surface area of 5.9 m², an insulating material with a thermal conductivity of 0.042 W/m·K, and an insulation thickness of 75 mm.
where:
Qloss: temperature lost through radiation and conduction during the treatment (MJ);
A: surface area of the reactor (m2);
Ka: thermal conductivity of the insulation material (W/m·K);
s: thickness of the insulation (m);
Δt: temperature variation during the process (°C);
T: treatment time (min).
The energy demand for the unit process of filtration/centrifugation before and after the washing process was determined based on Alt et al.’s study [43], which estimated the energy demand range for this process to be between 1 and 10 kWh per ton of processed material. For this study, considering a precise value within this range was possible, and the more conservative value of 10 kWh per ton of solution was adopted.
The scaling of the washing process was calculated linearly to the mass flow conducted in the laboratory. In this phase, only room-temperature water was used for the lignin precipitation process. Before the second centrifugation, after washing, 90% of the water was removed through pumping.
The water effluents employed in the treatment were assumed to be recycled within the treatment facility itself. The design of the treatment process factored in a water recycling efficiency of 70%, in line with findings from other biomass treatment studies [32,44].
Following the removal of excess liquids through a second centrifugation process, the lignin was subjected to oven drying to eliminate surplus moisture. The energy required for this phase was computed based on the energy necessary to elevate the liquid’s (water) temperature to its boiling point, in addition to its enthalpy of vaporization. Notably, only the energy required for temperature elevation was considered, while heat loss was accounted for within the context of the 80% assumed evaporation efficiency derived from studies on the drying process [32]. The calculation was performed based on Equation (6).
where:
Cp,liq: specific hear of water (J/kg·°C);
mliq: mass of the liquid (kg);
Tboil: temperature of water boiling (°C);
T0: initial temperature (°C);
ηdry: dryer efficiency (%);
ΔHvap: water enthalpy of vaporization (MJ/kg);
mvap: mass of vapor (m).
Ultimately, the biomass liquefaction process was sized using the same methodology applied to the organosolv process for the inputs and energy demands.
For all stages necessitating liquid pumping, these quantities were determined using Equation (7).
where:
m: pumped mass liquid.
Incorporated alongside the primary data, the inventory encompassed supplementary information concerning background systems. These systems encompassed the production of utilities like heat, electricity, and wastewater, as well as additional inputs such as chemicals and tap water. The source of the secondary data was the ecoinvent V3.9.1 database [28].
The study omitted the impact attributed to establishing and maintaining the infrastructure, deeming it negligible. Koch et al. [45] observed that bio-refinery construction’s effects are typically negligible over its durable operational lifetime.
2.7. Life Cycle Impact Assessment and Interpretation
The ReCiPe Midpoint (H) V1.1 [46] method was employed for Life Cycle Impact Assessment (LCIA), spanning a 100-year timeframe and converting emissions into 18 impact categories (ICs): Global warming (GWP), Stratospheric ozone depletion (SOD), Ionizing radiation (IRD), Ozone formation, Human health (OFHH), Fine particulate matter formation (FPMF), Ozone formation, Terrestrial ecosystems (OFTE), Terrestrial acidification (TAC), Freshwater eutrophication (FWE), Marine eutrophication (MET), Terrestrial ecotoxicity (TEC), Freshwater ecotoxicity (FEC), Marine ecotoxicity (MEC), Human carcinogenic toxicity (HCT), Human non-carcinogenic toxicity (HNCT), Land use (LUS), Mineral resource scarcity (MRS), Fossil resource scarcity (FRS), and Water consumption (WCS).
Additionally, we integrated the ReCiPe Endpoint (H/A) method, examining “Human Health”, “Ecosystems”, and “Resources” aspects. Our approach involved inventory assessment and characterization at both midpoint and endpoint levels, with particular attention to identifying hotspots and analyzing key impact-driving flows. Furthermore, we comprehensively evaluated environmental impacts using the ReCiPe Endpoint (H/A) method, allocating impacts based on the economic value of fractions obtained in each production phase.
3. Results
3.1. Laboratory Results: Compositional Analysis and Liquefaction Process
Table 2 presents the chemical composition of the cardoon stalks utilized in this study. These stalks exhibit hemicellulose and lignin content comparable to that of other cardoon stalks employed in biochemical conversion processes, with only a slightly lower cellulose content [47,48]. The hemicellulose, composed almost entirely of xylan heteropolysaccharide, is primarily comprised of xylose, the most abundant component (>93%). The low lignin content (14.2%) and extractives value (7.6%) suggest a high degree of accessibility and reactivity of biomass to organosolv processes [32].
Table 2.
Cardoon stalks composition.
Approximately 67% of the initial lignin was extracted and precipitated from the organosolv solution. Analysis of the cardoon residue-derived OL revealed it contained 88.9% acid-insoluble lignin, with total sugars constituting 3.5% (comprising 1% glucose and 2.5% xylose). The solid pulp obtained post-organosolv process exhibited a 90.45% cellulose content, recovering about 87% of the initial cellulose. Due to its highly digestible cellulose content, the solid pulp is suitable for enzymatic hydrolysis to yield fermentable glucose [49]. In Figure 2, the cardoon biomass before and the OL precipitated after the organosolv process can be observed. The brownish appearance of the OL demonstrates the efficient removal of holocellulose from the raw material.
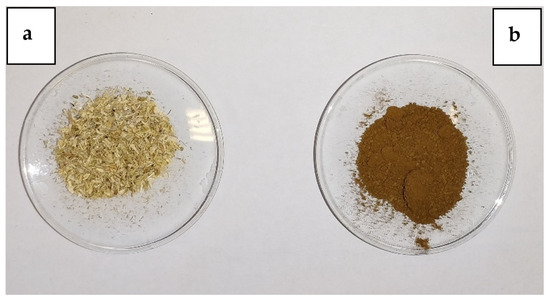
Figure 2.
Raw material before the organosolv process (a) and precipitated OL (b).
Two dependent variables were considered to judge the liquefaction process of OL, LY (%), and IOH (mg KOH/g). About 98% (LY) of initial OL was liquefied to polyols thanks to the liquefaction process. The polyol LL1 showed an IOH of 582 mg KOH/g, which was higher than the PEG 400 employed in the liquefaction process and suitable to be used as a precursor in polyurethane foam synthesis [23].
3.2. Life Cycle Inventory
The inventory, illustrating the results of upscaling laboratory processes, is presented in Table 3, providing a comprehensive overview of mass and energy flows throughout the entire process chain.
Table 3.
Life Cycle Inventory of Lignin-based Polyols Production per kg of Polyols Produced.
Comprehensive metadata pertaining to crop production and GLV production can be found in Appendix A—Table A1 and Table A2.
3.3. Life Cycle Impact Assessment
3.3.1. Midpoint Level—Characterization
The environmental profile of the entire chain, segmented into the three macro-process steps (cardoon Production, organosolv, and liquefaction), is illustrated in Figure 3. The total value for the entire chain for each impact category is shown in Appendix A—Table A3.
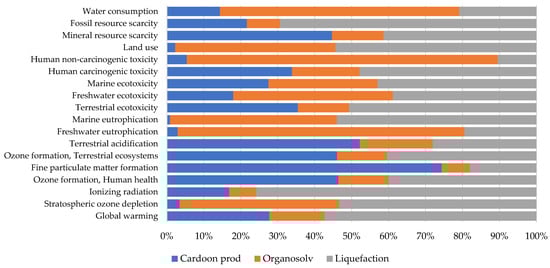
Figure 3.
Environmental Profile of the Entire Process Chain as a Percentage of the Total Impact Load for Each Macro-Process (Cardoon Production, Organosolv, and Liquefaction).
The results have been categorized into three key phases: cardoon production, which involves producing the raw material; the organosolv process, utilized in biomass treatment for pulp and lignin production; and lastly, the liquefaction of lignin to obtain polyols. The percentage values represent the relative contribution of each of these phases to the total environmental impact in the production of 1 kg of polyols.
Cardoon Production
Figure 4 illustrates the midpoint-level characterization results for the cardoon Production phase for 1 kg of polyols.
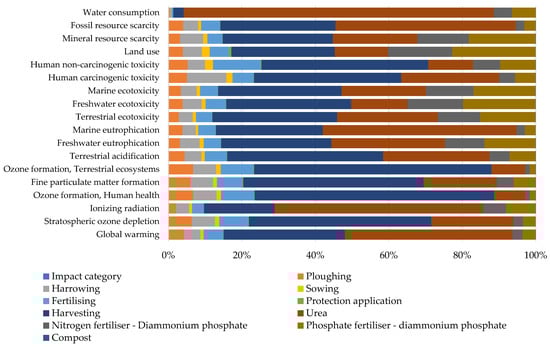
Figure 4.
Midpoint-Level Characterization—Cardoon Production Phase.
Most of the impact load primarily stemmed from two key factors: the use of machinery during the harvesting process and the application of urea across all assessed impact categories. To a lesser degree, chemical inputs like nitrogen and phosphate fertilizers also played a part, predominantly affecting the FWE, TEC, FWE, ME, LUS, and MRS categories.
Organosolv
Figure 5 illustrates the midpoint-level characterization results for the organosolv phase for 1 kg of polyols.
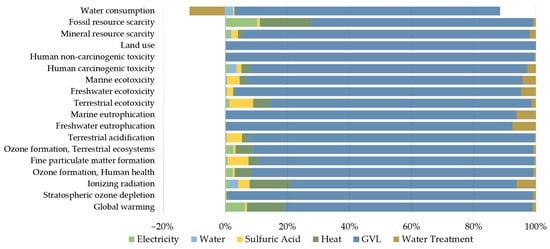
Figure 5.
Midpoint—Level Characterization—Organosolv Phase.
Upon analyzing the organosolv processes, it becomes apparent that the majority of the impact load is attributed to the utilization of GVL as a solvent across all assessed impact categories. This input accounted for 72–100% of the total impact load across all analyzed categories. For more detailed information on the LCIA of GVL, please refer to the Appendix A—Figure A1. Additionally, other contributing factors, albeit to a lesser degree, included the use of grid electricity, primarily affecting the GWP and FRS categories, as well as the application of heat in thermal processes, which predominantly influenced the GWP, IRD, and FRS categories. Lastly, the wastewater treatment phase had impacts on the IRD, FWE, and MET categories, and had a positive impact on the WCS, reducing it by approximately −15%.
Liquefaction
Figure 6 illustrates the midpoint-level characterization results for the liquefaction phase for 1 kg of polyols.
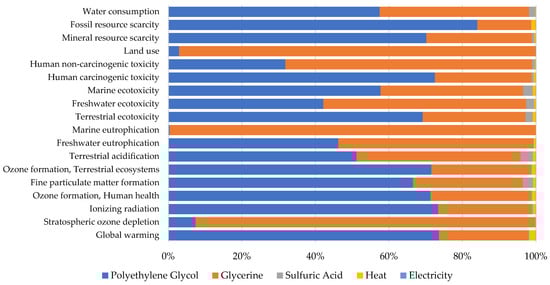
Figure 6.
Midpoint-Level Characterization—Liquefaction Phase.
The findings from the liquefaction phase reveal that the majority of impacts were predominantly concentrated in two key inputs, PEG 400 and glycerin. These two inputs were collectively responsible for 96–100% of the overall process impact load across all impact categories.
3.3.2. ReCiPe Endpoint
The ReCiPe Endpoint H/A method was developed with the aim of achieving a deeper and more holistic comprehension of environmental impacts. This approach facilitated the organization of all eighteen impact categories into three clearly defined damage categories: human health, ecosystems, and resources. The endpoint results are shown in terms of damage assessment (Figure 7) and single score (Figure 8).
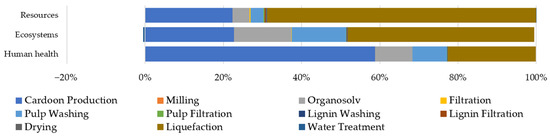
Figure 7.
Endpoint Level—Damage Assessment.
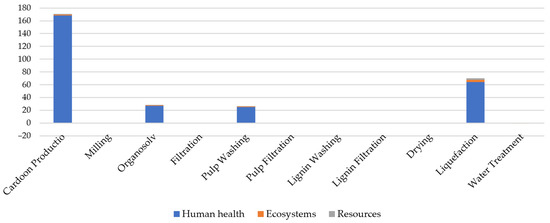
Figure 8.
Endpoint Level—Single Score.
The endpoint results are shown in terms of single score, evidencing which were the more affected damage categories, and in terms of damage assessment, evidencing the share of each phase of the polyols processes in the total load of impacts in the damage categories.
4. Discussion
4.1. LCIA Midpoint Level
The data presented in Figure 2 clearly indicate that every macro-phase in the production chain played a substantial role in pollutant emissions. Notably, the crop production phase had a significant impact on categories such as OFHH, FPMF, OFTE, TAC, and MRS.
The organosolv phase primarily contributed to impact categories such as SOD, FWE, MET, FWE, HNCT, LUS, and WCS.
On the other hand, the liquefaction phase was the phase that had a predominant impact on a broader range of impact categories, including GWP, SOD, IRD, OFHH, OFTE, TAC, TEC, MEC, HCT, LUS, MRS, and FRS.
4.1.1. Crop Production
As previously examined in studies on the cardoon production chain [30,50], the agricultural production inventory involved the application of fertilizers and the use of machinery. Data concerning fertilization were collected as primary data directly from the producer, while data regarding machinery usage were estimated based on the processes involved in cardoon cultivation. There was no need for irrigation, leading to an improved environmental performance. The harvest yielded 18 t/ha, which closely approached the maximum of 20 t/ha reported by other authors. Rainfall in the cultivation region met the minimum seasonal requirement of 500 mm, consistent with Porto Torres, which typically experiences rainfall in the range of 400 to 600 mm [51,52]. The utilization of marginal lands was considered a best practice, addressing challenges in energy crop production within agricultural areas and thereby minimizing environmental impacts. The production fields were located 20 km from the polygeneration plant, simulating proximity to reduce transportation-related effects, which were indeed found to be negligible in the analysis.
The crop production phase was particularly affected by the cardoon harvesting process, as demonstrated by Barros Lovate Temporim et al. [30,50]. This process had an impact on all ICs except for the WCS category. The harvesting process was primarily affected by the use of diesel fuel and materials employed in the construction of machinery, such as steel. The categories most impacted by the use of these materials were OFHH, FPMF, and OFTE.
Confirmed by other authors [29], the input that contributed the most to the impact load was urea, showing significant impacts in all ICs, particularly in the WCS category, which accounted for 84% of the total impact load in that category. The use of diammonium phosphate, to a lesser extent, also had non-negligible impacts of up to 18% across all ICs. In fact, by analyzing the elementary flows of fertilizers production, those chemicals led to emissions in air, water, and soil, primarily through phosphorus and nitrogen releases in the form of phosphates and nitrates. This affected groundwater, surface water, and, ultimately, oceans and seas [30]. Among all fertilizers used, ammonia’s widespread use as a raw material had the highest impact, leading to substantial environmental effects across categories like GWP, IRD, MEC, and WCS. Specifically, in the MEC, TEC, FEC, and MEC categories, these three fertilizers (urea and diammonium phosphate) had similar significance in the total impact load.
4.1.2. Organosolv
Analyzing the organosolv phase, it became evident that most of the electricity consumption was attributed to the filtration processes of the various products, accounting for approximately 95% of the process’s electricity demand. In contrast, heat was exclusively required by the organosolv process, as all other processes were conducted at ambient temperature. Furthermore, this phase exhibited a significant demand for water, which was reduced to 30% of the external water demand by implementing on-site wastewater treatment, allowing for the recycling of approximately 70% of the water used in the process.
The organosolv reaction phase stands out for its substantial impact, primarily driven by the use of the solvent GVL in two key processes: the organosolv reaction itself and the washing of the pulp after lignin separation. Both of these processes utilized the same quantity of GVL and collectively accounted for 72–100% of the impact across all analyzed impact categories.
The wastewater treatment process had minimal impacts on most of the analyzed impact categories. However, it did result in a 15% reduction in the WCS category due to the recycling of effluent water, which is reused within the production plant.
The thermal processes, which required heat, had notable impacts in the GWP, IRD, and FRS categories, ranging from 12–17%. Electricity consumption for processes like centrifugation and liquid pumping contributed to around 10% of the impact in the FRS category. Other unit processes had considerably less impact on the overall impact load.
When specifically considering the production of GVL alone, it became evident that the most substantial contributor to its environmental impact was the raw material utilized, namely, the lignocellulosic material sourced from Kenaf. This raw material accounted for a significant portion, ranging from 43–100%, of the impact across all categories. Additionally, inputs such as sulfuric acid, lime, hydrogen, and the water treatment process played a role in the impact, albeit to a lesser extent, as indicated by Han et al. [41]. Sulfuric acid emerged as the most impactful chemical input, particularly affecting impact categories such as IRD, FPF, MRS, and TEC. Lastly, the water treatment process primarily impacted categories like FEC, FWE, MEC, HCT, and HNCT, with contributions ranging from 44–100%.
4.1.3. Liquefaction
The liquefaction phase involves a low-temperature thermal process, where the major inputs are PEG 400, followed by the use of glycerin. In this phase, most of the total impact load is primarily associated with these two inputs, accounting for 96–100% across all impact categories. PEG 400 has a significant impact across most impact categories except for SOD, MEC, and LUS, where glycerin is the predominant contributor responsible for 92–100% of the impact in each of these three categories. The primary factors driving the impact of PEG 400 use are related to the production of ethylene oxide, which consumes a substantial amount of electricity. Conversely, glycerin’s impact load was mainly influenced by the use of vegetable oil in its production. Other processes and materials had minimal to negligible impacts.
4.1.4. Comparison GWP
In summary, the cradle-to-gate analysis reveals that the production of polyols from technical lignin emitted a total of 3.29 kg CO2-eq per kg of polyols produced, as detailed in Table 4.
Table 4.
GWP References.
Compared to traditional petroleum-based polyols available in the international market, the lignin-based polyol from cardoon exhibited a reduction ranging from 3% to 16% of GHGs. When compared to polyether and CO2-based polyols, the polyol proposed in this study showed a performance close to, albeit slightly lower, approximately ranging from −2% to −25%.
However, in the context of other renewable sources, its performance was notably less favorable. Particularly when compared to polyols derived from residual lignin in the kraft process, which exhibited an impact load that was eleven-fold lower. This significant difference can be attributed to the fact that kraft lignin is considered a residue, and therefore, the environmental impacts related to lignin extraction are not considered, resulting in highly favorable environmental performance. In this context, it is important to emphasize that the impacts associated with the pathways for polyol production, including raw material production, treatments for lignin extraction, and polyol production itself, cannot be directly compared to other studies, as the contribution of each individual process was not explicitly declared in the reference studies.
4.2. LCIA Endpoint Level
In the endpoint-level damage assessment in Figure 7, the global environmental burden of lignin-based polyol production revealed notable trends. It was observed that the cardoon production phase had a significant impact across all damage categories, with a particularly pronounced effect on human health, accounting for approximately 60% of the impact load in this specific category. This impact can be attributed to the use of chemical fertilizers (urea and diammonium phosphate), which directly affect human health through soil, air, and water contamination. In the ecosystem damage category, a more even distribution of the total impact load was observed. Cardoon production, organosolv, and liquefaction phases contributed 23%, 29%, and 48%, respectively, to the overall impact. Furthermore, in the resources damage category, it was evident that the liquefaction phase had the most significant impact, accounting for approximately 70% of the total impact load.
In the endpoint-level single score analysis, it was evident that all phases of the process predominantly affected the human health damage category. Notably, the cardoon production phase had a substantial relative impact on the overall analysis.
5. Conclusions
This study aimed to conduct a comprehensive environmental sustainability assessment of lignin-based polyol production, utilizing the organosolv and liquefaction processes. The analysis revealed that all stages of polyol production, including crop cultivation, organosolv processing, and liquefaction, exhibited substantial impacts across various environmental indicators. These impacts were primarily attributed to specific materials and processes. Within the crop cultivation phase, noteworthy impacts were associated with the utilization of harvesting machinery and fertilizers. In the organosolv stage, the critical factor contributing to environmental impact was the use of the GVL solvent. In the liquefaction phase, the materials with the most significant environmental footprint were PEG 400 and glycerin.
Furthermore, an endpoint analysis emphasized the considerable impact of the lignin-based polyol production chain on human health, primarily due to emissions released into the atmosphere, soil, and aquatic ecosystems.
In comparison to petroleum-based polyols, lignin-based polyols exhibited a notable improvement, manifesting a reduction of approximately 3–16% in environmental impact. However, their environmental performance was less favorable when contrasted with polyols derived from alternative sources, such as kraft lignin and CO2.
Author Contributions
G.C.: Resources, Supervision, Project administration; I.M.: Conceptualization; P.I.: Conceptualization; T.G.: Data curation, Formal analysis, Investigation, Visualization, Writing—review and editing; M.G.: Data curation, Formal analysis Investigation, Visualization, Writing—review and editing; A.N.: Validation; R.B.L.T.: Supervision, Conceptualization, Data curation, Formal analysis, Investigation, Methodology, Roles/Writing—original draft, Writing—review and editing. All authors have read and agreed to the published version of the manuscript.
Funding
This study was funded by Pegaso Telematic University within the project: “SOLUZIONI INNOVATIVE COMPATIBILI PER LA RIQUALIFICAZIONE ENERGETICA DEL SISTEMA EDIFICIO-IMPIANTO MEDIANTE L’IMPIEGO DI BIOMATERIALI E DI BIOCOMBUSTIBILI”. CUP FR 2022 0014.
Institutional Review Board Statement
Not applicable.
Informed Consent Statement
Not applicable.
Data Availability Statement
Data are contained within the article.
Conflicts of Interest
The authors declare no conflict of interest.
Appendix A
Table A1.
Cardoon Production Inventory.
Table A1.
Cardoon Production Inventory.
| Cardoon Production | ||
|---|---|---|
| Urea | 57.5 | kg/ha |
| Diamonium phosphate—N | 4.5 | kg/ha |
| Diamonium phosphate—P | 11.5 | kg/ha |
| Compost | 20 | kg/ha |
| Pendimetalin | 151.7 | g/ha |
| Ploughing | 0.17 | ha |
| Harrowing | 0.33 | ha |
| Sowing | 0.17 | ha |
| Fertilizing | 1 | ha |
| Plant protection application | 0.17 | ha |
| Harvesting | 1 | ha |
| Emission—N2O | 0.8358 | kg/ha |
| Emission—NH3 | 9.3 | kg/ha |
| Emission—CO2 | 11.5 | kg/ha |
Table A2.
GVL Production Inventory.
Table A2.
GVL Production Inventory.
| GVL Production | ||
|---|---|---|
| Biomass | 4.601 | kg |
| H2SO4 | 0.046 | kg |
| Lime | 0.035 | kg |
| H2O | 1.872 | kg |
| H2 | 0.016 | kg |
| Waste gypsum | 0.081 | kg |
| Wood as mixture | 0.286 | Kg |
| Values in kg per kg of GVL | ||
Table A3.
Midpoint Level Characterization—All Chain of Processes.
Table A3.
Midpoint Level Characterization—All Chain of Processes.
| Impact Category | Unit | Crop Production | Organosolv | Liquefaction | Total |
|---|---|---|---|---|---|
| Global warming | kg CO2 eq | 0.911 | 0.492 | 1.880 | 3.283 |
| Stratospheric ozone depletion | kg CFC11 eq | 2.09 × 10⁻⁷ | 2.62 × 10⁻⁶ | 3.23 × 10⁻⁶ | 6.05 × 10⁻⁶ |
| Ionizing radiation | kBq Co-60 eq | 1.64 × 10⁻³ | 7.15 × 10⁻⁴ | 7.36 × 10⁻³ | 9.71 × 10⁻³ |
| Ozone formation, Human health | kg NOx eq | 4.91 × 10⁻³ | 1.44 × 10⁻³ | 4.23 × 10⁻³ | 1.06 × 10⁻² |
| Fine particulate matter formation | kg PM2.5 eq | 1.16 × 10⁻² | 1.19 × 10⁻³ | 2.80 × 10⁻³ | 1.56 × 10⁻² |
| Ozone formation, Terrestrial ecosystems | kg NOx eq | 5.08 × 10⁻³ | 1.49 × 10⁻³ | 4.45 × 10⁻³ | 1.10 × 10⁻² |
| Terrestrial acidification | kg SO2 eq | 1.45 × 10⁻² | 5.49 × 10⁻³ | 7.77 × 10⁻³ | 2.78 × 10⁻² |
| Freshwater eutrophication | kg P eq | 1.42 × 10⁻⁵ | 3.79 × 10⁻⁴ | 9.50 × 10⁻⁵ | 4.89 × 10⁻⁴ |
| Marine eutrophication | kg N eq | 1.70 × 10⁻⁵ | 9.03 × 10⁻⁴ | 1.08 × 10⁻³ | 2.00 × 10⁻³ |
| Terrestrial ecotoxicity | kg 1,4-DCB | 4.170 | 1.632 | 5.965 | 11.767 |
| Freshwater ecotoxicity | kg 1,4-DCB | 9.44 × 10⁻⁴ | 2.27 × 10⁻³ | 2.04 × 10⁻³ | 5.26 × 10⁻³ |
| Marine ecotoxicity | kg 1,4-DCB | 3.48 × 10⁻³ | 3.73 × 10⁻³ | 5.43 × 10⁻³ | 1.26 × 10⁻² |
| Human carcinogenic toxicity | kg 1,4-DCB | 1.40 × 10⁻² | 7.57 × 10⁻³ | 1.98 × 10⁻² | 4.14 × 10⁻² |
| Human non-carcinogenic toxicity | kg 1,4-DCB | 0.518 | 8.068 | 1.004 | 9.590 |
| Land use | m2a crop eq | 0.026 | 0.495 | 0.621 | 1.142 |
| Mineral resource scarcity | kg Cu eq | 5.82 × 10⁻³ | 1.82 × 10⁻³ | 5.39 × 10⁻³ | 1.30 × 10⁻² |
| Fossil resource scarcity | kg oil eq | 0.268 | 0.111 | 0.860 | 1.239 |
| Water consumption | m3 | 2.08 × 10⁻² | 9.38 × 10⁻² | 3.03 × 10⁻² | 1.45 × 10⁻¹ |

Figure A1.
Midpoint Characterisation—GVL Production.
Figure A1.
Midpoint Characterisation—GVL Production.

References
- Vieira, F.R.; Magina, S.; Evtuguin, D.V.; Barros-Timmons, A. Lignin as a Renewable Building Block for Sustainable Polyurethanes. Materials 2022, 15, 6182. [Google Scholar] [CrossRef]
- Polyurathane Market Size & COVID-19 Impact Analysis. Available online: https://www.fortunebusinessinsights.com/industry-reports/polyurethane-pu-market-101801 (accessed on 5 September 2023).
- Cateto, C.A.; Barreiro, M.F.; Rodrigues, A.E.; Belgacem, M.N. Optimization study of lignin oxypropylation in view of the preparation of polyurethane rigid foams. Ind. Eng. Chem. Res. 2009, 48, 2583–2589. [Google Scholar] [CrossRef]
- Kamm, B.; Gruber, P.R.; Kamm, M. Biorefineries-Industrial Processes and Products; Wiley-VCH Weinheim: Weinheim, Germany, 2006; Volume 2. [Google Scholar]
- Tribot, A.; Amer, G.; Alio, M.A.; de Baynast, H.; Delattre, C.; Pons, A.; Mathias, J.-D.; Callois, J.-M.; Vial, C.; Michaud, P. Wood-lignin: Supply, extraction processes and use as bio-based material. Eur. Polym. J. 2019, 112, 228–240. [Google Scholar] [CrossRef]
- Luan, P.; Zhao, X.; Copenhaver, K.; Ozcan, S.; Zhu, H. Turning Natural Herbaceous Fibers into Advanced Materials for Sustainability. Adv. Fiber Mater. 2022, 4, 736–757. [Google Scholar] [CrossRef]
- Borand, M.N.; Karaosmanoğlu, F. Effects of organosolv pretreatment conditions for lignocellulosic biomass in biorefinery applications: A review. J. Renew. Sustain. Energy 2018, 10, 033104. [Google Scholar] [CrossRef]
- Kautto, J.; Realff, M.J.; Ragauskas, A.J. Design and simulation of an organosolv process for bioethanol production. Biomass Convers. Biorefinery 2013, 3, 199–212. [Google Scholar] [CrossRef]
- Sannigrahi, P.; Ragauskas, A.J.; Miller, S.J. Lignin structural modifications resulting from ethanol organosolv treatment of loblolly pine. Energy Fuels 2010, 24, 683–689. [Google Scholar] [CrossRef]
- Laurichesse, S.; Avérous, L. Chemical modification of lignins: Towards biobased polymers. Prog. Polym. Sci. 2014, 39, 1266–1290. [Google Scholar] [CrossRef]
- Jin, Y.; Ruan, X.; Cheng, X.; Lü, Q. Liquefaction of lignin by polyethyleneglycol and glycerol. Bioresour. Technol. 2011, 102, 3581–3583. [Google Scholar] [CrossRef]
- da Silva, S.H.F.; Egüés, I.; Labidi, J. Liquefaction of Kraft lignin using polyhydric alcohols and organic acids as catalysts for sustainable polyols production. Ind. Crops Prod. 2019, 137, 687–693. [Google Scholar] [CrossRef]
- Zhang, X.; Kim, Y.; Elsayed, I.; Taylor, M.; Eberhardt, T.L.; Hassan, E.B.; Shmulsky, R. Rigid polyurethane foams containing lignin oxyalkylated with ethylene carbonate and polyethylene glycol. Ind. Crops Prod. 2019, 141, 111797. [Google Scholar] [CrossRef]
- Hu, S.; Luo, X.; Li, Y. Polyols and polyurethanes from the liquefaction of lignocellulosic biomass. ChemSusChem 2014, 7, 66–72. [Google Scholar] [CrossRef] [PubMed]
- Niu, M.; Zhao, G.-J.; Alma, M.H. Polycondensation reaction and its mechanism during lignocellulosic liquefaction by an acid catalyst: A review. For. Stud. China 2011, 13, 71–79. [Google Scholar] [CrossRef]
- Soares, B.; Gama, N.; Freire, C.; Barros-Timmons, A.; Brandao, I.; Silva, R.; Pascoal Neto, C.; Ferreira, A. Ecopolyol production from industrial cork powder via acid liquefaction using polyhydric alcohols. ACS Sustain. Chem. Eng. 2014, 2, 846–854. [Google Scholar] [CrossRef]
- Jasiukaitytė-Grojzdek, E.; Kunaver, M.; Crestini, C. Lignin structural changes during liquefaction in acidified ethylene glycol. J. Wood Chem. Technol. 2012, 32, 342–360. [Google Scholar] [CrossRef][Green Version]
- Jasiukaitytė, E.; Kunaver, M.; Crestini, C. Lignin behaviour during wood liquefaction—Characterization by quantitative 31P, 13C NMR and size-exclusion chromatography. Catal. Today 2010, 156, 23–30. [Google Scholar] [CrossRef]
- Yip, J.; Chen, M.; Szeto, Y.; Yan, S. Comparative study of liquefaction process and liquefied products from bamboo using different organic solvents. Bioresour. Technol. 2009, 100, 6674–6678. [Google Scholar] [CrossRef]
- Faris, A.H.; Ibrahim, M.N.M.; Rahim, A.A.; Hussin, M.H.; Brosse, N. Preparation and characterization of lignin polyols from the residues of oil palm empty fruit bunch. BioResources 2015, 10, 7339–7352. [Google Scholar] [CrossRef]
- Cinelli, P.; Anguillesi, I.; Lazzeri, A. Green synthesis of flexible polyurethane foams from liquefied lignin. Eur. Polym. J. 2013, 49, 1174–1184. [Google Scholar] [CrossRef]
- Mohammadpour, R.; Mir Mohamad Sadeghi, G. Effects of some material parameters on lignin biopolymer liquefaction by microwave heating. Iran. Polym. J. 2020, 29, 147–159. [Google Scholar] [CrossRef]
- Xue, B.-L.; Wen, J.-L.; Sun, R.-C. Producing lignin-based polyols through microwave-assisted liquefaction for rigid polyurethane foam production. Materials 2015, 8, 586–599. [Google Scholar] [CrossRef] [PubMed]
- Ionescu, M. Chemistry and Technology Of Polyols for Polyurethanes; Smithers Rapra Publishing: Shawbury, UK, 2005. [Google Scholar]
- ISO 14040a; Environmental Management—Life Cycle Assessment—Principles and Framework. ISO: Geneva, Switzerland, 2006.
- ISO 14040b; Environmental Management—Life Cycle Assessment—Principles and Framework. ISO: Geneva, Switzerland, 2006.
- SimaPro. Sustainability SimaPro. Available online: https://simapro.com/ (accessed on 5 September 2023).
- Wernet, G.; Bauer, C.; Steubing, B.; Reinhard, J.; Moreno-Ruiz, E.; Weidema, B. The ecoinvent database version 3 (part I): Overview and methodology. Int. J. Life Cycle Assess. 2016, 21, 1218–1230. [Google Scholar] [CrossRef]
- Tortoioli, S.; Paolotti, L.; Romagnoli, F.; Boggia, A.; Rocchi, L. Environmental Assessment of Bio-Oil Transformation from Thistle in the Italian Context: An LCA Study. Environ. Clim. Technol. 2020, 24, 430–446. [Google Scholar] [CrossRef]
- Barros Lovate Temporim, R.; Cavalaglio, G.; Petrozzi, A.; Coccia, V.; Cotana, F.; Nicolini, A. Life Cycle Assessment of Cynara cardunculus L. -Based Polygeneration and Biodiesel Chains. Sustainability 2022, 14, 13868. [Google Scholar] [CrossRef]
- Giannoni, T.; Gelosia, M.; Bertini, A.; Fabbrizi, G.; Nicolini, A.; Coccia, V.; Iodice, P.; Cavalaglio, G. Fractionation of Cynara cardunculus L. by Acidified Organosolv Treatment for the Extraction of Highly Digestible Cellulose and Technical Lignin. Sustainability 2021, 13, 8714. [Google Scholar] [CrossRef]
- Piccinno, F.; Hischier, R.; Seeger, S.; Som, C. From laboratory to industrial scale: A scale-up framework for chemical processes in life cycle assessment studies. J. Clean. Prod. 2016, 135, 1085–1097. [Google Scholar] [CrossRef]
- IPCC. Guidelines for National Greenhouse Gas Inventories; IPCC: Geneva, Switzerland, 2006. [Google Scholar]
- Sluiter, J.B.; Ruiz, R.O.; Scarlata, C.J.; Sluiter, A.D.; Templeton, D.W. Compositional analysis of lignocellulosic feedstocks. 1. Review and description of methods. J. Agric. Food Chem. 2010, 58, 9043–9053. [Google Scholar] [CrossRef]
- Sequeiros, A.; Serrano, L.; Briones, R.; Labidi, J. Lignin liquefaction under microwave heating. J. Appl. Polym. Sci. 2013, 130, 3292–3298. [Google Scholar] [CrossRef]
- ASTM D4274-21; Standard Test Method for Testing Polyurethane Raw Materials: Determination of Hydroxyl Numbers of Polyols. ASTM: West Conshohocken, PA, USA, 2005.
- Bello, S.; Ríos, C.; Feijoo, G.; Moreira, M.T. Comparative evaluation of lignocellulosic biorefinery scenarios under a life-cycle assessment approach. Biofuels Bioprod. Biorefin. 2018, 12, 1047–1064. [Google Scholar] [CrossRef]
- Uihlein, A.; Schebek, L. Environmental impacts of a lignocellulose feedstock biorefinery system: An assessment. Biomass Bioenergy 2009, 33, 793–802. [Google Scholar] [CrossRef]
- Jeswani, H.K.; Falano, T.; Azapagic, A. Life cycle environmental sustainability of lignocellulosic ethanol produced in integrated thermo-chemical biorefineries. Biofuels Bioprod. Biorefin. 2015, 9, 661–676. [Google Scholar] [CrossRef]
- Naimi, L.J.; Sokhansanj, S. Data-based equation to predict power and energy input for grinding wheat straw, corn stover, switchgrass, miscanthus, and canola straw. Fuel Process. Technol. 2018, 173, 81–88. [Google Scholar] [CrossRef]
- Han, J.; Son, M.; Kang, D. Process design and environmental analysis for catalytic production of gamma-valerolactone from Kenaf. J. Ind. Eng. Chem. 2023, 120, 254–260. [Google Scholar] [CrossRef]
- Green, D.W.; Perry, R.H. Perry’s Chemical Engineers’ Handbook; McGraw-Hill Education: New York, NY, USA, 2008. [Google Scholar]
- Anlauf, H. Mechanical Solid–Liquid Separation, Introduction. In Ullmann’s Encyclopedia of Industrial Chemistry; Verlag Chemie: Hoboken, NJ, USA, 2000; pp. 1–13. [Google Scholar]
- Barbanera, M.; Castellini, M.; Tasselli, G.; Turchetti, B.; Cotana, F.; Buzzini, P. Prediction of the environmental impacts of yeast biodiesel production from cardoon stalks at industrial scale. Fuel 2021, 283, 118967. [Google Scholar] [CrossRef]
- Koch, D.; Paul, M.; Beisl, S.; Friedl, A.; Mihalyi, B. Life cycle assessment of a lignin nanoparticle biorefinery: Decision support for its process development. J. Clean. Prod. 2020, 245, 118760. [Google Scholar] [CrossRef]
- Huijbregts, M.A.; Steinmann, Z.J.; Elshout, P.M.; Stam, G.; Verones, F.; Vieira, M.; Zijp, M.; Hollander, A.; Van Zelm, R. ReCiPe2016: A harmonised life cycle impact assessment method at midpoint and endpoint level. Int. J. Life Cycle Assess. 2017, 22, 138–147. [Google Scholar] [CrossRef]
- Antunes, A.; Amaral, E.; Belgacem, M. Cynara cardunculus L.: Chemical composition and soda-anthraquinone cooking. Ind. Crops Prod. 2000, 12, 85–91. [Google Scholar] [CrossRef]
- Zhao, X.; Zhang, L.; Liu, D. Biomass recalcitrance. Part I: The chemical compositions and physical structures affecting the enzymatic hydrolysis of lignocellulose. Biofuels Bioprod. Biorefin. 2012, 6, 465–482. [Google Scholar] [CrossRef]
- Fabbrizi, G.; Giannoni, T.; Lorenzi, L.; Nicolini, A.; Iodice, P.; Coccia, V.; Cavalaglio, G.; Gelosia, M. High Solid and Low Cellulase Enzymatic Hydrolysis of Cardoon Stems Pretreated by Acidified γ-Valerolactone/Water Solution. Energies 2022, 15, 2600. [Google Scholar] [CrossRef]
- Barros Lovate Temporim, R.; Cavalaglio, G.; Petrozzi, A.; Coccia, V.; Iodice, P.; Nicolini, A.; Cotana, F. Life Cycle Assessment and Energy Balance of a Polygeneration Plant Fed with Lignocellulosic Biomass of Cynara cardunculus L. Energies 2022, 15, 2397. [Google Scholar] [CrossRef]
- Deligios, P.A.; Sulas, L.; Spissu, E.; Re, G.A.; Farci, R.; Ledda, L. Effect of input management on yield and energy balance of cardoon crop systems in Mediterranean environment. Eur. J. Agron. 2017, 82, 173–181. [Google Scholar] [CrossRef]
- Caloiero, T.; Coscarelli, R.; Gaudio, R.; Leonardo, G.P. Precipitation trend and concentration in the Sardinia region. Theor. Appl. Climatol. 2019, 137, 297–307. [Google Scholar] [CrossRef]
- Helling, R.K.; Russell, D.A. Use of life cycle assessment to characterize the environmental impacts of polyol production options. Green Chem. 2009, 11, 380–389. [Google Scholar] [CrossRef]
- von der Assen, N.; Bardow, A. Life cycle assessment of polyols for polyurethane production using CO2 as feedstock: Insights from an industrial case study. Green Chem. 2014, 16, 3272–3280. [Google Scholar] [CrossRef]
- Manzardo, A.; Marson, A.; Roso, M.; Boaretti, C.; Modesti, M.; Scipioni, A.; Lorenzetti, A. Life Cycle Assessment Framework To Support the Design of Biobased Rigid Polyurethane Foams. ACS Omega 2019, 4, 14114–14123. [Google Scholar] [CrossRef] [PubMed]


Disclaimer/Publisher’s Note: The statements, opinions and data contained in all publications are solely those of the individual author(s) and contributor(s) and not of MDPI and/or the editor(s). MDPI and/or the editor(s) disclaim responsibility for any injury to people or property resulting from any ideas, methods, instructions or products referred to in the content. |
© 2023 by the authors. Licensee MDPI, Basel, Switzerland. This article is an open access article distributed under the terms and conditions of the Creative Commons Attribution (CC BY) license (https://creativecommons.org/licenses/by/4.0/).