Abstract
This research employs a questionnaire survey to examine the influence of the late phase of the pandemic on the sustainability performance of the banking industry in Taiwan. This research focuses on the perceptions of bank employees and explores the mediating role of fintech adoption (FTA) and green finance (GF). A total of 325 valid responses were collected, and structural equation modeling (CB-SEM) AMOS.21 software was applied to analyze the overall model, while the SPSS.21 PROCESS (2017) was applied to analyze the mediating effects. The empirical findings reveal that green process innovation (GI) significantly affects both green finance and banking sector sustainability performance (BSP), perceived environmental responsibility (PER) positively influence GF and FTA, and both FTA and GF positively impact BSP; however, GI had no direct impact on FTA, and FTA had no direct impact on GF. In terms of the mediating effects, PER has a complete mediating effect on BSP through FTA or GF, while GF partially mediates the relationship between GI, PER, and BSP.
1. Introduction
Due to their effects and challenges on the business processes and sustainable performance of global banking institutions, GF, green processes, technology innovations, and sustainable management have become popular research topics in the finance industry following the late phase of the pandemic. [1]. Due to the economic instability and uncertainty brought about by the pandemic and the rise of contactless payment transactions [2], the period after the late phase of the pandemic has witnessed the development of innovative financial business models, particularly in the Asian region. The fintech operations of banking institutions were filled with innovation in the late phase of the pandemic [3]. Ref. [4] pointed out that the pandemic accelerated the digitization of banks by 3 to 10 years. In recent years, rapid economic developments have led to environmental degradation and various environmental issues [5,6]. FTA and GF have been recognized as necessary conditions for achieving the “COP21—Paris Agreement” and the “Sustainable Development Goals” of the “United Nations” [7]. The investment demands of GF require the mobilization of large private capital; therefore, banking institutions play a vital role in accelerating the transition to sustainable development and climate neutrality [8]. GF is indispensable for the sustainable operations of banking institutions. Ref. [9] defined GF as the adoption of new financial services and strategies by banks; for example, green funds, green banks, carbon trading markets, green bonds, and financial policies and technologies, which are intended to enhance the ecological benefits of green financing and achieve sustainable development performance. Ref. [10] emphasized that effective utilization of financial resources can lead to financial innovation. An article published by [11] pointed out that green process innovation has emerged as one of the solutions for addressing environmental issues.
Ref. [12] provided extensive discussions regarding the applications of GF developments, which encompass interactions among the economy, the environment, and financial activities. The adoption of GI has become an approach to address environmental challenge issues, which must consider the key driving factors and antecedents, including relevant regulations. Refs. [5,13] provide the environmental determinants of technological and green process innovation [14]. Several studies [8,15,16,17] have determined that both green finance and traditional finance can invigorate the economy. GF can provide innovative financial facilities to enable the economy to adapt to climate change and reduce carbon emissions in the process of economic transformation and to consider the impact of long-term investments on the environment. GF includes the sustainable financial management modes of environmental management, social welfare, and corporate governance; thus, it is a unique financial instrument created to solve environmental damage. As GF integrates economic development and environmental protection, it is an innovative financial instrument for environmental protection. It is suggested that the adoption of innovative finance is related to the impact of green process innovation on the environment; thus, it is also the key factor of green finance and sustainable business performance. Refs. [18,19] explained that GI creates a balance between the economy and the ecological environment, thereby achieving sustainable development goals; however, in the current late phase of the pandemic, sustainable performance, green process innovation, and GF have not been confirmed [1]. The focus of this research is to examine the impacts of the perceptions of environmental responsibility and GI among Taiwan’s bank employees in the late phase of the pandemic on the sustainable performance of banks, as mediated by FTA and GF.
Recent studies [20,21] have explored the relationship between GF and sustainable business practices. Ref. [22] proposed mutually beneficial impacts between GF and GI. Ref. [23] pointed out that financial technology actively contributes to promoting sustainable practices in GF. Currently, there is a substantial body of research regarding the positive effects of GF, GI, and sustainability; however, there is limited research that specifically investigates BSP from the perspective of bank employees in the post-pandemic period. Ref. [1] conducted a study of the environmental factors related to GF, GI, and FTA in the banking sector. At present, most studies on GF focus on the qualitative research of the sustainable development of enterprises, while few studies focus on the impact of GI and PER on the sustainable operation of the banking sector through questionnaires conducted for bank employees. Against the background of the pandemic period, this research can fill the gap in the current research field by expressing the GI and PER to bank employees regarding BSP.
This research focused on the theory of planned behavior and examined the impact of perceived environmental responsibility and green process innovation on the BSP of institutions in the late phase of the pandemic. The unique contribution of this research lies in the inclusion of the independent variables of PER and GI, as well as the mediation of FTA and GF in examining the impact on BSP in the post-pandemic period. The relationship between GI, FTA, and BSP has not been comprehensively tested in the academic and research community. Hence, this research investigated this relationship within the context of the Taiwan banking industry. This investigation of Taiwan’s banking industry in and beyond the pandemic period can provide valuable insights for government agencies and bank managers in Taiwan when formulating GF policies and evaluating sustainable performance.
2. Literature Review and Hypotheses
2.1. Theory of Planned Behavior (TPB)
In the field of predictive psychology, behavior within the framework of the theory of planned behavior (TPB) is commonly used as a tool for predicting human behavior. Research has shown [24] that when the severity of a threat increases, individuals are most likely to intend to take some action to protect themselves from the threat. A study conducted in Turkey [25] showed that increasing individual environmental awareness significantly boosts the willingness to purchase green products. Ref. [26] demonstrated that environmental awareness significantly influences individuals’ willingness to make environmentally friendly purchases. In addition to using behavioral and normative expectations to predict intention, the theory of planned behavior incorporates perceived behavioral control [24]. Ref. [27] stated that PER refers to the individual’s responsibility not to have a harmful impact on the environment or others when engaging in environmental protection activities. This responsibility extends to all individuals within an organization [28].
This research adopted the variables of PER from the TPB. Previous studies have rarely combined GI with GF and FTA in the context of BSP. Therefore, this research aimed to investigate the impact of environmental awareness and GI on the sustainable performance of Taiwan’s banking industry in the late phase of the pandemic, as mediated by FTA and GF. This research explains the direct and indirect effects of environmental awareness among Taiwan’s bank employees on GF and GI in the overall banking industry, as well as their impact on BSP.
2.2. Green Process Innovation and Fintech Adoption
The global financial markets and economic landscape have been disrupted by the late phase of the pandemic [29,30,31]; thus, the banking industry has utilized FTA to enhance employee productivity and reduce costs, thereby enabling survival and sustainability during the transformation process [32]. This transformation towards FTA is facilitated by the characteristics of innovation diffusion, as observed in the early theory of innovation diffusion [33]. Innovation diffusion occurs within social systems, meaning innovations are disseminated through various channels of communication and over time; then, the individuals involved in this process reach a consensus in sharing and adopting the new ideas, leading to innovations [33,34], while fintech refers to the integration of modern technologies to innovate financial products and services. In recent years, financial technology has garnered significant attention and research interest in academia due to its potential for redefining financial services by enabling greater financial inclusion and delivering personalized experiences [35,36]. Ref. [37] indicated that green technological innovation and FTA can influence each other, while financial technology brings innovations in financial products, service models, and technological applications. Refs. [38,39] found that the benefits of financial technology include the ability to make rapid financial decisions, which facilitates instant payments and receipts within seconds; however, this may lead to a trade-off between efficiency and data transmission security. Therefore, this research proposes the following research hypothesis, H1.
H1:
There is a positive correlation between the GI and FTA of banking and financial institutions in the post-pandemic era.
2.3. Green Process Innovation, Green Finance, and a Bank’s Sustainability Performance
Wang [40] noted that in sustainable business, green finance is a crucial factor influencing green process innovation. Ref. [41] discovered that GI is an essential factor in enhancing sustainability performance, as did Ref. [11]. Recently, scholars have found that GI is a key driver for economic and social sustainability performance in various countries, enabling them to achieve GF [18]. Ref. [19] indicated that green process innovation can balance economic, social, and environmental aspects while simultaneously achieving sustainable developmental performance, thereby achieving sustainable development goals. Previous research has demonstrated that GF and GI can enhance sustainable performance by bringing new operational efficiency benefits through sustainable development objectives [8,15,16,17]. Therefore, this research proposes hypotheses H2 and H3, as follows:
H2:
There is a positive correlation between the GI and GF of banking and financial institutions in the post-pandemic era.
H3:
There is a positive correlation between the GI and BSP of banking and financial institutions in the post-pandemic era.
2.4. Perceived Environmental Responsibilities and Green Finance
Increased environmental awareness motivates individuals to engage in environmentally friendly behaviors. Ref. [42] also noted that a high level of environmental consciousness is often seen as a prerequisite for taking appropriate environmental protection actions [43]. Ref. [27] pointed out that perceived environmental responsibility entails protecting the ecosystem and ensuring that one’s activities do not have harmful effects. Elevation of personal environmental awareness represents a commitment to environmental protection, and environmentally aware individuals tend to consume and purchase green financial products [44,45]. Additionally, a study conducted in India [46] found that perceived environmental behavior influences the purchase of green products. Green finance is a comprehensive concept that can be put into practice by global banks through various initiatives, such as energy-saving measures, increasing green loan quotas, using recycled paper, and providing preferential terms for green loans [47]. The sustainability performance of the banking industry is derived from the activities of GF driven by an increased sense of environmental responsibility [48]. The crucial aspect of environmental awareness conservation lies in the outcomes of specific actions in GF [49]. Refs. [40,41] studied 57 developing countries and found that GF and environmental awareness protection mutually impact one another. Elevation of individual environmental awareness is a crucial factor in purchasing green products [50]. Particularly in the post-pandemic period, a heightened environmental consciousness among employees encourages them to engage in environmental protection and practice green banking. Therefore, this research proposes research hypothesis H4, as follows:
H4:
There is a positive correlation between the PER and GF of banking and financial institutions in the post-pandemic era.
2.5. Perceived Environmental Responsibilities, Fintech Adoption, and a Bank’s Sustainability Performance
In their study on financial technology in Malaysia, Ref. [51] demonstrated that FTA is driven by the perceived behavioral control of TPB and indicated an impact between the two. According to Ref. [52], recent research in South Africa shows that PER has significant impact on FTA. However, Ref. [53] found that it has not yet been concluded whether there is a mutual influence between sustainability performance and environmental perception of responsibility. Ref. [54] found that information based on increasing severity will indeed increase individuals’ willingness to mitigate their impact on climate change. Financial technology relies on green financial technology applications such as blockchain, artificial intelligence, big data, cloud computing, and internet finance that contribute to the achievement of sustainability goals in the banking industry [55]. In the past decade, there has been GI brought about by fintech, which is prompting the large banking industry to ramp up its investments in IT; for example, by 2019, fintech was the most advantageous investment for banking institutions [56] as was the adoption of financial technology integrates investments in green innovation technology within the banking industry. It facilitates the transformation of the banking industry and has significant impact on the overall economic and social sustainable transformation through the balance of financial inclusion and sustainable development [57]. FTA enhances the profitability, competitiveness, and BSP, thereby influencing financial sustainability development [58]. Therefore, the research hypotheses H5 and H6 are formulated as follows:
H5:
There is a positive correlation between the PER and FTA of banking and financial institutions in the post-pandemic era.
H6:
There is a positive correlation between the PER and BSP of banking and financial institutions in the post-pandemic era.
2.6. Fintech Adoption, Green Finance, and a Bank’s Sustainability Performance
Thakor [59] defined financial technology as the use of green financial technology to provide new and improved green financial service applications. New financial technology refers to the latest technologies of finance used for innovating financial service processes and products, and the widespread adoption of financial technology in traditional finance has broadened consumer experiences and the customization of financial products, enhancing the inclusivity of financial services. This phenomenon has garnered attention in the academic community and among consumers [35,36]. In and beyond the post-COVID-19 era, the enhancement of financial services through financial technology will expand the landscape of financial services [60]. Fintech is a key beneficiary of the Fourth Industrial Revolution [61] and extremely important for sustainable business development [62]. Therefore, FTA and GF are among the key drivers for achieving sustainable development [63]. FTA is not constrained by time, which allows GF to meet people’s financial product needs and enables banks to enhance their sustainable performance [55,64]. The recent literature also indicates that FTA supports sustainable development, and [40,65] found evidence that FTA has mutual impacts on GF. However, a study on the development of financial technology in China [66] provided evidence showing the significant negative impact of FTA on the development of GF. Therefore, this research proposes research hypotheses H7, H8, and H9, as follows:
H7:
There is a positive correlation between the FTA and GF of banking and financial institutions in the post-pandemic era.
H8:
There is a positive correlation between the GF and BSP of banking and financial institutions in the post-pandemic era.
H9:
There is a positive correlation between the FTA and BSP of banking and financial institutions in the post-pandemic era.
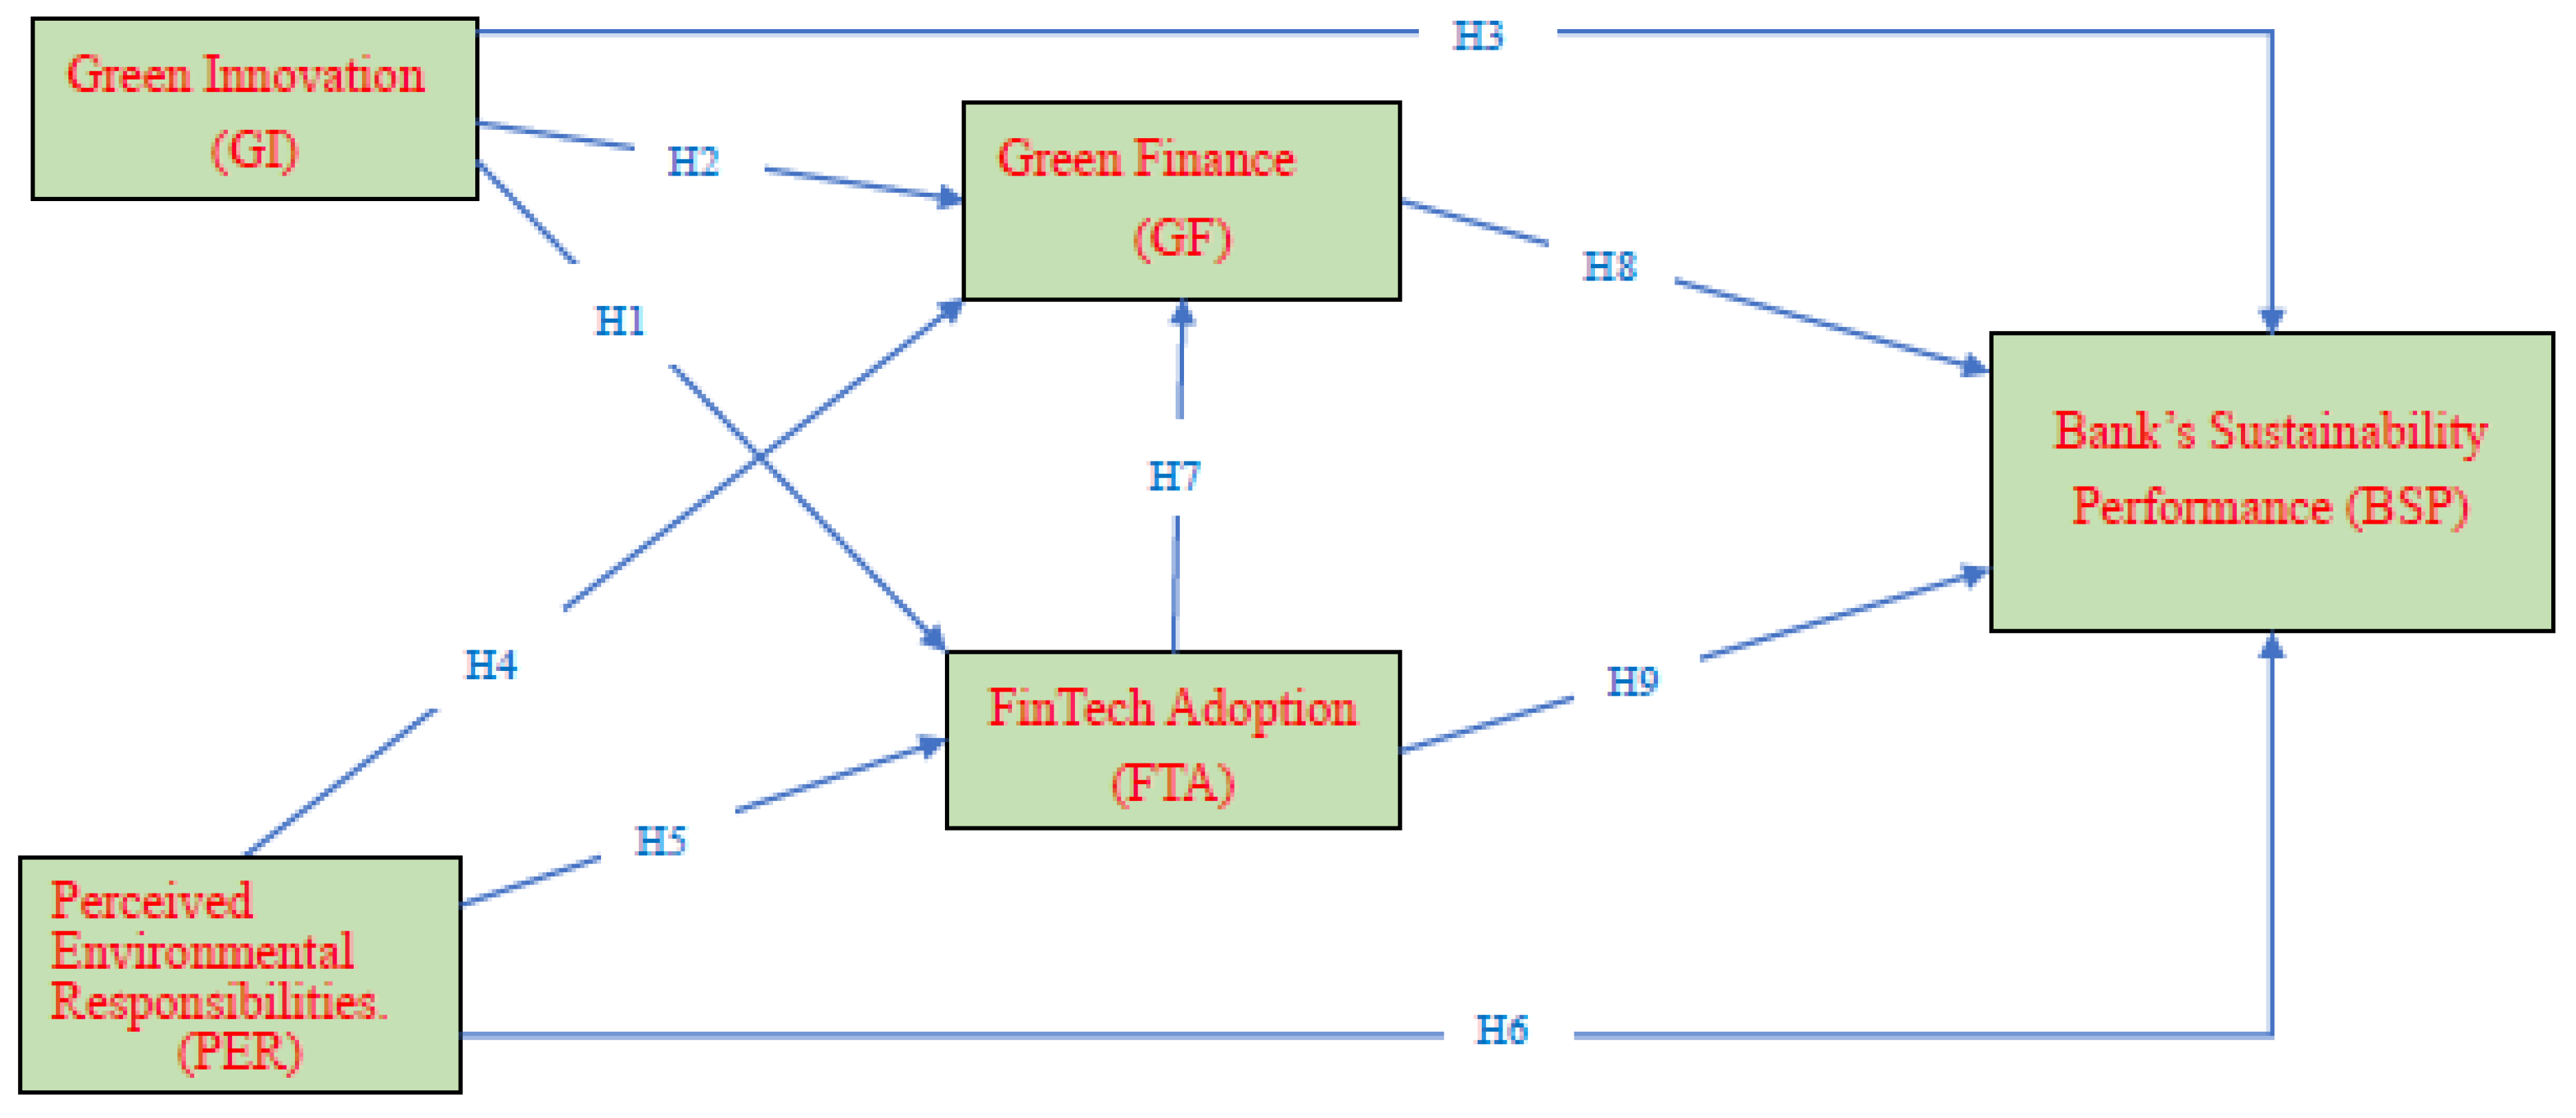
Based on the above theoretical framework, the structure of this research is shown in Figure 1.

Figure 1.
Conceptual framework of the research.
3. Research Method
3.1. Questionnaire Design
Based on the literature review, this research developed a questionnaire to measure the constructs related to green finance. Regarding the GF construct, five items were adapted from scales used by [67,68] to measure the impact of the increased amount of bank loans for environmental protection and recycling, as well as the investment increase in energy and green marketing on the sustainable business performance of green loans and green industry development in the new mode of environmental protection and financial management. Regarding the construct of FTA, five items were adapted from a scale developed by [69] to measure whether banks’ fintech adoption has reduced costs, saved energy costs, allowed information to flow, and reduced fraud risk, as well as the impact of bank employees’ fintech adoption on the sustainability performance of banks. The PER construct has five items adapted from a scale used by [70] to measure whether bank employees have increased awareness and determination regarding environmental protection under the threat of environmental change and to understand the impact of bank employees’ perceptions of environmental responsibility on sustainable business performance. The GI construct has four items adapted from a scale developed by [71]; for example, in operation, my bank can effectively save energy, reuse paper, and offer loans to enterprises to effectively protect the environment. The BSP construct has nine items adapted from a scale used by [72] to measure bank employees’ perceptions of sustainability performance. In terms of sustainable business performance, the banking sector aims to save energy and reduce waste, reduce costs, improve business performance, and enhance the image of banks. The questionnaire items are presented in Table 1.

Table 1.
Questionnaire items.
The structured questionnaire of this research was designed based on adaptations of the scales from the abovementioned scholars. While maintaining the intended meaning of the original questions, they were appropriately modified to suit the context of bank employees’ perceptions of sustainable performance. The questionnaire was reviewed by two bank executives and two scholars, and a pilot study was conducted with 35 participants to assess the reliability and consistency of the questionnaire. The results show that the Cronbach’s α reliability coefficient for each construct exceeded 0.70, which indicates the good reliability and consistency of the questionnaire items; thus, the questionnaire content was deemed consistent, reliable, and aligned with the banking industry’s current situation and effectively captured bank employees’ psychological perceptions. Based on these results, the formal questionnaire was administered.
3.2. Questionnaire Design and Sampling
The first part of the questionnaire collects respondents’ demographic information, while the second part contains measurement items for this research, including 5 items for GF, 4 items for GI, 5 items for PER, 5 items for FTA, and 9 items for BSP, for a total of 29 items. The questionnaire responses were collected using a seven-point Likert scale, and the questionnaire was distributed through the market research company DO SURVEY, which uses email surveys to collect data. All interviews in this research were conducted in Chinese. The collected data were recorded and transcribed by the researchers and then translated into English. The translated questionnaire was reviewed by professionals to ensure that it accurately reflected the intentions of the original questions.
The target population for the questionnaire was bank employees working in listed and non-listed banks in Taiwan. The questionnaires were distributed directly to bank employees to avoid sampling errors, thus ensuring responses from the target population. Specifically, general bank employees (accounted for about 60%) and supervisors (accounted for about 40%) were taken as the survey subjects to distinguish the possible influences caused by rank. The questionnaire was issued through an exclusion method, that is, the respondents were bank employees who completed the questionnaires to avoid sampling errors in responses from the respondents. The sampling period for this research was from 28 February 2023 to 10 June 2023; 383 questionnaires were collected, and, after excluding invalid responses, there were 325 valid responses. According to [73], a sample size ranging from 250 to 500 is considered appropriate for surveys. Additionally, Ref. [74] suggested that the sample size for SEM analysis should be at least 10 to 20 times the number of the model variables. Regarding maximum likelihood estimation (MLE) analysis, a sample size ten times the number of the model variables is the minimum requirement [75]. The sample size in this research meets the SEM sample-size requirements, as proposed by scholars.
3.3. Sample Characteristics
A total of 338 questionnaires were collected for analysis, and, after excluding invalid questionnaires, a total of 325 questionnaires were retained for statistical analysis using SPSS for Windows 21.0 software. Demographic data showed that 48% of the respondents were male, and 52% were female. The respondents were bank employees, with 76.02% aged between 35 and 64. The educational backgrounds of the respondents were varied, with 93.54% having a bachelor’s or master’s degree, and only 1.5% having a doctoral degree. General staff accounted for 60.62%, while managerial staff accounted for 39.38%. Publicly listed banks accounted for 70.46%, while non-listed banks accounted for 29.54%. A total of 66.77% of the respondents had more than 10 years of work experience in the banking industry, while 33.23% had less than 10 years of experience. A total of 84% of the bank employees showed increased concern for environmental issues in the post-pandemic period. Meanwhile, banks have been actively cultivating talents with knowledge of green and sustainable finance, with 71.38% currently involved in such initiatives and 21.23% planning future efforts. In summary, the analysis results indicate that Taiwan’s bank employees have shown greater concern for environmental protection issues in the post-pandemic period, and banking institutions have been actively fostering an understanding of green finance and cultivating talent. The demographic survey data are presented in Table 2.
Table 2.
The demographic profile of respondents.
3.4. Reliability and Validity Analysis
This research used composite reliability (CR) to measure the internal consistency of the items within each construct, where higher reliability indicates greater consistency among construct indicators. The CR values for the five constructs in this research were GI (0.851), GF (0.938), PER (0.781), FTA (0.839), and BSP (0.932). Average variance extracted (AVE) was used to measure the variance explained by the measurement variables with respect to the latent variables, where a higher AVE indicates that the observed variables better reflect the underlying traits of the common construct factors. The AVE values for the five constructs were GI (0.589), GF (0.716), PER (0.439), FTA (0.51), and BSP (0.605). All these values meet the convergence validity criteria proposed by [76], which states that CR values should be greater than 0.7, and AVE should be greater than 0.5. The factor loadings (λ) for all items, except for the item “Environmental conservation is not my obligation, but that of the government” (λ = 0.273), were above 0.6; therefore, all five constructs in this model demonstrate convergence validity. Refer to Table 3 for more details.
Table 3.
Analysis of confirmatory factors.
The research used CFA to detect the common method variance, and five eigenvalue factors were extracted using the VARIMAX axis. The explained variance of the first factor was 46.53%, and the explained variance of the cumulative five factors was 67.715%, which is consistent with the finding of [77]. When the explained variance of the first factor is less than 50%, it cannot explain all the variances. The test result was p < 0.000; thus, the problem of common method variance did not exist. This research examined the discriminant validity among the constructs using the average variance extracted (AVE) method. The square roots of the AVE for each construct, 0.714, 0.663, 0.767, 0.846, and 0.778, respectively, were greater than the correlation between the constructs, which demonstrates the presence of discriminant validity among the constructs [76]. Please refer to Table 4 for more details.
Table 4.
Discriminant validity.
4. Research Results
4.1. Data Analysis
This research employed AMOS 21 and SEM to assess the proposed hypotheses. SEM can provide comprehensive and complete information, including evaluations of all parameters. SEM is a multivariate statistical tool commonly used to examine relationships between latent variables [77], and it has been shown that SEM techniques can effectively discuss complex models in a straightforward manner [78,79]. Furthermore, CB-SEM is used to test existing theories [78]. As the research framework of this research is based on existing theories, CB-SEM was employed to explore the relationships between variables. SEM analysis provides a measure of fit between the hypothesized model and the collected data [80]. This research used the model fit indices recommended by scholars, such as [81,82], to assess the model fit. The chi-square value (model fit test statistic, χ2) compares the difference between the sample covariance matrix and the model-implied covariance matrix and serves as the foundation for evaluating SEM fit indices, which include goodness of fit index (GFI), adjusted goodness of fit index (AGFI), root mean square error of approximation (RMSEA), comparative fit index (CFI), non-normed fit index (NNFI), incremental fit index (IFI), and standardized root mean square residual (SRMR).
The chi-square value, which is sensitive to the sample and can be influenced by the complexity of the model, was calculated using the maximum likelihood (ML) estimation method. Ref. [83] suggested using the ratio of the chi-square value (χ2) to the degrees of freedom (df) (χ2/df) as an indicator of overall fit, where a χ2/df ratio of 5 or less is considered acceptable [73]. GFI and AGFI values ranging from 0.8 to 0.89 indicate reasonable fit [84,85,86], while an RMSEA value between 0.05 and 0.08 suggests good model fit [73]. An NNFI value greater than 0.90 is considered a good fit indicator, with larger values indicating better fit [86,87].
4.2. Verification of the Hypothesis Results
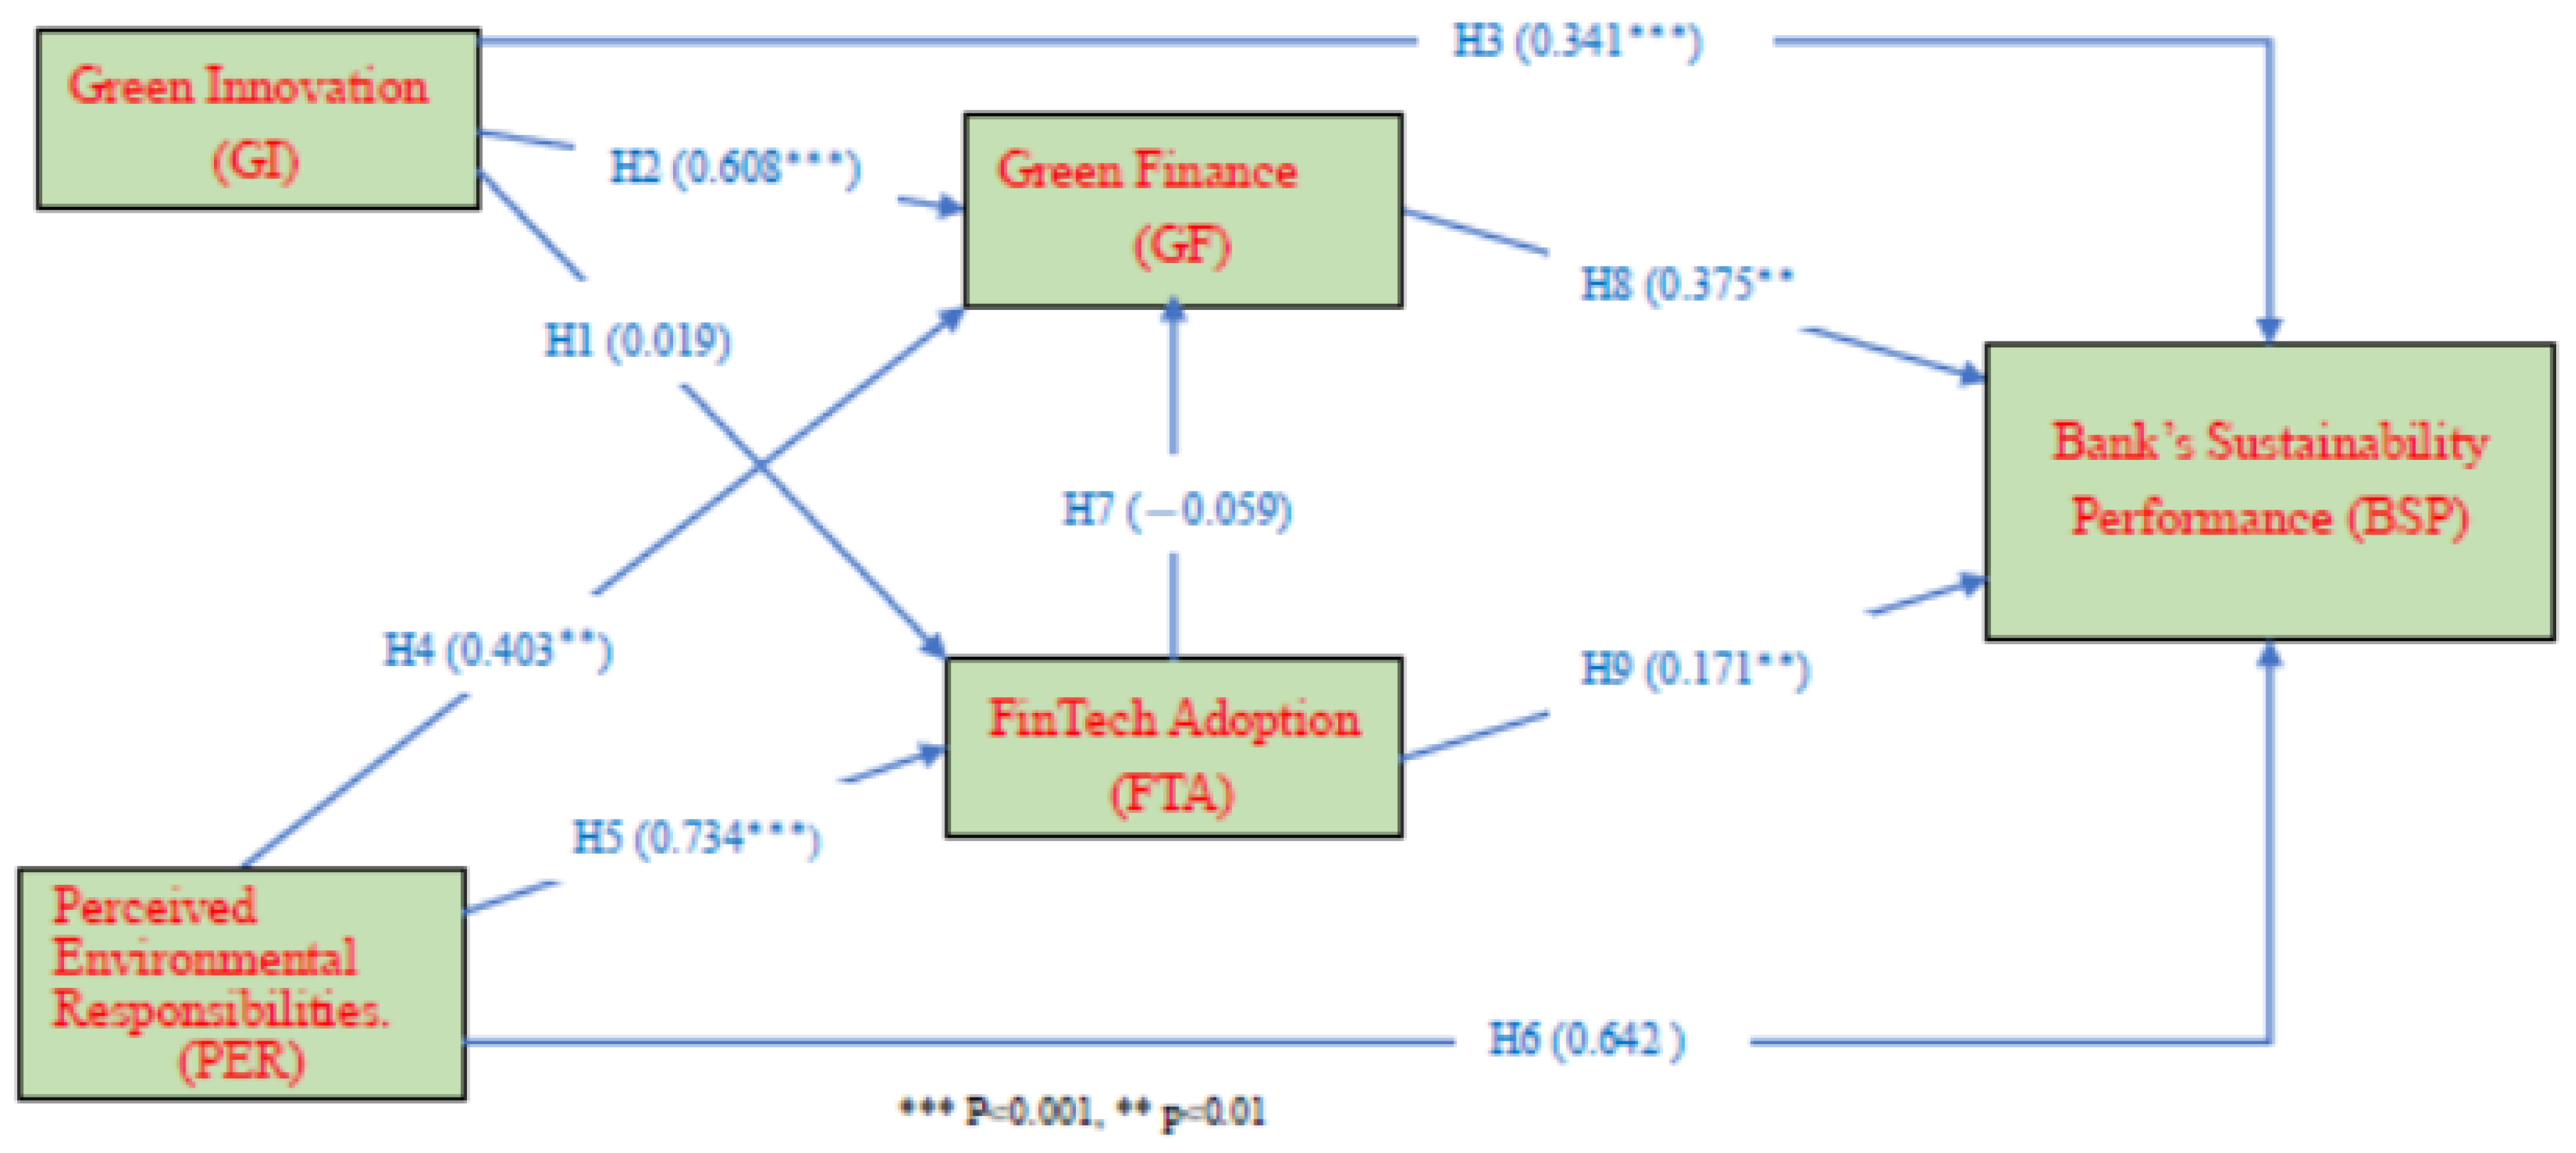
According to the results of the structural model analysis, the various fit indices of the research model are χ2 (Chi-square) = 988; χ2/df = 2.692; GFI = 0.815; AGFI = 0.781; RMSEA = 0.072; CFI = 0.905; and TLI = 0.900, which are within the scope proposed by scholars [86,87], and SRMR = 0.0531. Except for AGFI, which is 0.78, all other indices meet the recommended criteria mentioned earlier, indicating the research model has good fit. The R2 values for the model are R2 (FTA) = 0.395; R2 (GF) = 0.714; and R2 (BSP) = 0.706, indicating a moderate level of explanatory power for the model. The main purpose of this research is to examine whether the PER of bank employees and GI have an impact on BSP in the late phase of the pandemic. Additionally, this research investigates whether FTA and GF mediate the effects of PER and GI on BSP.
This research revealed some notable findings. The results showed that GI has significant influence on GF (β = 0.608, p = 0.000) and BSP (β = 0.341, p = 0.000), which supports hypotheses H2 and H3 of this research. These findings are consistent with the research of [8,11,15,16,17,18,40,41]. Furthermore, PER has significant impact on GF (β = 0.403, p = 0.000) and FTA (β = 0.734, p = 0.000); employees use perceived behavior to increase their willingness to carry out FTA due to serious threats, which in turn affects the development of GF, and this is consistent with the PER proposed by the TPB [24], which supports hypotheses H4 and H5 of this research. These findings are consistent with the research findings of [56,57,58].
On the other hand, regarding the impact of GI on FTA (β = 0.019, p = 0.874), the impact of PER on BSP (β = −0.06, p = 0.642), and the impact of FTA on GF (β = −0.059, p = 0.38), the results were statistically insignificant, meaning hypotheses H1, H6, and H7 were not supported. These findings are consistent with the research of [39,53]. Furthermore, GF (β = 0.375, p = 0.000) and FTA have significant positive impact on BSP (β = 0.171, p = 0.000), which supports hypotheses H8 and H9 of this research. These findings are consistent with the research of [55], [64,65]. The overall model fit and results of the path analysis for each hypothesis are presented in Table 5 and Figure 2.
Table 5.
Result of final model.
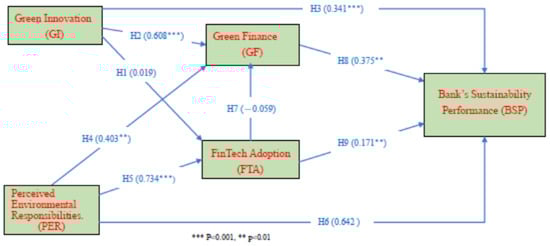
Figure 2.
Results of the structural model.
4.3. Mediation Effect Analysis
The mediation effect, also known as the indirect effect, refers to the influence of independent variable X1 on dependent variable Y through the mediating variable X2. The mediation effect is typically defined as a reduction in the regression coefficient of X1 on Y when the influence of X2 is controlled [88,89,90]. Bootstrap analysis, as introduced by [91], is a non-parametric statistical inference method that increases the sample size by repeatedly sampling from the existing sample, thereby approximating the population. This research used PROCESS macro version (Model 6) software for path analysis, as developed by [92], which is based on regression analysis to estimate and examine the moderated mediation models and calculate the conditional indirect effects [93]. Bootstrap analysis, as suggested by [94], was employed to test the indirect effects. The statistical software Process [93] was used for analysis, and 5000 bootstrap resamples, as recommended by [94], were conducted to validate the mediation effects.
Based on PROCESS Model 6, this research examined the indirect effects by checking the bias-corrected 95% of the confidence interval for the upper and lower bounds, excluding zero [94]. First, the mediation effect between PER and BSP was examined; then, the mediation effect between GI and BSP was examined. The results of the mediation effects of PER on BSP through FTA and GF are as follows: the bootstrap effect of PER on BSP through FTA is significant with β = 0.0896, (0.022, 0.169), indicating that the PER among bank employees affects BSP through FTA, which supports hypotheses H5 and H9. The bootstrap effect of PER on BSP through GF is significant with β = 0.1545, (0.082, 0.234), indicating that the perception of environmental responsibility among bank employees affects sustainable performance through GF, which supports hypotheses H4 and H8. The bootstrap effect of PER on BSP through FTA and GF is not significant with β = −0.0005, (−0.0259, 0.0251), indicating that during the late phase of the pandemic, the PER among bank employees did not have an impact on GF or on sustainable performance through FTA, which supports hypotheses H5 and H8, but does not support H7.
The total indirect effect of PER on BSP is β = 0.2436, (0.151, 0.342), which is significant. The direct effect of PER on BSP is β = 0.067, (−0.059, 0.195). Based on the research conducted by [90,95,96] regarding the judgment of mediation effects, if the indirect effect falls within the 95% confidence interval and includes zero, it is not significant, indicating no mediation effect. If the indirect effect falls within the 95% confidence interval and does not include zero, it is significant, indicating a mediation effect. If the direct effect falls within the 95% confidence interval and includes zero, it is not significant, indicating a complete mediation effect. The abovementioned results indicate that FTA and GF fully mediate the relationship between PER and BSP.
Mediation effects of GI on BSP through FTA and GF: the bootstrap effect of GI on BSP through FTA is not significant with β = 0.012, (−0.008, 0.044), indicating that the impact of GI through FTA on BSP is not significant, which supports H9, but does not support H1. The bootstrap effect of GI on BSP through GF is significant with β = 0.199, (0.119, 0.293), indicating that the impact of GI through GF on BSP is significant, which supports hypotheses H2 and H8. The bootstrap effect of GI on BSP through FTA and GF is not significant with β = 0.000, (−0.004, 0.006), indicating that the impact of GI on FTA and GF on BSP is not significant, which supports H8, but not H1 or H7.
The total indirect effect of GI on BSP is β = 0.211, (0.135, 0.300), indicating that green innovation by bank employees can affect BSP. The direct effect of GI on BSP is β = 0.261, (0.163, 0.359). Based on the research conducted by [90,95,96] regarding the study of mediation effects, the results of this research indicate that FTA and GF partially mediate the relationship between GI and BSP. The PROCESS Model 6 analysis results are shown in Table 6.
Table 6.
The path’s indirect effect from the mediation models. (Model 6).
5. Conclusions
The focus of this research was to examine the impact of employees’ PER and GI on BSP in Taiwan in the late phase of the pandemic. This research attempted to investigate the mediating role of FTA and GF in the relationship between PER, GI, and BSP in the context of Taiwan’s banking institutions. This research employed the CB-SEM technique to examine the relationships among the variables, and the empirical findings indicate that GI has a significant positive impact on GF and BSP, while PER has a significant positive impact on GF and FTA. Notably, there were no significant effects of GI on FTA or GF or of PER on BSP during the post-pandemic period. Furthermore, the results demonstrate that both GF and GI have a significant impact on BSP. Additionally, the empirical data show the mediating role of GF in the relationship between PER, GI, and BSP in the context of banking institutions.
This research identified some notable findings. The results indicate that FTA has not had a significant effect on GI among Taiwan’s banking employees during the post-pandemic period. This phenomenon can be attributed to employees’ initial concerns about the security of fintech, which resulted in lower adoption rates before the pandemic; however, during the pandemic, the avoidance of physical contact led to an increase in FTA. Post-pandemic, employees no longer perceive financial technology as having significant influence on GF. Additionally, the innovations of green processes do not necessarily have to rely on financial technology to impact sustainable performance. Therefore, in and beyond the post-pandemic period, this research confirms that Taiwan’s banking employees have doubts about the security of financial technology and are more inclined to enhance BSP through GI, which differs from other research findings. Furthermore, this research found that there has been no significant impact of FTA on GF among Taiwan’s banking employees in the late phase of the pandemic. Non-contact financial technology can achieve green financing and fund management through green process innovation. PER does not have a significant effect on BSP. Employees must rely on GF or FTA to achieve sustainable performance through their perception of environmental responsibility.
Based on the empirical findings of this research, FTA has significant impact on BSP, which implies that adopting new financial technology is an important step for the banking industry in order to achieve sustainable performance, such as e-payments, digital lending, mobile banking, online customer services, etc. As FTA enhances BSP, it is recommended that banks incorporate financial technology into their daily operations to achieve overall sustainability.
The results also indicate that GI has a favorable impact on GF, which means that GI contributes to increasing the acceptance of GF within banking institutions and enables the banking industry to achieve sustainable performance.
In the late phase of the pandemic, employees use perceived behavior to increase their willingness to carry out FTA due to serious threats, which in turn affects the development of GF. The findings of this research show that PER has a significant impact on both GF and FTA among employees, which suggests that the late phase of the pandemic has indeed heightened employees’ awareness of environmental protection. This is consistent with the PER proposed by the TPB. Simultaneously, in response to the pandemic, the banking industry has leveraged FTA to create new fintech and green investment channels to enhance the operation of green funds, which play a crucial role in providing GF. Overall, the results of this research highlight the importance of FTA and GI in promoting BSP, while underscoring the role of employees’ PER and the industry’s efforts to respond to the late phase of the pandemic by embracing FTA and promoting GF.
Finally, the mediation results demonstrate that GF fully mediates the relationship between GI in BSP, which indicates that GI has direct impact on BSP and is indirectly influenced by the mediating role of GF. Moreover, the empirical data show that GF plays a significant mediating role between PER and BSP, which highlights the importance of green activities, such as GF, green banking, and green financing, in enhancing the relationship between PER, GI, and SP. There is a lack of literature that focuses on the relationship between GI, PER, and BSP from the perspective of banking industry employees, particularly using FTA and GF as mediators, in a developed country like Taiwan. This research addresses this gap in the existing literature. In conclusion, FTA, GF, and GI can contribute to reducing carbon emissions and paper usage, save energy, and provide green training for banking employees, which will lead to significant improvements in BSP. Enhancing the overall sustainability performance of banks can contribute to Taiwan’s green growth; therefore, bank managers should focus on adopting financial technology and developing green process innovations to support the sustainable operations of their organizations.
This research examines how banking institutions can utilize employees’ PER, GI, FTA, and GF to enhance the overall BSP. The research findings demonstrate the importance of integrating employees’ perceptions of environmental responsibility and the practices of GI, FTA, and GF into the daily operations of banking institutions to achieve sustainable performance. Furthermore, the results provide practical managerial insights for bank managers and policymakers, including the use of innovative fintech and the funding of green finance initiatives to improve the overall sustainability performance of the financial sector, enhance employees’ attitudes towards environmental protection, and foster a culture of green process innovations within banks. To enhance sustainable performance, managers and policymakers must prioritize the adoption of innovative fintech, green finance, and green process innovations. This research makes significant contributions to the literature regarding environmental sustainability, FTA, GF, green process innovation, and sustainable performance management in banking.
6. Limitations and Future Research Directions
There are several limitations to this research that need to be addressed in future research. Firstly, as the questionnaire was anonymous, the respondents could not be tracked; thus, in-depth interviews were not conducted. The authors will pay attention to this part in the follow-up research. As the sample size of this research was limited to 325 employees from Taiwan banks, the findings may not be applicable to other countries or banking sectors; thus, the results are only generalizable to banking industries with economic and cultural backgrounds similar to Taiwan. Future research could utilize larger samples and include participants from financial industries in different countries. Secondly, this research examined the effects of perceived environmental responsibility (PER) and green process innovation (GI) on banking sector sustainability performance (BSP), with fintech adoption (FTA) and GF as mediators. However, incorporating additional mediators, such as environmental strategic analysis, employee green behavior, and improved green technological capabilities, could enhance the explanatory power of the existing research model. Finally, the assessment measures of banking sector sustainability performance (BSP) did not consider whether the studied banks had established sustainable development policies and procedures to demonstrate their commitment to sustainable performance; therefore, it is suggested that future research could consider incorporating multigroup analysis as a research method and focus on alternative environmental promotion strategies, thereby enhancing the analytical and explanatory capabilities of the research model.
Author Contributions
Conceptualization, T.-L.L., T.T.L. and S.-Y.H.; methodology, T.-L.L., T.T.L. and S.-Y.H.; software T.-L.L. and S.-Y.H.; validation, T.-L.L., T.T.L. and S.-Y.H.; formal analysis, T.-L.L. and S.-Y.H.; resources, T.-L.L.; data curation, T.-L.L. and S.-Y.H.; writing—original draft preparation, T.-L.L.; writing—review and editing, T.-L.L., T.T.L. and S.-Y.H.; visualization, S.-Y.H.; supervision, T.-L.L., T.T.L. and S.-Y.H.; project administration, T.T.L.; funding acquisition, T.T.L. All authors have read and agreed to the published version of the manuscript.
Funding
This research received no external funding.
Institutional Review Board Statement
Not applicable.
Informed Consent Statement
Not applicable.
Data Availability Statement
Data are contained within the article.
Acknowledgments
The authors would like to thank the anonymous reviewers for their valuable comments, which have helped improve the presentation of this article.
Conflicts of Interest
The authors declare no conflict of interest.
References
- Guang-Wen, Z.; Siddik, A.B. The effect of Fintech adoption on green finance and environmental performance of banking institutions during the COVID-19 pandemic: The role of green innovation. Environ. Sci. Pollut. Res. Int. 2023, 30, 25959–25971. [Google Scholar] [CrossRef]
- Yan, C.; Siddik, A.B.; Akter, N.; Dong, Q. Factors influencing the adoption intention of using mobile financial service during the COVID-19 pandemic: The role of FinTech. Environ. Sci. Pollut. Res. Int. 2021, 30, 61271–61289. [Google Scholar] [CrossRef]
- Liu, T.L.; Lin, T.T.; Hsu, S.Y. Continuance Usage Intention toward E-Payment during the COVID-19 Pandemic from the Financial Sustainable Development Perspective Using Perceived Usefulness and Electronic Word of Mouth as Mediators. Sustainability 2022, 14, 7775. [Google Scholar] [CrossRef]
- The Financial Brand. Available online: https://reurl.cc/x7AjaN (accessed on 25 July 2023).
- Qi, G.Y.; Shen, L.Y.; Zeng, S.X.; Jorge, O.J. The drivers for contractors’ green innovation: An industry perspective. J. Clean. Prod. 2010, 18, 1358–1365. [Google Scholar] [CrossRef]
- Panwar, N.; Kaushik, S.; Kothari, S. Role of renewable energy sources in environmental protection: A review. Renew. Sustain. Energy Rev. 2011, 15, 1513–1524. [Google Scholar] [CrossRef]
- UNEP. The Financial System We Need: Aligning the Financial System with Sustainable Development. Nairobi: United Nations Environment Programmer. 2015. Available online: https://reurl.cc/lDAj4q (accessed on 25 July 2023).
- Maltais, A.; Nykvist, B. Understanding the role of green bonds in advancing sustainability. J. Sustain. Finance Investig. 2020, 1–20. [Google Scholar] [CrossRef]
- Berensmann, K.; Lindenberg, N. Corporate Social Responsibility, Ethics and Sustainable Prosperity, 1st ed.; World Scientific: Fitchburg, MA, USA, 2019; pp. 305–332. [Google Scholar]
- Furuoka, F. Financial development and energy consumption: Evidence from a heterogeneous panel of Asian countries. Renew. Sust. Energ. Rev. 2015, 52, 430–444. [Google Scholar] [CrossRef]
- Weng, H.H.; Chen, J.S.; Chen, P.C. Effects of green innovation on environmental and corporate performance: A stakeholder perspective. Sustainability 2015, 7, 4997–5026. [Google Scholar] [CrossRef]
- Zhang, B.; Wang, Y. The effect of green finance on energy sustainable development: A case study in China. Emerg. Mark. Financ. Trade 2021, 57, 3435–3454. [Google Scholar] [CrossRef]
- Kammerer, D. The effects of customer benefit and regulation on environmental product innovation: Empirical evidence from appliance manufacturers in germany. Ecol. Econ. 2009, 68, 2285–2295. [Google Scholar] [CrossRef]
- Lin, C.-Y.; Ho, Y.-H. Determinants of green practice adoption for logistics companies in China. J. Bus. Ethics 2011, 98, 67–83. [Google Scholar] [CrossRef]
- Umar, M.; Safi, A. Do green finance and innovation matter for environmental protection? A case of OECD economies. Energy Econ. 2023, 119, 106560. [Google Scholar] [CrossRef]
- Wang, K.; Tsai, S.B.; Du, X.; Bi, D. Internet finance, green finance, and sustainability. Sustainability 2019, 11, 3856. [Google Scholar] [CrossRef]
- Singh, A.K.; Raza, S.A.; Nakonieczny, J.; Shahzad, U. Role of financial inclusion, green innovation, and energy efficiency for environmental performance? Evidence from developed and emerging economies in the lens of sustainable development. Struct. Chang. Econ. Dyn. 2023, 64, 213–224. [Google Scholar]
- Guo, J.; Zhou, Y.; Ali, S.; Shahzad, U.; Cui, L. Exploring the role of green innovation and investment in energy for environmental quality: An empirical appraisal from provincial data of China. J. Environ. Manag. 2021, 292, 112779. [Google Scholar] [CrossRef]
- Álvarez-Herránz, A.; Balsalobre, D.; Cantos, J.M.; Shahbaz, M. Energy innovations-GHG emissions nexus: Fresh empirical evidence from OECD countries. Energy Policy 2017, 101, 90–100. [Google Scholar] [CrossRef]
- Awawdeh, A.E.; Ananzeh, M.; El-khateeb, A.I.; Aljumah, A. Role of green financing and corporate social responsibility (CSR) in technological innovation and corporate environmental performance: A COVID-19 perspective. China Financ. Rev. Int. 2022, 12, 297–316. [Google Scholar] [CrossRef]
- Chen, J.; Siddik, A.B.; Zheng, G.-W.; Masukujjaman, M.; Bekhzod, S. The effect of green banking practices on banks’ environmental performance and green financing: An empirical study. Energies 2022, 15, 1292. [Google Scholar] [CrossRef]
- Xu, H.; Mei, Q.; Shahzad, F.; Liu, S.; Long, X.; Zhang, J. Untangling the impact of green finance on the enterprise green performance: A meta-analytic approach. Sustainability 2020, 12, 9085. [Google Scholar] [CrossRef]
- Muganyi, T.; Yan, L.; Sun, H.P. Green finance, fintech and environmental protection: Evidence from China. Environ. Sci. Ecotechnol. 2021, 7, 100107. [Google Scholar] [CrossRef]
- Ajzen, I. The Theory of Planned Behavior. Organ. Behav. Hum. Decis. Process. 1991, 50, 179–211. [Google Scholar] [CrossRef]
- Albayrak, T.; Aksoy, Ş.; Caber, M. The effect of environmental concern and scepticism on green purchase behaviour. Mark. Intell. Plan. 2013, 31, 27–39. [Google Scholar] [CrossRef]
- Zaremohzzabieh, Z.; Ismail, N.; Ahrari, S.; Samah, A.A. The effects of consumer attitude on green purchase intention: A meta-analytic path analysis. J. Bus. Res. 2021, 132, 732–743. [Google Scholar] [CrossRef]
- Barr, S. Strategies for sustainability: Citizens and responsible environmental behaviour. Area 2003, 35, 227–240. [Google Scholar] [CrossRef]
- Kumar, P.; Ghodeswar, B.M. Factors affecting consumers’ green product purchase decisions. Mark. Intell. Plan. 2015, 33, 330–347. [Google Scholar] [CrossRef]
- Dai, P.-F.; Xiong, X.; Liu, Z.; Huynh, T.L.D.; Sun, J. Preventing crash in stock market: The role of economic policy uncertainty during COVID-19. Financ. Innov. 2021, 7, 31. [Google Scholar] [CrossRef] [PubMed]
- Ramelli, S.; Wagner, A.F. Feverish Stock Price Reactions to COVID-19. Rev. Corp. Financ. Stud. 2020, 9, 622–655. [Google Scholar] [CrossRef]
- Almeida, H. Liquidity management during the Covid-19 pandemic. Asia-Pac. J. Financ. Stud. 2021, 50, 7–24. [Google Scholar] [CrossRef]
- Fleisch, E. What is the internet of things? An economic perspective. J. Econ. Financ. 2010, 5, 125–157. [Google Scholar]
- Rogers, E.M. Die Diffusion von Innovationen in der Telekommunikation, 1st ed.; Springer: Berlin/Heidelberg, Germany, 1995; pp. 25–38. [Google Scholar]
- Rogers, E.M. Diffusion of preventive innovations. Addict. Behav. 2002, 27, 989–993. [Google Scholar] [CrossRef]
- Chueca Vergara, C.; Ferruz Agudo, L. Fintech and sustainability: Do they affect each other? Sustainability 2021, 13, 7012. [Google Scholar] [CrossRef]
- Zarrouk, H.; El Ghak, T.; Bakhouche, A. Exploring economic and technological determinants of FinTech startups’ success and growth in the United Arab Emirates. J. Open Innov. Technol. Mark. Complex. 2021, 7, 50. [Google Scholar] [CrossRef]
- Xue, Q.; Bai, C.; Xiao, W. Fintech and corporate green technology innovation: Impacts and mechanisms. MDE Manag. Decis. Econ. 2022, 43, 3898–3914. [Google Scholar] [CrossRef]
- Farboodi, M.; Veldkamp, L. Long-run growth of financial data technology. Am. Econ. Rev. 2020, 110, 2485–2523. [Google Scholar] [CrossRef]
- Hommel, K.; Bican, P.M. Digital entrepreneurship in finance: Fintechs and funding decision criteria. Sustainability 2020, 12, 8035. [Google Scholar] [CrossRef]
- Wang, X. Research on the impact mechanism of green finance on the green innovation performance of China’s manufacturing industry. MDE Manag. Decis. Econ. 2022, 43, 2678–2703. [Google Scholar] [CrossRef]
- Wang, Q.J.; Wang, H.J.; Chang, C.P. Environmental performance, green finance and green innovation: What’s the long-run relationships among variables? Energy Econ. 2022, 110, 106004. [Google Scholar] [CrossRef]
- De Silva, M.; Wang, P.; Kuah, A.T. Why wouldn’t green appeal drive purchase intention? Moderation effects of consumption values in the UK and China. J. Bus. Res. 2021, 122, 713–724. [Google Scholar] [CrossRef]
- Tsarenko, Y.; Ferraro, C.; Sands, S.; McLeod, C. Environmentally conscious consumption: The role of retailers and peers as external influences. J. Retail. Consum. Serv. 2013, 20, 302–310. [Google Scholar] [CrossRef]
- Han, M.S.; Hampson, D.P.; Wang, Y.; Wang, H. Consumer confidence and green purchase intention: An application of the stimulus-organism-response model. J. Retail. Consum. Serv. 2022, 68, 103061. [Google Scholar] [CrossRef]
- Saut, M.; Saing, T. Factors affecting consumer purchase intention towards environmentally friendly products: A case of generation Z studying at universities in Phnom Penh. SN Bus. Econ. 2021, 1, 1–20. [Google Scholar] [CrossRef]
- Kumar, G.A. Framing a model for green buying behavior of Indian consumers: From the lenses of the theory of planned behavior. J. Clean. Prod. 2021, 295, 126487. [Google Scholar] [CrossRef]
- Du, H.; Chen, A.; Li, Y.; Ma, L.; Xing, Q.; Nie, Y. Perceived income inequality increases status seeking among low social class individuals. Asian J. Soc. Psychol. 2022, 25, 52–59. [Google Scholar] [CrossRef]
- Khairunnessa, F.; Vazquez-Brust, D.A.; Yakovleva, N. A review of the recent developments of green banking in Bangladesh. Sustainability 2021, 13, 1904. [Google Scholar] [CrossRef]
- Gu, X.; Qin, L.; Zhang, M. The impact of green finance on the transformation of energy consumption structure: Evidence based on China. Front. Earth Sci. 2023, 10, 1097346. [Google Scholar] [CrossRef]
- Chen, Y.S.; Chang, C.H. Enhance green purchase intentions: The roles of green perceived value, green perceived risk, and green trust. Manag. Decis. 2012, 50, 502–520. [Google Scholar] [CrossRef]
- Sharif, S.P.; Naghavi, N. Online financial trading among young adults: Integrating the theory of planned behavior, technology acceptance model, and theory of flow. Int. J. Hum. Comput. Interact. 2021, 37, 949–962. [Google Scholar] [CrossRef]
- Mazambani, L.; Mutambara, E. Predicting FinTech innovation adoption in South Africa: The case of cryptocurrency. Afr. J. Econ. Manag. 2020, 11, 30–50. [Google Scholar] [CrossRef]
- Huth, W.L.; Mcevoy, D.M.; Morgan, O.A. Controlling an invasive species through consumption: The case of lionfish as an impure public good. Ecol. Econ. 2018, 149, 74–79. [Google Scholar] [CrossRef]
- Chen, M.-F. Impact of fear appeals on pro-environmental behavior and crucial determinants. Int. J. Advert. 2016, 35, 74–92. [Google Scholar] [CrossRef]
- Nassiry, D. The role of fintech in unlocking green finance. In Policy Insights for Developing Countries; ADBI Working Paper, No. 883; Asian Development Bank Institute (ADBI): Tokyo, Japan, 2018. [Google Scholar]
- Kabulova, J.; Stankevičienė, J. Valuation of FinTech Innovation Based on Patent Applications. Sustainability 2020, 12, 10158. [Google Scholar] [CrossRef]
- Moro-Visconti, R.; Cruz Rambaud, S.; López Pascual, J. Sustainability in FinTechs: An Explanation through Business Model Scalability and Market Valuation. Sustainability 2020, 12, 10316. [Google Scholar] [CrossRef]
- Hõbe, L.; Alas, R. A Financial Services Innovation Management Model for Banks. J. Chang. Manag. 2015, 34, 138–154. [Google Scholar]
- Thakor, A.V. Fintech and banking: What do we know? J. Financ. Intermediat. 2020, 41, 100833. [Google Scholar] [CrossRef]
- Firmansyah, E.A.; Masri, M.; Anshari, M.; Besar, M.H.A. Factors affecting fintech adoption: A systematic literature review. FinTech 2022, 2, 21–33. [Google Scholar] [CrossRef]
- Jiao, Z.; Shahid, M.S.; Mirza, N.; Tan, Z. Should the fourth industrial revolution be widespread or confined geographically? A country-level analysis of fintech economies. Technol. Forecast. Soc. Chang. 2021, 163, 120442. [Google Scholar] [CrossRef]
- Deng, X.; Huang, Z.; Cheng, X. FinTech and sustainable development: Evidence from China based on P2P data. Sustainability 2019, 11, 6434. [Google Scholar] [CrossRef]
- Bai, J.; Chen, Z.; Yan, X.; Zhang, Y. Research on the impact of green finance on carbon emissions: Evidence from China. Econ. Res.-Ekon. Istraživanja 2022, 35, 6965–6984. [Google Scholar] [CrossRef]
- Gallego-Losada, M.J.; Montero-Navarro, A.; García-Abajo, E.; Gallego-Losada, R. Digital financial inclusion. Visualizing the academic literature. Res. Int. Bus. Financ. 2023, 64, 101862. [Google Scholar] [CrossRef]
- Zhou, G.; Zhu, J.; Luo, S. The impact of fintech innovation on green growth in China: Mediating effect of green finance. Ecol. Econ. 2022, 193, 107308. [Google Scholar] [CrossRef]
- Ren, X.; Shao, Q.; Zhong, R. Nexus between green finance, non-fossil energy use, and carbon intensity: Empirical evidence from China based on a vector error correction model. J. Clean. Prod. 2020, 277, 122844. [Google Scholar] [CrossRef]
- Zheng, G.W.; Siddik, A.B.; Masukujjaman, M.; Fatema, N.; Alam, S.S. Green Finance Development in Bangladesh: The Role of Private Commercial Banks (PCBs). Sustainability 2021, 13, 795. [Google Scholar] [CrossRef]
- Akter, N.; Siddik, A.B.; Mondal, M.S.A. Sustainability Reporting on Green Financing: A Study of Listed Private Sustainability Reporting on Green Financing: A Study of Listed Private Commercial Banks in Bangladesh. J. Bus. Technol. 2018, 7, 14–27. [Google Scholar]
- Ziemba, E. The contribution of ICT adoption to sustainability: Households’ perspective. Inf. Technol. People 2019, 32, 731–753. [Google Scholar] [CrossRef]
- Sinnappan, P.; Rahman, A.A. Antecedents of green purchasing behavior among Malaysian consumers. Int. Bus. Manag. 2011, 5, 129–139. [Google Scholar] [CrossRef]
- Chen, Y.S.; Lai, S.B.; Wen, C.T. The influence of green innovation performance on corporate advantage in Taiwan. J. Bus. Ethics 2006, 67, 331–339. [Google Scholar] [CrossRef]
- KPPHGN, M.; Arulrajah, A.A.; Senthilnathan, S. Mediating Role of Employee Green Behaviour Towards Sustainability Performance Of Banks. J. Gov. Regul. 2020, 9, 92–102. [Google Scholar]
- Lo, P.S.; Dwivedi, Y.K.; Tan, G.W.H.; Ooi, K.B.; Aw, E.C.X.; Metri, B. Why do consumers buy impulsively during live streaming? A deep learning-based dual-stage SEM-ANN analysis. J. Bus. Res. 2022, 147, 325–337. [Google Scholar] [CrossRef]
- Mitchell, M. Situational interest: Its multifaceted structure in the secondary school mathematics classroom. J. Educ. Psychol. 1993, 85, 424. [Google Scholar] [CrossRef]
- Jackson, D.L. Revisiting sample size and number of parameter estimates: Some support for the N: Q hypothesis. Struct. Equ. Model. 2003, 10, 128–141. [Google Scholar] [CrossRef]
- Fornell, C.; Larcker, D.F. Structural equation models with unobservable variables and measurement error: Algebra and statistics. J. Mark. Res. 1981, 3, 382–388. [Google Scholar] [CrossRef]
- Podsakoff, P.M.; MacKenzie, S.B.; Lee, J.Y.; Podsakoff, N.P. Common method biases in behavioral research: A critical review of the literature and recommended remedies. J. Appl. Psychol. 2003, 88, 879. [Google Scholar] [CrossRef] [PubMed]
- Dash, G.; Paul, J. CB-SEM vs PLS-SEM methods for research in social sciences and technology forecasting. Technol. Forecast. Soc. Chang. 2021, 173, 121092. [Google Scholar] [CrossRef]
- Hair, J.F., Jr.; Hult, G.T.M.; Ringle, C.M.; Sarstedt, M.A. Primer on Partial Least Squares Structural Equation Modeling (PLS-SEM); Sage Publications: New York, NY, USA, 2021. [Google Scholar]
- Kline, R.B. Principles and Practice of Structural Equation Modeling. Can. Stud. Popul. 2018, 45, 188–195. [Google Scholar] [CrossRef]
- Hoyle, R.H. Structural Equation Modeling: Concepts, Issues, and Applications; Sage: Riverside County, CA, USA, 1995; pp. 1–13. [Google Scholar]
- Boomsma, A. Reporting analyses of covariance structures. Struct. Equ. Model. 2000, 7, 461–483. [Google Scholar] [CrossRef]
- Gefen, D.; Straub, D.; Boudreau, M.C. Structural equation modeling and regression: Guidelines for research practice. Commun. Assoc. Inf. Syst. 2000, 4, 7. [Google Scholar] [CrossRef]
- Doll, W.J.; Xia, W.; Torkzadeh, G. A confirmatory factor analysis of the end-user computing satisfaction instrument. MIS Q. 1994, 18, 453–461. [Google Scholar] [CrossRef]
- Etezadi-Amoli, J.; Farhoomand, A.F. A structural model of end user computing satisfaction and user performance. Inf. Manag. 1996, 30, 65–73. [Google Scholar] [CrossRef]
- Kline, R.B. Software review: Software programs for structural equation modeling: Amos, EQS, and LISREL. J. Psychoeduc. Assess. 1998, 16, 343–364. [Google Scholar] [CrossRef]
- Hayduk, L.A. Structural Equation Modeling with LISREL: Essentials and Advances; The Johns Hopkins University Press: Baltimore, MD, USA, 1987. [Google Scholar]
- Baron, R.M.; Kenny, D.A. The moderator–mediator variable distinction in social psychological research: Conceptual, strategic, and statistical considerations. J. Pers. Soc. Psychol. 1986, 51, 1173. [Google Scholar] [CrossRef] [PubMed]
- Judd, C.M.; Kenny, D.A. Process analysis: Estimating mediation in treatment evaluations. Eval. Rev. 1981, 5, 602–619. [Google Scholar] [CrossRef]
- Cheung, G.W.; Lau, R.S. Testing Mediation and Suppression Effects of Latent Variables. Organ. Res. Methods 2007, 11, 296–325. [Google Scholar] [CrossRef]
- Efron, B. Bootstrap methods: Another look at the Jackknife. Ann. Stat. 1979, 7, 1–26. [Google Scholar] [CrossRef]
- Hayes, A.F. Introduction to Mediation, Moderation, and Conditional Process Analysis: A Regression-Based Approach; Guilford Publications: New York, NY, USA, 2017. [Google Scholar]
- Preacher, K.J.; Rucker, D.D.; Hayes, A.F. Addressing moderated mediation hypotheses: Theory, methods, and prescriptions. Multivar. Behav. Res. 2007, 42, 185–227. [Google Scholar] [CrossRef] [PubMed]
- Hayes, A.F. Beyond Baron and Kenny: Statistical mediation analysis in the new millennium. Commun. Monogr. 2009, 76, 408–420. [Google Scholar] [CrossRef]
- Cheung, M.Y.; Luo, C.; Sia, C.L.; Chen, H. Credibility of electronic word-of-mouth: Informational and normative determinants of on-line consumer recommendations. Int. J. Electron. Commer. 2009, 13, 9–38. [Google Scholar] [CrossRef]
- Lau, R.S.; Cheung, G.W. Estimating and comparing specific mediation effects in complex latent variable models. Organ. Res. Methods 2012, 15, 3–16. [Google Scholar] [CrossRef]
Disclaimer/Publisher’s Note: The statements, opinions and data contained in all publications are solely those of the individual author(s) and contributor(s) and not of MDPI and/or the editor(s). MDPI and/or the editor(s) disclaim responsibility for any injury to people or property resulting from any ideas, methods, instructions or products referred to in the content. |
© 2023 by the authors. Licensee MDPI, Basel, Switzerland. This article is an open access article distributed under the terms and conditions of the Creative Commons Attribution (CC BY) license (https://creativecommons.org/licenses/by/4.0/).