Abstract
Individual carbon accounting and trading is significant for building and achieving low-/zero-carbon university campuses. This manuscript examines various aspects of individual carbon trading on campus, such as assessing personal carbon emissions, students’ willingness to participate in individual carbon trading on campus, and its influencing factors, policy setting, and emission reduction benefits. Based on the Theory of Planned Behavior, this manuscript uses the conditional process analysis method and conducts a questionnaire survey on a university campus in Beijing to evaluate individuals’ carbon emissions on campus and explore their willingness to trade personal carbon. Moreover, a system dynamics approach is adopted to propose a simulation model of individual carbon trading on the campus and assess its feasibility and emission reduction benefits. The results indicate an average annual emission reduction of 8.18% per person, providing a theoretical foundation to implement and promote the individual carbon trading pilot on campus. These findings highlight the potential benefits of individual carbon trading policies that may effectively reduce carbon emissions on university campuses.
1. Introduction
1.1. Research Background
In response to global climate change and the energy crisis [1], countries worldwide have launched carbon trading in recent years to expedite the attainment of carbon peaking and carbon neutrality. The European Union Emissions Trading System, introduced in 2005, represents the world’s most extensive international system for trading greenhouse gas emission quotas [2]. As of early 2022, there are 25 operational carbon trading systems, collectively covering approximately 17% of global greenhouse gas emissions.
As the world’s largest carbon emitter [3], China began exploring the carbon market’s construction in 2013 and launched pilot projects in seven cities [4]. Up to now, China has established an institutional framework for quota allocation, data management, transaction supervision, law enforcement inspection, and support platforms [5,6,7,8]. China’s carbon trading is based on the principle of “government control over enterprises, enterprises leading individuals”. The feasibility of personal carbon trading (PCT) will be explored based on the enterprise carbon trading system and its practical experience [9]. However, the current carbon trading system only focuses on reducing carbon emissions in the production process without considering the impact of consumption-side demand on production in the social reproduction cycle. This means that the increasing energy consumption demand can offset any reduction in emissions achieved through production [10]. To address this issue, PCT can complement the existing carbon trading system from the consumption side.
The idea of integrating carbon trading into people’s daily lives was first proposed independently by Fleming [11] and Mayer [12] and received more in-depth research and political support worldwide [13,14,15,16,17]. PCT can influence people’s lifestyles and consumption habits [18], making it an indispensable component of carbon trading practice for long-term carbon reduction [18,19]. PCT has also gained a high priority in China. The basic idea is to quantify carbon reduction behaviors as personal assets and attach an economic value, which the public has widely accepted. However, since most individual carbon trading systems are much more expensive to set up and run than upstream enterprise carbon trading systems [20], and the benefits of emission reduction may not cover its costs, the current projects are generally of a public welfare nature.
An analysis of the core functions and roles of carbon trading [21] showed that constructing the PCT system faces several challenges. First, a sustainable commercial operation model has yet to be developed [22]. As there is a lack of connection between the person trading projects and the market, individual carbon emission reduction benefits are not attractive enough for social capital. Secondly, there are concerns about the effectiveness of information transmission in constructing PCT. Consumers have a limited understanding of transaction mechanisms and inadequate information collection. The construction further suffers from the lack of a unified scale for data quantification, as well as issues of information asymmetry. As such, it is difficult for enterprises or platforms to share data under the premise of safety and reliability [9]. Moreover, the incentive mechanism for user participation is not well established, resulting in low enthusiasm and sustainability in consumer participation, reduced willingness to conserve energy, and limited benefits in emission reduction. Fragmented platform coverage scenarios and high user operating costs [9] contribute to hidden incentive discounts. Moreover, social acceptance varies depending on participants’ nationalities and socioeconomic statuses and it is further constrained by implementation complexity [23,24,25]. Finally, the current market order is deficient in robustness. Inadequate support from relevant laws and regulations and an incomplete policy system poses challenges to maintaining market order [26,27].
Various social policies are often piloted on university campuses before their implementation in practice [28], owing to their high population densities and relatively complete and independent social functions [29]. For PCT investigation, students are considered a suitable group because they have high levels of consistency in their work and rest, a single energy consumption mode, and concentrated energy use times and locations. In addition, carbon emission factors can be localized according to the school standards [30,31], providing a necessary and feasible basis for carbon emission calculation. As the primary contributors and consumers of green energy in the future, college students also have the potential to impact the sustainable development of green energy with their attitudes and behaviors. Therefore, understanding college students’ behavioral psychology and motivations regarding carbon emissions can inform the development of effective and efficient PCT models tailored to the specific context.
1.2. Research Contents and Methodology
This manuscript measures individual carbon emissions and models personal carbon trading on campus (PCTC). It presents a research pathway that involves “questionnaire research-data analysis-PCTC model development-benefit evaluation”. The investigation initially consists of the computation and examination of the constituents of individual emissions within a university campus in Beijing, China. Then, it explores the operational mechanism and institutional structure of carbon trading using a system dynamics (SD) approach model. This paper uses a Likert scale to assess students’ carbon emissions and behavioral psychology, assuming that carbon emission levels reflect participants’ willingness to engage in individual carbon trading. A questionnaire survey is conducted to collect individuals’ carbon emission data within the university boundary. These data are then weighted using localized factors to estimate individual carbon emissions. A total of 1227 valid questionnaires are collected from students at a university in Beijing, providing an objective and scientifically quantifiable assessment of the students’ energy-saving awareness and carbon emission levels. The proposed hypotheses are tested through the conditional process analysis method. Based on the functional relationship obtained from the analysis, this study establishes a feedback link from carbon trading to individual carbon emissions using the SD approach. Specifically, the study assumes a relationship between trading personality and the frequency of transactions and explores the relationship between fundamental information factors and carbon emissions under different settings with the correction of behavior factors. Through iterative simulations, this study predicts the annual emission reduction benefits of carbon trading within the university for different groups and provides policy recommendations accordingly.
The remainder of the manuscript is organized as follows: Section 2 provides a review of the research status of the low-carbon campus. Section 3 describes the questionnaire design and data analysis results. Section 4 outlines the PCTC modeling based on the SD approach. Finally, Section 5 presents the conclusions and discussion.
2. Literature Review
2.1. Accounting Methods of Campus Carbon Emissions
Various studies have proposed diverse assessment standards and managerial approaches for campus carbon accounting. When conducting carbon accounting for universities and colleges, scholars worldwide usually incorporate the real circumstances with the IPCC inventory method [32] and account for three dimensions: buildings, transportation, and waste. They either develop accounting methods for each dimension separately or emphasize one dimension. Ridhosari et al. [33] obtained carbon footprint data utilizing direct sampling, questionnaire surveys, and secondary data and gauged the total carbon emissions of universities from electricity, transportation, and waste. Guerrieri et al. [34] centered on buildings and assessed carbon emissions from buildings, lighting, and transportation. Guo [30] employed the carbon emission factor method with localized IPCC factors and calculated the annual carbon emissions of universities from the perspective of carbon sources based on electricity consumption. Shi et al. [35] utilized fluid mechanics to simulate the diffusion of carbon dioxide and carbon fixation by plants and employed a carbon sink as an indicator to estimate the carbon emissions of universities.
Based on the above discussion, various methods are available for campus carbon emission accounting, and the emission factors and accounting models are comprehensive, accurate, and mature. However, practical carbon emission research faces many restrictions due to the unique nature of schools. As a result, selective carbon emission research leads to diversified accounting perspectives and inconsistent accounting standards.
2.2. Low-Carbon Campus Evaluation Indicators and Willingness towards PCT
Formulating low-carbon campus evaluation indicators can effectively gauge the sustainability of campus construction. Several studies have recommended evaluation standards for low-carbon campuses based on the perspective of campus construction and have implemented various models to construct evaluation systems based on different dimensions. For instance, Zhao et al. [36] proposed a green campus evaluation indicator system founded on dynamic Bayesian inference and adaptive network fuzzy inference system (DBN-ANFIS). Na et al. [37] formulated an expert questionnaire, compared the Analytic Hierarchy Process (AHP) with the Entropy Weight Method (EWM), and assigned different weights to four aspects: management mechanism, low-carbon culture, renewable energy utilization, and emission reduction measures. Liu et al. [38] combined ecological footprint evaluation (EFE) with the life cycle assessment (LCA) to evaluate the sustainability of low-carbon campus development. Zhu et al. [39] focused on the green campus development model of Stanford University through the Sustainability Tracking, Assessment, and Rating System (STARS).
Moreover, it is imperative to explore the roles of individuals in achieving low-carbon campuses, with students leading the charge in promoting environmental sustainability on campus [40]. Various studies have employed survey-based research methodologies to examine the individual intentions of universities toward this end [41]. Fang et al. [31] investigated college students’ attitudes toward green energy from both the supply and demand sides of the market, encompassing renewable and nuclear energy sources and energy-efficient household appliances. Lin et al. [42] conducted a study to investigate the impacts of individual and social factors on preferences for different carbon reduction policies, namely PCT, carbon tax, and CGSP, to provide insights for governments to design effective consumption-side carbon reduction policies in the future. In summary, numerous universities have taken steps to implement and enforce low-carbon policies and measures, which have resulted in notable carbon reductions. Nevertheless, current policies, management practices, and comprehensive evaluation criteria for campus carbon reduction primarily emphasize building energy consumption and layout planning [43], thereby lacking in assessing individual energy-saving attitudes on campus.
3. Research Hypotheses and Examinations
3.1. Research Hypotheses and Theoretical Basis
Examining the variables that impact pilot engagement and behavior is crucial in anticipating pilot operations, as it furnishes empirical and statistical backing for PCT. The Theory of Planned Behavior (TPB), raised by Ajzen [44], is a pivotal framework for scrutinizing the mechanisms of persuasion on pro-policy attitudes. The TPB postulates that behavioral intention refers to the extent of an individual’s willingness to engage in a particular action and the efforts they plan to make [45], and it has been upheld by various psychological investigations into carbon emission conduct [46,47]. Behavioral intention is determined by an individual’s beliefs about the likely consequences of the behavior (behavioral beliefs), the normative expectations of others (normative beliefs), and the presence of factors that may facilitate or act as an obstacle to the performance of the behavior (control beliefs). In their respective aggregates, behavioral beliefs produce an uncertain attitude toward the behavior; normative beliefs lead to perceived social pressure or subjective norm; and control beliefs give rise to perceived behavioral control or self-efficacy.
Under China’s personal carbon trading setting, PCT is still in its experimental stage, and a sustainable commercial operation mechanism has not yet been fully developed. Furthermore, the incentive mechanism for user participation is not well established, resulting in low social acceptance, enthusiasm, and sustainability in consumer participation. As a result, individuals will not fully understand the obstacles of time, money, and trading channels, and they will develop perceived social pressure to use PCT from close friends or family members. Guo et al. [48] found that many residents in China took a wait-and-see attitude due to their lack of knowledge about the PCT scheme. In this way, we only incorporate behavioral beliefs and consider attitudes as cardinal determinants of behavioral intention. Consistently, Gansser and Reich [49] discovered that the influence of the attitude toward sustainable behavior on intention to change behavior has the most significant effect on the areas of consumption and energy.
- (1)
- Individual carbon emission, attitude, and willingness to implement PCT
We first analyze individual carbon emissions as a significant factor influencing the pro-environmental attitude, and how it further impacts the willingness to implement PCT. Attitudes allude to the extent of participants’ inclination towards low-carbon behaviors and lifestyles. Individuals with higher emission levels may be less likely to execute low-carbon actions, may be unwilling to compromise their consumption levels, and do not prioritize environmental protection, thus exhibiting poorer low-carbon attitudes. According to the TPB, attitudes are cardinal determinants of behavioral intention, and individuals with favorable attitudes toward carbon savings are more willing to support individual carbon reduction policies. Chen et al. [50] and Liu et al. [51] concluded that low-carbon attitudes and values significantly impact residents’ low-carbon behaviors. Meanwhile, Yang et al. [52] found that individuals with high environmental responsibility and attitudes toward reduction are more likely to engage in direct and indirect energy reduction actions. The study by Capstick and Lewis [53] provided an inverse relationship between a participant’s carbon footprint and their support for PCT. Tao et al. [54] showed that high-carbon consumers are not more willing to purchase voluntary carbon-offsetting products among Chinese consumers. Therefore, we hypothesize the following:
H1.
Individuals with high carbon emissions will be less willing to participate in PCT.
H2.
Individuals with high carbon emissions will exhibit negative low-carbon attitudes and, thus, be less willing to participate in PCT.
- (2)
- The mediating effect of habits
We further demonstrated the moderating role of personal habit on the relationship between attitude and the intention of adopting PCT. Habits reflect participants’ habits and knowledge of energy conservation, which is developed over a prolonged period, and they are strongly stable compared with other factors. Danner et al. [55] concluded that frequently performed behavior is often a matter of habit, and habit establishes a boundary condition for applying attitude–behavior models. Researchers have incorporated habitual behavior into the behavioral model to increase its predictive ability [56,57,58]. Once established, habitual behaviors do not require the process of reasoning and planning to occur. Instead, they are automatically evoked upon instigating the goal to act, replacing the reasonable thinking mechanism between attitude and behavior intention. Research indicates that negative habits can serve as personal barriers to adopting low-carbon behaviors, while low-carbon habits and knowledge improvements can increase low-carbon behaviors or intentions [47,58]. Therefore, when individuals have higher levels of low-carbon habits, they may engage in unconscious carbon reduction activities, human behavior will be less guided by reason-based concepts, and there will be a less pronounced relationship between attitudes and subsequent goal-directed behavior. Therefore, we hypothesize the following:
H3.
Energy conservation habits will weaken the positive relationship between attitude and the willingness to engage in PCT.
The above theoretical framework constitutes a moderated mediation model, as illustrated in Figure 1. Furthermore, to explore the preferred types of incentives among participants, the questionnaire includes inquiries regarding reward preferences. This dimension is defined as rewards and pertains to the prizes received through PCT to encourage users to interact with the platform [59]. The incentive to adopt low-carbon behaviors and gradually modify habits is strengthened when the rewards for reducing emissions surpass the associated costs [10,60,61,62].
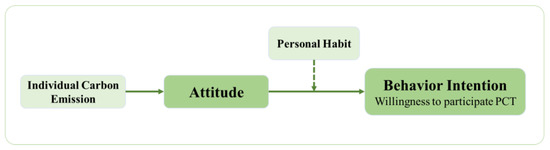
Figure 1.
The proposed moderated mediation model.
3.2. Questionnaire Design, Collection, and Reliability Tests
To examine these hypotheses, a survey is developed based on the condition of a university in Beijing. The questionnaire is composed of three main sections. The first section aims to collect the fundamental demographic information of the participants, including their genders, educational levels, majors, and residency statuses. The second section utilizes a Likert scale to assess the participants’ levels of low-carbon behavior, attitudes towards low-carbon, willingness to engage in individual carbon trading, and preferred rewards. Finally, the third section investigates and quantifies the portion of operational carbon emissions that are frequently involved, easily counted directly, and in urgent need of reduction, and classifies them into three settings.
This study targets a university campus in Beijing as its research sample. The survey instrument is administered through a dual approach, encompassing both online and offline channels, facilitated by “Questionnaire Star”, the predominant questionnaire survey platform in China. Following eliminating outliers, such as instances with response times below 30 s or examples indicating contradictory responses, a comprehensive dataset comprising 1227 valid questionnaires is derived. The validity rate of this dataset stands at 94.1%.
A reliability test should be conducted on the participants’ data. Dimension “A” relates to the attitudes of the participants towards low-carbon behaviors. Dimension “H” reflects the participants’ habits and knowledge of energy conservation. Dimension “W” pertains to the willingness to engage in individual carbon trading. This study finds dimension “W” to be the most significant factor influencing the desires of individuals to participate in PCT. The dimension “R” reflects the attractiveness of the reward mechanism to the participants. All Cronbach’s alpha values exceed 0.70, indicating an acceptable internal reliability. Table S1 lists the issues associated with each dimension.
3.3. Descriptive Statistics
The survey utilized in this study ensures a comprehensive representation of all demographic groups residing on the campus. Further details concerning the participants meeting the inclusion criteria are outlined in Table S2.
In the upcoming analysis, these items will be treated as critical factors that will be utilized to construct simulation models. Drawing on the data collected from the questionnaire and the carbon emission factors table provided below, this manuscript will calculate the carbon emissions (CE) associated with various settings.
where Ai is the activity date of each item gathered from the questionnaire, and CF represents the carbon emission factors that can use the values shown in Table 1.

Table 1.
Carbon emission factors for the calculation.
The questionnaire finds that students’ average annual CO2 emissions on the counted items are 393.7 kg, as shown in Table S3. The carbon emissions of the dormitory setting accounts for 49.94%, and the carbon emissions of the activity setting accounts for 47.56%. For the activity setting, takeaway packaging has the highest carbon emissions, accounting for 26.90% of the total emissions, followed by express cartons, accounting for 17.12%. In addition, hot water emits 21.23% of the total emissions for the dormitory setting, followed by air conditioners and additional electricity, accounting for 13.69% and 11.78% of the total emissions, respectively.
3.4. Conditional Process Analysis
To further explore the factors influencing participants’ willingness to engage in PCT and the efficacy of its principles, this study investigates whether attitudes mediate the association between ln(Sum) and willingness and whether habits moderate the indirect pathways. Model 4 (simple mediation model) in PROCESS macro v4.1, developed by Hayes [63], is employed to examine the mediation effect while controlling for the variables of gender, major, education level, and residency status. In Model 1, willingness is predicted based on the direct effect of ln(Sum). Model 2 estimates the moderating effect of attitudes between ln(Sum) and willingness. In Model 3, willingness is predicted based on the indirect effect of attitudes. According to the results presented in Table S4, the multiple linear regression analysis demonstrates a significant negative predictive effect of ln(Sum) on willingness (B = −0.1508, t = −3.3971, p < 0.01). Then, attitudes are introduced as mediators, showing a significant negative predictive effect of ln(Sum) on attitudes (B = −0.2483, t = −0.4208, p < 0.001), and a significant positive effect of attitudes on willingness (B = 0.394, t = 17.9638, p < 0.001).
Furthermore, as shown in Table S5, the bias-corrected percentile bootstrap method indicates that the bootstrap confidence interval for the mediating effect of attitudes does not include 0. This suggests that ln(Sum) can predict willingness through the mediation of attitudes. While the direct effect is found to be insignificant, this may be due to the limited scale of participants. Nonetheless, it does not preclude the examination of the moderating influence, and thus, Hypothesis 1 and Hypothesis 2 are supported.
The second phase of the analysis involves the use of Model 4 to test the moderated mediation effect while controlling for gender, major, education level, and residency status. The results are shown in Table S6. After including habits as a moderator variable, the product of attitudes and habits has a significant negative predictive effect on willingness (B = −0.0673, t = −3.2518, p < 0.01). This indicates that habits have a regulatory impact on the predictive relationship between attitudes and willingness. Therefore, Hypothesis 3 is partially supported.
As shown in Table S7 and Figure S1, a further analysis using simple slope indicates that when participants have good habits (M+1SD), attitudes have significant positive predictive effects on willingness (simple slope = 0.3403, t = 12.4643, p < 0.001). However, for those with poor habits (M-1SD), the positive predictive effect of attitudes on willingness is significantly stronger (simple slope = 0.4561, t = 15.6154, p < 0.001). These findings suggest that as the levels of habits and the knowledge of energy conservation improve, the predictive effect of low-carbon behavioral attitudes on the degree of willingness to engage in individual carbon trading is weakened. Therefore, Hypothesis 3 is supported.
4. Results and Discussion
4.1. Deconstructing Carbon Emissions
The study’s objective is to focus on carbon emissions as a central point and to reconfigure the willingness dimension to precisely quantify a user’s inclination to interact with the platform, specifically in participating in PCTC. This section will present an analysis of the fundamental information of the participants and their carbon emission data collected from the questionnaire. It is important to note that the survey conducted in this study may not fully represent the entire school population, as the education levels of the participants significantly differ from the actual demographics of the school. To achieve more accurate measurements of carbon emissions, this manuscript distinguishes between different carbon emission settings and participant groups based on the fundamental information collected from the survey. The reconstruction of the carbon emission formula by groups is as follows:
where i represents the groups, j represents the settings, ε represents a correction factor for the carbon emissions of the groups in the settings, which will be further explained later, and Cj represents a correction factor for the carbon emissions of each setting.
4.1.1. Examination of Carbon Emissions According to Groups within Settings
The present study examines the differences in carbon emissions among participants with varying fundamental characteristics across different settings. Through a differential examination and significance level analysis, the results indicate significant variations in carbon emissions based on gender in the activity setting, based on residency status in the dormitory setting, and based on education levels in both the dormitory and study settings. However, no significant differences in carbon emissions among students from different majors, including energy-related ones, are observed in all three settings. Table S8 provides a summary of the findings.
A partial correlation analysis, as shown in Table S9, reveals that the four behavioral dimensions are significantly negatively correlated with carbon emissions in the dormitory and activity settings. However, none of these dimensions significantly impact carbon emissions in the study setting. The analysis results indicate a correlation between carbon emissions in various locations, fundamental information factors, and four behavioral dimensions.
4.1.2. Fundamental Carbon Emission Formula
Based on the analysis conducted above, the study indicates that carbon emissions within various settings are closely associated with participants’ education levels and residency statuses in the dormitory setting (CEd), with gender in the activity setting (CEa), and with education level in the study setting (CEs). This study further examines the differences in average individual annual carbon emissions among diverse groups within each setting. Since the carbon emission levels of graduate and undergraduate students are comparable, as are the emission levels of Ph.D. and other students, the education levels are regrouped into two categories: education level = 1 (including graduate and undergraduate students) and education level = 2 (including Ph.D. and other students). The average individual annual carbon emissions of different groups are presented in Table S10.
This study compares average carbon emissions among different groups in various settings. The standard values for each setting are established using the carbon emissions of specific groups as reference points. For the dormitory setting, the carbon emissions of undergraduate and graduate students with an urban household residency status (198.20) are considered with an information factor of 1 (IFd). Similarly, for the activity setting, the carbon emissions of the male group (174.98) are taken as the standard value with an information factor of 1 (IFa). For the study setting, the carbon emissions of undergraduate and graduate students (9.8) are regarded as the standard value with an information factor of 1 (IFs). The information factor (IF) is the first multiplier of ε. The study then ranks eight groups based on three fundamental information factors, namely gender, residency status, and education level. The corresponding IFs are estimated using the carbon emissions of the standard value as the independent variable and the carbon emissions of the remaining participants as the dependent variable. Table S11 presents the calculated values of IFi.
A partial correlation analysis is carried out based on fundamental information. The results show that attitudes, habits, and willingness are significantly negatively correlated with carbon emissions in the activity and dormitory settings. The estimated carbon emissions are adjusted based on behavior factors. The CRITIC method is applied to determine the proportion of each dimension in the final behavior characteristic assessment. The CRITIC method is based on the variability and conflict between the evaluation indicators. The variability of the indicators is measured using standard deviation, with higher weights assigned to larger standard deviations, and the conflict is measured using the correlation coefficient between indicators, with lower weights assigned to stronger correlations between indicators. Using the CRITIC method based on the data obtained from the questionnaire statistics, the weights of the three dimensions are calculated, and the results are shown in Table S12.
Based on the CRITIC method, the behavior characteristic formula is as follows:
The behavior characteristics are standardized within the range of [−0.5, 0.5] to derive the behavior factor. It is evident that the lower the carbon emissions, the higher the behavior factor score. The formula for calculating the behavior factor is as follows:
The carbon emissions formula for the dormitory setting (CEd) is modified by incorporating the behavior factor. This is achieved by regressing the actual carbon emissions against the previous ones, which serves as the independent variable. The regression analysis results in a correction coefficient of 1.22 and an R-squared value of 0.767. Similarly, for the carbon emissions in the activity setting (CEa), the correction coefficient is 1.24, and the R-squared value is 0.701. In contrast, for the carbon emissions in the study setting (CEs), the fundamental information factors are directly multiplied by the mean, as the behavior factor does not influence this setting.
where CEd represents the carbon emissions in a dormitory setting. CEs represents the carbon emissions in the study setting. CEa represents the carbon emissions in an activity setting. IFd represents the fundamental information factors in the dormitory setting. IFs represents the essential information factors in the study setting. IFa represents the fundamental information factors in an activity setting.
4.1.3. Emission Reduction Model Based on Trading Personality
For the scientific accounting of carbon emission reduction, the cumulative carbon emission reduction achieved through users’ interaction with the platform is calculated as the product of the frequency of transactions and the emission reduction for each transaction, denoted as ED. The degree of willingness can be used as a metric to characterize users’ willingness to interact with the platform to obtain the frequency of transactions and the amount of emission reduction for each transaction. Using the regression equation presented in Table S6, the predicted value of willingness is obtained and used to classify positive personality traits in PCTC.
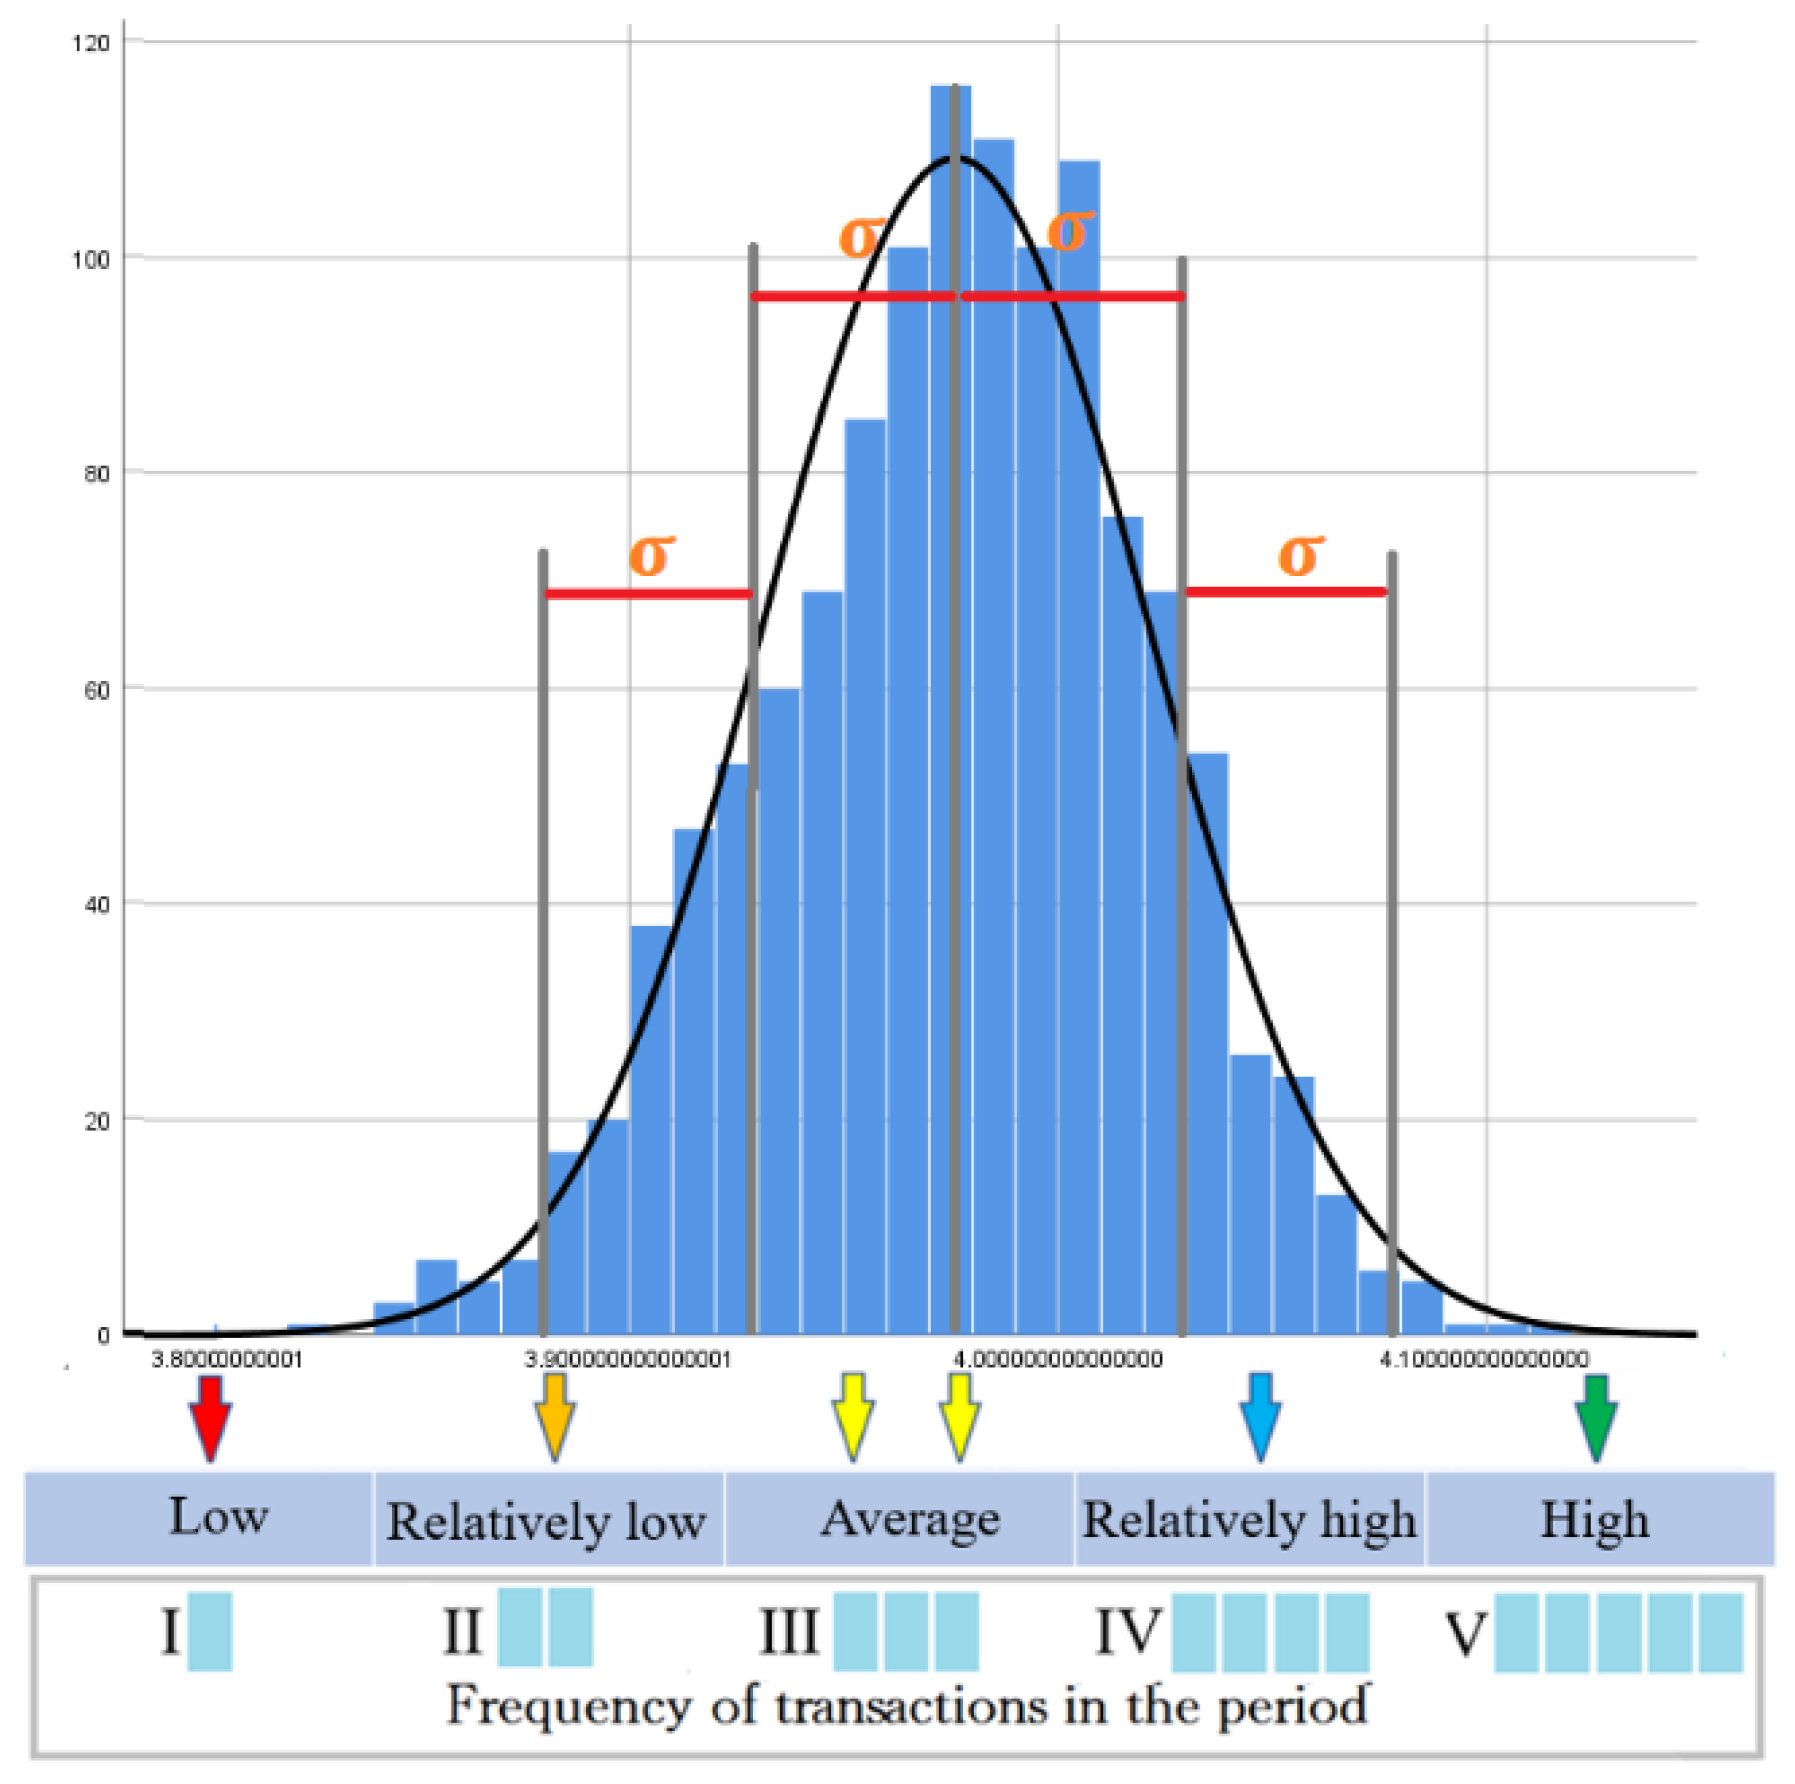
As demonstrated in Figure 2, the median line is determined by calculating the mean of Willingness, and five intervals are created based on the standard deviation. These intervals, arranged in ascending order of frequency, are (I) low-frequency trading population, (II) relatively low-frequency trading population, (III) average-frequency trading population, (IV) relatively high-frequency trading population, and (V) high-frequency trading population. This study posits that higher values of willingness correspond to more frequent carbon transactions, with a range of 1 to 5 carbon transactions in a given period, progressing in ascending order. For instance, if a user falls under category IV (attentive to trading), their frequency of transactions in this period would be 4.

Figure 2.
Trading personality.
Meanwhile, the emission reduction for each transaction can be expressed as follows:
Here, Z represents the emission reduction per transaction, Sum denotes users’ average annual carbon emissions, and a% represents the percentage reduction in emissions (a recommended value of 2.7% is used). By combining the frequency of PCTC with the emission reduction from each transaction, the cumulative emission reduction (ED) can be calculated using the following formula:
where n refers to the frequency of carbon transactions during the period.
4.2. Modeling and Simulation Based on the SD Approach
4.2.1. System Model Analysis
This section explores the potential benefits of emission reduction through the PCTC pilot by integrating the relationships mentioned above and performing hypothetical simulations. Figure 3 presents a mind map comprising a low-carbon response and emission reduction models. The low-carbon response model illustrates the interconnectedness between carbon emissions (CE) and behavioral intention (BI). It is observed that BI has a genuine negative effect on CE, while CE causes a prediction effect on BI. The trading personality determines the degree of emission reduction and introduces a disturbance to the BI and CE system. Thus, the primary system composed of BI and CE and the disturbance organized based on trading personality achieves a dynamic equilibrium after multiple rounds of iterations, resulting in stable carbon emissions and emission reductions.
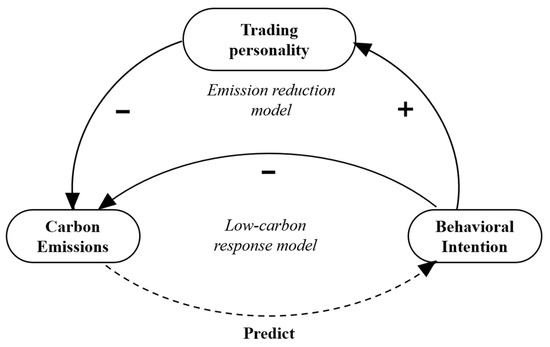
Figure 3.
The analytical framework of carbon emissions and reduction system (note: the dotted line in the figure represents the predictive relationship explored in Section 3, while the solid line represents the causal relationship explored in Section 4.1).
4.2.2. The Development of PCTC Model
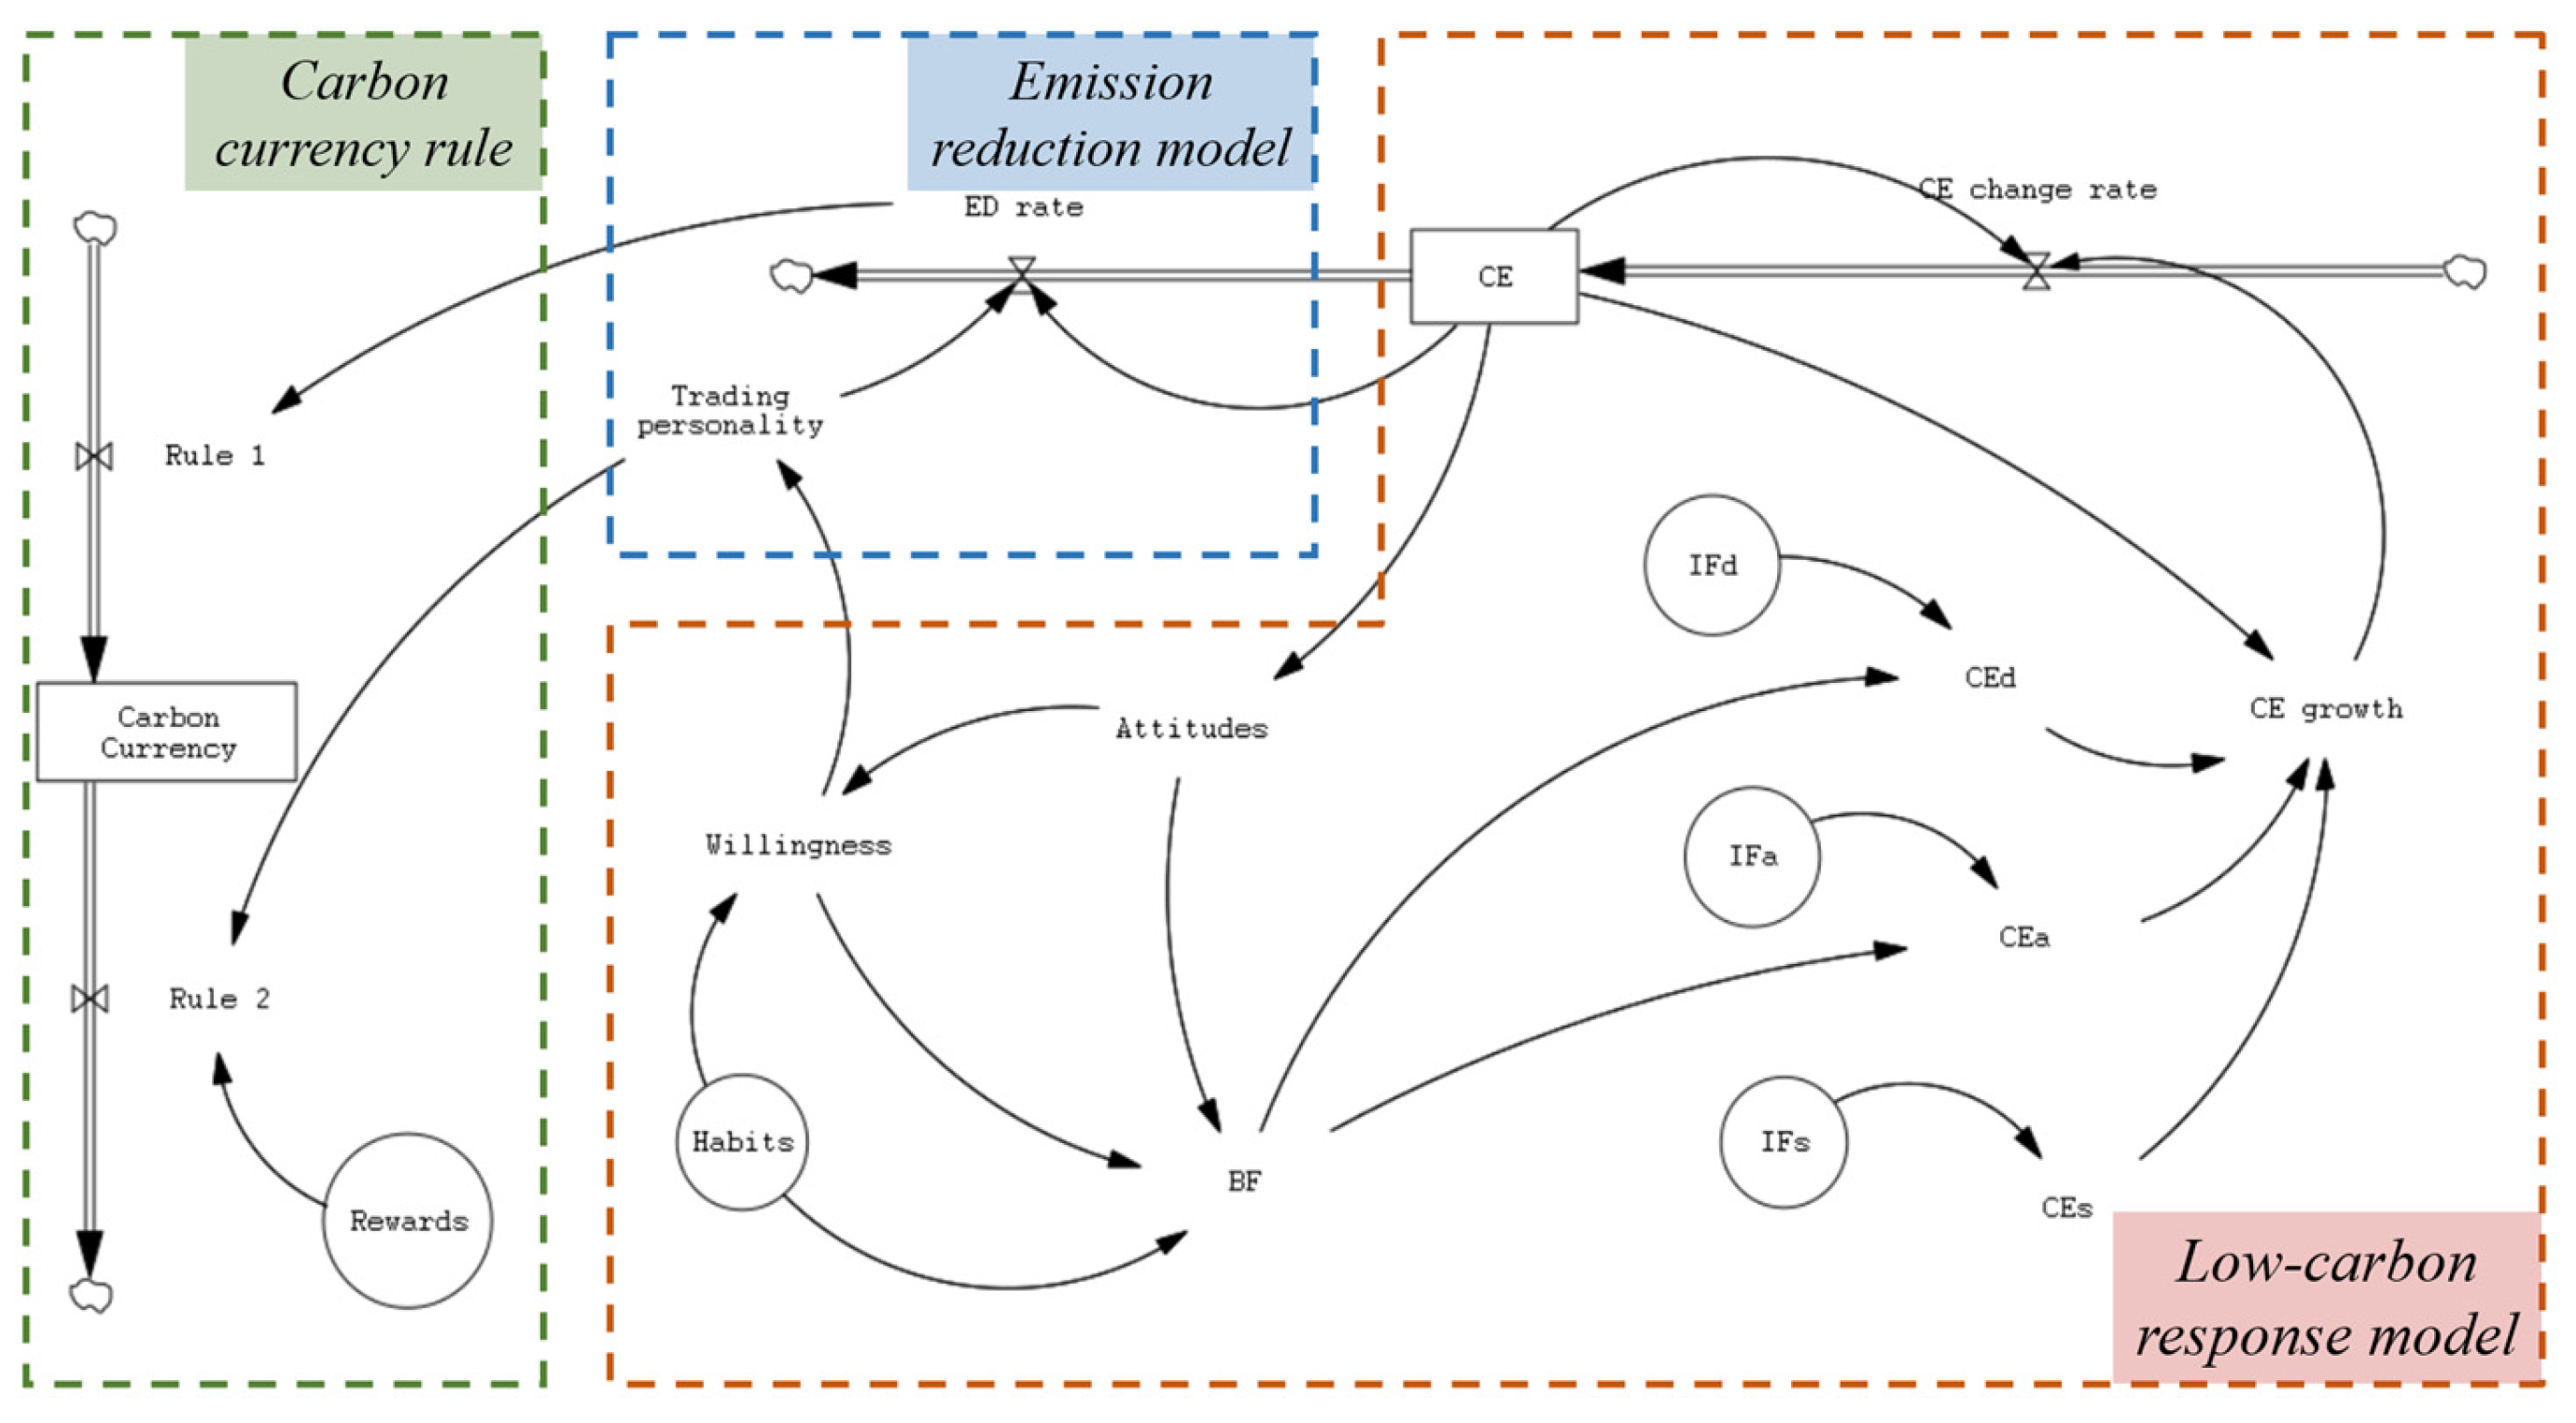
By integrating the equations presented earlier, this study utilizes the Vensim PLE software to develop a stock–flow diagram, as depicted in Figure 4. The system takes the average annual carbon emissions of individuals as the input, and the initial emission values vary considerably between groups. To address this, the “average person” concept is introduced to iterate this value annually. The “average person” represents a simulated individual within each group, with changing carbon emissions and reductions and carbon currency during the simulated trading process. The carbon emissions of the overall system correspond to the emissions of this “average person”. Notably, each group’s “average person” has distinct values for IFi, habits, and rewards, resulting in variations in other values across different groups in subsequent iterations. Among them, the position of the habits variable is equivalent to the constant term, IFi. In contrast, the value of rewards represents the average level assigned to positive incentives for accepting various prizes, considered as the daily consumption of carbon currency for the “average person” in different groups. The currency consumed in a given period is defined as (Rewards × trading personality × 365)/maximum of frequency. The constant term for each group code is listed in Table S13.
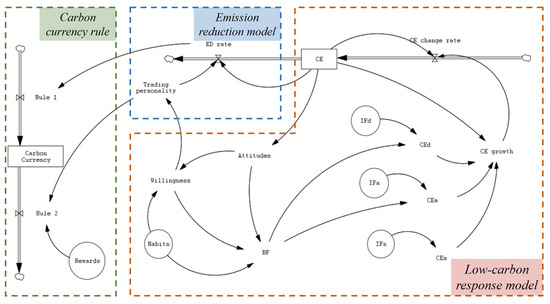
Figure 4.
Stock–flow diagram of PCTC model (note: the orange box in the figure represents the low-carbon response model, while the blue box represents the emission reduction model, and the green box represents the carbon currency rule).
The PCTC model presented in Figure 4 comprises several components, including the low-carbon response model, the emission reduction model, and the carbon currency rule. The emission reduction model suggests reduction measures that are converted into carbon currency according to a predetermined conversion rate (Rule Ⅰ). This carbon currency can then be exchanged for prizes (Rule Ⅱ). The PCTC model can be subdivided into different parts to assess their effects. The “average person” enters the cycle from their carbon emissions and undergoes the low-carbon response model, with the stable value representing the predicted carbon emissions value. Alternatively, the “average person” enters the cycle from their carbon emissions and undergoes both the low-carbon response model and the emission reduction model, with the stable value obtained representing the carbon emission value after the reduction. Finally, the “average person” enters the cycle from the carbon emissions and goes through the entire PCTC model, including the low-carbon response model, the emission reduction model, and the carbon currency rule, for the complete cycle. The hypothetical carbon currency conversion rate will be discussed and verified in subsequent analyses.
4.2.3. Simulation and Discussion
For example, the PCTC model simulates the carbon emissions of a proxy group (1/1/1) comprising males, students with an urban residency status, undergraduate students, and graduate students. This group’s initial value of carbon emissions is 376.750 kgCO2. Based on the simulation results, this group’s predicted value of carbon emissions is 370.475 kgCO2. After applying the emission reduction model, the carbon emission value after the reduction is 340.149 kgCO2, resulting in an annual emission reduction of 30.326 kgCO2 for the average person of group code (1/1/1).
The emission reduction results are calculated for eight groups, with the average annual emission reduction per person being 30.875 kgCO2 after implementing the reduction measures. The reduction values vary across groups, ranging from 29.204 kgCO2 to 43.053 kgCO2. Further detailed data are presented in Table 2.
Table 2.
Simulation results.
The carbon currency rule, which includes Rule Ⅰ and Rule Ⅱ, is an important part of the PCTC model. The currency conversion rate in Rule Ⅰ is a hypothetical quantity assumed to convert the emission reduction actions into carbon currency. In Rule Ⅱ, the amount of carbon currency consumed to convert rewards to carbon currency is determined by the frequency of transactions in a period and the trading personality. The carbon currency rule combines the low-carbon response and emission reduction models to form the complete PCTC model.
For instance, in group code (1/1/1), the simulation shows that adjusting the currency conversion rate affects the carbon emission value after reduction. When the currency conversion rate is greater than or equal to 30 currency/kgCO2, the currency amount accumulates year by year. Conversely, when the currency conversion rate is less than 30 currency/kgCO2, the currency amount decreases year by year. Therefore, the currency conversion rate should be higher than 30 currency/kgCO2 to incentivize users to interact with the platform and reduce emissions.
5. Conclusions
The existing literature on campus carbon emission accounting and the low-carbon campus evaluation index construction primarily adopts macro-level approaches that offer policy guidance and have promising research prospects. Additionally, individual-level analyses have been conducted to explore the influences of awareness and the willingness to save energy on the effectiveness of consumption-side emission reduction policies. To address the gap in PCT benefit prediction, expand the low-carbon campus concept, and incorporate individual carbon emissions into the macro emission reduction system, this manuscript employs a behavioral, psychological research method based on a questionnaire survey to investigate individual carbon emissions and the willingness towards participating in PCT.
The findings of the conditional process analysis carried out on participants from a university in Beijing reveal that attitudes fully mediate the association between carbon emission levels and willingness, and the indirect association is moderated by habits. These results enhance our comprehension of the factors that impact an individual’s willingness to engage in PCT, including their level of carbon emissions and awareness of energy conservation, while emphasizing the influence of individual differences in cognitive mechanisms. This study’s theoretical and practical implications are significant and provide a valuable data source to simulate and evaluate the benefits of the PCTC pilot.
By drawing on the findings of the PCTC model and employing a simple SD simulation approach, this study estimates that the provision of corresponding reduction methods based on participants’ trading personalities can lead to a cumulative reduction of 30.875 kg in CO2 emissions per person, with varying benefits for different characteristic groups. In addition, this study examines the impact of the emission reduction currency conversion ratio on trading and carbon emission reduction using the community of group code (1/1/1). The results suggest that individuals are likelier to exhibit a heightened interest in trading and reducing carbon emissions when the conversion ratio exceeds 30 currency/kgCO2. This initial exploration of PCTC modeling can serve as a foundation for future implementation and offer insights into the design of PCT pilots in settings similar to university campuses.
In summary, this manuscript provides valuable insights into the potential for PCT on university campuses, and the findings suggest that such policies may be effective tools for reducing carbon emissions. These results have implications for environmental policy makers and suggest that PCT may be a viable solution to reduce carbon emissions in other settings. Future research could improve upon this manuscript’s limitations. To begin with, a longitudinal or experimental design may be more suitable, as the current cross-sectional design precludes causal inferences. Moreover, the SD-based simulation model assumes an “average person” behavior, which may not reflect the complexity of individual behavior. To mitigate this issue, future research could conduct offline pre-pilot studies that use actual transaction data to adjust the plan and dynamically obtain more accurate benefit estimates.
Supplementary Materials
The following supporting information can be downloaded at: https://www.mdpi.com/article/10.3390/su152215928/s1, Figure S1. Simple slope analysis. Table S1. Questionnaire section. Table S2. Participants’ fundamental information features. Table S3. Carbon emissions for each setting. Table S4. Testing the mediation effect of ln(Sum) on the Willingness. Table S5. Total, direct and indirect effects. Table S6. Testing moderating effect of Attitudes on Willingness. Table S7. Direct and mediating effects at different levels of Habits. Table S8. Differential examination. Table S9. Partial correlation analysis. Table S10. Average individual annual carbon emissions of different groups. Table S11. Different groups codes and fundamental information factor. Table S12. Weight analysis results based on CRITIC method. Table S13. Group codes and constant items.
Author Contributions
Methodology, J.H., X.Y., C.Y., J.L., Y.R., Y.Z., F.H. and D.Z.; Software, X.Y. and C.Y.; Validation, X.Y., J.L., Y.R. and F.H.; Formal analysis, Y.Z.; Investigation, J.H. and Y.Z.; Data curation, X.Y., C.Y., Y.R. and Y.Z.; Writing—original draft, J.H. and X.Y.; Writing—review & editing, Y.Z.; Supervision, J.H. and Y.Z. All authors have read and agreed to the published version of the manuscript.
Funding
This research was funded by the Innovation Centre for Digital Business and Capatial Development of Beijing Technology and Business University (SZSK202330).
Institutional Review Board Statement
Not applicable.
Informed Consent Statement
Not applicable.
Data Availability Statement
Data are contained within the article.
Conflicts of Interest
The authors declare no conflict of interest.
Nomenclatures
| Variable | Description |
| Gender | Genders of participants |
| Education level | Backgrounds of participants’ education |
| Major | Whether the participants have an energy-related background |
| Residency status | Registered residence distribution of participants |
| Sum | Individual annual carbon emissions |
| ln(Sum) | The natural logarithm of the individual annual carbon emissions |
| A | Participants’ attitudes towards low-carbon behaviors |
| W | Participants’ willingness to engage in individual carbon trading |
| H | Participants’ habits and knowledge of energy conservation |
| R | Rewards offered to participants to incentivize their interactions with the platform |
| ED | Cumulative carbon emission reduction achieved through users’ interactions with the platform |
| P | Proportion of each variable in the formula |
| F | Full mark of the behavioral factor |
| BC | Behavior characteristic |
| BF | Behavior factor |
| CE | Average individual annual carbon emissions |
| CF | Carbon emission factor |
| Ai | The activity date of each item gathered from the questionnaire |
| IF | Fundamental information factors |
References
- Lyu, X.; Shi, A.; Wang, X. Research on the Impact of Carbon Emission Trading System on Low-Carbon Technology Innovation. Carbon Manag. 2020, 11, 183–193. [Google Scholar] [CrossRef]
- Economics, P. Annual Report on the Market for RGGI CO2 Allowances: 2021; Annual Reports; Regional Greenhouse Gas Initiative Inc.: New York, NY, USA, 2022; p. 97. Available online: http://www.rggi.org/market/market_monitor (accessed on 28 August 2023).
- Liu, Z.; Deng, Z.; He, G.; Wang, H.; Zhang, X.; Lin, J.; Qi, Y.; Liang, X. Challenges and Opportunities for Carbon Neutrality in China. Nat. Rev. Earth Environ. 2022, 3, 141–155. [Google Scholar] [CrossRef]
- Zhang, W.; Li, J.; Li, G.; Guo, S. Emission Reduction Effect and Carbon Market Efficiency of Carbon Emissions Trading Policy in China. Energy 2020, 196, 117117. [Google Scholar] [CrossRef]
- Yi, L.; Bai, N.; Yang, L.; Li, Z.; Wang, F. Evaluation on the Effectiveness of China’s Pilot Carbon Market Policy. J. Clean. Prod. 2020, 246, 119039. [Google Scholar] [CrossRef]
- Fu, C.; Huang, Y.; Zheng, Y.; Luo, C. The Influence and Acting Pattern of China’s National Carbon Emission Trading Scheme on Regional Ecologicalization Efficiency of Industry. Sci. Rep. 2022, 12, 11940. [Google Scholar] [CrossRef] [PubMed]
- Dong, F.; Dai, Y.; Zhang, S.; Zhang, X.; Long, R. Can a Carbon Emission Trading Scheme Generate the Porter Effect? Evidence from Pilot Areas in China. Sci. Total Environ. 2019, 653, 565–577. [Google Scholar] [CrossRef] [PubMed]
- Borghesi, S.; Cainelli, G.; Mazzanti, M. Linking Emission Trading to Environmental Innovation: Evidence from the Italian Manufacturing Industry. Res. Policy 2015, 44, 669–683. [Google Scholar] [CrossRef]
- Ye, Q.; Gao, C.; Jiang, G. The Structure Design of China Blockchain Carbon Market for the Future Big Data Environment. J. Manag. World 2022, 38, 229–249. [Google Scholar] [CrossRef]
- Tan, X.; Wang, X.; Zaidi, S.H.A. What Drives Public Willingness to Participate in the Voluntary Individual carbon-Trading Scheme? A Case Study of Guangzhou Pilot, China. Ecol. Econ. 2019, 165, 106389. [Google Scholar] [CrossRef]
- Fleming, D. Tradable Quotas: Setting Limits to Carbon Emissions. 1997. Available online: https://www.osti.gov/etdeweb/biblio/617107 (accessed on 28 August 2023).
- Hillman, M. Carbon Budget Watchers: The Implications for Individual Lifestyles. Town Ctry. Plan.-Lond.-Town Ctry. Plan. Assoc. 1998, 67, 305. [Google Scholar]
- Meeting the Energy Challenge: A White Paper on Energy. Available online: https://www.gov.uk/government/publications/meeting-the-energy-challenge-a-white-paper-on-energy (accessed on 20 April 2023).
- Starkey, R.; Anderson, K. Domestic Tradable Quotas: A Policy Instrument for Reducing Greenhouse Gas Emissions from Energy Use; Tyndall Centre for climate Change Research: Norwich, UK, 2005. [Google Scholar]
- Fawcett, T. Investigating Carbon Rationing as a Policy for Reducing Carbon Dioxide Emissions from UK Household Energy Use. Doctoral Thesis, University of London, London, UK, 2005. [Google Scholar]
- 2010 Norfolk Island to Trial World First Individual carbon Trading Program—Southern Cross University. Available online: https://www.scu.edu.au/engage/news/latest-news/2010/norfolk-island-to-trial-world-first-personal-carbon-trading-program.php (accessed on 20 April 2023).
- Webb, G.; Hendry, A.; Armstrong, B.; McDermott, R.; Swinburn, B.; Garry, E. Exploring the Effects of Individual carbon Trading (PCT) System on Carbon Emission and Health Issues: A Preliminary Study on the Norfolk Island. Int. Technol. Manag. Rev. 2014, 4, 1–11. [Google Scholar] [CrossRef]
- Fawcett, T. Individual carbon Trading: A Policy Ahead of Its Time? Energy Policy 2010, 38, 6868–6876. [Google Scholar] [CrossRef]
- Fawcett, T.; Parag, Y. An Introduction to Individual carbon Trading. Clim. Policy 2010, 10, 329–338. [Google Scholar] [CrossRef]
- Chen, H. Development and Prospect of Individual carbon Trading Research. China Popul. Resour. Environ. 2014, 24, 30–36. [Google Scholar]
- Goulder, L.H.; Hafstead, M.A.C.; Dworsky, M. Impacts of Alternative Emissions Allowance Allocation Methods under a Federal Cap-and-Trade Program. J. Environ. Econ. Manag. 2010, 60, 161–181. [Google Scholar] [CrossRef]
- Gao, L.; He, H.; Wang, S.; Li, J. What Drives Resident Acceptance of Individual carbon Trading Policy in China? Environ. Geochem. Health 2022, 44, 3007–3020. [Google Scholar] [CrossRef] [PubMed]
- Qiu, J.; Chen, R.; Chen, X. Research on the mechanism of carbon inclusion in Jiangsu Province. Low Carbon World 2020, 10, 6–7+10. [Google Scholar] [CrossRef]
- Jagers, S.C.; Löfgren, Å.; Stripple, J. Attitudes to personal carbon Allowances: Political Trust, Fairness and Ideology. In Personal Carbon Trading; Routledge: London, UK, 2017; pp. 410–431. [Google Scholar]
- Andersson, D.; Löfgren, Å.; Widerberg, A. Attitudes to Individual Carbon Allowances. 2011. Available online: http://hdl.handle.net/2077/25675 (accessed on 28 August 2023).
- Starkey, R. Individual carbon Trading: A Critical Survey Part 2: Efficiency and Effectiveness. Ecol. Econ. 2012, 73, 19–28. [Google Scholar] [CrossRef]
- Burgess, M. Individual carbon Allowances: A Revised Model to Alleviate Distributional Issues. Ecol. Econ. 2016, 130, 316–327. [Google Scholar] [CrossRef]
- Dawodu, A.; Dai, H.; Zou, T.; Zhou, H.; Lian, W.; Oladejo, J.; Osebor, F. Campus Sustainability Research: Indicators and Dimensions to Consider for the Design and Assessment of a Sustainable Campus. Heliyon 2022, 8, e11864. [Google Scholar] [CrossRef]
- Characteristics, L. Performances and Enlightenments of the EU Carbon Emissions Trading Scheme. J. Chongqing Univ. Technol. (Soc. Sci.) 2010, 24, 1–5. [Google Scholar]
- Guo, R.; Tian, Y. Low-carbon Oriented Methodology of Energy-related Carbon Accounting and Its Application in Campus. J. Tongji Univ. (Nat. Sci.) 2015, 43, 1361–1366. [Google Scholar]
- Fang, X.; Qu, Z.; Sun, C.; Wu, C.; Wei, J. Public Attitude and Policy Selection of Future Energy Sustainability in China: Evidence of the Survey of the College Students. Energy Policy 2022, 165, 112961. [Google Scholar] [CrossRef]
- 2006 IPCC Guidelines for National Greenhouse Gas Inventories—IPCC. Available online: https://www.ipcc.ch/report/2006-ipcc-guidelines-for-national-greenhouse-gas-inventories/ (accessed on 20 April 2023).
- Ridhosari, B.; Rahman, A. Carbon Footprint Assessment at Universitas Pertamina from the Scope of Electricity, Transportation, and Waste Generation: Toward a Green Campus and Promotion of Environmental Sustainability. J. Clean. Prod. 2020, 246, 119172. [Google Scholar] [CrossRef]
- Guerrieri, M.; La Gennusa, M.; Peri, G.; Rizzo, G.; Scaccianoce, G. University Campuses as Small-Scale Models of Cities: Quantitative Assessment of a Low Carbon Transition Path. Renew. Sustain. Energy Rev. 2019, 113, 109263. [Google Scholar] [CrossRef]
- Shi, Y.; Fu, S.; Guo, J. The Research on Campus Space Optimization of Low Carbon Based on CO₂ Diffusion Simulation. Int. J. Ecol. 2015, 4, 100–109. [Google Scholar] [CrossRef]
- Zhao, H.; Xu, Y.; Hong, W.-C.; Liang, Y.; Zou, D. Smart Evaluation of Green Campus Sustainability Considering Energy Utilization. Sustainability 2021, 13, 7653. [Google Scholar] [CrossRef]
- Na, W.; Zhao, Z.C. The Comprehensive Evaluation Method of Low-Carbon Campus Based on Analytic Hierarchy Process and Weights of Entropy. Environ. Dev. Sustain. 2021, 23, 9308–9319. [Google Scholar] [CrossRef]
- Liu, H.; Wang, X.; Yang, J.; Zhou, X.; Liu, Y. The Ecological Footprint Evaluation of Low Carbon Campuses Based on Life Cycle Assessment: A Case Study of Tianjin, China. J. Clean. Prod. 2017, 144, 266–278. [Google Scholar] [CrossRef]
- Zhu, B.; Zhu, C.; Dewancker, B. A Study of Development Mode in Green Campus to Realize the Sustainable Development Goals. Int. J. Sustain. High. Educ. 2020, 21, 799–818. [Google Scholar] [CrossRef]
- Jiang, P.; Chen, Y.; Xu, B.; Dong, W.; Kennedy, E. Building Low Carbon Communities in China: The Role of Individual’s Behaviour Change and Engagement. Energy Policy 2013, 60, 611–620. [Google Scholar] [CrossRef]
- Li, X.; Tan, H.; Rackes, A. Carbon Footprint Analysis of Student Behavior for a Sustainable University Campus in China. J. Clean. Prod. 2015, 106, 97–108. [Google Scholar] [CrossRef]
- Lin, B.; Yang, M. Choosing the Right Policy: Factors Influencing the Preferences of Consumption-Side Individual carbon Reduction Policies. J. Environ. Manag. 2023, 326, 116706. [Google Scholar] [CrossRef] [PubMed]
- Ping, L.; Pengcheng, C. Research on the path of Low carbon Campus Construction in Chinese Universities. Resour. Econ. Environ. Prot. 2022, 146–148. [Google Scholar] [CrossRef]
- Ajzen, I. The Theory of Planned Behavior. Organ. Behav. Hum. Decis. Process. 1991, 50, 179–211. [Google Scholar] [CrossRef]
- Ding, Z.; Jiang, X.; Liu, Z.; Long, R.; Xu, Z.; Cao, Q. Factors Affecting Low-Carbon Consumption Behavior of Urban Residents: A Comprehensive Review. Resour. Conserv. Recycl. 2018, 132, 3–15. [Google Scholar] [CrossRef]
- Luo, X.; Zhang, M.; Liu, X. Analysis of Factors Affecting Rural Residents’ Willingness to Adjust Energy Use Behaviors Based on a Multi-Group Analysis. Energy Rep. 2023, 9, 522–538. [Google Scholar] [CrossRef]
- Hafner, R.J.; Elmes, D.; Read, D. Promoting Behavioural Change to Reduce Thermal Energy Demand in Households: A Review. Renew. Sustain. Energy Rev. 2019, 102, 205–214. [Google Scholar] [CrossRef]
- Guo, D.; Chen, H.; Long, R.; Zou, S. Determinants of Residents’ Approach–Avoidance Responses to the Personal Carbon Trading Scheme: An Empirical Analysis of Urban Residents in Eastern China. Int. J. Environ. Res. Public Health 2021, 18, 822. [Google Scholar] [CrossRef]
- Gansser, O.A.; Reich, C.S. Influence of the new ecological paradigm (NEP) and environmental concerns on pro-environmental behavioral intention based on the theory of planned behavior (TPB). J. Clean. Prod. 2023, 382, 134629. [Google Scholar] [CrossRef]
- Chen, W.; Li, J. Who Are the Low-Carbon Activists? Analysis of the Influence Mechanism and Group Characteristics of Low-Carbon Behavior in Tianjin, China. Sci. Total Environ. 2019, 683, 729–736. [Google Scholar] [CrossRef] [PubMed]
- Liu, Y. Residents’ Willingness and Influencing Factors on Action Individual carbon Trading: A Case Study of Metropolitan Areas in Tianjin, China. Sustainability 2019, 11, 369. [Google Scholar] [CrossRef]
- Yang, S.; Zhang, Y.; Zhao, D. Who Exhibits More Energy-Saving Behavior in Direct and Indirect Ways in China? The Role of Psychological Factors and Socio-Demographics. Energy Policy 2016, 93, 196–205. [Google Scholar] [CrossRef]
- Capstick, S.B.; Lewis, A. Effects of Individual carbon Allowances on Decision-Making: Evidence from an Experimental Simulation. In Individual Carbon Trading; Routledge: London, UK, 2017; pp. 369–384. ISBN 1-84977-672-5. [Google Scholar]
- Tao, Y.; Duan, M.; Deng, Z. Using an extended theory of planned behaviour to explain willingness towards voluntary carbon offsetting among Chinese consumers. Ecol. Econ. 2021, 185, 107068. [Google Scholar] [CrossRef]
- Danner, U.N.; Aarts, H.; De Vries, N.K. Habit vs. intention in the prediction of future behaviour: The role of frequency, context stability and mental accessibility of past behaviour. Br. J. Soc. Psychol. 2008, 47, 245–265. [Google Scholar] [CrossRef] [PubMed]
- Ajzen, I.; Fishbein, M.; Lohmann, S.; Albarracín, D. The influence of attitudes on behavior. In The Handbook of Attitudes, Volume 1: Basic Principles; Psychology Press: New York, NY, USA, 2018; pp. 197–255. [Google Scholar]
- Lavelle, M.J.; Rau, H.; Fahy, F. Different shades of green? Unpacking habitual and occasional pro-environmental behavior. Glob. Environ. Chang. 2015, 35, 368–378. [Google Scholar] [CrossRef]
- Verplanken, B.; Roy, D. Empowering interventions to promote sustainable lifestyles: Testing the habit discontinuity hypothesis in a field experiment. J. Environ. Psychol. 2016, 45, 127–134. [Google Scholar] [CrossRef]
- Chang, H.-J. Institutional Change and Economic Development; Anthem Press: London, UK, 2007; ISBN 978-0-85728-697-0. [Google Scholar]
- Ding, Z.; Wang, G.; Liu, Z.; Long, R. Research on Differences in the Factors Influencing the Energy-Saving Behavior of Urban and Rural Residents in China–A Case Study of Jiangsu Province. Energy Policy 2017, 100, 252–259. [Google Scholar] [CrossRef]
- Khanna, T.M.; Baiocchi, G.; Callaghan, M.; Creutzig, F.; Guias, H.; Haddaway, N.R.; Hirth, L.; Javaid, A.; Koch, N.; Laukemper, S.; et al. A Multi-Country Meta-Analysis on the Role of Behavioural Change in Reducing Energy Consumption and CO2 Emissions in Residential Buildings. Nat. Energy 2021, 6, 925–932. [Google Scholar] [CrossRef]
- Qi, A.; Ji, Z.; Gong, Y.; Yang, B.; Sun, Y. The Impact of the Gain-Loss Frame on College Students’ Willingness to Participate in the Individual Low-Carbon Behavior Rewarding System (ILBRS): The Mediating Role of Environmental Risk Perception. Int. J. Environ. Res. Public Health 2022, 19, 11008. [Google Scholar] [CrossRef]
- Hayes, A.F. Introduction to Mediation, Moderation, and Conditional Process Analysis: A Regression-Based Approach; Guilford Press: New York, NY, USA, 2013; pp. xvii, 507. ISBN 978-1-60918-230-4. [Google Scholar]

Disclaimer/Publisher’s Note: The statements, opinions and data contained in all publications are solely those of the individual author(s) and contributor(s) and not of MDPI and/or the editor(s). MDPI and/or the editor(s) disclaim responsibility for any injury to people or property resulting from any ideas, methods, instructions or products referred to in the content. |
© 2023 by the authors. Licensee MDPI, Basel, Switzerland. This article is an open access article distributed under the terms and conditions of the Creative Commons Attribution (CC BY) license (https://creativecommons.org/licenses/by/4.0/).