Abstract
Environmental, social, and governance (ESG) integration is an increasingly popular and innovative investing strategy that requires companies to be transparent about their ESG practices to facilitate investors’ decisions. In the palm oil sector, companies are addressing ESG risks by adopting and disclosing ESG efforts to improve access to financing. This study seeks to broaden existing research on ESG transparency and firms’ financial indicators by using firm valuation as a financial indicator and investigating the moderating role of firm size in the palm oil sector. It first investigates whether ESG transparency has a direct positive or negative effect on firm valuation. Transparency is measured using the Zoological Society of London’s (ZSL) Sustainability Policy Transparency Toolkit (SPOTT) 2021 assessment, which provides scores for palm oil companies’ total, environmental, social, and governance disclosures. Firm valuation is measured by the price-to-earnings ratio (P/E), a widely used ratio calculated by dividing the share price by earnings per share. The study also explores the moderating role of firm size, using accounting-based measures such as revenue and assets, in strengthening the relationship between ESG transparency and firm valuation. The results show statistically significant negative relationships between ESG transparency and firm valuation. Companies with stronger ESG transparency are valued at a discount relative to companies with weaker ESG transparency. Additionally, the results find that firm size plays a moderating role such that larger firms strengthen the negative relationships between all transparency measures and firm valuation. These findings encourage constructive action for various stakeholders and provide implications for future research to support mainstreaming sustainable palm oil.
1. Introduction
Palm oil is the world’s most produced, consumed, and traded vegetable oil. It is the most land-efficient crop, utilizing only 6% of cultivated land for vegetable oils globally but contributes over a third of the total output [1], making it difficult to substitute. The oil palm crop is a commodity widely used across products such as cooking oil, processed food, cosmetics, cleaning products, animal feed, and biofuel [2]. Almost half of the world’s population depends on palm oil for their diets [3]. Palm oil is produced in tropical countries, with production dominated by developing countries such as Indonesia and Malaysia, which account for 83% of global production, with 59% produced by Indonesia (44.7 million tonnes) and 24% produced by Malaysia (18.1 million tonnes) [4]. The crop is a key contributor to economic development. It has alleviated poverty for millions of people [5], created jobs, developed rural infrastructure [6], and strengthened exports for producing countries [7].
However, palm oil’s growing importance to global economies has placed companies in the sector under more scrutiny than any other agricultural commodity due to their involvement with unsustainable practices. Linking sustainability to the environmental, social, and governance (ESG) context, the sector generates several negative externalities to society. Clearing land for expansion has resulted in environmental concerns from deforestation and peatland degradation, which significantly account for the 23% of greenhouse gas (GHG) emissions attributed to agriculture, forestry, and other land uses [8]. This has resulted in the recurring transboundary haze in Southeast Asia, causing respiratory issues and fatalities, leading to billions of dollars in damage [9]. Furthermore, palm oil production impacts the highest number of threatened species when compared to other oil crops [10]. Social issues such as forced labor have led to the United States (US) placing sanctions on companies [11], while governance issues such as corruption [12] and incomplete traceability [6,13,14] have raised greenwashing risks. These issues have eroded investor and consumer confidence in the sector. With the world population estimated to grow from 8.0 billion in 2022 to 9.7 billion by 2050 [15], future demand for palm oil is forecasted to grow further. Production could rise four to six times from 73.8 million metric tonnes in 2020 to 264 to 447 million metric tonnes by 2050 [16], creating opportunities for producers to expand production capacities. With few productive oil crop substitutes, it is therefore critical for palm oil companies to expand their involvement with sustainable practices such as those that protect forests and peatlands, optimize land use efficiency, improve grievance mechanisms, and strengthen transparency. Regulations and engagement efforts from several stakeholder groups in society have also emerged to mainstream sustainable palm oil.
Globally, sustainability has become an increasingly important priority to provide for the needs of present and future generations. ESG was coined as a framework for sustainability in a financial sector initiative to integrate non-financial indicators in financial markets [17]. Companies with better ESG management can raise shareholder value by better managing ESG risks, foreseeing regulatory changes or consumer trends, and entering new markets or lowering costs. In other words, companies concerned with ESG would thrive by satisfying shareholders and societal stakeholders such as regulatory bodies and consumers. If ESG risks are left unaddressed, companies can incur financial risks through compliance and reputational risks, higher operational costs, lower revenues [18], lower equity value of shares, and reduced access to financial resources to maintain and grow their operations. This can consequently reflect poor growth opportunities and investment returns, which are embedded in firm valuation measures that investors use for analysis.
Investors have responded to ESG risks by adopting ESG integration as an innovative strategy for sustainable investing. ESG integration is defined by the United Nations Principles for Responsible Investment (UNPRI) as “the systematic and explicit inclusion of material ESG factors into investment analysis and decisions” [19]. The Global Sustainable Investment Alliance’s (GSIA) 2020 report shows that ESG integration (USD 25.2 trillion) has overtaken negative and exclusionary screening (USD 15.9 trillion) as the most common sustainable investment strategy [20]. It evidences the need for a sustainable transition through innovative approaches to better investor engagement. Investors are closing this gap by increasingly seeking non-financial benefits by focusing on ESG transparency, which is commonly associated with sustainability reporting, corporate social responsibility (CSR), and ESG disclosures. These can help firms and investors unlock a significant pool of untapped financial resources to catalyze the transition toward a more sustainable world.
Sustainable finance through ESG integration thus plays a vital role in achieving sustainable palm oil production. The World Wide Fund for Nature Inc. (WWF) warned that divestment could erode the sustainability of the sector [21]. Instead, institutional investors need to improve their capacity to engage with palm oil companies such as by enhancing policy disclosures, which would facilitate the uptake of ESG integration. The UNPRI Investor Working Group on Sustainable Palm Oil also engaged with palm oil companies, banks, and shareholders to instill stewardship efforts to transform the palm oil sector to become more sustainable [22]. Additionally, several supporting initiatives are being developed to encourage companies to increase their ESG transparency to support ESG integration. As such, in addition to improving their practices, palm oil companies are increasingly raising their efforts in ESG transparency to gain stakeholder trust and a competitive advantage for their efforts toward sustainable palm oil. While production continues to grow, deforestation for the commodity decreased by 82% in the last decade to 45,285 hectares annually from 2018 to 2020 [23], evidencing that sustainable palm oil is attainable. Research outside the palm oil sector shows linkages between ESG transparency and financial indicators of firms [24] to justify the case for ESG integration. ESG transparency can improve stakeholder trust, minimize reputational risk, avoid compliance costs, reduce operational risks, and create long-term value for stakeholders [17,18,25]. Yet, there remains a degree of skepticism as to whether the relationship between ESG transparency and financial indicators is positive or negative. Some studies also found that individual environmental, social, and governance components could influence financial indicators more than overall ESG [26,27,28]. Few studies have used firm valuation measured by the price-to-earnings ratio (P/E) as a financial indicator, despite being the most popular valuation tool used by investors [29,30,31]. Additionally, some studies found that larger firms are equipped with more resources and capacity to engage in ESG, suggesting that firm size has a moderating role in strengthening the relationship [32,33]. Only a handful of direct relationships have been found within the palm oil sector using financial indicators such as stock performance [34,35,36,37]. Research on the moderating role of firm size in the sector is absent. However, a growing body of evidence in the sector suggests that ESG transparency can influence firm valuation, and that firm size has a moderating effect. Hence, this study seeks to contribute to the existing literature by being the first to investigate the relationships between ESG transparency and firm valuation, and the moderating role of firm size in the global palm oil sector.
The results find that there is a negative relationship between ESG transparency and firm valuation, and that larger firms do strengthen the negative direct relationship between ESG transparency and firm valuation. This indicates that the innovative strategy of ESG integration may be lacking in the sector and larger companies are susceptible to more scrutiny. The findings call for more engagement with investors and financiers to improve sentiment for ESG integration and strengthen companies’ competitive advantage toward mainstreaming sustainable palm oil.
As an overview, this paper reviews the existing literature in Section 2 to contextualize the basis for the authors’ research questions, methodology, analysis, and discussion. Section 3 develops the conceptual framework and the subsequent hypotheses for the study. Section 4 details the methods adopted to conduct the research study, including the justifications for data sources, variables used, and the model tests that are conducted. Section 5 presents the results of the study and analyzes whether the hypotheses in question can be accepted or rejected. Section 6 discusses the interpretation of the study, along with recommendations and implications for future research. The final section summarizes the paper and concludes with how the study contributes to the existing literature.
2. Literature Review
This section explores the applications of existing organizational theories to justify how providing stakeholder transparency on ESG practices translates to financial benefit through ESG integration. The literature review then draws inspiration from similar studies between ESG performance and financial indicators conducted beyond the palm oil sector, and highlights research that uses variables such as firm valuation and firm size that can be considered for the palm oil sector.
2.1. Stakeholder Transparency
ESG risks call for stronger regulation, penalties, and transparency to prevent companies from behaving unsustainably and minimize externalities conveyed. Companies are expected to internalize sustainability into their strategy and culture to attain competitive advantage while reducing risks [38] such as legal, reputational, and financial risks that can divert resources away from main businesses. With ESG considerations embedded into their practices, companies should communicate their ESG efforts by establishing a comprehensible metric of externalities involving the ecosystem and stakeholders [39], which improves stakeholder transparency.
The treatment of ESG transparency overlaps with that of sustainability reporting, corporate social responsibility (CSR) reporting, and ESG disclosures in the literature. Commonality exists in that both reporting and disclosure aim to address transparency to stakeholders. While sustainability addresses a broader definition, CSR and ESG cover aspects of sustainability. Through ESG, sustainability is categorized into three components—environmental, social, and governance—and has become the most extensively used measurement of sustainability standards in current practice to hold companies accountable [40].
The percentage of Fortune Global 250 firms allocating portions of their annual reports and CSR reporting to CSR activities grew from 44% in 2011 to 78% in 2017 [25], showcasing the growing norms of communicating sustainability among businesses. High ESG performance can provide “insurance-like” protection as these firms gain stakeholder trust and experience less criticism from stakeholders such as investors and regulatory bodies [41,42]. Clark, Feiner, and Viehs (2015) [43] note that the future of sustainable investing will involve active ownership by multiple stakeholder groups, which aligns with the growing trend of ESG integration.
Companies providing stakeholder transparency on ESG practices can be rationalized by existing organizational theories. In this paper’s context, there also exist various supporting initiatives to encourage palm oil companies to communicate their efforts.
2.1.1. Theoretical Underpinnings
Providing transparency about ESG efforts draws on existing organizational concepts of agency theory, legitimacy theory, stakeholder theory, and signal theory for substantiating the relationship between ESG transparency and firm valuation.
Legitimacy theory suggests that companies are operating in ways accepted by society to attain a social license to operate [44]. Corporations will legitimize their actions through ESG transparency to ensure their continuing existence. Society may penalize firms for their negligence or reluctance towards ESG activities which can threaten firm survival. This theory is most cited among research papers exploring the relationship between sustainability and financial indicators.
Similarly, stakeholder theory originated from R. Edward Freeman in 1984, who argued that companies should consider other members of society who have connections to business activities to influence the success of products and services [45]. This is backed by other studies [46,47] where other stakeholders in society include employees, customers, suppliers, financiers, communities, and government. Societal stakeholders are thus key motivators for companies to engage in ESG practices [48]. By doing so, ESG practices could increase shareholder value by improving reputation which attracts more customers, improving productivity for trained employees [49], and minimizing regulatory costs.
The agency theory is based on two main pillars: the principal–agent relationship and the separation between ownership and control [50]. The principal, otherwise the company owner or shareholder, delegates the managing power to the agent to act in the best interests of the principal [51,52]. However, agents may pursue their own interests at the expense of the principal, resulting in agency cost and conflict [53]. Principals are more focused on the long term while agents are more focused on short-term benefits. For this paper, ESG disclosures are perceived to reduce agency costs via information asymmetry, which arises from the separation between ownership and control [54]. The stronger the disclosure, the greater the transparency. ESG transparency can thus help reduce compliance costs, which can influence the risk profile and valuation of the firm [55,56].
The signaling theory suggests that companies will reduce information symmetry present in imperfect markets by sharing information with stakeholders. ESG transparency hence signals a firm’s credibility and commitment towards sustainability to external stakeholders [57,58].
Therefore, these theories provide the basis for why ESG transparency signals to stakeholders the extent to which the company is operating sustainably, making ESG integration an innovative sustainable investing strategy for firms to gain a competitive advantage. ESG transparency can be used to legitimize corporate activities towards creditors and shareholders, thus incentivizing efforts to engage in sustainability [59]. This implies that higher ESG transparency reduces agency costs, and signals legitimacy to various stakeholder groups that firms have low compliance risk and minimal reputational risk, and hence deserve stronger valuation. Companies that behave less responsibly will be punished by the market [60,61,62] and this can be reflected by a decrease in performance, such as sales and earnings, which are linked to their valuations.
2.1.2. Supporting Initiatives
To facilitate transparency, there exist several regulations and initiatives by different stakeholder groups in society that can be applied across sectors, with some developed for the palm oil sector itself. These include regulations, mandates by public exchanges, voluntary initiatives, certification schemes, and data and reporting platforms that enable stakeholders to access information about companies’ practices.
Regulations
Reporting regulations have been on the rise to motivate companies to strengthen their sustainability disclosures [63]. Within the EU, the EU Taxonomy Regulation aims to develop a classification system for economic activities that are environmentally sustainable [64]. Additionally, the EU’s Sustainable Finance Disclosure Regulation (SFDR) addresses ESG reporting obligations by requiring financial market participants to share how sustainability risks are managed [64]. Newer developments include the European Sustainability Reporting Standards (ESRS) for entities subject to the Corporate Sustainability Reporting Directive (CSRD), which are required to be applied by large companies in their 2024 annual reports [65]. These are mandated by the European Commission, based on draft standards developed by EFRAG (the European Financial Reporting Advisory Group) [66]. At a global scale, the International Sustainability Standards Board (ISSB), set up by the International Financial Reporting Standards (IFRS) Foundation [67], published its first sustainability-related disclosure standards known as IFRS S1 and IFRS S2, building upon existing market standards, to establish the global baseline for sustainability-related disclosures [68]. These are critical in unifying standards on sustainability and promoting more transparent and credible ESG data and disclosures for stakeholders.
Public Exchanges
Public exchanges help foster market confidence by strengthening governance to promote ESG disclosures through listing requirements. This helps to protect companies’ reputations and facilitates competition among companies [69]. In 2015, when the UN Sustainable Stock Exchanges (SSE) initiative launched its Model Guidance, less than a third of stock exchanges in the world provided ESG guidance, and by mid-2020 more than half of SSE’s members published ESG guidance [70]. Public exchanges have mandated sustainability reporting for listed companies across Singapore, Hong Kong, Indonesia, Malaysia, and Thailand [71], and large listed companies in Europe and the United Kingdom (UK) [72]. For India, it will be mandated for the top 1000 largest companies from fiscal years 2022 to 2023 [71].
Voluntary Initiatives
To address information asymmetry about non-financial concerns between companies and investors [73], there exists a wide range of standards and frameworks available for assessing ESG transparency through sustainability reporting and ESG disclosures. These include the UN Global Compact Network (GCN), the Global Reporting Initiative (GRI), the Sustainability Accounting Standards Board (SASB), and the International Integrated Reporting Council (IIRC). There are also several data providers such as Bloomberg, Sustainalytics, Standard and Poor’s (S&P), and Morgan Stanley Composite Index (MSCI) who have their ESG metrics. These frameworks and databases have comprehensive guidelines covering ESG considerations, but these are not consistently used across industries and firms. Despite enabling transparency, the inconsistency makes the extent and quality of ESG disclosure heterogeneous [29], creating challenges for stakeholders to assess and compare ESG performance.
Principle-based voluntary ESG initiatives have progressively been established to strengthen private investments, such as the UNPRI, UN Environment Programme (UNEP) Finance Initiative, Equator Principles, and Principles for Sustainable Insurance [74]. In response to managing heterogeneous disclosures, the UNPRI, GSIA and the CFA Institute formed a collaboration to create an authoritative resource that harmonizes the different terms and definitions relating to ESG investment to make ESG disclosures more comparable and enhance the investors’ decision making while minimizing legal, compliance, and reputation risks [75].
Certification
In the palm oil sector, certification is commonly used for companies to transparently communicate commitments to ESG. The most globally recognized is the Roundtable on Sustainable Palm Oil (RSPO), a voluntary certification set up in 2004 to promote sustainable palm oil [76]. Its members comprise stakeholder groups in the value chain from producers, processors, traders, manufacturers, retailers, investors, and NGOs [77]. The RSPO collaborates with government bodies to formulate legislative frameworks. However, its high visibility and association with greenwashing have highlighted weaknesses and garnered doubts about the certification’s credibility [4], as observed in the earlier examples of labor challenges. RSPO certification is also costly to adopt, as it excludes smaller companies and smallholders from being recognized as sustainable. Nonetheless, its Principles and Criteria (P&C) have continually been revised and strengthened over time [78], reflecting its progressive nature. Certification is still beneficial in demonstrating a commitment to sustainability and improved branding. Since its inception, approximately 20% of palm oil produced globally is certified sustainable by RSPO [79].
At a national level, the top-producing countries of Indonesia and Malaysia established Indonesian Sustainable Palm Oil (ISPO) and Malaysian Sustainable Palm Oil (MSPO) in their respective countries. Compared with RSPO, studies consistently found RSPO to be the most robust, comprehensive, and ambitious in criteria, followed by MSPO, and ISPO the least [76,77,80,81,82]. As such, some studies do not count MSPO and ISPO as certified sustainable palm oil (CSPO) [2,4,78]. Indirectly, they demonstrate that the stringent nature of RSPO and its high costs make it challenging to attain. Instead, ISPO and MSPO are perceived more as stepping stones for smaller companies and smallholders in the top two producing countries to adopt sustainable practices [83].
Data and Reporting Platforms
The rise in data and reporting platforms boosts transparency and traceability for the palm oil sector. These platforms include satellite-based deforestation monitoring systems such as the World Resources Institute’s (WRI) Global Forests Watch program [84], Suitability Mapper [85], Forest Cover Analyzer [86], Trase [87], and RSPO PalmTrace [88]. These platforms enhance supply chain mapping and enable better planning of land use strategies and sustainable palm oil production.
Moreover, data platforms such as the Zoological Society of London’s (ZSL) Sustainability Policy Transparency Toolkit (SPOTT) [89] and WWF’s Palm Oil Buyer’s Scorecard [90] go beyond the requirements of certification to rank companies on their sustainability disclosures over the years. For example, the SPOTT initiative is an annual assessment of soft commodity producers, processors, and traders on the ESG-related public disclosure of their organization, policies, and practices [89]. They produce separate assessments for palm oil, timber and pulp, and natural rubber. They actively collaborate with industry players including the RSPO [91] and all members of the value chain—governments, financiers, producers, consumers, investors, and NGOs—to adopt strategic measures to improve the sustainability of palm oil while achieving supply chain transparency [92]. At its inception in 2014, only large publicly listed companies were initially assessed [93], as they were perceived to have the largest environmental impact, greater access to resources, and more pressure to improve compared to smaller companies. However, smaller and privately owned companies were subsequently added as stakeholders sought to ensure holistic efforts of transparency in the sector. Smaller companies have shown improvement rates similar to those of larger companies due to increased pressure on the sector throughout SPOTT assessments from 2014 to 2018 [93]. The indicator framework has also been revised and expanded to include indicators beyond “Environmental” considerations to provide a comprehensive scope of ESG, and it is considered to have reached a point of maturity [93].
2.2. Integrating Sustainability with Finance
Several studies beyond the palm oil sector find that transparency on ESG can have a relationship with various financial indicators. These relationships conducted across sectors and countries extend support for ESG integration. Common variables such as firm valuation and firm size are studied further to rationalize the relationships. Drawing inspiration from these studies, the literature links back to the palm oil context by reviewing existing research in the sector to identify gaps and opportunities that this paper can help to address.
Since 1970, over 2000 studies have been conducted [24] to marry the relationship between the non-financial indicators of sustainability with financial indicators. This demonstrates the push for ESG integration into financial considerations, building the foundations for sustainable investments. However, the findings of prior research have been mixed. There could be significant positive or negative relationships, or no significant relationships. In Friede, Busch, and Bassen’s (2015) [24] analysis, most studies found a positive relationship between ESG and firms’ financial indicators, a quarter had a neutral relationship, while a tenth reflected a negative relationship. These studies are scoped differently using inconsistent measures for sustainability [30] as well as financial indicators. Moreover, results were also mixed as to whether total ESG or isolated environmental (E), social (S), or governance (G) components held more weight in determining financial indicators. Isolating the components also helped to remove the effects of netting, as a negative indicator in one component could be negated by a strength in another [94].
Many studies found a positive relationship between ESG and organizations’ financial indicators [24,43,95] such as lowered cost of capital, better operational performance, and improved stock price performance and market value. Higher ESG performance inherently protects firms by portraying a positive reputation to shareholders [41]. An analysis of 52 studies based on 33,878 observations finds that corporate social performance is positively correlated with corporate market value [26], suggesting that the S component holds more weight. A global study of 44 countries concluded with statistical significance that ESG scores were heterogeneous, where overall ESG scores and E scores had positive effects, while S and G scores had negative effects [27]. In Germany, a significantly positive relationship was found between ESG and accounting-based firm performance, and G was found to be the strongest determinant factor [28], possibly due to the German Corporate Governance Code introduced in 2002 where firms are obligated to report CSR. This demonstrates how regulating authorities have a positive influence over companies’ actions. At the industrial level, a study of large manufacturing companies in the US during the 1980s found that those with higher profits tended to be more socially responsible with reduced risk [96]. Another study on the real estate sector in developed countries found a positive relationship between ESG disclosure with financial performance, where E was also significant in influencing return on capital (ROC) [29]. As for the pharmaceutical industry in Italy, G was positively related to financial performance [97], where good corporate behaviours through compensation, management of fraud, ethics and values, transparency, and anti-corruption could be linked with companies’ operations and relative market performance.
Amongst those with neutral relationships, it is possible that the costs of demonstrating ESG were net off by financial benefits [98,99]. Similarly, no significance was found in another study on Italian blue-chip companies between ESG scores and abnormal returns, evidencing that social responsibility was not a reliable indicator for leverage [100]. These examples suggest that ESG disclosures have no relevance in determining any financial benefit.
Of those with negative relationships, a study on Northern European firms also found a negative relationship between ESG and P/E [31], with a weak correlation suggesting that investors interested in ESG were not necessarily concerned with the high returns. In terms of risk, a negative relationship was found between E and S disclosures on total risk, as corporate transparency increased the reputation and trust of stakeholders [101]. Similarly, the ESG performance of textile and apparel firms helped to reduce volatility and market risk [102].
As opposed to a linear relationship, Nofsinger, Sulaeman, and Varma’s (2019) [94] study of E and S components found that institutional investors demonstrated an asymmetric preference for strong and weak CSR attributes. Investment portfolios that avoided or had few weak ES stocks generated higher alphas than those with a greater fraction of weak ES. Institutional investors were averse to ES weaknesses through divestment but appeared ambivalent towards ES strengths because CSR was also linked with agency costs that eroded economic benefit [94]. This aligns with the findings of Krüger (2015) that the stock market responds weakly negatively to positive ESG news [103] and that firms with strong CSR records had more liability due to greater scrutiny of negative events [104]. In this regard, minimizing risk through divestment appeared to dominate investors’ decision-making process.
Amongst the literature review, few studies were conducted on the palm oil sector using other financial indicators. Those conducted on palm oil either had only an environmental focus or were exclusive to RSPO certification rather than overall ESG transparency, which could be reflected in other measures that were more inclusive of smaller firms. For studies with an environmental focus, markets were found to be sensitive to negative environmental events, as the 2015 haze crisis had significantly negative impacts on abnormal stock returns for palm oil companies in Southeast Asia [34]. Separately, a positive relationship was found between environmental disclosure and return on assets (ROA) for Malaysian companies, which were explained to have a larger firm size than Indonesian companies [105]. For studies exclusive to RSPO certification, nine Indonesian RSPO-certified companies were found to have a 2.28 times appreciation in share price between 2005 and 2016 compared to uncertified companies [35]. Climate Advisers also established a palm oil index that found 18 RSPO-certified firms outperforming non-certified counterparts by about 25% over 6.5 years [36]. Mixed results were observed in another study of 64 palm oil firms, where Malaysian RSPO-certified firms had poorer risk-adjusted performance than their respective non-certified peers, while the Indonesian RSPO-certified portfolio fared better than its peers, implying RSPO had limited influence on stock performance [37]. Tey and Brindal (2020) [37] identified that RSPO certification requires economies of scale that are more suited for larger farm operations and that palm oil investors may benefit more from small-cap companies in Malaysia. They also raised the need for an easily understood and accepted ESG framework, as opposed to RSPO certification, to provide a more robust view for developing the basis of investing for growth through a sustainability standard. This spurs further investigation into the palm oil sector that goes beyond certification and assesses overall ESG transparency. It will also respond to Godfrey and Hatch (2007) [106], who called for industry-specific research, as differences among industries can become obscured when ranked by the same criteria. Comparisons within industries provide more clarity on relevant and meaningful sustainability considerations.
2.2.1. Firm Valuation
Studies in previous literature have used various financial indicators such as market value, ROA, ROC, P/E, stock returns, and dividend yield. This study will focus on the valuation of a company to be given by P/E because far fewer studies have used P/E, despite it being the top-used measure for valuing companies [107]. It is calculated as the share price divided by earnings per share. Earnings per share is the net income over a certain period, typically a fiscal year, divided by the total number of shares outstanding at the point in time.
The rationale for using P/E is that investors can apply ESG investing principles to guide their decisions to purchase company shares, which are reflected by the share price. As a ratio, P/E standardizes stocks of different prices and earning levels, making it useful for comparing its performance across time or with competitors in the same industry [108].
Future value creation is a key component in firm valuation [109]. It reflects growth, characterized by the size of a company’s investments, the excess investment returns relative to the cost of capital, and the length of time a company can find value-creating investment opportunities [110]. It is unlikely for a company’s P/E to revert to historically higher levels unless growth prospects and return on incremental capital remain consistent with historic levels, which are difficult to maintain. This explains why stocks with a high P/E are growth stocks that signify overvaluation, as fast growth and high volatility are expected.
Meanwhile, a low P/E represents value stocks, which typically represent companies that have slowed in growth. Value stocks indicate modest expectations of future value creation and, if the company is stable, they can present opportunities for attractive returns. A low P/E could signify undervaluation or that the company has slowed in growth with low volatility. Investors prefer to invest in company stocks with low P/E because it also represents a low price for a high earning, deeming it a value stock with higher returns anticipated [111]. Therefore, P/E ratios help to identify valuation premiums or discounts, as well as risk and growth opportunities. Studies show that portfolios with low ratios tend to provide abnormal or higher risk-adjusted returns [112,113,114].
Conversely, high P/E ratios can also be associated with slow growth [115]. Investors could change perspectives and view investments as less risky, causing demand and hence prices to increase. Such an example was when the COVID-19 virus impacted global economies in 2020, and companies with the highest ESG rankings were found to be trading at a 30% premium relative to poor performers by referencing their forward P/E [116]. This was due to high capital inflows into ESG funds causing an ESG bubble, suggesting that the P/E values of ESG investments were overvalued. Within the short period from April to June 2020, more than USD 70 billion was poured into ESG equity funds, surpassing annual flows [40]. Markets viewed ESG funds as less risky than non-ESG funds during COVID-19 when uncertainty was high, and demand for ESG funds grew, raising the P/E despite market conditions which implied slowed growth. Separately, Goldman Sachs Equity Research also hinted at a positive relationship, where global companies highly aligned with the EU Taxonomy were valued at a 37% P/E sector-relative premium, while low carbon-emitting companies in the Asia Pacific were trading at a 28% P/E premium over their high carbon-emitting peers [71]. Companies being transparent about their sustainability efforts appeared to encourage ESG integration as an innovative strategy for improving their valuation.
The rise of ESG presents many opportunities for sustainable investments. Studies remain inconclusive about the relationship between ESG transparency and P/E. Jitmaneeroj (2018) [30] found a positive relationship between the governance component and P/E in US companies, as companies focused on corporate governance practices during the 2008–2009 financial crisis and less on environmental and social factors. Almeyda and Darmansyah (2019) [29] and Junius, Adisurjo, Rijanto, and Adelina (2020) [117] found no statistical significance between ESG with P/E in the real estate sector and four ASEAN countries, respectively. Meanwhile, Svensson (2020) [31] found a negative relationship with P/E in Northern Europe companies. Hence, ESG could be suggested to have a neutral, positive, or negative relationship with P/E.
Therefore, by recognizing that ESG performance is linked with providing stakeholders with transparency on high performers, companies with high ESG transparency could have low P/E as they are expected to have higher returns than companies with low ESG transparency. Alternatively, high ESG transparency could also be associated with high demand and hence high P/E, as they are viewed as relatively low risk.
2.2.2. Firm Size
Firm size is frequently found to be related to firms’ sustainability-related decisions. Larger firms are usually more involved with CSR compared to smaller firms [118]. Many studies commonly use market capitalization, assets, and revenue as a control variable to control for the effect of size [28,32,49,53,119]. They imply that larger firms have a greater influence on societal stakeholders (e.g., larger consumer outreach and more employees) and are thus more closely monitored by the public, incentivizing them to better disclose their sustainability efforts [33,120]. They are also better positioned to reduce regulatory pressures from governments via the legitimacy theory [121], which explains why some public exchanges have stricter reporting requirements for larger firms. Larger firms are characterized by economies of scale [122], with more monetary, intellectual, and physical resources available to invest in ESG, and set exemplary models as market leaders [102]. Larger firms that invest in ESG can thus reduce firm risk, create a positive reputation for the firm, gain stakeholder trust, and gain a competitive advantage. However, the direction of the relationship between firm size, CSR performance, and financial indicators can be positive or negative [31].
While the benefits outweigh the costs for larger firms, the case is the opposite for smaller firms. ESG disclosure raises the cost of capital for listed small and medium-sized enterprises (SMEs) [123] as their firm characteristics differ from large firms by having simpler reporting structures, limited financial and human resources, and hence limited sustainability management tools [124], which changes the effectiveness of ESG disclosure.
To a lesser extent, studies also consider interaction effects between firm size with disclosure to explore firm-level heterogeneity since larger firms have greater propensity to attain better ESG performance. However, the interaction effects were found to be inconclusive. Krueger, Sautner, Tang, and Zhong (2021) [33] found a negative interaction between firm size and mandatory disclosure, indicating that smaller firms had less availability of ESG reporting, and were thus associated with poorer ESG performance than larger firms. Sánchez-Infante Hernández, Yañez-Araque, and Moreno-García (2020) [32] found that firm size had a significant moderating effect, where larger firms had stronger relationships between CSR and economic performance. On the other hand, Lin, Cheah, Azali, Ho, and Yip (2019) [125] had a counterintuitive finding that smaller firms in the automotive industry had higher efficiency with higher green innovation investment returns, and generated more profits than large firms that were too aggressive in investments and had lower financial performance.
As for firm size in the palm oil sector, empirical studies on the moderating role of firm size were not found. However, research finds that larger firms are perceived similarly to have greater propensity and hence expectations to adopt sustainable practices. The 2020 Annual Communication of Progress (ACOP) reports submitted by RSPO members found that the progress of the biggest players across the supply chain is considered too slow, especially for processors and traders, where nine of the ten biggest players were less than 30% certified [126]. Amongst growers, only three of the top ten achieved at least 80% certification. Companies with the largest land area and volumes of palm oil handled still fell short of certification. These companies are expected to have significant leverage with more responsibility to take up RSPO certification and were called to take urgent action to close the certification gap, as larger players have added responsibility to raise their uptake of sustainable palm oil.
The current literature commonly polarizes palm oil producers as large or small, without distinguishing medium-sized companies or smallholders [127]. Thus, policies and initiatives rarely target medium-sized companies. They may also lack the capacity to adopt ESG commitments given the numerous frameworks and guidelines for companies to adhere to. Some smaller companies can also have sustainable practices in place that are not incorporated into the policy framework, or they may only sell to the domestic market, and hence do not require an RSPO certification. The MSPO and ISPO certifications and standards such as the SPOTT framework help to be more inclusive toward varying firm sizes, as they look beyond the price premium and stringent criteria associated with RSPO certification to assess companies on their sustainability efforts. Efforts are still needed for more inclusive support toward smaller companies, including strengthening the acceptance for MSPO and ISPO to be recognized by international stakeholders.
2.2.3. Valuation for Palm Oil Companies
The valuation of palm oil companies was previously found to be positively influenced by economic indicators such as inflation, exchange rates, and the world crude palm oil (CPO) price [128]. In recent years, however, the correlation between companies’ share prices and CPO prices began to show a disconnect due to rising ESG concerns. The correlation between CPO prices and the Bursa Malaysia Plantation Index, which tracks 43 listed planters, weakened from 0.75 in 2020 to 0.22 in early 2021 when CPO prices rose beyond RM 3500 per tonne [129]. Similar observations were found between the CPO and the Kuala Lumpur Plantation Index (KLPI) up until August 2021 [130]. The portrayal of weak ESG practices, through the US Customs and Border Protection’s (CBP) ban on FGV Holdings Bhd and Sime Darby Plantation due to the use of forced labor, were cited to have eroded the share price of Malaysian planters. Investors’ growing ESG concerns appear to have overtaken economic indicators in influencing the valuation of palm oil companies. This reaffirms the need for companies to be transparent about ESG efforts for addressing investor concerns to encourage uptake of ESG integration as an innovative sustainable investing strategy.
A descriptive study performed by a global financial institution on 15 palm oil companies in 2021 identified similarly that ESG risks have caused the sector to trade at a record low P/E, which is a 72% discount below peak P/E [131]. This is wider than other ESG-excluded names in tobacco and thermal coal sectors. In other words, the palm oil sector was valued at a discount despite efforts to improve practices. Even with volatile market movements due to the Russia–Ukraine war and Indonesia’s temporary export ban on palm oil in 2022, another study by Foo [132] on five palm oil companies in 2022 suggested that the sector was still valued at 13-year lows since the Global Financial Crisis in 2009. This was reaffirmed by Rijk, Miraningrum, and Piotrowski (2022) [133], who found that Wilmar, the largest company in the palm oil supply chain, reached its lowest P/E in history as of March 2022 due to reputational impacts caused by poor transparency relating to forest and sustainability risks, calling for better transparency of “No Deforestation, No Peat and No Exploitation” (NDPE) policy execution and uptake of certified palm oil. As these studies are mainly descriptive, they inspire an opportunity to conduct empirical research to validate if there is any statistical significance between ESG transparency and the P/E valuation discount of palm oil companies, instead of looking at stock returns or ROA conducted by previous studies.
3. Conceptual Development
Derived from the literature review, this section builds the conceptual framework and develops the testable hypotheses.
The growing adoption of ESG integration and the rise in stakeholder initiatives such as regulations, certifications, and reporting platforms have pressured companies to address the ESG risks of the palm oil sector and become more transparent by communicating their efforts towards sustainable palm oil production. Theoretical applications can be applied as companies achieve their social license to operate via the legitimacy theory, address stakeholder concerns on ESG risks via the stakeholder theory, act as agents on behalf of their shareholders via the agency theory, and reduce information asymmetry via the signaling theory to signal their commitment towards sustainability, all of which are expected to have an impact on firm valuation.
3.1. Direct Relationship
The literature review references studies outside the palm oil sector that suggest a possible direct relationship between ESG transparency and financial indicators, but the results were inconclusive as to whether the relationship was positive or negative. The relational ambiguity could suggest both scenarios. With firm valuation as a popular indicator used by investors, ESG transparency could have a positive relationship with firm valuation. Firms with higher ESG transparency could be valued at a premium compared to firms with less transparency. They could be high in demand and viewed as relatively low in risk. This is demonstrated by the ESG bubble in 2020 [116] and the need to align with regulations such as the EU Taxonomy [71], which are relevant to the palm oil sector. On the other hand, it is also possible that ESG transparency could be negatively related to firm valuation. Firms with higher ESG transparency could instead be undervalued stocks relative to those with lower ESG transparency. They would be preferred by investors as they potentially present a higher return for their low price relative to earnings [111,113]. Therefore, the conceptual framework is first developed by hypothesizing that the construct of ESG transparency could have a direct effect on firm valuation where the direction is either (a) positive or (b) negative.
Most studies investigate overall ESG, with the view that the management of environmental, social, and governance issues are intertwined. For example, the absence of corruption in governance could ensure strong enforcement of penalties towards environmental and social compliance. Alternatively, good governance that signals 100% traceability can mitigate the negative impacts of deforestation (environmental) and land use conflicts (social). By addressing all three aspects, companies benefit financially and attain a competitive advantage [38] as they are protected against compliance and reputational risks. Initiatives such as certification, where RSPO-certified companies outperformed non-certified counterparts [36], help to address such risks. This derives the first hypothesis that total ESG transparency has a direct positive or negative relationship with firm valuation.
H1a:
Total ESG transparency will have a positive relationship with firm valuation.
H1b:
Total ESG transparency will have a negative relationship with firm valuation.
Studies also find that the direct relationship could be observed for individual environmental, social, and governance components as they can have netting effects on one another [94] or even be heterogeneous, providing a mix of positive and negative relationships [27]. Therefore, each component should be considered for influencing firm valuation.
In the palm oil sector, the environmental (E) component could be directly related to firm valuation. Research on the environmental effects received more attention given increasing regulations relating to deforestation, transboundary haze, and the urgency of climate-related risks, such as declaring GHG emissions as part of the 2015 Paris Agreement. Erian (2016) [34] found that the 2015 haze crisis had significant negative impacts on abnormal stock returns of listed palm oil companies, implying that markets are sensitive to the knowledge of environmental events. Environmental indicators are also based on various scientific tools that ease data collection and facilitate extensive scientific research. Furthermore, the earlier years of SPOTT assessments entailed only environmental considerations before including social and governance [93], evidencing that environmental considerations hold more weight in attaining a competitive advantage than social or governance efforts. Thus, transparency about environmental efforts is suggested to have more influence on firm valuation than social and governance efforts. This derives the second hypothesis that environmental transparency has a direct positive or negative relationship with firm valuation.
H2a:
Environmental transparency will have a positive relationship with firm valuation.
H2b:
Environmental transparency will have a negative relationship with firm valuation.
It is also possible that financial indicators in the palm oil sector could be driven by the social (S) component or even both environmental and social components found in other studies [26,94]. Social issues have gained traction in recent years. The sanctions on FGV Holdings and Sime Darby over forced labor allegations highlight the increasing consideration of social issues, as the sanctions were key in influencing the share prices of Malaysian planters [130]. Social considerations could hold more weight in attaining a competitive advantage than environmental or governance considerations. This derives the third hypothesis that social transparency has a direct positive or negative relationship with firm valuation.
H3a:
Social transparency will have a positive relationship with firm valuation.
H3b:
Social transparency will have a negative relationship with firm valuation.
Governance (G) can also be a key driver of firm valuation. Velte (2017) [28] notes that the introduction of legislation such as the Corporate Governance Code possibly resulted in governance being the strongest driver for firm performance. Jitmaneeroj (2018) [30] also found a positive relationship between governance and P/E in US companies, as companies focused on corporate governance practices during the 2008–2009 financial crisis. Initiatives such as increased regulations, improvements to certifications, and companies disclosing their commitments highlight efforts for more transparency and better governance. The rise of data and reporting platforms to promote 100% traceability and improve transparency also reflects the emerging importance of governance in the sector. Greenwashing claims and investor aversion can hence be reduced by improving the credibility of deforestation commitments. Governance considerations could hold more weight in attaining a competitive advantage than environmental or social considerations. This derives the fourth hypothesis that governance transparency has a direct positive or negative relationship with firm valuation.
H4a:
Governance transparency will have a positive relationship with firm valuation.
H4b:
Governance transparency will have a negative relationship with firm valuation.
Figure 1 summarizes the conceptual framework for the direct relationship between transparency and firm valuation in hypotheses 1 to 4.
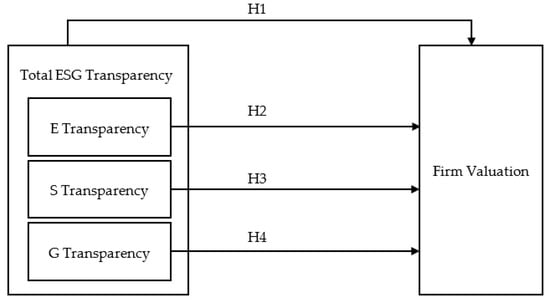
Figure 1.
Conceptual framework for the direct relationship.
3.2. Moderating Role of Firm Size
The literature review also observes that firm size could be another construct that moderates the relationship between ESG and financial indicators [32,33]. Compared with smaller companies, larger companies are more cost-effective and have greater capital to address ESG concerns. They also face more pressure to be more sustainable. This is reiterated by how some public exchanges mandate sustainability reporting for larger listed companies (e.g., Europe, UK, India). Large companies are hence perceived to be more responsive by enhancing ESG transparency to improve their competitive advantage, as they have capabilities to adhere to higher sustainability standards and have less ESG risk associated with traceability and compliance as compared to smaller companies. In palm oil’s context, the analysis of ACOP reports singled out larger players to increase their uptake of sustainable palm oil [126]. Thus, the earlier conceptual framework can be expanded upon to derive the fifth hypothesis that firm size plays a moderating role in the relationship between total ESG transparency and firm valuation.
H5a:
Firm size will moderate the positive effect of total ESG transparency on firm valuation such that when firm size increases, the positive effect is larger.
H5b:
Firm size will moderate the negative effect of total ESG transparency on firm valuation such that when firm size increases, the negative effect is larger.
Firm size could also have significant interaction with individual ESG components. In assessing sector valuation, Abdullah, Hamzah, Ali, Tseng, and Brander (2020) [105] found a significantly positive relationship between environmental disclosure and ROA in Malaysian companies that were larger in firm size relative to Indonesian companies. This derives the sixth hypothesis that firm size plays a moderating role in the relationship between environmental transparency and firm valuation.
H6a:
Firm size will moderate the positive effect of environmental transparency such that when firm size increases, the positive effect is larger.
H6b:
Firm size will moderate the negative effect of environmental transparency on firm valuation such that when firm size increases, the negative effect is larger.
In the social aspect, the penalties in reaction to forced labor allegations and poor working conditions were also imposed on large companies such as Sime Darby, which impacted their share prices linked to firm valuation [130]. However, Sime Darby engaged the necessary resources to review their operations and reimbursed workers [134]. This evidences that large firms have capacities to respond to regulatory pressures and right their wrongs on social factors to maintain a competitive advantage. This derives the seventh hypothesis that firm size plays a moderating role in the relationship between social transparency and firm valuation.
H7a:
Firm size will moderate the positive effect of social transparency on firm valuation such that when firm size increases, the positive effect is larger.
H7b:
Firm size will moderate the negative effect of social transparency on firm valuation such that when firm size increases, the negative effect is larger.
As for governance, large companies are expected to have the resources to adopt sustainability management tools to uphold strong governance standards. However, due to Wilmar’s governance issues relating to poor transparency and weak uptake of certified palm oil, the industry leader reached its lowest P/E in history [133]. This evidences that large firms are under more scrutiny for their governance standards to maintain a competitive advantage. This derives the eighth hypothesis that firm size plays a moderating role in the relationship between governance transparency and firm valuation.
H8a:
Firm size will moderate the positive effect of governance transparency on firm valuation such that when firm size increases, the positive effect is larger.
H8b:
Firm size will moderate the negative effect of governance transparency on firm valuation such that when firm size increases, the negative effect is larger.
Figure 2 summarizes the conceptual framework for the moderating role of firm size on the relationship between transparency and firm valuation in hypotheses 5 to 8.
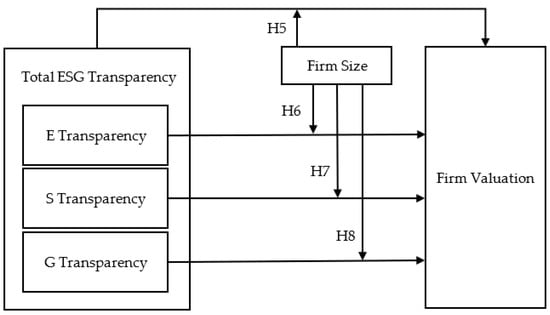
Figure 2.
Conceptual framework for the moderating role of firm size.
4. Research Methodology
This section describes the methods adopted for designing the research, including the data sources and variables used for conducting the model tests to investigate the hypotheses developed in Section 3.
4.1. Methodology
This study adopts a deductive approach to test the eight hypotheses that (i) examine the direct relationships that total ESG, environmental, social, and governance transparency have with firm valuation and (ii) understand the moderating role of firm size on the direct relationships that total ESG, environmental, social, and governance transparency have with firm valuation. The paper then evaluates the findings for the hypotheses.
The hypotheses are formulated by defining the measures used for each construct shown in Table 1. The construct of ESG transparency will be defined by the ESG disclosure scores in ZSL’s SPOTT 2021 assessment. Overall ESG transparency will be defined by the total score, while environmental, social, and governance transparency are defined by environmental (E), social (S), and governance (G) scores, respectively. The construct of firm size as moderator will be defined by revenue, or assets in the robustness test, while firm valuation is defined by P/E.

Table 1.
Mapping constructs to measures.
The investigation will be a cross-sectional study of 36 palm oil companies, which compares four categories of ESG disclosure scores—total score, and independent E, S, and G scores—to isolate netting effects from other scores. Subsequently, the study will explore if firm size (revenue or assets) plays a moderating role by strengthening the relationship between ESG scores and P/E. To test the hypotheses, a multiple regression analysis was performed using the analysis of variance (ANOVA) test via Microsoft Excel based on the ordinary least squares regression method.
4.2. Data
ESG disclosure scores were retrieved from the total, E, S, and G scores in the SPOTT assessment of 100 palm oil companies released in November 2021. SPOTT is a relevant framework because it has a niche focus on commodity producers, processors, and traders, and assesses public disclosure of their organization, policies, and practices towards ESG issues [89]. These companies are closer to the upstream supply chain with greater exposure and control over plantation activities that dominate the ESG issues highlighted earlier. SPOTT is a reliable tool for measuring ESG transparency because its index values are measured against a comprehensive indicator framework, which was formulated through in-depth consultation with SPOTT’s companies and users, and it has stabilized over the years since its inception in 2014 [93]. SPOTT is also versatile, as it provides access to both broad and detailed information of companies with a disaggregation of variables such as market capitalization, landbank, and company engagement [93]. This provides an opportunity to assess trends across different factors. Referencing the SPOTT assessment will respond to Tey and Brindal (2020) [37], who acknowledged RSPO certification was exclusive to larger companies and called for a more easily understood and accepted ESG framework. The SPOTT assessment framework addresses this by going beyond the requirements of certification to assess ESG performance, having attained a point of maturity [93], making it more inclusive towards smaller companies. The framework also responds to Godfrey and Hatch’s (2007) [106] call for more industry-specific criteria that increase the relevance of criteria for the sector.
The SPOTT 2021 palm oil assessment adopts a comprehensive framework with 182 ESG indicators across 10 categories, developed with consideration of the UN SDGs [89]. Table 2 presents the 10 categories and the corresponding number of ESG indicators for each category. These categories include themes that are tailored to the palm oil sector, such as traceability, deforestation, certification, and labor rights. Among the total of 182 indicators, an indicator can fulfil two or all three categories of E, S, and G. Thus, there are 136 E indicators, 120 S indicators, and 52 G indicators. For each indicator, points of 0 to 1 are assigned, where 0 is given for no disclosure, a partial point (e.g., 0.5 or 0.01 to 0.99) can be given for partial disclosure, and 1 point for clear disclosure (e.g., 100% traceability). The scores are then converted to percentages ranging from 0 to 100, where higher scores are associated with more transparent disclosure.
Table 2.
Categories and indicators in the SPOTT 2021 palm oil assessment.
Companies’ financial data were sourced from Thomson Reuters, a professional platform for financial data. Data were sourced based on the latest available in July 2022, to account for a lagged effect within a year of SPOTT’s score release. Fiscal year-end numbers and reported currencies for revenue and assets were also verified on companies’ annual reports and websites to ensure accuracy. As palm oil companies are listed across multiple stock exchanges globally, financial data were reflected in different reporting currencies. For standardization, numbers were converted to USD based on exchange rates in Xe.com, which is an established platform for global exchange rates. The dates of exchange rates used for conversion were based on the latest fiscal year reporting date (for assets and revenue) and share price closing date (for market capitalization), where applicable.
4.3. Sample
The sample aims to represent the global population of publicly listed palm oil companies with a score from the SPOTT assessment. The reason for scoping publicly listed companies is because their data are more easily accessible to the wider group of public investors who can make investment decisions that contribute to enabling sustainable production. Among SPOTT’s 2021 assessment of 100 companies, 45 companies were publicly listed. Due to missing financial data on Thomson Reuters (e.g., delisted, restructured), 9 companies were omitted from the study. This narrowed the final sample to 36 companies listed in Appendix A. They include dominant players in Southeast Asia such as Wilmar International, Sime Darby Plantation, IOI Corporation, Kuala Lumpur Kepong Bhd, QL Resources Bhd, Golden Agri-Resources Ltd., and FGV Holdings. Other global players such as Itochu Corporation, Archer-Daniels-Midland Co, Bunge Ltd., and AAK AB listed in Japan, New York, and Sweden are also included. Of the 36 companies, at least 31 have operations in Indonesia and Malaysia, and 29 of them (including subsidiaries) are RSPO members. This sample size is larger than the sample sizes in some of the earlier studies conducted. The sample also provides a global representation of palm oil companies, as opposed to earlier studies that mostly focused on companies in Indonesia and Malaysia only.
4.4. Variables
With the sample size of 36 companies, three independent variables are considered to align with the norms of regression analysis by having at least 10 observations per variable [135] to avoid overfitting. The first four hypotheses will have one direct and two control variables to examine the direct relationship, while the remaining four will have a direct, interactive, and control variable to examine the interactive relationship.
The direct variables of ESG disclosure scores are the total, E, S, and G scores which are used to assess the direct relationships in hypotheses 1 to 4. They are also used to assess the interactive relationships in hypotheses 5 to 8.
To test the direct relationship in hypotheses 1 to 4, two control variables for firm size are used—market capitalization and revenue. In this study, the natural logarithm is applied to both attributes to reduce skewness.
To test the interactive relationship in hypotheses 5 to 8, one interactive variable and one control variable are used. The interactive variable considers firm size as a moderator where total revenue is multiplied by the sustainability score. It assesses if firm size moderates the relationship between ESG scores and the P/E ratio. Meanwhile, the control variable retains the natural logarithm of market capitalization.
In all hypotheses, the dependent variable references the P/E ratio as a measure for firm valuation that is commonly used by investors. This is based on the share price divided by the normalized annual earnings per share. Normalized earnings exclude unusual expenses or revenue that are not typical of the companies’ main businesses.
For robustness, each test is replicated by replacing the revenue with assets as the firm size proxy in the control variable for hypotheses 1 to 4, and in the interactive variable for hypotheses 5 to 8.
Table 3 summarizes the description of each variable.
Table 3.
Variable description.
To evaluate the impact of ESG transparency on firm valuation of palm oil companies, the equation for the direct relationship is as follows:
where:
P/Ei,t = β0 + β1ESGi,t-1 + β2Control(FSi,t-1) + β3Control(MC)i,t + εi
- P/Ei,t is the valuation of company i at time t
- ESGi,t-1 is a measure of the total, E, S, or G disclosure score of the company i at time t-1
- Control(FS)i,t-1 is the control variable of firm size (revenue or assets) at time t-1
- Control(MC)i,t is the control variable of market capitalization at time t
- εi is the error term.
To evaluate the moderating role of firm size on the relationship between ESG transparency and firm valuation of palm oil companies, the equation for including the interaction effect is as follows:
where:
P/Ei,t = β0 + β1ESGi,t-1 + β2(ESGi,t-1×FSi,t-1) + β3Control(MC)i,t + εi
- P/Ei,t is the valuation of company i at time t
- ESGi,t-1 is a measure of the total, E, S, or G disclosure score of the company i at time t-1
- ESGi,t-1×FSi,t-1 is a measure of interaction between the disclosure score (total, E, S, or G) of company i at time t-1, multiplied by the firm size (revenue or assets) of the company i at time t-1
- Control(MC)i,t is the control variable of market capitalization at time t
- εi is the error term.
4.5. Model Tests
To conduct an ordinary least squares regression, eight model tests are run. For each of the four independent direct variables (total, E, S, G Score), two tests are run. One tests for the direct relationship, and the other for the interaction effect. In all tests, the same control (market capitalization) and independent variable (P/E) are used. Table 4 presents the difference in variables used across each model.
Table 4.
Model description.
5. Results and Analysis
This section examines the data through descriptive statistics, correlation analysis, and the regression results of the study, which analyzes whether the hypotheses in question can be accepted or rejected.
5.1. Descriptive Statistics
Table 5 presents the summary statistics for the 36 publicly listed palm oil companies in this study. The P/E ratio averages 10.150 with a range from 3.85 to 58.57, which indicates that firms can be significantly undervalued or overvalued relative to one another. The total scores range from 8.1 to 91.30 with an average of 61.4. This average is higher than the average of 42.8 from the original list of 100 companies which included private companies, hinting that publicly listed companies are more inclined to engage in more ESG transparency to meet additional requirements of public exchanges. The individual E, S, and G scores average 56.293, 63.066, and 56.153, respectively, suggesting that each component does not differ too much from the average total score, although the S score is the closest.
Table 5.
Descriptive statistics.
5.2. Correlation Analysis
Table 6 presents the correlation coefficients for the variables used in this paper. At first glance, the direct variables total, E, S, and G scores are negatively correlated with P/E, with E having the highest correlation. Firm size variables of revenue and assets are weakly negatively correlated with P/E, while market capitalization has a positive correlation with P/E. In their natural logarithm form, revenue, assets, and market capitalization are all positively correlated with P/E and disclosure scores. As interactive variables, when the score is multiplied by revenue or assets, the correlation is negative. Among the direct variables, E, S, and G scores are highly correlated with the total score above 0.9, suggesting that netting effects from each score are minimal. E and S have higher correlations with the total score above 0.99, while G has a lower correlation of 0.95, implying that E and S scores could have more influence over the total scores than G scores.
Table 6.
Correlation matrix.
5.3. Regression Results
Table 7 summarizes the results of the eight model tests. It reports the estimated coefficients, standard errors, and significance levels.
Table 7.
Regression results for 36 palm oil companies.
5.3.1. Direct Effect of ESG Transparency on Firm Valuation
In models 1, 2, 3, and 4, the regression results of the total, E, S, G score variable respectively are negatively significant at a 1% significance level. This indicates a negative relationship where companies with higher total, E, S and G scores reflect lower P/E ratios. H1a, H2a, H3a, H4a are rejected while H1b, H2b. H3b. H4b are accepted at a 99% confidence interval.
5.3.2. Firm Size Moderates the Effect of ESG Transparency on Firm Valuation
In models 5 and 7, the regression results of the interactive variable using firm size multiplied by the total scores and S scores respectively are negatively significant at a 1% significance level. This means that firm size strengthens the negative effect of the total score and S score on P/E. H5a and H7a are rejected while H5b and H7b, are accepted at a 99% confidence interval.
Similarly, in models 6 and 8, the regression results of the interactive variable using firm size multiplied by the E scores and G scores respectively are negatively significant at a 5% significance level. This means that firm size strengthens the negative effect of the E score and G score on P/E. H6a and H8a are rejected while H6b and H8b are accepted at a 95% confidence interval.
A robustness test was performed by replacing revenue with assets as a control variable in models 1r to 4r, and as an interactive variable in models 5r to 8r, which is summarized in Table 8. The reproduced regression results in Table 9 reiterate that overall relationships across direct and interactive variables are all negatively significant at a 5% significance level in models 1r to 8r. When revenue is used, the direct negative relationships are stronger at a 1% significance in models 1 to 4. The interaction effects are also stronger at a 1% significance when revenue is multiplied by total and social scores (models 5 and 7, respectively). In the robustness test, the adjusted R-squared parameters are smaller when assets are used for testing the interaction effect. Models 5, 6, 7, and 8 hence explain a larger proportion of the variance of P/E by the interaction effect of firm size when compared to models 5r, 6r, 7r, and 8r, respectively. Nonetheless, the robustness test provides consistent results that the direct and interactive relationships hold at a 5% significance level.
Table 8.
Model description for robustness test.
Table 9.
Regression results for robustness test of 36 palm oil companies.
The results in the first four models affirm the negative effect of total ESG, environmental, social, and governance transparency on firm valuation.
Table 10 summarizes the results of the direct relationship, which accepts the first four hypotheses that favor a negative relationship and rejects those that favor a positive relationship.
Table 10.
Result summary for the direct relationship.
Expanding on the direct relationship, the results confirm that firm size acts as a moderator in strengthening the negative effect that total ESG, environmental, social, and governance transparency have on firm valuation.
Table 11 summarizes the moderating role of firm size, which accepts the last four hypotheses in favor of strengthening the negative effect.
Table 11.
Result summary for the moderating role of firm size.
6. Discussion
This section evaluates the results to verify how they align with findings from the literature review and conceptual development. It then provides recommendations for various stakeholder groups and describes the limitations of the study, which can have implications for future research.
6.1. Interpretation
6.1.1. Direct Relationship
The results of the first four models reflect that total, environmental, social, and governance scores are all negatively significantly correlated with P/E in the palm oil sector. These findings differ from Almeyda and Darmansyah (2019), Abdullah, Hamzah, Ali, Tseng, and Brander, (2020), Orlitzky, Schmidt, and Rynes (2003), and Velte (2017) [26,28,29,105], who found that individual components of E, S, or G were more determinant in influencing financial indicators. The results also counter Nofsingera, Sulaeman, and Varma (2019) [94] regarding the possibility of netting effects and Lam, Zhang, and Chien’s (2018) [27] mix of positive and negative relationships. Instead, the netting effects of individual E, S, and G scores are considered minimal and less heterogeneous. The results show that all three ESG factors in the palm oil sector are strongly linked with one another and must be considered holistically. This aligns with the correlation matrix in Table 6, which showed a strong positive relationship between total, environmental, social, and governance scores. The 182 indicators in Table 2 also reflected that some indicators overlap with one another. For example, attaining 100% traceability not only enhances transparency and ensures good governance, but it mitigates environmental issues associated with deforestation and social issues such as land use conflicts. Initiatives such as companies’ NDPE policies and RSPO certifications collectively aim to address environmental issues such as deforestation and peatland management, social issues such as exploitation, human conflicts, and smallholder inclusion, and governance issues such as weak transparency and traceability.
The direct negative relationship highlights that companies with high ESG transparency are discounted relative to poor performers. This adds to the existing minority of the literature that found a negative relationship between sustainability and financial indicators. The negative relationship offers a few insightful perspectives on the palm oil sector. Firstly, an optimistic interpretation would infer that companies with high ESG transparency have low P/E, which supports Basu’s (1977) [111] view that they potentially have a higher return for their price relative to earnings, making them preferred by investors. High ESG transparency may thus be positively perceived for high returns. However, the findings are also similar to Svensson’s (2020) [31] study on Northern European firms, which found a weak negative correlation. In this study, the highest adjusted R-squared is 0.404 in model 1, which tests the total score against P/E, implying that investors concerned with ESG in the palm oil sector are not as focused on high returns. Secondly, the results could be explained by Foo, Glover, Chang, and Pratama (2021) [131], in that companies are trading below peak P/E due to rising scrutiny over ESG risks, which resulted in aversion, including those with higher ESG scores. Based on Shen (2000) [115], low P/E could be associated with more growth prospects. This would align with the growing demands for ESG transparency, and anticipated growth in global demand for palm oil, justifying the argument by Foo, Glover, Chang, and Pratama (2021) [129] to encourage mainstreaming sustainable palm oil. Thirdly, the results contradict Jones, et al. (2022) [71] and Temple-West (2020) [116], where high ESG performers were trading at a premium to align with growing regulations or reflect an ESG bubble. In the palm oil sector, high ESG performers are not competitively priced at a premium relative to poorer ESG performers. The ESG premium is not prevalent among palm oil companies. Overall, it appears that the sector’s ESG risks have overridden the prospect of well-performing companies with high ESG transparency, which offered a potentially higher return for their price. Good performers are penalized by overall perceptions of the sector. It also suggests that the investing strategy of divestment may dominate more than ESG integration in the palm oil sector. Investors appear to respond weakly to high ESG performers, as highlighted similarly in Krüger’s (2015) [103] research, which shows that the market responds weakly to positive ESG news. It also revalidates Luo, Meier, and Oberholzer-Gee’s (2011) [104] finding that high-performing firms were exposed to more liability as they received more attention for negative events. Investors’ aversion appears guided by minimizing risks through divesting from the sector rather than investing in companies with high ESG transparency through ESG integration. Engagement efforts between investors, financiers, regulators, and companies may still be lacking. Therefore, in summary, ESG transparency does not strengthen valuation in the palm oil sector. Companies with higher ESG transparency are discounted relative to poorer performers. The sectors’ ESG risks are likely to have eroded investor confidence and raised perceived financial risks, causing investors to be averse towards the whole sector, especially good performers. High ESG transparency was thus not effective in encouraging ESG integration as an innovative strategy for improving valuation. Good performers appear to be penalized more for having higher ESG transparency, but they provide the opportunity for a higher return for having a low price relative to earnings. The aversion towards good performers suggests that palm oil companies need to step up their efforts to minimize ESG risks to restore stakeholder confidence in the sector in order to encourage uptake of ESG integration as a sustainable investing strategy.
6.1.2. Moderating Role of Firm Size
The results of the last four hypotheses align with previous studies that found that firm size plays a moderating role in strengthening the relationship between ESG transparency and firm valuation. The larger the revenue or assets, the stronger the negative effect that total, environmental, social, and governance scores have on P/E. This revalidates that all three components of ESG are interlinked and have an influence on P/E. The results agree with the notion that larger firms dominate in visibility and hence receive greater media attention on ESG risks [33,120]. Larger firms are also subject to greater reputational, operational, and hence financial risks due to their impacts. P/E ratios of larger firms are likely to reflect more modest expectations of value creation that consider ESG risks. The growth potential of larger companies was eroded as investors became more averse in anticipation of higher financial risks linked to ESG issues. Sime Darby and FGV were among the larger companies that had SPOTT scores of 83.4 and 74.2, respectively, which were above the average total score. These companies responded to heavy criticisms and sanctions, which revalidates that large firms are receptive and have the resources to right their wrongs [11,133]. Such responses are necessary as they are under greater regulatory pressure such as mandates from listed exchanges to set exemplary standards, and they also have greater stakeholder impact. Meanwhile, smaller companies are likely to be subject to less visibility and less pressure and are equipped with fewer resources to communicate stakeholder transparency about adopting ESG practices.
However, looking at firm size as a control, the results from all eight model tests reflect a conflict that P/E has a significantly positive correlation with market capitalization as the control, indicating that smaller firms have smaller P/E. When revenue and assets were used as controls for firm size in the first four tests, the relationship was significantly negative. This highlights that while market capitalization, assets, and revenue are three popular measures of firm size, they are theoretically different [136]. Among the three, only market capitalization is forward-looking and reflects a firm’s growth opportunities. It is the only measure of firm size that is calculated by using the share price at a point in time, which is also used to calculate the numerator for P/E. Thus, market capitalization is mechanically correlated with P/E. Meanwhile, revenue measures the money flowing from its sales while assets measure a firm’s total resources. Both are not forward-looking [136]. Theoretically, revenue could be negatively correlated with P/E as it is positively correlated with the denominator, earnings per share. Therefore, it would be more appropriate to state that only accounting-based measures of firm size (revenue and assets) have a moderating role in strengthening the negative relationship between ESG disclosure scores and firm valuation.
Overall, the results show that ESG transparency significantly influences firm valuation for companies in the palm oil sector, and validate the organizational theories of legitimacy, agency, stakeholder, and signaling theories. Companies, which act on behalf of shareholders, need to step up their communication efforts to improve perceptions of the sector by addressing the collective ESG concerns raised by multiple stakeholder groups, to signal their commitment to ESG and legitimize their social license to continue operating. By doing so, they can minimize reputational, legal, and operational risks, which can improve their earnings and anticipated growth, and hence encourage investors to adopt ESG integration as an innovative sustainable investing strategy to strengthen their overall financial valuation.
6.2. Recommendations
The research findings provide insight for various stakeholders across the palm oil value chain who have important roles in ensuring companies uphold good standards of ESG practices to mainstream sustainable palm oil. All stakeholders should be kept abreast of the related environmental, social, and governance issues in the sector, and how companies are responding, to make constructive decisions.
The results of the study provide direction for palm oil companies to consider all aspects of ESG issues seriously as these concerns can impact firm valuation. Companies can better reflect ESG risks within their operations to pinpoint improvement areas by developing sustainable strategies to legitimize their operations. They need to be proactively aware of the available supporting initiatives to develop practices that accelerate the transition towards sustainable production while meeting future global demand. They should invest in technological capabilities to boost transparency by reporting comprehensive ESG data on accessible platforms. Moreover, they must concurrently provide assurance against greenwashing risks and ensure these efforts are communicated to stakeholders on relevant channels to effectively minimize financial risks associated with compliance, reputational, and operational risks. These efforts will also improve their differentiation and branding across competitors, which in turn gains stakeholder trust and enhances accessibility to financial capital. They should also monitor and report their efforts periodically, to track progress and signal accountability to their commitments. With regards to the moderating role of firm size in managing ESG transparency, smaller companies with lesser resources and competencies are encouraged to seek external assistance from governments, financial institutions, and NGOs through voluntary initiatives to improve their practices and transparency efforts. Companies can also learn from each other’s efforts to strengthen practices and consequently improve overall perceptions of the sector.
The results also prompt financial institutions and investors to increase engagement efforts to discourage divesting to manage financial risks. ESG integration should be embraced as an innovative investing strategy by paying more attention to how companies respond to ESG risks, as companies with high ESG transparency present opportunities for higher financial returns. Furthermore, the results support investment analysis that shows each ESG component is intertwined with the others and must be considered holistically when making investment decisions. As observed by the moderating role of firm size, financial institutions and investors need to develop a more inclusive approach that enables financing for smaller companies that lack capital for certification but perform sustainable practices, to encourage further ESG integration in the palm oil sector. These include upholding higher standards of transparency and going beyond certification criteria such as referencing data reporting and platforms including the SPOTT framework. This incentivizes companies to minimize room for greenwashing. It also provides flexibility in investors’ due diligence towards the palm oil sector to expand financial opportunities that support more sustainable firms. It will also complement policymaking for financial institutions and reduce the gaps in weak policies that support less sustainable companies. Investors will hence be in a better position to assess the ESG performance of firms.
Similarly, regulators from producing countries, importing countries, and public exchanges that list palm oil companies can strengthen legislation and policy implementation by embedding environmental and social capital more into policy considerations. In addition to having policies that are ban-focused (e.g., moratoria) and dependent on penalties, incentives can be implemented to encourage companies to innovate and build a competitive advantage over their peers. This can improve legitimacy and encourage positive investor sentiments about sustainable growth in the sector. Further assistance should also be given to smaller firms that lack the capital and resources so that their standards do not lag behind those of larger firms. While some public exchanges globally have enforced disclosure requirements for companies, they should enforce more lenient requirements for smaller companies to engage with ESG transparency.
Given the interdisciplinary nature of ESG, governments and companies should engage with specialists across multiple disciplines for improving practices in the sector. For example, scientists and engineers should be involved, as they have the capabilities to better attribute the companies’ impact on the environment and develop innovative solutions for improving yields and land use efficiency while addressing environmental risks. Consultants and planners can also be engaged to improve environmental and social impact assessments of land use change. Environmental assessments can help to address the avoidance of deforestation and peatland degradation, which would minimize biodiversity loss, emissions, and the risks of haze and floods. Social assessments can help establish more complete maps of indigenous and local community groups and develop better methods for grievance mechanisms such as fairer compensation approaches, which help to address land use change conflicts. With a more inclusive assessment, environmental and social impacts on the livelihood of local community groups can be improved. Companies would also be able to minimize their financial risks associated with environmental and social issues.
With growing awareness of the sector’s ESG impact on financial valuation, NGOs can divert efforts to develop initiatives to identify remaining gaps in practices and unaddressed ESG risks, bolstering companies’ efforts. Certification bodies such as the RSPO should continue their progressive efforts to identify more ways of assessing smaller companies, which make certification accessible to companies with good practices. ZSL, which developed the SPOTT framework, should continue to stay informed about updates in the sector and reassess if new types of frameworks would be applicable for tracking progress. They can also work towards integrating their framework into the various reporting standards, to encourage harmonization and homogeneity of ESG transparency criteria. WWF could explore more avenues of engaging financial institutions and investors to encourage ESG integration as an innovative sustainable investing strategy.
The results also educate palm oil consumers on their constructive influence over the sector’s ESG impact, such as by encouraging complete traceability, or collaborating with data and reporting platforms such as SPOTT to strengthen their credibility. They can create a collective voice that pressures companies to be transparent about their adoption of sustainable practices. Furthermore, they can reassess their consumption habits and adopt other means of due diligence methods, such as referencing frameworks including SPOTT when purchasing products containing palm oil and paying more attention to how companies respond to ESG risks.
6.3. Implications for Future Research
As the demand for palm oil is expected to grow with the world population, there is an expected increase in research interest in managing sustainability for the palm oil sector. The study provides a baseline that unlocks many potential areas of research. It is a cross-sectional study that acknowledges the limitation that the data were captured in a snapshot period for one financial indicator. While findings are consistent with P/E ratios assessed in 2021 by Foo, Glover, Chang, and Pratama (2021) [131], the P/E used is based on past earnings to identify sentiment on future value creation, which could change with time due to uncontrollable market events such as international crises, inflation, or government policies [29]. For example, crisis events could create negative sentiment and decrease the share price of companies, which may potentially strengthen the negative relationship between ESG transparency and P/E. Meanwhile, events such as government subsidies for RSPO certification could potentially improve sentiment and raise the share price of companies, which may negate the negative relationship. Future research could include analyzing longer time frames to assess how the influence of ESG transparency on firm valuation in the sector has evolved with time. Other financial indicators such as return on assets (ROA) or return on equity (ROE) could also be considered to strengthen the interpretation of the results. This study investigates palm oil companies in the SPOTT assessment, which are producers, processors, and traders in the commodity sector that are most exposed to ESG risks related to palm oil production and have the most control in changing their practices. Future research could also consider companies down the value chain that have influential power to encourage upstream companies to adopt sustainable practices, such as those in the WWF Palm Oil Buyer’s Scorecard [90] for a more complete picture of the sector’s supply chain.
Further downstream, public consumers can advocate and have influence over companies’ reputations. Future research could consider integrating a variable for consumer behavior into the main study to enrich the paper’s findings.
As the study uses publicly listed companies that are under significant pressure and are differentiated to be more sustainable, little insight is provided about companies that are not publicly listed, including private companies and smallholders who make a substantial contribution to production. This warrants future research to investigate the effects of ESG disclosure scores on other financial indicators if the data of private companies become more accessible and transparent to the public, to achieve a more holistic and representative view of the sector.
This study also notes that ESG transparency does not equate to implementation on the ground. Baumann-Pauly, Wickert, Spence, and Scherer (2013) [137] find that larger multinational companies are frequently better at communicating sustainability without substantial implementation in organizational practices, as opposed to smaller SMEs who poorly communicate the strong implementation of CSR practices. This is due to larger companies receiving more scrutiny for CSR, and requiring larger implementation costs than smaller companies [137]. Consequently, larger companies place more priority on communicating CSR practices as opposed to implementing them [137]. Thus, more in-depth due diligence could be considered by investigating effective implementation in addition to ESG transparency.
7. Conclusions
This paper delves into the problem of supporting ESG integration as an innovative sustainable investing strategy to provide financing for the palm oil sector, which is riddled with controversies. By recognizing palm oil’s contributions to global economies, the paper introduces the material ESG issues and consequent financial risks associated with the sector, which have been heavily scrutinized by various stakeholder groups. While efforts are growing for companies to improve their practices, a key step to ensuring ESG concerns are met is engaging in stakeholder transparency through the disclosure of ESG practices, which are supported by regulations, public exchanges, certifications, and data and reporting platforms. In so doing, the paper acts within the framework of organizational theories such as legitimacy theory, stakeholder theory, agency theory, and signaling theory to justify the connection between ESG transparency and financial indicators. With limited studies found in the palm oil sector, this paper draws inspiration from studies conducted in different countries and sectors that found direct relationships between ESG transparency and financial indicators, where some studies used firm valuation as a dependent variable, and included firm size as a moderator that strengthens the relationship. The paper then applies the findings in the context of research in the palm oil sector and hypothesizes that ESG efforts in the sector could be discounted in terms of firm valuation (P/E), due to increased transparency of ESG risks outweighing the benefits. This builds the hypotheses to examine the direct relationship between ESG transparency and firm valuation, and the subsequent hypotheses that firm size has a moderating role in strengthening the relationship. The study is conducted on publicly listed companies in the global palm oil sector by referencing ESG disclosure scores from the SPOTT 2021 palm oil assessment for ESG transparency, revenue (and assets for robustness) for firm size, and P/E ratio for firm valuation. As the current literature review is mixed about the direction of the relationship between ESG transparency and financial indicators, the findings add to the existing minority of the literature that finds a negative relationship. Companies with higher ESG transparency in the palm oil sector are undervalued and provide the potential for a higher return when compared to those with lower ESG transparency. In addition, the results find that accounting-based measures of firm size act as a moderator, such that when firm size increases, the negative effect is strengthened.
The contributions to existing literature are in five key domains.
Firstly, this study is a unique assessment of the emerging phenomenon of palm oil companies’ response to heightened ESG scrutiny. It also answers studies calling for the use of industry-focused ESG frameworks such as SPOTT, which is customized for ESG concerns in the sector. The results serve as a baseline for researchers to understand how the direct effect of ESG transparency on firm valuation and the moderating role of firm size could evolve as the sector progresses in its efforts towards sustainable production.
Secondly, this study develops a better understanding of the implications of ESG transparency on firm valuation indicators such as P/E, which is commonly used by investors and financial institutions. The results provide awareness about sentiment towards the adoption of ESG transparency among palm oil companies and encourage companies to explore areas to improve perceptions of the sector.
Thirdly, for policy, regulators in the sector are still looking to improve their approaches. This study marries a holistic set of non-financial indicators with firm valuation in the palm oil sector, identifying opportunities for policy improvement and providing better assurances of validity for policymakers as they strengthen their regulations in the palm oil sector, which can be extended to other agricultural commodities.
Fourthly, this study helps NGOs to better distinguish unaddressed gaps in ESG practices to create new or enhance existing voluntary initiatives to accelerate the transition to sustainable palm oil. These include expanding their engagement efforts with different stakeholder groups, improving the defining criteria for sustainable practices, and making them consistent across reporting standards.
Lastly, consumers can gain more awareness of their collective impact in influencing sustainable palm oil. They can attain more clarity about the ESG concerns and efforts to improve sustainability in the sector so that they can exercise better judgement when making decisions about consuming products with palm oil.
The study highlights avenues for future research by acknowledging its limitations. Although the study finds a negative relationship between ESG transparency and firm valuation, these results represent a snapshot in time and may not represent the sector’s status indefinitely. Future studies that include more cross-sections in time and more financial indicators may be needed for a better understanding of the sector. Moreover, the palm oil companies in the scope of this study can also be extended to include private companies that are not publicly listed, and those down the supply chain such as buyers, for a more complete representation of companies in the sector.
Author Contributions
L.L. and T.C. conceptualised the study, designed the assessment framework and methodology; T.C. managed the data collection initiatives and writing; T.C. conducted the empirical analysis and documented the findings. All authors have read and agreed to the published version of the manuscript.
Funding
This research received no external funding.
Institutional Review Board Statement
Not applicable.
Informed Consent Statement
Not applicable.
Data Availability Statement
Data are contained within the article.
Conflicts of Interest
The authors declare no conflict of interest.
Appendix A. List of Sample Companies
AAK AB–Malmö, Sweden
Anglo-Eastern Plantations plc–London, United Kingdom
Archer Daniels Midland Company (ADM)–Chicago, United States
Astra Agro Lestari Tbk PT–Jakarta, Indonesia
Austindo Nusantara Jaya Tbk PT–Jakarta, Indonesia
BLD Plantation Bhd (Bintulu Lumber Development (BLD) Plantation)–Kuching, Malaysia
Boustead Plantations Bhd–Kuala Lumpur, Malaysia
Bumitama Agri Ltd.–Jakarta, Indonesia
Bunge Ltd.–Chesterfield, United States
Dharma Satya Nusantara Tbk–Jakarta, Indonesia
FGV Holdings Bhd–Kuala Lumpur, Malaysia
First Resources Ltd.–Singapore, Singapore
Genting Plantations Bhd–Kuala Lumpur, Malaysia
Gokul Agro Resources Ltd.–Ahmedabad, India
Golden Agri Resources Ltd.–Singapore, Singapore
Hap Seng Plantations Holdings Bhd–Kuala Lumpur, Malaysia
Indofood Agri Resources Ltd.–Singapore, Singapore
IOI Corporation Bhd–Putrajaya, Malaysia
ITOCHU Corporation–Tokyo, Japan
Kencana Agri Ltd.–Singapore, Singapore
Kuala Lumpur Kepong Bhd–Ipoh, Malaysia
M.P. Evans Group plc–Royal Tunbridge Wells, United Kingdom
Mewah International Inc–Singapore, Singapore
Nisshin OilliO–Tokyo, Japan
POSCO International–Incheon, Korea
QL Resources Bhd–Shah Alam, Malaysia
R.E.A. Holdings plc–London, United Kingdom
Sampoerna Agro Tbk PT –Palembang, Indonesia
Sarawak Oil Palms Bhd–Kuching, Malaysia
Sawit Sumbermas Sarana Tbk PT–Central Kalimantan, Indonesia
Sime Darby Plantation Sdn Bhd–Pasir Gudang, Malaysia
SIPEF–Antwerp, Belgium
TSH Resources Bhd–Kuala Lumpur, Malaysia
Tunas Baru Lampung Tbk PT–Jakarta, Indonesia
United Plantations Bhd–Teluk Intan, Malaysia
Wilmar International Ltd.–Singapore, Singapore
Note: City/town and country depicted is the location of the company’s headquarters.
References
- Hong, W.O. How the Palm Oil Industry is Transitioning to Net-Zero. World Economic Forum. Available online: https://www.weforum.org/agenda/2021/08/how-palm-oil-industry-is-transitioning-to-net-zero/ (accessed on 1 October 2023).
- Segi Enam Advisors Pte Ltd. Sustainable Palm Oil Uptake in Asia: Where Do We Go from Here? WWF: Gland, Switzerland, 2021; Available online: https://wwfint.awsassets.panda.org/downloads/sustainable_palm_oil_uptake_in_asia_sept_2021.pdf (accessed on 1 October 2023).
- IUCN. Palm Oil and Biodiversity; IUCN: Gland, Switzerland, 2018; Available online: https://www.iucn.org/sites/default/files/2022-07/iucn_issues_brief_palm_oil_and_biodiversity.pdf (accessed on 1 October 2023).
- EPOA; IDH; RSPO. Sustainable Palm Oil: Europe’s Business; IDH: Utrecht, The Netherlands, 2022; Available online: https://www.idhsustainabletrade.com/uploaded/2022/09/Palm_Oil_Report_21_09_22_FINAL.pdf (accessed on 1 October 2023).
- Pandjaitan, L.B. Sustainable Palm Oil Production Can Lift Communities Out of Poverty. Friends of Europe. Available online: https://www.friendsofeurope.org/insights/sustainable-palm-oil-production-can-lift-communities-out-of-poverty/ (accessed on 1 October 2023).
- Meijaard, E.; Garcia-Ulloa, J.; Sheil, D.; Carlson, K.M.; Wich, S.A.; Juffe-Bignoli, D.; Brooks, T.M. Oil Palm and Biodiversity: A Situation Analysis by the IUCN Oil Palm Task Force; IUCN, International Union for Conservation of Nature: Gland, Switzerland, 2018. [Google Scholar] [CrossRef]
- Russell, M. Palm Oil: Economic and Environmental Impacts. European Parliamentary Research Service. Available online: https://epthinktank.eu/2018/02/19/palm-oil-economic-and-environmental-impacts/ (accessed on 1 October 2023).
- Shukla, P.R.; Skea, J.; Calvo Buendia, E.; Masson-Delmotte, V.; Pörtner, H.-O.; Roberts, D.C.; Zhai, P.; Slade, R.; Connors, S.; van Diemen, R.; et al. Climate Change and Land: An IPCC Special Report on Climate Change, Desertification, Land Degradation, Sustainable Land Management, Food Security, and Greenhouse Gas Fluxes in Terrestrial Ecosystems; Intergovernmental Panel on Climate Change (IPCC): Geneva, Switzerland, 2019; Available online: https://www.ipcc.ch/site/assets/uploads/2019/11/SRCCL-Full-Report-Compiled-191128.pdf (accessed on 1 October 2023).
- SASPO. Guide to Sustainable Palm Oil for Singapore Companies: Economic Opportunities and Sourcing Guidelines; WWF: Gland, Switzerland, 2018; Available online: https://wwfint.awsassets.panda.org/downloads/saspo_business_guide_to_sustainable_palm_oil.pdf (accessed on 1 October 2023).
- Meijaard, E.; Brooks, T.M.; Carlson, K.M.; Slade, E.M.; Garcia-Ulloa, J.; Gaveau, D.L.A.; Lee, J.S.H.; Santika, T.; Juffe-Bignoli, D.; Struebig, M.J.; et al. The Environmental Impacts of Palm Oil in Context. Nat. Plants 2020, 6, 1418–1426. [Google Scholar] [CrossRef]
- Lim, J. FGV Says No Evidence of Forced or Child Labour Was Discovered in Independent Assessment. The Edge Malaysia. Available online: https://theedgemalaysia.com/article/fgv-says-no-evidence-forced-or-child-labour-was-discovered-independent-assessment (accessed on 1 October 2023).
- CRR. The Chain: How Limited Supply, Alleged Corruption, and the Biodiesel Market Led to Indonesia’s Cooking Oil Crisis—Chain Reaction Research. Available online: https://chainreactionresearch.com/the-chain-how-limited-supply-alleged-corruption-and-the-biodiesel-market-led-to-indonesias-cooking-oil-crisis/ (accessed on 1 October 2023).
- CRR. The Chain: Biofuels from Big Oil Lack Sourcing Transparency, Form a Major Source of Leakage—Chain Reaction Research. Available online: https://chainreactionresearch.com/the-chain-biofuels-from-big-oil-lack-sourcing-transparency-form-a-major-source-of-leakage/ (accessed on 1 October 2023).
- Trase. Corporate Ownership and Dominance of Indonesia’s Palm Oil Supply Chains. 2022. Available online: http://resources.trase.earth/documents/infobriefs/infobrief09EN.pdf (accessed on 1 October 2023).
- The United Nations. World Population Prospects 2022: Summary of Results; The United Nations: New York, NY, USA, 2022. Available online: https://www.un.org/development/desa/pd/sites/www.un.org.development.desa.pd/files/wpp2022_summary_of_results.pdf (accessed on 1 October 2023).
- Afriyanti, D.; Kroeze, C.; Saad, A. Indonesia Palm Oil Production without Deforestation and Peat Conversion by 2050. Sci. Total Environ. 2016, 557–558, 562–570. [Google Scholar] [CrossRef] [PubMed]
- UN Global Compact. Who Cares Wins; United Nations Environment Programme Finance Initiative; United Nations: New York, NY, USA, 2004. Available online: https://www.unepfi.org/fileadmin/events/2004/stocks/who_cares_wins_global_compact_2004.pdf (accessed on 1 October 2023).
- CRR. ESG Lessons from Palm Oil for Soy Supply Chain Investors—Chain Reaction Research. Available online: https://chainreactionresearch.com/report/esg-lessons-from-palm-oil-for-soy-supply-chain-investors/ (accessed on 1 October 2023).
- UNPRI. Practical Guide to ESG Integration for Equity Investing; UNPRI: London, UK, 2016; Available online: https://www.icgn.org/sites/default/files/2021-08/PRI_apracticalguidetoesgintegrationforequityinvesting.pdf.Test (accessed on 1 October 2023).
- GSIA. Global Sustainable Investment Review 2020; GSIA: Sydney, Australia, 2021; Available online: http://www.gsi-alliance.org/wp-content/uploads/2021/08/GSIR-20201.pdf (accessed on 1 October 2023).
- WWF. WWF Statement on the Role of Financial Institutions in Palm Oil Sector Sustainability; WWF: Gland, Switzerland, 2019; Available online: https://wwfint.awsassets.panda.org/downloads/wwf_statement_on_the_role_of_financial_institutions_in_palm_oil_sector_sustainability.pdf.Test (accessed on 1 October 2023).
- Pretorius, L.; Barron, T. Investors Turning Up the Heat on Asia’s Palm Oil Buyers. PRI. Available online: https://www.unpri.org/pri-blog/investors-turning-up-the-heat-on-asias-palm-oil-buyers/5595.article (accessed on 1 October 2023).
- Jong, H. Sustainability Pledges Help Indonesia Produce Palm Oil with Less Deforestation. Mongabay Environmental News. Available online: https://news.mongabay.com/2022/10/sustainability-pledges-help-indonesia-produce-palm-oil-with-less-deforestation/ (accessed on 1 October 2023).
- Friede, G.; Busch, T.; Bassen, A. ESG and Financial Performance: Aggregated Evidence from More than 2000 Empirical Studies. J. Sustain. Financ. Invest. 2015, 5, 210–233. [Google Scholar] [CrossRef]
- KPMG. The KPMG Survey of Corporate Responsibility Reporting; KPMG: Amstelveen, The Netherlands, 2017; Available online: https://assets.kpmg/content/dam/kpmg/be/pdf/2017/kpmg-survey-of-corporate-responsibility-reporting-2017.pdf (accessed on 1 October 2023).
- Orlitzky, M.; Schmidt, F.L.; Rynes, S.L. Corporate Social and Financial Performance: A Meta-Analysis. Organ. Stud. 2003, 24, 403–441. [Google Scholar] [CrossRef]
- Lam, S.-S.; Zhang, W.; Chien, C.Y.K. Can Corporate Social Responsibility Fill Institutional Voids? In Firm Value—Theory and Empirical Evidence; Hoffmann, P.S., Ed.; InTech: Rijeka, Croatia, 2018. [Google Scholar] [CrossRef]
- Velte, P. Does ESG Performance Have an Impact on Financial Performance? Evidence from Germany. J. Glob. Responsib. 2017, 8, 169–178. [Google Scholar] [CrossRef]
- Almeyda, R.; Darmansya, A. The Influence of Environmental, Social, and Governance (ESG) Disclosure on Firm Financial Performance. IPTEK J. Proc. Ser. 2019, 5, 278–290. [Google Scholar] [CrossRef]
- Jitmaneeroj, B. A Latent Variable Analysis of Corporate Social Responsibility and Firm Value. Manag. Financ. 2018, 44, 478–494. [Google Scholar] [CrossRef]
- Svensson, E. ESG and Expected Returns: A Study Using Alternative Measures on European Firms to Review the Relationship. Master’s Thesis, Örebro University School of Business, Örebro, Sweden, 2020. [Google Scholar]
- Sánchez-Infante Hernández, J.P.; Yañez-Araque, B.; Moreno-García, J. Moderating Effect of Firm Size on the Influence of Corporate Social Responsibility in the Economic Performance of Micro-, Small- and Medium-Sized Enterprises. Technol. Forecast. Soc. Chang. 2020, 151, 119774. [Google Scholar] [CrossRef]
- Krueger, P.; Sautner, Z.; Tang, D.Y.; Zhong, R. The Effects of Mandatory ESG Disclosure Around the World. European Corporate Governance Institute – Finance Working Paper No. 754/2021. Swiss Finance Institute Research Paper No. 21-44. Available online: https://papers.ssrn.com/sol3/papers.cfm?abstract_id=3832745 (accessed on 1 October 2023).
- Erian, N. ESG Issues in the Palm Oil Investments: An Event Study on the Listed Palm Oil Companies in Singapore, Indonesia, and Malaysia. Master’s Thesis, University of Twente, Enschede, The Netherlands, 2016. Available online: https://essay.utwente.nl/69102/1/Erian_MA_BMS.pdf (accessed on 1 October 2023).
- Morgans, C.L.; Meijaard, E.; Santika, T.; Law, E.; Budiharta, S.; Ancrenaz, M.; Wilson, K.A. Evaluating the Effectiveness of Palm Oil Certification in Delivering Multiple Sustainability Objectives. Environ. Res. Lett. 2018, 13, 064032. [Google Scholar] [CrossRef]
- Climate Advisers. Companies Committed to Sustainable Palm Oil Production Have Substantively Stronger Equity Returns—Climate Advisers. Climate Advisers. Available online: https://www.climateadvisers.org/newsfeed/companies-committed-to-sustainable-palm-oil-production-have-substantively-stronger-equity-returns/ (accessed on 1 October 2023).
- Tey, Y.S.; Brindal, M. Sustainability Stewardship: Does Roundtable on Sustainable Palm Oil Certification Create Shareholder Value? Corp. Soc. Responsib. Environ. 2021, 28, 786–795. [Google Scholar] [CrossRef]
- Kurucz, E.C.; Colbert, B.A.; Wheeler, D. The Business Case for Corporate Social Responsibility. In The Oxford Handbook of Corporate Social Responsibility; Crane, A., Matten, D., McWilliams, A., Moon, J., Siegel, D.S., Eds.; Oxford University Press: Oxford, UK, 2009; pp. 83–112. [Google Scholar] [CrossRef]
- Jensen, A.L. Stock Market Reactions to Environmental Social and Governance-Related Events: An Event Study of H&M Group. Master’s Thesis, Copenhagen Business School, Frederiksberg, Denmark, 2020. Available online: https://research.cbs.dk/en/studentProjects/stock-market-reactions-to-environmental-social-and-governance-rel (accessed on 1 October 2023).
- Howard-Grenville, J. ESG Impact Is Hard to Measure—But It’s Not Impossible. Harvard Business Review, 22 January 2021. Available online: https://hbr.org/2021/01/esg-impact-is-hard-to-measure-but-its-not-impossible (accessed on 1 October 2023).
- Godfrey, P.C. The Relationship Between Corporate Philanthropy and Shareholder Wealth: A Risk Management Perspective. Acad. Manag. Rev. 2005, 30, 777–798. [Google Scholar] [CrossRef]
- Godfrey, P.C.; Merrill, C.B.; Hansen, J.M. The Relationship between Corporate Social Responsibility and Shareholder Value: An Empirical Test of the Risk Management Hypothesis. Strateg. Manag. J. 2009, 30, 425–445. [Google Scholar] [CrossRef]
- Clark, G.L.; Feiner, A.; Viehs, M. From the Stockholder to the Stakeholder: How Sustainability Can Drive Financial Outperformance. SSRN J. 2014, 66. [Google Scholar] [CrossRef]
- Deegan, C. Introduction: The Legitimising Effect of Socialand Environmental Disclosures—A Theoretical Foundation. Account. Audit. Account. J. 2002, 15, 282–311. [Google Scholar] [CrossRef]
- Freeman, R.E. Strategic Management: A Stakeholder Approach; Pitman: Boston, MA, USA, 1984. [Google Scholar]
- Buchholz, R.A.; Rosenthal, S.B. Toward a Contemporary Conceptual Framework for Stakeholder Theory. J. Bus. Ethics 2005, 58, 137–148. [Google Scholar] [CrossRef]
- Laplume, A.O.; Sonpar, K.; Litz, R.A. Stakeholder Theory: Reviewing a Theory That Moves Us. J. Manag. 2008, 34, 1152–1189. [Google Scholar] [CrossRef]
- Diez-Cañamero, B.; Bishara, T.; Otegi-Olaso, J.R.; Minguez, R.; Fernández, J.M. Measurement of Corporate Social Responsibility: A Review of Corporate Sustainability Indexes, Rankings and Ratings. Sustainability 2020, 12, 2153. [Google Scholar] [CrossRef]
- Abdi, Y.; Li, X.; Càmara-Turull, X. Exploring the Impact of Sustainability (ESG) Disclosure on Firm Value and Financial Performance (FP) in Airline Industry: The Moderating Role of Size and Age. Environ. Dev. Sustain. 2022, 24, 5052–5079. [Google Scholar] [CrossRef]
- Fama, E.F.; Jensen, M.C. Separation of Ownership and Control. J. Law Econ. 1983, 26, 301–325. [Google Scholar] [CrossRef]
- Oh, W.Y.; Chang, Y.K.; Martynov, A. The Effect of Ownership Structure on Corporate Social Responsibility: Empirical Evidence from Korea. J. Bus. Ethics 2011, 104, 283–297. [Google Scholar] [CrossRef]
- De Villiers, C.; Naiker, V.; Van Staden, C.J. The Effect of Board Characteristics on Firm Environmental Performance. J. Manag. 2011, 37, 1636–1663. [Google Scholar] [CrossRef]
- Carnini Pulino, S.; Ciaburri, M.; Magnanelli, B.S.; Nasta, L. Does ESG Disclosure Influence Firm Performance? Sustainability 2022, 14, 7595. [Google Scholar] [CrossRef]
- Morris, R.D. Signalling, Agency Theory and Accounting Policy Choice. Account. Bus. Res. 1987, 18, 47–56. [Google Scholar] [CrossRef]
- Cormier, D.; Magnan, M.; Van Velthoven, B. Environmental Disclosure Quality in Large German Companies: Economic Incentives, Public Pressures or Institutional Conditions? Eur. Account. Rev. 2005, 14, 3–39. [Google Scholar] [CrossRef]
- Tagesson, T.; Blank, V.; Broberg, P.; Collin, S.-O. What Explains the Extent and Content of Social and Environmental Disclosures on Corporate Websites: A Study of Social and Environmental Reporting in Swedish Listed Corporations. Corp. Soc. Responsib. Environ. Manag. 2009, 16, 352–364. [Google Scholar] [CrossRef]
- Spence, M. Job Market Signaling. Q. J. Econ. 1973, 87, 355–374. [Google Scholar] [CrossRef]
- Connelly, B.L.; Certo, S.T.; Ireland, R.D.; Reutzel, C.R. Signaling Theory: A Review and Assessment. J. Manag. 2011, 37, 39–67. [Google Scholar] [CrossRef]
- Haniffa, R.M.; Cooke, T.E. The Impact of Culture and Governance on Corporate Social Reporting. J. Account. Public Policy 2005, 24, 391–430. [Google Scholar] [CrossRef]
- Connelly, B.L.; Ketchen, D.J.; Slater, S.F. Toward a “Theoretical Toolbox” for Sustainability Research in Marketing. J. Acad. Mark. Sci. 2011, 39, 86–100. [Google Scholar] [CrossRef]
- Alon, A.; Vidovic, M. Sustainability Performance and Assurance: Influence on Reputation. Corp. Reput. Rev. 2015, 18, 337–352. [Google Scholar] [CrossRef]
- Ching, H.Y.; Gerab, F. Sustainability Reports in Brazil through the Lens of Signaling, Legitimacy and Stakeholder Theories. Soc. Responsib. J. 2017, 13, 95–110. [Google Scholar] [CrossRef]
- Ioannou, I.; Serafeim, G. The Consequences of Mandatory Corporate Sustainability Reporting. In The Oxford Handbook of Corporate Social Responsibility; McWilliams, A., Rupp, D.E., Siegel, D.S., Stahl, G.K., Waldman, D.A., Eds.; Oxford University Press: Oxford, UK, 2019; pp. 451–489. [Google Scholar] [CrossRef]
- Shapiro, L. The Fear of Greenwashing May Be Greater than the Reality across the Global Financial Markets. S&P Global Ratings. Available online: https://www.spglobal.com/ratings/en/research/articles/210823-the-fear-of-greenwashing-may-be-greater-than-the-reality-across-the-global-financial-markets-12074863 (accessed on 1 October 2023).
- Jones, H. EU Confirms Watering down of Corporate Sustainability Disclosures. Reuters, 1 August 2023. Available online: https://www.reuters.com/sustainability/eu-finalises-new-corporate-sustainability-disclosure-rules-2023-07-31/(accessed on 31 October 2023).
- Manfredi, R. European Corporate Sustainability Reporting Directive (CSRD): Key Takeaways from Adoption of the European Sustainability Reporting Standards. Gibson Dunn. Available online: https://www.gibsondunn.com/european-corporate-sustainability-reporting-directive-key-takeaways-from-adoption-of-european-sustainability-reporting-standards/ (accessed on 31 October 2023).
- IFRS-ISSB: Frequently Asked Questions. Available online: https://www.ifrs.org/groups/international-sustainability-standards-board/issb-frequently-asked-questions/ (accessed on 31 October 2023).
- ISSB Sustainability-Related Disclosure Standards Published: A New Global Baseline? | Global Law Firm | Norton Rose Fulbright. Available online: https://www.nortonrosefulbright.com/en/knowledge/publications/e2505907/issb-sustainability-related-disclosure-standards-published-a-new-global-baseline (accessed on 31 October 2023).
- Grayson, J.; Stampe, J. Palm Oil Investor Review: Investor Guidance on Palm Oil; WWF: Gland, Switzerland, 2012; Available online: https://wwf.panda.org/wwf_news/?204547/Palm-Oil-Investor-Review-2012 (accessed on 1 October 2023).
- SSE. New SSE ESG Guidance Database. Available online: https://sseinitiative.org/all-news/new-sse-esg-guidance-database/ (accessed on 1 October 2023).
- Jones, E.; Kim, K.; Chetwode, S.; Tylenda, E.; Singer, B.; Bingham, D.R.; Chen, G.; Corbett, B.; Meyer, M.; Aggarwal, R.; et al. GS SUSTAIN: APAC ESG Regulation a Deep-Dive on Progress across Key Asia Pacific Markets; Goldman Sachs: New York, NY, USA, 2022; Available online: https://www.goldmansachs.com/intelligence/pages/gs-research/gs-sustain-our-analysis-of-apac-esg-regulation/report-deep-dive.pdf (accessed on 1 October 2023).
- VinciWorks. Is ESG Reporting Mandatory in the UK, EU & US? VinciWorks. Available online: https://vinciworks.com/blog/is-esg-reporting-mandatory-in-the-uk-the-eu-and-the-us/ (accessed on 1 October 2023).
- Doh, J.P.; Howton, S.D.; Howton, S.W.; Siegel, D.S. Does the Market Respond to an Endorsement of Social Responsibility? The Role of Institutions, Information, and Legitimacy. J. Manag. 2010, 36, 1461–1485. [Google Scholar] [CrossRef]
- UN Global Compact. Private Sustainability Finance. Invest in Sustainable Development|UN Global Compact. Available online: https://unglobalcompact.org/take-action/action/private-sustainability-finance (accessed on 1 October 2023).
- RIA Canada. A New Global Collaboration to Align and Refine ESG Terminology Between the UN Priniciples for Responsible Investment, the Global Sustainable Investment Alliance and the CFA Institute. Responsible Investment Association. Available online: https://www.riacanada.ca/news/a-new-global-collaboration-on-esg-terminology/ (accessed on 1 October 2023).
- McInnes, A. A Comparison of Leading Palm Oil Certification Standards; Forest Peoples Programme: Moreton-in-Marsh, UK, 2017; Available online: https://www.forestpeoples.org/sites/default/files/documents/Palm%20Oil%20Certification%20Standards_lowres_spreads.pdf (accessed on 1 October 2023).
- Schouten, G.; Glasbergen, P. Creating Legitimacy in Global Private Governance: The Case of the Roundtable on Sustainable Palm Oil. Ecol. Econ. 2011, 11, 1891–1899. [Google Scholar] [CrossRef]
- Barthel, M.; Jennings, S.; Schreiber, W.; Sheane, R.; Royston, S.; Fry, J.; Khor, Y.L.; McGill, J. Study on the Environmental Impact of Palm Oil Consumption and on Existing Sustainability Standards: Final Report and Appendices; Publications Office of the European Union: Luxembourg, 2018; Available online: https://data.europa.eu/doi/10.2779/530244 (accessed on 1 October 2023).
- RSPO. ACOP 2020—Latin America and North America Report Robust Results. Roundtable on Sustainable Palm Oil (RSPO). Available online: https://rspo.org/acop-2020--latin-america-and-north-america-report-robust-results/ (accessed on 1 October 2023).
- Efeca. Comparison of the ISPO, MSPO and RSPO Standards; Efeca: Bournemouth, UK, 2015; Available online: https://www.sustainablepalmoil.org/wp-content/uploads/sites/2/2015/09/Efeca_PO-Standards-Comparison.pdf (accessed on 1 October 2023).
- IUCN. Setting the Biodiversity Bar for Palm Oil Certification: Assessing the Rigor of Biodiversity and Assurance Requirements of Palm Oil Standards; IUCN: Amsterdam, The Netherlands, 2019; Available online: https://www.iucn.nl/app/uploads/2021/03/iucn_nl_setting_the_biodiversity_bar_for_palm_oil.pdf (accessed on 1 October 2023).
- Wulandari, A.; Nasution, M.A. Perbandingan Roundtable on Sustainable Palm Oil (RSPO), Indonesian Sustainable Palm Oil (ISPO), Dan Malaysian Sustainable Palm Oil (MSPO). J. Penelit. Kelapa Sawit 2021, 29, 35–48. [Google Scholar] [CrossRef]
- Kong, L. Who Gets to Define Sustainable Palm Oil? China Dialogue. Available online: https://chinadialogue.net/en/food/who-gets-to-define-sustainable-palm-oil/ (accessed on 1 October 2023).
- Global Forest Watch. World Resources Institute. Available online: https://www.wri.org/initiatives/global-forest-watch (accessed on 3 November 2023).
- Suitability Mapper. World Resources Institute. Available online: https://www.wri.org/data/suitability-mapper (accessed on 3 November 2023).
- Forest Cover Analyzer. World Resources Institute. Available online: https://www.wri.org/data/forest-cover-analyzer (accessed on 3 November 2023).
- Trase Homepage. Available online: https://www.trase.earth/ (accessed on 3 November 2023).
- RSPO PalmTrace Marketplace. Roundtable on Sustainable Palm Oil (RSPO). Available online: https://rspo.org/as-an-organisation/marketplace/ (accessed on 3 November 2023).
- ZSL. About SPOTT. Available online: https://www.spott.org/about/ (accessed on 1 October 2023).
- WWF. WWF Palm Oil Buyers Scorecard—POBS. Available online: https://palmoilscorecard.panda.org/ (accessed on 1 October 2023).
- Fanning, I.; Spencer, E. Palm Oil Industry Unprepared for Climate Change. Available online: https://www.spott.org/news/palm-oil-industry-unprepared-for-climate-change/ (accessed on 1 October 2023).
- ZSL. Sustainable Business and Finance|ZSL. Available online: https://www.zsl.org/what-we-do/working-with-business (accessed on 1 October 2023).
- Oppenheimer, P.; Clarke, E.; Cupit, O.; Delabre, I.; Dodson, A.; Guindon, M.; Hatto, A.; Lam, J.; Lawrence, L.; Melot, C.; et al. The SPOTT Index: A Proof-of-Concept Measure for Tracking Public Disclosure in the Palm Oil Industry. Curr. Res. Environ. Sustain. 2021, 3, 100042. [Google Scholar] [CrossRef]
- Nofsinger, J.R.; Sulaeman, J.; Varma, A. Institutional Investors and Corporate Social Responsibility. J. Corp. Financ. 2019, 58, 700–725. [Google Scholar] [CrossRef]
- Loh, L.; Thomas, T.; Wang, Y. Sustainability Reporting and Firm Value: Evidence from Singapore-Listed Companies. Sustainability 2017, 9, 2112. [Google Scholar] [CrossRef]
- Herremans, I.M.; Akathaporn, P.; McInnes, M. An Investigation of Corporate Social Responsibility Reputation and Economic Performance. Account. Organ. Soc. 1993, 18, 587–604. [Google Scholar] [CrossRef]
- Paolone, F.; Cucari, N.; Wu, J.; Tiscini, R. How Do ESG Pillars Impact Firms’ Marketing Performance? A Configurational Analysis in the Pharmaceutical Sector. J. Bus. Ind. Mark. 2021, 37, 1594–1606. [Google Scholar] [CrossRef]
- McWilliams, A.; Siegel, D.; Teoh, S.H. Issues in the Use of the Event Study Methodology: A Critical Analysis of Corporate Social Responsibility Studies. Organ. Res. Methods 1999, 2, 340–365. [Google Scholar] [CrossRef]
- Lahouel, B.B.; Gaies, B.; Zaied, Y.B.; Jahmane, A. Accounting for Endogeneity and the Dynamics of Corporate Social—Corporate Financial Performance Relationship. J. Clean. Prod. 2019, 230, 352–364. [Google Scholar] [CrossRef]
- Landi, G.; Sciarelli, M. Towards a More Ethical Market: The Impact of ESG Rating on Corporate Financial Performance. Soc. Responsib. J. 2018, 15, 11–27. [Google Scholar] [CrossRef]
- Benlemlih, M.; Shaukat, A.; Qiu, Y.; Trojanowski, G. Environmental and Social Disclosures and Firm Risk. J. Bus. Ethics 2018, 152, 613–626. [Google Scholar] [CrossRef]
- Shakil, M.H. Environmental, Social and Governance Performance and Stock Price Volatility: A Moderating Role of Firm Size. J. Public Aff. 2022, 22, e2574. [Google Scholar] [CrossRef]
- Krüger, P. Corporate Goodness and Shareholder Wealth. J. Financ. Econ. 2015, 115, 304–329. [Google Scholar] [CrossRef]
- Luo, J.; Meier, S.; Oberholzer-Gee, F. No News Is Good News: CSR Strategy and Newspaper Coverage of Negative Firm Events; Working Paper; Harvard Business School: Boston, MA, USA, 2011. [Google Scholar]
- Abdullah, M.; Hamzah, N.; Ali, M.H.; Tseng, M.-L.; Brander, M. The Southeast Asian Haze: The Quality of Environmental Disclosures and Firm Performance. J. Clean. Prod. 2020, 246, 118958. [Google Scholar] [CrossRef]
- Godfrey, P.C.; Hatch, N.W. Researching Corporate Social Responsibility: An Agenda for the 21st Century. J. Bus. Ethics 2007, 70, 87–98. [Google Scholar] [CrossRef]
- Fernandez, P. Valuation Using Multiples: How Do Analysts Reach Their Conclusions? IESE Business School: Barcelona, Spain, 2001; Available online: http://odabasi.boun.edu.tr/FinanceNotes/2001%20Fernandez%20-%20Multiples.pdf (accessed on 1 October 2023).
- CFI. Price Earnings Ratio. Corporate Finance Institute. Available online: https://corporatefinanceinstitute.com/resources/valuation/price-earnings-ratio/ (accessed on 1 October 2023).
- Miller, M.H.; Modigliani, F. Dividend Policy, Growth, and the Valuation of Shares. J. Bus. 1961, 34, 411–433. [Google Scholar] [CrossRef]
- Mauboussin, M.J.; Callahan, D. What Does a Price-Earnings Multiple Mean? Credit Suisse: Zürich, Switzerland, 2014; Available online: https://studylib.net/doc/7982074/what-does-a-price-earnings-multiple-mean%3F (accessed on 1 October 2023).
- Basu, S. Investment Performance of Common Stocks in Relation to Their Price-Earnings Ratios: A Test of the Efficient Market Hypothesis. J. Financ. 1977, 32, 663–682. [Google Scholar] [CrossRef]
- Basu, S. The Relationship between Earnings’ Yield, Market Value and Return for NYSE Common Stocks: Further Evidence. J. Financ. Econ. 1983, 12, 129–156. [Google Scholar] [CrossRef]
- Tseng, K.C. Low Price, Price-Earnings Ratio, Market Value, and Abnormal Stock Returns. Financ. Rev. 1988, 23, 333–343. [Google Scholar] [CrossRef]
- Fama, E.; French, K. The Cross-Section of Expected Stock Returns. J. Financ. 1992, 47, 427–465. [Google Scholar]
- Shen, P. The P/E Ratio and Stock Market Performance. Econ. Rev. 2000, 85, 23–36. [Google Scholar]
- Temple-West, P. ‘Monstrous’ Run for Responsible Stocks Stokes Fears of a Bubble. Financial Times. Available online: https://www.ft.com/content/73765d6c-5402-11ea-90ad-25e377c0ee1f (accessed on 1 October 2023).
- Junius, D.; Adisurjo, A.; Rijanto, Y.A.; Adelina, Y.E. The Impact of ESG Performance to Firm Performance and Market Value. J. Apl. Akunt. 2020, 5, 21–41. [Google Scholar] [CrossRef]
- Lerner, L.D.; Fryxell, G.E. An Empirical Study of the Predictors of Corporate Social Performance: A Multi-Dimensional Analysis. J. Bus. Ethics 1988, 7, 951–959. [Google Scholar]
- Levicharova, M.; Steinweg, T.; Thoumi, G. SE Asian Palm Oil Sector—Statistics Suggest Equity Overvalued—Chain Reaction Research. Available online: https://chainreactionresearch.com/report/se-asian-palm-oil-sector-statistics-suggest-equity-overvalued/ (accessed on 1 October 2023).
- Udayasankar, K. Corporate Social Responsibility and Firm Size. J. Bus. Ethics 2008, 83, 167–175. [Google Scholar] [CrossRef]
- Watson, A.; Shrives, P.; Marston, C. Voluntary Disclosure of Accounting Ratios in the UK. Br. Account. Rev. 2002, 34, 289–313. [Google Scholar] [CrossRef]
- Roberts, P.W.; Dowling, G.R. Corporate Reputation and Sustained Superior Financial Performance: Reputation and Persistent Profitability. Strateg. Manag. J. 2002, 23, 1077–1093. [Google Scholar] [CrossRef]
- Gjergji, R.; Vena, L.; Sciascia, S.; Cortesi, A. The Effects of Environmental, Social and Governance Disclosure on the Cost of Capital in Small and Medium Enterprises: The Role of Family Business Status. Bus. Strategy Environ. 2021, 30, 683–693. [Google Scholar] [CrossRef]
- Gallo, P.J.; Christensen, L.J. Firm Size Matters: An Empirical Investigation of Organizational Size and Ownership on Sustainability-Related Behaviors. Bus. Soc. 2011, 50, 315–349. [Google Scholar] [CrossRef]
- Lin, W.-L.; Cheah, J.-H.; Azali, M.; Ho, J.A.; Yip, N. Does Firm Size Matter? Evidence on the Impact of the Green Innovation Strategy on Corporate Financial Performance in the Automotive Sector. J. Clean. Prod. 2019, 229, 974–988. [Google Scholar] [CrossRef]
- WWF; ZSL. WWF-ZSL Study Urgently Calls on RSPO Member Companies to Set and Deliver on Their Targets and Work Collectively Towards Mainstreaming Sustainable Palm Oil. WWF. Available online: https://wwf.panda.org/wwf_news/?5443966/WWF-ZSL-study-urgently-calls-on-RSPO-member-companies-to-set-and-deliver-on-their-targets-and-work-collectively-towards-mainstreaming-sustainable-palm-oil (accessed on 1 October 2023).
- SIIA. ESG in Practice: A Closer Look at Sustainability in ASEAN’s Palm Oil and Pulpwood Sectors; Singapore Institute of International Affairs: Singapore, 2020; Available online: http://www.siiaonline.org/wp-content/uploads/2020/11/ESG-in-Practice-A-Closer-Look-at-Sustainability-in-ASEAN%E2%80%99s-Palm-Oil-and-Pulpwood-Sectors.pdf (accessed on 1 October 2023).
- Suroso, A.I.; Tandra, H.; Najib, M.; Syaukat, Y. Firm Performance Factors and Efficiency of Indonesian Palm Oil Companies. J. Manaj. Agribisnis 2020, 17, 227. [Google Scholar] [CrossRef]
- Surendran, S. CPO and Share Prices of Producers Diverge. The Edge Malaysia. 3 March 2021. Available online: https://theedgemalaysia.com/article/cpo-and-share-prices-producers-diverge (accessed on 1 October 2023).
- Kumar, P.C. The CPO Price and Stock Disconnect. The Star. 7 August 2021. Available online: https://www.thestar.com.my/business/business-news/2021/08/07/the-cpo-price-and-stock-disconnect (accessed on 1 October 2023).
- Foo, A.; Glover, P.; Chang, A.; Pratama, S. Asia Palm Oil Sector: From Divestment to Industry Transition; Environmental, Social and Governance (ESG) Research; Credit Suisse PLUS: Credit Suisse Equity Research: Asia Pacific; Credit Suisse: Zürich, Switzerland, 2021. [Google Scholar]
- Foo, A. Asia Palm Oil Sector: New Report: Lingering Uncertainties to Extend Price Support; Environmental, Social and Governance (ESG) Research; Credit Suisse PLUS: Credit Suisse Equity Research: Asia Pacific; Credit Suisse: Zürich, Switzerland, 2022. [Google Scholar]
- Rijk, P.; Miraningrum, O.; Piotrowski, M. Wilmar’s Refineries and Brands Lag in Implementation of ESG Policies—Chain Reaction Research. Available online: https://chainreactionresearch.com/report/wilmars-refineries-and-brands-lag-in-implementation-of-esg-policies/ (accessed on 1 October 2023).
- Yap, L.K. Government Support Vital for ESG in Palm Oil Industry. The Star. 12 December 2022. Available online: https://www.thestar.com.my/business/business-news/2022/12/12/government-support-vital-for-esg-in-palm-oil-industry (accessed on 1 October 2023).
- Kleinbaum, D.G.; Kupper, L.L.; Nizam, A. Applied Regression Analysis and Other Multivariable Methods; Duxbury Press: Pacific Grove, CA, USA, 1998. [Google Scholar]
- Dang, C.; Li, Z.F.; Yang, C. Measuring Firm Size in Empirical Corporate Finance. J. Bank. Financ. 2018, 86, 159–176. [Google Scholar] [CrossRef]
- Baumann-Pauly, D.; Wickert, C.; Spence, L.J.; Scherer, A.G. Organizing Corporate Social Responsibility in Small and Large Firms: Size Matters. J. Bus. Ethics 2013, 115, 693–705. [Google Scholar] [CrossRef]
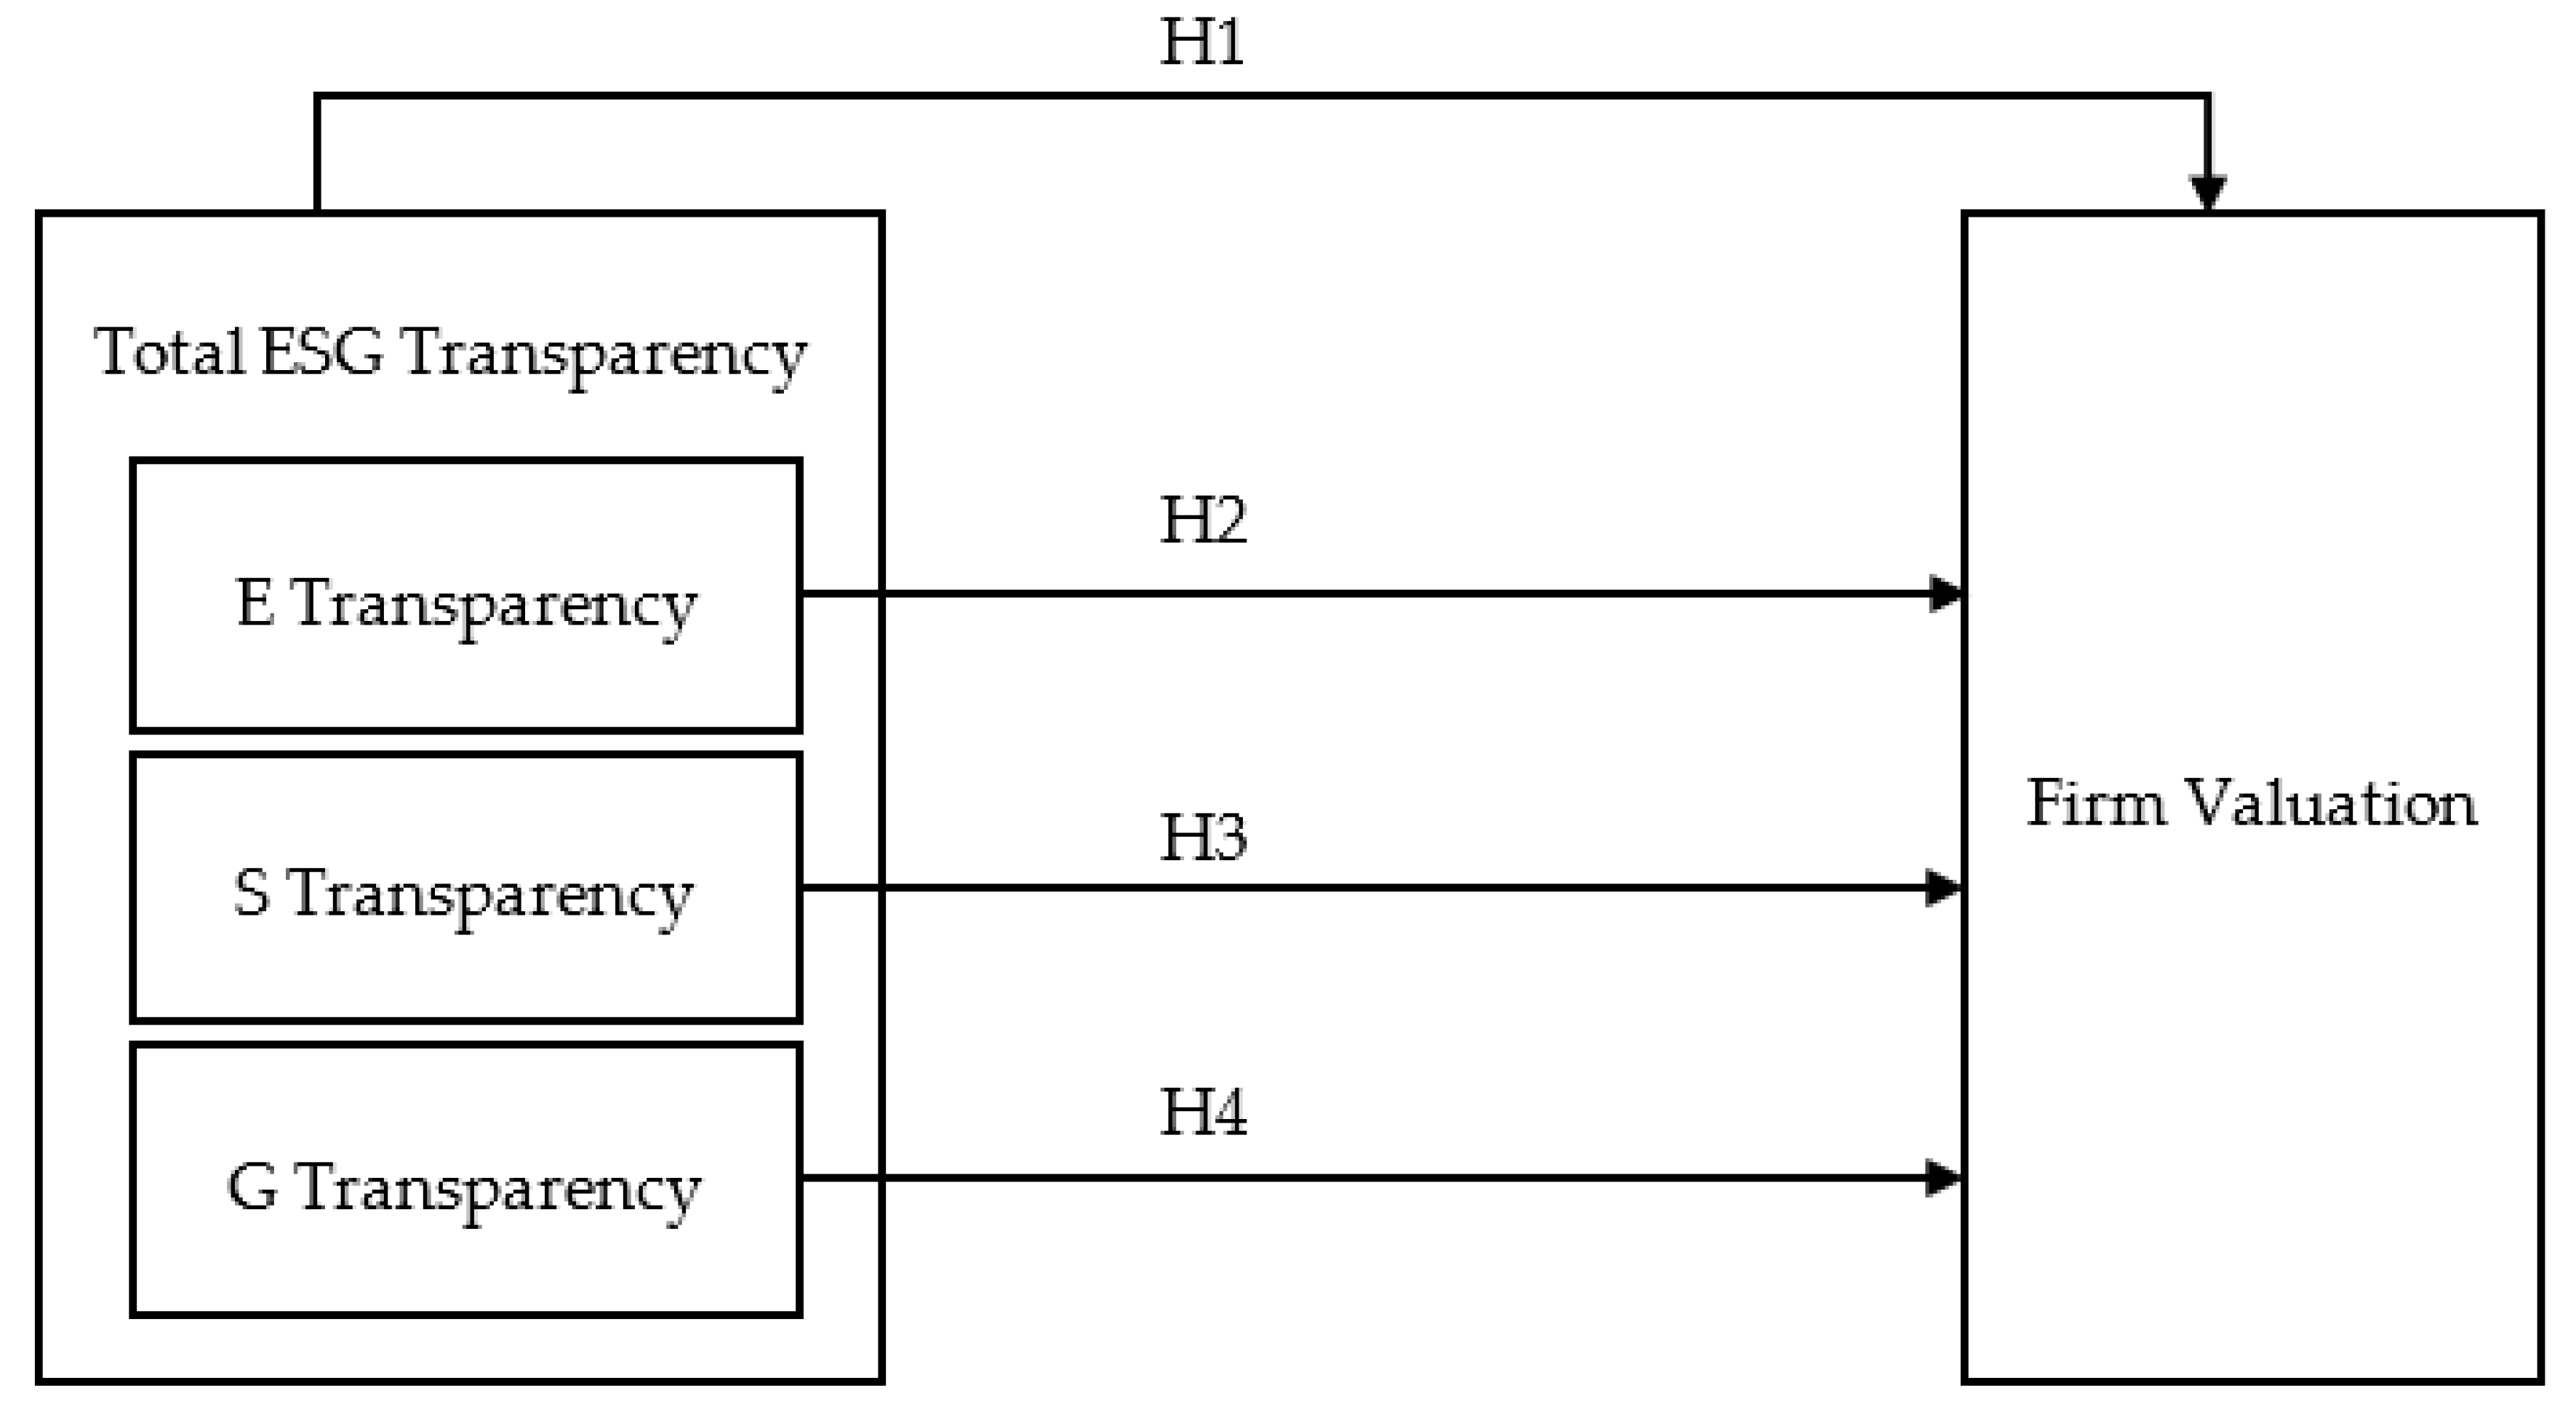

Disclaimer/Publisher’s Note: The statements, opinions and data contained in all publications are solely those of the individual author(s) and contributor(s) and not of MDPI and/or the editor(s). MDPI and/or the editor(s) disclaim responsibility for any injury to people or property resulting from any ideas, methods, instructions or products referred to in the content. |
© 2023 by the authors. Licensee MDPI, Basel, Switzerland. This article is an open access article distributed under the terms and conditions of the Creative Commons Attribution (CC BY) license (https://creativecommons.org/licenses/by/4.0/).