Article

Analysis of Head Displacement during a Frontal Collision at a Speed of 20 km/h—Experimental Studies

Department of Automotive Engineering and Transport, Kielce University of Technology, Avenue Tysiaclecia Państwa Polskiego 7, 25-314 Kielce, Poland
Sustainability 2023, 15(22), 16015; https://doi.org/10.3390/su152216015
Submission received: 26 September 2023 / Revised: 9 November 2023 / Accepted: 13 November 2023 / Published: 16 November 2023
(This article belongs to the Special Issue Traffic Flow, Road Safety, and Sustainable Transportation)

Abstract

:
The aim of the research is to compare the head displacements of volunteers with the head displacements of the KPSIT C50 dummy, taking into account the change of vehicle seat belts. Unfortunately, sudden braking or collisions between vehicles is becoming more and more common, especially during traffic jams. There is considerable ignorance in the literature on the behavior of the human body during a low-speed collision, which motivates the development of low-speed crash test procedures in order to reduce the risk of cervical spine injuries. The tests were carried out at a teaching station designed to measure the forces in seat belts and the displacements of individual body elements (dummy or volunteer) during a low-speed crash test. The article is part of extensive research on crash tests using volunteers and KPSIT physical dummies. The study involved 150 volunteers who were divided into specific percentile groups. The article compares the head displacements of the constructed KPSIT C50 dummy with the head displacements of volunteers representing the 50th percentile group of the male population. The study conducted with volunteers was under control and was completely safe for people participating in the study. The research shows that the use of a bucket sports seat equipped with four-point or five-point seat belts significantly reduces the movement of the head during a low-speed collision. This type of vehicle seat is safer and provides a reduced risk of injury from hitting the head on the steering column in a low-speed collision when the airbag has not deployed. Moreover, research shows that standard seat belts placed in passenger vehicles allow the head to move freely forward in the event of an accident or low-speed collision. Therefore, if the speed is too low to deploy the airbag, there is a high probability that the driver and passengers will hit their heads against the cockpit of the passenger vehicle during a collision at a speed of 20 km/h.

1. Introduction

Currently, the policy of European Union countries and many countries around the world is aimed at reducing the number of fatalities in road accidents. The “Vision Zero” philosophy adopted by most of these countries around the world aims to create and monitor a road transport system in which human error will not result in death or serious injury [1,2,3]. Failure to adjust speed to prevailing road conditions and failure to maintain a safe distance from the vehicle in front are the most common driver errors leading to road accidents. When introducing the vision zero philosophy, vehicle safety should be managed in such a way that people making mistakes (exceeding the speed limit, failing to observe the distance, etc.) have the opportunity to avoid an accident or reduce the level of injuries by using active and passive safety systems [4,5,6]. The fact is that modern vehicles are equipped with various safety systems, e.g., obstacle detection, active cruise control, lane keeping, or blind spot detection system. Each of these systems contributes to improving the safety of all road users [7,8,9].
However, seat belts are the basic safety system in every vehicle. They were first introduced into mass production of Ford vehicles in 1955 and Volvo in 1958. The main reason for introducing seat belts in motor vehicles was to hold the body of the driver and passengers in the event of a collision. At the moment of a collision, the human body moves forward due to inertia, which leads to the body hitting the cabin elements and even falling out of the vehicle through the windshield [10,11,12]. Another element that increased the chances of reducing injuries to drivers and passengers during the crash test was the airbag. At that time, it was rather difficult to imagine a vehicle without an airbag and seat belts. However, it should be noted that motor vehicles have largely changed in the era of revolution. The driver’s position has changed, and current vehicles allow you to adjust the height of the steering column and adjust the vehicle seat to suit the comfort of the driver and passengers. The road infrastructure has also changed significantly [13,14,15]. In many countries around the world, highways and expressways have been expanded, forcing vehicles to move in one direction, which has resulted in a reduction in the number of frontal and side accidents in recent decades. The movement of vehicles in one direction on highways or expressways, or in cities where the roads are separated by a green belt, most often results in collisions in which the vehicle does not brake and hits the rear of the vehicle in front. These types of collisions most often occur at intersections with traffic lights, when the vehicle brakes suddenly, or in traffic jams. Low-speed collisions can cause long-term injuries and even death. Vehicle manufacturers should not underestimate this type of collision, because in most cases, collisions at a speed of 20 km/h will not trigger the airbag and a standard seat belt installed in a passenger vehicle may not be tightened by the belt tensioner due to the low impact force. In such a situation, the vehicle driver may hit the vehicle’s cockpit [16,17,18].
Currently, anthropometric dummies are used in crash tests, which are adapted to the type of crash test. Therefore, we can divide dummies for frontal, rear, and side crash tests [19,20,21]. Moreover, dummies can be divided according to the percentile of the population, although anthropometric dummies for all percentiles of the population of men, women, and children have not been created since the beginning of the first dummies. Currently, anthropometric dummies are used for crash tests, reproducing individual parts of the human body in terms of mass, dimensions, and width. Their task is to collect information about displacements, accelerations, and forces acting on individual parts of the dummy’s body during a collision. Data from the dummy help to illustrate the level of injury or human survival in a road accident [22,23,24].
Unfortunately, it should be noted that each dummy is designed to be used in a specific crash test at a specific crash speed. This results in the fact that despite the correct biofidelity of the dummy with the human body, dummy manufacturers do not accept the use of one dummy for several different crash tests. Moreover, the market lacks a dummy dedicated to low-speed crash tests [13,15,16].
The current state of knowledge does not allow verification of the behavior of the human body during a low-speed collision. We do not know whether the position of the vehicle seat, its type, or the type of seat belts will affect the movement of individual parts of the human body during a low-speed collision. Additionally, the literature on the subject shows that the dummies available on the market are mainly used for crash tests at higher speeds, and no dummy manufacturer declares their use at low speeds. The literature on the subject also lacks a procedure for assessing a person’s injuries during such an event. The article aims to obtain the necessary information regarding the displacement of the human body during low-speed collisions. The research will enable us to check the influence of the gender of the volunteers on the displacement of the head during a crash test at a low speed of 20 km/h. They will also provide information on the impact of the use of four-point or five-point belts on the movement of the dummy’s head during a frontal collision at low speed.
The joints used in anthropometric dummies (Hybrid III) intended for crash tests must be dismantled, calibrated, and reinstalled after a series of impacts [25,26,27]. In the case of the built KPSIT C50 dummy, the joints do not need to be calibrated after a series of crash tests.
It should be noted that the ideal design solution for anthropometric dummies intended for crash tests would be a design that would not require frequent calibration and at the same time ensure the durability of the joint and the repeatability of the results [28,29,30].
The rest of the article is as follows. Section 2 provides the research background. This section presents gaps in current knowledge regarding low-speed crash tests. Section 3 contains experimental research. This part contains information about the implementation and course of experimental research. Moreover, this part contains research hypotheses. Section 4 contains the characteristics of the group of volunteers taking part in the crash test. Section 5 contains the results of experimental research. This part presents the results of the head movement trajectories of volunteers and the KPSIT C50 dummy. The section contains a summary of the head displacement of the KPSIT C50 dummy, including changes to the seat and seat belts. Section 6 contains a discussion. At the end of the article, conclusions are presented along with the scope of further work by the authors.

2. Research Background

Head-on collisions at low speeds not exceeding 25 km/h are not life threatening. However, it should be noted that they can cause head, neck, or trunk injuries. Injuries of the cervical spine are particularly difficult to diagnose in the first moments after the collision, as the first symptoms intensify only 8 h after the collision. As a result of the shock of a road traffic accident, the injured person may initially feel very well and not feel pain. However, it is only after a few hours that symptoms such as headache, vomiting, loss of consciousness, stiff neck, nausea, and numbness in the hands may occur. Very different structures can be damaged: muscles, tendons, nerves, or intervertebral discs. Treatment and recovery can take years, with the cost of treating cervical injuries steadily increasing [31,32]. These costs include, but are not limited to, the costs of treatment, rehabilitation, and medical visits. It is important to note that the average compensation for back and neck injuries as a result of a vehicle accident ranges from $100,000 to $500,000. Serious neck and back injuries can be much higher than average, especially if they require extensive medical care and ongoing rehabilitation [31].
Controlled crumple zones of a vehicle are features of a vehicle’s structure whose main function is to compress during a collision and absorb the energy of an impact. Unfortunately, a low-speed impact does not involve crumple zones, so the impact impulse is transmitted to the vehicle frame, which then converts the energy to the occupants. Because the occupants in the vehicle are strapped to the vehicle, they are the ones who are affected by most of the impact forces and not the crumple zones of the vehicle. The authors in [33] showed that as many as 50% of people involved in low-speed vehicle collisions reported cervical spine pain. The main limitation in such cases is the lack of knowledge about the mechanisms of whiplash injury during low-speed collisions. Unfortunately, most test centers conduct crash tests at much higher speeds. Euro NCAP crash tests are carried out at speeds that do not exceed 64 km/h. The lower limit of crash tests usually ends at a speed of 30 km/h [34]. Some passenger vehicle manufacturers carry out crash tests at low speeds of up to 25 km/h for the sole purpose of checking for potential damage to the vehicle [35,36]. Anthropometric dummies are not used in this type of crash test, as there are no studies on injuries to the driver or passengers at such low speeds. In addition, it should be noted that the market for anthropometric dummies is quite extensive. Since the first anthropometric dummy more than 80 years ago, there have been around 3500 different anthropometric dummies on the market for crash testing [17,18]. Manufacturers of dummies determine the purpose of anthropometric dummies and determine the velocities of collisions. When reviewing dummies, you can observe the problem of low speeds and the problem of using one dummy for several crash tests. Despite the fact that frontal crash test dummies are very extensive, the manufacturer does not recommend their use in rear crash tests. One BIORIDIA anthropometric dummy is commonly used for rear crash tests [19,20]. There is a lack of an anthropometric dummy on the market, which was dedicated to two types of crash tests and dedicated exclusively to low-speed crash tests [17,18].
The only dummy dedicated to crash tests is the KPSIT C50 dummy corresponding to the 50th percentile male. The name of the dummy was initiated from the first letters of the Department of Motor Vehicles and Transport, Kielce University of Technology, where the dummy was built. This dummy was built to resemble the HYBRID III C50 dummy. Ref. [18] presents the process of comparing the KPSIT C50 dummy to the HYBRID III C50 dummy. In addition, in Ref. [14], the KPSIT C50 dummy was compared with a simulation dummy made in the MSC ADAMS program. Ref. [17] presents a comparison of the head trajectory of the KPSIT C50 dummy with that of C50 volunteers during a frontal crash test at a speed of 20 km/h. The shoulder and knee joints of the KPSIT C50 dummy have been patented [37,38].
It should be noted that in the automotive industry, the safety of the driver and passengers is of great importance. Therefore, in the automotive industry, passenger and pedestrian safety technology has been significantly developed in recent decades. Passive safety systems are therefore becoming increasingly important in reducing damage and injuries to the driver and passengers in the event of a road accident. Airbags, ABS, traction control, ESC, seat belts, etc., are passive safety systems that are commonly installed in motor vehicles. The seat belt is primarily intended to protect the occupants of the vehicle. Research into various aspects of the design, operation, and manufacturing of seat belts has been carried out since their use in motor vehicles [39]. Currently, passenger vehicles have three-point seat belts, which at the same time sufficiently protect the driver and passengers and do not have a complicated fastening procedure. In contrast to passenger vehicles, three-point belts are rarely found in sports vehicles; the most common are five-point and four-point belts. These belts provide greater stability to the rider while driving and improve control over rotation and pelvic tilt while minimizing pressure on the abdomen or lower abdomen. In Ref. [40], the authors examined how the passenger’s age affects the fit and comfort of seat belts. The authors noted that about 50 percent of the people tested had an inadequately fitted seat belt. Participants with higher body mass indexes (BMIs) were more likely to have a shoulder strap higher on their abdomen, regardless of age or gender. When the shoulder strap was higher on the abdomen, the upper part of the strap was closer to the volunteer’s neck.

3. Experimental Studies

Experimental research was carried out at the Department of Vehicle and Tractors, Kielce University of Technology. Frontal crash tests of volunteers have been carried out since 2018. The research was carried out in high sunlight. A stand for simulating a collision with a fixed obstacle has been placed outside the laboratory, and Figure 1 shows a stand for simulating crash tests at low speed from 5 km/h to 25 km/h.

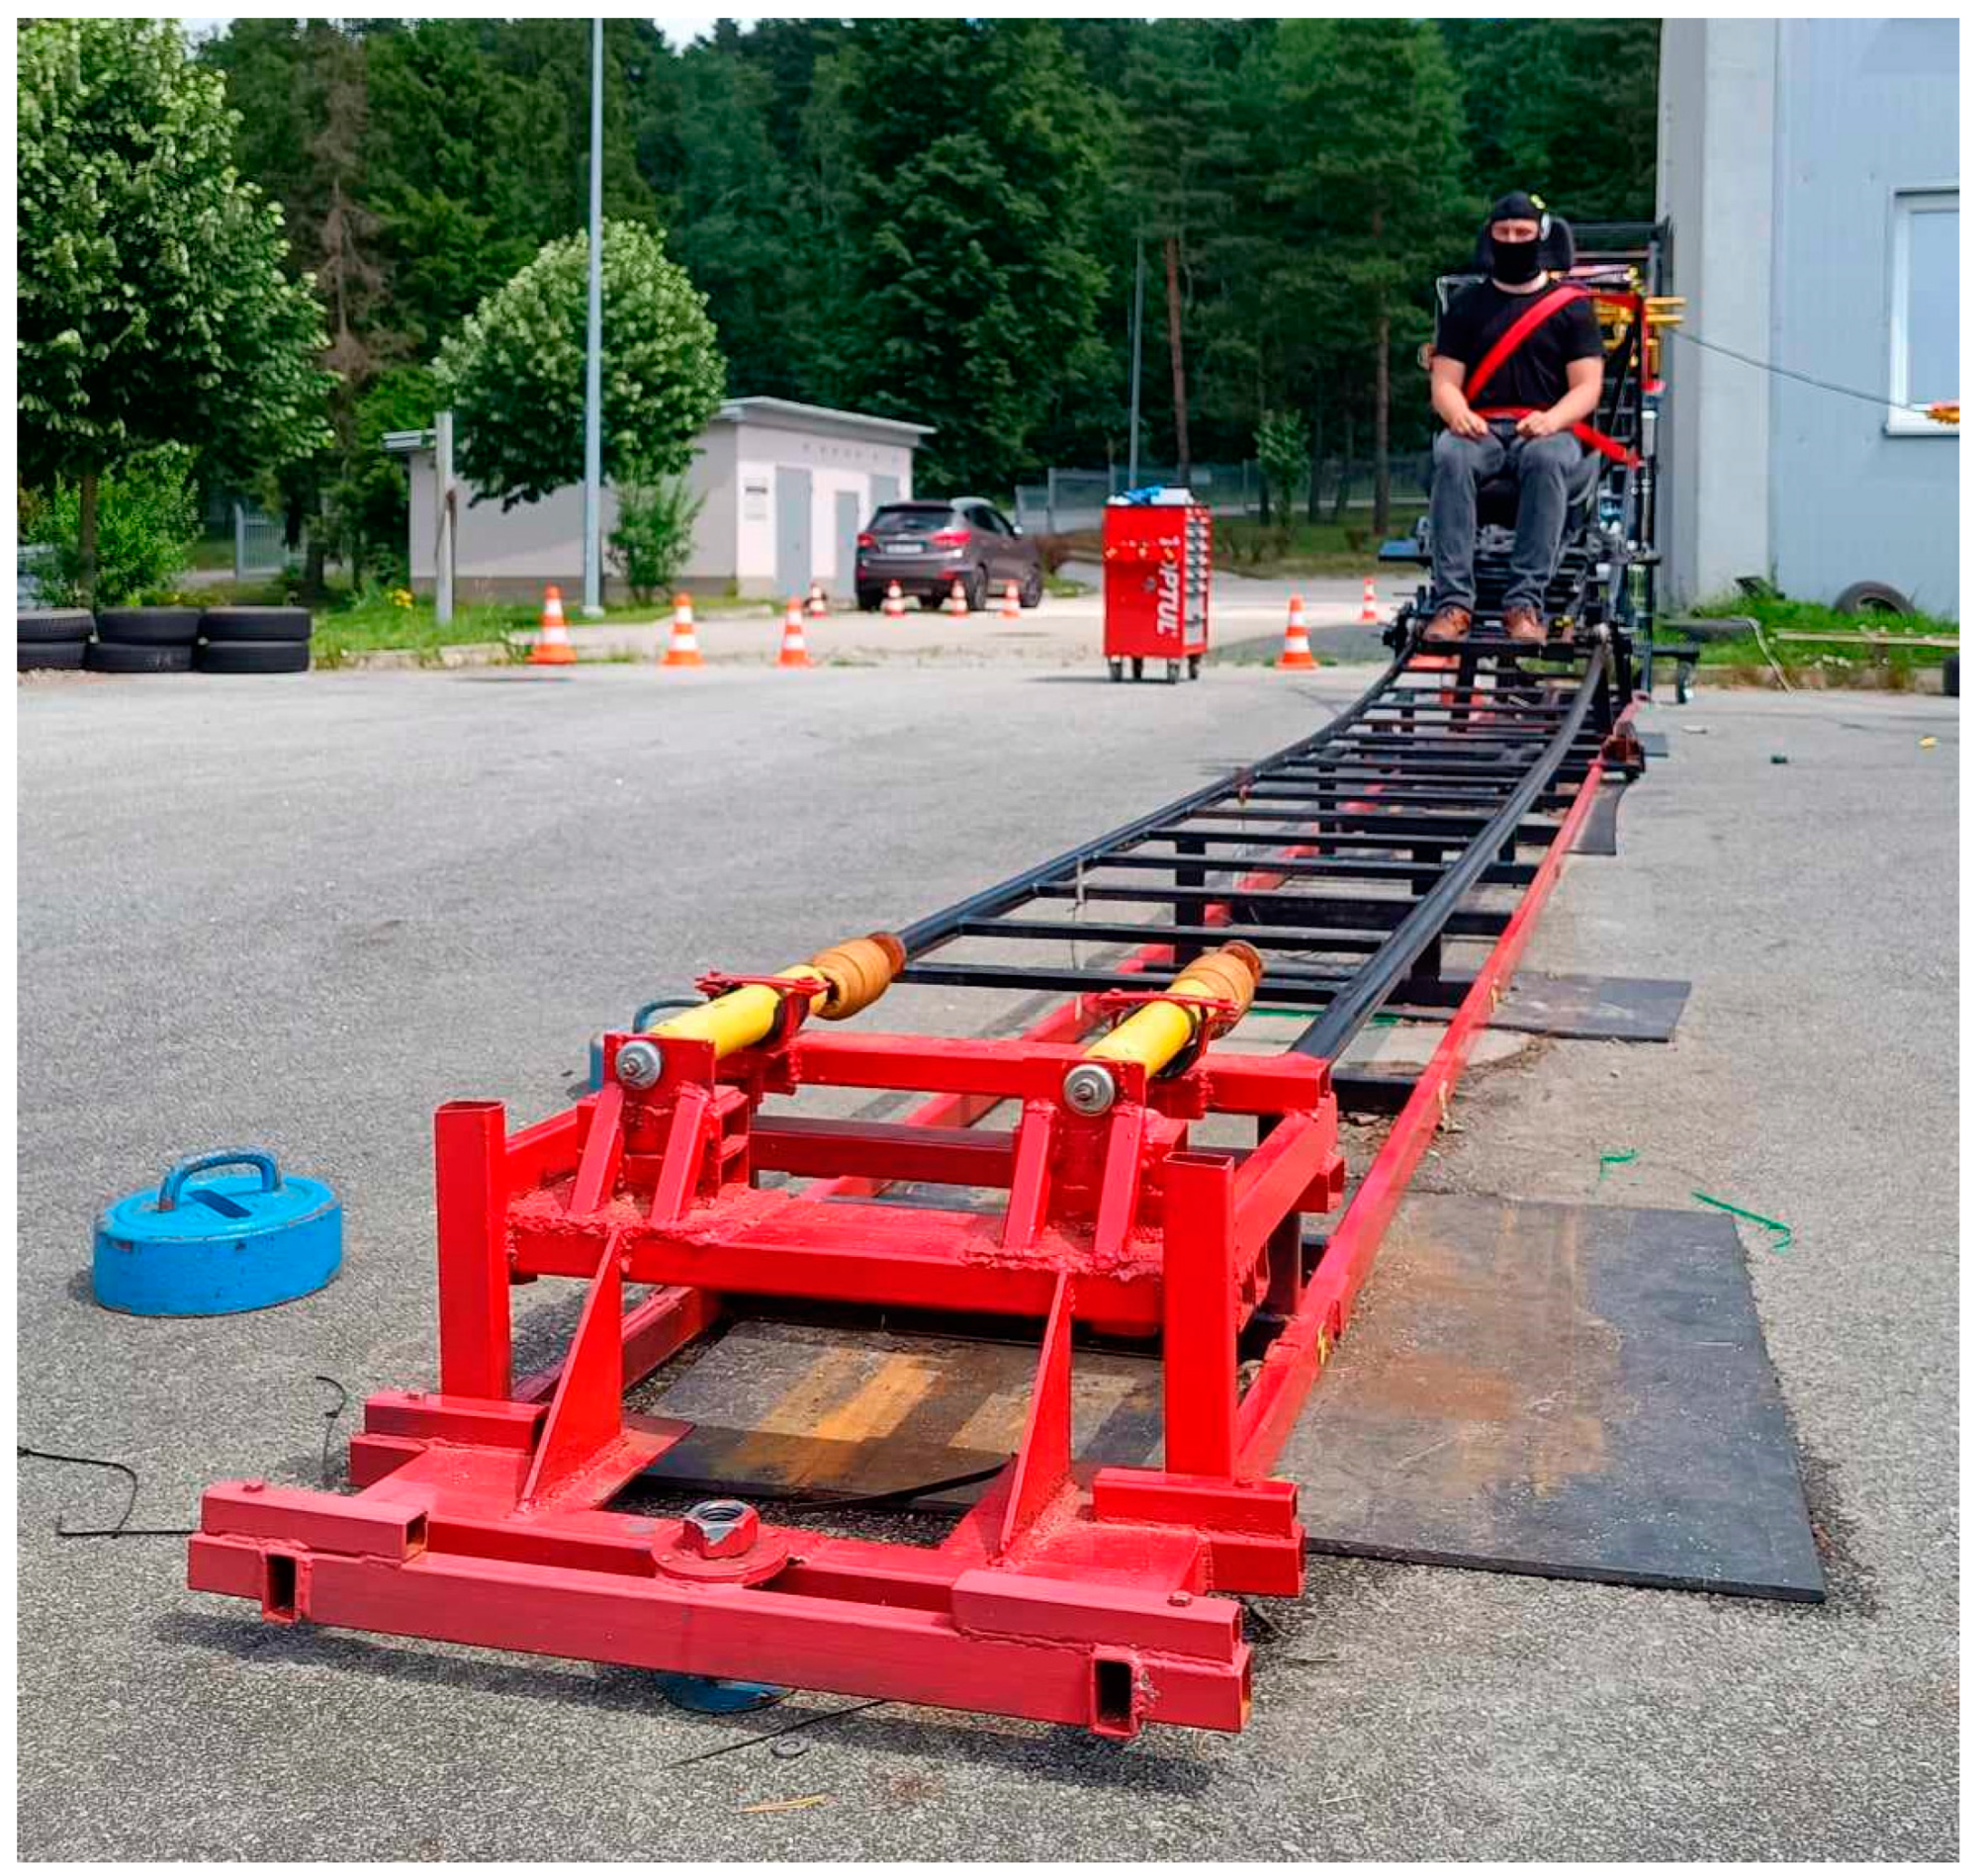
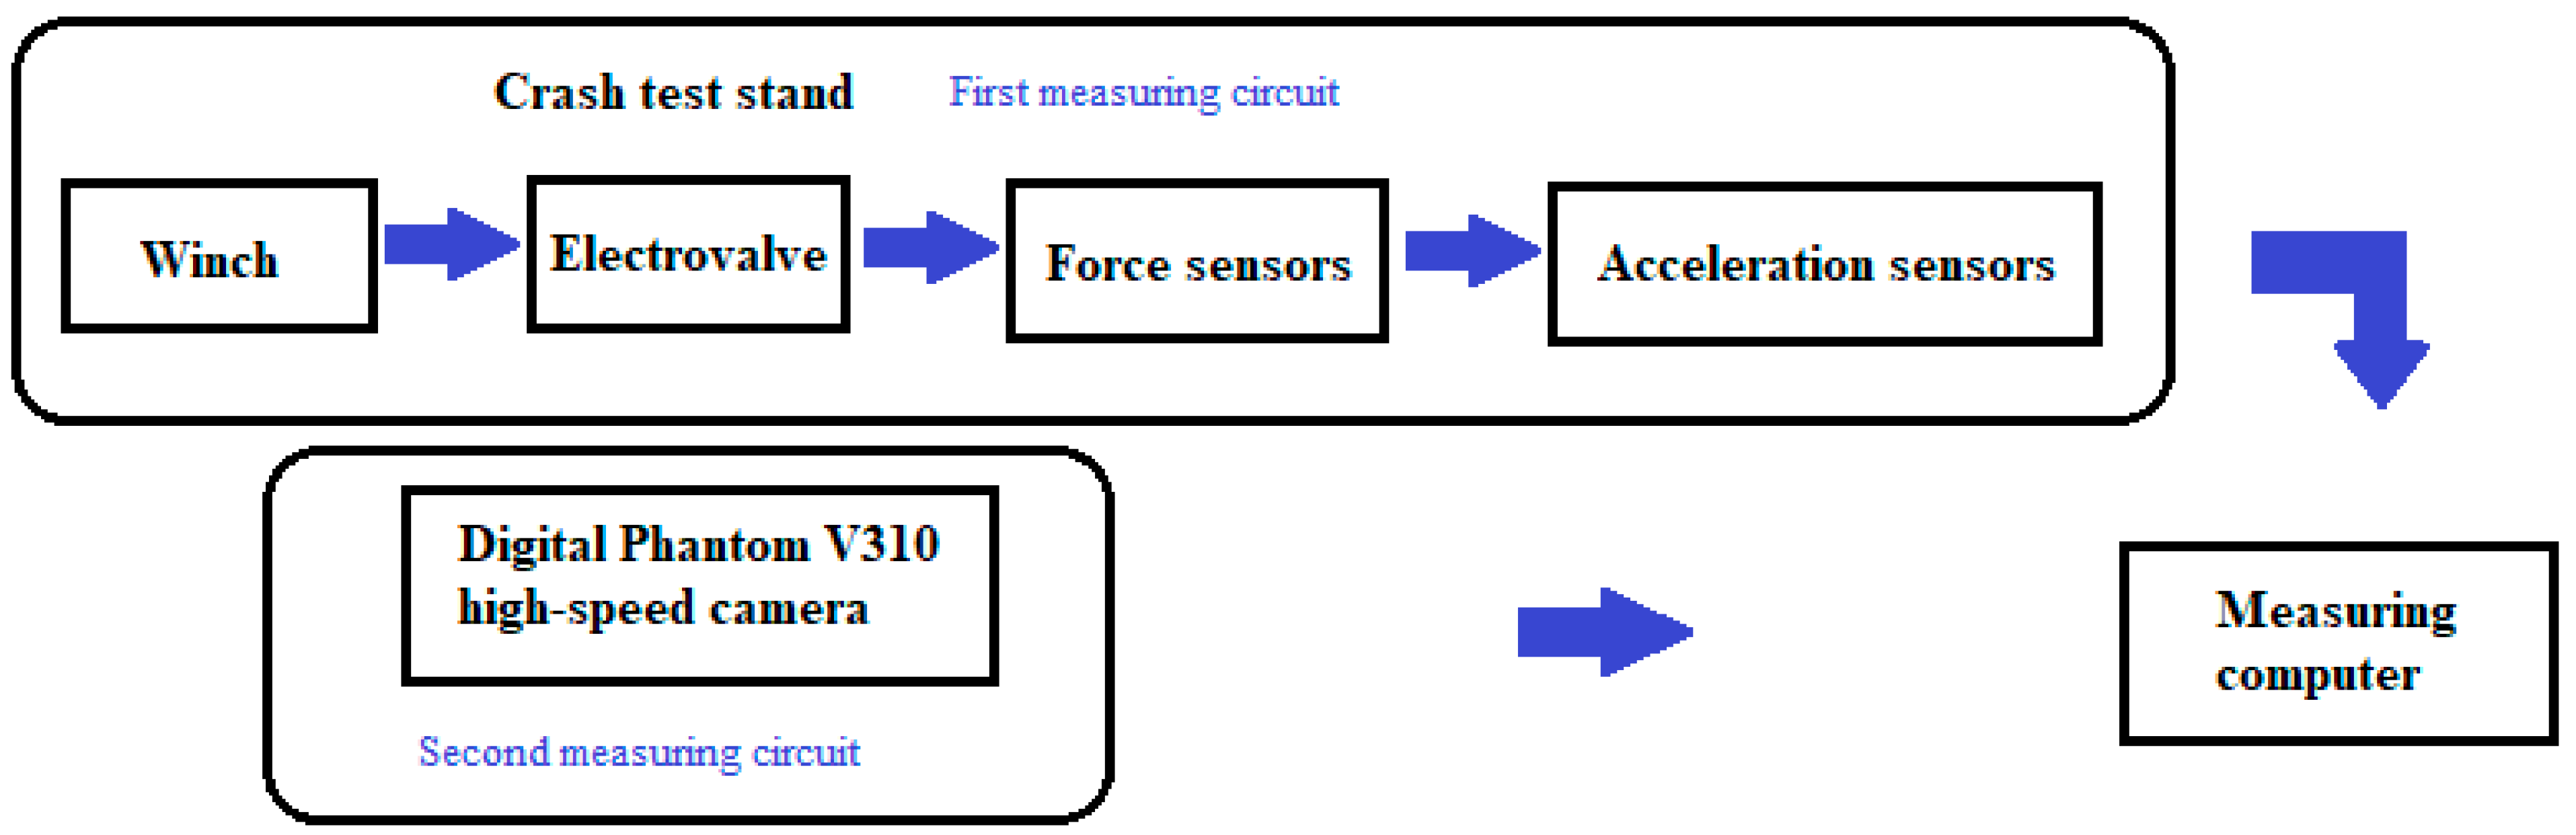
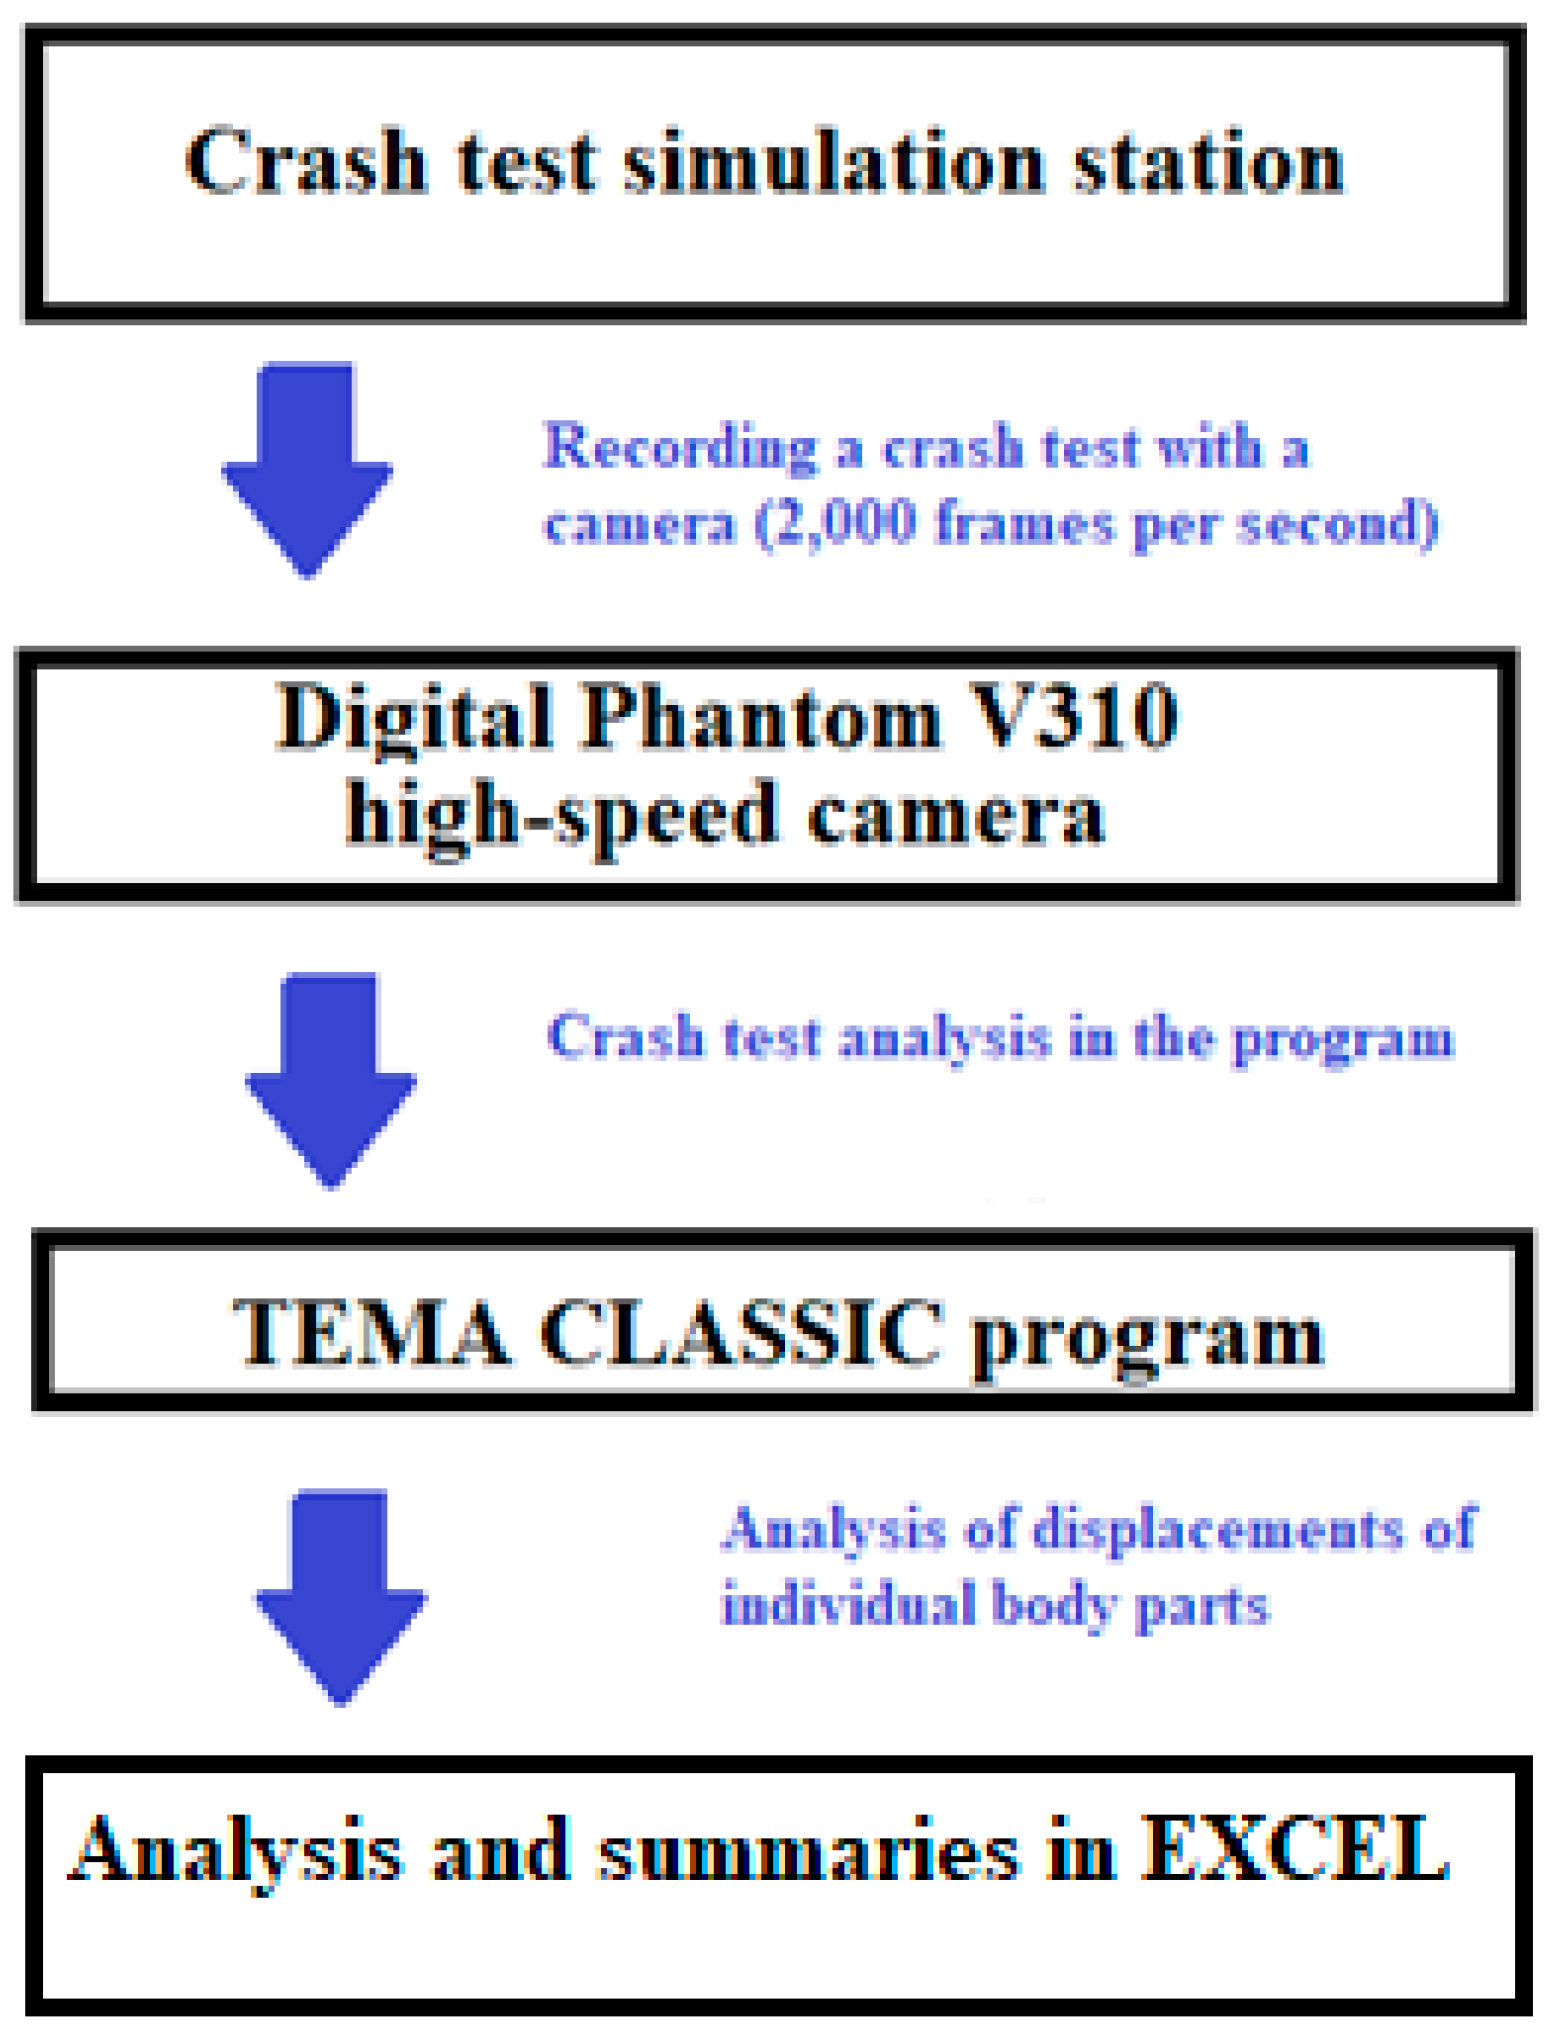
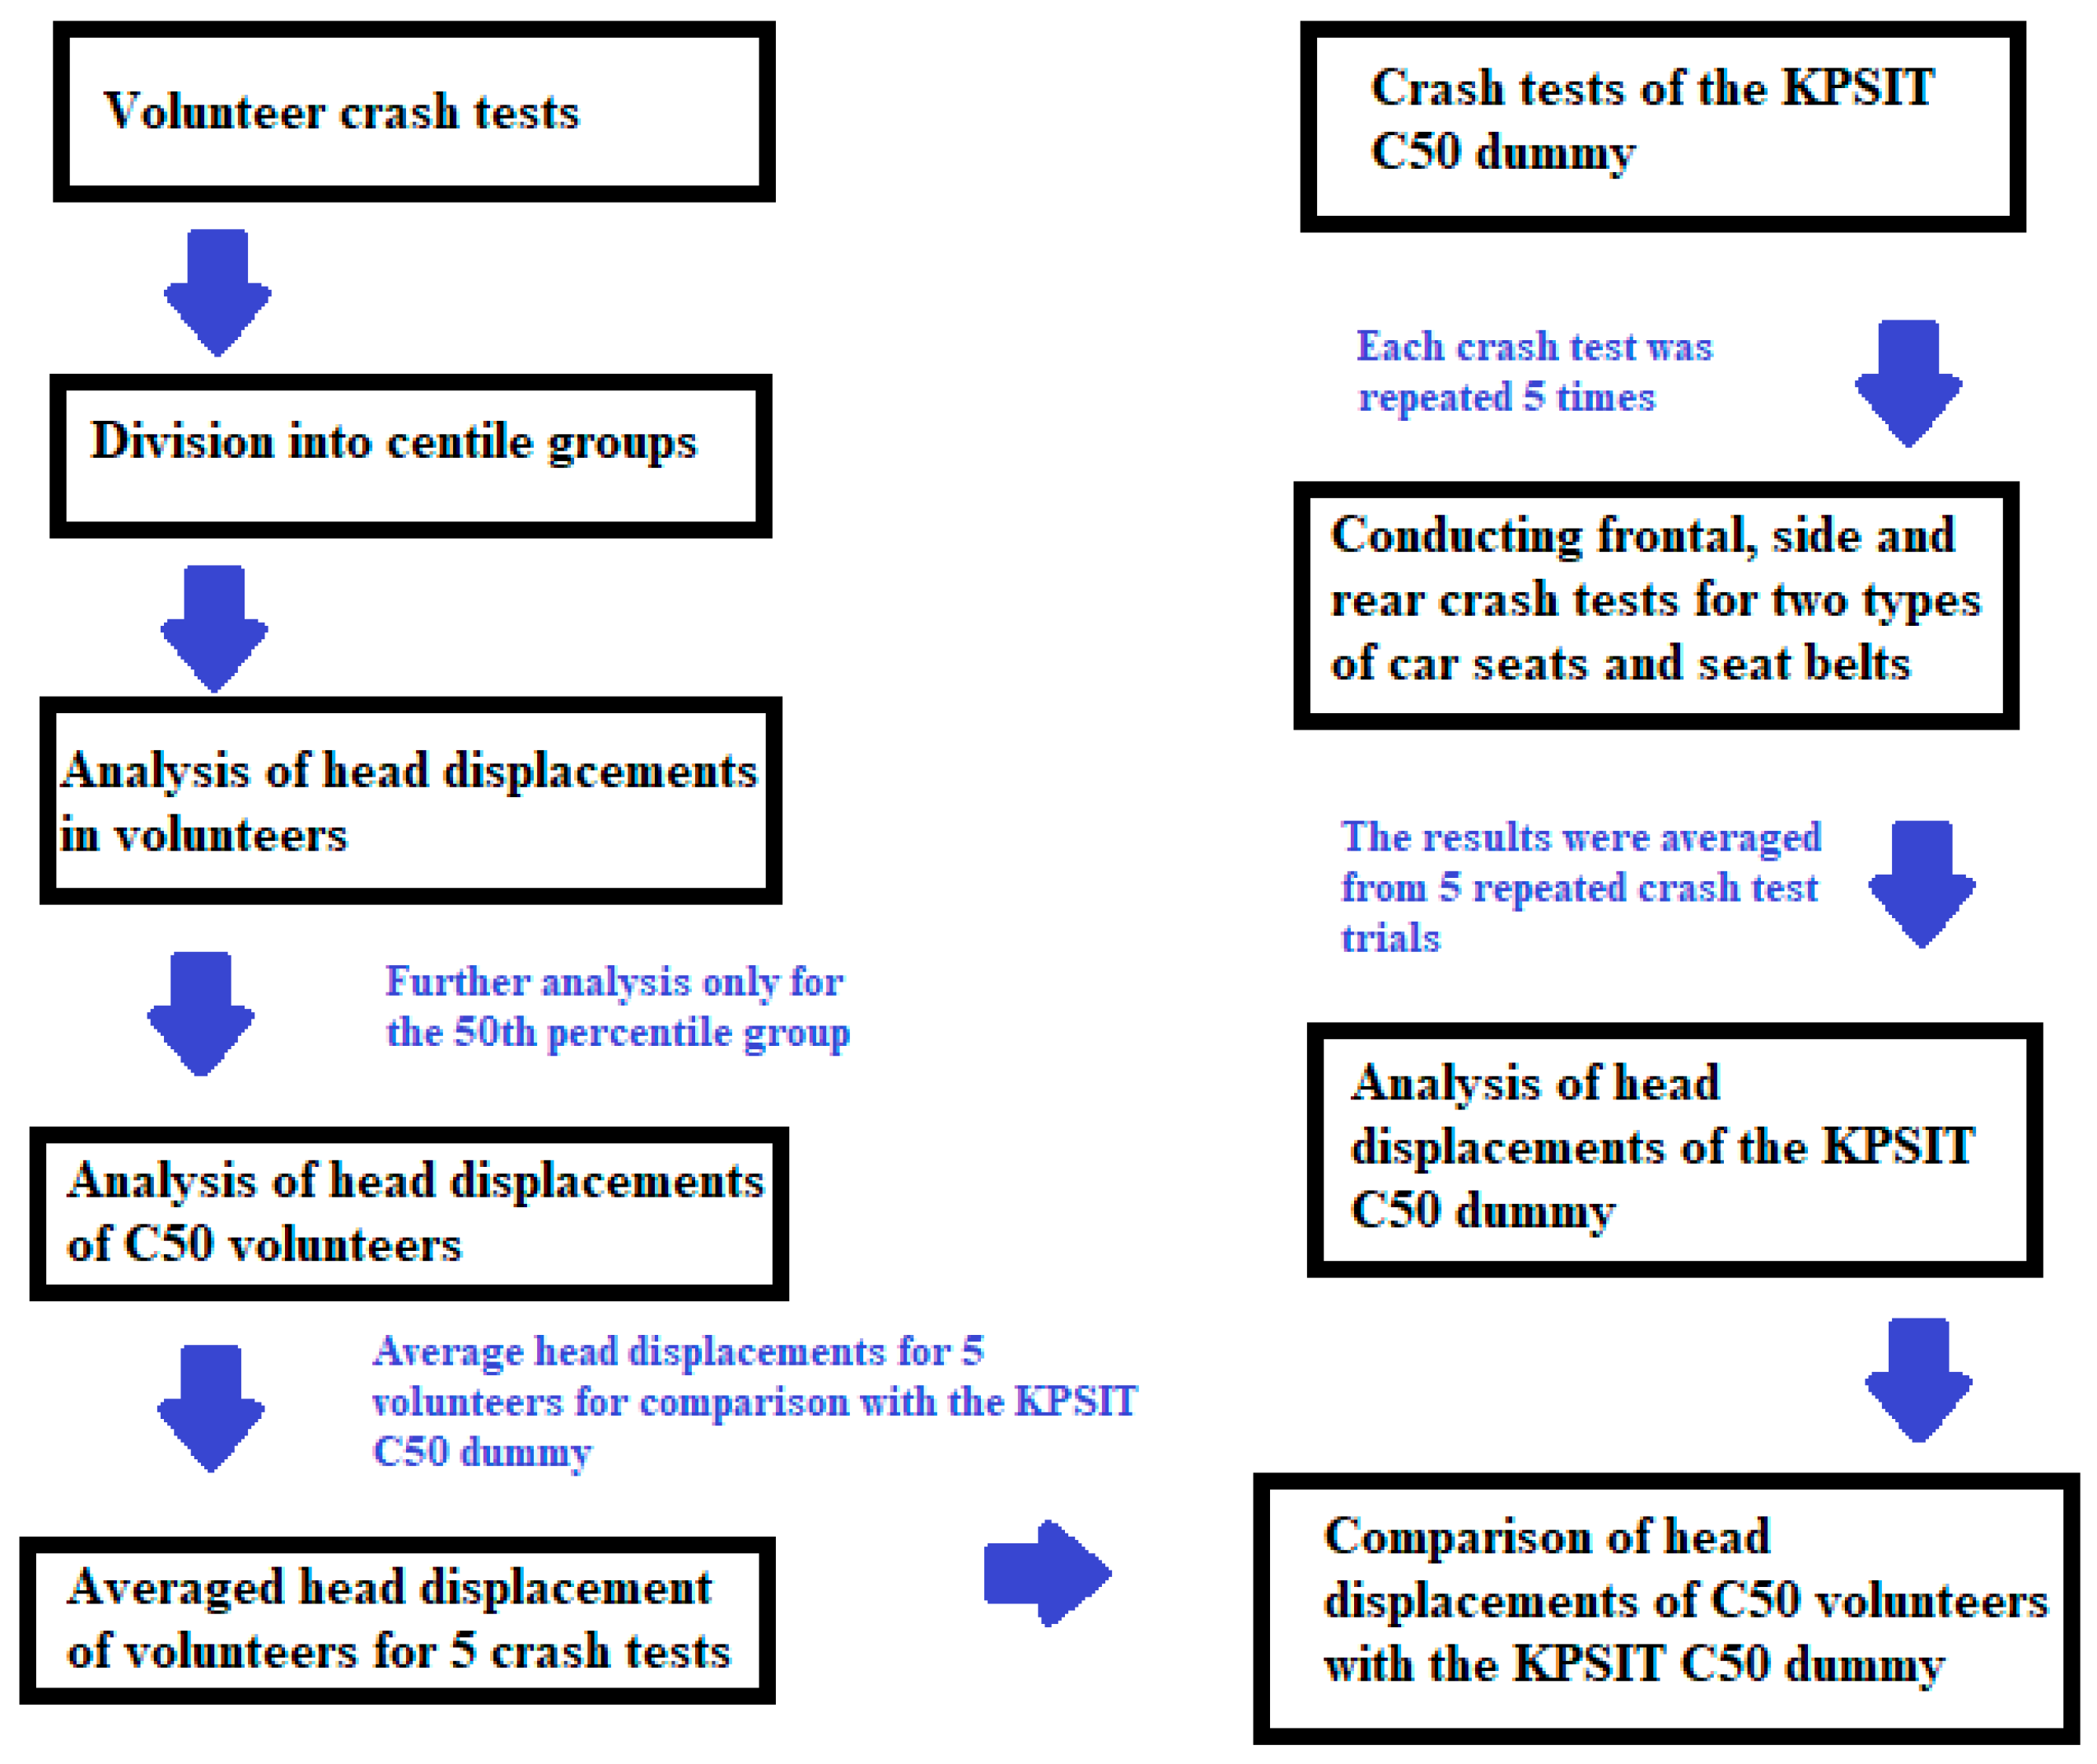
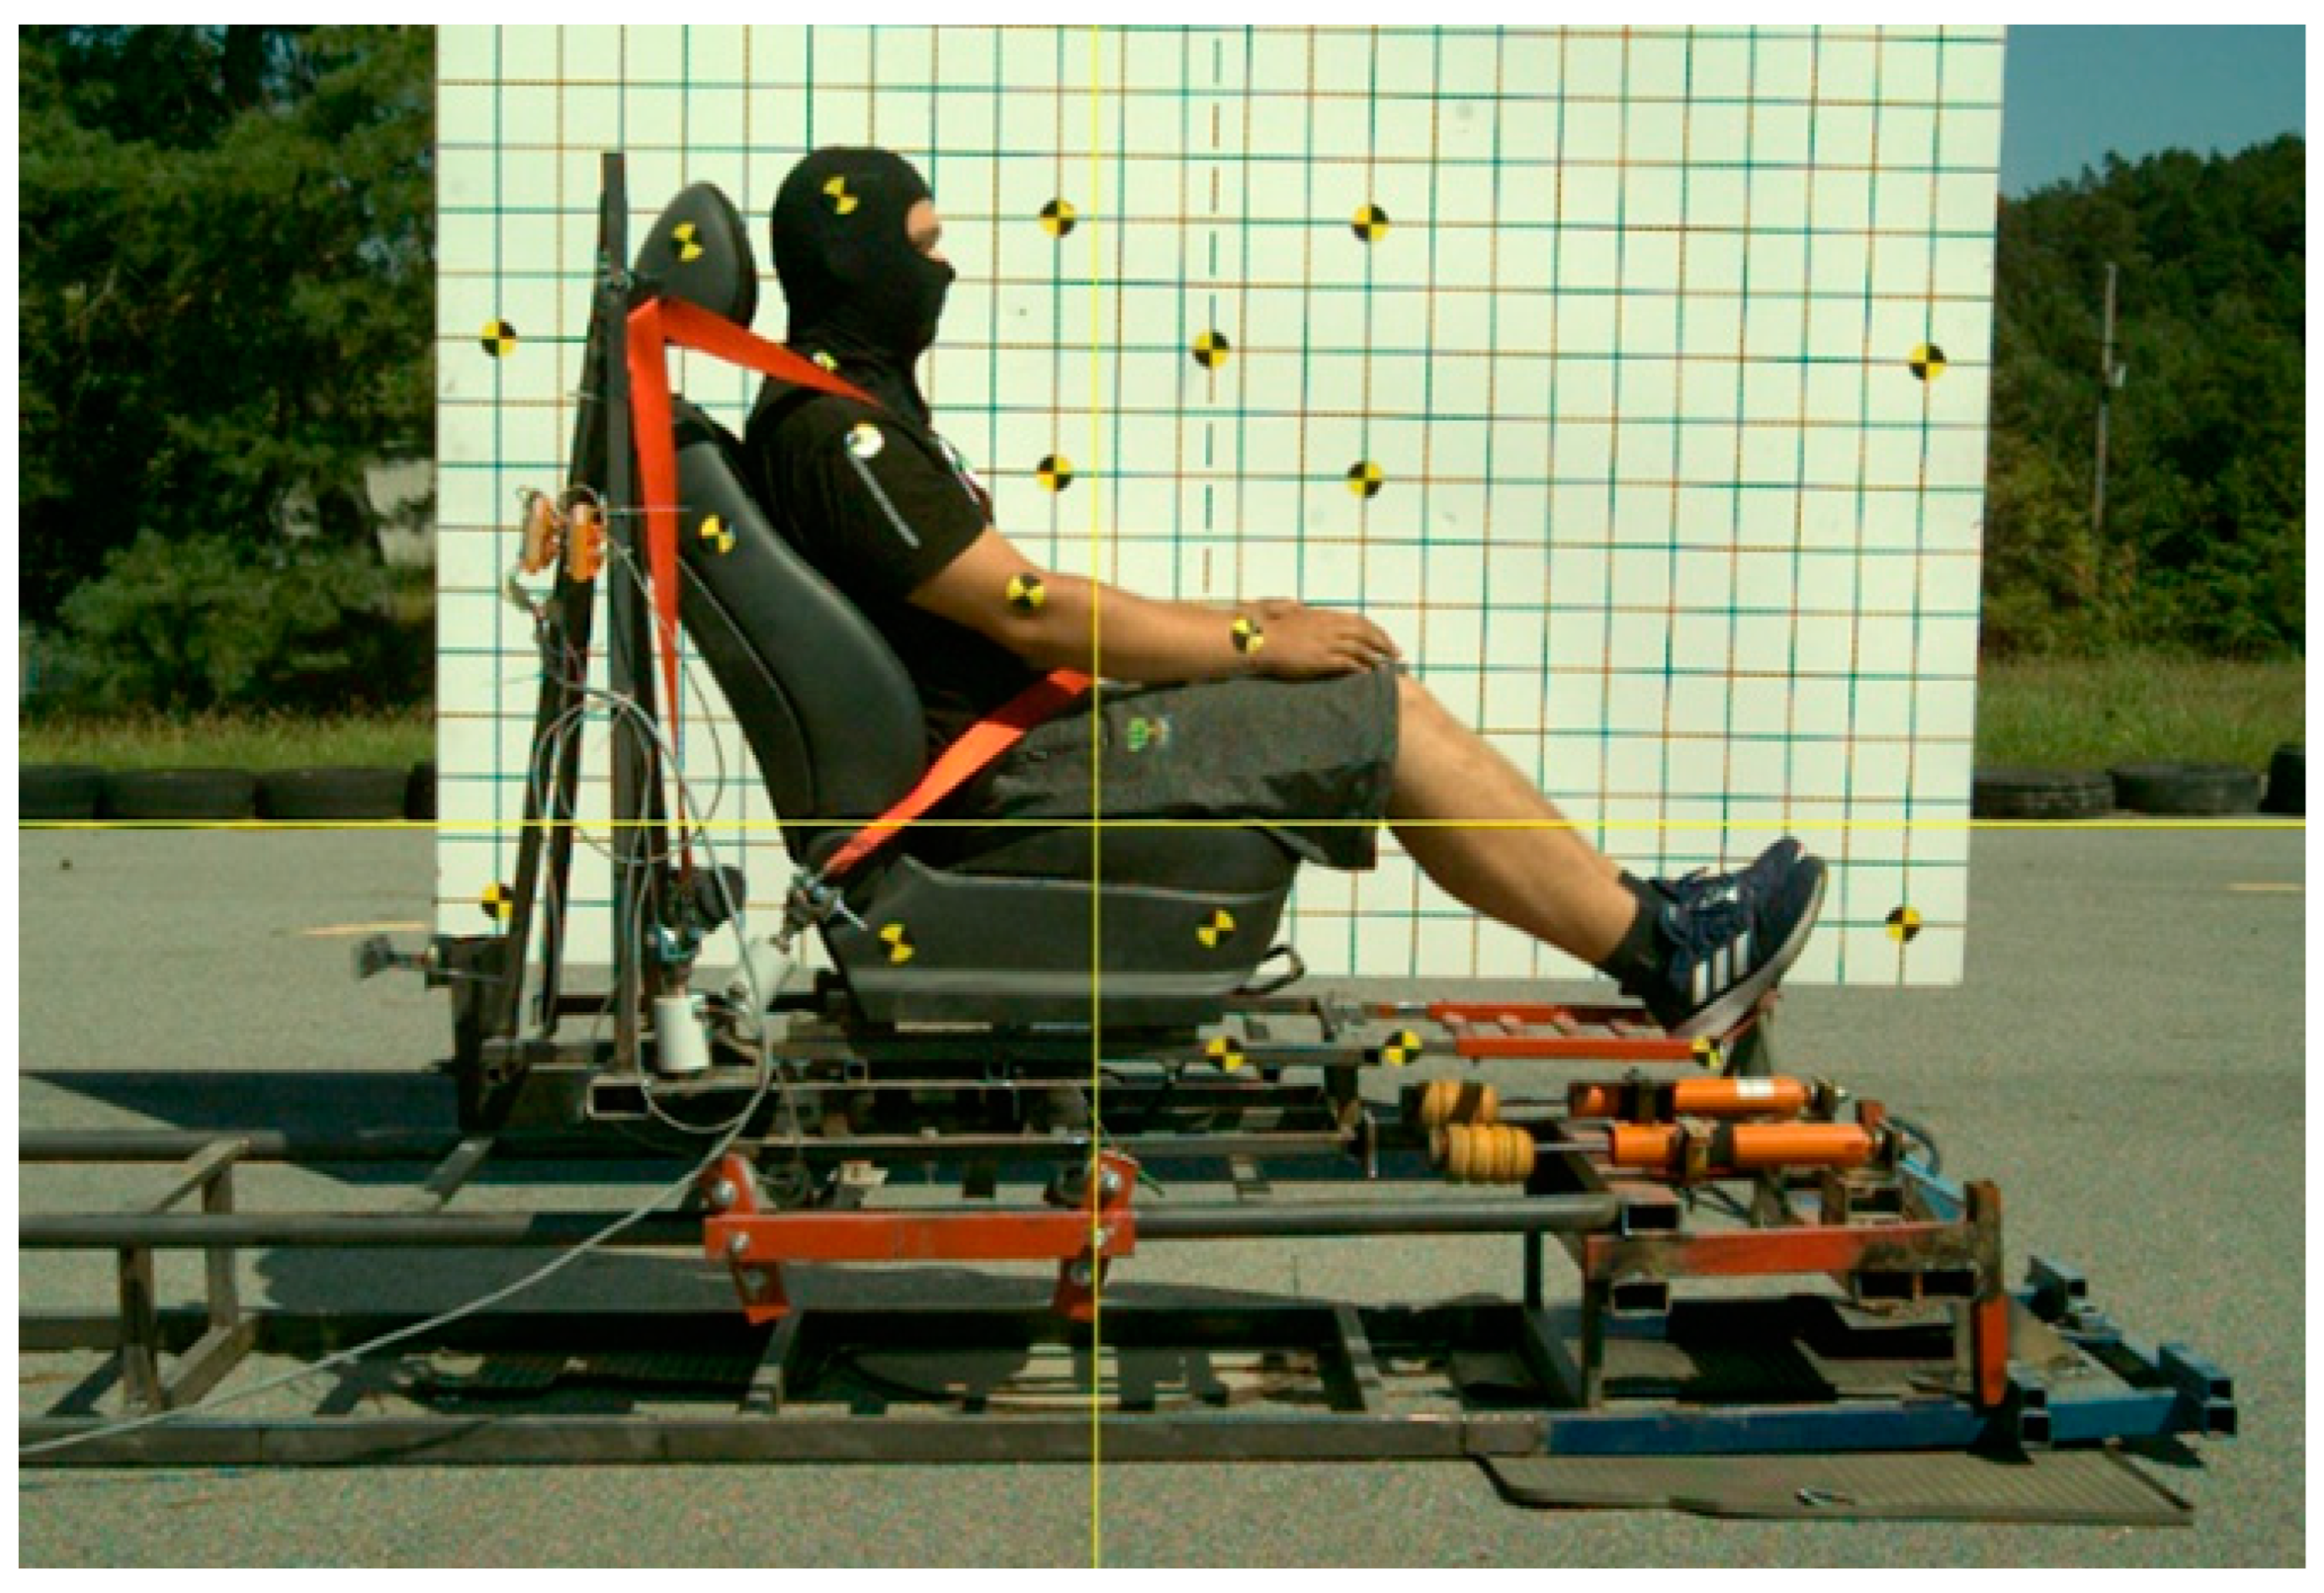
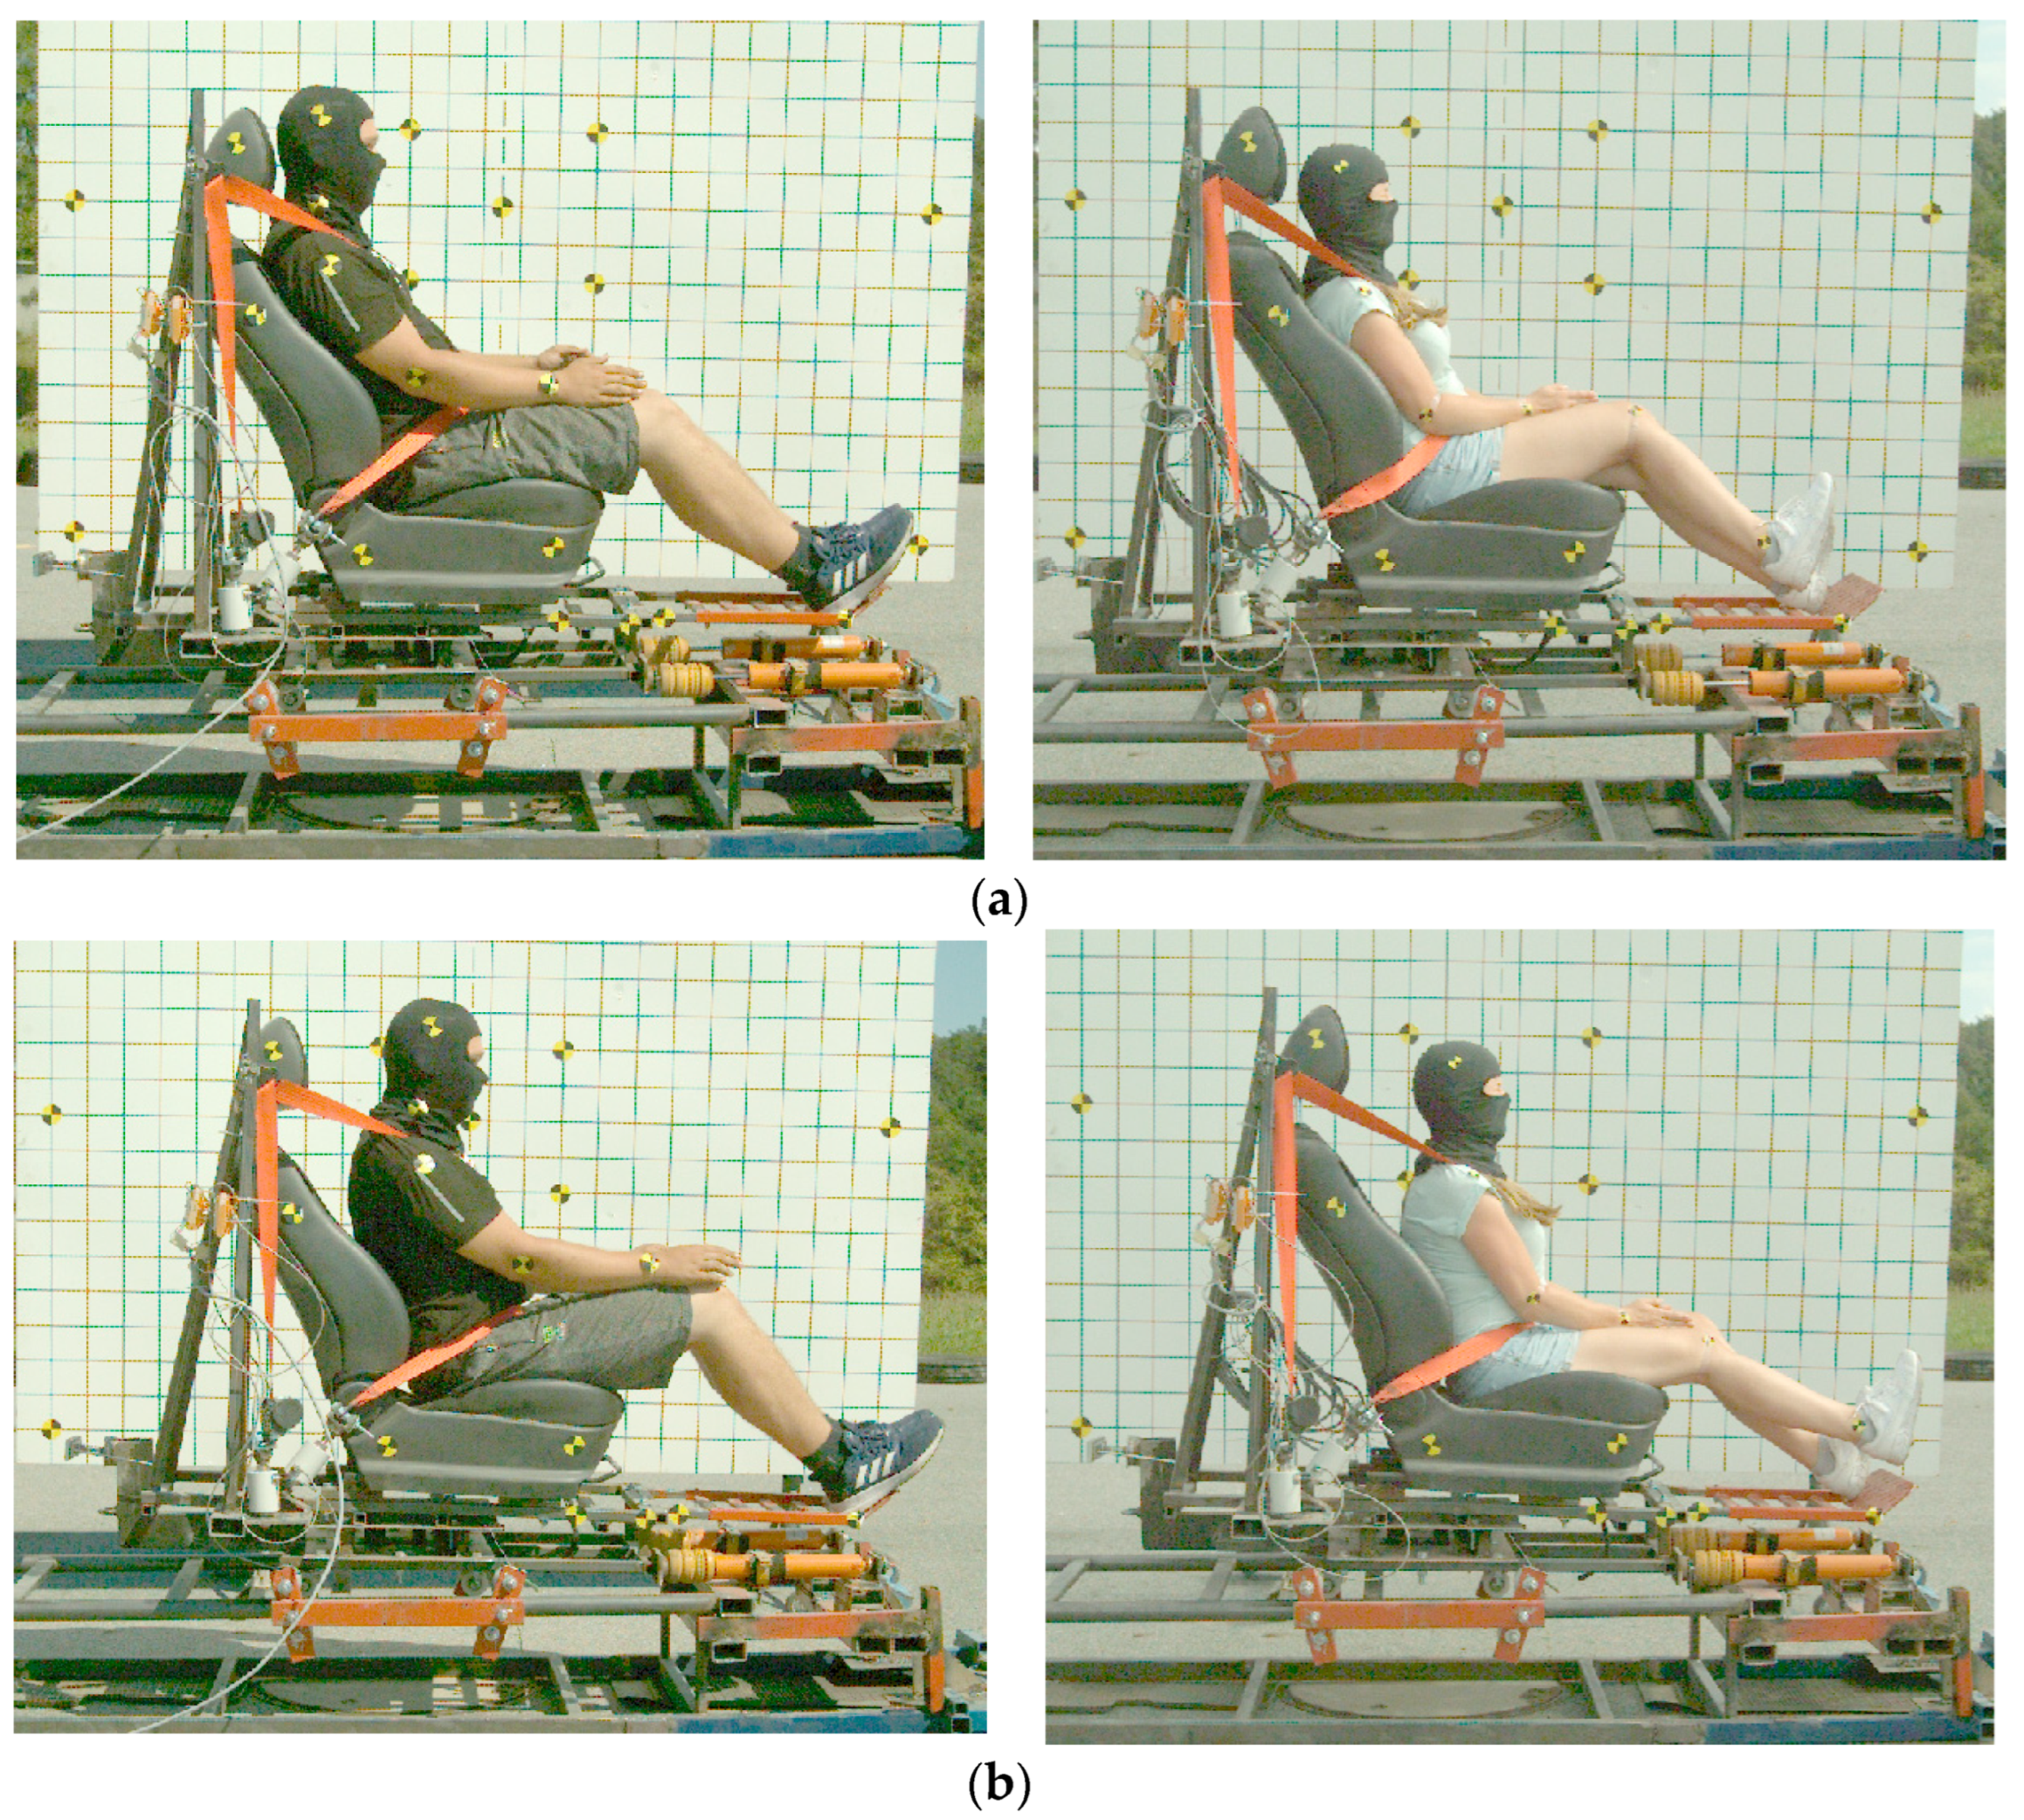
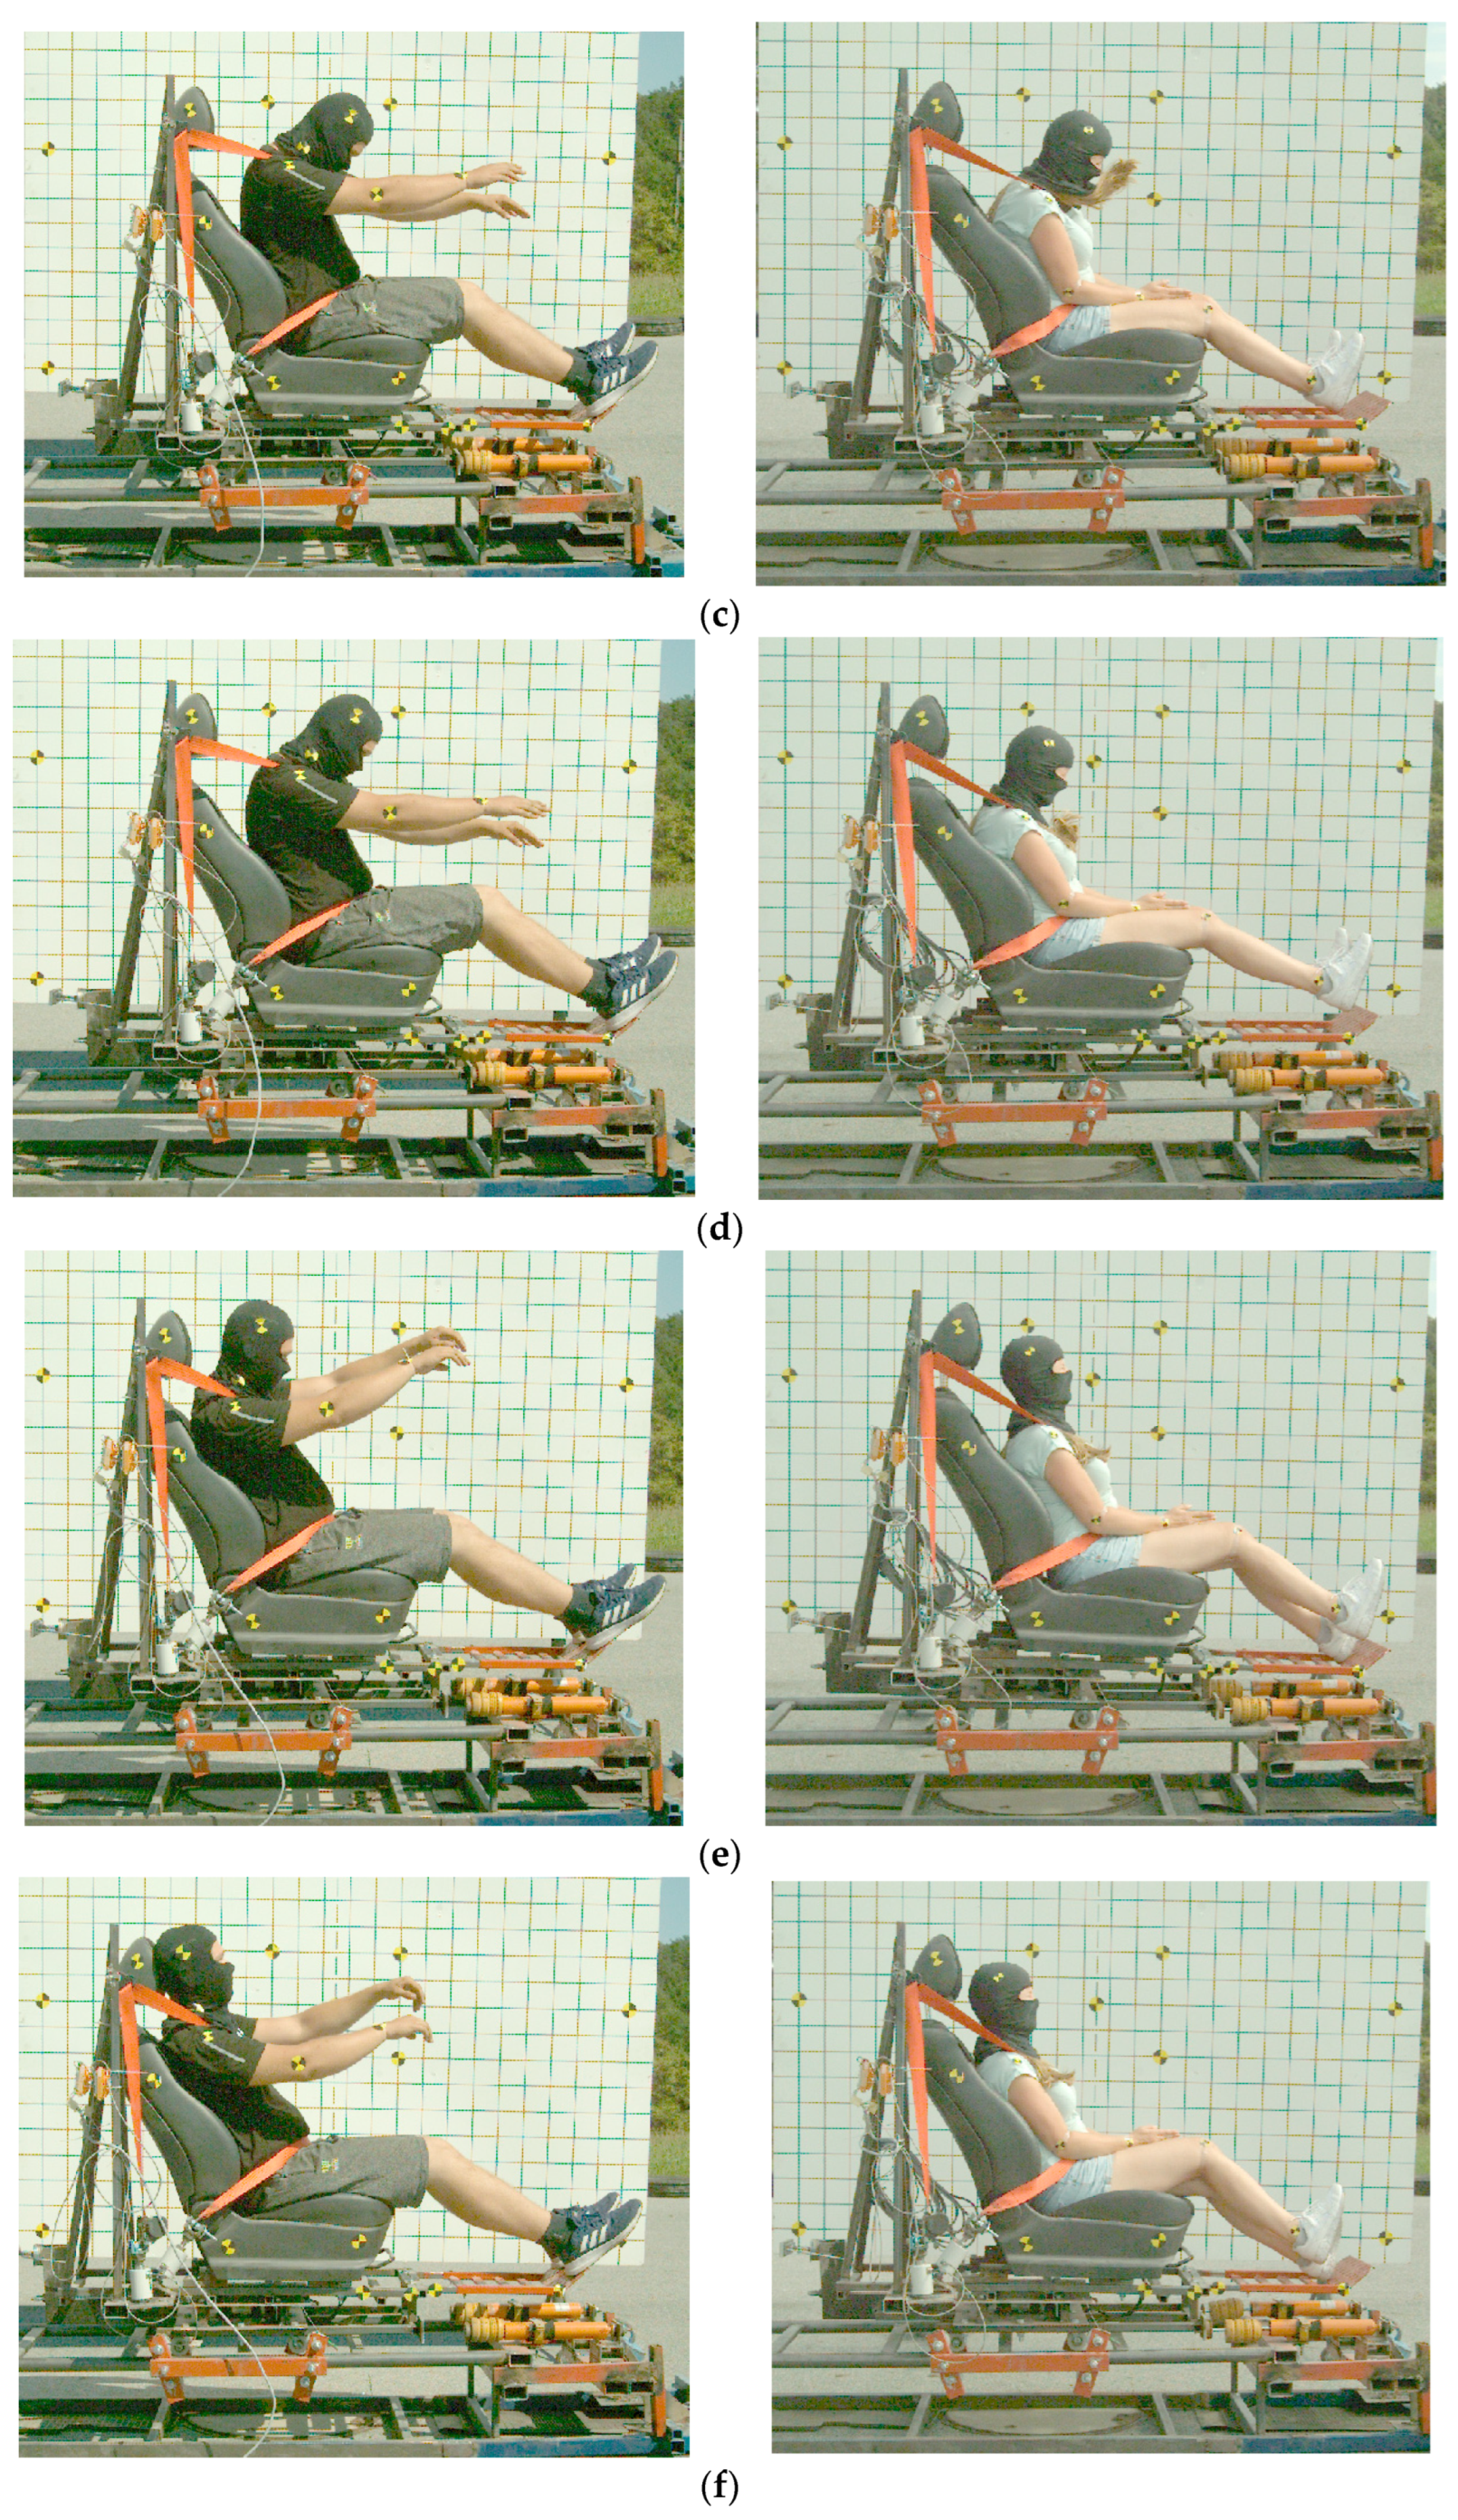
3.1. Implementation of Experimental Research

The research was carried out to allow comparison of the displacement of the volunteers’ head with the KPSIT C50 dummy during a crash test at a speed of 20 km/h. This was followed by crash tests of the KPSIT C50 dummy. Figure 2 shows a diagram of a test rig designed to simulate low-speed crash tests. The test stand consists of two independent measuring circuits. The first circuit makes it possible to record the acceleration of the test rig platform and to measure the force in the seat belts. The second measurement allows you to record a crash test with the high-speed Digital Phantom V310 camera.
The diagram of the measurement data recording is shown in Figure 3. Crash tests of the volunteers and the KPSIT C50 dummy were recorded at the same crash speed. The recorded crash test with the Digital Phantom V310 camera was first analyzed in the TEMA CLASSIC program. The data were then transferred to an EXCEL 2019 spreadsheet to compare the displacements of the individual body parts of the volunteers and the KPSIT C50 dummy.
A diagram of the organization of the tests is shown in Figure 4. In the first place, a study was carried out on a group of 150 volunteers. The volunteers participated in a frontal crash test at a speed of 20 km/h. Then, on the basis of 16 parameters of anthropometric dimensions, the volunteers were classified into a given percentile group. Then, an analysis of the displacement of the head of the volunteers was carried out, taking into account the division into percentile groups. In the next step, the head displacements of five C50 volunteers were averaged for comparison with the KPSIT C50 dummy. The crash tests of the KPSIT C50 dummy included a full set of crash tests. Front, rear, and side crash tests were performed. Each crash test of the KPSIT C50 has been repeated five times to maintain the reliability and repeatability of the data. A final analysis comparing the head displacements of C50 volunteers and KPSIT C50 dummy was performed on data averaged over five samples/volunteers. In this way, the same test procedure was maintained for both the dummy and the volunteers.

3.2. Assumptions of Experimental Research

Important from the point of view of the correctness of experimental research is the repeatability of the acceleration pulse of the cart for the given collision speed. The recorded decelerations of the bogie in a series of five crash tests performed expressed in m/s2 were very similar. The average truck deceleration for the five crash tests was 69.68 m/s2. The acceleration of the trolley together with the vehicle seat for the crash test of volunteers and the KPSIT C50 dummy is shown in Figure 5. The obtained results confirm the correctness of the measuring equipment and the repeatability of the platform acceleration results during each crash test. The resulting differences may be due to the fact that the mass of volunteers varied depending on the subject, while the mass of the dummy was constant each time.
During the experimental research, two types of vehicle seats were used. Vehicle seats are depicted in Figure 6 and Figure 7. During the crash tests, the seat backrest angle relative to the ground was 110°. In the article, four-point and five-point belts for the bucket sport seat and three-point and four-point belts for the passenger vehicle seat were used.
For the safety of the volunteers taking part in the crash test, the test procedure did not take into account the change of the type of seat belts and the change of the vehicle seat model. Crash tests with the KPSIT C50 dummy required changing the vehicle seat and seat belts. For this purpose, crash tests of the KPSIT C50 dummy were carried out using a passenger vehicle seat with a standard seat belt in order to compare the displacements of individual parts of the dummy’s body with those of volunteers. In addition, a series of crash tests were carried out with the bucket sports seat, which was equipped with four-point and five-point seat belts. The aim of the study was to determine the differences in the head displacement of the KPSIT C50 dummy during a crash test at a speed of 20 km/h. The sports bucket seat is significantly different in design from standard passenger vehicle seats. First of all, it is better adapted to the human posture, which provides greater stability while riding. In addition, the four-point and five-point seat belts reduce the possibility of moving the human body sideways and stabilize the human posture while driving.

3.3. Objectives of Experimental Research

Experimental studies were carried out in order to obtain answers to the working hypotheses. Two working hypotheses were formulated in the article:
  • The gender of the volunteers does not affect the head displacement during the low-speed crash test of 20 km/h.
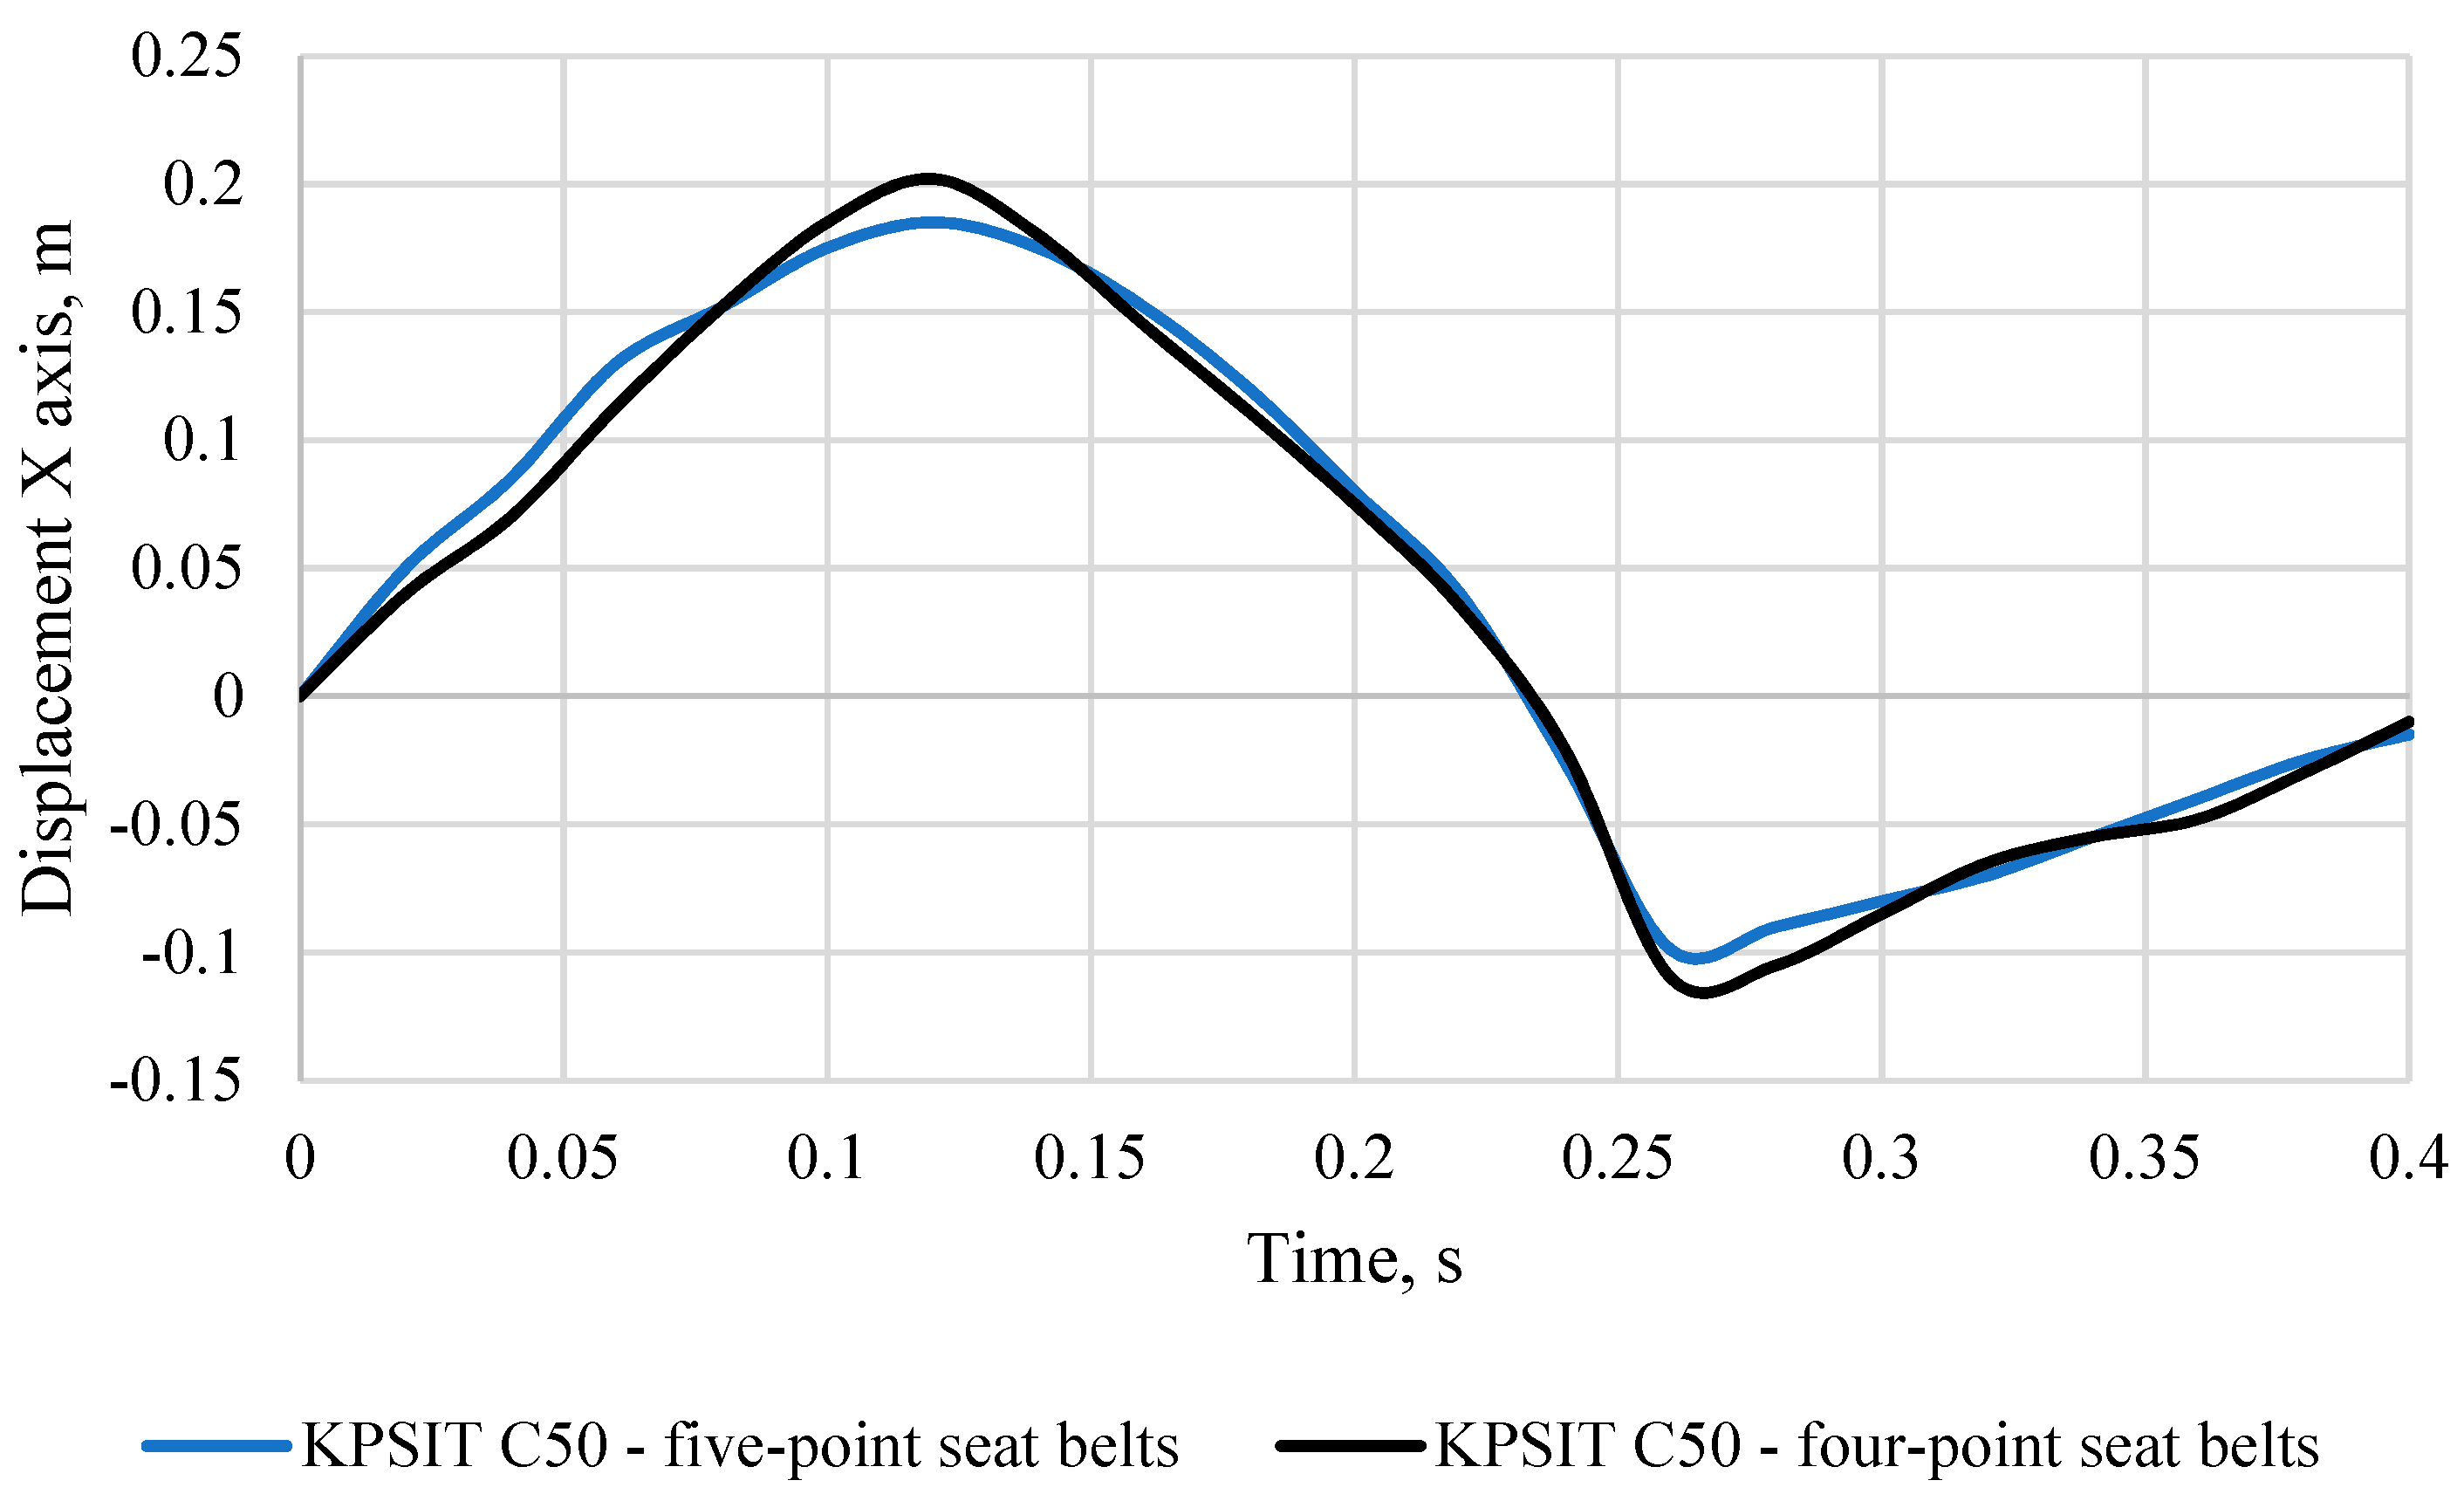
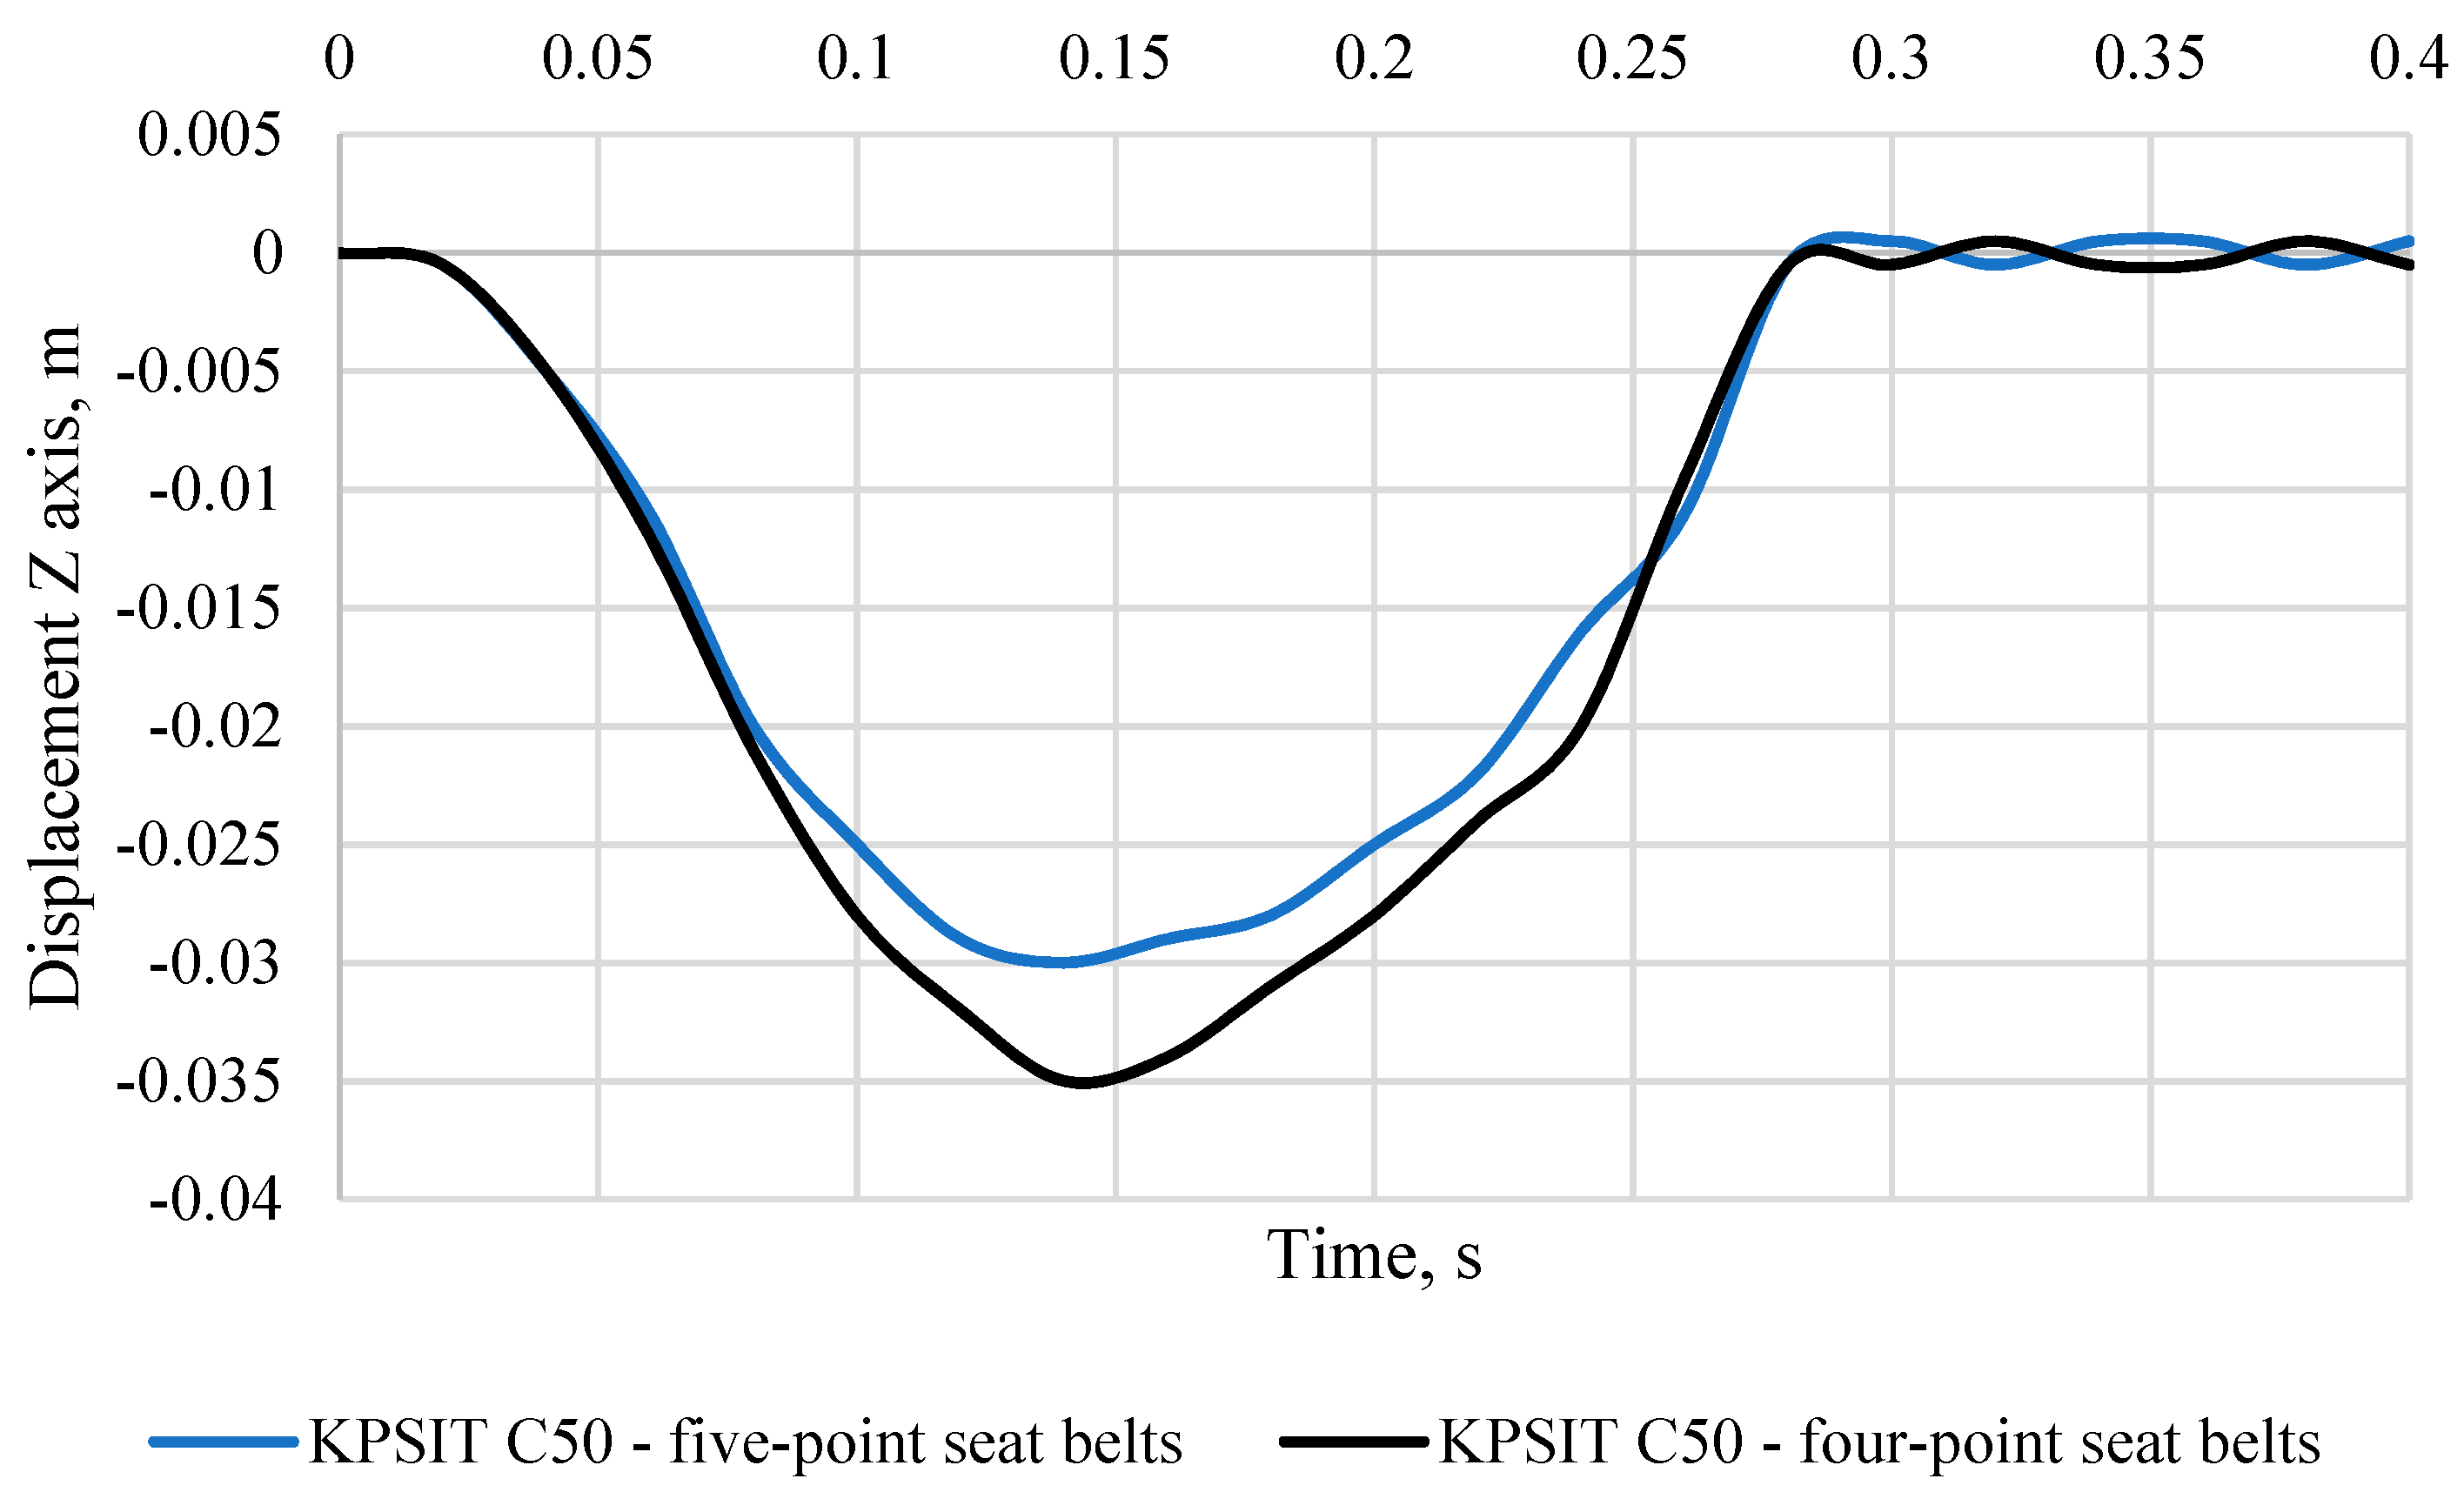
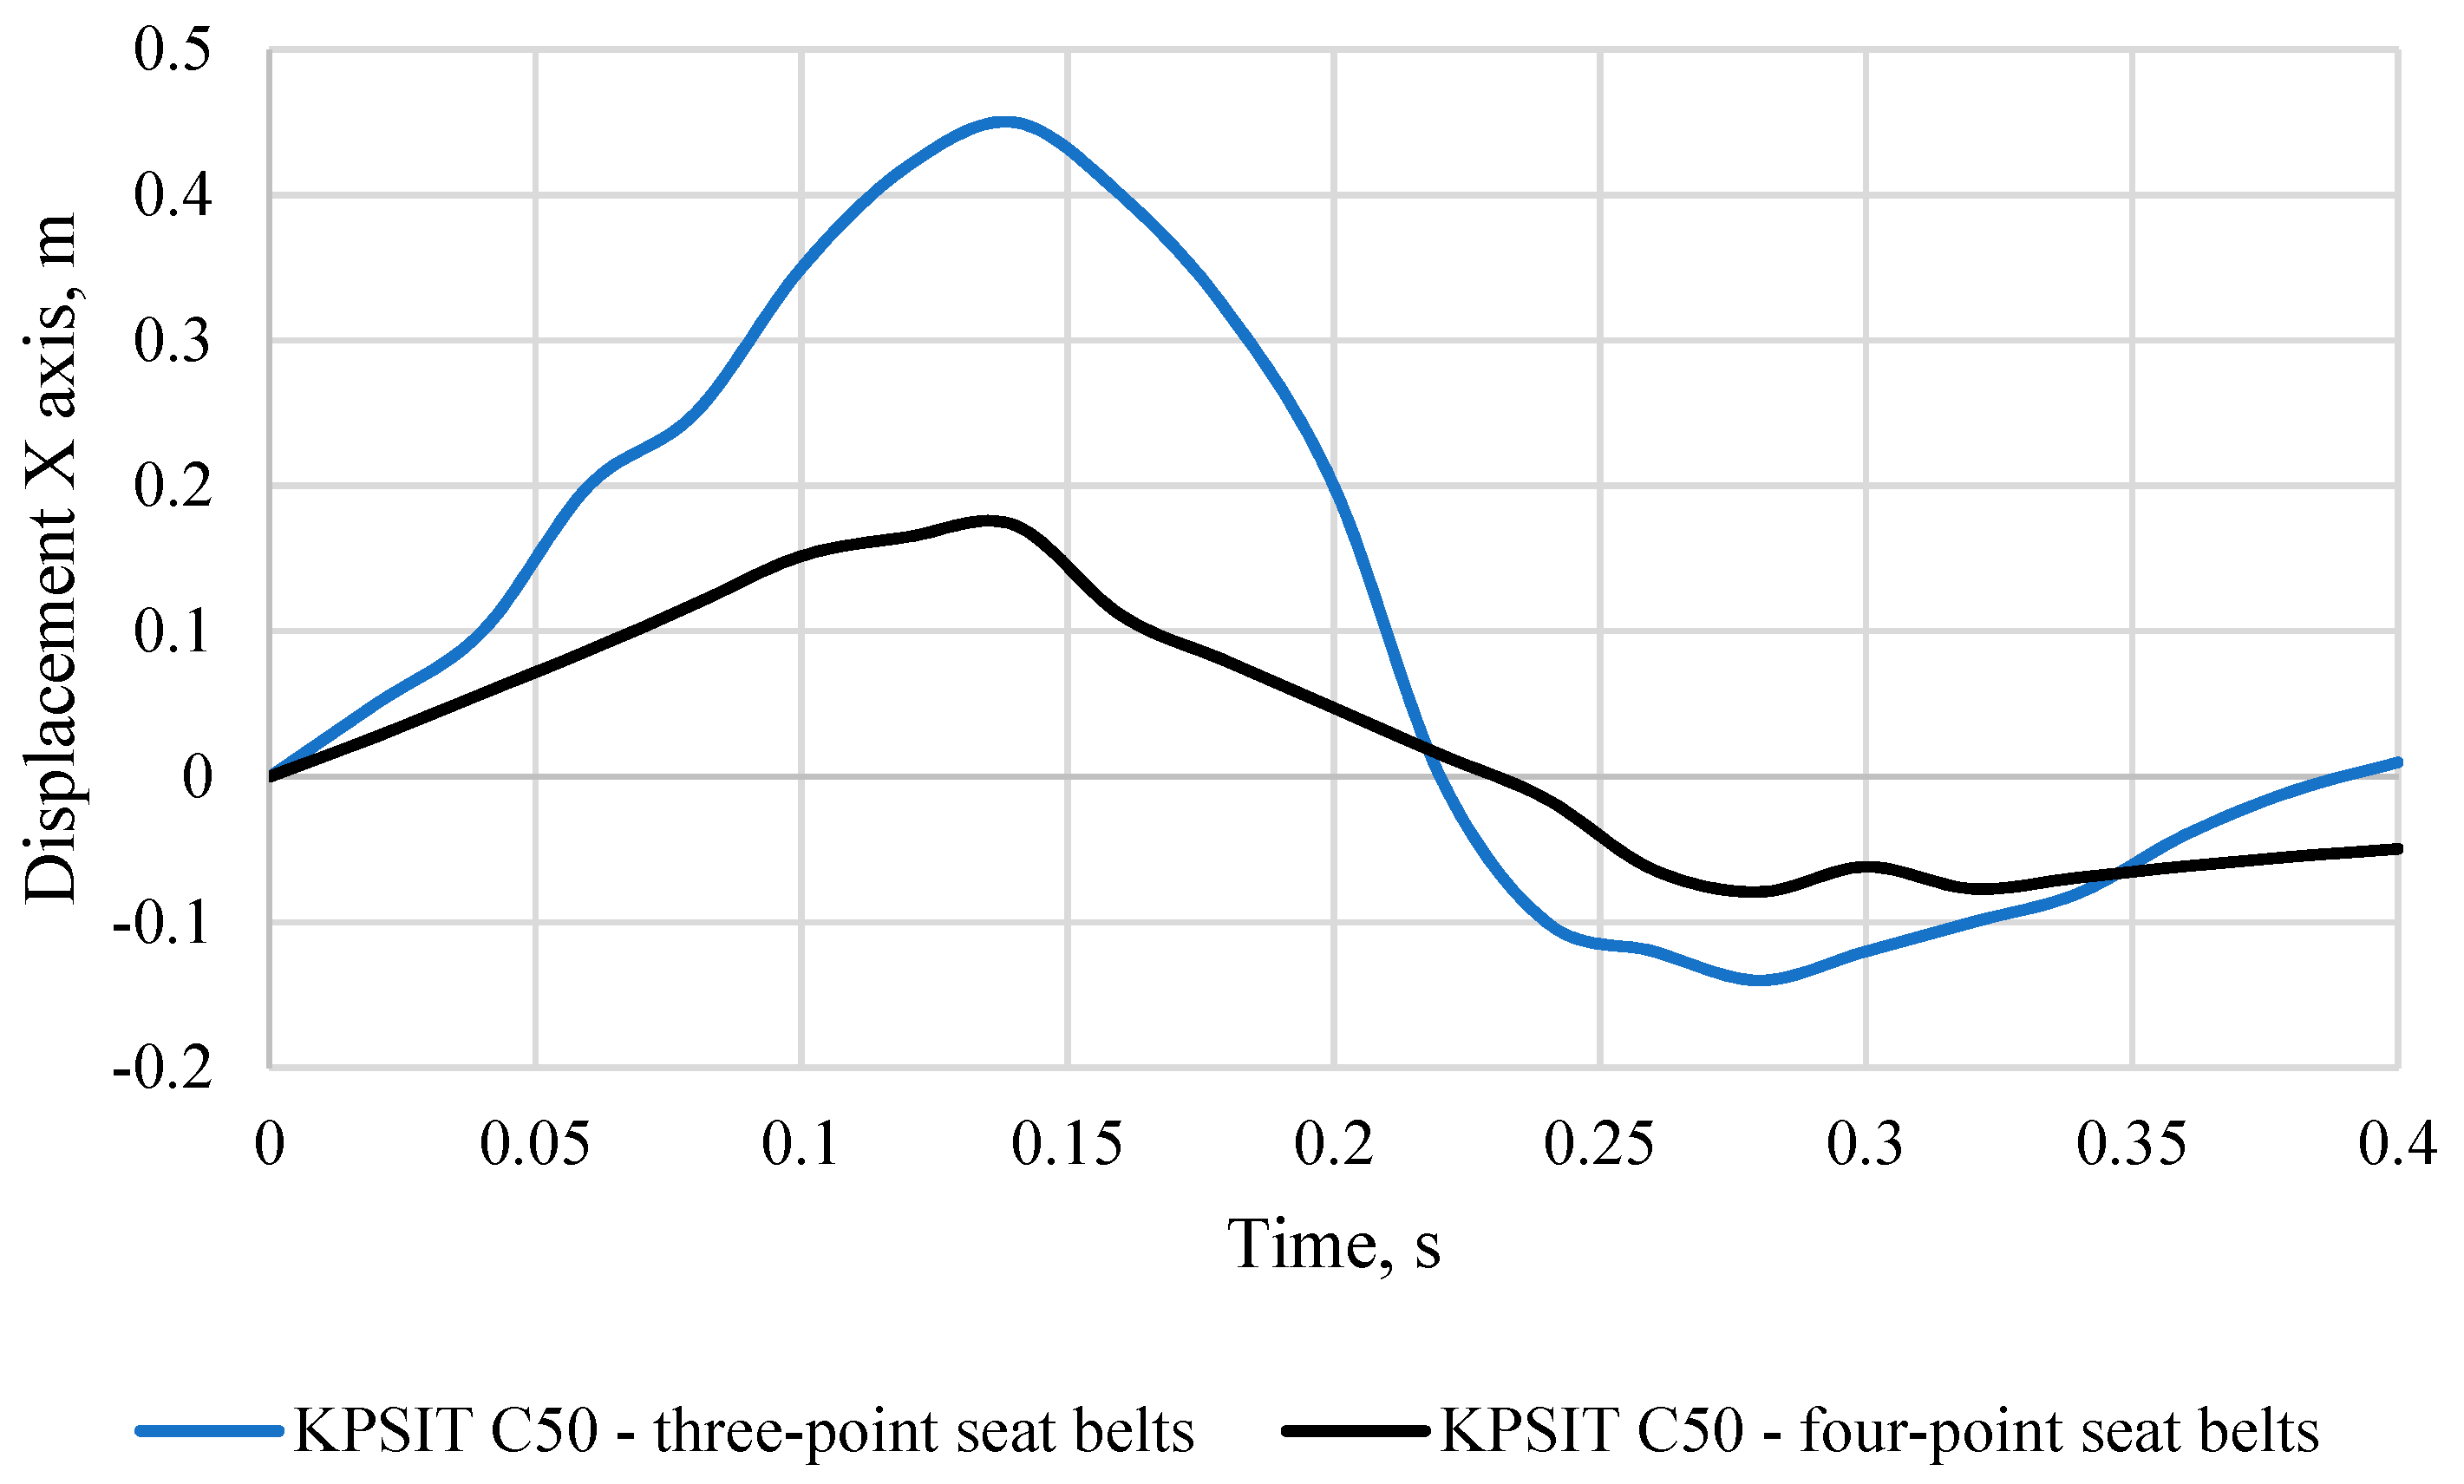
  • Four-point or five-point belts reduce head movement of the KPSIT C50 dummy during a low-speed frontal collision.
The working hypotheses presented in the article will be verified on the basis of the analysis of the head trajectory of volunteers and the KPSIT C50 dummy in the TEMA CLASSIC program. Limiting the movement of individual parts of the human body, especially the head, during a low-speed collision is crucial in protecting the health of the driver and passengers. Understanding the trajectory of head movement in low-speed collisions will lead to the development of standards for vehicle seat positioning that do not cause serious injury to drivers and passengers in low-speed collisions. It should be added that in this type of collision, the airbag will not be activated and improper positioning of the vehicle seat and the appropriate distance between the human body and the driver’s column may cause the driver’s head to hit the steering column or the passenger to hit the cockpit of the vehicle.

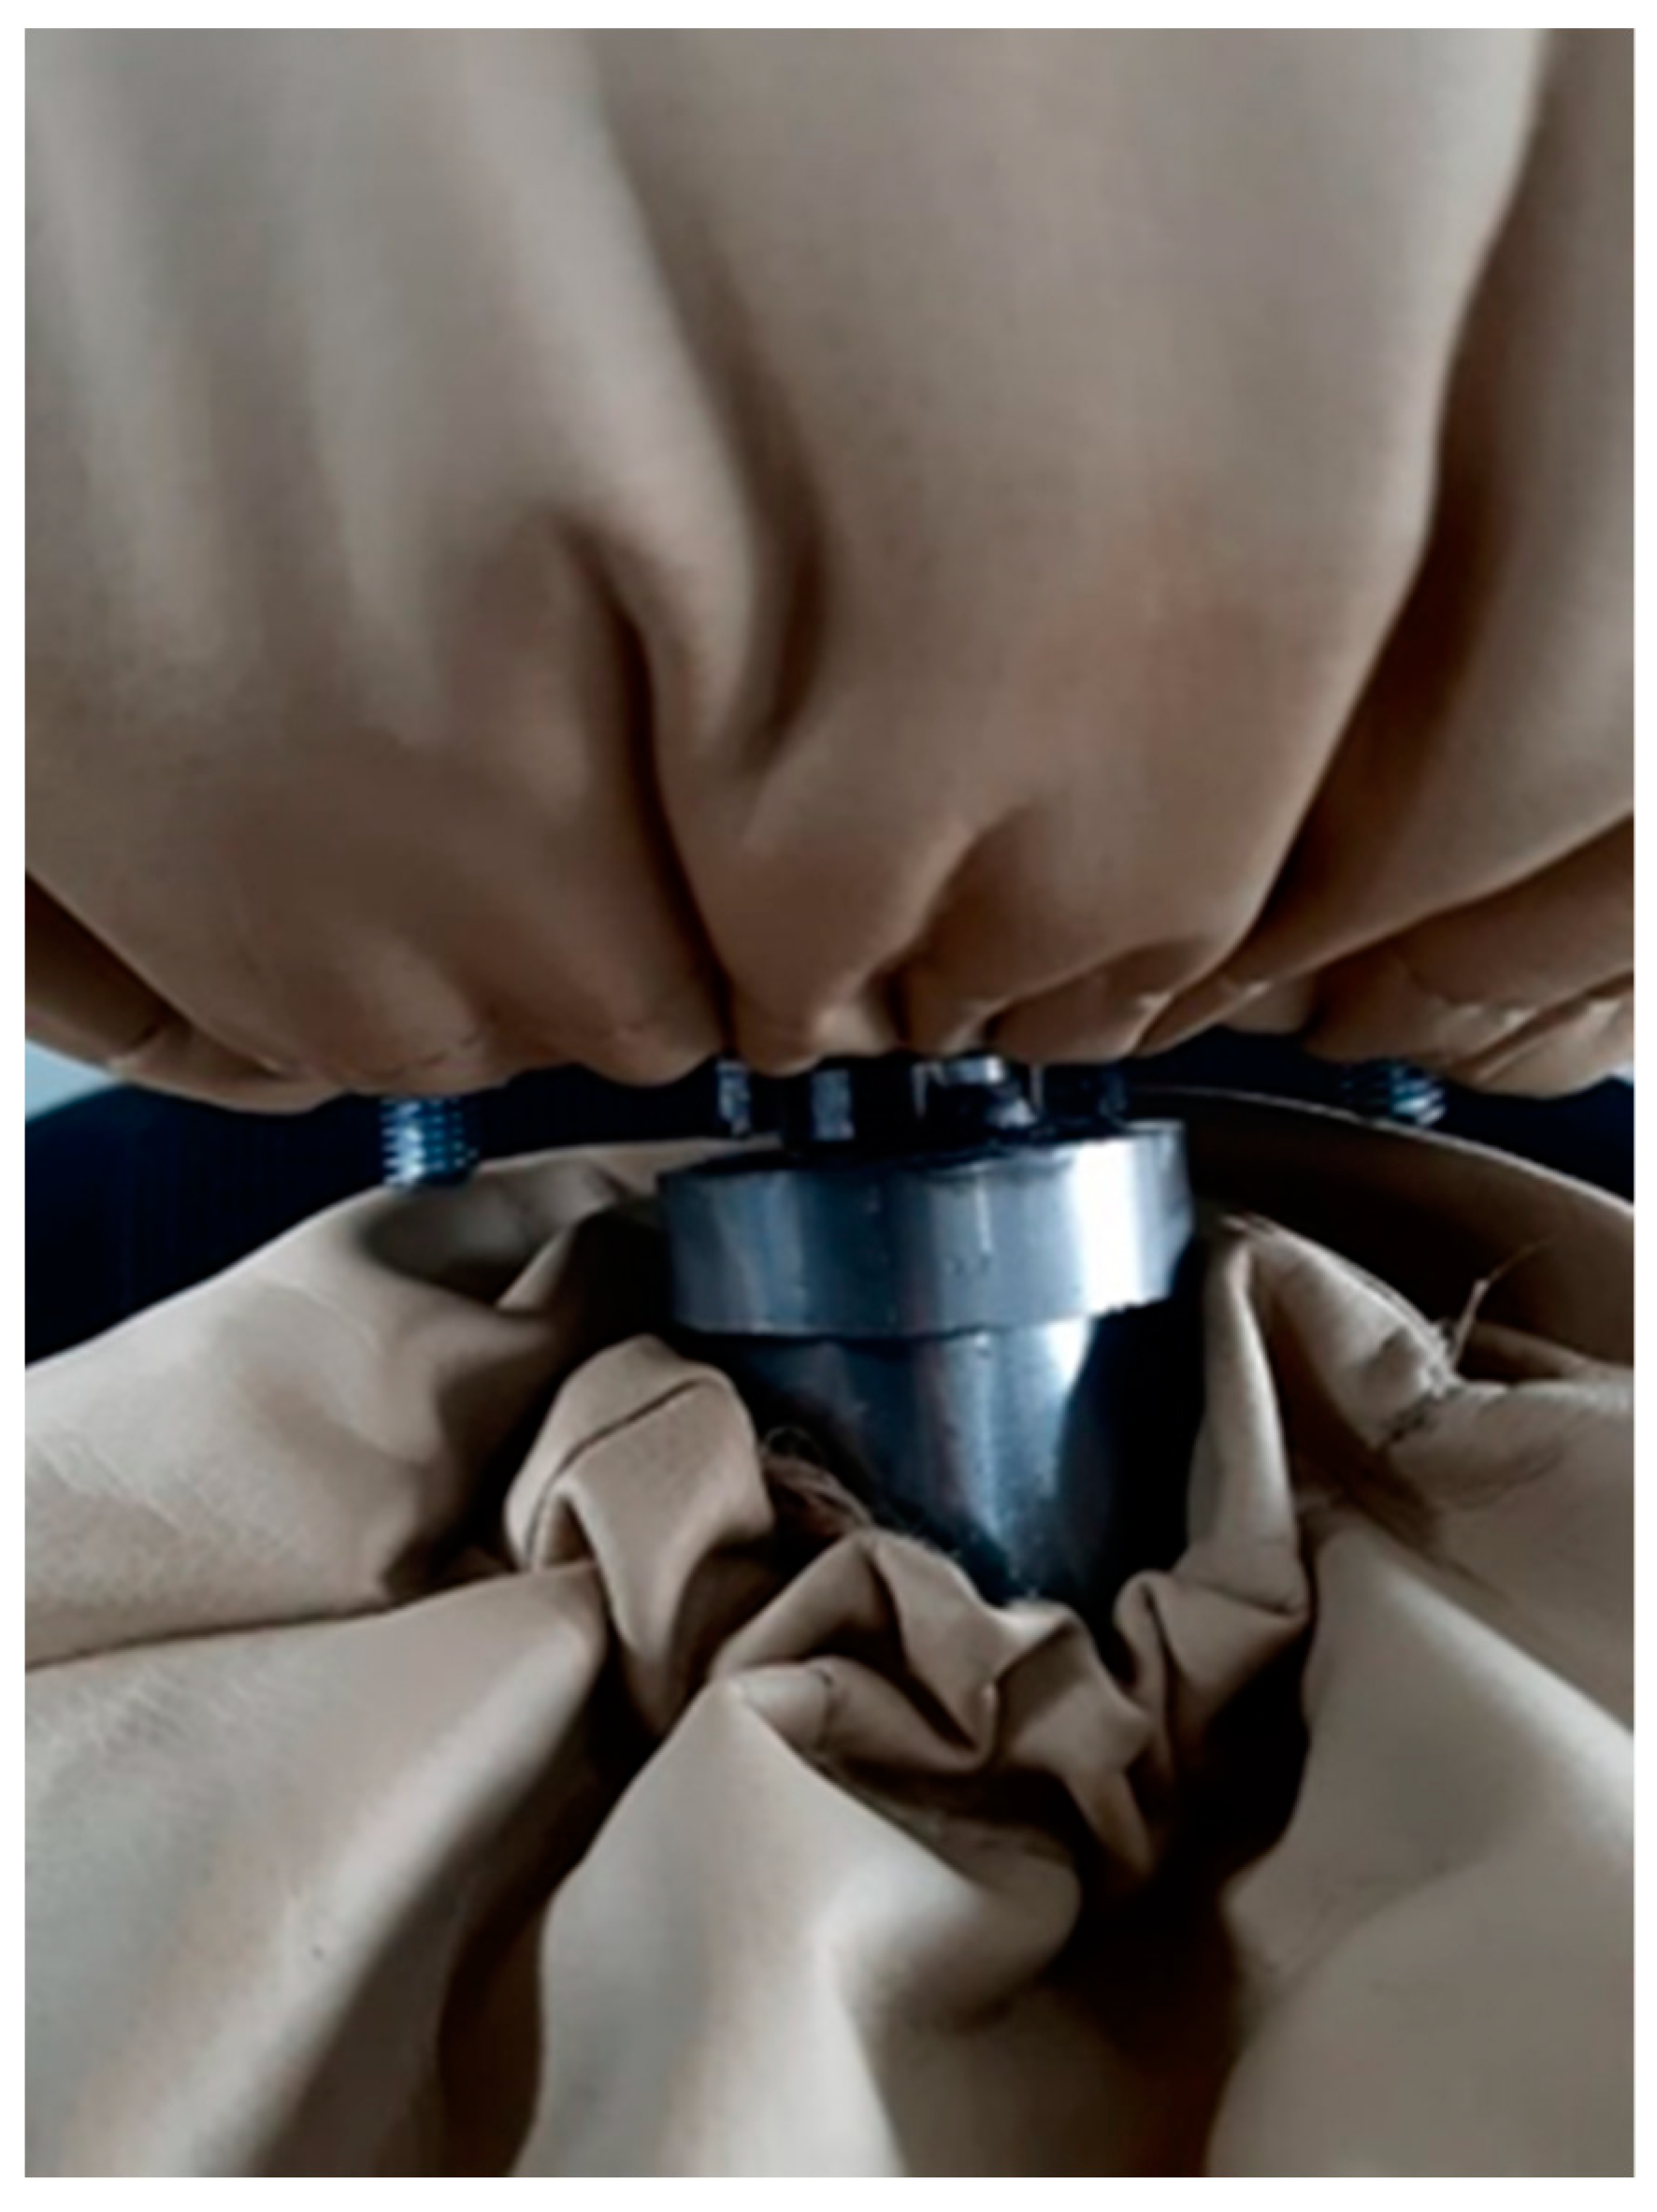
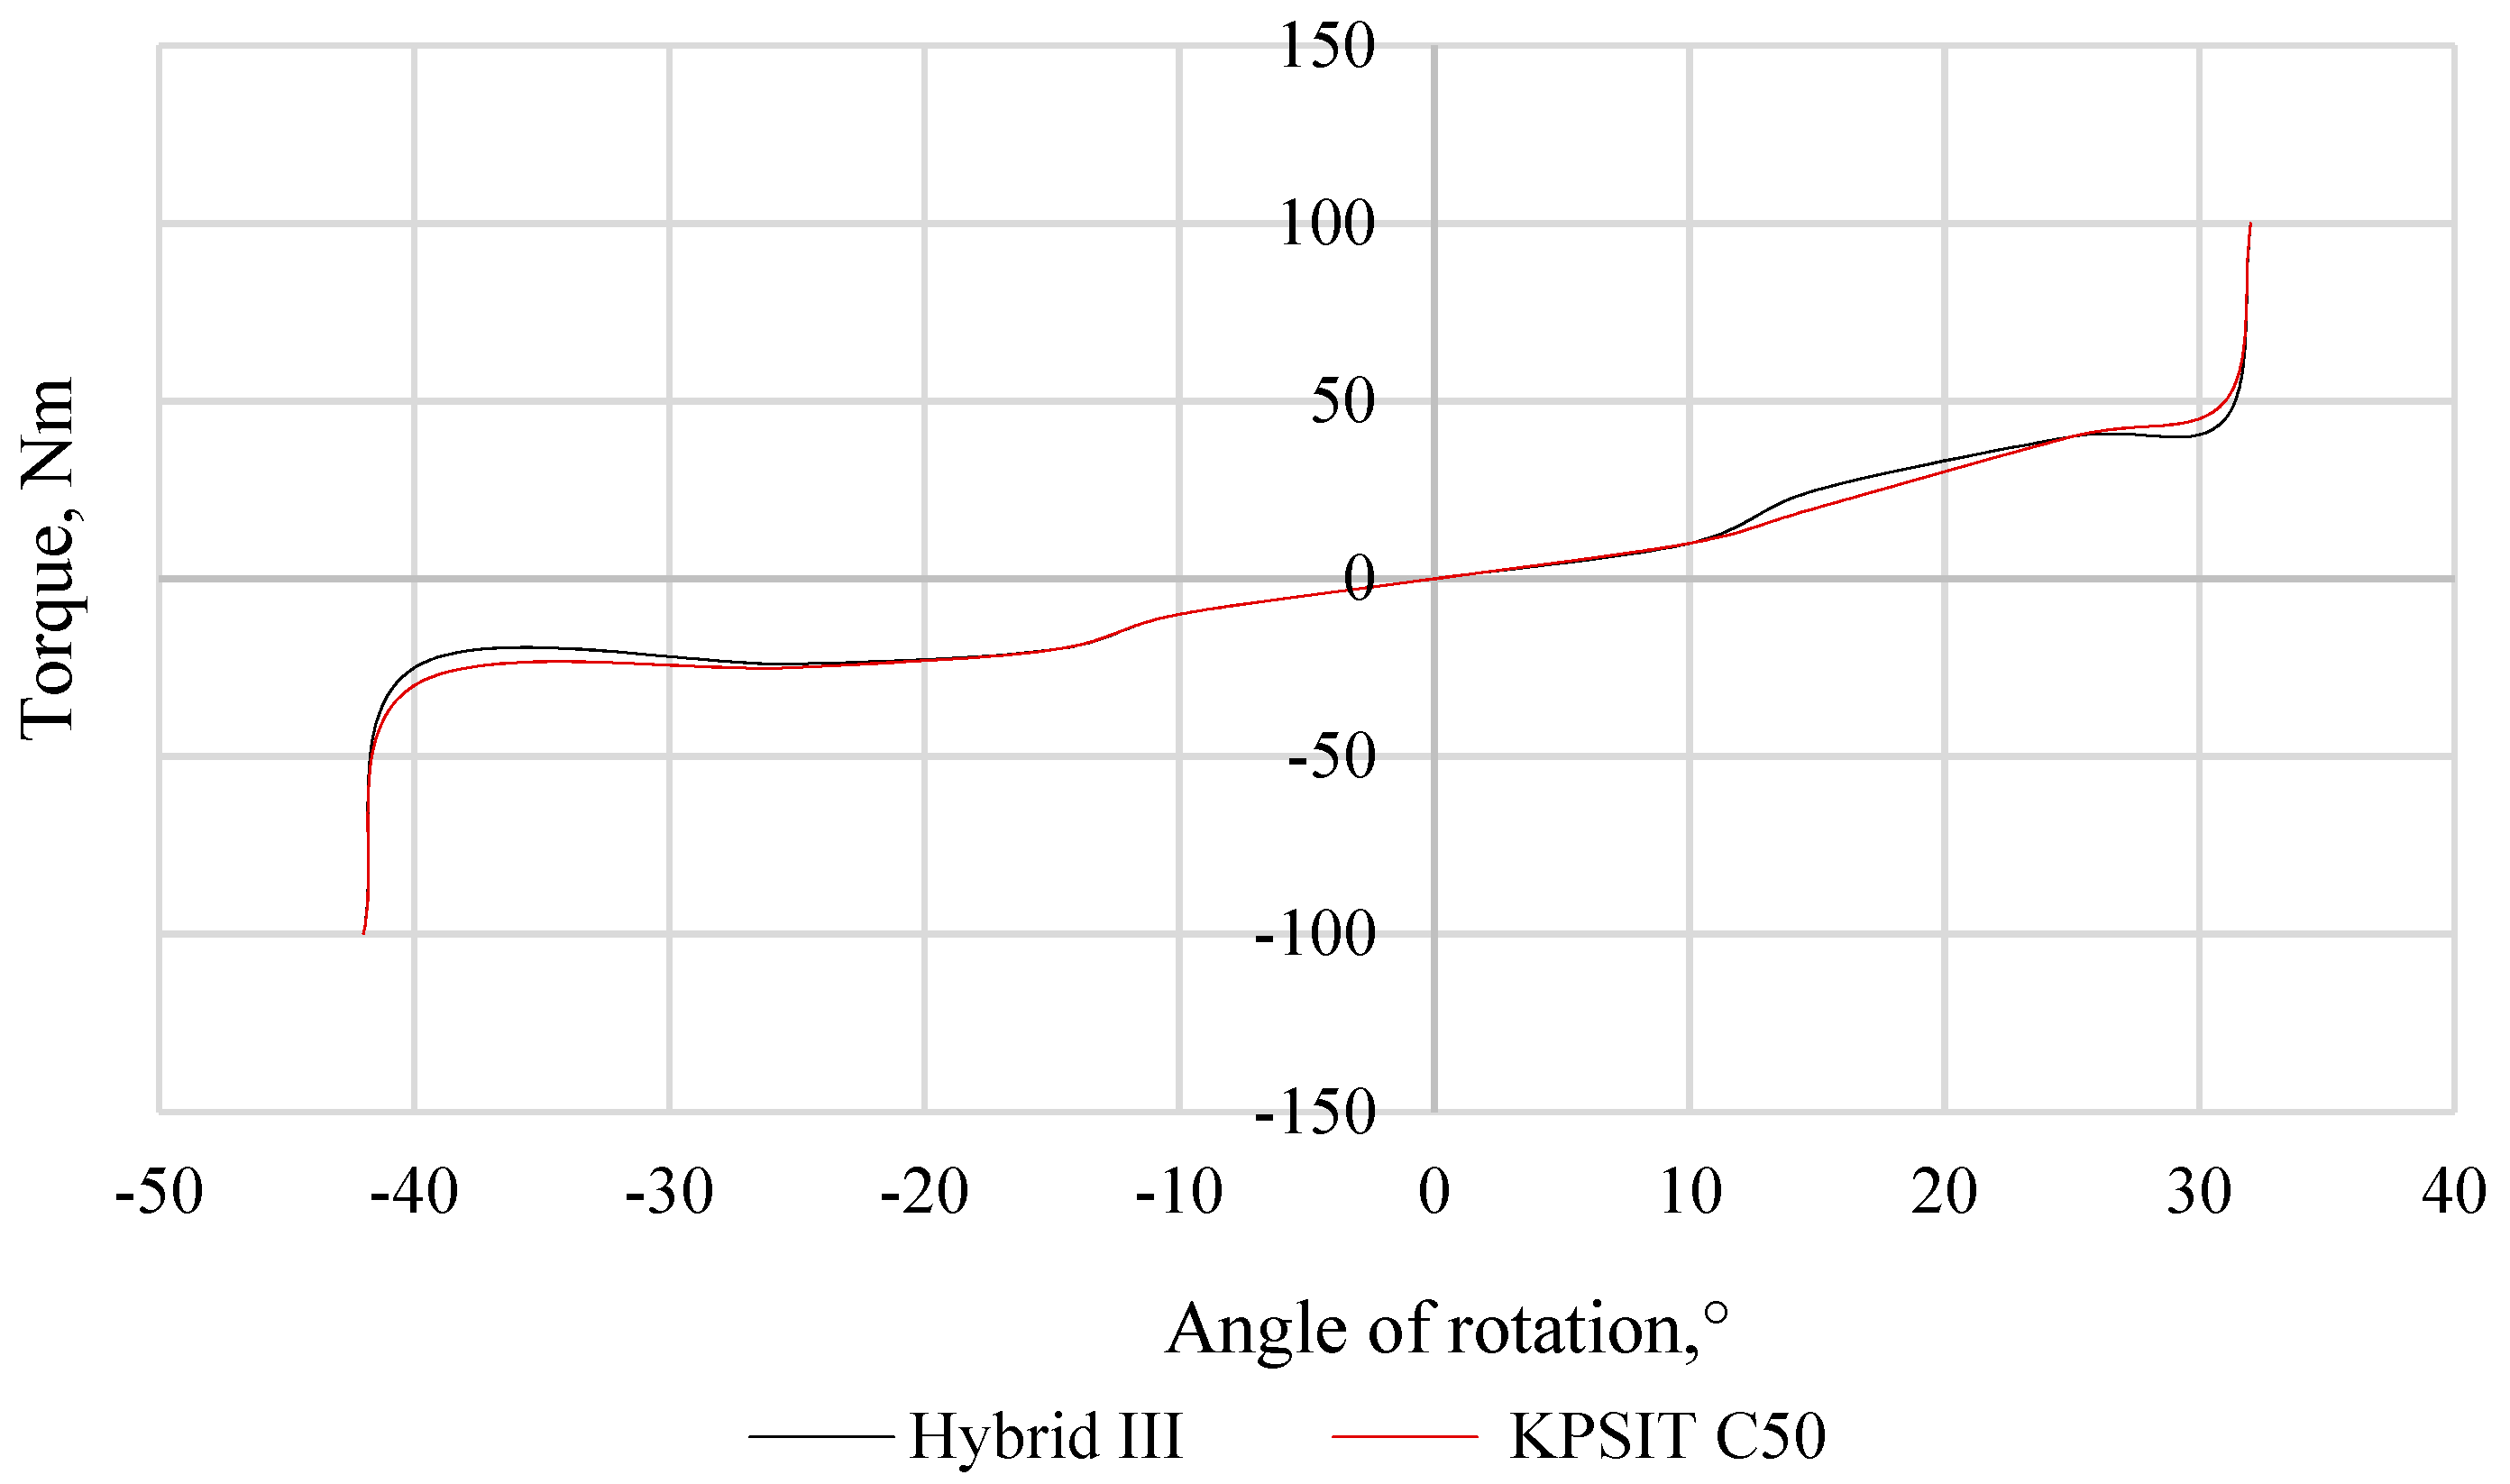
3.4. Neck Joint of the KPSIT C50 Dummy Used in Experimental Tests

Figure 8 shows a diagram of the neck joint of a physical dummy. It consists of two elements. The upper element of the neck joint is connected to the head with two steel screws. The lower element of the neck joint is attached to the body of the physical dummy by means of a steel screw, which simultaneously determines the range of motion and the moment of resistance in the joint. The screw connecting the lower member of the neck joint to the body of the dummy has a compression spring. Proper selection of springs ensures obtaining stiffness characteristics similar to the cervical joint of a person. The lower connection of the neck joint to the body allows the movement of the dummy’s head in the direction of the X-axis (front-to-back). Movement relative to the direction of the Y-axis (right-to-left) is possible thanks to the upper attachment of the neck joint to the head of the dummy. The protective steel tube of the neck joint, which gives it a shape similar to that of a human neck, has ball bearings in the upper mount, which ensure free movement of the dummy’s head in the direction of the Y-axis, and this movement is limited by the splines located behind the outer sleeve of the protective ball bearing. In addition, the splines are designed to stabilize head movements relative to the Y-axis and at the same time prevent excessive rotation angle. The steel bolt connecting the upper and lower parts of the neck joint of the dummy has a compression spring that allows the stiffness characteristics of the joint to be changed.
The mechanics of the movements of the head and neck of the physical dummy shall be so constructed as to allow uniform bending of the neck over the entire section in two planes: front-to-back (X-axis) and right-to-left (Y-axis). Figure 9 shows the constructed neck joint of a physical dummy. The neck joint of the physical dummy shall have two degrees of freedom. This allows the upper end to move in the X-axis (longitudinal) and in the Y (transverse) direction.
The resistance torque characteristics of the neck joint of the KPSIT C50 physical dummy were chosen on the basis of point results. The measurements were made using a strain gauge, and measurements of the range of motion of individual joints were measured using a protractor [37,38]. Based on the test results, the moment of resistance in individual joints was determined. The moment of resistance is presented in the form of Equation (1) [16,17].
M = M k Δ φ + M c Δ φ ˙ + C
where:
  • M k Δ φ —component that is a function of the articular angle,
  • M c Δ φ ˙ —component that is a function of angular velocity in the joint,
  • C = M o M k Δ φ o —constant selected on the basis of initial conditions,
  • M 0 , Δ φ o —initial articular moments and angles.
In the cervical joint, the drag torque characteristics coincide very well with those of the Hybrid III dummy. The differences in the moment of resistance are visible in the final stage of the angle of rotation. In the case of positive values, the difference is 5 Nm at 30°. In the case of negative values, the difference between the torque of resistance of the physical dummy and the Hybrid III dummy shall be 5 Nm at 40°. The stiffness characteristics in the cervical joint of the KPSIT C50 physical dummy are shown in Figure 10.

4. Group of Volunteers

The experimental study involved 150 volunteers aged 18 to 51. The study involved 95 men and 55 women. All individuals before the measurement test were measured and weighed and then classified into a given percentile of the population. Table 1 presents the values of the measured parameters of the volunteers’ bodies, which are consistent with the human anthropometric atlas [41]. Volunteers were classified into a given percentile group based on the average of the measured 15 anthropometric dimensions of individual body parts.
For men, the 5th percentile group consisted of 30 people, the 50th percentile group of 35 people, and the 95th percentile group of 30 people. For women, the 5th percentile group consisted of 20 people, the 50th percentile group of 20 people, and the 95th percentile group of 15 people. Table 2 shows examples of anthropometric dimensions of a 50th percentile man.

5. Results of Experimental Studies

The recorded videos from the crash tests allowed us to determine the trajectory of the head movement of 150 volunteers, who were divided into individual percentile groups. The analysis of the trajectory of the head movement was possible thanks to a marker stuck on the head of the volunteers. During the crash test, a marker was placed on each volunteer’s head. The TEMA CLASSIC program was able to analyze the displacement of the marker along with the head of the volunteers. Figure 11 shows an example of the placement of the displacement measurement marker on the head of a volunteer during experimental studies. Volunteers have a black and yellow marker on individual body parts, which is recognized in the program. Based on the movement of the marker, the trajectory of movement of individual body parts is recorded. People taking part in the low-speed crash test had a marker on their head, neck, shoulder, elbow, and knee.

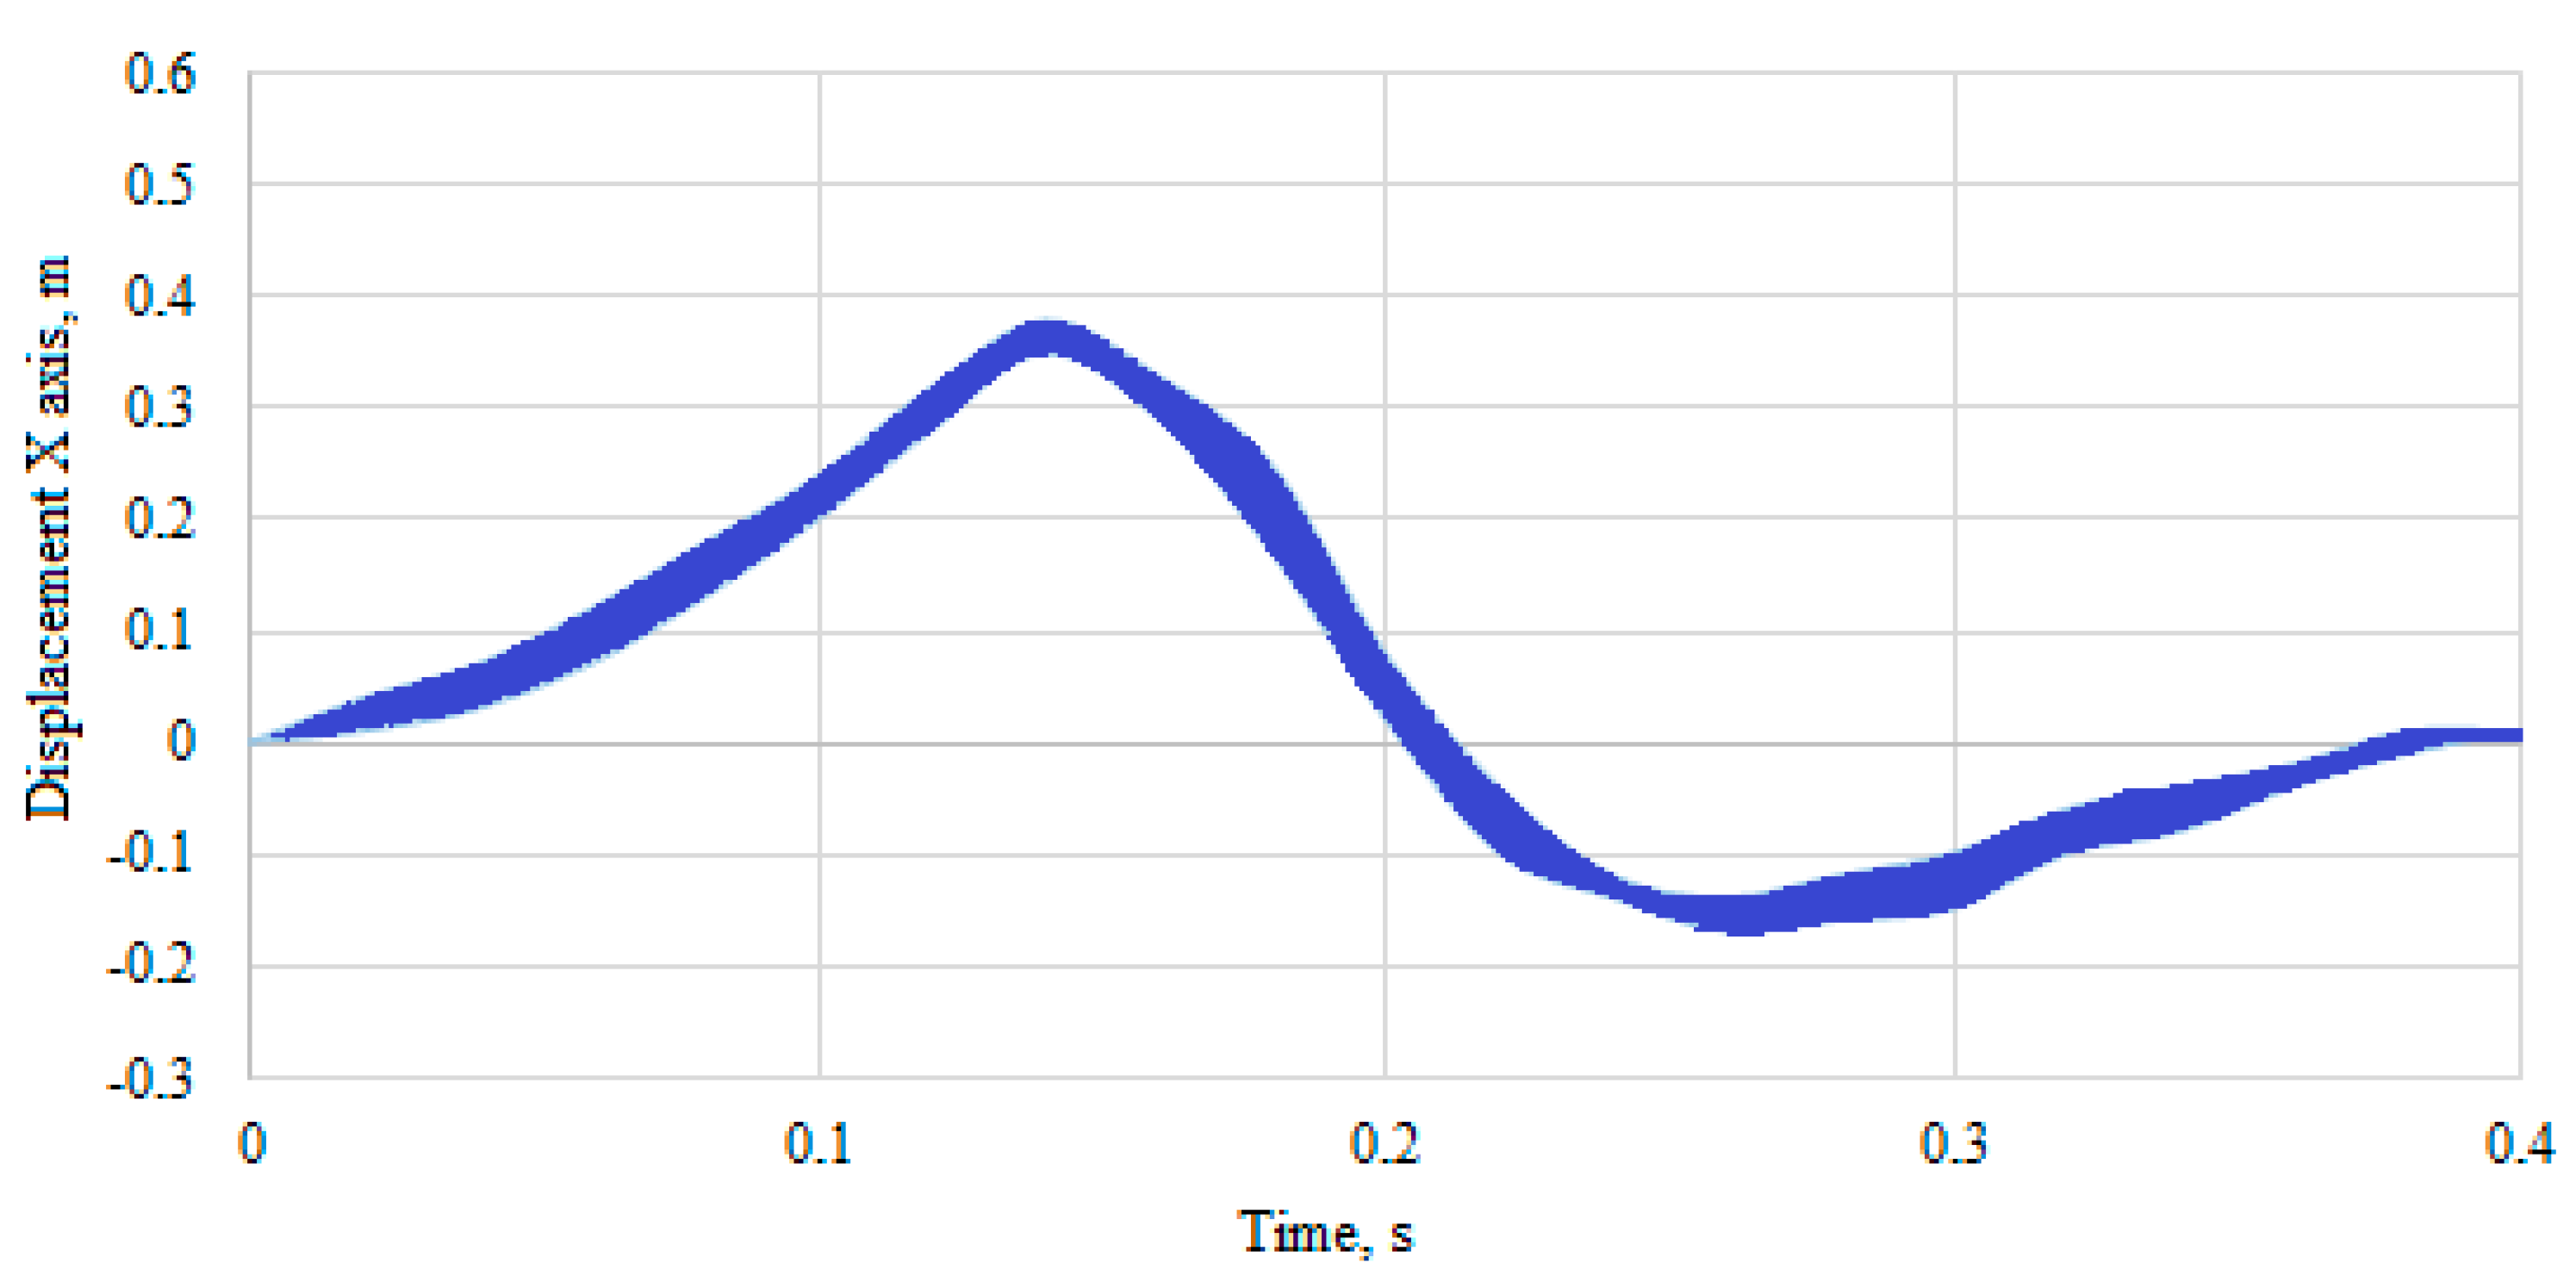
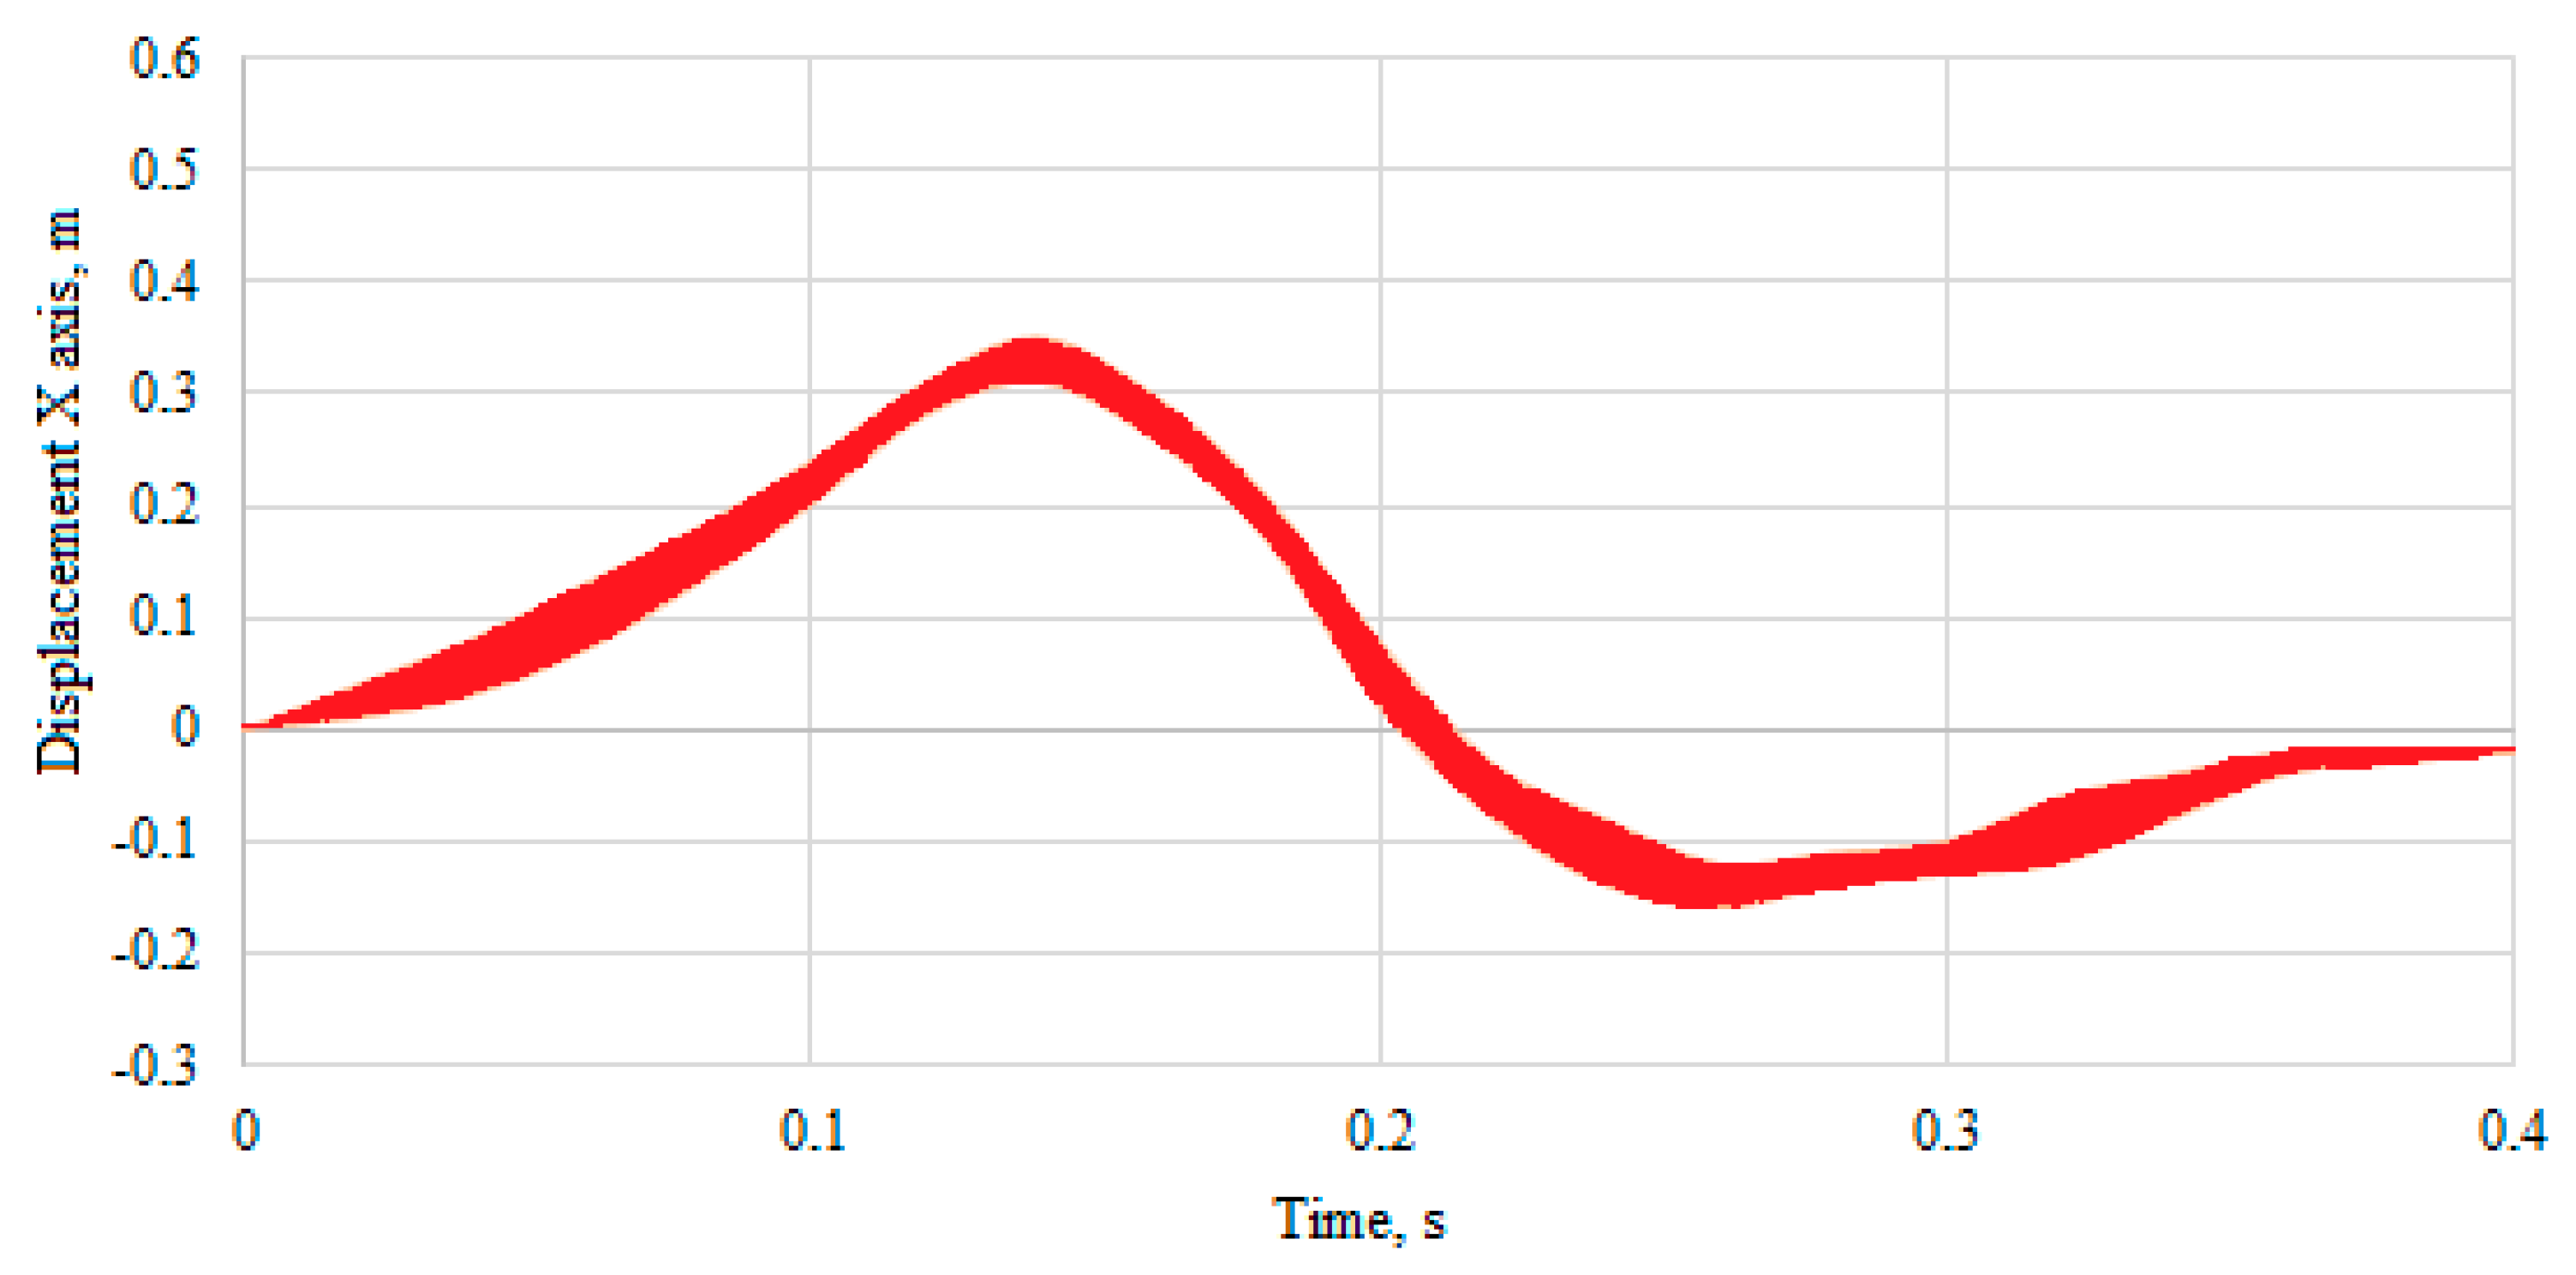
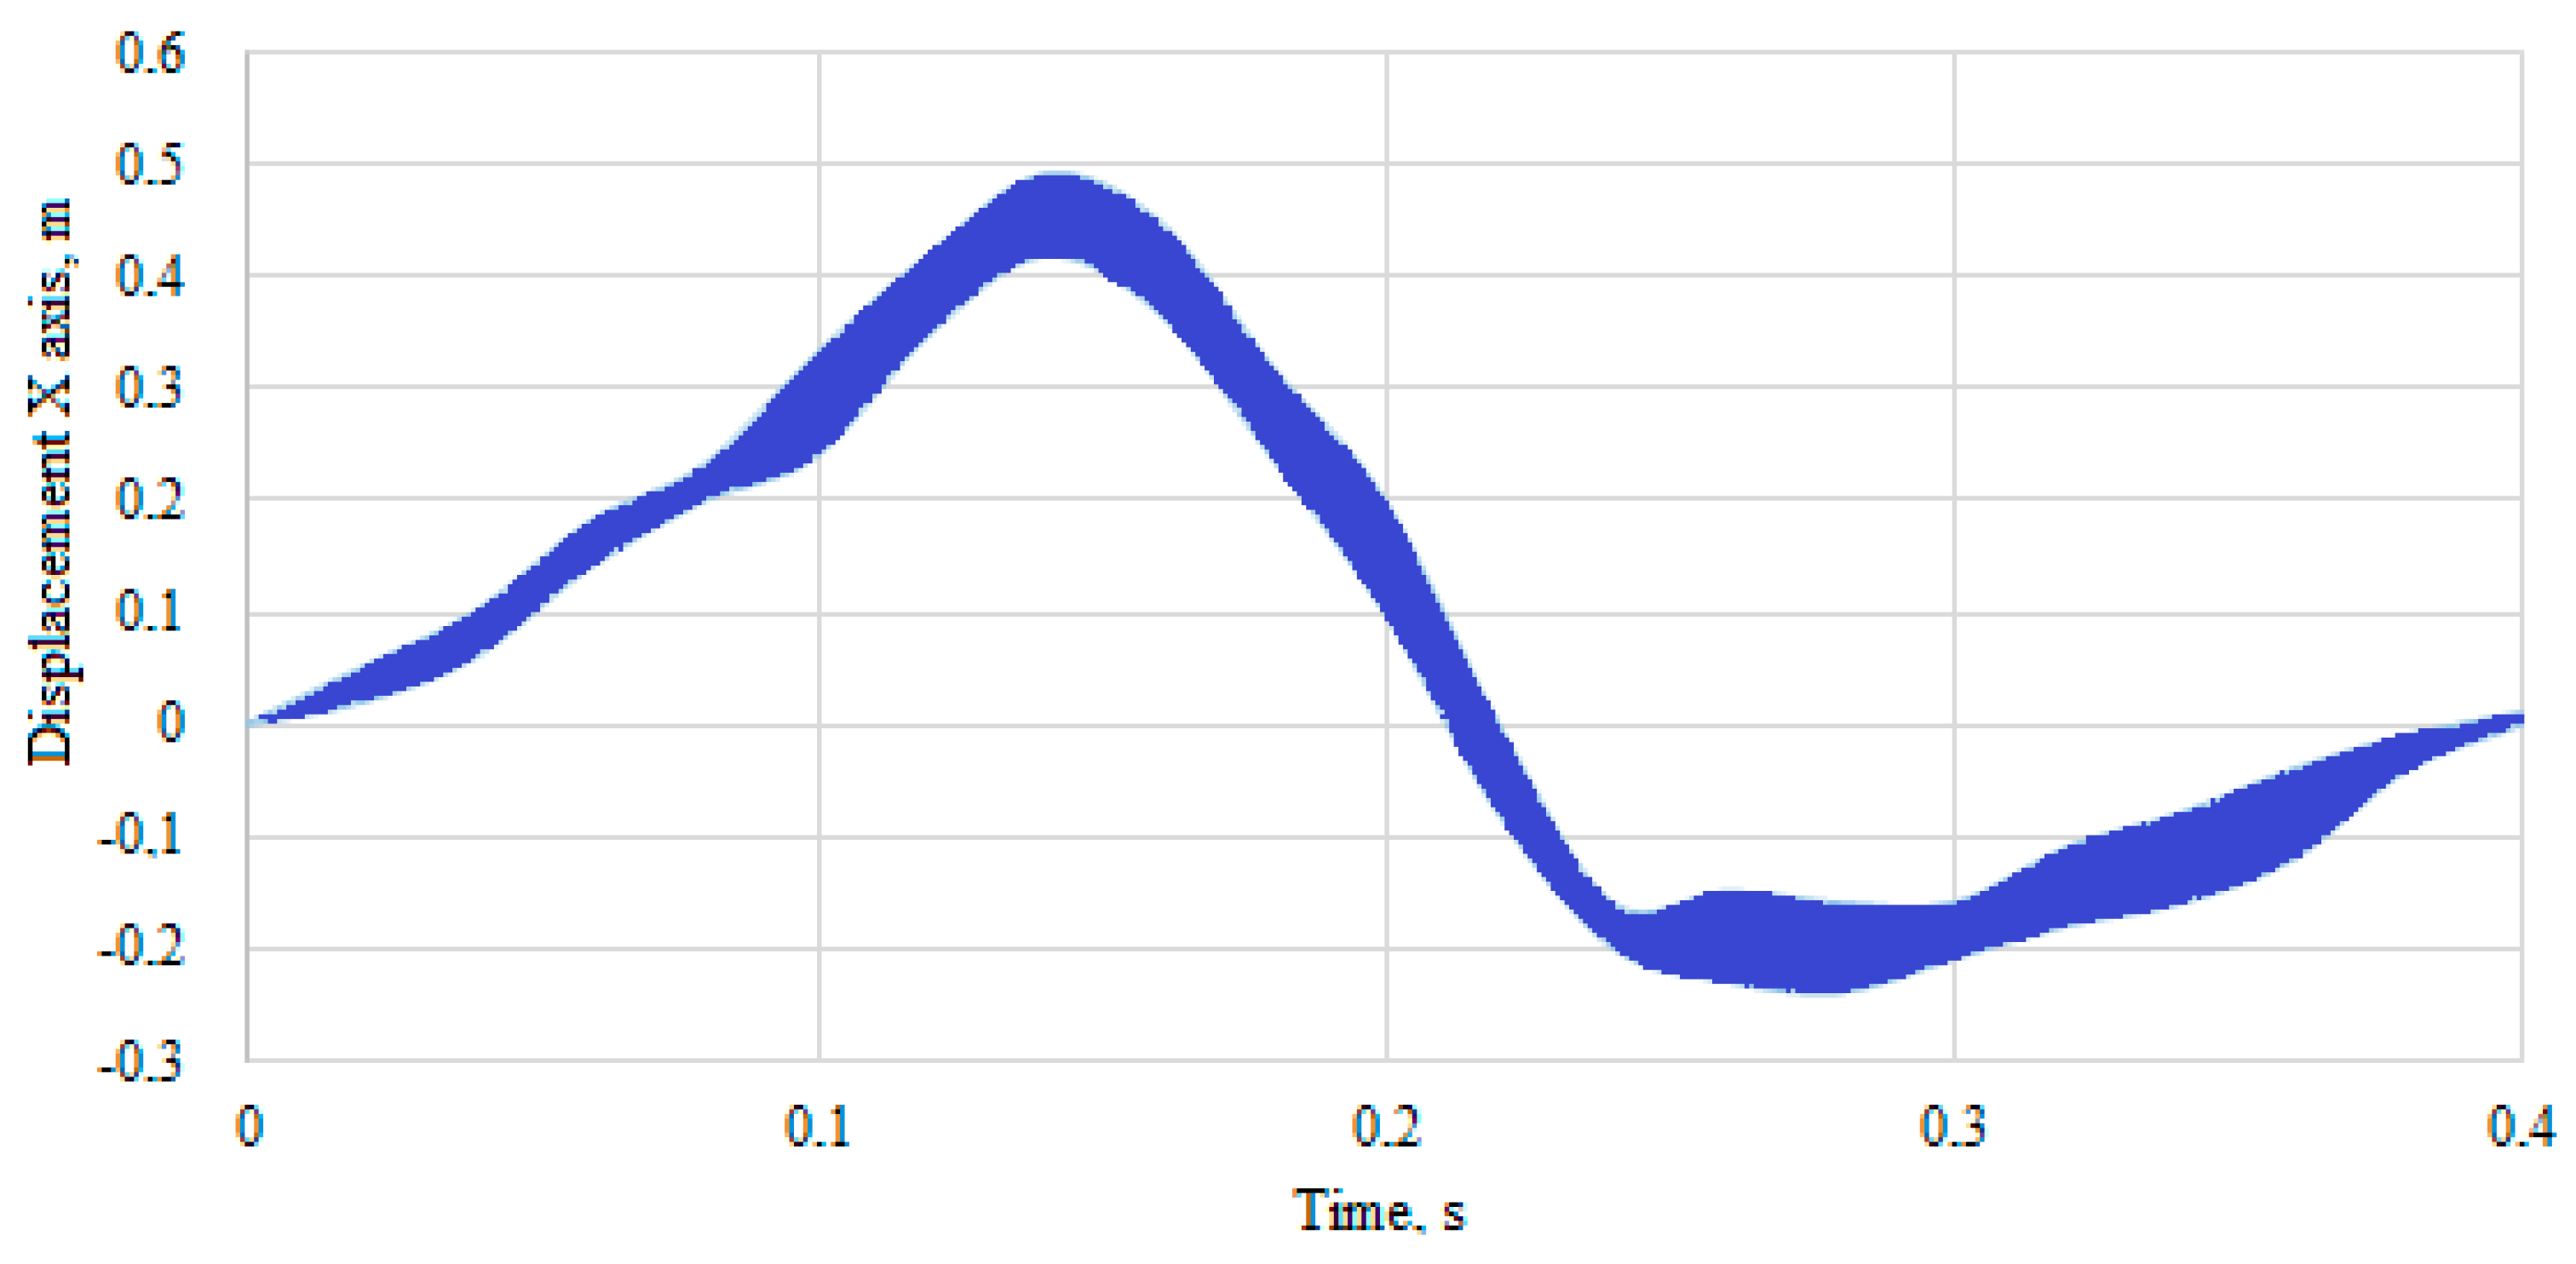
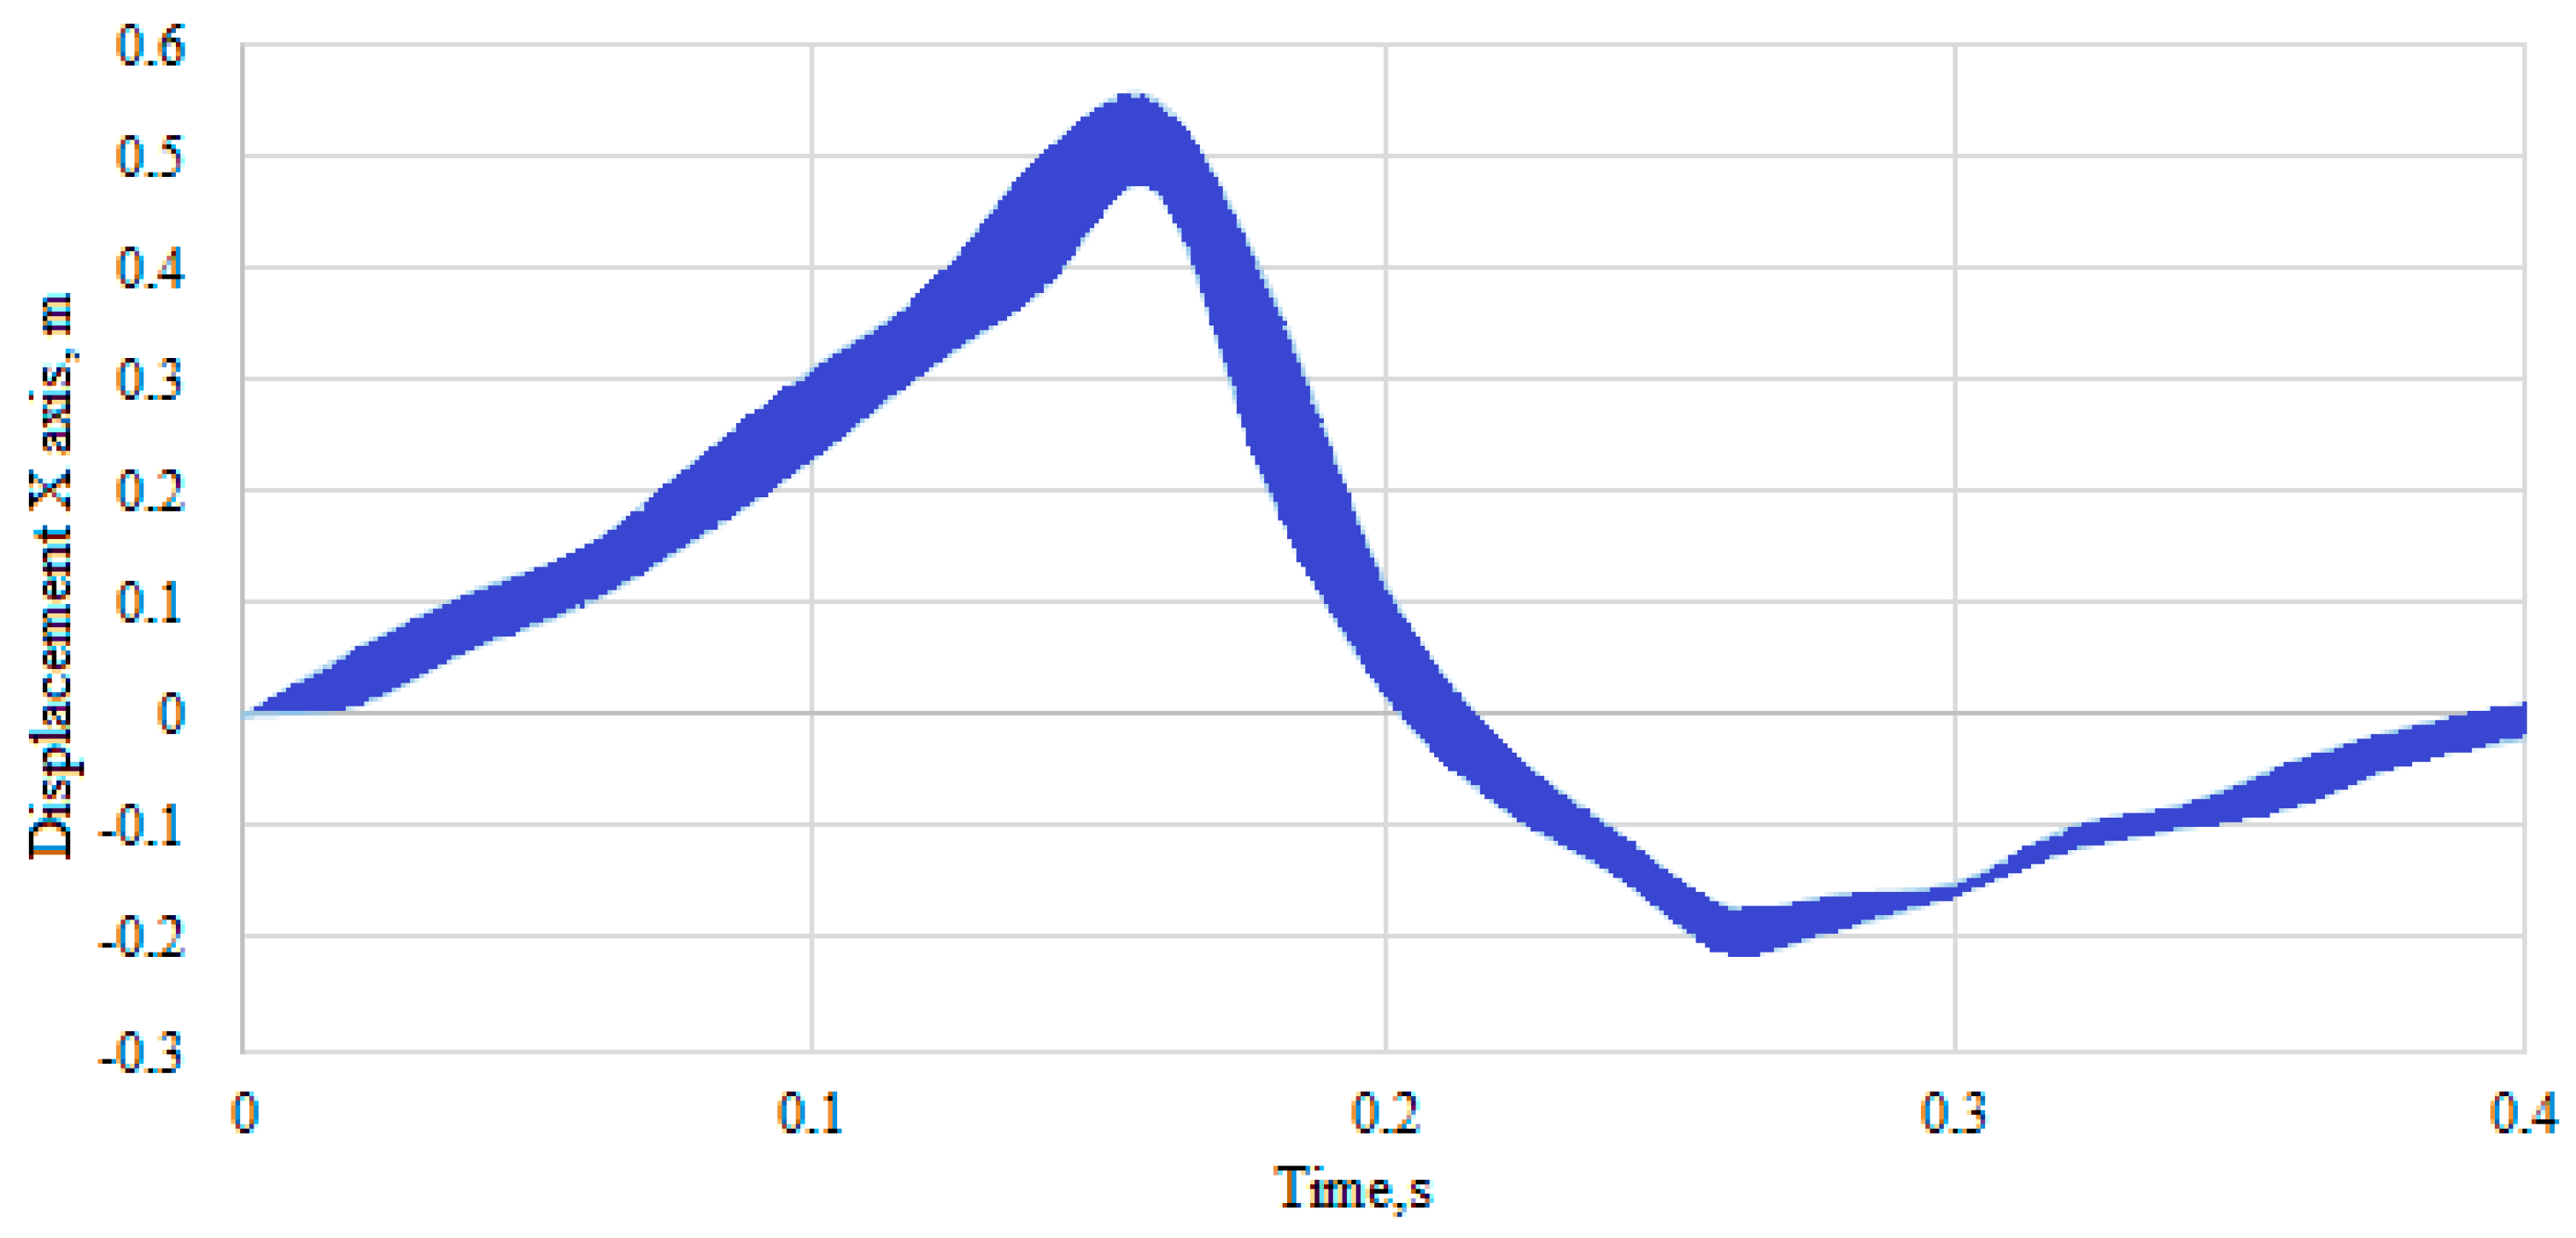
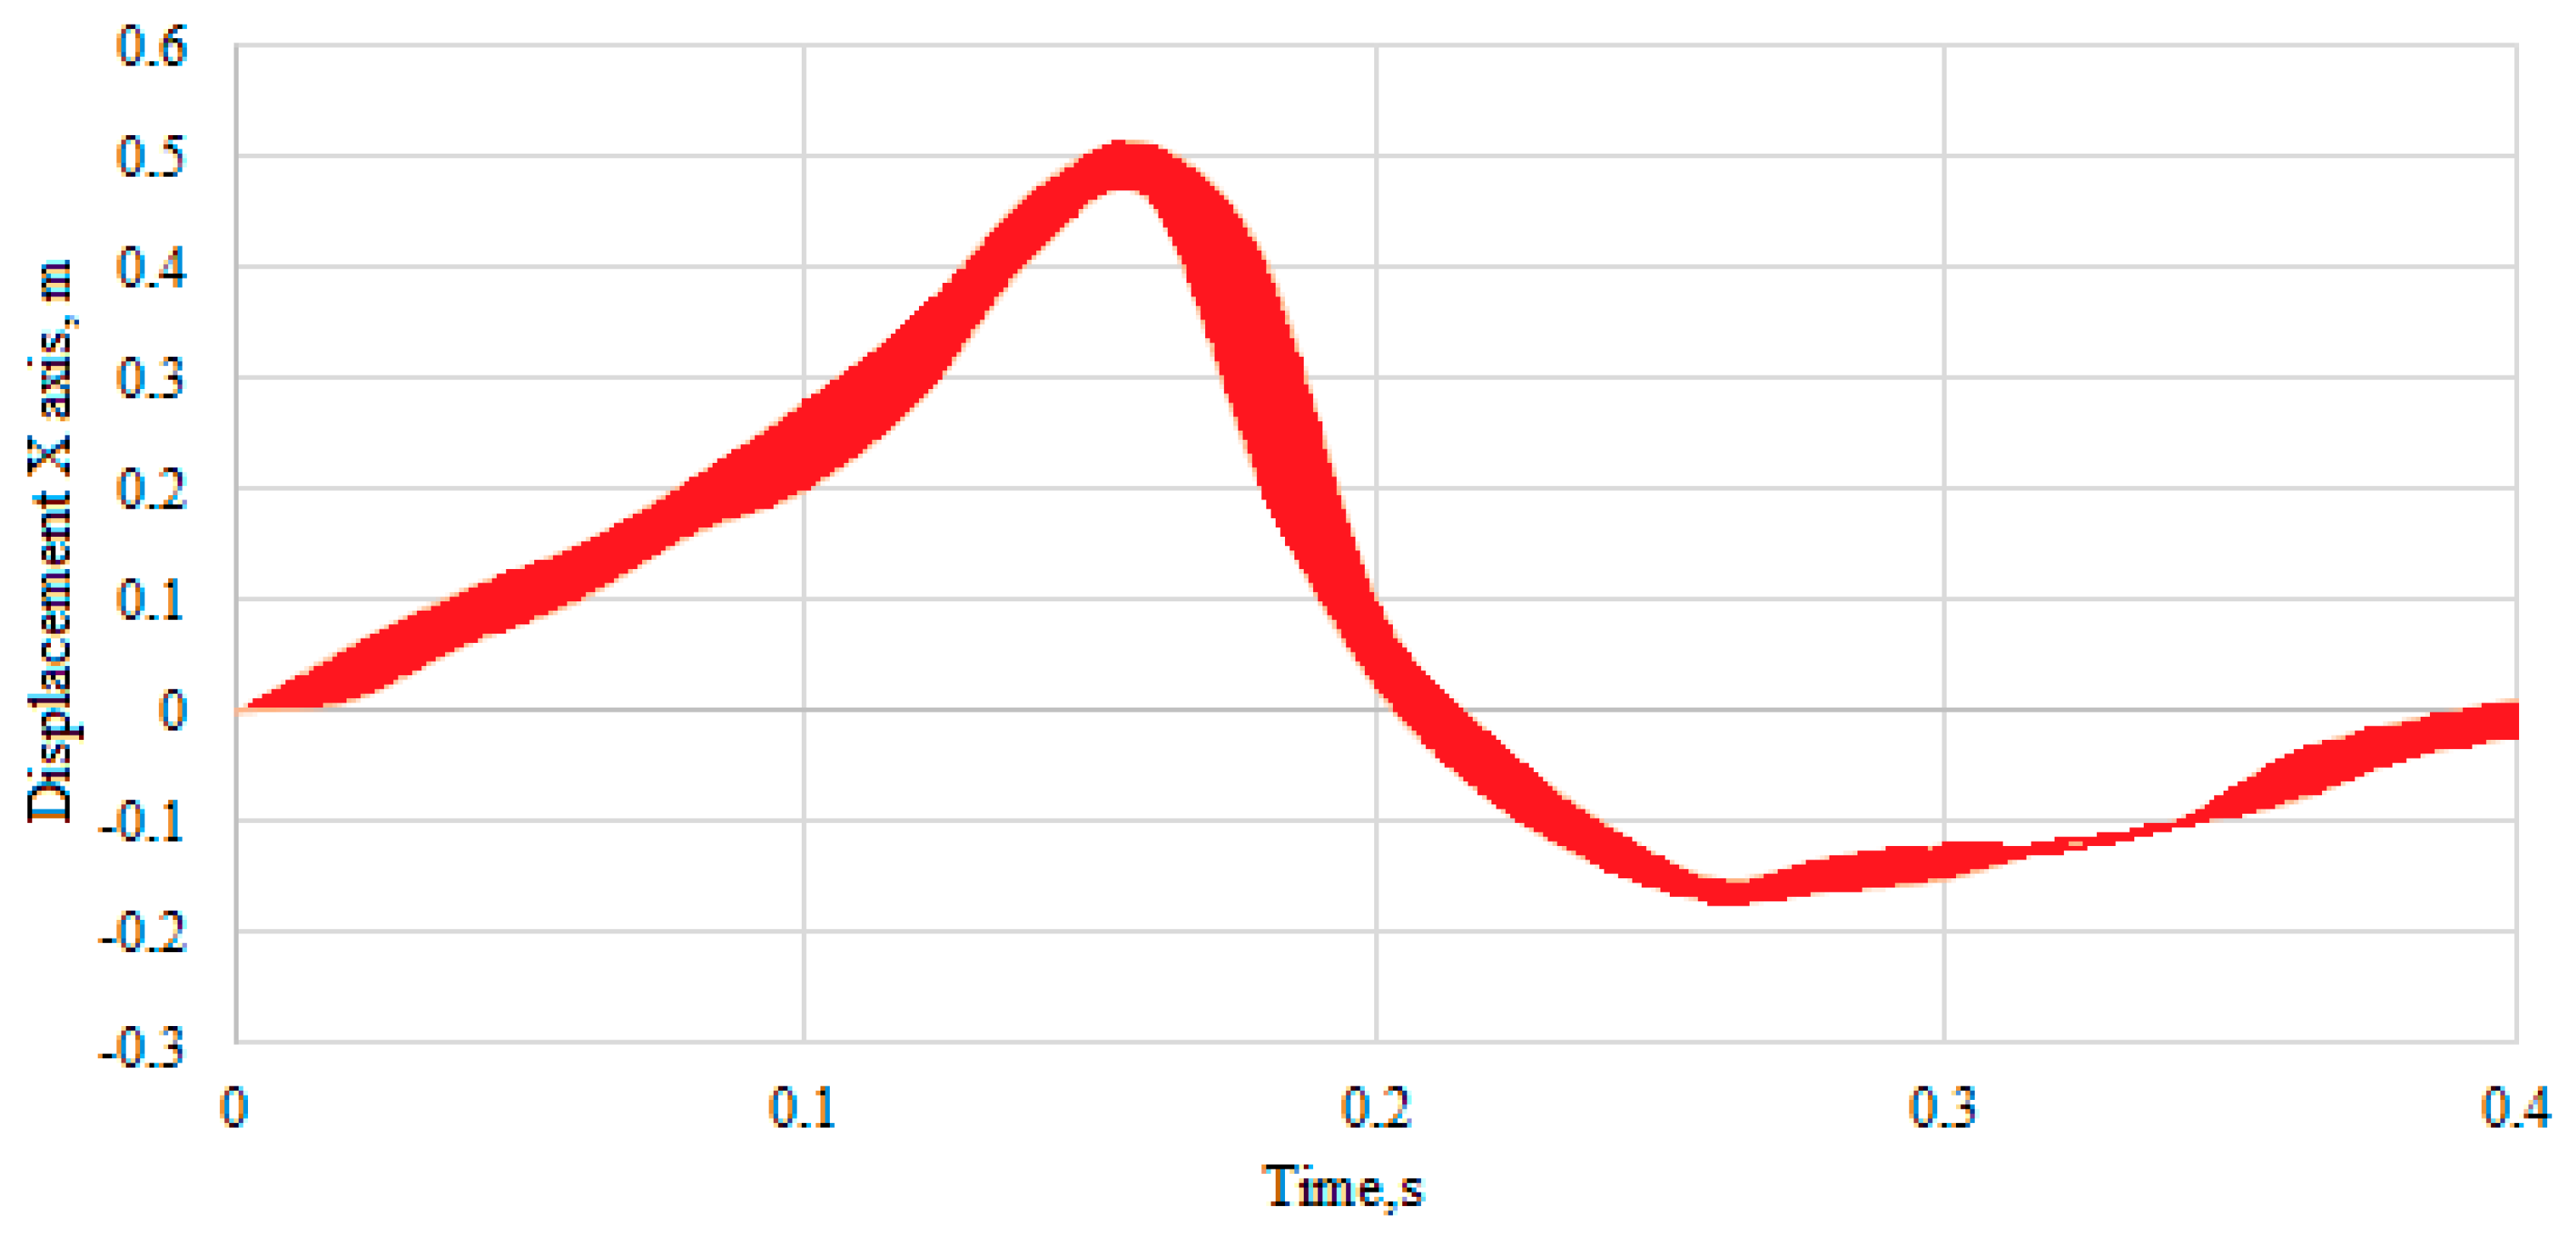
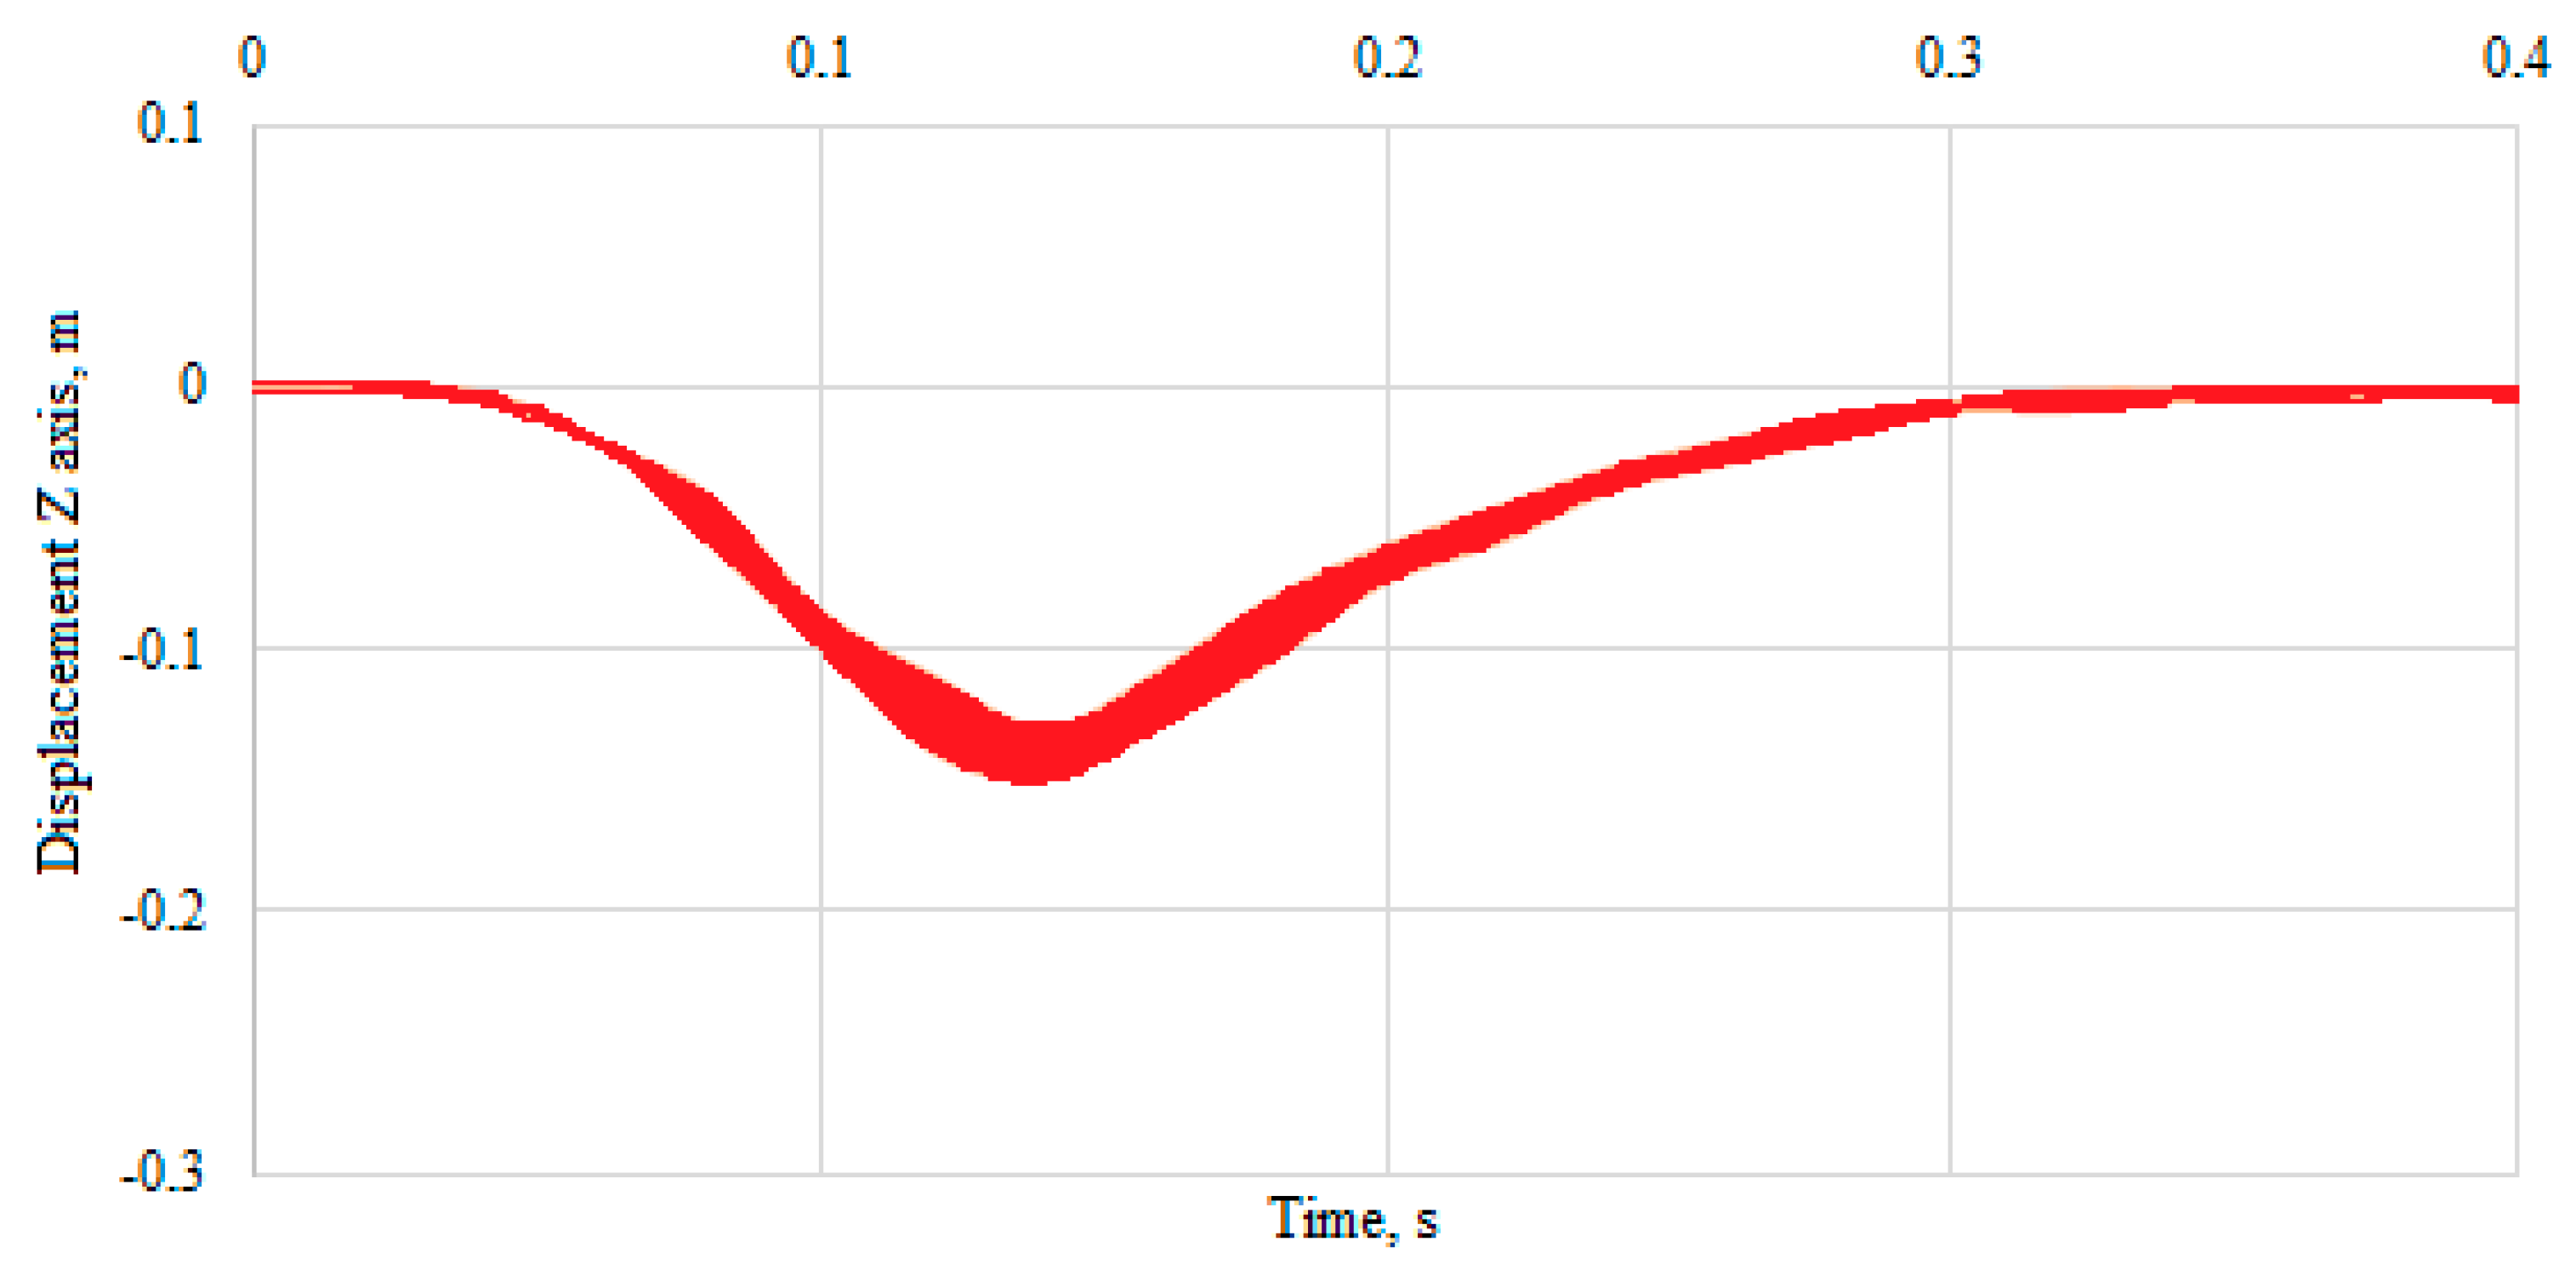
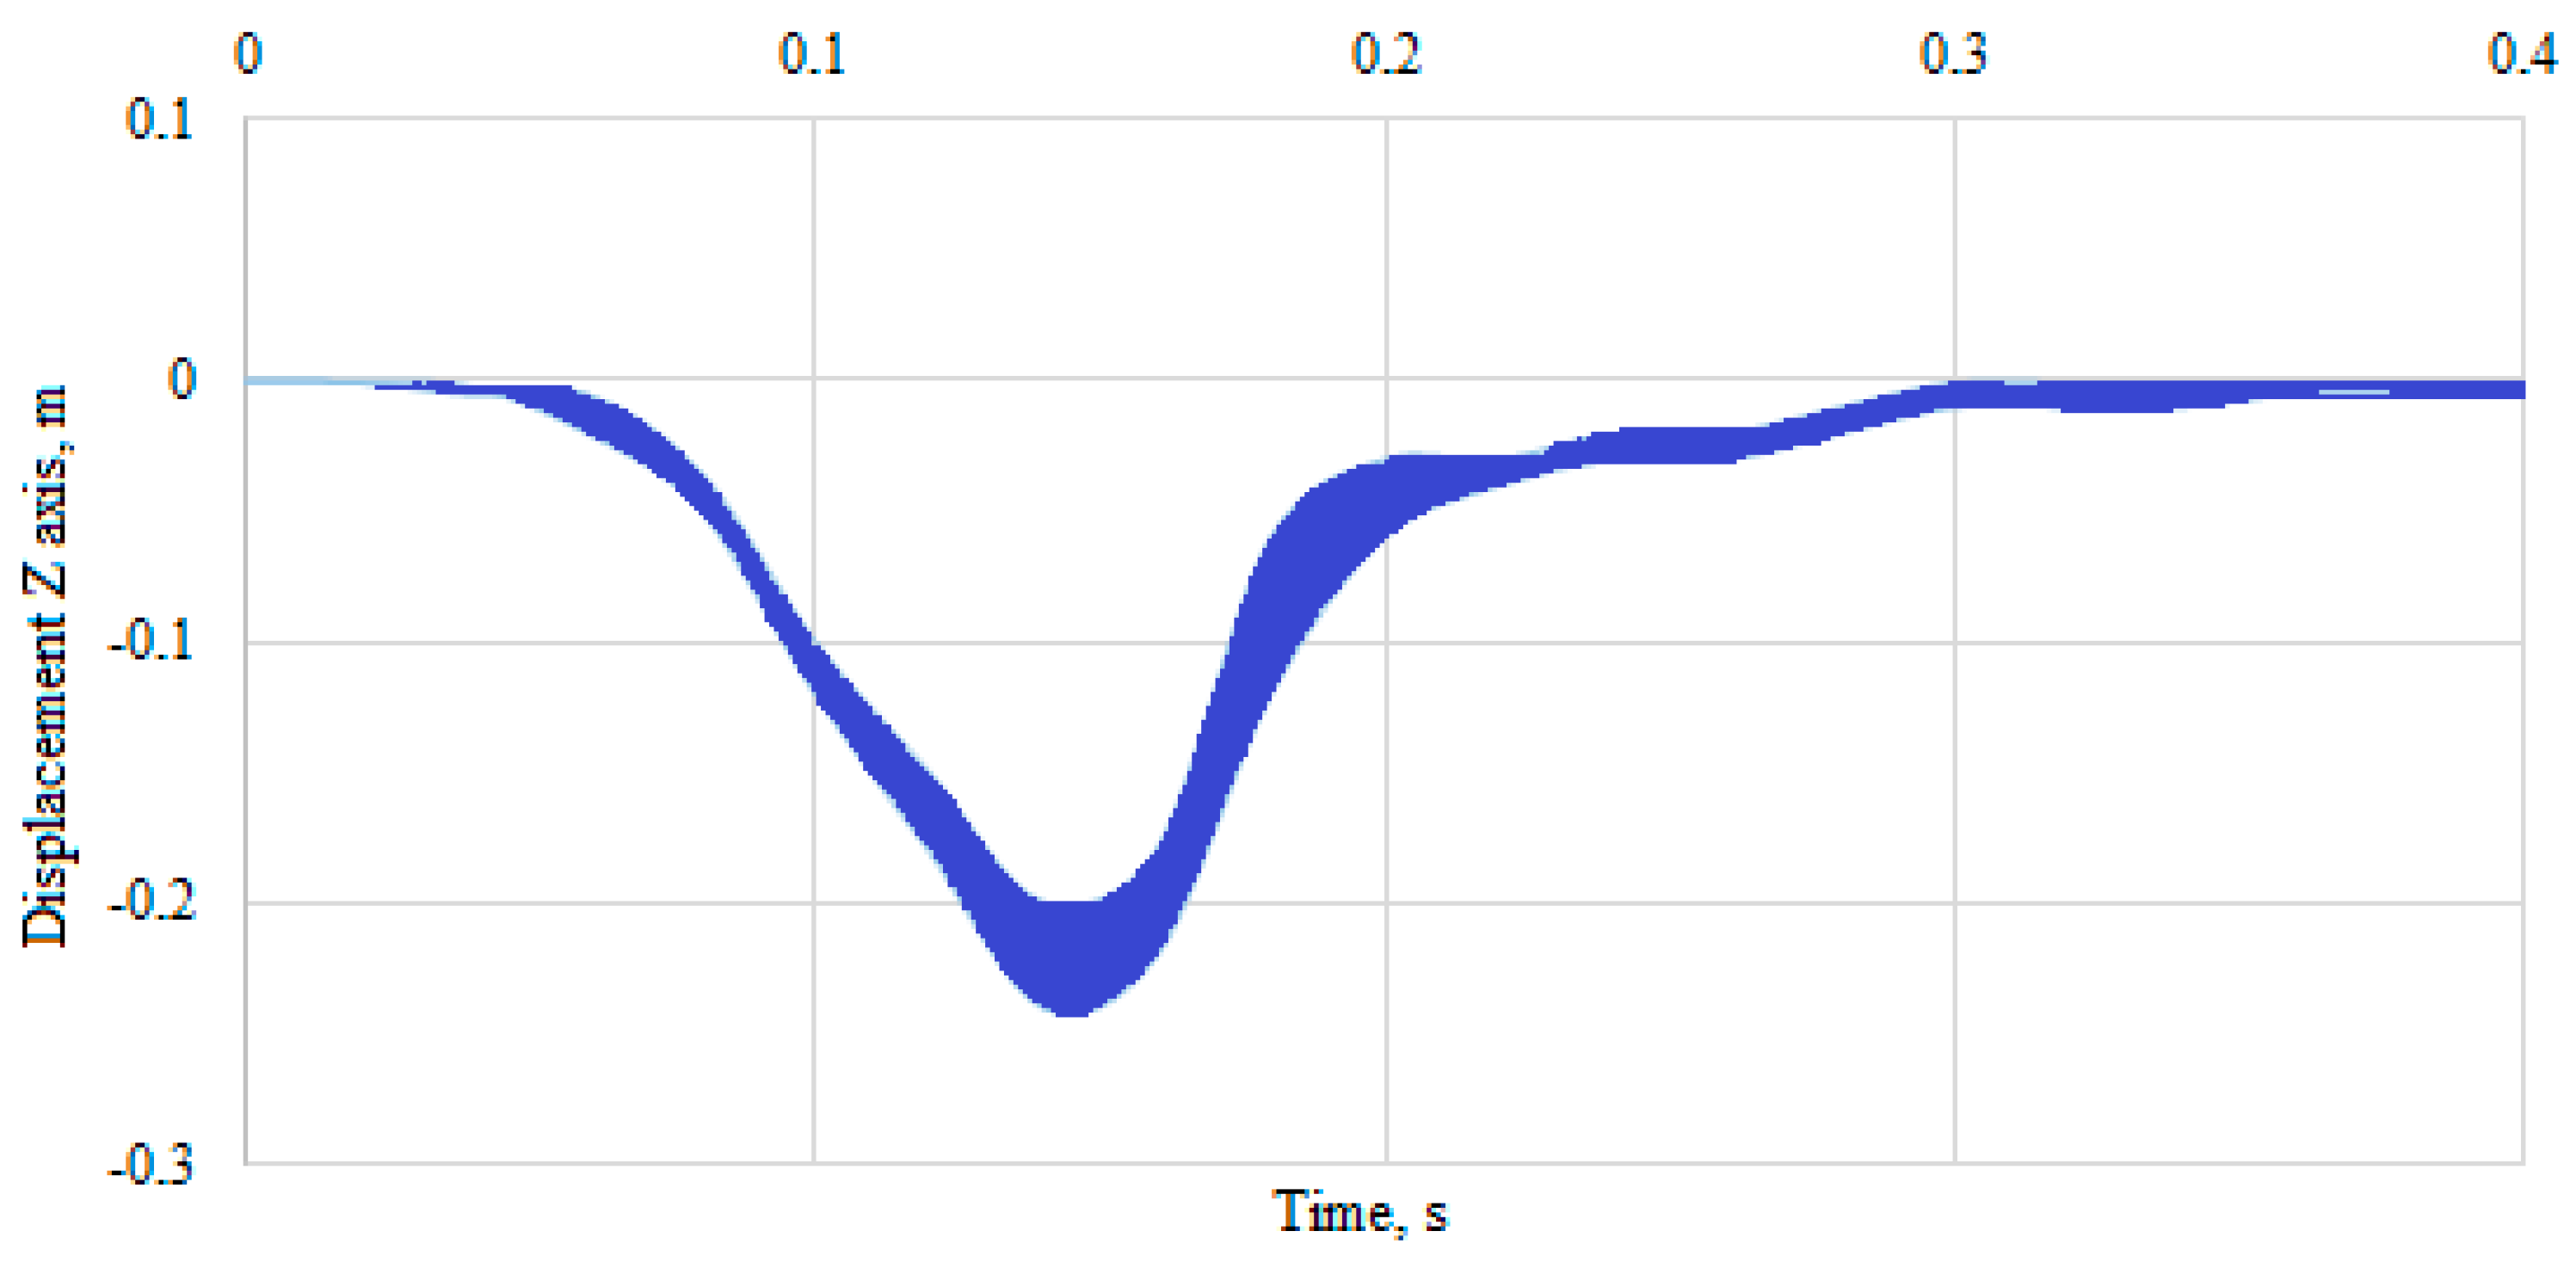
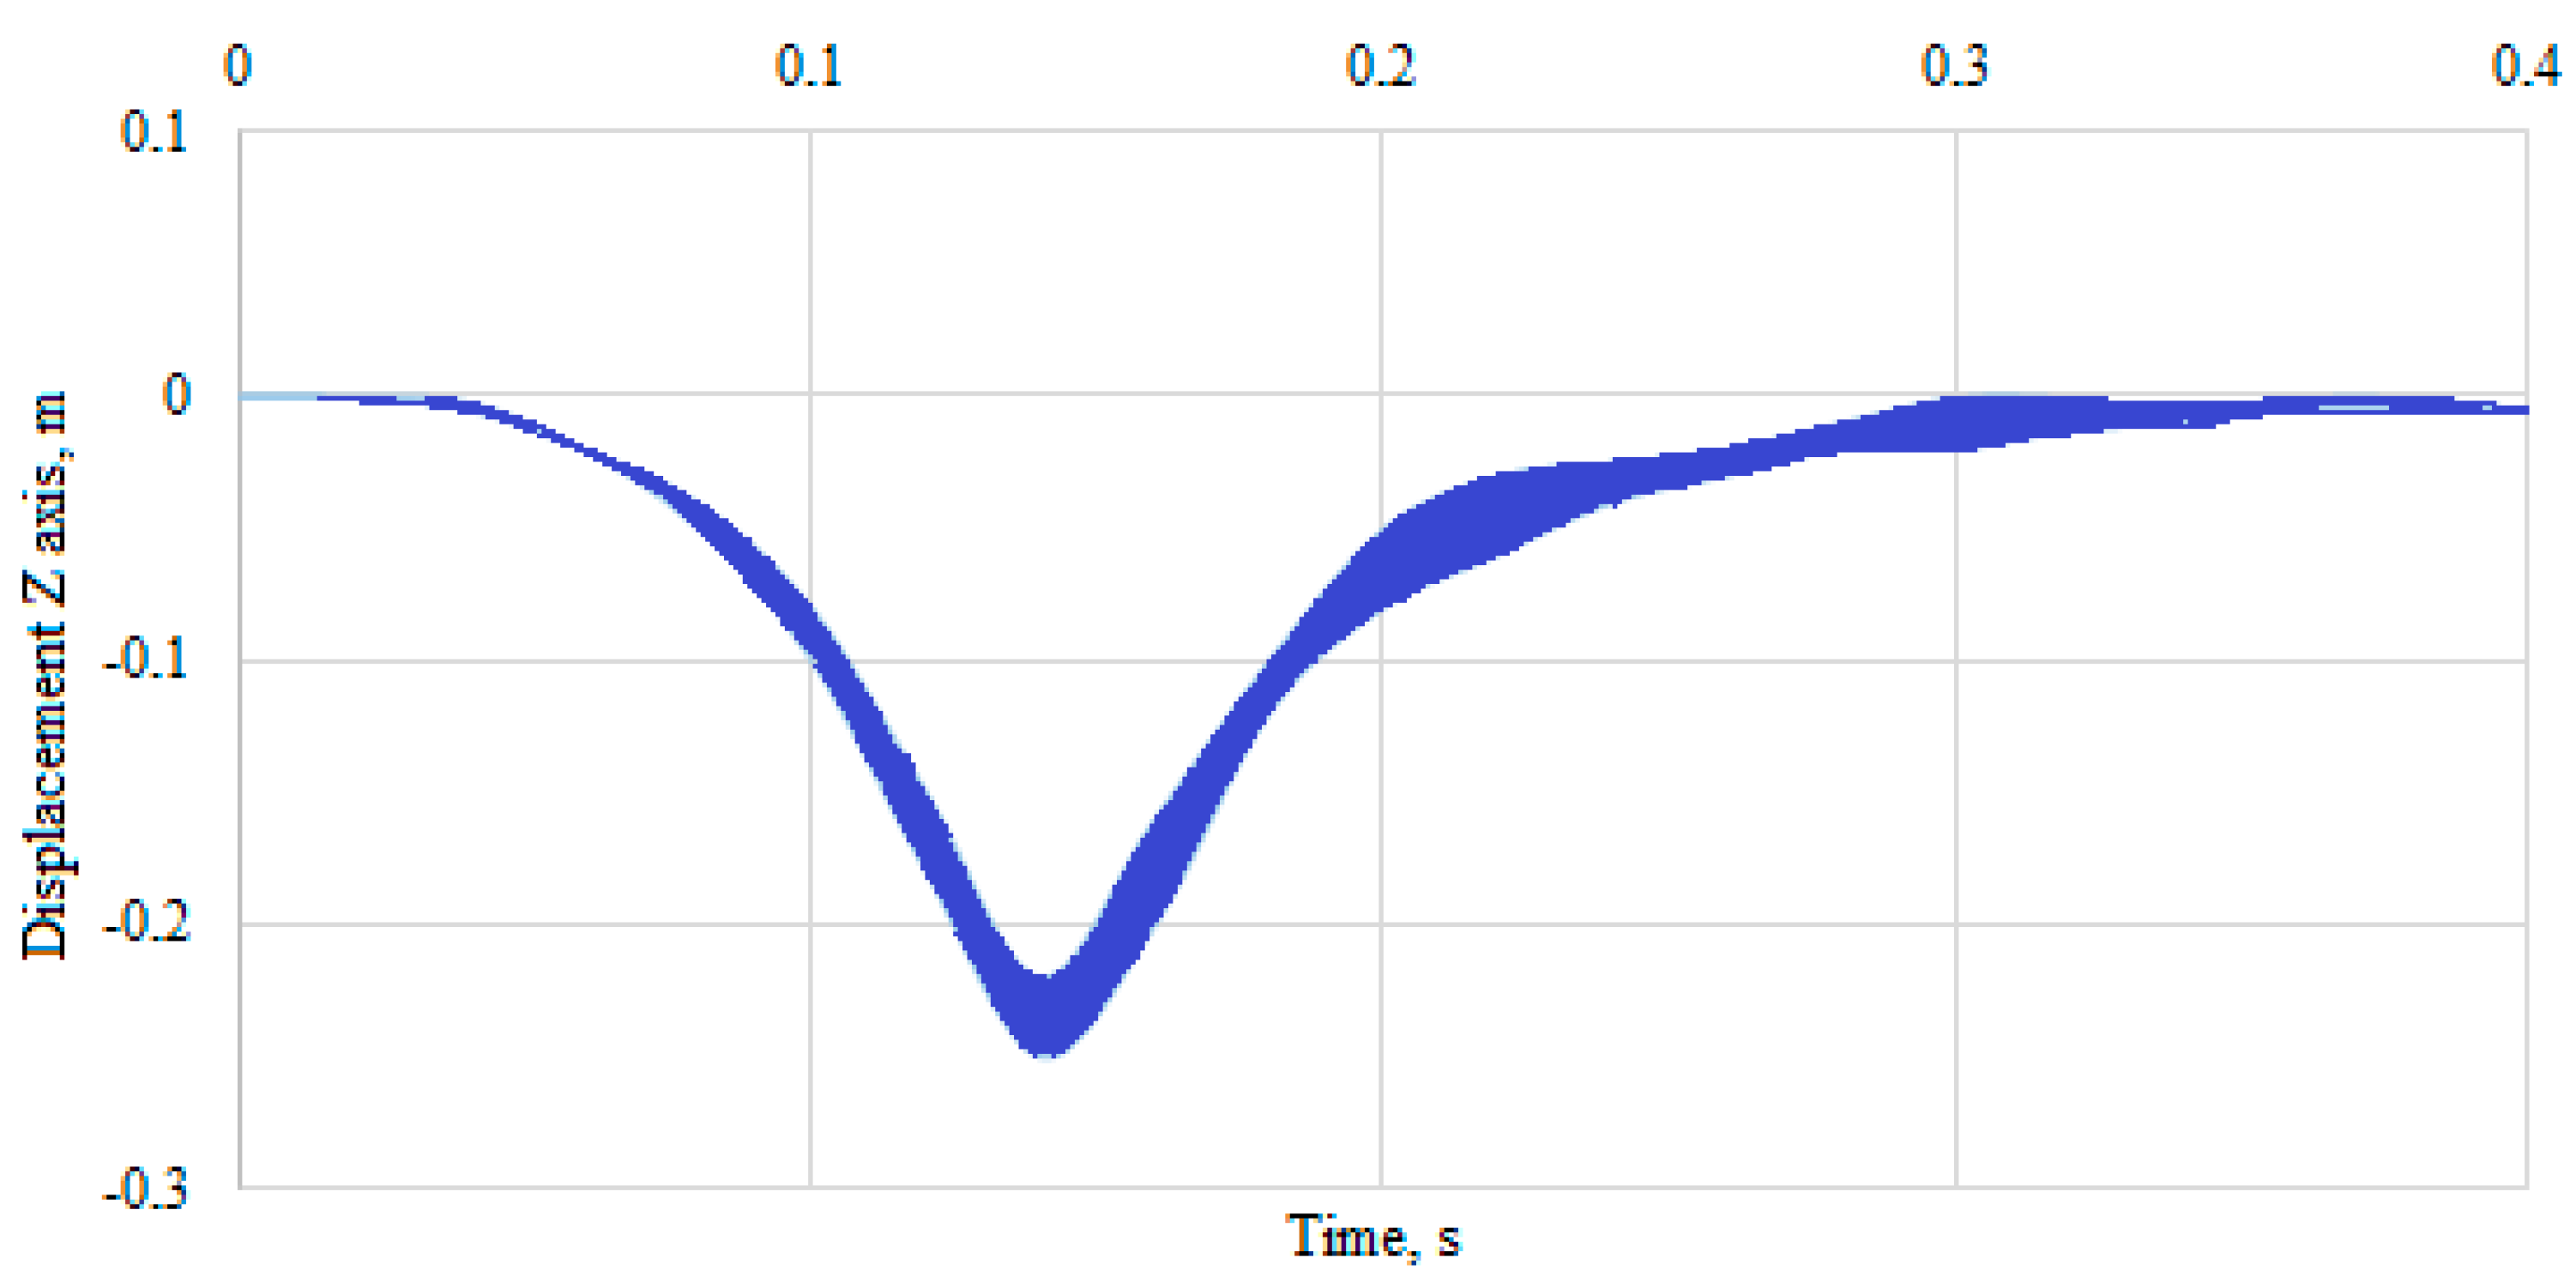
5.1. Analysis of the Head Displacement of Volunteers

The recorded low-speed crash tests were analyzed in the TEMA CLASSIC program, which is designed for advanced motion analysis [42]. It allows you to track objects based on an image and then present the results in tables and charts. Figure 12 shows a volunteer representing the 50th percentile of the male population, while Figure 13 shows a volunteer representing the 50th percentile of the female population.
Figure 14 shows frames from a recorded crash test of volunteers at a speed of 20 km/h. By performing a frame-by-frame analysis of the recorded crash tests, one can notice a great similarity in the head displacements of the volunteers, taking into account gender. For further verification, head movement trajectory characteristics were determined for all percentiles of the population, taking into account the division into women and men. The characteristics were determined as the maximum and minimum values of volunteers’ head displacement (head displacement corridors) in a given percentile group.
The displacements of the volunteers’ heads in the crash tests relative to the X-axis are included in Figure 15, Figure 16, Figure 17, Figure 18, Figure 19 and Figure 20. The displacement of the head of C5 male volunteers in the first phase of the collision (0.14 s—maximum head forward tilt) is in the range from 0.35 m to 0.38 m, while the second phase of the collision (0.26 s—maximum head tilt back) is in the range from 0.14 m to 0.17 m (Figure 15). The displacement of the head of female C5 volunteers in the first phase of the collision (0.14 s—maximum head forward tilt) is in the range from 0.31 m to 0.35 m, while the second phase of the collision (0.26 s—maximum head tilt back) is in the range from 0.12 m to 0.16 m (Figure 16).
The head displacement of C50 male volunteers in the first phase of the collision (0.14 s—maximum head forward tilt) is in the range from 0.47 m to 0.55 m, while the second phase of the collision (0.26 s—maximum tilt of the head backwards) is in the range from 0.17 m to 0.21 m (Figure 17). The displacement of the head of C50 female volunteers in the first phase of the collision (0.14 s—maximum head forward tilt) is in the range from 0.43 m to 0.47 m, while the second phase of the collision (0.26 s—maximum head tilt back) is in the range from 0.16 m to 0.24 m (Figure 18).
The head displacement of C95 male volunteers in the first phase of the collision (0.14 s—maximum head forward tilt) is in the range from 0.35 m to 0.38 m, while the second phase of the collision (0.26 s—maximum head tilt back) is in the range from 0.14 m to 0.17 m (Figure 19). The displacement of the head of female C95 volunteers in the first phase of the collision (0.14 s—maximum head forward tilt) is in the range from 0.46 m to 0.51 m, while the second phase of the collision (0.26 s—maximum head tilt back) is in the range from 0.15 m to 0.17 m (Figure 20).
The displacements of the volunteers’ heads in the crash tests relative to the Z-axis are shown in Figure 21, Figure 22, Figure 23, Figure 24, Figure 25 and Figure 26. The displacement of the head of C5 male volunteers in the first phase of the collision (0.14 s—maximum head forward tilt) is in the range from 0.12 m to 0.15 m (Figure 21). The displacement of the head of female C5 volunteers in the first phase of the collision (0.14 s—maximum head forward tilt) is in the range from 0.13 m to 0.15 m (Figure 22).
The head displacement of C50 male volunteers in the first phase of the collision (0.14 s—maximum head forward tilt) is in the range from 0.20 m to 0.24 m (Figure 23). The displacement of the head of female C05 volunteers in the first phase of the collision (0.14 s—maximum head forward tilt) is in the range from 0.19 m to 0.22 m (Figure 24).
The displacement of the head of C95 male volunteers in the first phase of the collision (0.14 s—maximum head forward tilt) is in the range from 0.22 m to 0.25 m (Figure 25). The displacement of the head of female C95 volunteers in the first phase of the collision (0.14 s—maximum head forward tilt) is in the range from 0.20 m to 0.25 m (Figure 26).
It should be noted that the displacement of the head in the second phase of the collision (0.26 s) ranged from 0.01 m to 0.04 m for all volunteers.
Based on the head displacements of the tested volunteers (in the first and second phase of the collision) in both the X- and Z-axes, it can be seen that there are differences of up to 5% between women and men in a given percentile population. This difference was calculated based on the standard deviation determined for each data pair over a specified time interval (from 0.00 s to 0.40 s) and then averaged and presented as a percentage.

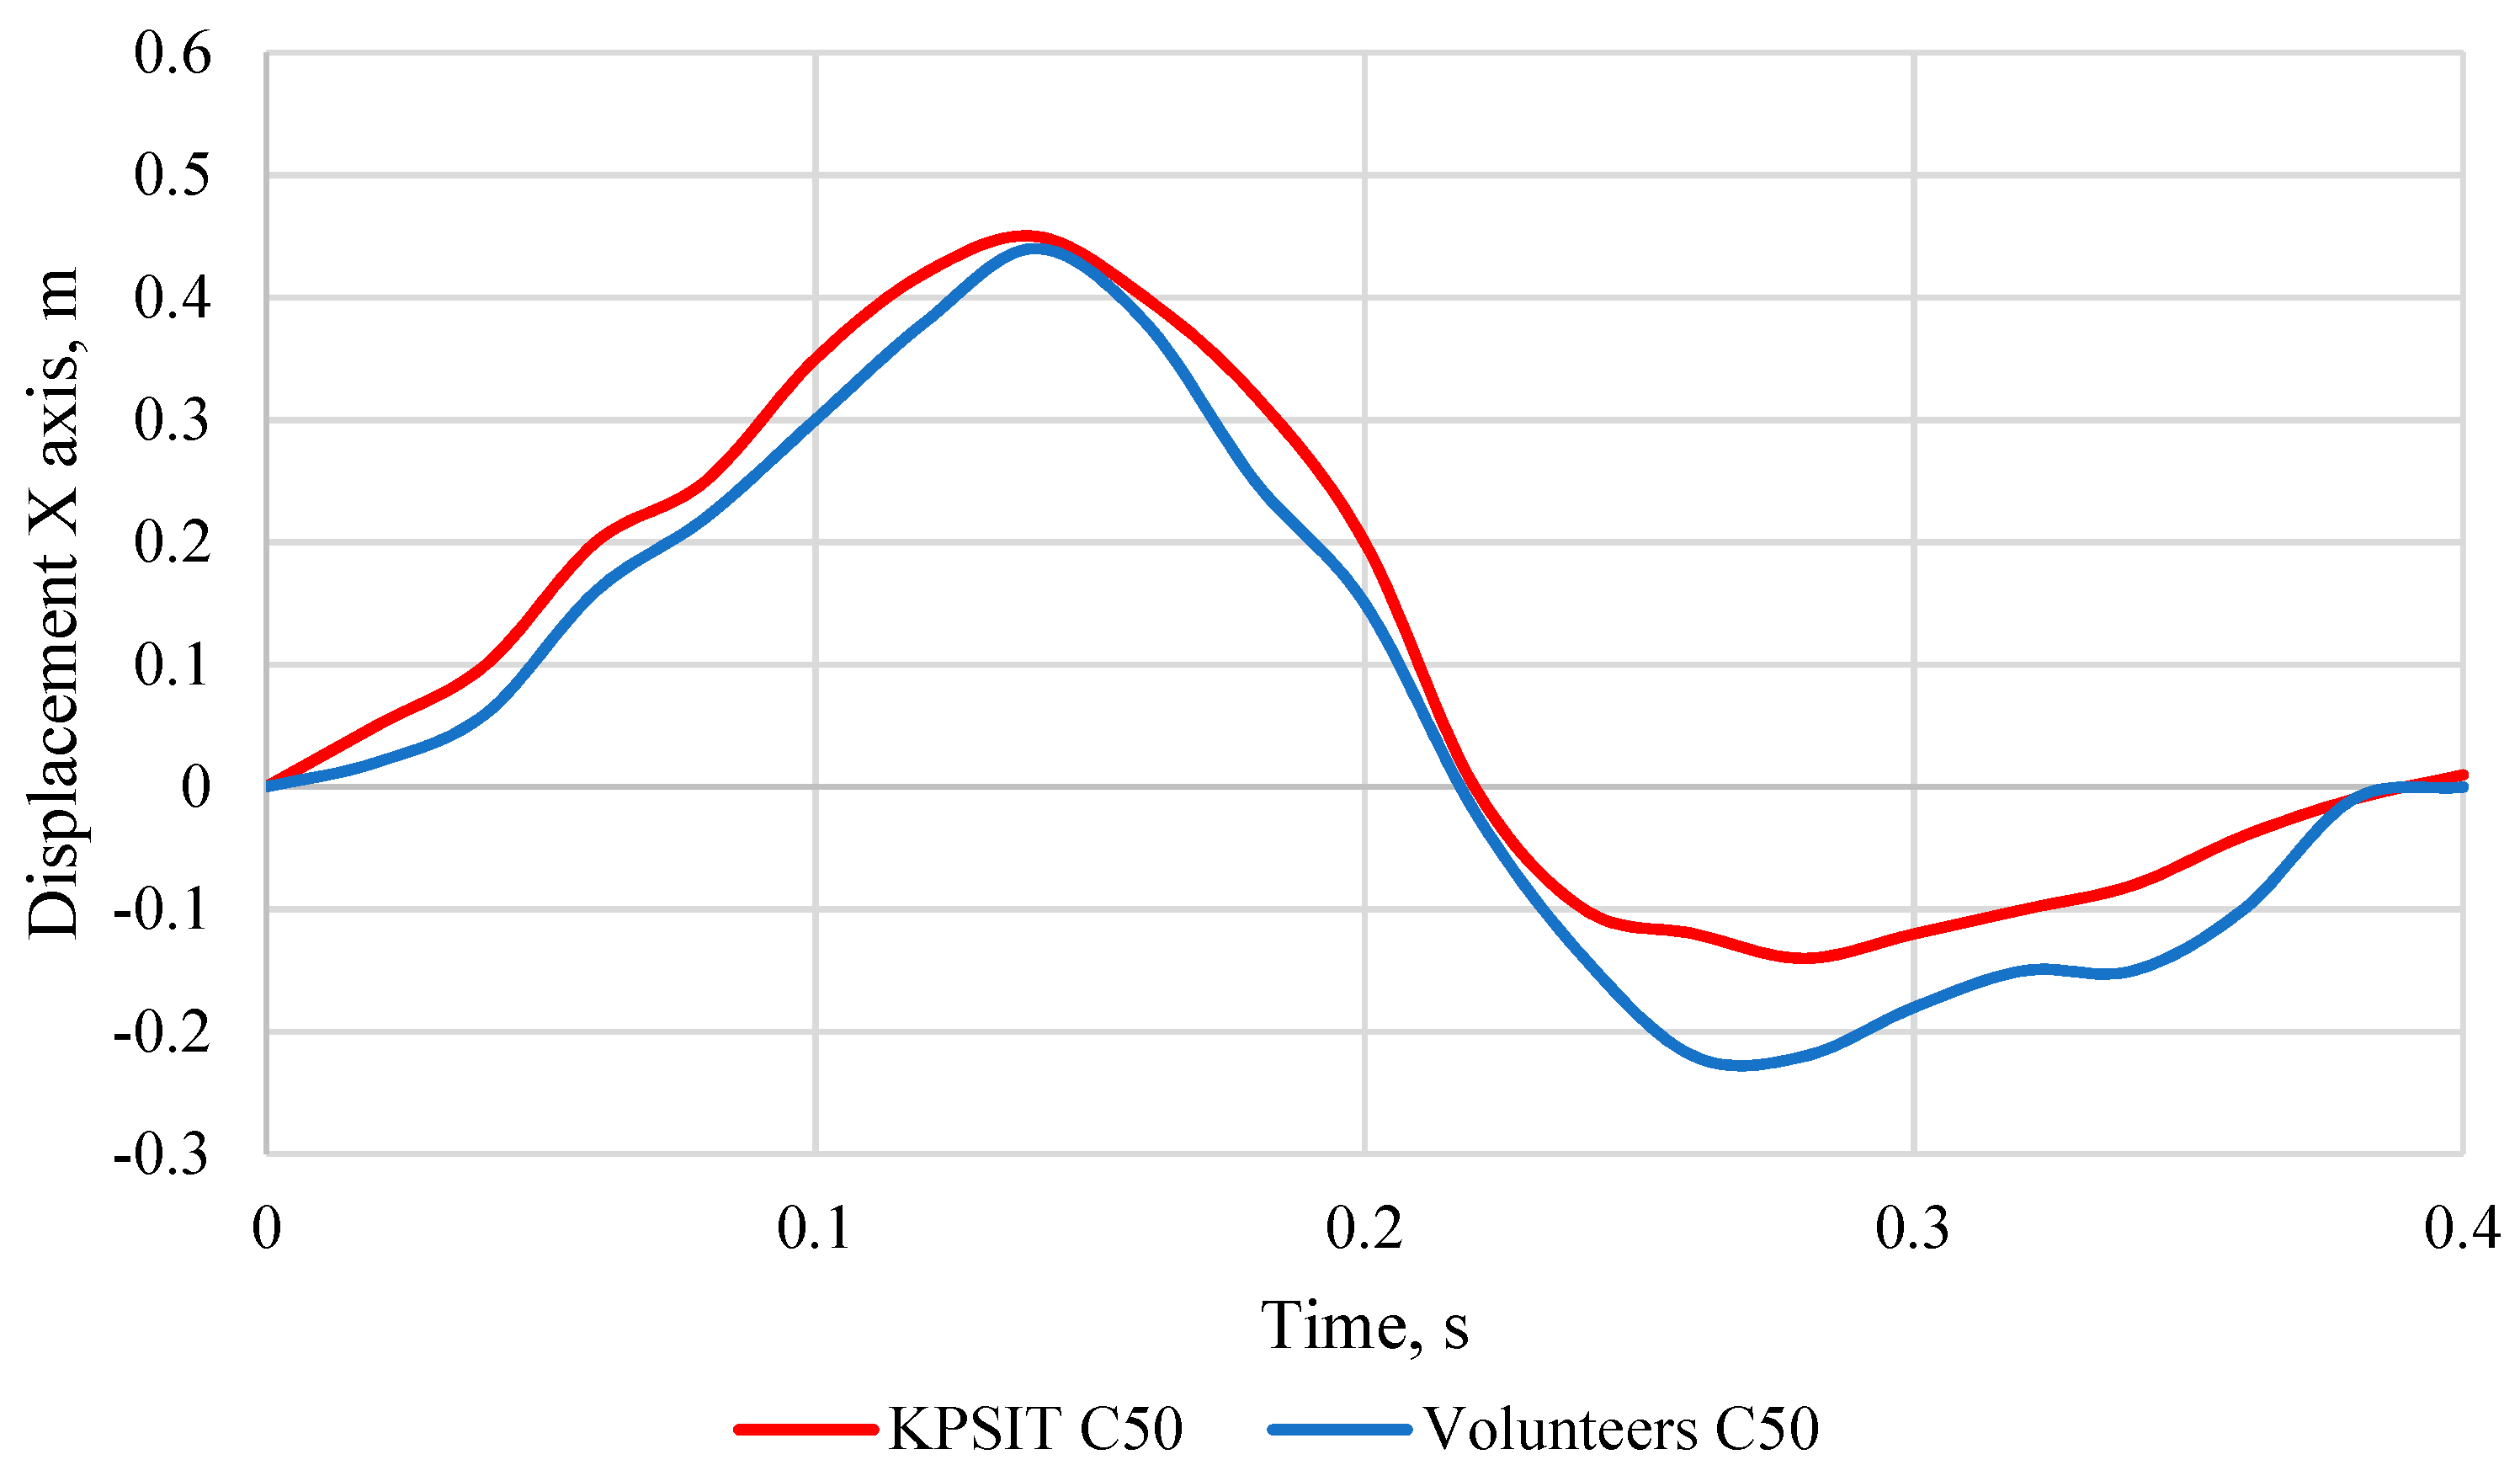
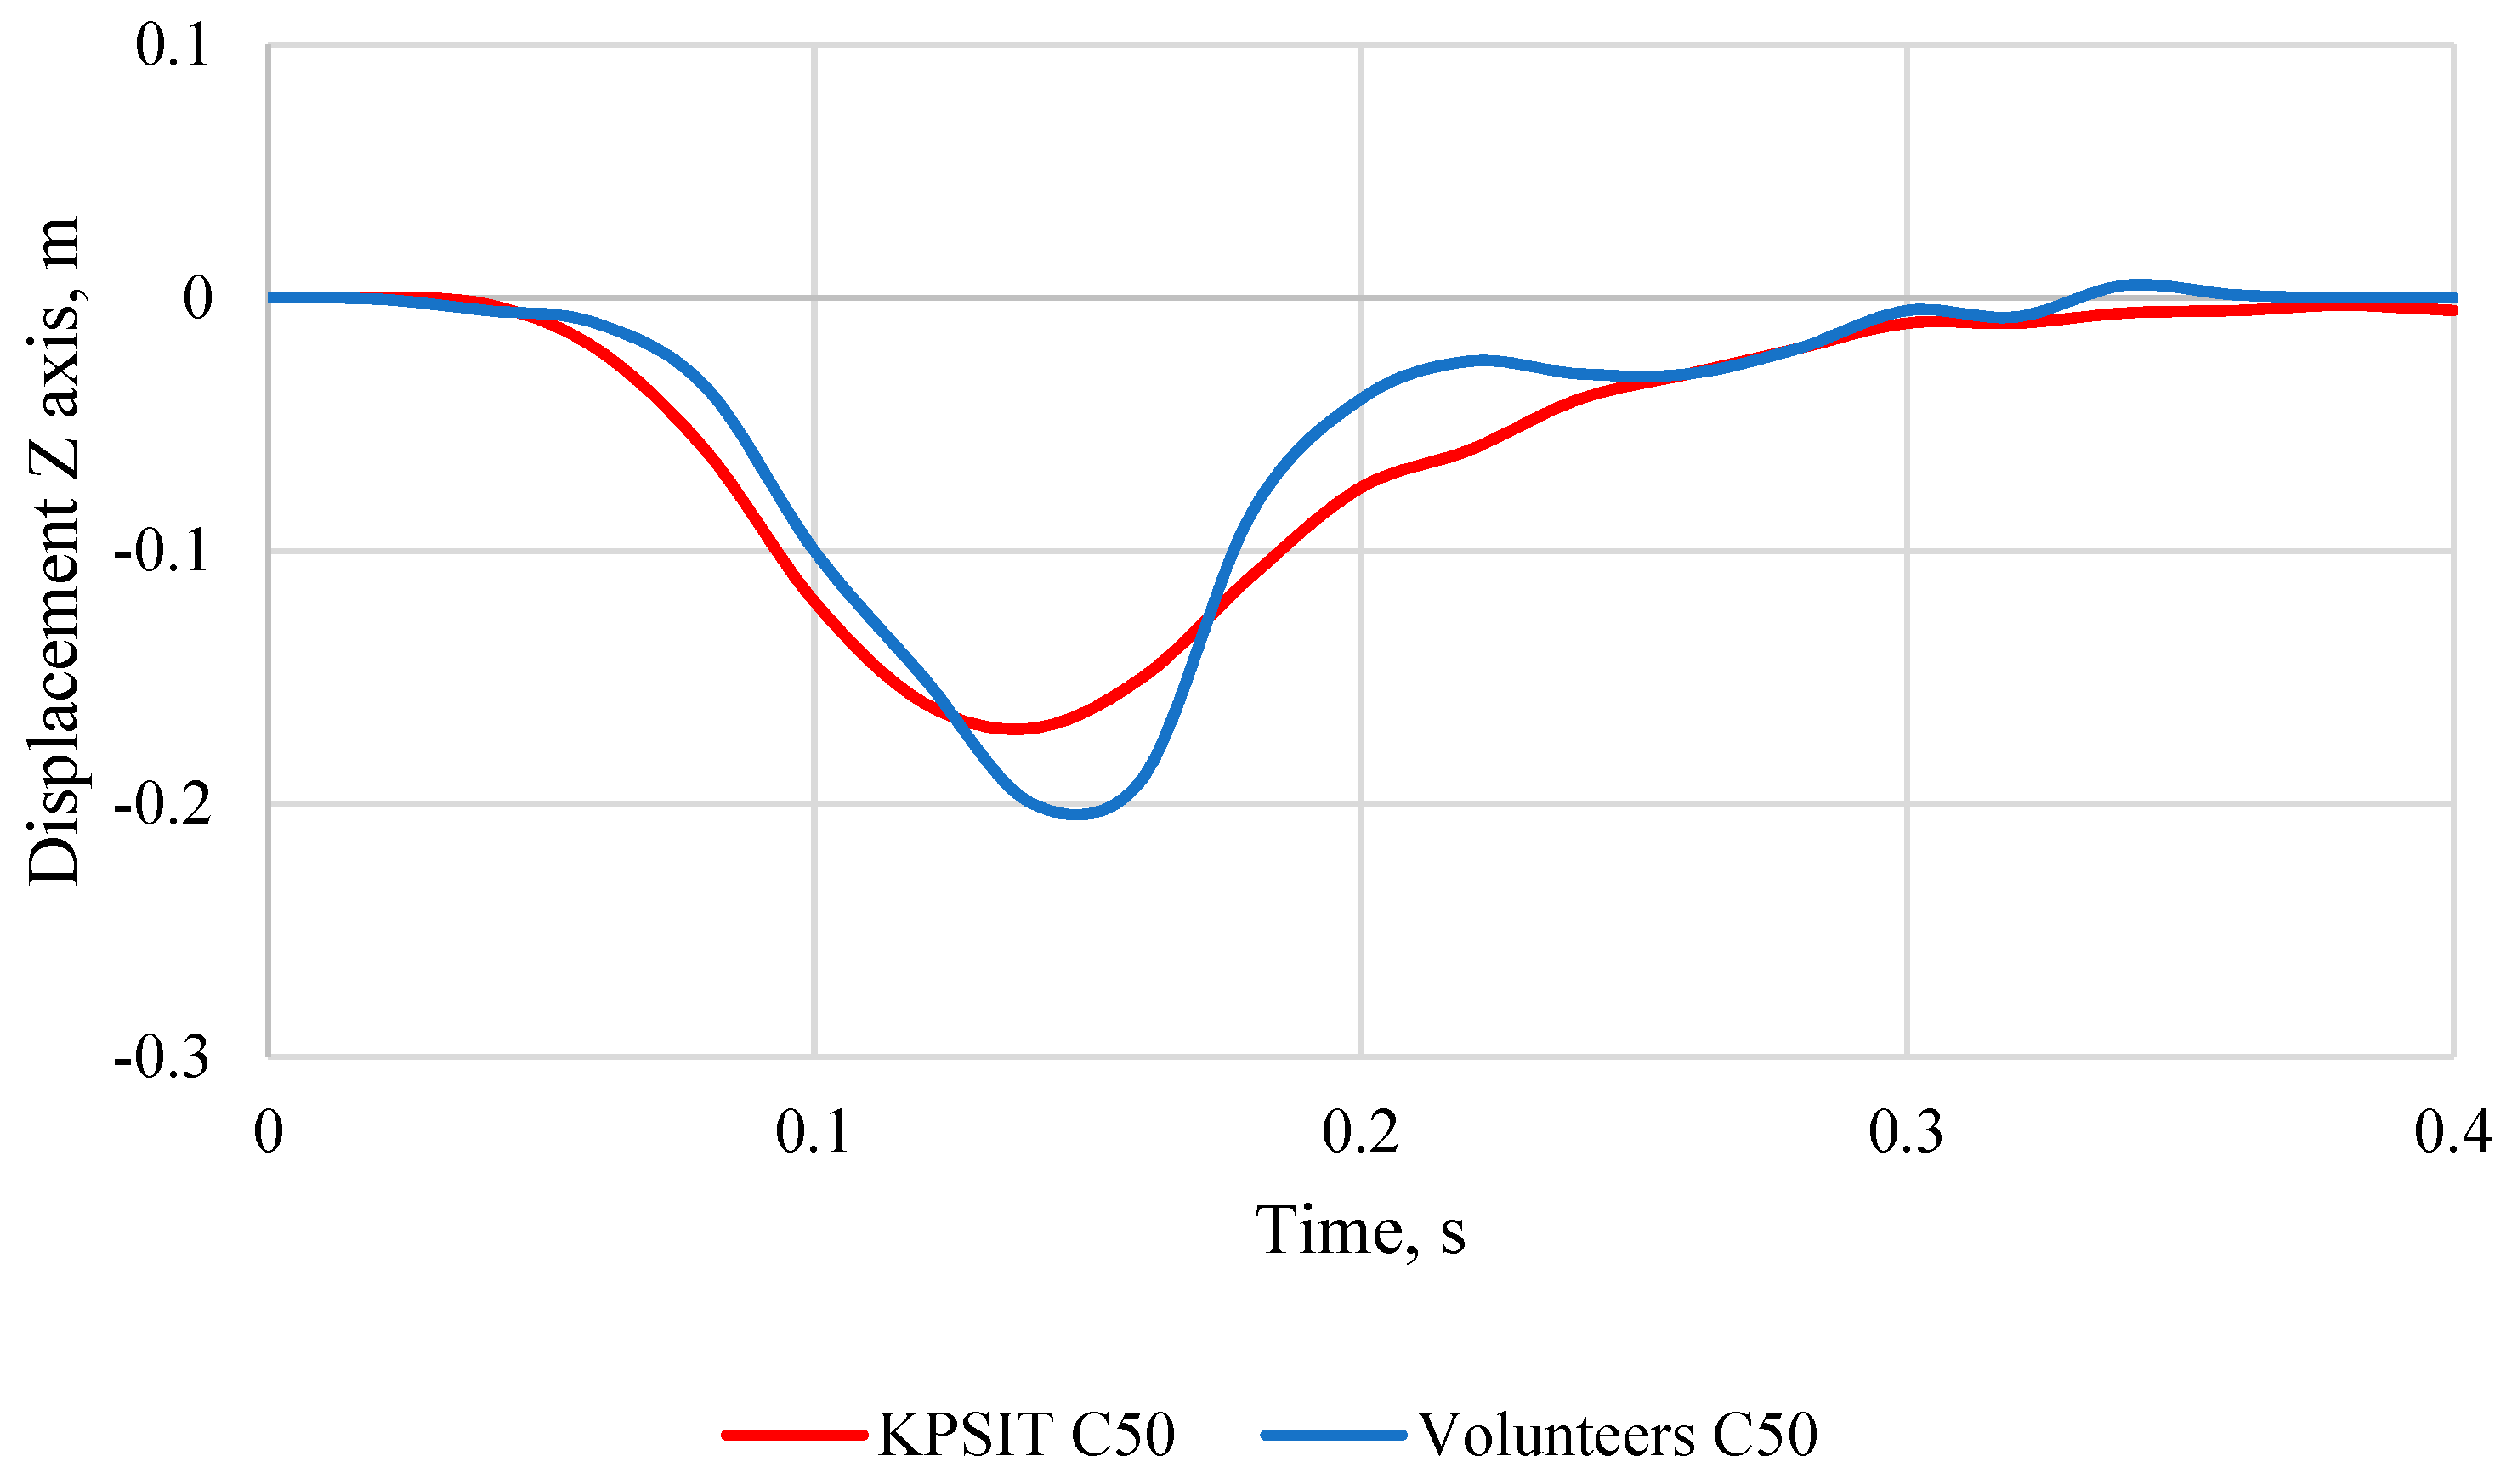
5.2. Comparison of the Head Trajectory of Volunteers with the KPSIT C50 Dummy

On the basis of data obtained from vision tests, the displacement characteristics of the head of the KPSIT C50 physical dummy and C50 male volunteers were determined. Figure 27 and Figure 28 show comparisons of the displacement of the head of the C50 physical dummy (average result from five trials) with male volunteers representing the 50th percentile of the population (average score for five subjects) during a frontal impact. The results show that the displacement of the head of the KPSIT C50 dummy in the first phase of the collision reached softer values than in the case of volunteers. However, in the second phase of the collision, when the head tilts back to the maximum, higher displacement values occurred in the case of volunteers. The displacement of the head of C50 male volunteers (X-axis) in the first phase of the collision (average result for five volunteers) was 0.40 m, while in the second phase of the collision it was 0.22 m. In the case of the KPSIT C50 dummy, the head displacement (X-axis) in the first phase of the collision (averaged over five tests) was 0.45 m, while in the second phase of the collision it was 0.14 m.
The head displacement of the C50 male volunteers (Z-axis) in the first phase of the collision (average score for five volunteers) was 0.2 m. In the case of the KPSIT C50 dummy, the head displacement (Z-axis) in the first phase of the collision (averaged over five attempts) was 0.17 m.

5.3. Analysis of the Head Trajectory of the KPSIT C50 Dummy—Experimental Studies

Figure 29 and Figure 30 show the displacement of the head of the KPSIT C50 dummy relative to the X- and Z-axes during a frontal crash test at a speed of 20 km/h. The stand was equipped with a sports bucket seat, first with five-point belts and then with four-point belts. The KPSIT C50 dummy, which was validated with volunteers and the Hybrid III dummy, was designed to perform crash tests at low speed, in a variety of settings and configurations. The volunteers’ studies did not assume a change of vehicle seat and seat belts, so in further considerations, only the displacement of the head of the KPSIT C50 dummy was used. It should be noted that in the first phase of the collision in the direction of the X-axis, the head of the KPSIT C50 dummy leaned forward by a maximum of 0.202 m in the case of four-point belts and 0.185 m in the case of five-point belts. In the second phase of the collision, the head of the KPSIT C50 dummy moved backwards by 0.11 m for four-point belts and 0.10 m for five-point belts. Undoubtedly, the displacement of the head of the KPSIT C50 dummy using four-point or five-point belts compared to standard three-point belts has largely reduced the displacement of the head (maximum forward deflection of three-point belts is 0.45 m, four-point belt is 0.202 m, and five-point belt is 0.185 m).
The head displacement of the KPSIT C50 physical dummy representing the 50th percentile of the male population in the first phase of impact (0.14 s) in the direction of the Z-axis achieved less head displacement when using five-point belts in the sports seat than when using four-point belts in the sports seat. The displacement of the head of the KPSIT C50 physical dummy in the direction of the Z-axis was 0.035 m in the first phase of the collision during the test with the five-point belts and 0.029 m in the test with the four-point belts.
Figure 31 and Figure 32 show a comparison of head displacement relative to the X- and Z-axes of the C50 simulation dummy during a frontal crash test at low speed (20 km/h) with a passenger vehicle seat using three-point and four-point belts. It should be noted that in the first phase of the collision in the direction of the X-axis, the head of the KPSIT C50 dummy leaned forward by a maximum of 0.45 m in the case of three-point belts and 0.173 m in the case of four-point belts. In the second phase of the collision, the head of the KPSIT C50 dummy moved backwards by 0.14 m for three-point belts and 0.78 m for four-point belts.
The head displacement of the KPSIT C50 physical dummy in the direction of the Z-axis was 0.055 m in the first phase of the collision during the test with the four-point belts and 0.20 m during the test with the three-point belts.
Experimental crash tests carried out with the KPSIT C50 dummy showed that the use of a bucket seat with five- or four-point belts reduced the displacement of the dummy’s head by almost 50% compared to the displacement of the dummy’s head on a passenger vehicle seat with point belts. Standard seat belts in a passenger vehicle allow the head of volunteers and the dummy to move over 40 cm. This result is unsatisfactory for safety reasons. Such a large movement at such a low collision speed can cause the driver’s head to hit the driver’s column or the passenger to hit the cockpit of the vehicle.

6. Discussion

Low-speed collisions, due to the low probability of loss of life, have been completely ignored in terms of the safety of drivers and passengers by the companies that manufacture and approve vehicles for public traffic. Low-speed crash tests involving volunteers have been described in a handful of scientific articles. In Ref. [43], the authors concluded, based on a literature review, that most of the existing dummies and their models are based on the male body, usually representing the 50th percentile of the population. In addition, the authors find that in a real collision, older, obese, or dwarf women are more likely to be injured. The authors also believe that most of the existing crash test dummies are based on the characteristics of the human population in Europe and the United States. From the point of view of injuries sustained in road accidents, the mechanisms of damage to individual parts of the body of a road accident participant cannot reflect the general human characteristics of other countries. The authors believe that in order to increase road safety, each country should develop a crash test dummy that meets the human characteristics of its country. Crash tests conducted on a group of 150 volunteers, who were classified to a given population percentile on the basis of the anthropometric atlas of the Polish population, showed differences in the trajectory of head movement during the crash test between the percentile groups. These differences do not exceed 15% (the difference in head displacement for the entire head trajectory of the volunteers during the crash test). In addition, the gender differences between the volunteers in each percentile group did not exceed 5%. Thus, the gender of the volunteers does not make much difference in the displacement of individual body parts during a low-speed collision.
In Ref. [44], an analysis of the displacement of the head movement of volunteers with the BIORID II dummy during a low-speed collision of 9 km/h was performed. This type of research was performed to validate the structure of the dummy’s neck. On the basis of a comparison of the displacement of the head of the volunteers (seven volunteers took part in the test), the biofidelity of the cervical segment of the dummy was assessed. In the experimental studies, the constructed KPSIT dummy was also validated in the process of comparing head displacement with volunteers. The KPSIT C50 crash test was performed five times and then averaged, then the head displacement result of five volunteers from the 50th percentile group of the male population was averaged. The head displacement characteristics of the KPSIT C50 dummy, compared to the head displacement of the C50 volunteers, satisfactorily reflected the head movement of the volunteers during the crash test.
In Ref. [45], crash tests of volunteers were conducted to quantify the repeatability, variability, and impact of seat design on human response. Crash tests of eleven volunteers showed head movement towards the Z-axis during a rear-end collision in the second phase of the collision. In addition, Ref. [46] shows that the head movement of a volunteer during a low-speed crash test using a standard passenger vehicle seat and standard seat belts is less than the head movement of a THOR dummy representing 50 percent of the male population. Our own research showed that the displacement of the volunteers’ heads during a low-speed collision in the direction of the X-axis was slightly smaller than for the KPSIT C50 dummy.
In Refs. [17,18], the authors conducted crash tests with volunteers to validate a simulation dummy representing the 50th percentile of the male population. The authors performed a time-lapse analysis of a volunteer crash test and a simulation dummy. The analysis made it possible to use the simulation dummy for side and rear crash tests. Validation of the behavior of individual parts of the simulation dummy’s body with the human body allowed for the selection of the moment of resistance in the joints of the simulation dummy. A similar procedure was carried out in experimental studies. Crash tests of volunteers were used to validate the body of the KPSIT C50 dummy, specifically the cervical joint. Satisfactory validation results allowed the KPSIT C50 dummy to be used in crash tests where the participation of volunteers was not possible.
Refs. [47,48] compare the advantages of using four-point belts in terms of driver comfort and safety. The five-point belts resulted in less body displacement and more stability than standard belts. Experimental tests carried out at low crash speed have shown that four-point belts reduce head movement towards the X-axis by almost 50% compared to standard three-point belts used.
It is a well-known fact that the position of the vehicle seat is important in terms of safety. A poorly positioned head restraint can cause damage to the cervical cut-off during a rear-end collision. Our own research shows that a displacement of the volunteers’ heads within the range of 0.50 m in the direction of the X-axis can cause the driver’s head to hit the steering column. Undoubtedly, there is a lack of information in the literature on the behavior of the human body during a low-speed collision. Although this type of collision is not life-threatening for the driver or passengers, it can lead to permanent damage to health and long-term and expensive rehabilitation. Our own research partially provides knowledge about the behavior of the human body during a low-speed collision. The results of the analysis of the displacement of the head and individual body parts of the volunteers during the low-speed crash test are necessary to validate the crash test dummies. The acquired knowledge allowed for the selection of the drag torque in the individual joints of the KPSIT C50 dummy. In addition, the knowledge gained from the implementation of experimental research is needed to develop a procedure for adjusting the seat of a passenger vehicle that will be safe, comfortable, and ergonomic for the driver.

7. Conclusions

Frontal impact tests were developed by the European Enhanced Vehicle Safety Committee at the end of the twentieth century. The head-on collision is performed at a speed of 64 km/h; during the test, the speeding vehicle hits the deforming barrier. The assessment of driver and passenger safety offered by vehicles is based on the analysis of the data collected during the frontal test by sensors that are located in the dummies.
For low-speed crash tests, the constructed dummy can be used for all types of crash tests. The use of a single dummy for frontal and rear crash tests makes it possible to verify human behavior during collisions in traffic jams. In addition, during crash tests at low speeds, the type of vehicle seat and the type of seat belt are of great importance for moving the head of the dummy or volunteers.
For low-speed crash tests, a constructed dummy can be used for all types of crash tests. The use of a single dummy for frontal and rear crash tests makes it possible to mimic human behavior during collisions. The results of our experiments showed minimal differences in the displacement of the volunteers’ heads in terms of gender. The built KPSIT C50 low-speed dummy can help predict human injuries caused by rear-end collisions. In addition, the use of four-point or five-point belts compared to standard seat belts was shown to reduce the displacement of the head by approximately 50% during a collision at a speed of 20 km/h.
The conducted experimental studies confirmed the research hypotheses. The difference between the sex of the volunteers participating in the low-speed crash test resulted in a maximum of 5% difference in the displacement of the head movement in the direction of the X- and Z-axes. In addition, the second working hypothesis left behind was also confirmed. The use of four-point or five-point belts greatly reduces the distance of the head tilt towards the X-axis during the crash test. Reduction of head displacement in a low-speed collision reduces the risk of the driver hitting the steering column with the head.
In summary, extensive experimental research fulfills both a cognitive purpose and can be used for practical purposes as tools for the reconstruction and analysis of road accidents. In addition, only by carefully analyzing the displacement of individual parts of the human body during a low-speed crash test can we determine the potential hazard of a human body hitting the cockpit of a vehicle. A thorough analysis will help to construct active and passive systems that increase the safety of road users.
Further work by the authors will include a comparison of the head trajectory of the KPSIT C50 dummy when changing the angles of the vehicle seat backrest and an analysis of the displacement of individual body parts of the KPSIT C50 dummy during rear and side collisions at low crash speeds.

Funding

The research was carried out using the KR.0004.1.130.2020 programmed financed by the National Science Centre under the MINIATURA VI.

Institutional Review Board Statement

The article was conducted in accordance with the Declaration of Helsinki, and approved by the Institutional Ethics Committee of Kielce University of Tehnologi NAME OF INSTITUTE (004 of the day 3 November 2022).

Informed Consent Statement

Informed consent was obtained from all subjects involved in the research.

Data Availability Statement

Data from conducted surveys and observational studies may be made available after sending an inquiry to the authors.

Conflicts of Interest

The author declares no conflict of interest.

References

  1. Champahom, T.; Se, C.; Aryuyo, F.; Banyong, C.; Jomnonkwao, S.; Ratanavaraha, V. Crash Severity Analysis of Young Adult Motorcyclists: A Comparison of Urban and Rural Local Roadways. Appl. Sci. 2023, 13, 11723. [Google Scholar] [CrossRef]
  2. Hudecová, V.; Chriašteľ, P. The Directive Facilitating Cross-Border Exchange of Information. Arch. Automot. Eng. Arch. Motoryz. 2021, 92, 17–31. [Google Scholar] [CrossRef]
  3. Podosek, K.; Frej, D.; Górniak, A.; Elvira, N. 50 percentile dummy movement analysis using TEMA Automotive software. Arch. Automot. Eng. Arch. Motoryz. 2022, 97, 25–50. [Google Scholar] [CrossRef]
  4. Kohút, P.; Macurová, Ľ.; Rédl, M.; Ballay, M. Application of Rectification Method for Processing of Documentation from the Place of Road Accident. Arch. Automot. Eng. Arch. Motoryz. 2020, 88, 37–46. [Google Scholar] [CrossRef]
  5. Vrabel, J.; Rievaj, V.; Synák, F.; Babic, D. Examination of the vehicle light intensity in terms of road traffic safety: A case study. Arch. Automot. Eng. Arch. Motoryz. 2018, 81, 137–146. [Google Scholar] [CrossRef]
  6. Czarnecka, W. Prędkość i jej Wpływ na Wypadki na Drogach z Udziałem Zwierząt (Speed and Its Impact on Animal Accidents), Budownictwo i Architektura, t. 15, 1, Politechnika Lubelska; Wydawnictwo Politechniki Lubelskiej: Lublin, Poland, 2016; pp. 249–257. [Google Scholar]
  7. Wang, Q.; Wei, B.; Wei, Z.; Gao, S.; Jin, X.; Yang, P. Reconstruction of a Car–Running Pedestrian Accident Based on a Humanoid Robot Method. Sensors 2023, 23, 7882. [Google Scholar] [CrossRef]
  8. Naeem, A.B.; Senapati, B.; Islam Sudman, M.S.; Bashir, K.; Ahmed, A.E.M. Intelligent Road Management System for Autonomous, Non-Autonomous, and VIP Vehicles. World Electr. Veh. J. 2023, 14, 238. [Google Scholar] [CrossRef]
  9. Reveles-Gómez, L.C.; Luna-García, H.; Celaya-Padilla, J.M.; Barría-Huidobro, C.; Gamboa-Rosales, H.; Solís-Robles, R.; Arceo-Olague, J.G.; Galván-Tejada, J.I.; Galván-Tejada, C.E.; Rondon, D.; et al. Detection of Pedestrians in Reverse Camera Using Multimodal Convolutional Neural Networks. Sensors 2023, 23, 7559. [Google Scholar] [CrossRef]
  10. Li, M.; Zhang, D.; Liu, Q.; Zhang, T. Driver Injury from Vehicle Side Impacts When Automatic Emergency Braking and Active Seat Belts Are Used. Sensors 2023, 23, 5821. [Google Scholar] [CrossRef]
  11. Masumitsu, A.; Hitosugi, M.; Baba, M.; Nakamura, M.; Koike, K.; Ida, H.; Aoki, M. Predictive Factors of the Fatality of Motor Vehicle Passengers Involved in Far-Side Lateral Collisions: A National Crash Database Study. Healthcare 2023, 11, 1496. [Google Scholar] [CrossRef]
  12. Rezapour, M.; Ksaibati, K. Understanding the Complex Impacts of Seatbelt Use on Crash Outcomes. Computation 2022, 10, 58. [Google Scholar] [CrossRef]
  13. Vivas Pacheco, H.; Rodríguez-Mariaca, D.; Jaramillo, C.; Fandiño-Losada, A.; Gutiérrez-Martínez, M.I. Traffic Fatalities and Urban Infrastructure: A Spatial Variability Study Using Geographically Weighted Poisson Regression Applied in Cali (Colombia). Safety 2023, 9, 34. [Google Scholar] [CrossRef]
  14. Islam, M.K.; Reza, I.; Gazder, U.; Akter, R.; Arifuzzaman, M.; Rahman, M.M. Predicting Road Crash Severity Using Classifier Models and Crash Hotspots. Appl. Sci. 2022, 12, 11354. [Google Scholar] [CrossRef]
  15. Marianne, M.; Malcolm Henry, P.; Hung-Kay, C.D. Muscle activity during low-speed rear impact. Chin. J. Traumatol. 2019, 22, 80–84. [Google Scholar] [CrossRef]
  16. Jaśkiewicz, M.; Więckowski, D.; Poliak, M.; Frej, D. Shoulder joint design of the anthropometric dummy used for crash tests. In Proceedings of the 2020 XII International Science-Technical Conference AUTOMOTIVE SAFETY, Kielce, Poland, 21–23 October 2020; pp. 1–5. [Google Scholar] [CrossRef]
  17. Jaśkiewicz, M.; Frej, D.; Matej, J.; Chaba, R. Analysis of the Head of a Simulation Crash Test Dummy with Speed Motion. Energies 2021, 14, 1476. [Google Scholar] [CrossRef]
  18. Frej, D.; Jaśkiewicz, M. Comparison of Volunteers’ Head Displacement with Computer Simulation—Crash Test with Low Speed of 20 km/h. Sensors 2022, 22, 9720. [Google Scholar] [CrossRef]
  19. Gidlewski, M.; Prochowski, L. Analysis of motion of the body of a motor car hit on its side by another passenger car. In Proceedings of the Scientific Conference on Automotive Vehicles and Combustion Engines (KONMOT), Krakow, Poland, 22–23 September 2023; Volume 48, pp. 22–23, Paper No. 012039. [Google Scholar]
  20. Pachocki, Ł.; Bruski, D. Modeling, simulation, and validation of a TB41 crash test of the H2/W5/B concrete vehicle restraint system. Arch. Civ. Mech. Eng. 2020, 20, 467–489. [Google Scholar] [CrossRef]
  21. Jaśkiewicz, M.; Jurecki, R.; Witaszek, K.; Więckowski, D. Overview and analysis of dummies used for crash tests. Zesz. Nauk./Akad. Morska W Szczecinie 2013, 35, 22–31. [Google Scholar]
  22. Iwamoto, M.; Nakahira, Y. Development and Validation of the Total HUman Model for Safety (THUMS) Version 5 Containing Multiple 1D Muscles for Estimating Occupant Motions with Muscle Activation During Side Impacts. Stapp Car Crash J. 2015, 59, 53–90. [Google Scholar]
  23. Chen, H.; Tang, H.; Cheng, X.; Zhang, L.; Wang, Z. Experimental Observations of Animal Neck Injuries under Whiplash Simulations. In Proceedings of the 2012 Third International Conference on Digital Manufacturing & Automation, Gulin, China, 31 July–2 August 2012; pp. 398–401. [Google Scholar] [CrossRef]
  24. Moravčík, E.; Jaśkiewicz, M. Boosting car safety in the EU. In Proceedings of the 2018 XI International Science-Technical Conference Automotive Safety, Casta-Papiernicka, Častá, Slovakia, 18–20 April 2018; pp. 1–5. [Google Scholar] [CrossRef]
  25. Kent, R. Air Bag Loading on In-Position Hybrid III Dummy Neck. In Air Bag Development and Performance: New Perspectives from Industry, Government and Academia; SAE: Warrendale, PA, USA, 2003; pp. 601–616. [Google Scholar]
  26. Kent, R. Assessment of Air Bag Deployment Loads with the Small Female Hybrid III Dummy. In Air Bag Development and Performance: New Perspectives from Industry, Government and Academia; SAE: Warrendale, PA, USA, 2003; pp. 519–530. [Google Scholar]
  27. Lai, X.; Ma, C.; Hu, J.; Zhou, Q. Impact direction effect on serious-to-fatal injuries among drivers in near-side collisions according to impact location: Focus on thoracic injuries. Accid. Anal Prev. 2012, 48, 442–450. [Google Scholar] [CrossRef]
  28. Cormier, J.; Gwin, L.; Reinhart, L.; Wood, R.; Bain, C. A Comprehensive Review of Low-Speed Rear Impact Volunteer Studies and a Comparison to Real-World Outcomes. Spine 2018, 43, 1250–1258. [Google Scholar] [CrossRef] [PubMed]
  29. Grip, H.; Ohberg, F.; Wiklund, U.; Sterner, Y.; Karlsson, J.S.; Gerdle, B. Classification of neck movement patterns related to whiplash-associated disorders using neural networks. IEEE Trans. Inf. Technol. Biomed. 2003, 7, 412–418. [Google Scholar] [CrossRef]
  30. Liu, Z.; Zhang, X.; Chen, H.; Shi, Y. Optimization of Calibration Parameters for Hybrid III 5th Female Dummy Neck Calibration Based on Taguchi Method. In Proceedings of the 2010 Third International Conference on Information and Computing, Wuxi, China, 4–6 June 2010; pp. 97–100. [Google Scholar] [CrossRef]
  31. The Economic and Societal Impact of Motor Vehicle Crashes, 2019 (Revised). Available online: https://crashstats.nhtsa.dot.gov/Api/Public/ViewPublication/813403 (accessed on 18 August 2023).
  32. NHTSA: Traffic Crashes Cost America $340 Billion in 2019. Available online: https://www.codot.gov/safety/traffic-safety-pulse/2023/february/nhtsa-traffic-crashes-cost-america-340-billion-in-2019 (accessed on 18 August 2023).
  33. Nolet, P.S.; Nordhoff, L.; Kristman, V.L.; Croft, A.C.; Zeegers, M.P.; Freeman, M.D. Is Acceleration a Valid Proxy for Injury Risk in Minimal Damage Traffic Crashes? A Comparative Review of Volunteer, ADL and Real-World Studies. Int. J. Environ. Res. Public Health 2021, 18, 2901. [Google Scholar] [CrossRef] [PubMed]
  34. Kullgren, A.; Lie, A.; Tingvall, C. Comparison Between Euro NCAP Test Results and Real-World Crash Data. Traffic Inj. Prev. 2010, 11, 587–593. [Google Scholar] [CrossRef] [PubMed]
  35. Kim, S.; Lee, K.; Lee, D.; Lee, H. Bumper System Development to Meet New IIHS Bumper Test Using CAE and Optimization. In Proceedings of the SAE 2009 World Congress, Detroit, MI, USA, 20–23 April 2009. [Google Scholar] [CrossRef]
  36. Liu, W.; Cheng, X.; Shan, Y.; Li, H.; Yang, H. Improvement of bumper structure for pedestrian lower leg protection based on Euro-NCAP. In Proceedings of the 2011 International Conference on Mechatronic Science, Electric Engineering and Computer (MEC), Jilin, China, 19–22 August 2011; pp. 648–652. [Google Scholar] [CrossRef]
  37. Przegub barkowy manekina antropometrycznego do testów zderzeniowych (Shoulder Joint of the Anthropometric Crash Test Dummy Application). Zgłoszenie oznaczono numerem: P.433041, [WIPO ST 10/C PL433041]. Available online: https://ewyszukiwarka.pue.uprp.gov.pl/search/pwp-details/P.433041 (accessed on 15 October 2023).
  38. Przegub kolanowy manekina antropometrycznego do testów zderzeniowych (Knee-Joint of the Anthropometric Crash Test Dummy). Zgłoszenie oznaczono numerem: P.431522, [WIPO ST 10/C PL431522]. Available online: https://ewyszukiwarka.pue.uprp.gov.pl/search/pwp-details/P.431522, (accessed on 15 October 2023).
  39. Itu, C.; Toderita, A.; Melnic, L.-V.; Vlase, S. Effects of Seat Belts and Shock Absorbers on the Safety of Racing Car Drivers. Mathematics 2022, 10, 3593. [Google Scholar] [CrossRef]
  40. Whyte, T.; Kent, N.; Keay, L.; Coxon, K.; Brown, J. Frontal crash seat belt restraint effectiveness and comfort accessories used by older occupants. Traffic Inj. Prev. 2020, 21, 60–65. [Google Scholar] [CrossRef]
  41. Atlas Miar Człowieka, Dane do Projektowania i Oceny Ergonomicznej (Human Atlas of Measures, Data for Design and Ergonomic Evaluation). CIOP. Available online: https://docer.pl/doc/5se5x5 (accessed on 18 August 2023).
  42. TEMA Pro. Available online: https://imagesystems.se/tema-pro/ (accessed on 18 August 2023).
  43. Xu, T.; Sheng, X.; Zhang, T.; Liu, H.; Liang, X.; Ding, A. Development and Validation of Dummies and Human Models Used in Crash Test. Appl. Bionics Biomech. 2018, 2018, 3832850. [Google Scholar] [CrossRef]
  44. Davidsson, J.; Deutscher, C.; Hell, W.; Lövsund, P.; Svensson, M.Y. Human Volunteer Kinematics in Rear-End Sled Collisions. J. Crash Prev. Inj. Control 2001, 2, 319–333. [Google Scholar] [CrossRef]
  45. Carlsson, A.; Linder, A.; Davidsson, J.; Hell, W.; Schick, S.; Svensson, M. Dynamic Kinematic Responses of Female Volunteers in Rear Impacts and Comparison to Previous Male Volunteer Tests. Traffic Inj. Prev. 2011, 12, 347–357. [Google Scholar] [CrossRef]
  46. Sandoz, B.; Persohn, S.; González-García, M.; Weber, J. Société de Biomécanique Young Investigator Award 2019: Upper body behaviour of seated humans in vivo under controlled lateral accelerations. Clin. Biomech. 2023, 105, 105952. [Google Scholar] [CrossRef]
  47. Sibilski, K.; Małachowski, J. Sensitivity study on seat belt system key factors in terms of disabled driver behavior during frontal crash. Acta Bioeng. Biomech. 2019, 21, 169–180. [Google Scholar] [CrossRef]
  48. Duma, S.M.; Moorcroft, D.M.; Gabler, H.C.; Manoogian, S.; Stitzel, J.; Duma, G.G. Analysis of pregnant occupant crash exposure and the potential effectiveness of four-point seatbelts in far side crashes. Annu. Proc. Assoc. Adv. Automot. Med. 2006, 50, 187–198. [Google Scholar] [PubMed]
Figure 1. Low-speed crash test simulation bench.
Sustainability 15 16015 g001
Figure 2. Diagram of the low-speed crash test stand.
Sustainability 15 16015 g002
Figure 3. Measurement data logging scheme.
Sustainability 15 16015 g003
Figure 4. Article organization scheme.
Sustainability 15 16015 g004
Figure 5. The course of acceleration of the platform with the vehicle seat during experimental research.
Sustainability 15 16015 g005
Figure 6. Bucket sport seat.
Sustainability 15 16015 g006
Figure 7. Passenger vehicle seat.
Sustainability 15 16015 g007
Figure 8. Diagram of the neck joint of the physical dummy.
Sustainability 15 16015 g008
Figure 9. Neck joint mounted to the frame and head of the C50 dummy.
Sustainability 15 16015 g009
Figure 10. Characteristics of the moment of resistance in the cervical joint of the physical dummy.
Sustainability 15 16015 g010
Figure 11. Example of the location of the marker for measuring the displacement of the marker located on the head of a volunteer during experimental tests.
Sustainability 15 16015 g011
Figure 12. Male representing the 50th percentile of the population.
Sustainability 15 16015 g012
Figure 13. Female representing the 50th percentile of the population.
Sustainability 15 16015 g013
Figure 14. Scenes from the collision of volunteers at low-speed crash test frames at low speed of 20 km/h: (a) time = 0.0 s; (b) time = 0.07 s; (c) time = 0.14 s; (d) time = 0.18 s; (e) time = 0.21 s; (f) time = 0.26 s.
Sustainability 15 16015 g014aSustainability 15 16015 g014b
Figure 15. Displacement of the head of C5 males in the direction of the X-axis, during crash test.
Sustainability 15 16015 g015
Figure 16. Displacement of the C5 women’s head in the X-axis direction during crash test.
Sustainability 15 16015 g016
Figure 17. Displacement of the C50 men’s head in the X-axis direction during crash test.
Sustainability 15 16015 g017
Figure 18. Displacement of the C50 women’s head in the X-axis direction during crash test.
Sustainability 15 16015 g018
Figure 19. Displacement of the C95 men’s head in the X-axis direction during crash test.
Sustainability 15 16015 g019
Figure 20. Displacement of the C95 women’s head in the X-axis direction during crash test.
Sustainability 15 16015 g020
Figure 21. Displacement of the C5 men’s head in the direction of the Z-axis during crash test.
Sustainability 15 16015 g021
Figure 22. Displacement of the C5 women’s head in the direction of the Z-axis during the crash test.
Sustainability 15 16015 g022
Figure 23. Displacement of the C50 men’s head in the direction of the Z-axis during crash test.
Sustainability 15 16015 g023
Figure 24. Displacement of the C50 women’s head in the direction of the Z-axis during crash test.
Sustainability 15 16015 g024
Figure 25. Displacement of the C95 men’s head in the direction of the Z-axis during crash test.
Sustainability 15 16015 g025
Figure 26. Displacement of the C95 women’s head in the direction of the Z-axis during crash test.
Sustainability 15 16015 g026
Figure 27. Displacement of the head of C50 volunteers and the KPSIT C50 dummy in the direction of the X-axis during a frontal collision at a speed of 20 km/h—passenger vehicle seat.
Sustainability 15 16015 g027
Figure 28. Displacement of the head of C50 volunteers and the KPSIT C50 dummy in the direction of the Z-axis during a frontal collision at a speed of 20 km/h—passenger vehicle seat.
Sustainability 15 16015 g028
Figure 29. Movement of the KPSIT C50 dummy in the direction of the X-axis during a frontal collision at a speed of 20 km/h—bucket sport seat, five-point belts and four-point belts.
Sustainability 15 16015 g029
Figure 30. Movement of the head of the KPSIT C50 dummy in the direction of the Z-axis during a frontal impact at a speed of 20 km/h—bucket sport seat, five-point belts and four-point belts.
Sustainability 15 16015 g030
Figure 31. Displacement of the head of the KPSIT C50 dummy in the direction of the X-axis during a frontal impact at a speed of 20 km/h—passenger vehicle seat, four-point belts and three-point belts.
Sustainability 15 16015 g031
Figure 32. Movement of the head of the KPSIT C50 dummy in the direction of the Z-axis during a frontal impact at a speed of 20 km/h—passenger vehicle seat, four-point belts and three-point belts.
Sustainability 15 16015 g032
Table 1. Anthropometric dimensions of measured parts of the human body according to a given population percentile [17,31].
DimensionsUnitWomanMan
5th Percentile50th Percentile95th Percentile5th Percentile50th Percentile95th Percentile
hand lengthcmod 10.3od 10.4 do 11.2od 11.3od 11.0od 11.1 do 12.1od 12.2
length of upper limbcmod 68.7od 68.8 do 76.9od 77.0od 74.9od 75.0 do 83.1od 83.2
length of elbow axis of the handlecmod 32.1od 32.2 do 37.9od 38.0od 35.6od 35.7 do 40.8od 40.9
arm lengthcmod 32.1od 32.2 do 35.5od 35.6od 35.8od 35.9 do 39.5od 39.6
arm length (forearm)cmod 17.2od 17.3 do 18.4od 18.5od 18.9od 19.0 do 20.3od 20.4
thigh length (buttock, knee)cmod 55.5od 55.6 do 60.1od 60.2 od 57.8od 57.9 do 62.4od 62.5
masskgod 57.5od 57.6 do 76.5od 76.6 od 69.0od 69.1 do 88.5od 88.6
head circumferencecmod 54.2od 54.3 do 56.8od 56.9od 55.7od 55.8 do 58.7od 58.8
chest circumferencecmod 86.7od 86.8 do 98.4od 98.5od 88.8od 88.9 do 100.2od 100.3
shoulder widthcmod 37.3od 37.4 do 40.1od 40.2od 43.4od 43.5 do 47.0od 47.1
head heightcmod 21.1od 21.2 do 22.9od 23.0od 22.8od 22.9 do 24.8od 24.9
body heightcmod 156.9od 157 do 166od 166.1od 169.5od 169.6 do 180.1od 180.2
knee heightcmod 40.4od 40.5 do 44.3od 44.4od 43.6od 43.7 do 48.3od 48.4
crotch height (length of lower limb)cmod 79.5od 79.6 do 86.3od 86.4od 86.4od 86.5 do 94.1od 94.2
medial height of the footcmod 7.2od 7.3 do 8.1od 8.2od 8.3od 8.4 do 9.1od 9.2
Table 2. Examples of dimensions of a volunteer taking part in crash tests.
DimensionsUnitMan
50th Percentile
hand lengthcm11.5
length of upper limbcm81.5
length of elbow axis of the handlecm37.5
arm lengthcm37.5
arm length (forearm)cm20.0
thigh length (buttock, knee)cm59.5
masskg82.5
head circumferencecm57.5
chest circumferencecm93.5
shoulder widthcm45.0
body heightcm179.0
head heightcm23.5
knee heightcm47.5
crotch height (length of lower limb)cm90.5
medial height of the footcm8.5
Disclaimer/Publisher’s Note: The statements, opinions and data contained in all publications are solely those of the individual author(s) and contributor(s) and not of MDPI and/or the editor(s). MDPI and/or the editor(s) disclaim responsibility for any injury to people or property resulting from any ideas, methods, instructions or products referred to in the content.

