Article

Calculation of Carbon Emissions and Study of the Emission Reduction Path of Conventional Public Transportation in Harbin City

School of Civil Engineering and Transportation, Northeast Forestry University, Harbin 150040, China
*
Author to whom correspondence should be addressed.
Sustainability 2023, 15(22), 16025; https://doi.org/10.3390/su152216025
Submission received: 4 August 2023 / Revised: 9 November 2023 / Accepted: 10 November 2023 / Published: 16 November 2023

Abstract

:
As the northernmost megacity in China, the long winters, large population size, and unsustainable transport structure in Harbin determine that the city will produce relatively large carbon emissions. The transportation industry is one of the three greenhouse gas emission sources; therefore, the development of low-carbon transportation is imperative. This work compares commonly used carbon emission measurement methods and chooses a mileage method to classify the carbon emissions of conventional buses of different energy types used in Harbin in 2020. A multi-factor grey prediction model was constructed to predict the population size of Harbin and the number of conventional buses. After that, a scenario analysis method was used to analyze the fuel structure of buses in Harbin from three perspectives: a pessimistic scenario, a baseline scenario, and an optimistic scenario. The carbon emissions of conventional buses were calculated for Harbin from 2023 to 2030. Finally, by combining the prediction results and factors influencing carbon emission, a regular bus path to minimize carbon emissions is proposed. The outcome of this study shows that the carbon emission environment in Harbin will be improved by reducing vehicle energy consumption, optimizing energy structure, standardizing driving behavior, building intelligent transportation, giving priority to public transportation, and improving the road network structure.

1. Introduction

In recent years, with the massive consumption of non-renewable energy, global warming has caused glaciers to melt and sea levels to rise. This has led to a serious threat to the ecological environment and human survival. Greenhouse gasses (GHGs) produced by the combustion of non-renewable energy are the direct cause of global warming. According to statistics, the net global anthropogenic GHG emissions in 2019 were approximately 52.4–65.6 GtCO2-eq, of which approximately 15% (8.7 GtCO2-eq) came from the transport, and the average annual growth rate of its emissions was maintained at approximately 2% [1]. For transportation, CO2 is the main greenhouse gas emitted [2]. The CO2 emissions from transportation for 2019–2022 are shown in Figure 1.
In China, CO2 emissions from transportation account for approximately 9% of the total national emissions. As cities are the center of human transportation, the proportion of carbon emissions and energy consumption from transport is even higher [3]. Conventional public transportation plays a key role in urban mobility and accessibility, and it reduces traffic congestion and other transport externalities [4]. Therefore, reducing CO2 emissions from conventional public transportation is of great importance for urban energy consumption and ecological protection.
Special climatic conditions pose a challenge to the renewal of the energy structure of conventional public transportation in Harbin. As the northernmost provincial capital city of China, Harbin has long and cold winters. During the cold season, vehicles tend to stay on the road longer due to icy roads, resulting in increased pollutant emissions [5]. Based on a green travel initiative and the development trend of urban transportation, new energy public transportation will inevitably become the main mode of urban transportation. In 2010, Harbin proposed to give priority to the development of urban public transport. In 2012, Harbin was identified by the Ministry of Transport as one of the first cities in China to be deemed a “National Public Transport City”. Xu et al. argued that CO2 emissions would increase if pure electric buses were introduced in Harbin in 2015 [6]. In 2018, the first series of pure electric buses were put into service. By the end of 2020, Harbin had a total of 7219 public transport vehicles and 322 operating lines, and the number of lines increased by 5.2% over the previous year. Moreover, the proportion of new and clean energy vehicles in new and renewed public buses and trams in the future will be no less than 80%. Therefore, studying the current stage of carbon emissions and future trends of conventional public transportation in Harbin will provide an important contribution to the formulation and implementation of energy-saving and emission reduction policies for urban public transport.
Previous studies have measured and predicted the carbon emissions of urban public transport systems, but there is a lack of refined analysis of carbon emission models for conventional public transport vehicles [7,8,9]. Therefore, this paper quantifies the carbon emissions of conventional public transportation in Harbin with the help of carbon emission models of buses with different power systems. Considering changes in the population scale and energy structure of public transport, a scenario analysis method is used to predict future trends in the carbon emissions of conventional public transportation and to propose practical paths for carbon reduction in public transport.
The rest of this paper is organized as follows: Section 2 introduces the related work of conventional public transportation carbon emission measurements, predictions, and carbon reduction paths. Section 3 describes the research methods and data. Section 4 then analyzes the reasons for the research results. Finally, this paper concludes with a discussion and conclusions section.

2. Literature Review

2.1. Calculation of Carbon Emissions

Some researchers have measured carbon emissions in cities by improving the existing IPCC emission calculation methods or establishing calculation models using the life cycle assessment (LCA) method. Shan et al. built a carbon emission inventory of Chinese cities based on the IPCC regional emission accounting method and calculated urban carbon emissions accordingly [10]. Alam et al. calculated road transport carbon emissions in Ireland from 1990 to 2012 using the IPCC Level 3 method [11]. Ghaemi et al. systematically introduced the life cycle assessment method to quantify city-scale carbon emissions using a mixed life cycle assessment and input–output life cycle assessment [12]. Milovanoff et al. adopted a life cycle method to establish the carbon emission calculation model of urban transport and passenger transport systems to calculate the carbon emissions of urban passenger transport in Singapore [13].
The measurement methods of carbon emissions from mobile sources can be generally classified into top-down models and bottom-up models. These two estimation models can be used to calculate the total carbon emissions, or to calculate the carbon emissions of different modes of transportation based on specific research objectives [14]. Ding et al. proposed a new grey multivariate model and designed a discrete grey model to measure carbon emissions after considering the case of nonlinear effects. The model is more accurate than other baseline models and can provide a basis for environmental policy and energy consumption planning [15,16]. He et al. proposed a spatiotemporal cell model that takes into account traffic dynamics, which opens the door to estimating carbon emissions from widely available low-fidelity traffic data [17]. Pan et al. proposed a gradient boosting regression tree (GBRT) model to measure CO2 emissions, which can deeply understand the emission characteristics of different types of buses [18]. Fan et al. used the long-term energy alternative planning (LEAP) model to calculate energy demand and greenhouse gas emissions under different scenarios during the period of 2016–2030 [3]. Mądziel, M built a liquified petroleum gas-fueled vehicle CO2 emission model based on a portable emission measurement system, on-board diagnostics data, and gradient-boosting machine learning [19]. Jaworski, A. presented a new approach for analyzing CO2 emissions for buses—this approach also takes into account the emissions of CO, which is also a greenhouse gas but is often overlooked in calculations [20].

2.2. Prediction of Carbon Emission

Based on existing carbon emission data, most scholars have focused on selecting and improving neural networks using optimization algorithms and predicting energy consumption and carbon emissions. Azam et al. used long-term energy alternative planning (LEAP) models to predict energy consumption and greenhouse gas emissions [21]. Alfaseeh et al. used deep sequence learning to predict greenhouse gas emissions from the road network in downtown Toronto [22]. Gao et al. proposed a new fraction-order gray Riccati (FGRM) model, which has better estimation ability and effectiveness for short-term carbon emission prediction [23]. Ozceylan et al. used particle swarm optimization (PSO) and artificial bee colony (ABC) technology to predict carbon emissions based on socio-economic indicators [24]. Fang et al. proposed an improved Gaussian process regression method for carbon emission prediction based on the improved particle swarm optimization algorithm [25]. Aggarwal et al. developed five scenarios projecting carbon emissions from Delhi’s transport sector in 2020 [26]. Li et al. used a scenario analysis to analyze the carbon emission reduction potential of China’s transportation industry under different scenarios [27]. Kousoulidou et al. forecast the carbon emissions of road transport in Europe in 2020 and explored low-carbon transport modes using a scenario analysis [28]. Liu et al. built a BP neural network carbon emission prediction model and provided policy suggestions for carbon emission trading using the results of a prediction and scenario analysis [29]. Coelho established a carbon emission prediction model based on the current development form and analyzed the effects of different scenarios of traffic carbon emissions [30]. Pamuła, T. proposed a novel deep-learning-based model for predicting the energy consumption of an electric bus traveling in an urban area. This model addresses two important issues: accuracy and cost of prediction [31]. The existing studies on carbon emission prediction were achieved by using scenario setting methods, but the division of scenarios is affected by many factors. Some scenarios may not be realized, and the final forecast results will lack objectivity and reliability.

2.3. Emission Reduction Path

Some scholars have developed a carbon emission reduction path according to different scenarios, analyzing in detail the emission reduction measures of each influencing factor on the path and ultimately achieving the carbon emission reduction target of the entire path. Jovanovic et al. believe that carbon emissions can be effectively reduced by instituting strict measures to restrict private car travel, improve the efficiency of road use, and strengthen the construction of urban public transportation systems [32]. Arioli et al. proposed major changes in travel methods, technologies, fuels, and strengthening of the implementation of existing policies to achieve the goal of low-carbon transportation [33]. Chatziioannou et al. revealed the interrelationship between traffic negative externalities, which can be solved through reasonable organization of sustainable transportation and public policies [34]. Liu et al. proposed a decarbonization measure combining advanced vehicle technology with the building supply chain, which can reduce the total life cycle carbon emissions of roads [35]. Wu et al. believe that comprehensive emission control policies and measures can effectively reduce automobile carbon emissions [36]. Jung et al. took traffic behavior as the research object and proposed that car sharing can help reduce greenhouse gas emissions [37]. Fan et al. established a multivariate generalized Fisher index decomposition model to measure the influencing factors of carbon emissions, and they proposed a series of measures to curb traffic carbon emissions [38]. Formulating policies and establishing a carbon emissions trading system can contribute to the achievement of emission reduction targets. Altieri et al. discussed South Africa’s emission reduction policies, which focus on major reform and decarbonization of the energy system [39]. Bayer et al. believe that the carbon market is an effective tool for reducing emissions by creating an incentive mechanism to regulate carbon emissions through carbon pricing [40]. Cao et al. proposed a hybrid system consisting of an emissions trading system and a carbon tax that could achieve emissions reduction targets at a lower cost [41]. The carbon emission reduction of a transportation system is realized in the interaction between macro, meso, and micro levels. At the micro level, transportation systems achieve carbon reduction by improving the level of infrastructure technology. At the meso level, optimization initiatives within the industry are developed from a structural perspective. At the macro level, carbon market and carbon tax, as two important policy tools to deal with climate change, play an important role in promoting the process of socio-economic low-carbon transitions. In absolute terms, the macro and meso levels are currently in progress, while the micro level will be addressed in the future. The implementation of the macro and meso levels is the basis for the implementation of the micro level.

3. Methodology and Data Preparation

The research idea of this paper is to analyze the public transportation situation in Harbin, to determine the research objectives, and to construct carbon emission measurement models of different types of vehicles based on theoretical technology. Additionally, this research aims to forecast the carbon emissions of conventional buses in Harbin. According to the influencing factors of transportation carbon emissions, a reduction path is proposed. The study framework is shown in Figure 2.

3.1. Emission Calculation Model

According to the type of energy used, buses can be classified as petrol, diesel, natural gas, pure electric, and hybrid vehicles. The calculation method for carbon emissions of traditional buses with different fuel types is shown in the Equation (1) [14].
P CO 2 = D × E × F × N
where P CO 2 is the total carbon emissions produced by the vehicle, D is the average annual mileage per vehicle, E is the vehicle energy consumption per 100 km, F is the carbon emission factor, and N is the number of vehicles.
Gasoline, diesel, and natural gas vehicles all use primary energy. Their carbon emission factors can be obtained from ref. [42] and measured directly in terms of driving mileage without energy conversion. The procedure of this model can be briefly described as shown in Equation (2).
Q bev , j = q bev , j η cd 1 ω xs
where Qbev,j is the power consumption on the power supply side, qbev,j is the electricity consumption during the operation of a pure electric bus, ηcd is the charging efficiency of electric buses, and ωxs is the Line loss rate.
Pure electric vehicles can be converted from coal consumption values for pure electrical energy consumption. For example, according to the National Energy Bureau of Statistics, the standard coal consumption for power plants of 6000 kW and above was 305.5 g/kWh in 2020, and the national line loss rate was 5.62%. Taking the charging efficiency as 100%, an electric vehicle consumed 1 kWh of electric energy, which required the consumption of 323.7 g of coal, as shown in Equation (3).
E F CO 2 = E C × C O 2 e + E F × C O 2 f
where EFCO2 is the carbon emissions, EC is the 100 km electricity consumption, EF is the 100 km gas consumption, CO2e is the CO2 emission intensity of electricity, and CO2f is the carbon dioxide emission factor of natural gas.
The carbon emissions from the electricity and natural gas consumed during hybrid operation are calculated separately. In this case, the electric energy is calculated using the model of pure electric buses, and natural gas is calculated using the carbon emission model of fuel and gas vehicles and then summed.

3.2. Emission Prediction

Because population development is affected by many factors, the current classical GM (1,1) model cannot effectively predict all of the factors. In this paper, a multi-factor grey prediction model (MGM) is established on the basis of a GM model and the principle of linear regression.
The first step is to use the principle of multiple linear regression to establish a prediction model, as shown in in Formula (4):
y ^ t = a 0 + a 1 x ^ 1 t + a 2 x ^ 2 t + + a k x ^ k t
where, y ^ ( t ) is the predicted value of the population at time t ,   x ^ i ( t ) is the predicted value of the independent variable at time t and a i ( i = 1 , 2 , , k ) is the estimated parameter.
The second step is to predict the value of various factors at t time by using GM (1,1) grey prediction model.
The third step is to determine the estimated parameter a i . The estimated parameters are obtained from the observations y ( 1 ) , , y ( m ) and x i ( 1 ) , x i ( 2 ) , , x i ( m ) ( i = 1 , 2 , , k ) , as shown in substitution (5):
A = a 0 , a 1 , , a k T = X T X 1 X T Y
In Equation (5): X = 1 x 1 1 x k 1 1 x 1 2 x k 2 1 x 1 m x k m ; Y = y 1 y 2 y m
In the fourth step, the estimated parameters and the predicted values of various factors are substituted (4) to obtain the predicted values of the dependent variables at each time.

4. Case Study: Harbin, China

Bus vehicles of different energy types in Harbin are the experimental subject of this paper. Harbin is the northernmost comprehensive transportation hub in China. There are two reasons for choosing Harbin as a case study: first, there are a variety of energy types used by bus vehicles in Harbin. Secondly, there is a relatively high proportion of fuel vehicles among the many types of energy used in Harbin during the heating season, which results in a more significant impact from the transition to new energy buses. Therefore, studying its carbon reduction is more representative.
Harbin has 3 subway lines and 364 bus routes, with 3 bus priority corridors covering 16 routes, totaling 18.7 km. The length of bus lanes has reached 327.4 km. In terms of vehicles, there are 87 railway operating vehicles, 522 carriages, and 6533 public vehicles, including 6456 green public vehicles. A total of 9 “P+R” parking lots, 16 parking areas, and 435 parking spaces have been built, covering a total of 8 stations on Metro Lines 1, 2, and 3. In 2023, the share of motorized public transportation travel reached 55.8%.

4.1. Emission Evaluation

According to the Heilongjiang Provincial Road Transport Statistical Analysis Report and Information Compilation, the total operating mileage of Harbin public trams in 2020 was 383,658,000 km, the total number of public trams was 8431, and the average operating mileage of a single vehicle was 45,500 km. The model parameters related to carbon emission evaluation in Harbin are shown in Table 1.
In this study, the driving mileage method is used to evaluate the carbon emissions. The carbon emission factor of standard coal is taken as 2.46 kg/kg, and the carbon emission of conventional public transport is calculated. The results are shown in Table 2.

4.2. Emission Prediction

4.2.1. Prediction Modeling and Baseline

As previously mentioned, one of the main objectives of this paper is to validate the proposed model for predicting the future trend in carbon emissions of conventional public transportation of and to compare it with other types of artificial intelligence methods. To make a fair comparison, long short-term memory (LSTM) and gate recurrent unit (GRU) were chosen as the two methods.
As a special form derived from the RNN model, LSTM can better deal with data of longer sequences. Long-term memory is preserved through gating and cell state updates, and time-related information is retained through storage cells to solve the gradient disappearance and gradient explosion problems in RNN models.
The GRU is an excellent variant of the RNN. It is different from the LSTM mentioned above, in that the GRU simplifies the structure by combining the forgetting gate and the input gate into a single update gate. The update gate controls the update state of the cell, while the reset gate determines how to combine new input information with previous memories to speed up convergence.
To compare the traffic flow prediction effect of the proposed model, LSTM, and GRU models, the same traffic flow datasets are chosen. The root means square error (RMSE), mean absolute percentage error (MAPE), and the mean absolute error (MAE) were selected to evaluate the models, as shown in Equations (6)–(8).
RMSE = 1 n i = 1 n y t y p 2
MAE = 1 n i = 1 n y t y p
MAPE = 1 n i = 1 n y t y p y t
where n is the number of observations and yt and yp are the flow’s measured value and the corresponding predicted value, respectively.
The training process for both LSTM and GRU utilized the Adam optimizer, with the MaxEpochs set to 250, a gradient threshold of 1, and an initial learning rate of 0.01. To ensure the uniformity of the platform, the experimental equipment was composed of a 6-core AMD3600 X 3.80 GHz CPU, 16 GB of RAM, and a GEFORCE RTX 3060 8 GB GPU. MATLAB 2021a was chosen for the experimental platform.

4.2.2. Prediction Logic Explanation

In order to measure the development trend in carbon emissions of conventional public transportation in Harbin, this paper focuses on the analysis and prediction of the growth trend and structural changes of conventional public transportation on the basis of the measurement of carbon emissions of conventional public transportation.
Many scholars’ predictions of car ownership are mainly divided into two directions. One is to establish a model to predict the amount of ownership from the factors that affect the amount of ownership, and the other is to start with the change in data of the amount of ownership. A single-factor retention prediction model is established to predict the retention. The number of conventional public transport vehicles is in line with the size of the population, and there are relevant documents stipulating the number of conventional public transport vehicles per ten thousand people. With reference to the first forecasting direction, this paper first forecasts the population size of Harbin combined with the number of ten thousand people to predict the number of conventional public transport vehicles.
In this paper, a scenario analysis is used to set up the fuel structure of buses in Harbin according to different scenarios, to calculate the number of buses of various fuel types in Harbin, and then to calculate the carbon emissions of conventional buses in Harbin in the future.

4.2.3. Population Size Prediction

The influencing factors of population change are numerous and complex, which are closely related to the natural environment, regional economy, and social system. Therefore, it is difficult to include all the influencing factors in the model. Based on a review of the literature [48,49] and relevant data, this paper constructs an index system from the three aspects of natural population growth rate, population structure, and economic level. The birth rate, mortality rate, proportion of labor force, urban population, per capita GDP, average wages of on-duty workers, and consumer price index (CPI) were selected as the main influencing factors, where the index population (P) is the output set, namely the response variable; and the level 2 index (X1-X7) is the input set, namely the independent variable. The index system of population-influencing factors is shown in Table 3.
Before modeling for prediction, we must conduct exponential pattern verification and a smooth test on the original sequence. The population of Harbin and its influencing factors from 2011 to 2020 in Table 4 are used as the original sequence.
Taking the population as an example, the original sequence is P(0) = (p(0)(1), p(0)(2), p(0)(3),…,p(0)(10)) = (993.27, 993.51, 995.20,…, 948.55). Then, we can obtain the 1-AGO sequence, P(1) = (993.27, 1986.78, 2981.98,…, 9699.11) of the original data using Equation (9). We obtained the stepwise ratio and smooth ratio using the exponential regularity test and smooth test using Formulas (10) and (11), respectively.
p 1 i = j = 1 i p 0 j , i = 1 , 2 , . , N
σ i = p 1 i p 1 i 1 , i = 2 , 3 , , N
μ i = p 0 i p 1 i 1 , i = 2 , 3 , , N
The stepwise ratios of the original data are σ = (2.0002, 1.5009, 1.3311,…, 1.1084). The smooth ratios of the original data are μ = (1.0002, 0.5009, 0.3311,…, 0.1084). The above results are consistent with the data smoothing condition and exponential pattern when I > 3, μ < 0.5, and σ < 2, which can establish the MGM.
Using the above data, the MGM is used to predict the population of Harbin in the next 10 years. The predicted results of the three methods are shown in Table 5, Table 6 and Table 7.
Using the P as an example, a comparison of the true and predicted values of different prediction models during the period of 2023–2030 is shown in Figure 3.
Then, the prediction results are evaluated. As can be seen from Table 8, the three evaluation indicators of the proposed multivariate gray prediction model are slightly better than the other two models for predicting the future trend in carbon emissions from traditional public transportation. Therefore, we selected the MGM to continue the subsequent prediction experiment of fuel structure for conventional public transportation in Harbin.

4.2.4. Prediction of Fuel Structure for Conventional Public Transportation in Harbin

In order to further analyze the impact of the change in fuel structure on carbon emissions in bus operations, the international carbon reduction policy was taken as a reference. Considering the future implementation of new energy buses and energy saving and emission reduction policies in Harbin, this analysis will have a great impact on the fuel structure of buses. Therefore, the changing trend in bus fuel structure is predicted by taking the bus fuel structure as the classification level.
(1)
Scenario analysis method
Scenario analysis is a popular method used to analyze future development in recent years. A scenario analysis assumes the future development situation, sets scenarios, and predicts and analyzes the situation of goals in different situations to analyze the effect of different situations on these goals. The so-called scenario is neither a prophecy nor prediction; instead, it only shows the possible direction of development in the future. A scenario analysis only provides a platform for the research and clarifies the research ideas so that scholars can fully consider the role and impact of various uncertain factors affecting social and economic development in the future. The possible uncertainties in the future are classified, and the most likely scenarios for the development of this field are designed [30]. Scenario analyses can help managers find trends in future changes and avoid overestimating and underestimating future changes and their impacts. However, situational analysis lacks a procedural mode of operation and depends on the intuition of researchers to a certain extent.
(2)
Scenario setting
The Action Plan for Carbon Dioxide Peaking Before 2030 issued by the State Council proposes to promote efficient and low-carbon transport and accelerate the phase-out of vehicles with high energy consumption and high carbon emissions. The notice on the Development Plan of Modern Integrated Transportation system in the 14th five-year plan proposes to promote low-carbon facilities and equipment, to promote low-carbon and diversified development of energy in the field of transportation, and to actively promote new energy and clean energy transport vehicles. The proportions of electric vehicles in new or updated ground public transportation in cities with a population of more than 1 million is not less than 80%. Based on the method in literature [50] and the conventional bus fuel structure in 2020, the following three scenarios are built using a combination of the carbon peak target, an update of the fuel structure of buses, an increase in the proportion of pure electric vehicles, and a reduction in the proportion of vehicles with high carbon emissions.
  • Pessimistic Scenario
Due to the development of pure electric bus technology and infrastructure, the transition time and permeability of pure electric bus are relatively loose. In this scenario, the fuel structure forecast of conventional public transportation is shown in Table 9.
2.
Benchmark Scenario
With the rapid development of pure electric bus technology, the proportion of pure electric buses is further improved. In this context, the fuel structure of conventional public transport is predicted as shown in Table 10.
3.
Optimistic scenario
The development of pure electric bus technology is accelerated, the charging infrastructure is widely popularized, and the transformation cycle of pure electric buses is greatly reduced. In this scenario, the fuel structure of conventional public transportation is predicted as shown in Table 11.

4.2.5. Carbon Emission Forecast of Conventional Public Transportation in Harbin

According to the Heilongjiang Provincial Road Transport Statistical Analysis Report and Information Compilation, in 2020, the total number of buses and trams in Harbin was 8431, the number of standard operating vehicles was 10340.8, and the number of buses per 10,000 people was 10.9. The standards outlined in ref. [51] stipulate that for the planned ownership of urban buses and trams, big cities should have one standard car for every 800–1000 people, which means that there should be 10–12.5 buses for every 10,000 people. The demand for passenger traffic increases with the development of the economy. In this paper, when calculating the number of standard buses from 2023 to 2030, the number of buses per ten thousand people is 11.1–11.8. In terms of the average vehicle conversion factor for conventional buses, 7–10 m single-section, single-deck buses are used as standard vehicles with a conversion factor of 1, while 10–13 m public auto-trolley vehicles have a conversion factor of 1.3. The average conversion coefficient of conventional public transportation in Harbin is 1.2265, which is obtained by dividing the number of standard operating vehicles by the total number of bused and trams in 2020. Because it is difficult to count the vehicle size of all kinds of conventional public transportation, this paper uses 1.2265 as the conversion coefficient to calculate the number of vehicles.
The carbon emissions from 2023 to 2030 are calculated according to the total number of people in Harbin, the number of buses with 10,000 people, the conversion coefficient of standard vehicles, the fuel structure of buses, and carbon emissions per bike. The calculated results are shown in Table 12 and Figure 4.
As shown in Figure 3, in the pessimistic situation, pure electric vehicles have the lowest proportion, the highest carbon emissions, and the fastest growth rate of carbon emissions. In the benchmark scenario, the electrification of conventional public transport is relatively fast, its carbon emissions are reduced compared with the pessimistic situation, and the growth rate of carbon emissions has slowed down. In an optimistic situation, conventional public transportation has the highest degree of electrification and the lowest carbon emissions. Although carbon emissions decrease first and then increase in optimistic scenarios, their carbon emissions are always lower than those in benchmark scenarios and pessimistic scenarios. In a pessimistic scenario, pure electric vehicles will have reached a high proportion in 2026, and the increase in carbon emissions is mainly due to the increase in bus ownership caused by population growth.

5. Discussion

This study demonstrates that Harbin’s carbon emissions will reach 261,947.71 tons in 2030 under the baseline scenario, and the carbon emission predictions can reach 266,310.84 tons and 260,562.21 tons in the pessimistic and optimistic scenarios, respectively. However, the difference in values is reflected in the proportion of electric vehicles. In the pessimistic scenario, pure electric vehicles have the lowest proportion, but this kind of scenario has the highest carbon emissions and the fastest growth rate. Under the benchmark scenario, the carbon emissions are reduced from the pessimistic scenario, and the growth rate is also slower because of the relatively fast electrification of conventional buses. After 2028, carbon emissions in the benchmark scenario and the pessimistic scenario gradually decrease. Based on the analysis, the reason is that the technological conversion of purely electric buses has matured at this moment and is promoting the transition on a large scale. In the optimistic scenario, conventional buses have the highest degree of electrification, and the carbon emissions decrease and then increase; however, the carbon emissions are always lower than in the baseline and pessimistic scenarios. In 2025, carbon emissions in the optimistic scenario reach their lowest point. The reason is that purely electric buses are transitioning rapidly in this year, and charging infrastructure is increasingly popularized. This conclusion is similar to the results of Aggarwal P and Jain S’s prediction of the carbon emissions of Delhi’s transport sector in 2020 [26]. The scenario analysis method was also utilized, but a single-factor ownership prediction model was developed based on the data changes in traffic ownership. It was concluded that for reducing carbon emissions in the transportation sector, it is necessary to optimize the energy structure, use cleaner energy to generate electricity, and vigorously develop public transportation to reduce fossil energy consumption. This coincides with the conclusion in this article that the way to reduce carbon emissions is to use new energy sources.
In terms of population size prediction, MGM is compared with LSTM and GRU in Section 4. Compared with the above two models, the MGM proposed in this experiment is not a parameterized algorithm and cannot be trained and learned through large amounts of data to improve accuracy. However, MGM can improve the prediction accuracy by considering multiple influencing factors. Moreover, the amount of data with obvious time series features used in this paper is not large, and MGM can also achieve good effects. MGM also has a slight advantage over the other two parameterization algorithms in terms of computational speed. In addition, when facing small sample data, the convergence speed of GRU is faster than LSTM.
In terms of the design and optimization of emission reduction pathways, many scholars have proposed reducing transportation carbon emissions by vigorously developing public transportation; however, few had proposed specific emission reduction pathways for public transportation. Jovanovic M. studied Belgrade’s urban transport carbon emissions, calculated that Belgrade’s per capita carbon emissions are 228 kg, and made recommendations to reduce carbon dioxide emissions, enact more stringent measures to restrict private car travel, improve road efficiency, and pay more attention to the construction of urban public transportation systems [32]. Abigail L. Bristow and other scholars took the United Kingdom as an example to study the low-carbon development of passenger transportation [52]. The results showed that carbon emissions are mainly affected by human activities, and the authors proposed the following measures to effectively reduce carbon emissions: take economic measures to restrict the use of motor vehicles, use low-energy, low-emission vehicles, promote the development of public transportation, etc. This paper puts forward the low-carbon emission reduction path of Harbin’s conventional public transport system, combines the influencing factors of carbon emissions, and puts forward technical and management emission reduction suggestions aimed at reducing vehicle energy consumption based on the carbon emission factor, controlling the number of motor vehicles, and reducing vehicle mileage; specifically reducing vehicle energy consumption, optimizing energy structure, standardizing driver behavior, building intelligent public transport, giving priority to the development of public transportation, and improving the road network structure.

6. Conclusions

This paper estimates the carbon emissions of conventional buses in Harbin in 2020, mainly considering the influence of fuel structure. The carbon emissions of conventional buses in Harbin from 2023 to 2030 are predicted using a scenario analysis, and an emission reduction path for conventional public transport systems based on the influencing factors of carbon emissions are proposed. The main conclusions of this article are as follows:
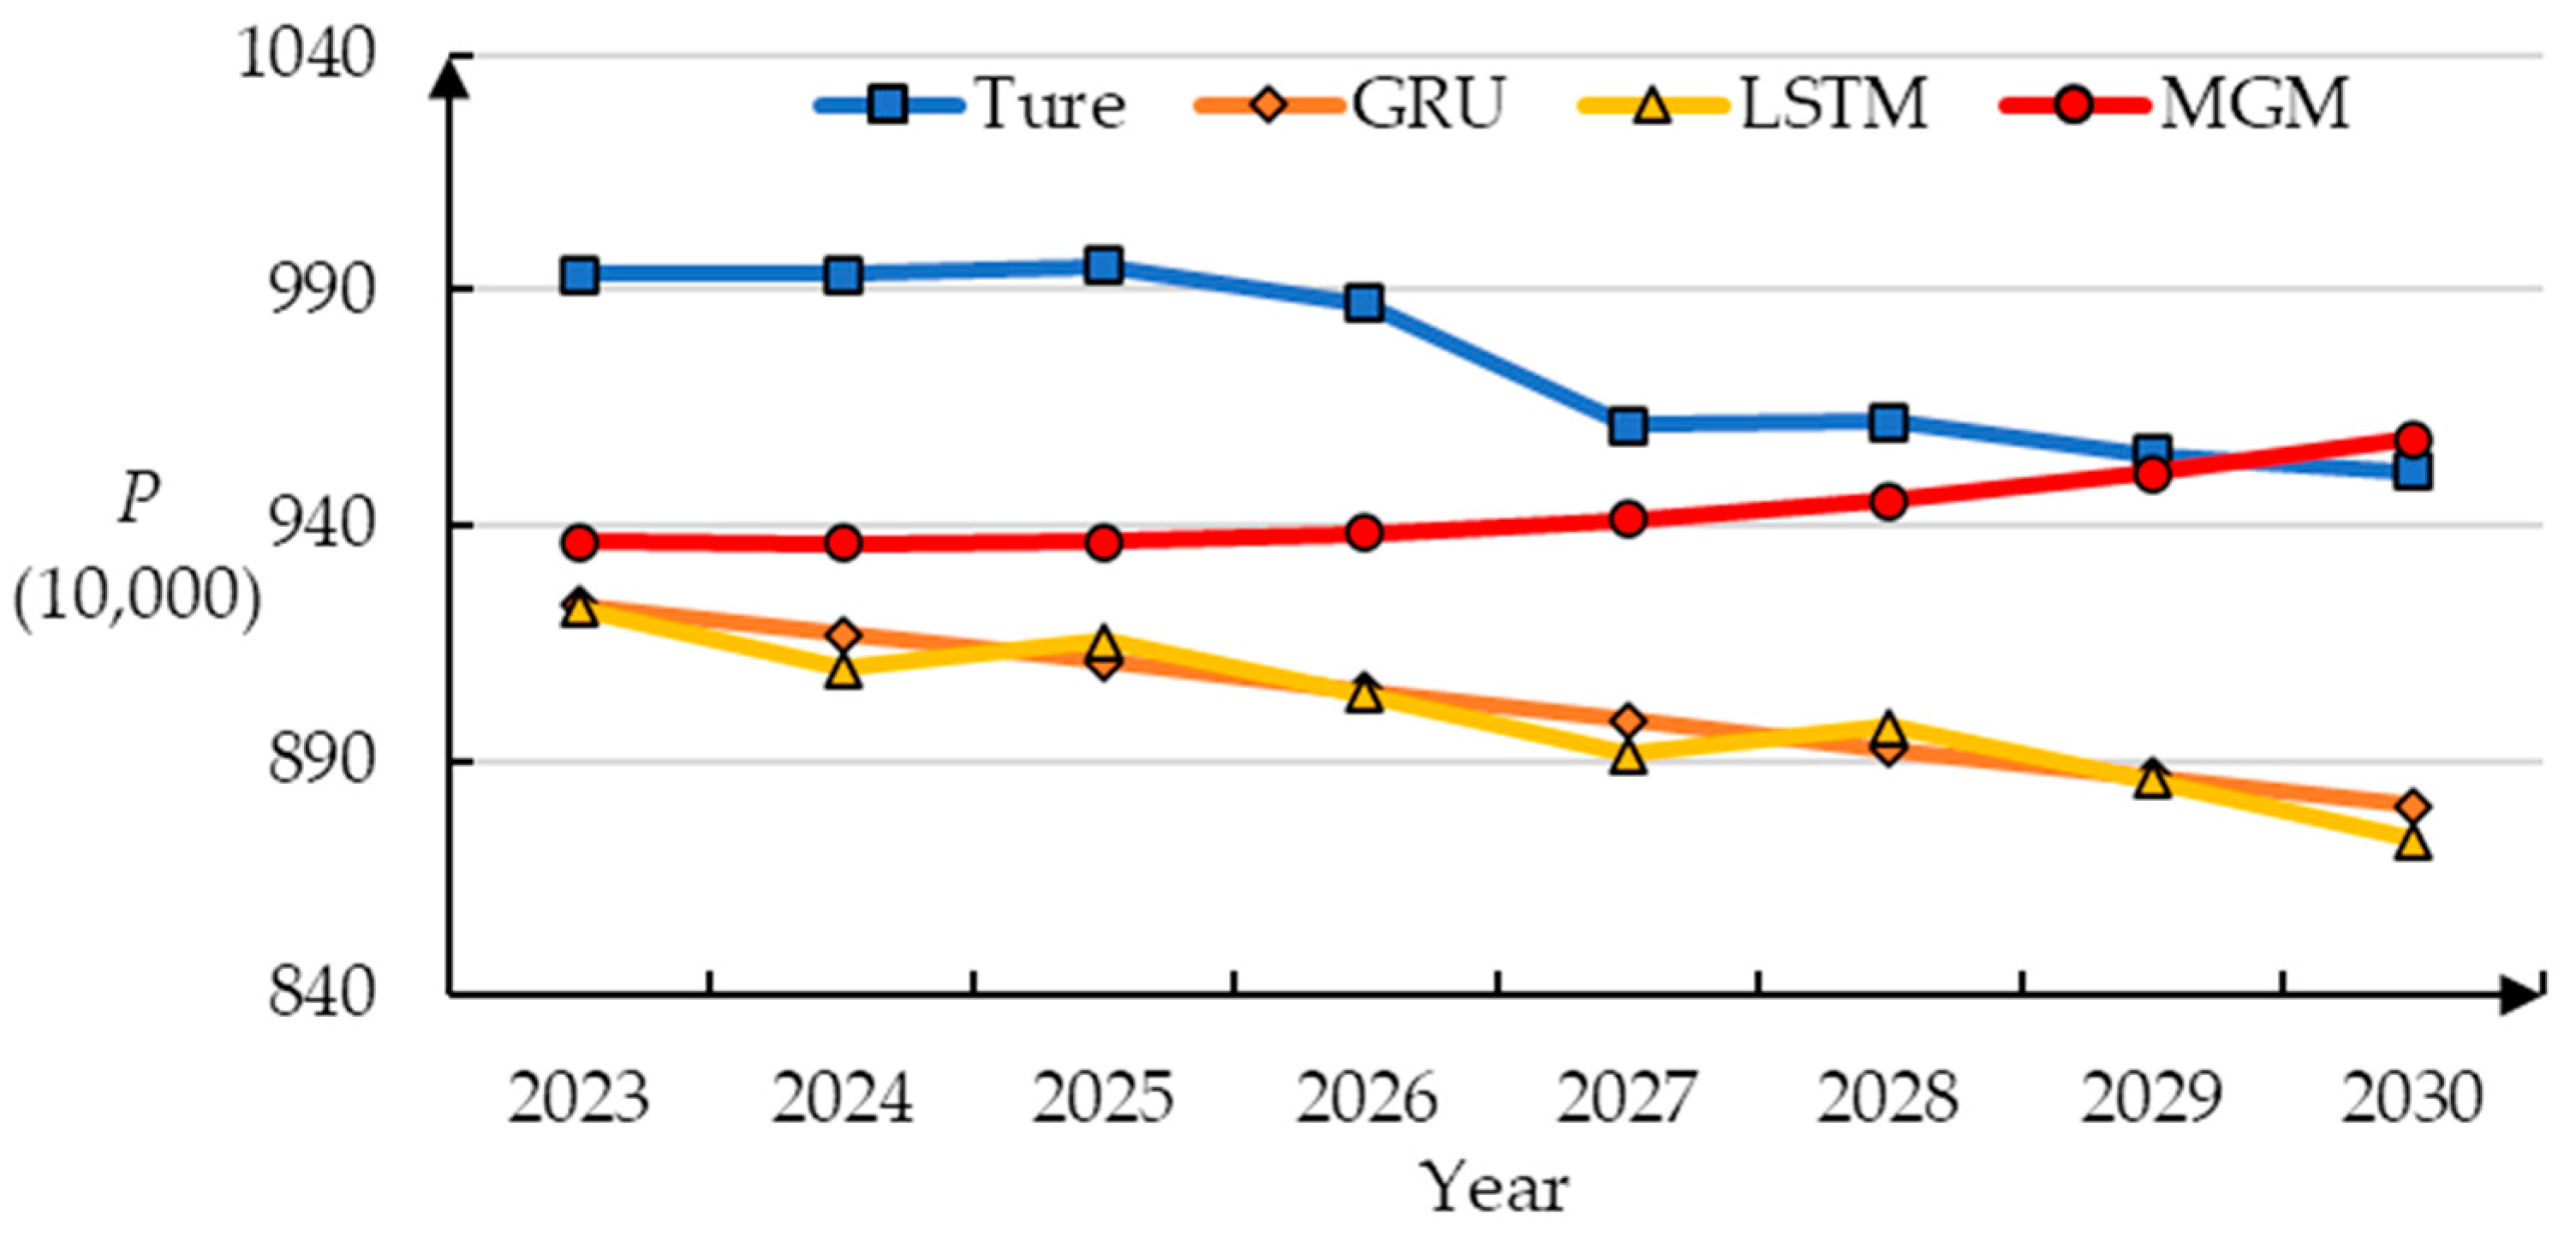
  • By constructing an MGM, an indicator system was constructed based on three aspects, natural population growth rate, population structure, and economic level, to predict the population size of Harbin. According to the predictions, the population of Harbin will reach 9.5824 million in 2030.
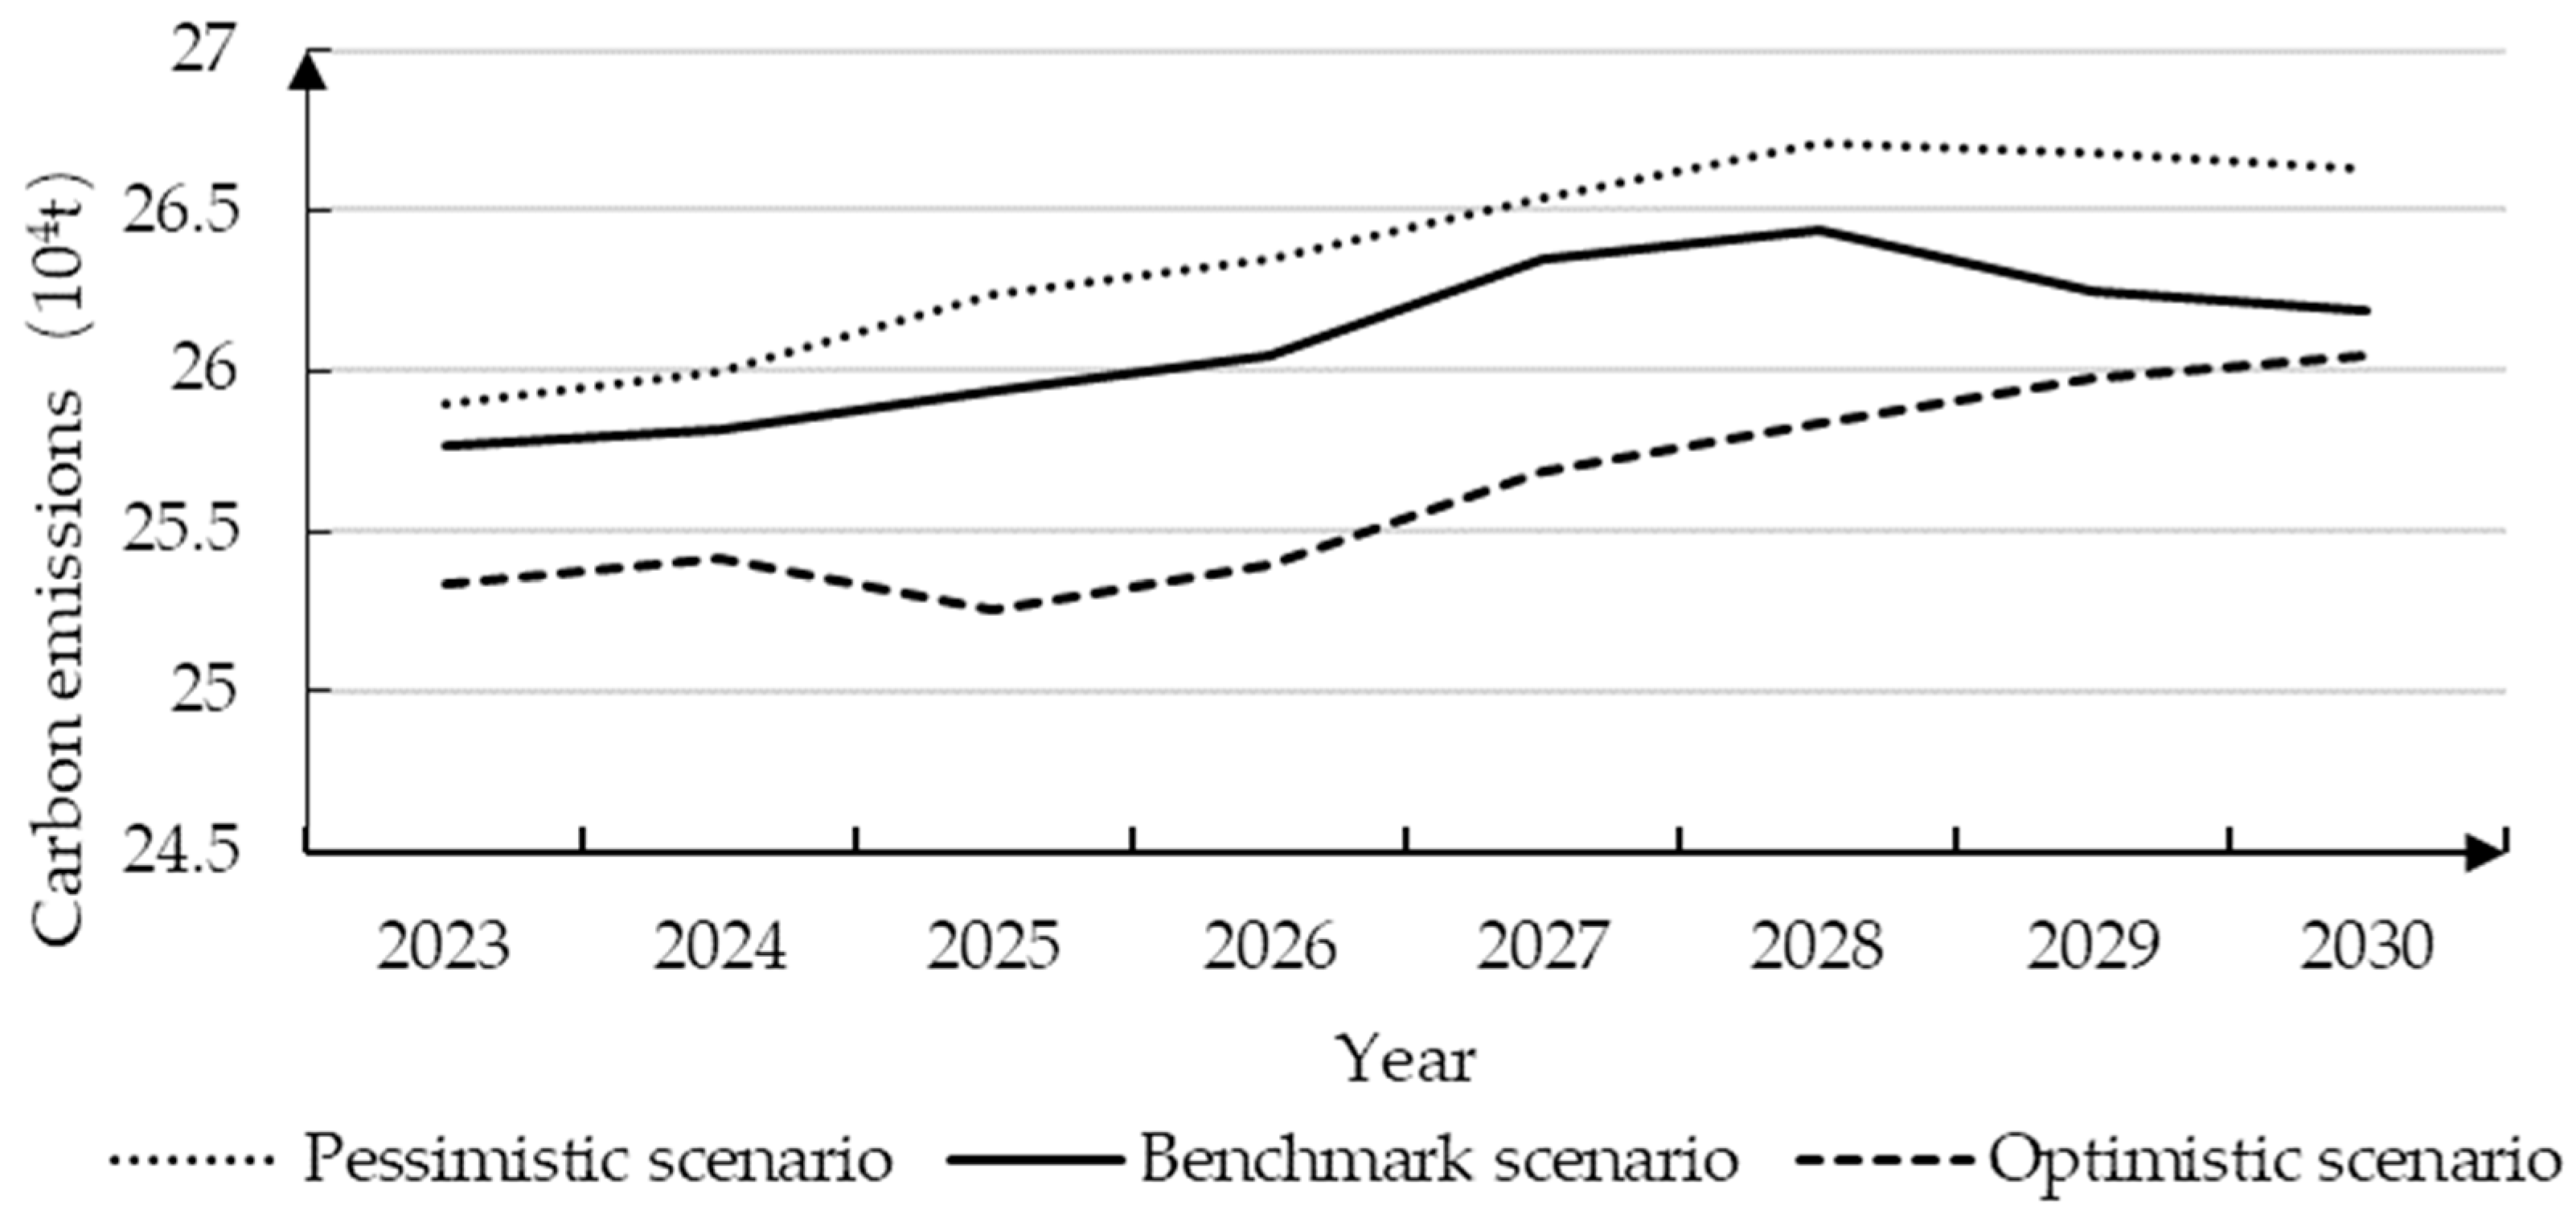
  • A scenario analysis method was used to analyze the fuel structure of buses in Harbin from three perspectives: a pessimistic scenario, a baseline scenario, and an optimistic scenario. By 2030, the proportion of pure electric buses in the three scenarios will be 75%, 85%, and 92%, respectively.
  • This article calculates the carbon emissions of regular buses in Harbin from 2023 to 2030. The carbon emissions under the three scenarios (pessimistic, baseline, and optimistic) in 2030 are 266,310.84 tons, 261,947.71 tons, and 260,562.21 tons, respectively.
This study also presents some limitations. The availability of carbon emission data on conventional buses in Harbin is debatable, so the data selected in this paper may not be comprehensive. In addition, the low-carbon emission reduction path of the conventional public transport system proposed in Section 4 of this paper is not specific enough, and if the emission reduction path can be quantified in combination with mathematical models, it can better provide a more scientific reference for the low-carbon emission reduction of conventional public transport in Harbin.

Author Contributions

This paper was written by W.Z. (Wenhui Zhang), G.Z., Z.S., X.S., M.Y., X.C., Y.X., W.Z. (Wenzhao Zheng), P.Z. and W.Z. (Wenhui Zhang) developed the research framework and wrote the paper. G.Z. and Z.S. guided the research design and paper writing. X.S., M.Y., X.C., Y.X., W.Z. (Wenzhao Zheng) and P.Z. collected data and performed the data analysis. All authors have read and agreed to the published version of the manuscript.

Funding

This research was supported by the China Fundamental Research Funds for the Central Universities Category D Project Carbon Neutralization Project (No. 2572021DT09).

Institutional Review Board Statement

Not applicable.

Informed Consent Statement

Not applicable.

Data Availability Statement

Data available upon request.

Conflicts of Interest

The authors declare that they have no known competing financial interest or personal relationships that could have appeared to influence the work reported in this paper.

References

  1. Bashmakov, I.A.; Nilsson, L.J.; Acquaye, A.; Bataille, C.; Cullen, J.M.; de la Rue du Can, S.; Fischedick, M.; Geng, Y.; Tanaka, K. Climate Change 2022: Mitigation of Climate Change. Contribution of Working Group III to the Sixth Assessment Report of the Intergovernmental Panel on Climate Change; Cambridge University Press: Cambridge, UK; New York, NY, USA, 2022. [Google Scholar] [CrossRef]
  2. Brand, C.; Goodman, A.; Rutter, H.; Song, Y.; Ogilvie, D. Associations of Individual, Household and Environmental Characteristics with Carbon Dioxide Emissions from Motorised Passenger Travel. Appl. Energy 2013, 104, 158–169. [Google Scholar] [CrossRef] [PubMed]
  3. Fan, J.-L.; Wang, J.-X.; Li, F.; Yu, H.; Zhang, X. Energy Demand and Greenhouse Gas Emissions of Urban Passenger Transport in the Internet Era: A Case Study of Beijing. J. Clean. Prod. 2017, 165, 177–189. [Google Scholar] [CrossRef]
  4. Jelti, F.; Allouhi, A.; Al-Ghamdi, S.G.; Saadani, R.; Jamil, A.; Rahmoune, M. Environmental Life Cycle Assessment of Alternative Fuels for City Buses: A Case Study in Oujda City, Morocco. Int. J. Hydrogen Energy 2021, 46, 25308–25319. [Google Scholar] [CrossRef]
  5. Luo, Y.; Liu, S.; Che, L.; Yu, Y. Analysis of Temporal Spatial Distribution Characteristics of PM2.5 Pollution and the Influential Meteorological Factors Using Big Data in Harbin, China. J. Air Waste Manag. Assoc. 2021, 71, 964–973. [Google Scholar] [CrossRef] [PubMed]
  6. Xu, H.; Pei, Y.; Wang, L.; Zhang, W. Emission Reduction of CO2 Caused by BEV in Urban Passenger Transport: A Case Study of Harbin. J. Transp. Inf. Saf. 2018, 36, 111–118. [Google Scholar]
  7. Wen, L.; Wang, A. System Dynamics Model of Beijing Urban Public Transport Carbon Emissions Based on Carbon Neutrality Target. Environ. Dev. Sustain. 2022, 25, 12681–12706. [Google Scholar] [CrossRef]
  8. Dong, D.; Duan, H.; Mao, R.; Song, Q.; Zuo, J.; Zhu, J.; Wang, G.; Hu, M.; Dong, B.; Liu, G. Towards a Low Carbon Transition of Urban Public Transport in Megacities: A Case Study of Shenzhen, China. Resour. Conserv. Recycl. 2018, 134, 149–155. [Google Scholar] [CrossRef]
  9. Zhang, S.; Wu, Y.; Liu, H.; Huang, R.; Yang, L.; Li, Z.; Fu, L.; Hao, J. Real-World Fuel Consumption and CO2 Emissions of Urban Public Buses in Beijing. Appl. Energy 2014, 113, 1645–1655. [Google Scholar] [CrossRef]
  10. Shan, Y.; Guan, D.; Liu, J.; Mi, Z.; Liu, Z.; Liu, J.; Schroeder, H.; Cai, B.; Chen, Y.; Shao, S.; et al. Methodology and Applications of City Level CO2 Emission Accounts in China. J. Clean. Prod. 2017, 161, 1215–1225. [Google Scholar] [CrossRef]
  11. Alam, M.S.; Duffy, P.; Hyde, B.; McNabola, A. Improvement in the Estimation and Back-Extrapolation of CO2 Emissions from the Irish Road Transport Sector Using a Bottom-up Data Modelling Approach. Transp. Res. Part D Transp. Environ. 2017, 56, 18–32. [Google Scholar] [CrossRef]
  12. Ghaemi, Z.; Smith, A.D. A Review on the Quantification of Life Cycle Greenhouse Gas Emissions at Urban Scale. J. Clean. Prod. 2020, 252, 119634. [Google Scholar] [CrossRef]
  13. Milovanoff, A.; Minet, L.; Cheah, L.; Posen, I.D.; MacLean, H.L.; Balasubramanian, R. Greenhouse Gas Emission Mitigation Pathways for Urban Passenger Land Transport under Ambitious Climate Targets. Environ. Sci. Technol. 2021, 55, 8236–8246. [Google Scholar] [CrossRef]
  14. Zhang, L.; Long, R.; Chen, H.; Geng, J. A Review of China’s Road Traffic Carbon Emissions. J. Clean. Prod. 2019, 207, 569–581. [Google Scholar] [CrossRef]
  15. Ding, S.; Dang, Y.-G.; Li, X.-M.; Wang, J.-J.; Zhao, K. Forecasting Chinese CO2 Emissions from Fuel Combustion Using a Novel Grey Multivariable Model. J. Clean. Prod. 2017, 162, 1527–1538. [Google Scholar] [CrossRef]
  16. Ding, S.; Xu, N.; Ye, J.; Zhou, W.; Zhang, X. Estimating Chinese Energy-Related CO2 Emissions by Employing a Novel Discrete Grey Prediction Model. J. Clean. Prod. 2020, 259, 120793. [Google Scholar] [CrossRef]
  17. He, Z.; Zhang, W.; Jia, N. Estimating Carbon Dioxide Emissions of Freeway Traffic: A Spatiotemporal Cell-Based Model. IEEE Trans. Intell. Transp. Syst. 2020, 21, 1976–1986. [Google Scholar] [CrossRef]
  18. Pan, Y.; Qiao, F.; Tang, K.; Chen, S.; Ukkusuri, S.V. Understanding and Estimating the Carbon Dioxide Emissions for Urban Buses at Different Road Locations: A Comparison between New-Energy Buses and Conventional Diesel Buses. Sci. Total Environ. 2020, 703, 135533. [Google Scholar] [CrossRef]
  19. Mądziel, M. Liquified Petroleum Gas-Fuelled Vehicle CO2 Emission Modelling Based on Portable Emission Measurement System, On-Board Diagnostics Data, and Gradient-Boosting Machine Learning. Energies 2023, 16, 2754. [Google Scholar] [CrossRef]
  20. Jaworski, A.; Mądziel, M.; Kuszewski, H. Sustainable Public Transport Strategies—Decomposition of the Bus Fleet and Its Influence on the Decrease in Greenhouse Gas Emissions. Energies 2022, 15, 2238. [Google Scholar] [CrossRef]
  21. Azam, M.; Othman, J.; Begum, R.A.; Abdullah, S.M.S.; Nor, N.G.M. Energy Consumption and Emission Projection for the Road Transport Sector in Malaysia: An Application of the LEAP Model. Environ. Dev. Sustain. 2016, 18, 1027–1047. [Google Scholar] [CrossRef]
  22. Alfaseeh, L.; Tu, R.; Farooq, B.; Hatzopoulou, M. Greenhouse Gas Emission Prediction on Road Network Using Deep Sequence Learning. Transp. Res. Part D Transp. Environ. 2020, 88, 102593. [Google Scholar] [CrossRef]
  23. Gao, M.; Yang, H.; Xiao, Q.; Goh, M. A Novel Fractional Grey Riccati Model for Carbon Emission Prediction. J. Clean. Prod. 2021, 282, 124471. [Google Scholar] [CrossRef]
  24. Özceylan, E. Forecasting CO2 Emission of Turkey: Swarm Intelligence Approaches. Int. J. Glob. Warm. 2016, 9, 337–361. [Google Scholar] [CrossRef]
  25. Fang, D.; Zhang, X.; Yu, Q.; Jin, T.C.; Tian, L. A Novel Method for Carbon Dioxide Emission Forecasting Based on Improved Gaussian Processes Regression. J. Clean. Prod. 2018, 173, 143–150. [Google Scholar] [CrossRef]
  26. Aggarwal, P.; Jain, S. Energy Demand and CO2 Emissions from Urban On-Road Transport in Delhi: Current and Future Projections under Various Policy Measures. J. Clean. Prod. 2016, 128, 48–61. [Google Scholar] [CrossRef]
  27. Li, W.; Li, H.; Zhang, H.; Sun, S. The Analysis of CO2 Emissions and Reduction Potential in China’s Transport Sector. Math. Probl. Eng. 2016, 2016, e1043717. [Google Scholar] [CrossRef]
  28. Kousoulidou, M.; Ntziachristos, L.; Mellios, G.; Samaras, Z. Road-Transport Emission Projections to 2020 in European Urban Environments. Atmos. Environ. 2008, 42, 7465–7475. [Google Scholar] [CrossRef]
  29. Liu, J.; Zhang, X.; Song, X. Regional Carbon Emission Evolution Mechanism and Its Prediction Approach Driven by Carbon Trading–A Case Study of Beijing. J. Clean. Prod. 2018, 172, 2793–2810. [Google Scholar] [CrossRef]
  30. Grácio, M.; Finet, C.; Desaeger, M.; Da Silva, F.N.; Coelho, M. Prospects for Energy Usage and Carbon Dioxide That Affect European Transportation Sector. Transp. Res. Rec. 2012, 2287, 54–63. [Google Scholar] [CrossRef]
  31. Pamuła, T.; Pamuła, D. Prediction of Electric Buses Energy Consumption from Trip Parameters Using Deep Learning. Energies 2022, 15, 1747. [Google Scholar] [CrossRef]
  32. Jovanovic, M. Belgrade’s Urban Transport CO2 Emissions from an International Perspective. Pol. J. Environ. Stud. 2016, 25, 635–646. [Google Scholar] [CrossRef]
  33. Arioli, M.; Fulton, L.; Lah, O. Transportation Strategies for a 1.5 °C World: A Comparison of Four Countries. Transp. Res. Part D Transp. Environ. 2020, 87, 102526. [Google Scholar] [CrossRef]
  34. Chatziioannou, I.; Alvarez-Icaza, L.; Bakogiannis, E.; Kyriakidis, C.; Chias-Becerril, L. A Structural Analysis for the Categorization of the Negative Externalities of Transport and the Hierarchical Organization of Sustainable Mobility’s Strategies. Sustainability 2020, 12, 6011. [Google Scholar] [CrossRef]
  35. Liu, Y.; Wang, Y.; Lyu, P.; Hu, S.; Yang, L.; Gao, G. Rethinking the Carbon Dioxide Emissions of Road Sector: Integrating Advanced Vehicle Technologies and Construction Supply Chains Mitigation Options under Decarbonization Plans. J. Clean. Prod. 2021, 321, 128769. [Google Scholar] [CrossRef]
  36. Wu, Y.; Zhang, S.; Hao, J.; Liu, H.; Wu, X.; Hu, J.; Walsh, M.P.; Wallington, T.J.; Zhang, K.M.; Stevanovic, S. On-Road Vehicle Emissions and Their Control in China: A Review and Outlook. Sci. Total Environ. 2017, 574, 332–349. [Google Scholar] [CrossRef]
  37. Jung, J.; Koo, Y. Analyzing the Effects of Car Sharing Services on the Reduction of Greenhouse Gas (GHG) Emissions. Sustainability 2018, 10, 539. [Google Scholar] [CrossRef]
  38. Fan, F.; Lei, Y. Decomposition Analysis of Energy-Related Carbon Emissions from the Transportation Sector in Beijing. Transp. Res. Part D Transp. Environ. 2016, 42, 135–145. [Google Scholar] [CrossRef]
  39. Altieri, K.E.; Trollip, H.; Caetano, T.; Hughes, A.; Merven, B.; Winkler, H. Achieving Development and Mitigation Objectives through a Decarbonization Development Pathway in South Africa. Clim. Policy 2016, 16, S78–S91. [Google Scholar] [CrossRef]
  40. Bayer, P.; Aklin, M. The European Union Emissions Trading System Reduced CO2 Emissions despite Low Prices. Proc. Natl. Acad. Sci. USA 2020, 117, 8804–8812. [Google Scholar] [CrossRef] [PubMed]
  41. Cao, J.; Ho, M.S.; Jorgenson, D.W.; Nielsen, C.P. China’s Emissions Trading System and an ETS-Carbon Tax Hybrid. Energy Econ. 2019, 81, 741–753. [Google Scholar] [CrossRef]
  42. Gitarskiy, M.L. The Refinement to the 2006 IPCC Guidelines for National Greenhouse Gas Inventories. Fundam. Appl. Climatol. 2019, 2, 5–13. [Google Scholar] [CrossRef]
  43. GB 30510-2018; China Automotive Technology and Research Center. Fuel Consumption Limits for Heavy-Duty Commercial Vehicles. General Administration of Quality Supervision, Inspection and Quarantine of the People’s Republic of China, China National Standardization Administration Committee: Beijing, China, 2018; p. 12.
  44. Huang, Y.; Guo, H.; Xie, P.; Liao, C.; Zhao, D. Study on Carbon Emission Reduction Calculation of Subway Travel—Take Guangzhou as an Example. Clim. Chang. Res. 2017, 13, 284. [Google Scholar] [CrossRef]
  45. Qin, B.; Li, C. Shanghai New Energy Transportation and Air Pollution Control from the Perspective of Input Cost—Emission Reduction Benefit. Technol. Innov. Manag. 2018, 39, 409–414. [Google Scholar] [CrossRef]
  46. Mai, W.; Zou, L.; Wang, Y.; Feng, Z. Analysis to the potential of energy-saving and emission-reduction of urban passenger transport: A case study of Zhenjiang City. Urban Probl. 2017, 08, 31–41. [Google Scholar] [CrossRef]
  47. Guo, H.; Huang, Y.; Liao, C.; Zhao, D. Methodology Study on Carbon Emission Reduction Calculation of Bus Travel: Taking Guangzhou as an Example. Ecol. Econ. 2019, 35, 44–48. [Google Scholar]
  48. Wang, X.; Gao, X. The Spatial Distribution and Evolution Characteristics of the Muslim Population in China. World Reg. Stud. 2021, 30, 1297. [Google Scholar] [CrossRef]
  49. Gao, H.; Yao, T.; Kang, X. Population Forecast of Anhui Province Based on the GM(1,1) Model. Grey Syst. Theory Appl. 2017, 7, 19–30. [Google Scholar] [CrossRef]
  50. Liu, S.; Zhao, M.; Bao, C.; Liu, J. Carbon Emission Calculation for Urban Transport Based on Scenario Analysis of Traffic Structure. J. Transp. Syst. Eng. Inf. Technol. 2015, 15, 222. [Google Scholar]
  51. GB/T 51328-2018; Standard for Urban Comprehensive Transport System Planning. Ministry of Housing and Urban-Rural Development of the People’s Republic of China, China Urban Planning and Design Institute: Beijing, China, 2018.
  52. Bristow, A.L.; Tight, M.; Pridmore, A.; May, A.D. Developing pathways to low carbon land-based passenger transport in Great Britain by 2050. Energy Policy 2008, 36, 3427–3435. [Google Scholar] [CrossRef]
Figure 1. CO2 emissions from transportation (2019–2022).
Sustainability 15 16025 g001
Figure 2. Research framework.
Sustainability 15 16025 g002
Figure 3. Comparison of the true value of P during 2023–2030.
Sustainability 15 16025 g003
Figure 4. Prediction results of carbon emissions of conventional public transportation in Harbin.
Sustainability 15 16025 g004
Table 1. Model parameters related to carbon emission evaluation.
Vehicle TypeQuantity (Vehicles)EnergyEnergy Consumption of 100 km per VehicleCarbon Emission Factor
Gasoline vehicle48Petrol37.2 L 2.25 kg/L
Diesel vehicle1209Diesel oil31 L 2.64 kg/L
Natural gas vehicle1022Natural gas35 m3 ③2.19 kg/m3
Pure electric vehicle4856Electric energy90 kWh -
Hybrid vehicle1296Electric energy
Natural gas
3.9 kWh
27.2 m 3⑥
-
2.19 kg/m3
Note: the number of vehicles was determined from the Heilongjiang Provincial Road Transport Statistical Analysis Report and Information Compilation; and are according to the [43]; is from reference [44]; is from reference [45]; is from reference [46]; is from reference [47]; carbon emission factors of gasoline, diesel, and natural gas come from reference [42].
Table 2. Results of carbon emissions evaluation.
Vehicle TypeEnergyCarbon Emissions per Bike (kg)Total Carbon Emissions (kg)
Gasoline vehiclePetrol38,083.501,828,008
Diesel vehicleDiesel oil37,237.2045,019,775
Natural gas vehicleNatural gas34,875.7535,643,017
Pure electric vehicleElectric energy28,045.18136,187,398
Hybrid vehicleElectric energy
Natural gas
28,318.7336,701,076
Table 3. Index system of population-influencing factors.
IndicatorLevel 1 IndexLevel 2 Index
Population P (10,000)Natural population growth rateBirth rate X1(‰)
Mortality rate X2(‰)
Population structureProportion of labor force X3(%)
Urban population X4(10,000)
Economic levelPer capita GDP X5(Yuan per person)
Average wages of on-duty workers X6(Yuan per person)
Average wages of on-duty workers and consumer price index X7(CPI)
Table 4. Historical data of the population for 2011–2020.
YearPX1X2X3X4X5X6X7
2011993.278.35.670.73476.4527,38036,450105.6
2012993.518.79.270.33478.9329,97341,773103.2
2013995.208.35.569.42480.8033,29947,150102.1
2014987.298.68.268.29481.3035,74151,554102.0
2015961.376.26.467.10464.3438,85858,405101.4
2016962.057.04.766.10467.7542,42562,583101.8
2017954.997.716.465.60463.8145,97467,542101.6
2018951.546.15.764.66467.5449,09771,771102.6
2019951.345.65.163.92473.9250,65082,385101.4
2020948.554.86.162.80528.4451,11384,796100.6
Note: the registered population, birth rate, mortality rate, urban population, per capita GDP, and consumer price index come from the Harbin Statistical Yearbook. The proportion of the labor force is calculated according to the Statistical Yearbook of Harbin, and the average salary of on-duty workers comes from the National Bureau of Statistics.
Table 5. Predicted values of factors related to population forecast from 2023 to 2030 (MGM).
YearPX1X2X3X4X5X6X7
2023936.593.96.560.26496.6965,753112,562100.6
2024936.073.46.359.43499.3570,265122,692100.4
2025936.613.06.258.61502.0275,087133,736100.2
2026938.302.66.157.80504.7180,239145,772100.0
2027941.222.15.957.00507.4185,745158,89299.8
2028945.451.75.856.22510.1291,629173,19299.7
2029951.091.35.655.44512.8597,917188,78099.5
2030958.240.85.554.67515.59104,636205,77199.3
Table 6. Predicted values of factors related to population forecast from 2023 to 2030 (LSTM).
YearPX1X2X3X4X5X6X7
2023922.424.046.660.11534.2152,875101,47799.6
2024909.683.646.259.21536.1453,462106,89599.3
2025915.443.246.558.30538.0654,048112,31398.9
2026904.162.856.257.40539.9854,635117,73198.6
2027891.412.456.156.50541.9155,221123,14998.3
2028897.172.055.955.59543.8355,808128,56797.9
2029885.891.656.054.69545.7656,395133,98597.6
2030873.141.256.253.79547.6856,981139,40497.2
Table 7. Predicted values of factors related to population forecast from 2023 to 2030 (GRU).
YearPX1X2X3X4X5X6X7
2023923.063.576.660.04530.0853,31691,052100.3
2024916.953.606.359.20535.6853,88095,31299.6
2025910.842.726.558.48533.7054,699101,95099.2
2026904.732.766.757.34539.3055,263106,20999.0
2027898.631.886.356.51537.3256,082112,84798.2
2028892.521.926.555.79542.9256,645117,10697.9
2029886.411.046.654.65540.9457,465123,74497.6
2030880.301.085.253.82546.5458,028128,00397.3
Table 8. Comparison of prediction results of three different models.
ModelRMSEMAEMAPE (%)
MGM17.9223.525.71
LSTM24.2164.137.71
GRU25.2262.368.48
Table 9. Pessimistic scenario.
YearGasoline (%)Diesel (%)Natural Gas (%)Pure Electric (%)Hybrid (%)
2023012125818
2024012105820
2025012105820
2026010106218
202701086418
20280886915
20290857215
20300557515
Table 10. Benchmark scenario.
YearGasoline (%)Diesel (%)Natural Gas (%)Pure Electric (%)Hybrid (%)
2023012106315
2024010106713
202501086913
20260887113
20270887410
20280587710
20290358210
20300058510
Table 11. Optimistic scenario.
YearGasoline (%)Diesel (%)Natural Gas (%)Pure Electric (%)Hybrid (%)
202305126815
202405107213
202500107713
20260087913
20270088210
20280058510
2029005905
2030003925
Table 12. Prediction results of carbon emissions of conventional public transportation in Harbin. (Unit: t).
YearPessimistic ScenarioBenchmark ScenarioOptimistic Scenario
2023259,013.31257,763.70253,390.34
2024260,019.42258,253.33254,254.63
2025262,451.60259,469.31252,596.79
2026263,531.50260,566.40254,040.73
2027265,403.95263,556.86256,954.44
2028267,128.48264,495.78258,451.40
2029266,846.99262,516.42259,868.01
2030266,310.84261,947.71260,562.21
Disclaimer/Publisher’s Note: The statements, opinions and data contained in all publications are solely those of the individual author(s) and contributor(s) and not of MDPI and/or the editor(s). MDPI and/or the editor(s) disclaim responsibility for any injury to people or property resulting from any ideas, methods, instructions or products referred to in the content.

