1. Introduction
The increasing demand for energy over the last 40 years or so, globalisation, and the desire for economic growth have increased energy production and thus CO
2 emissions [
1] (
Figure 1). The largest contribution to CO
2 emissions comes from the power generation sector (43.5%), followed by industry (27%) and transport (20.7%), with the remainder coming from the construction sector [
2].
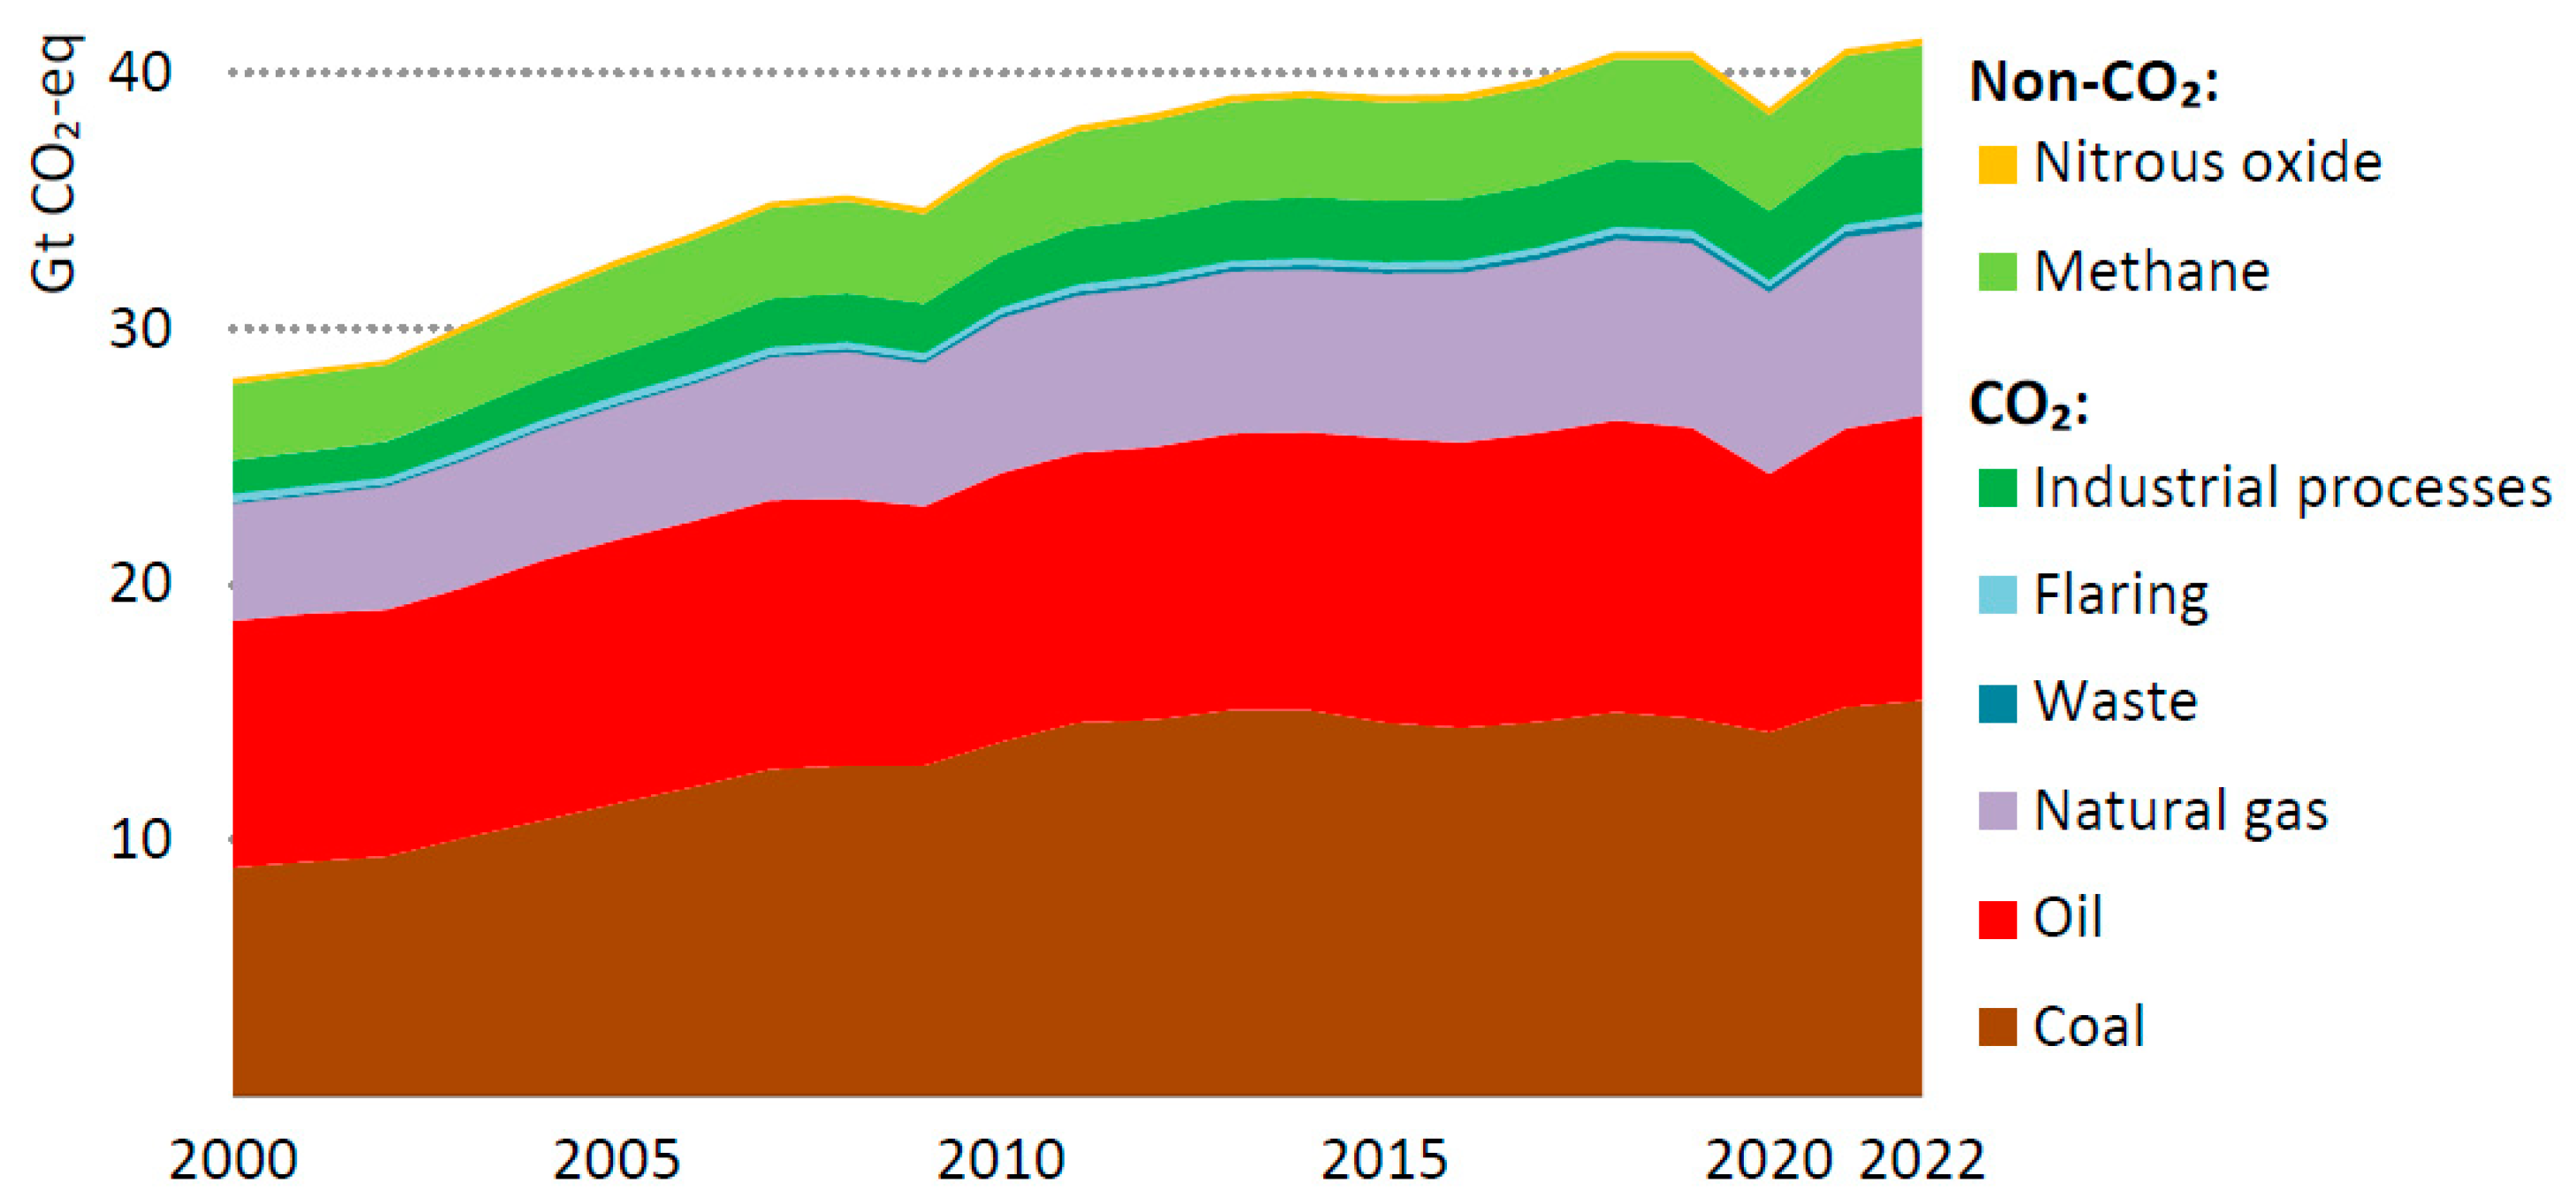
If you look at the sources of CO
2 emissions by fuel, it is obvious that coal is the number one fuel, followed by natural gas and oil. Worryingly, greenhouse gas (GHG) emissions from coal-fired power plants continue to increase (
Figure 2).
Oil emissions increased by 2.5% in 2022. Aviation accounted for around half of the year-over-year growth as air traffic recovered from its pandemic low. Global CO
2 emissions from energy in 2022 rose by 0.9%, or 321 million tons, to a new peak of more than 36.8 billion tons [
2]. Emissions growth was far slower than global economic growth of 3.2%. This continued a pattern that had been interrupted in 2021 by the rapid and emissions-intensive economic recovery following the COVID crisis. Extreme weather events, including droughts and heat waves, as well as an unusually high number of nuclear power plant shutdowns, were to blame for the increase in emissions. However, the increased use of renewable energy sources reduced emissions by a further 550 million tons [
2].
The consequence of high emissions is an increased CO
2 content in the atmosphere (
Table 1) and a global temperature rise due to the greenhouse effect.
The increased CO2 content in the atmosphere, i.e., the greenhouse effect, is the main cause of climate change, which includes intense melting of the ice at the Earth’s poles, increased number and intensity of winds, extremely high temperatures in certain regions, forest fires, and droughts, but also floods, landslides, and the like.
Extreme weather conditions have been analysed by many researchers [
4,
5,
6]. They concluded that heat waves are increasing in the southern and western United States, as well as in western Europe, the Mediterranean region, and the Mediterranean basin. At the same time, the seasonal thermal anomalies are more pronounced in summer in the northern hemisphere than in winter.
Further global warming is likely to lead to a higher proportion of stronger hurricanes (category 4 and 5), larger storm surges, and more extreme precipitation event [
7].
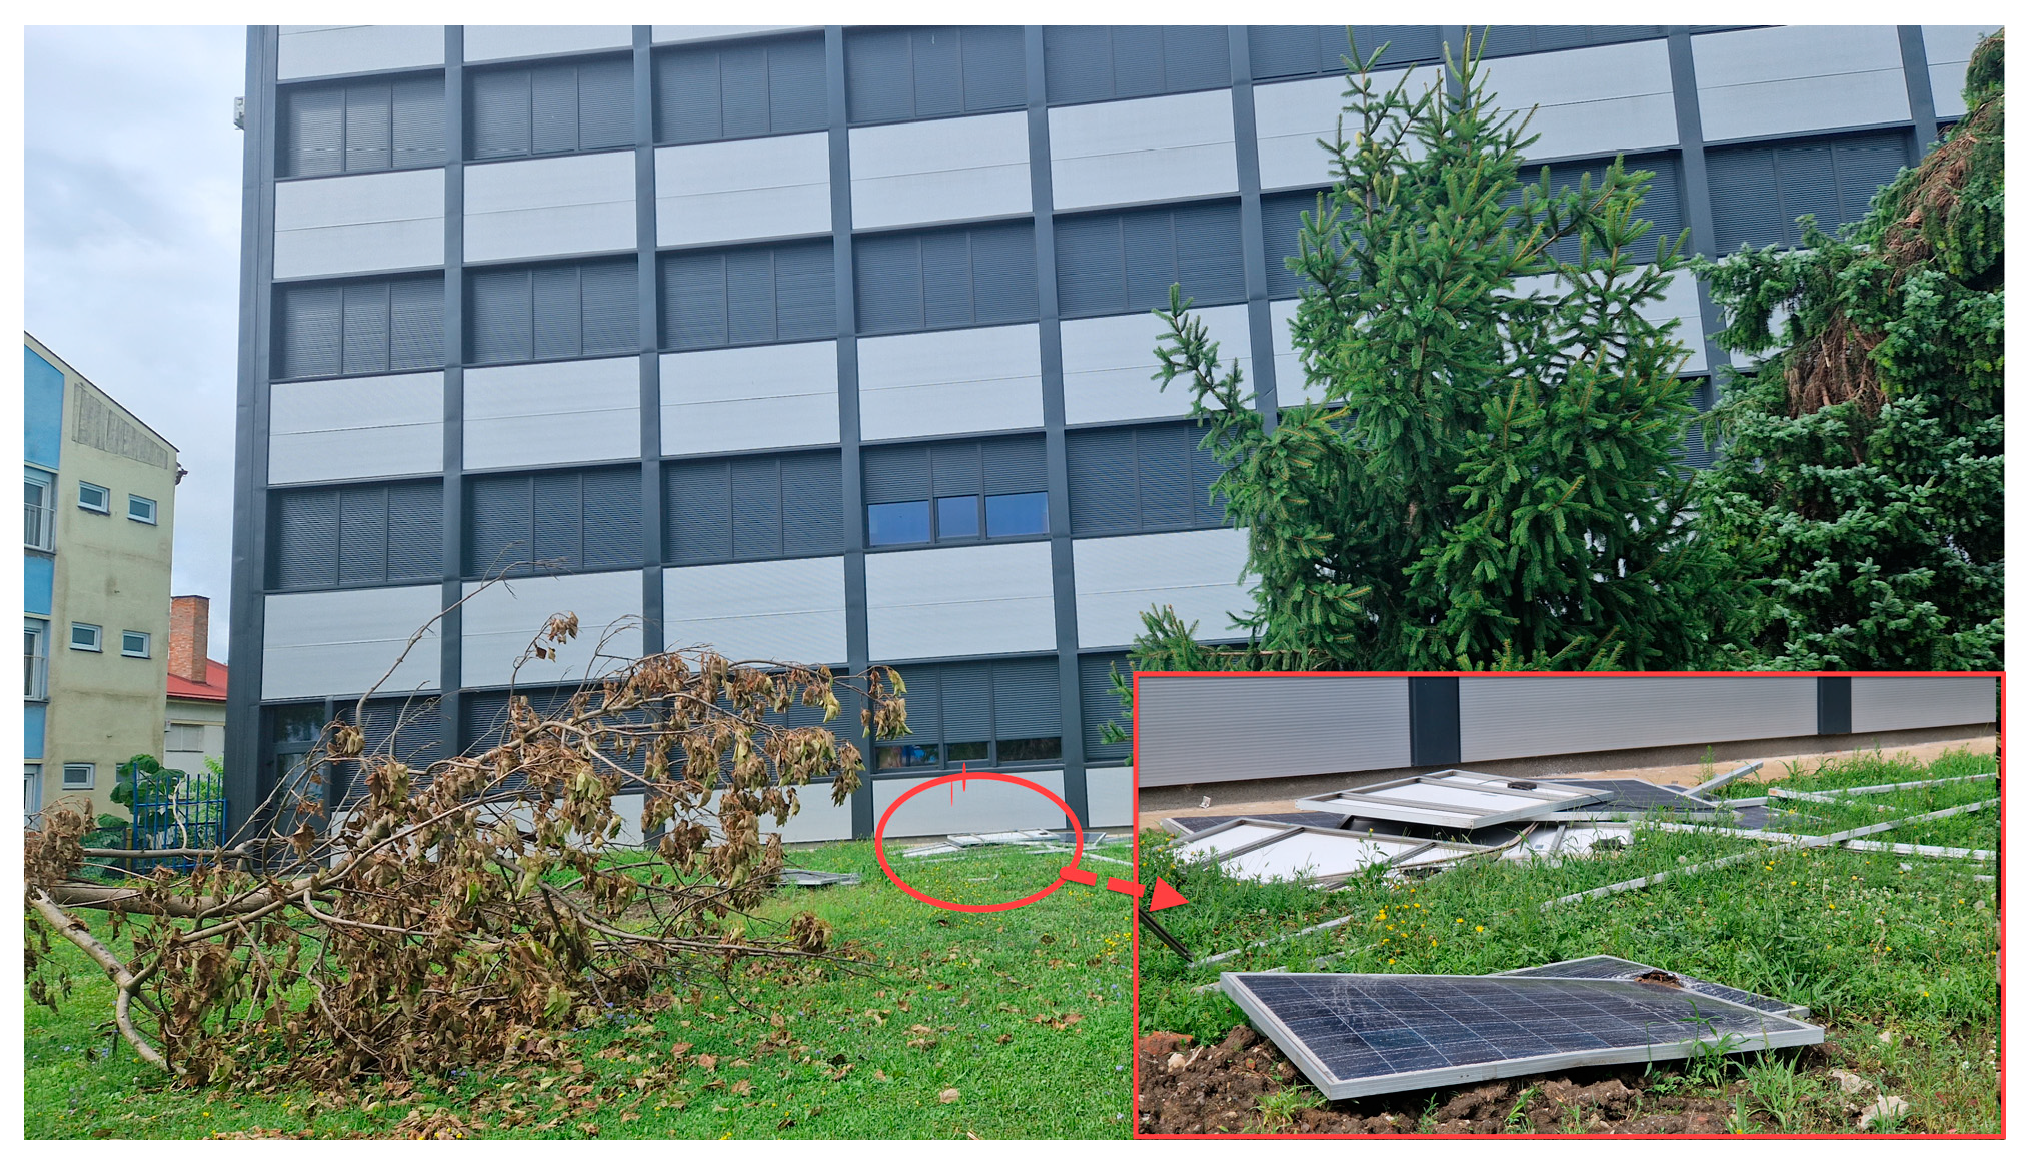
The results of the previous research are also confirmed by the extreme weather conditions in June and July 2023, when, in many places in Europe, the highest temperatures since meteorological measurements began were recorded. In addition, at the end of July, a large part of Europe, especially northern Italy, Slovenia, and Croatia, was hit by an unprecedented storm with wind speeds of over 200 km/h. The stormy winds uprooted trees as if it were a joke and tore off the roofs of many houses. Parts of the electricity grid were torn off and some of the PV panels were ripped off the roofs of the buildings (
Figure 3), which was also observed by the authors of this article.
In some places, hail with a size of over 30 mm caused major damage to crops, cars, and house roofs, but also to PV panels. Finally, heavy rains occurred in the same areas in early August, causing flooding in many areas. All this is likely to happen again in the coming years, and with increasing intensity. As PV power plants have become more strategic, these events have led the authors to analyse the resilience and reliability of PV power plants to extreme weather conditions.
In general, it can be said that climate change has become one of the biggest problems of this century. The Paris Agreement provides a mechanism with which to limit the global temperature increase to “well below 2 °C” and ideally to 1.5 °C compared to pre-industrial levels. People have realised that they need to change the way they produce energy. The quick adoption of low-carbon technologies to replace conventional fossil fuels can bring about such a transition. The application of green and sustainable technologies and their innovations are the most effective means of reducing CO
2 emissions [
8,
9].
This transition to sustainable low-carbon energy production was accelerated by the insecure supply of conventional fuels (natural gas, oil) due to wars and deteriorating political relations between the major powers. Globally, the main form of energy in the 2050 plans was to be electricity, and this was to be generated mainly via wind turbines and PV power plants (
Figure 4).
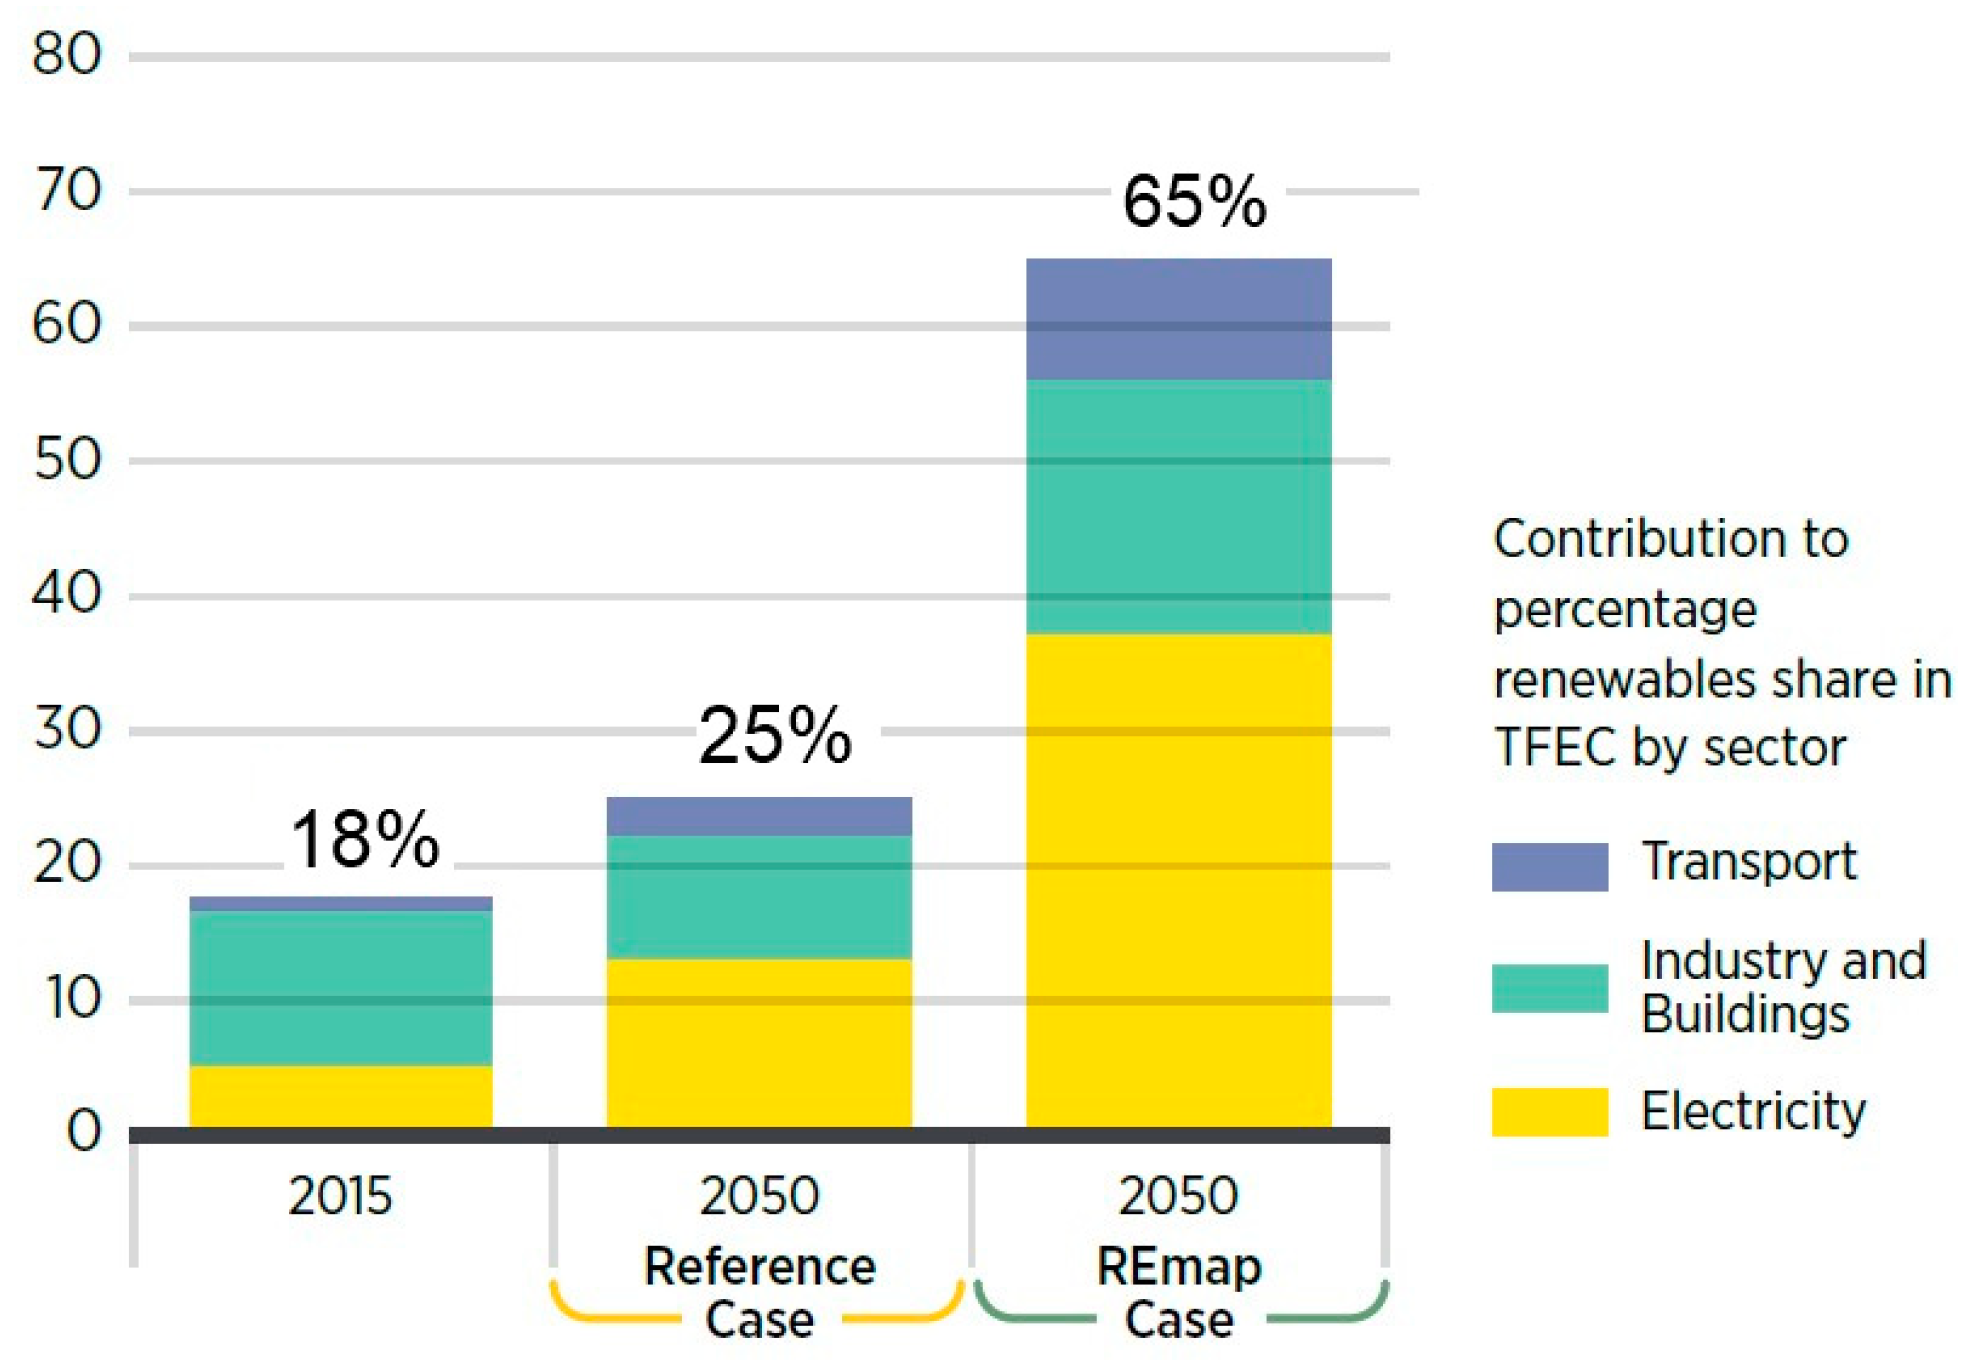
By 2050, every country may substantially increase the proportion of renewable energy in its overall energy consumption. Renewable energy (REN) can account for 60% or more of total final energy consumption (TFEC) in several countries, according to REmap [
10,
11] (
Figure 5), and thus contribute to the sustainable development of the economy.
The transition to increasing electrification of transport and heat generation, combined with the expansion of renewables, would provide around 60% of the needed CO
2 emission reductions in the energy sector by 2050 [
10].
The installed PV capacity worldwide is predicted to reach 4400 GW by 2030 and 14 TW by 2050 under the “net-zero emissions by 2050” scenario [
12].
The manufacturing process of PV power plant components is very energy intensive. Depending on the production location of the PV plant, the energy payback time (EPBT) is 2 to 5 years [
13]. This also means that CO
2 emissions from the production of PV power plant components are high. Since it is planned to install large capacities of PV power plants by 2050 (especially in China) and, at the same time, reduce the use of energy sources such as coal, oil, and gas in thermal power plants, it is interesting to analyse the amount of CO
2 that will be emitted worldwide by 2050.
There are different scenarios in the literature (
Figure 6). According to the scenario based on current policy and legislation, CO
2 emissions will increase approximately until 2035. This means a further increase in the CO
2 content of the atmosphere and an increase in extreme climate conditions. Although CO
2 emissions will decrease after 2035 according to the author, climate change is likely to last much longer, even until 2070.
PV power plants are operated on open spaces to capture as much solar energy as possible. The disadvantage is that the solar modules are constantly exposed to meteorological phenomena. The planned lifetime of PV power plants is 25 to 30 years. During this time, they must withstand increasingly unfavourable and extreme weather conditions in order to function reliably and safely. The question is to what extent the PV power plants built so far can do this. However, let us first define what is meant by extreme weather conditions: stormy wind, hail, lightening, high temperatures, wildfire, and floods.
Solar panels are designed to withstand relatively high wind speeds, but they can be damaged by gale-force winds whether they are installed on the roof or on the ground. This is because the wind gusts can come from all directions at once and lift the modules off their supports. It appears that rooftop modules are less susceptible to wind damage than tracking units and elevated mounting structures [
15]. Solar modules are also vulnerable to falling objects if they are carried by the wind.
Hail can damage solar modules by hitting them directly, or it can leave debris on the modules through which water can enter the PV system.
Lightning is the most common cause of damage to PV systems. It can cause damage to the solar modules and inverters as well as to other electrical equipment.
High temperatures not only affect the PV system’s power generation but also accelerate the ageing of the PV system’s components and increase the risk of fire. In addition, some materials is not able to tolerate short and extremely high temperature peaks [
16].
Fire risk is related to the vegetation and shrubbery around the PV installation, as well as local temperatures, relative humidity, and wind. Increased temperatures due to climate change are likely to exacerbate the risk of wildfires in some areas.
Flood risk takes into account the maximum short-term rainfall and the height that water can reach to flood electrical equipment and electrical cabins.
Storms often cause damage to power transmission systems. PV systems are quite storm-proof and can offer significant potential for powering local areas and critical services while the power transmission system is repaired [
17].
Furthermore, some examples show that PV systems are more resilient to weather disasters compared to conventional energy systems. For example, the earthquake and tsunami in Fukushima destroyed three nuclear reactors and released radiation, while most rooftop PV systems remained undamaged [
18].
Feron et al. [
19] investigated how cloud cover and weather fluctuations, which are exacerbated by climate change, affect the performance of PV systems. They found that conditions over the Arabian Peninsula are likely to worsen in the future, while they improve over southern Europe.
The I-V characteristics of a silicon-based monocrystalline PV cell were observed by Libra et al. [
20] in a range from −170 °C to +100 °C. The efficiency of energy conversion decreased by about 0.5%/°C with increasing temperature. The voltage of the PV modules also varies significantly when the temperature of the modules varies greatly.
Ketjoy et al. [
21] examined PV modules under conditions of prolonged moisture (flooding). They discovered several modules that might disrupt the operation of the PV system as they had high leakage voltage values and poor insulation resistance. High leakage voltage leads to safety problems. The majority of the samples—about two thirds—showed significant moisture penetration into the modules and did not meet the minimum requirements of the IEC 61215-1 (2021 Terrestrial photovoltaic (PV) modules—Design qualification and type approval—Part 1: Test requirements International ElectrotechnicalCommission, Geneva, Switzerland, 2021,
https://westore.iec.ch/publication/61345#additionalinfo) standard for assessing the moisture resistance of insulation.
Omazić et al. [
22] analysed the degradation of PV modules by observing the relation between environmental conditions and the polymer components of solar modules. They paid particular attention to the effects of temperature and humidity on the lifetime and the internal stresses of the PV modules. The results showed that the hot and humid tropical climate causes faster and more severe degradation of PV modules.
Aly and Clarke [
23] used computational fluid dynamics (CFD) and machine learning to analyse the designed wind loads on solar panels and compare them with experimental data to improve the resilience of the structure.
Jackson et al. [
24] analysed the impact of extreme weather conditions on the performance of utility-scale PV system in the United States by combining operation and maintenance data, weather data, and production data. Hurricanes (12.6%), storms (1.1%), and snow events (54.5%) all resulted in significant energy production drop.
Gholami et al. [
25] investigated the main parameters affecting the temperature of a PV panel. Irradiation and ambient temperature have been shown to have a direct effect on cell temperature, while humidity, wind speed, and the amount of dust that forms on the surface of a module have an opposite effect.
De Luca et al. [
26] studied the impact on energy production of PV systems during compound climate extremes that occur when several weather variables occur together, e.g., high temperatures, precipitation, and wind effects.
Based on several years of atmospheric study data, Yang et al. [
27] have developed a system by which to determine how vulnerable the power grid is to storm-related power outages. In Connecticut (USA), Eversource Energy’s distribution infrastructure was assessed using the proposed architecture from 1981 to 2020. The analysis showed that extreme events have increased over the last decade. The authors have assessed the potential impact of climate change on the resilience of the distribution network in this scenario.
A novel approach to study integrated energy systems (IES) susceptible to both stochastic and shock-induced failures was presented by Di Maio et al. [
28]. To illustrate the application of the proposed framework, an example of an IES consisting of two combined cycle gas turbines, a nuclear power plant, two wind farms, a PV plant and an electric gas plant is considered. The results indicate that IESs are resilient to climate-related outages.
Kaymak and Sahin [
29] compared floating PV power plants and ground-based PV power plants under extreme weather conditions. Based on the measured values of electricity production, it was found that both types of power plants provide equally good results. The main finding of the study is that floating PV power plants operate safely under extreme weather conditions; nonetheless, the connections must be flexible, and the system’s parts must be able to float independently.
Yılmaz et al. [
30] consider the risk of flooding and erosion as important criteria for choosing the location of a PV power plant by applying the analytical hierarchy process (AHP) method. The results of their study show that the risk of flooding and soil erosion cannot be ignored when selecting a site for a PV power plant.
Donaldson et al. [
31] have proposed a geospatial model of wildfire PV capacity to quantify the likely temporal reduction in PV capacity due to wildfire smoke. The accuracy of the proposed model was tested on forest fires in California in 2020. Real solar production data were used to demonstrate the high accuracy of the model.
Gómez-Amo et al. [
32] evaluated the effects of unusually high atmospheric dust and a forest fire that broke out at the time (June 2012) on the operation of PV systems. They measured aerosol exposure, solar irradiance, and output power of a PV plant in Burjassot (Spain). Empirical estimates were obtained via direct comparison with the day before the fire (reference day). The analysis shows an average daily energy loss of 20% of the energy generated by the PV system on the reference day. A significant part of the energy loss was due to smoke, with a daily maximum of 43% and a daily average of 34%. Dust caused an average reduction in energy production of 6%. The peak values of power reduction reached 8% for dust and 51% for smoke.
This paper attempts to comprehensively assess the impact of extreme weather conditions on PV systems and the degree of resilience of PV systems to these conditions. In addition to the effects on the safety and stability of PV systems, it should be noted that extreme weather conditions also have an impact on the amount of energy generated and the energy losses in PV systems, which also implies an economic effect.
In addition to data from the literature, experimental results obtained through field measurements and results from numerical analyses have been used for the assessment. In this sense, the paper expands the existing knowledge on the above-mentioned topic and will raise awareness of the problems faced by planners, installers, and users of PV systems due to the increasingly frequent occurrence of extreme weather conditions.
3. Results and Discussion
In this section, the effects of wind storms, hail, lightning strikes, high temperatures, wildfires, and floods on PV systems are analysed in more detail.
3.1. Extreme Wind Speeds
The solar modules of PV power plants can be exposed to a natural disaster and the question arises as to the durability of the modules under these extreme weather conditions. From an economic point of view, extreme weather conditions raise the question of the profitability of such a significant investment. Thanks to improved design and materials, today’s solar modules have better mechanical properties and are more resistant to extreme weather conditions such as heavy rain, hail, snow, and even hurricanes.
PV power plants should be designed for wind loads. However, there are no international and national wind load codes for PV modules yet. The calculations are carried out according to the concept of different design codes, such as Eurocode EN 1991-1-4:2006 (2005+A1, Eurocode 1: Actions on structures—Part 1–4: General actions—Wind actions, CEN, Brussels, Belgium), ASCE 7-10 (the American code, Minimum Design Loads and Associated Criteria for Buildings and Other Structures, ASCE, Reston, Virginia, USA), DIN 1055-4:2005-03 (the German code, Action on structures—Part 4: Wind loads, DIN, Berlin, Germany), etc. The wind load takes into account the basic characteristics of the wind speed in the area where the power plant is installed. However, extremely high, hurricane-like wind speeds can occur, which can cause severe damage to the power plant. Many reports from around the world prove this. To illustrate this, the numerical analysis of the wind load of an existing utility-scale solar power plant in Slavonski Brod was carried out using Ansys software. The geometric model of the ground solar is shown in
Figure 7. The supporting structure consists of steel profiles. The analysis was carried out for wind speeds of 20 m/s, 50 m/s, and 75 m/s, whereby only the forward wind direction was analysed.
The fluid–structure interaction (FSI) method was used to determine the deformations and stresses under the influence of wind. Computational fluid dynamics (CFD) simulations were performed to determine the wind loads. CFD is based on the steady Reynolds averaged Navier Stokes equations (RANS), and the simulations are performed using the finite volume method in Ansys CFX 2023 software. The
k-
ε turbulence model is often used to simulate the properties of turbulent wind flows [
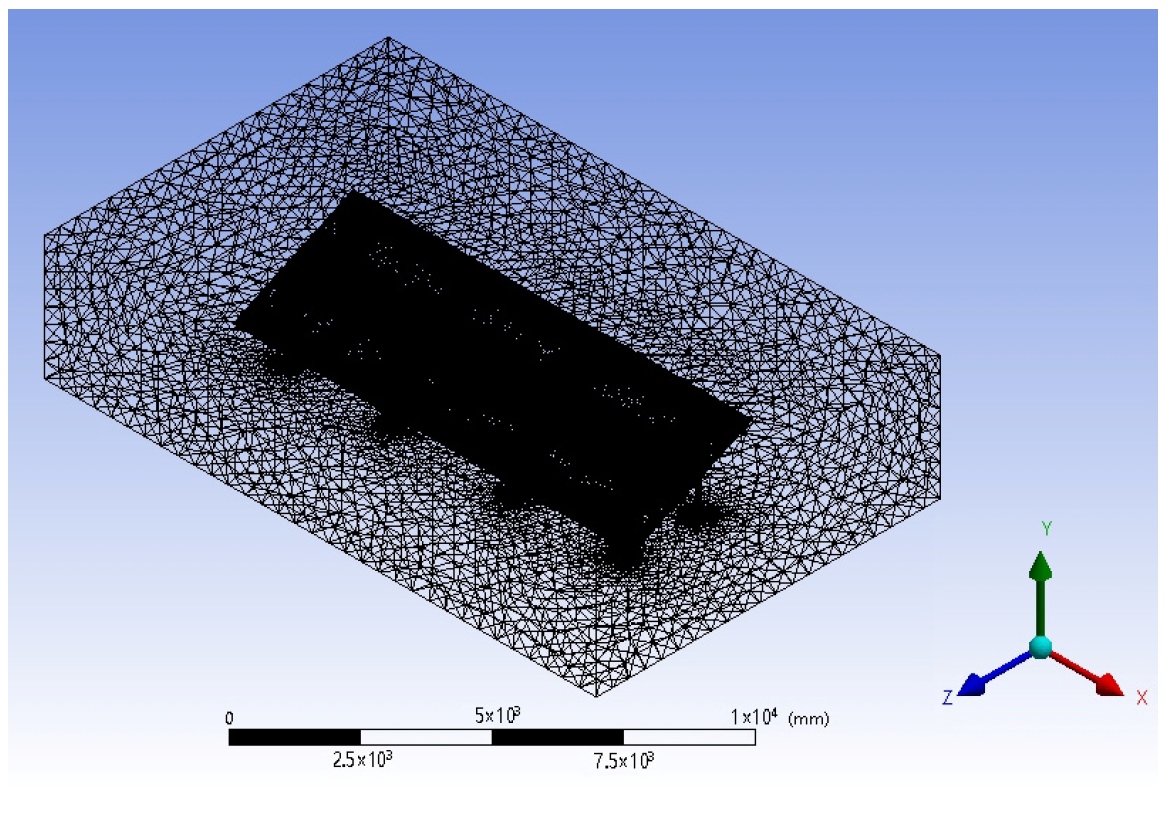
33], so it is also applied here. The discretisation of the transport equations was carried out using the first order upwind scheme. The pressure–velocity coupling is obtained by solving the governing equations of fluid mechanics using the widely used Simple algorithm. The selected fluid domain with boundary conditions is shown in
Figure 8. The generated computational mesh of the model consists of 23.7 million cells, most of which are tetrahedral (
Figure 9).
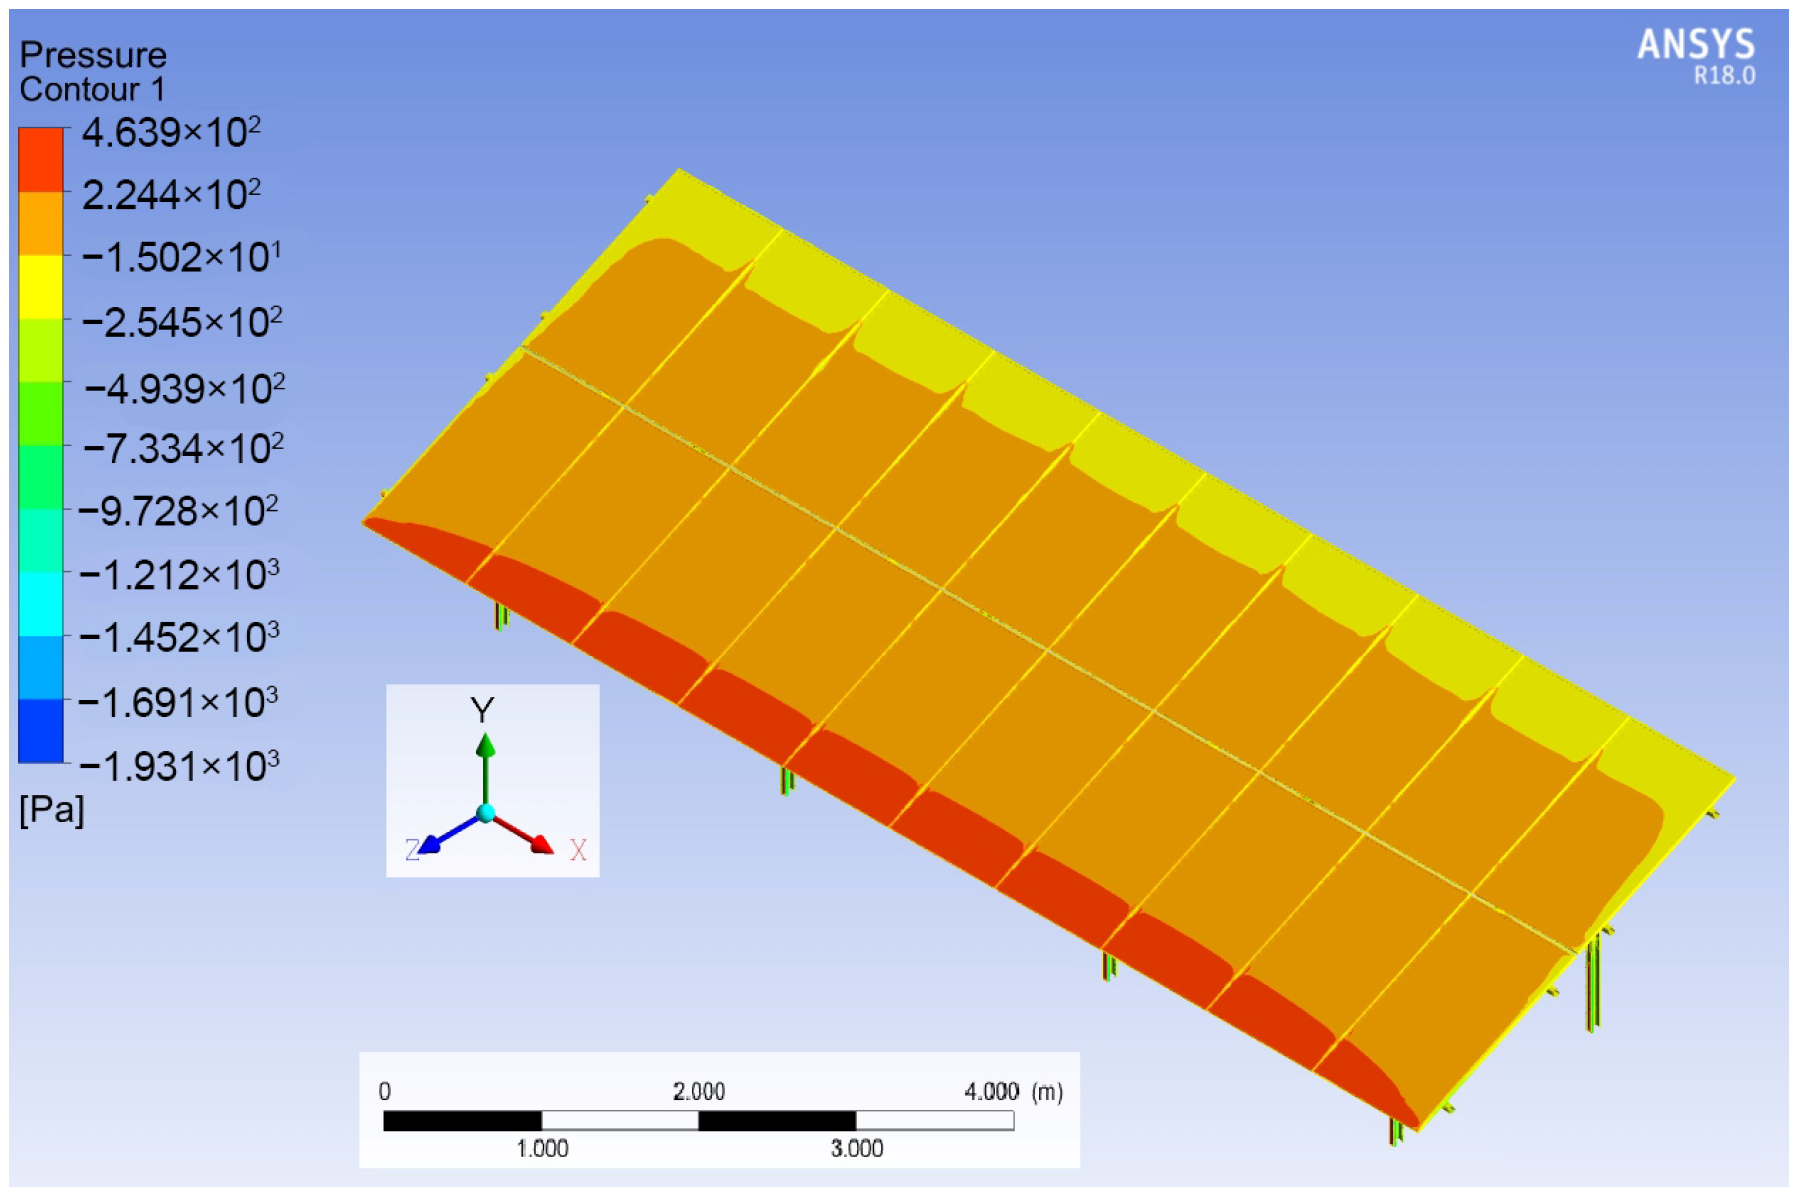
The pressure load determined via CFD for a wind speed of 25 m/s is shown in
Figure 10. The pressure loads for the other wind speeds considered were determined analogously. The pressure distribution is similar to the distribution on an airfoil. Overpressure is on the front side, and suction is on the back side, and the overpressure is a little higher than the suction.
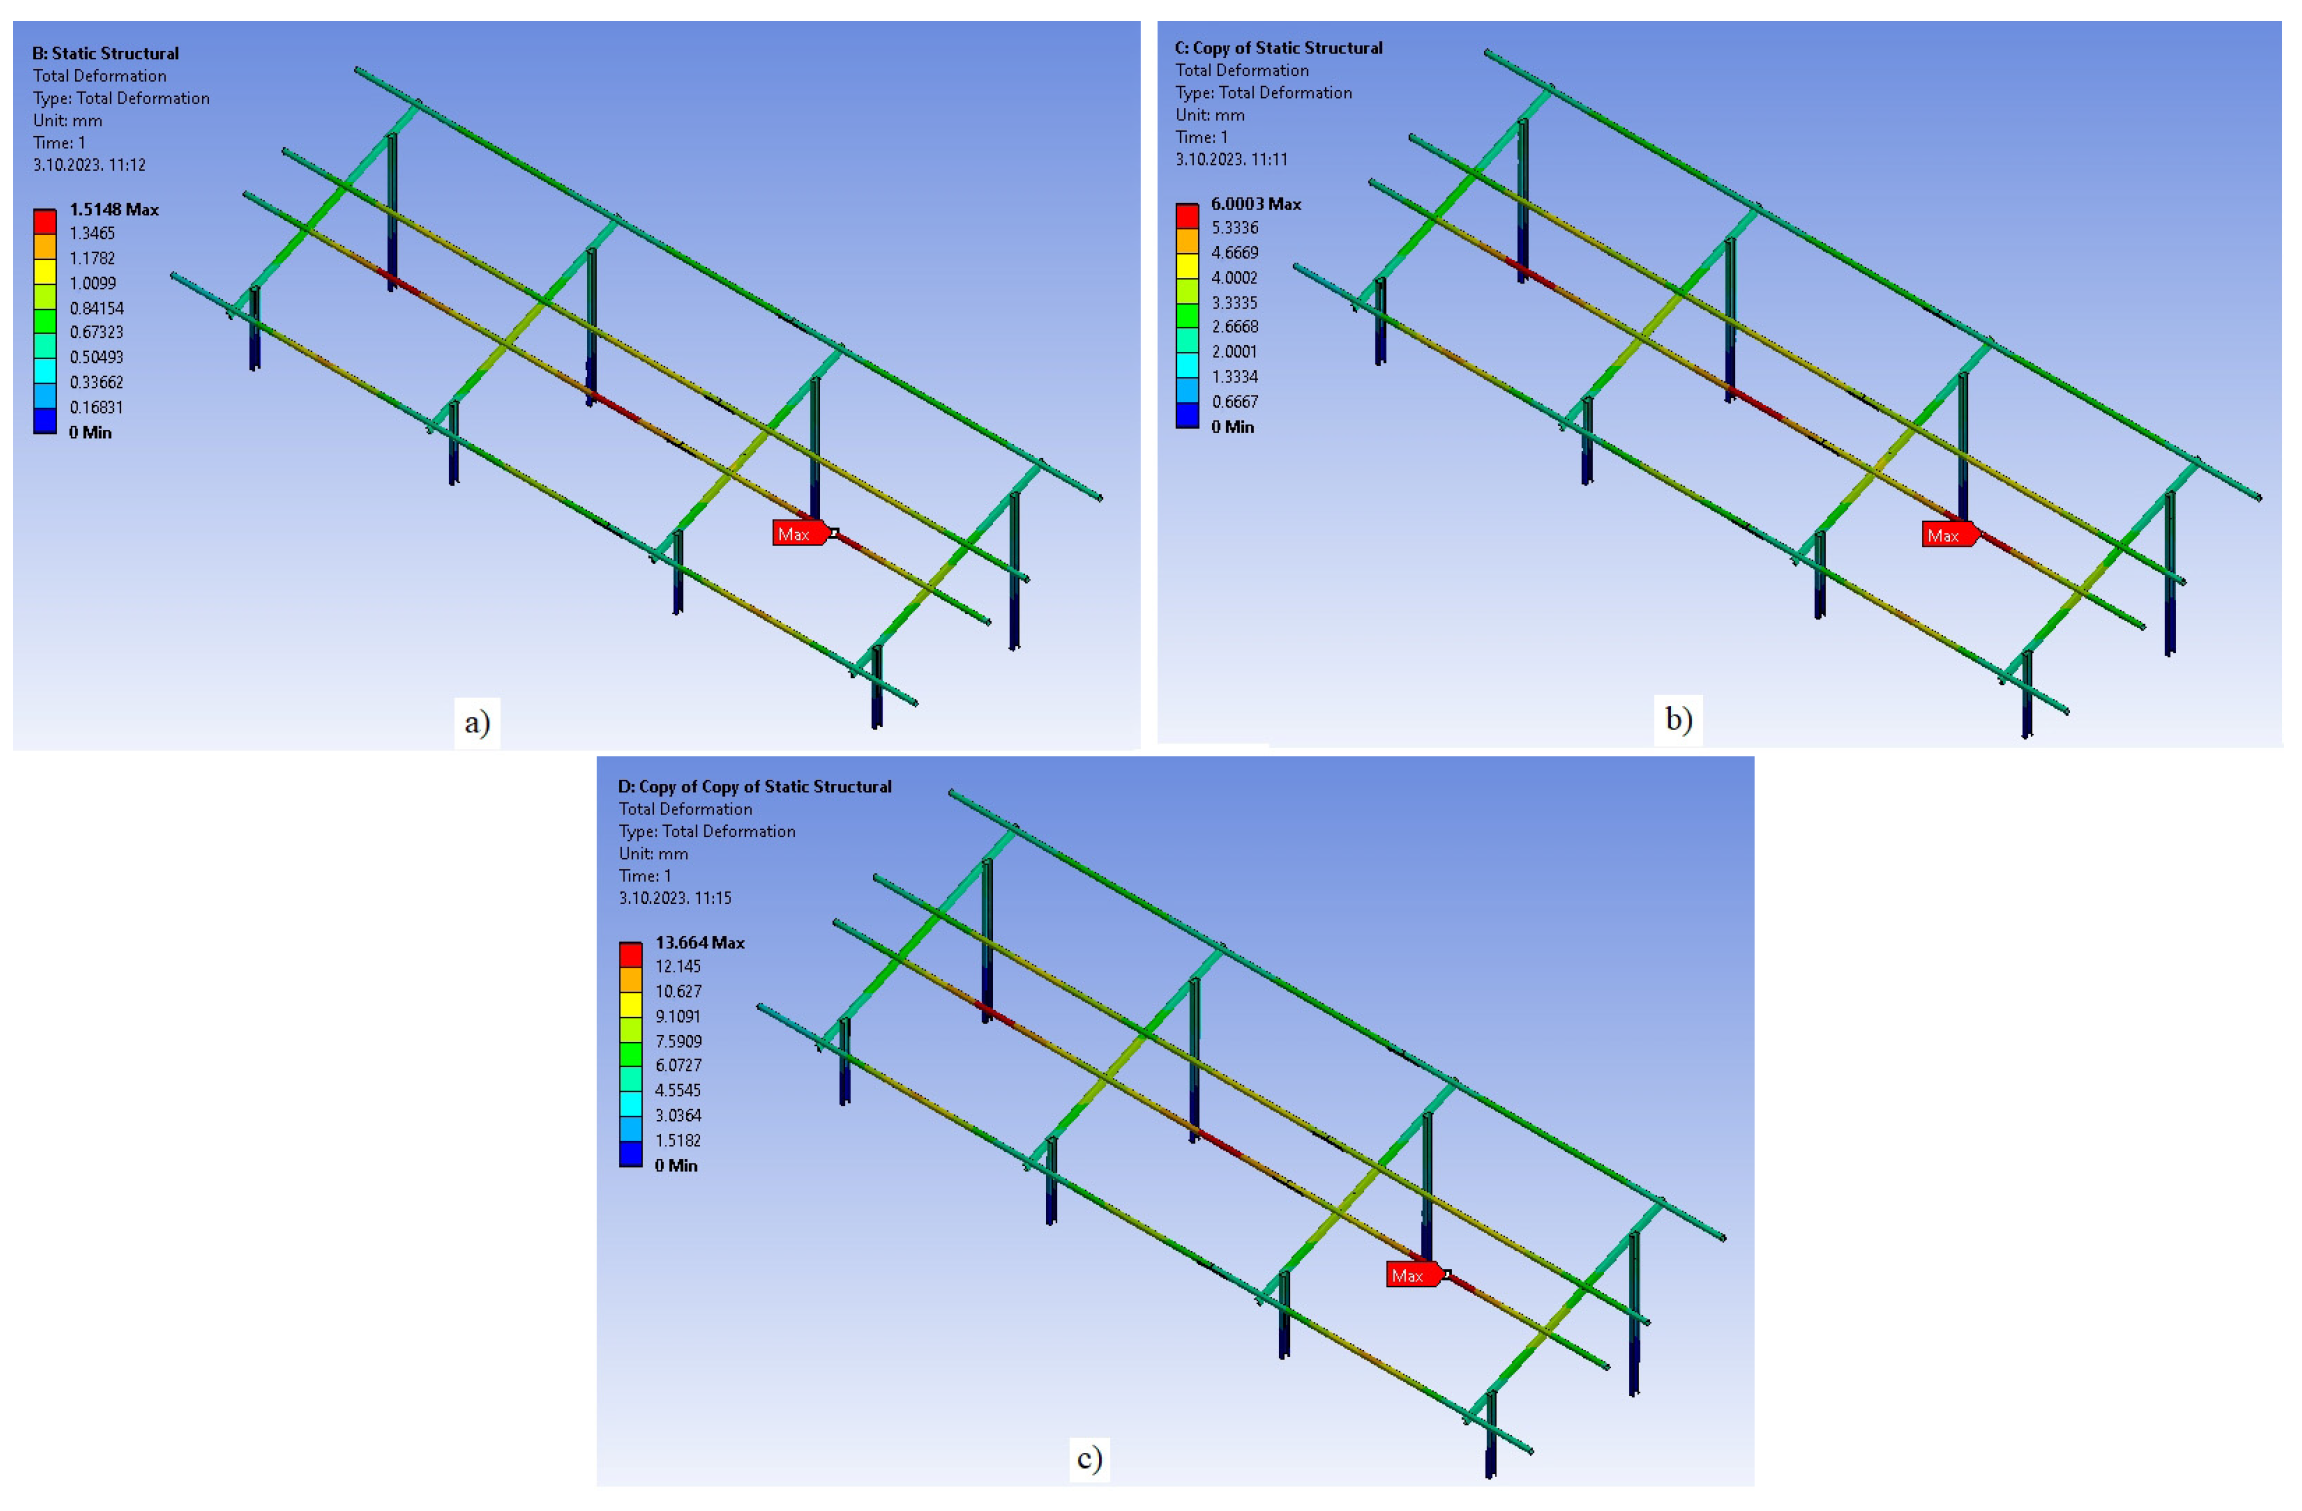
The pressure load obtained via the CFD analysis was imported into the static structural analysis. After generating the finite element mesh and defining the boundary conditions, a sensitivity analysis of the mesh was performed. Then the total deformation and stresses in the elements of the load-bearing structure were determined.
Figure 11 shows the distribution of the total deformation of the structural elements for the wind speeds considered. As can be seen, the C70 section beam, which belongs to the lower rails, experiences the greatest deformations. As the wind speed increases, the load increases and the total deformation increases. When the wind speeds are hurricane-like, the deformations become very large.
The stress distribution for the considered wind speeds is shown in
Figure 12. A high value of local stress is visible on the first beam of the lower rails of the C70 profile (
Figure 13). This is a consequence of the stress concentration at the geometric discontinuity under the connecting element of the L profile. However, the von Mises stresses of the individual beams are significantly lower, as can be seen from the distribution of shades of blue on the profiles (
Figure 12). Nevertheless, the stresses increase with increasing wind speed and reach significantly high values at hurricane speeds. These values can threaten the stability of the structure and lead to its plastic collapse.
Figure 12c shows that the beam stresses reach 300 MPa, which is significantly higher than the permissible value for the beam material (the yield strength is 235 MPa). In this case, loss of stability and collapse of the structure can be expected.
Flexible PV systems are usually very sensitive to wind-induced vibrations in addition to static loads [
34]. Therefore, it is crucial to better understand the dynamic response of flexible structures. Random fluctuating wind causes random forced vibrations of the flexible system, which is called buffeting. Buffeting has a negative impact on the safety of the structure’s components. It is often analysed as a stationary phenomenon, but in real life, it is mostly a non-stationary phenomenon. Another form of dynamic response of a flexible structure to the wind is flutter. Flutter describes the phenomenon of structural oscillation due to aerodynamic instability. At a certain critical wind speed, the structure starts to vibrate and collapses. Flutter instability is caused by the interaction between structural stiffness, aerodynamic forces, and inertial forces. It is necessary to improve flutter stability through the design of the PV structure. In addition to the two forms of dynamic response of the structure to the wind mentioned above, there are also vibrations caused by vortex shedding. At a certain wind speed, pairs of alternating vortex sheddings form on the top and bottom of the structure, resulting in vibrations of the structure. These vibrations usually cause fatigue damage to the structure. When designing a flexible PV system, it is therefore advisable to carry out an analysis of the dynamic response of the system to the action of the wind.
3.2. Hail
Severe hailstorms can seriously damage PV solar modules. Hail usually damages the front glass surface of the module and sometimes breaks the solar cell. The resulting cracks on the surface of the front glass reduce the solar radiation entering the solar cell. On the other hand, cracks in the solar cell lead to a reduction in current. Damage caused by hailstorms not only reduces electricity generation but also the lifetime of the PV modules. Therefore, it is very important that the modules can withstand the impact loads caused by hail.
To check whether the solar module can withstand the impact of hailstones, it is necessary to carry out a hail test. This test is an important test for the safety and quality of solar modules. It is usually performed to certify new types of solar modules and products. The tests are carried out in laboratories with a pneumatic device that ejects ice balls of different sizes and at specific speeds. The well-known hail impact tester is a product of the German company PSE (Project in solar energy), which specialises in testing PV modules. The PV panel is bombarded with ice balls at several specific points. The panel has successfully passed the test if it shows no visible damage after the test. However, real weather conditions may exceed the limits used in the test environment and cause damage to the installed modules.
The hail impact test is carried out in accordance with the guidelines of the IEC 61215-2 standard [
35]. The tests are carried out by varying the size of the ice balls from 12.5 mm to 75 mm in diameter and the speed of the ice balls from 16 m/s to 39.5 m/s. The path of the ice ball from the launcher to the module can be horizontal, vertical, or at any intermediate angle [
36]. In addition to the tests, numerical simulations of the effects of hail on the PV panel can also be carried out. Hail is a mixture of ice and other solids that occurs on Earth. The impact energy depends on the mass, and speed and can be extremely high. When hail hits a solid surface at high speed, there is a strong deformation and a transition from solid to water. Different methods of numerical analysis can be used to describe this process: the traditional Lagrangian finite element method, the arbitrary Lagrangian–Eulerian method, and the smooth particle hydrodynamics (SPH) method [
37]. The last model can provide more accurate results with less central processing unit (CPU) time. The SPH method is a mesh-free method and does not have the problem of mesh distortion that occurs in the finite element method. For this reason, the SPH method has been used in most studies to analyse the effects of hail on a PV panel or other object. The method has been implemented in many commercial software’s such as Abaqus, LS-Dyna, and the like.
One of the new studies on the effects of hailstones on a PV panel, based on numerical simulations using the SPH method, was conducted by the researcher Qi Xie [
37]. The author introduced parameters with stochastic variances into the material model of the panel glass. He analysed hailstones falling on a glass panel (impact core area with radius R = 0.3 m) with different impact velocities (from 40 m/s to 100 m/s) and stochastic variance from 0.1 to 0.9. The maximum diameter of the hail ball was 50 mm. A PV panel with dimensions of 2000 mm × 1000 mm and thicknesses of 3.5 mm to 4.2 mm was considered. The results of kinetic energy, equivalent stress, and deformation were obtained via the analysis. When the velocities of the hailstones exceed 70 m/s, the deformations and shear stresses increase rapidly in the area of the plate core, which leads to a corresponding behaviour of the glass plate. Experimental tests [
38] have also shown that the kinetic energy for the breakage of the glass plate should be greater than 95 J, which corresponds to a hail velocity of 73 m/s and a diameter of the hail ball of 42 mm. From the above analysis, and also from practical experience, it can be concluded that PV systems are extremely resistant to hail and are rarely damaged by hail.
3.3. Lightning Strikes
Lightning usually occurs in bad weather. In temperate climates, lightning occurs most frequently in summer; in polar climates, it is very rare; and in equatorial zones, it occurs during the rainy season or even all year round. By its very nature, lightning describes electrical discharges in the atmosphere (cloud-to-cloud, cloud-to-air, and cloud-to-ground lightning). As a hazard to PV power plants (and all other objects on earth), cloud-to-ground lightning is the main focus (25% of all lightning). Experience shows that 90% of cloud-to-ground lightning strikes are negative downward lightning [
39].
Lightning protection is an important challenge in PV power plant design, as lightning can cause major damage, resulting in component replacement costs, repair costs (direct costs), and PV plant failure (indirect costs—no electricity is generated). There are also additional costs (which are difficult to estimate over time), such as premature ageing of PV components, e.g., bypass diodes of PV modules, semiconductors of PV modules and communication lines of data systems (measurements, signals) [
40].
Important resistant parts of PV power plants are protective devices against lightning strikes. All metal structures, frames of PV modules, DC and AC switchboards, and inverters should be interconnected and connected to earth probes and/or other earthing devices. It is better if their resistance has a low value and if the soil resistance is as low as possible depending on the soil parameters (chemical structure and moisture of the soil). In addition, surge protection devices are usually installed at specific locations in the power plant, e.g., in the control cabinets DC and AC and in the inverters. Even if transformers are part of the PV power plant, they must be protected by an SPD (surge protection device) against the surges caused by lightning. Usually, there are no tall objects (exposed outdoor objects) near the power plant, as these shade the PV modules and thus reduce the efficiency of power generation. There is, therefore, a certain probability of a direct or indirect lightning strike, which can damage electronic equipment and the insulation of the components of PV power plants and power transformers. Direct lightning strikes cause melting points in the structures (thermal energy of the thunder) or structural fractures (electrodynamic forces). Indirect lightning strikes cause induced overvoltage that poses a great danger to the insulation resistance of the components and can cause short-circuit currents.
The output parameters in the development of SDP are the average thunderstorm intensity (isoceraunic lines), defined as the annual number of thunderstorm strikes on an area of km2, the expected maximum lightning current, and the average lightning current. The waveform is defined by the maximum lightning current, the wavefront time t1 (time period needed to let the current rise from 10% to 90% of the peak value), and the tiling time t2 (time period needed to let the current fall from the peak value to 50% of the peak value), both in μs.
According to [
41], a lightning current wave pulse is usually modelled as 8/20 μs and 10/350 μs to perform a surge protection laboratory test. Maximum lightning currents vary from 2 to 200 kA, with the first wave typically having 2–3 times greater amplitude in terms of maximum current than the second wave (which naturally decreases). Moreover, 98% of the maximum currents are greater than 4 kA, 80% greater than 20 kA, and only 5% greater than 90 kA. The basic challenges in developing SPDs are to consider the different SPD types and match them to the protection levels within the PV system and the mounting locations of the SPDs.
It is too early to say that the climate has changed the isoceraunic zone of the area under study or the maximum strike current. However, if these parameters increase, it means that a better and more expensive SPD system should be used in a PV power plant system. The distances between surge arresters should be reduced to improve protection against lightning strikes. In addition, the SPD current ratings could be higher (which, in turn, leads to more expensive equipment).
Damage caused by lightning strikes reduces generation of electric energy and also decrease the lifetime of the PV modules.
3.4. High Temperatures
As a result of global climate change, not only have temperature maxima been recorded in many places in recent years but the period of hot weather has also been extended. To find out how this affects PV power plants, the authors measured the temperature of the PV modules placed on the roof of the building of the University of Slavonski Brod (Croatia) during the period of high temperatures in August 2023. The tin roof is oriented towards the south and there is no shading. The temperature was measured with the KIMO multifunction device AMI 300 using contact probes placed at four points (
Figure 14a). The data logger recorded data every 10 min for three hours. The temperature was also measured with a FLIR E53 thermal imaging camera (
Figure 14b). The results obtained are identical.
Wind speed and relative humidity (49%) were taken from the meteorological station Slavonski Brod. The measurement results show that the surface temperature of the module reaches 75 °C and depends more on the amount of incident radiation than on the ambient temperature. The temperature of the aluminum frame is much lower (reaches 60 °C) and depends more on the temperature of the ambient air (
Figure 15). At the same time, the heating of the DC and AC cables, which are an integral part of the PV power plant, is also evident. It is clear that the temperature of the cable insulation depends on the insolation, the temperature of the surrounding air, but also the generation of heat inside the cable itself [
42]. It can be observed that the influence of the measured wind speeds on the panel and cable temperature is very small, which is consistent with the results of Mayer and Grof [
43].
The estimated temperature of the cable insulation was above 50 °C during the measurement. Considering that the resistance in the conductor increases with increasing temperature, there is also increased heat production in the cable itself, which further increases the temperature of the cable insulation.
In many places on Earth, air temperatures reach up to 50 °C (North Africa, Middle East, USA, Italy, India, Australia, Spain, Portugal, China) with high solar irradiation, so the measurement results obtained from Slavonski Brod should actually be increased by about 10 °C to obtain extreme temperature conditions. This would result in a frame temperature of around 70 °C, a panel temperature of up to 85 °C, and a cable insulation temperature above 60 °C. The effects of such high temperatures on PV power plants can be analysed in relation to the following aspects:
First of all, it should be noted that the nominal parameters of PV modules (power, efficiency, etc.) are specified in corresponding standards for precisely defined conditions so that PV modules of the same type from different manufacturers can be compared. The standard test conditions are defined as solar irradiation with an intensity of 1 kW/m2 of a typical spectrum of wavelengths characteristic of solar irradiation at a PV module temperature of 25 °C (it is important to emphasise that the temperature of the PV module and not the ambient temperature is observed). This temperature is referred to as the temperature under standard test conditions (TSTC).
It is well known that the voltage, the power, and the efficiency of PV modules are temperature-dependent functions. All the above physical values decrease with increasing temperature (assuming constant solar radiation). The minimum peak power point voltage (
UMPP,min) is reached at maximum temperature
Tmax acc. Equation (1):
UMPP—voltage of PV module at maximum power point, (V);
—temperature coefficient of voltage, (%/K), typical values are in range from −0.257 to −0.31 [
44].
Similarly, the peak power at the increased temperature of the cells (assuming constant solar radiation) decreases according to Equation (2):
PMPP—power of PV module at maximum power point, (W);
—temperature coefficient of power, for c-Si usually in range −0.29 to −0.5%/°C [
45].
In PV modules, the power decreases with increasing temperature because the cell voltage decreases. This happens even though the generated current increases. This increase does not compensate for the voltage drop.
Let is assume that the solar module reaches 85 °C. In this case, the temperature difference is 85 − 25 °C = 60 °C. Power loss will be up to (60 °C × −0.5%) = −30%.
This drop in power is not only bad for the owner of the PV system but also for the electricity grid. This is especially important because electricity consumption increases during periods of high temperatures. If it is assumed that PV power plants will have a significant share in electricity generation, their drop in power generation from other sources must be compensated for. This means that a certain number of power plants based on non-renewable energy sources must continue to operate, at least as reserve capacity.
As the efficiency of the PV panel drops considerably at high temperatures, cooling the panel is a possible option for solving the problem. Various technical solutions for cooling the panels (active and passive cooling) have been proposed, but none of them have become established in the mass production of PV panels, probably due to their unprofitability [
45]. For this reason, further research is needed in this area in order to find technologically and environmentally acceptable and economically viable solutions.
The second question concerns the fire hazard. The PV panels themselves are not combustible at the high temperatures indicated, nor is the panel frame. However, if dry leaves or other flammable materials get on or under the hot PV panels, there is a real fire hazard. The question is whether the installations (cables) can pose a fire hazard. To answer this question, we should look at what is stated in the cable manufacturer’s specifications. For DC, the cables used in the PV system are single-core, flexible cables up to 1.8 kV of type H1Z2Z2-K [
46], insulated with cross-linked polymers without halogen sheathing, according to EN 50618(Electric cables for photovoltaic systems (BT(DE/NOT)258)European Committee for Electrotechnical Standardization, Brussels, EU, 2014). The cable is resistant to atmospheric influences according to EN 50396 (Non electrical test methods for low voltage energy cables European Committee for Electrotechnical Standardization, Brussels, EU, 2005.) and resistant to UV radiation according to HD 605/A1(Electric cables—Additional test methods, European Committee for Electrotechnical Standardization, Brussels, EU, 2009). The cable insulation is self-extinguishing according to IEC 60332-1(2004, Tests on electric and optical fibre cables under fire conditions—Part 1–2: Test for vertical flame propaga-tion for a single insulated wire or cable—Procedure for 1 kW pre-mixed flame; IEC, Geneva, Switzerland, 2004.) and without flame propagation in the vertical cable bundle according to IEC 60332-3(2018 RLV, Tests on electric and optical fibre cables under fire conditions—Part 3–10: Test for vertical flame spread of vertically-mounted bunched wires or cables—Apparatus; IEC, Geneva, Switzerland, 2018.) The defined limit temperature working conditions of the cable are −40 °C to +90 °C. The maximum working temperature of the cable is 120 °C, while the maximum temperature during a short circuit of a maximum of 5 s is defined at 250 °C. Under extreme temperature conditions, the cables could reach a value up to 70 °C, which, according to the information available so far, means that there is no fire hazard yet.
The third point concerns the effects of high temperatures on the life of the components of the PV system. First of all, the effects on the cable insulation can be considered.
The manufacturer specifies the service life of the cable insulation as 30 years at a temperature of 90 °C or 2.3 years at a temperature of 120 °C (according to the Arrhenius law on the ageing of insulation as a function of insulation temperature). Therefore, there should be no problems in this respect, although the quality of the insulation of the insulated electrical components decreases with increasing temperature and ageing is accelerated.
3.5. Wildfires
In recent years, the number of forest fires and their intensity have increased significantly due to the extreme drought and heat caused by climate change, making vegetation much more susceptible to ignition. The fire season has lengthened and extreme fire weather conditions have become more frequent worldwide in recent decades [
47]. A record amount of burnt land has been recorded in various countries around the world. The forest fires in Siberia in 2021 burned 170.8 thousand km
2. The fires were so extreme that plumes reached the geographic North Pole, Mongolia, Canada, Nunavut, and Greenland. In the EU, more than 5500 km
2 of land was burned in 2021, which is equivalent to twice the area of Luxembourg.
However, the year 2022 is even worse, as more than 8600 km
2 have been burned in the EU [
48]. Large fires continued in 2023. Wildfires in southern and central Chile in February 2023 burned over 8000 km
2 of land. Wildfires in Russia’s Urals and Siberia burned 2800 km
2 in May 2023. In June 2023, the Canadian province of British Columbia experienced the largest forest fire since records began. The fire broke out in Donnie Creek and burned 5340 km
2 of land. The wildfire in northeastern Greece in August 2023 is the “largest wildfire ever recorded in the EU” and burned more than 930 km
2 of land (
Figure 16).
As both wildfires and PV power generation increase worldwide, analysing the impact of wildfires and smoke on PV installations becomes important.
The impact of wildfires can be analysed in terms of the direct damage when the fire captures a PV system and the damage caused by reduced electricity production due to fire smoke and dust particles. Rooftop PV systems are usually not directly exposed to fire, but large-scale systems can be. Large-scale installations often use degraded land that may be covered with grass or vegetation, which is a potential fire hazard. For this reason, it is necessary to apply firefighting techniques during the design, construction, and installation of the facility, which include the following:
Conducting an initial fire risk analysis based on climatic conditions: temperature, relative humidity and wind speed, fuel type (vegetation) and fuel moisture;
Planning access for firefighting teams;
Selecting a site that is isolated from local vegetation.
It is also necessary to take preventive measures:
Vegetation management and landscaping (distance to modules/height of shrubs etc. on the site);
Adequate firefighting/emergency response arrangements on site;
Access to water supply to support firefighting.
With the increasing number of wildfires around the world, there is a need to study the effects of wildfire smoke on solar energy systems. Small PM2.5 particles are the main pollutant in wildfire smoke, and the effects of PM2.5 can be felt up to 200 miles downwind from the source [
49]. Wildfire smoke can last for days or even weeks and cover large areas of land. Gilletly et al. [
50] found that PV plant output was reduced by an average of 8.3% during days with high smoke compared to similar conditions with no smoke present. However, the degree of impact can vary greatly depending on the severity of the fire, the proximity of a PV site, and atmospheric conditions.
Not only does it lead to a significant reduction in photovoltaic production by reducing the amount of solar radiation reaching the panels but there are also certain patterns of PV power output known as the “wiggle effect”. The wiggle effect has the potential to jeopardise the frequency stability of the power grid due to the sudden change in PV power production. This is especially true for power grids with a high share of renewable energy sources [
51]. If we rely more on solar energy in the future and there are more forest fires, it will become a serious problem. The stability of the grid frequency depends mainly on the inertia of the large rotating turbines and generators in conventional power plants. As the trend is to replace conventional energy sources with renewable sources that do not have the inertia of the rotating turbines, the stability of the grid frequency must increasingly be maintained in the long term.
One of the solutions is to develop an algorithm that controls the inverter with the aim of improving the frequency stability of the system [
52,
53]. This control method is called virtual synchronous generator (VSG). VSG has been introduced by Zheng et al. [
54], Shi et al. [
55], and other researchers who have studied this topic in more detail.
3.6. Floods
Together with extreme precipitation, climate change, global warming, and fires, floods are one of the most frequent and destructive natural hazards in history [
56]. Due to climate change, floods are predicted to become more frequent and destructive in the coming decades [
57]. The breach of a dam can also lead to extreme flooding in the area downstream of the dam. In addition, water contributes to soil erosion, which is a potential hazard for PV power plants in certain locations.
When we talk about the flood risk of PV systems, there are differences but also similarities between rooftop PV systems and ground-mounted PV systems.
PV systems on sloping roofs do not usually generate an excessive amount of water due to their own drainage capacity, so the effects of heavy precipitation can be neglected. However, a PV system on a flat roof can be flooded during storms or heavy rainfall due to its lower drainage capacity and the relatively low installation position of the supports. A well-functioning drainage system is the first line of defence against flooding on flat roofs. Standard drainage systems include interior drains, scuppers, and gutters. Regular maintenance will ensure that the PV system remains in good condition and can handle the water load. In general, it is advisable to inspect flat roofs twice a year, preferably in spring and autumn. Additional inspections may be required after extreme weather events. Some suggestions to prevent flooding are as follows:
Selecting a suitable location for the PV system on the flat roof, avoiding areas with poor drainage;
Selecting a mounting and installation method that is compatible with the roofing and the PV system, either ballasted or mechanical.
When it comes to utility scale PV systems, degraded land that is not suitable for growing crops or for urban development is usually chosen. Such land can potentially be prone to flooding, which needs to be considered when planning a PV plant. This refers first to the analysis of hydrological conditions. Consideration should be given to the maximum short-term rainfall, water depth, flood level, runoff conditions, etc. These factors directly affect the PV support system, the construction of the foundations, and the installation height of the electrical equipment. Although the construction of drainage and drainage systems makes the investment more expensive, it can be recommended as a good option in certain cases.
Solar inverters are IP (ingress protection) rated for outdoor use, meaning their warranty covers typical outdoor weather conditions. However, if the inverter has been immersed in water, the product warranty will be voided. Wires, cables, and electrical components may also need to be completely replaced and require a thorough inspection. PV solar systems can be affected by flooding in different ways depending on their location and construction. Some of the possible risks are as follows:
Electric shock or gas explosion if the system is connected to the power grid and the flooded area has electrical wiring or gas pipes;
Fire if the system components fail or are damaged due to water damage or corrosion;
Performance degradation or structural damage if the system is exposed to erosion, debris, or sedimentation due to flooding.
Even if the power supply is switched off, installations with inverters connected to the regional power grid are at risk of electrocution or gas explosion if they are located in areas of the house that are flooded. To avoid or reduce these risks, it is important to take safety precautions, such as shutting down and disconnecting the system from the grid before flooding occurs.
The consequences of flooding on PV systems can be seen in the costs caused by damage to the system components but also in the loss of energy production while the system is out of operation. In addition, the sky is usually cloudier during period of rain, so energy production is also lower in this respect.
4. Conclusions
Solar power plants are an important strategic commitment in the decarbonisation of the Earth’s atmosphere. They have a long lifetime during which they are exposed to various weather conditions. In the coming period, more frequent extreme conditions can be expected due to climate change. It is therefore important that they are designed to withstand extreme weather conditions and contribute to the sustainable development of the economy.
The influence of wind speeds of 25, 50, and 75 m/s on the mechanical stability of the ground-mounted PV system was analysed via numerical simulation using Ansys software. The results show that the current constructions can withstand wind speeds of up to 50 m/s. Only at higher speeds are stresses in the construction that exceed the permissible stress limit possible. Due to the more frequent occurrence of hurricane winds, the load-bearing structure of the PV panels should be designed for greater wind loads than those specified in the current standard.
From the analysis and also from practical experience, it can be concluded that PV systems are extremely resistant to hail and are rarely damaged by hail.
The authors measured the temperatures in the PV power plant in Slavonski Brod in August 2023. The surface temperature of the PV module reached 75 °C, the temperature of the aluminum frame reached 60 °C, and the estimated temperature of the cable was higher than 50 °C. To reach the conditions of the extreme values, the temperature of the measured value should be increased by about 10 °C. Such increased temperature values are within the values specified for the working ranges of the components of the PV system. Therefore, there should be no fire hazard at high temperatures. However, the performance of PV power plants decreases significantly at high temperatures. This can pose a problem for the electricity grid if PV power plants account for a high proportion of electricity generation. It is also known that high temperatures lead to accelerated aging of PV system components.
The effects of forest fires are most evident in the reduction of electricity production by fire smoke and dust particles due to reduced solar radiation reaching the panels and the so-called “wiggle effect”. This effect can jeopardise the stability of the frequency of the power grid due to the sudden change in PV power production. It is also necessary to include fire protection measures in the project and during the construction and installation of the PV power plant.
PV solar systems can be affected by flooding in different ways depending on their location and construction. A PV system on a flat roof can be flooded during storms or heavy rainfall due to the lower drainage capacity and the relatively low installation position of the supports. The drainage system is the first line of defence against flooding, both for flat roofs and ground-mounted power plants. For ground-mounted plants, it is important to pay attention to the height of the inverter installation to avoid flooding.
We hope that this article will raise awareness of the problems faced by planners, installers, and users of PV systems due to the increasingly frequent occurrence of extreme weather conditions in order to find suitable solutions to these problems.
Following this research, further detailed investigations are planned. For example, an investigation into the influence of wind on PV systems in which all influencing factors would vary. An analysis of the proposed cooling solutions for PV panels is also planned, including economic and technological aspects, and possibly a proposal for a new innovative solution. The influence of ice on PV panels is also a topic that can be analysed via numerical simulations which could be interesting in the context of the application of PV systems in agriculture.


