Article

Quantifying Medium-Sized City Flood Vulnerability Due to Climate Change Using Multi-Criteria Decision-Making Techniques: Case of Republic of Korea

Department of Civil Engineering, Seoul National University of Science and Technology, 232 Gongneung-ro, Nowon-gu, Seoul 01811, Republic of Korea
*
Author to whom correspondence should be addressed.
Sustainability 2023, 15(22), 16061; https://doi.org/10.3390/su152216061
Submission received: 15 October 2023 / Revised: 14 November 2023 / Accepted: 16 November 2023 / Published: 17 November 2023
(This article belongs to the Section Sustainable Water Management)

Abstract

:
This study proposed a systematic approach to quantifying city flood vulnerability (CFV) related to climate change using several multi-criteria decision-making methods in medium-sized cities and investigated the sources of uncertainty in this assessment. In addition, this study was intended to explore ways for quantifying flood vulnerability and mitigating the impact of data uncertainty on flood vulnerability through multi-criteria decision-making (MCDM) methods. The MCDM method was applied as a representative method to quantify flood vulnerability, which considers regional priorities. This study used the weighted summation method, TOPSIS, and VIKOR to calculate all CFVs for medium-sized cities. Furthermore, fuzzy- and grey-TOPSIS were included to account for the uncertainty inherent in the MCDM methods, such as the usage of average values and varying weighting values for all CFV indicators across stakeholders. This study incorporated expert surveys and the entropy approach to derive subjective and objective weights for all conceivable indicators. As a result, we looked at the proposed grey-TOPSIS technique, which can minimize the uncertainty. Finally, grey-TOPSIS can notably provide robust and sustainable prioritizing since it actively reflects the views of multiple stakeholders and takes uncertainty in the data into account.

1. Introduction

Rapid urbanization in city regions has increased climate change and its flood implications beyond their highly growing population density and development [1]. The causes and occasions regarding urban flood disasters that we explore are linked within the urbanization process. Hong and Chang [2] explaining the concrete posit importance of the subjective and objective effects of city flooding by expatiating on urban social factors with climatic disaster. For example, an individual’s community participation and annual income are closely related, either positively or negatively, to flood risk perception. In the process of urbanization, some city managers and urban planners have begun to pay attention to sectors of coupled human–environment interaction in flood risk prevention [3]. However, major conventional approaches to flood risk prevention and flood disaster reduction do not lay high stress on the societal subjects formed by people and communities [1].
In recent years, extreme weather events have occurred frequently in the context of global warming [4,5]. Specially, flood damage is expected to largely increase because of extreme precipitation events under global warming [6] and high population growth rates over or near floodplains [7]. Accordingly, the flood damages in the next decades could be exceptionally larger, with a 200% increase in the global economic exposure to flooding by 2050 [8]. These frequent and extreme floods have become fatal threats that hinder sustainable development in society, economy, and environment.
Nationwide annual average precipitation in the last 30 years (1988–2017) has increased by 124 mm compared to the early 20th century (1912–1941), showing significant variability. Additionally, over the past 106 years (1912–2017), Korea has also experienced a significant change in climate. In addition, precipitation in summer has increased significantly, along with increases in the frequency and daily precipitation of 10 mm or more. Specially, the increases in strong precipitation of 80 mm or more are evident [9]. In urbanized regions, the impact of flood disasters can continue to hinder social and economic development. Moreover, the increase in the frequency, duration, and intensity of summer precipitation resulting from climate change is expected to further heighten the likelihood of flood disasters. Huang et al. [10] revealed that the type of land use has a strong influence on flood events during a specific return period. Accordingly, they explain that the number of flood events increases significantly in urban and farmland and decreases in forest areas.
The dose–response relationship between an external environmental hazard from climate change and its flood risk degree can be used to define urban vulnerability [11]. In addition, vulnerability assessment depends on external characteristics such as various social and environmental factors and the importance of each indicator. Thus, it can be integrated with a multi-criteria decision-making (MCDM) approach, where decision-makers are required to evaluate and analyze a range of options with various attributes [12,13]. The importance of selecting suitable assessment indicators has grown with the expansion of available datasets, leading to increased attention on vulnerability assessment in conjunction with MCDM approaches. Risk and vulnerability assessment studies for flood response are widely applied due to increased interest in the need for multi-criteria assessments that take into account all social, economic, and environmental situations complexly associated with floods [14,15,16,17]. Additionally, Meyer et al. [18] and Scheuer et al. [19] proposed a broad sense of spatial vulnerability analysis technique, including the risk of flooding, that is, the probabilistic possibility of flooding, and Kienberger et al. [20] proposed an economic and social vulnerability model based on the possibility of occurrence of risks and the spatial distribution of exposed factors. Among the various MCDM approaches, the TOPSIS method proposed by Hwang and Yoon [21] stands out as a representative approach that assigns evaluation ratings using a distance scale. Hajkowicz and Collins [22] evaluated several decision-making strategies applied in water resources research and found that TOPSIS was the most generally utilized. Moreover, numerous authors have employed TOPSIS in their studies to evaluate flood risk and vulnerability [23,24].
Although the MCDM approach is appropriate for decision-making in vulnerability assessment, its implementation encounters challenges due to the varying patterns of inherent uncertainty in the MCDM process. The vulnerability assessment process using MCDM methods encountered the following obstacles. First, the objective selection of appropriate vulnerability evaluation indicators is challenging. Various elements from the social, economic, and environmental spheres have an impact on vulnerability. However, certain indicators have the same meaning and are highly correlated, and thus the right determination of indicators is very critical in the vulnerability assessment. Second, the data from national statistics and simulation results come in a variety of dimensions and spatial and temporal resolutions. Therefore, information from data sets is regularly and widely employed in most studies after normalization [25]. Third, as is customary, the weighting values for the assessment indicators might be established subjectively. In most conflicting dilemmas, however, the weighting values are heavily reliant on the preferences and perceptions of the decision-makers. As a result, the vulnerability assessment should account for a variety of uncertainty.
Various efforts have been made to address the inherent uncertainty within the MCDM approach. Yoo and Kim [26] proposed that the Delphi survey is an essential tool for the objective application of the indicators to represent the uncertainty in the selection of these indicators. Furthermore, many experts have applied the fuzzy concept [27] in numerous studies to address the uncertainty related to data reliability and weight determination. The fuzzy set theory has been proven to be a valuable tool for describing situations with imprecise or ambiguous data. Fuzzy sets deal with such problems by assigning a degree to which an object belongs to a set. Consequently, MCDM methods were combined with fuzzy set theory to address and mitigate various uncertainties in water resources management [28]. Fuzzy-MCDM methods have been popularly used for reducing the uncertainty of parametric approaches inherent in the derivation process of weights and crisp input data in some fields such as water resources management [29], groundwater management [30], and flood risk [31]. Nonetheless, there is considerable uncertainty and subjectivity in the theory of fuzzy sets. Because it only communicates the degree of belonging to a set in the process of identifying it as a fuzzy set, fuzzy set theory is vulnerable to uncertainty and subjectivity. As a result, grey theory, which may express uncertainty using partially recognized information, has been applied in different sectors in recent years in conjunction with MCDM methodologies. The fuzzy set theory [32] has been proven to be a valuable tool for describing situations with imprecise or ambiguous data.
In recent years, the grey theory, which can reflect uncertainty using partially recognized information, has been used in various fields in combination with MCDM techniques. Zhu and Hipel [33] addressed many stages of grey target decision-making difficulties by combining interval grey numbers. Zavadskas et al. [34] blended grey numbers with the multi-attribute decision making (MADM) model successfully. Following that, various researchers frequently used this MADM model to address supplier selection difficulties [35]. These decision-making documents showed similar results to ones from fuzzy sets, but uncertainty was removed by calculating more comprehensive numerical values and objectifying the results by using grey theory [36,37,38].
Rankings of vulnerability scores can be translated into prioritizing the candidate regions for climate change adaptation plans to achieve certain objectives. Most vulnerability scores to climate change are aggregated by the weighted averages of measures in important indicators. There have been some studies utilizing several MCDM methods to quantify vulnerability [39,40,41,42].
However, because no studies have been conducted to measure flood vulnerability and incorporate uncertainty using grey theory, this study used fuzzy and grey multi-criteria evaluation methods to evaluate city flood vulnerability (CFV) under various climate change scenarios while considering various uncertainties. In particular, we analyzed the effect of reducing uncertainty by comparing the grey-MCDM technique with the fuzzy-MCDM technique, which is known to have a clear effect on reducing uncertainty, and furthermore, the use of the grey-MCDM technique in terms of CFV can reduce the uncertainty of data and provide more effective ranking, so we proposed it as a new technique in this study.
In order to evaluate flood vulnerability, it is necessary to consider not only evaluation indicators from the existing economic perspective, but also indicators that reflect social, cultural, and environmental aspects [43,44,45]. However, indirect social and economic factors related to flood risk often tend to be ignored [18,46]. Therefore, this study attempted to reflect these factors in the calculation of CFVs and classified evaluation factors from social, economic, and environmental perspectives to recognize vulnerabilities in evaluation areas and facilitate the application of response policies. The CFV indicators were chosen from the social, economic, and environmental sectors based on the driving force-pressure-state-impact-response (DPSIR) [47] framework. TOPSIS was adopted because it is compatible with both fuzzy and grey set theories [37,38]. The entropy and Delphi survey methodologies were used to determine objective and subjective weighting values, respectively. This paper is structured as follows: the first section is an introduction, and the second is materials and methods to explain background knowledge and methodology. Third, the results of this paper, and lastly, the conclusions are presented, in that order.

2. Materials and Methods

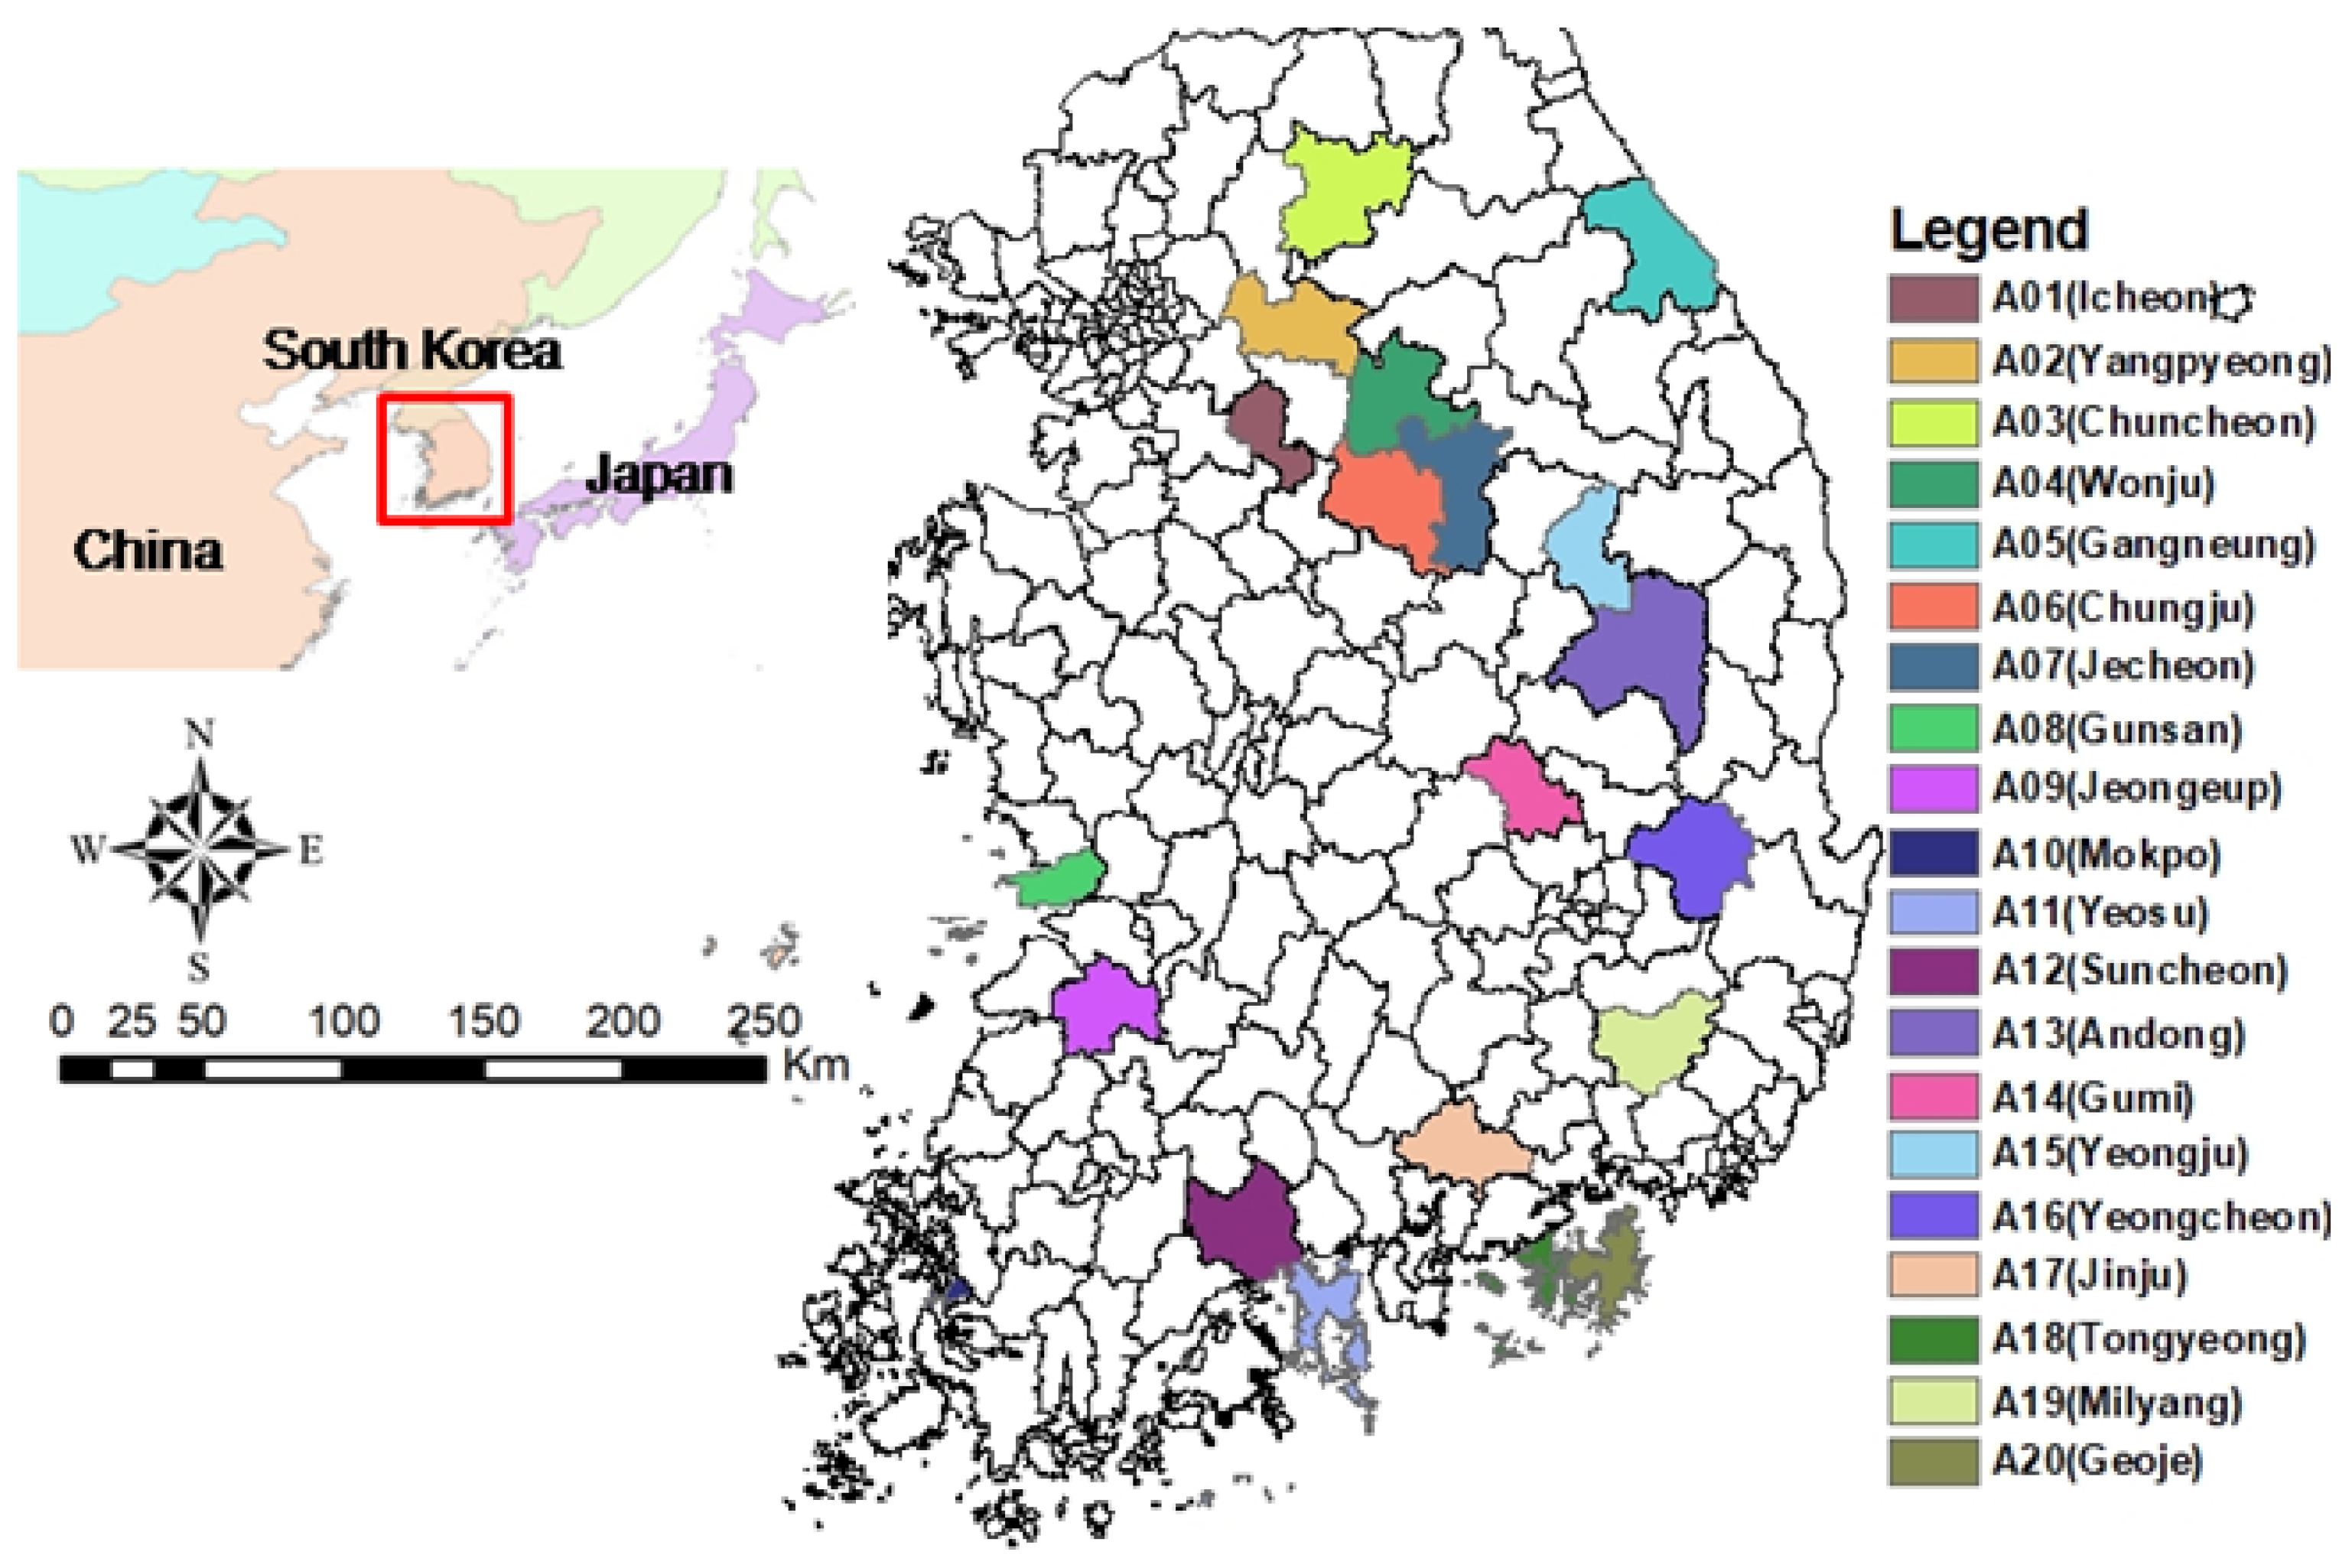
2.1. Description of the Study Area
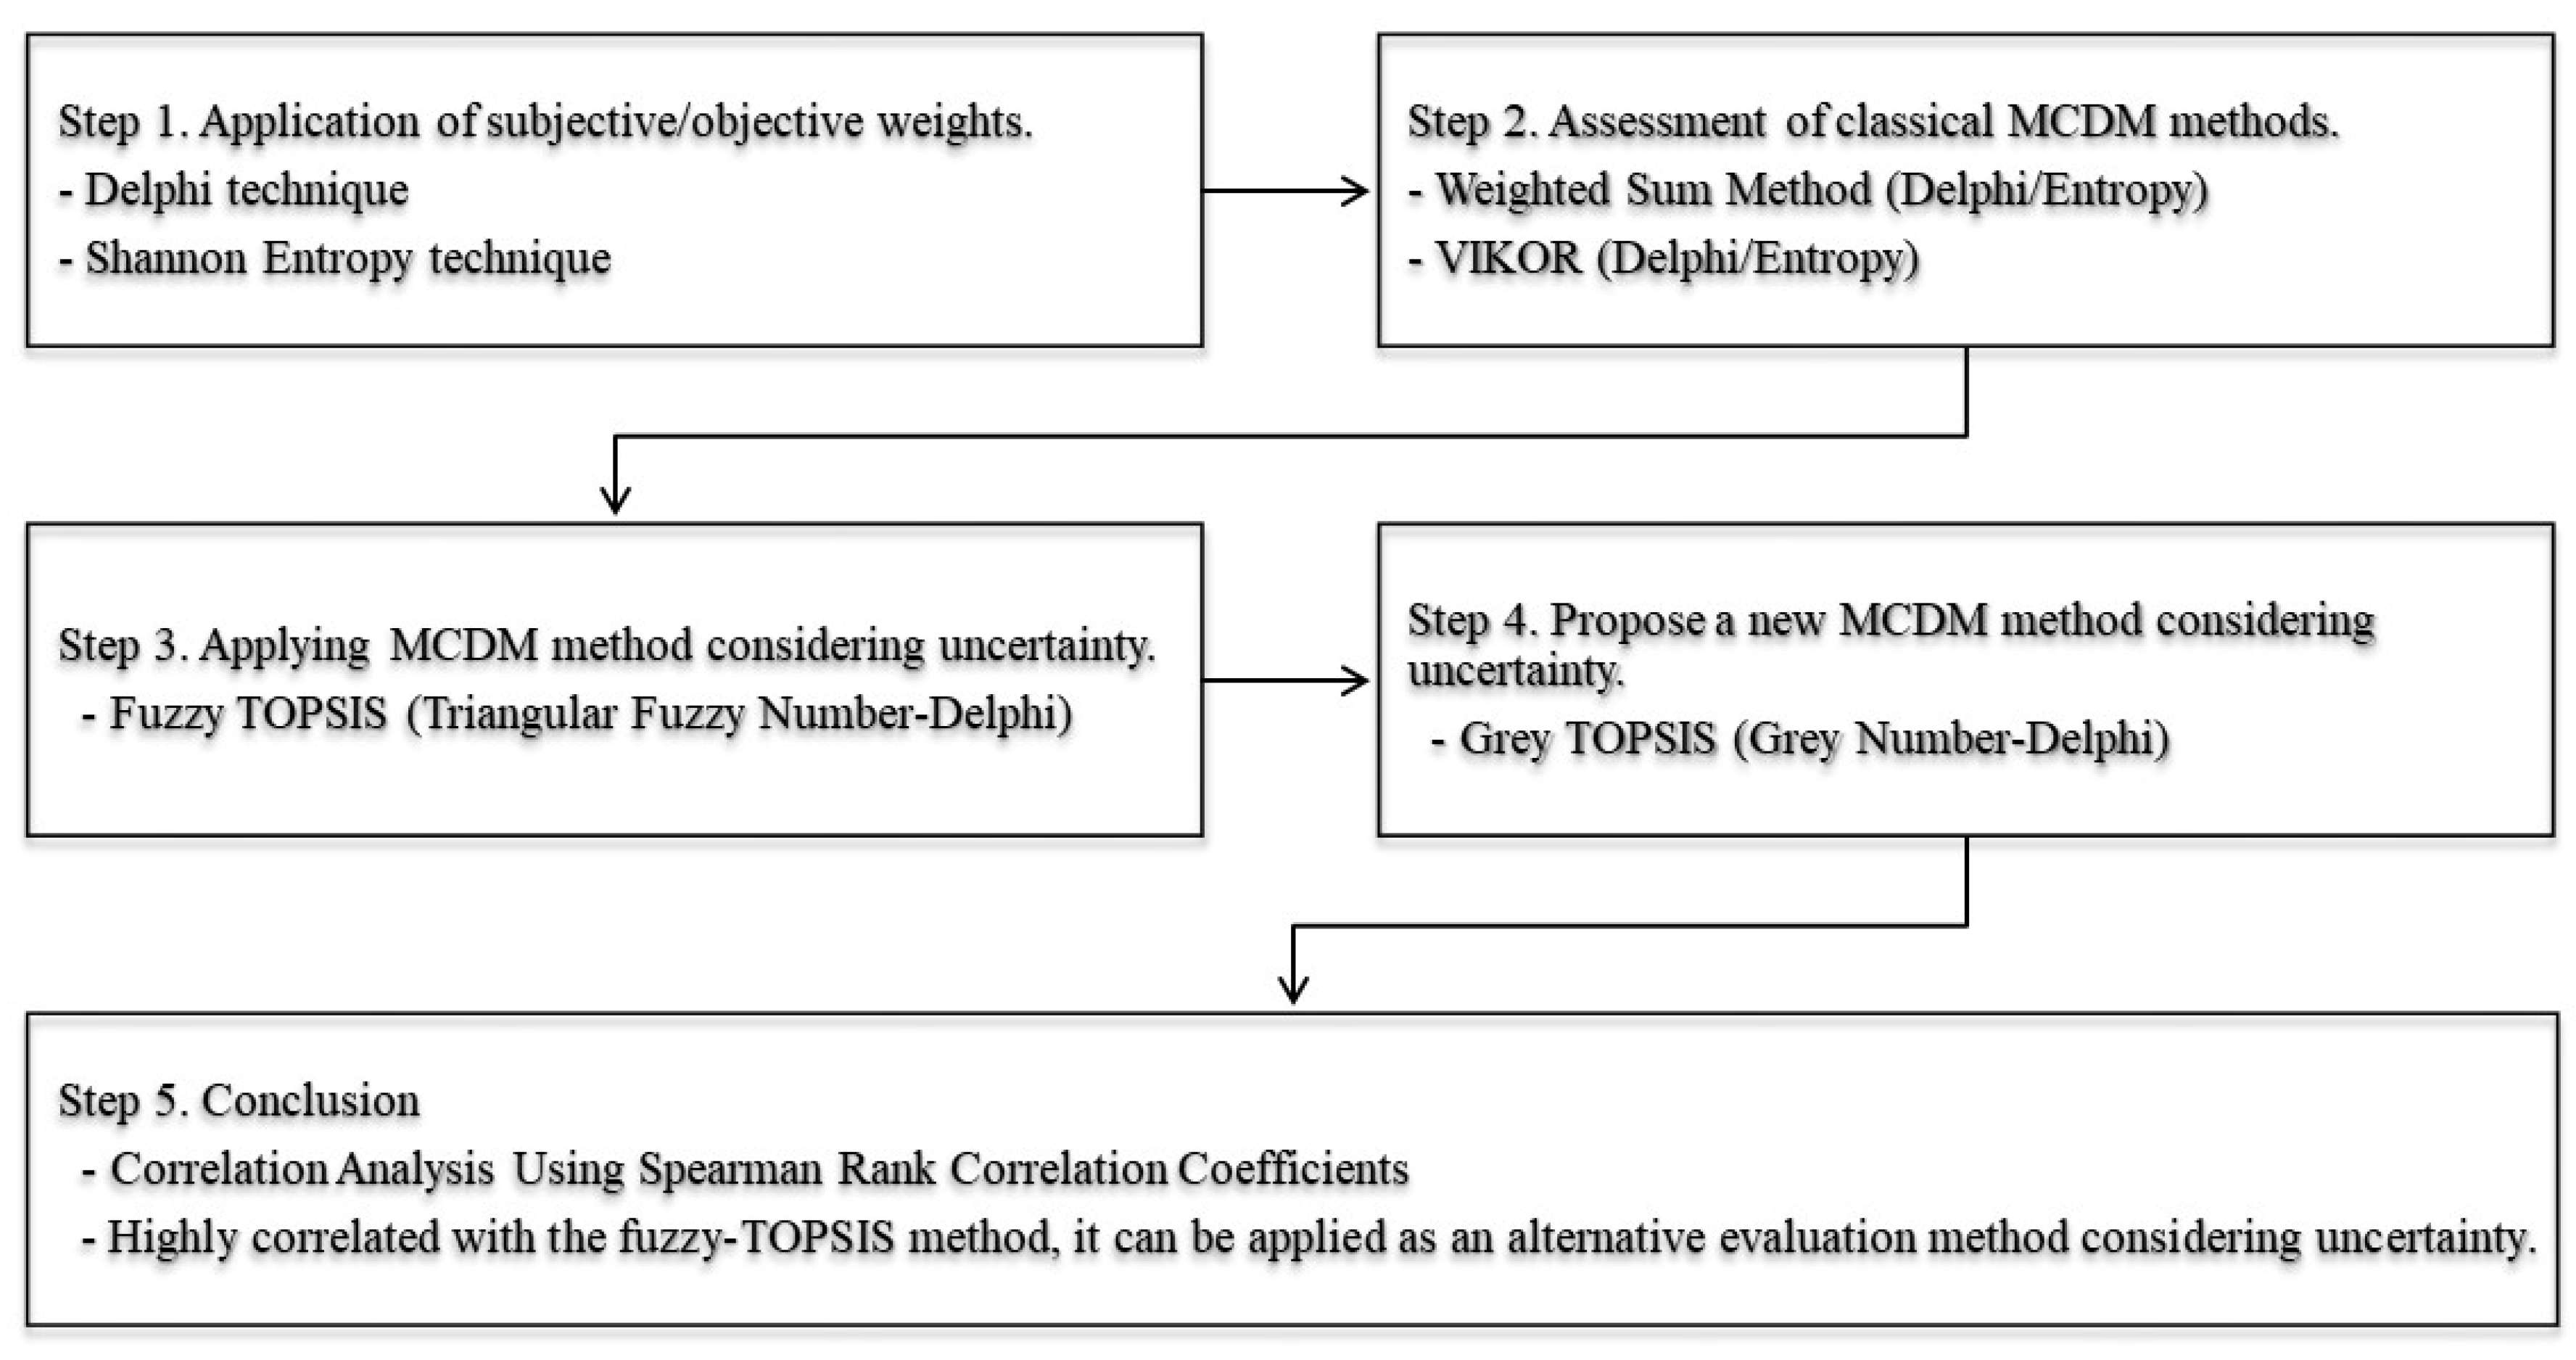
This study selected urban areas characterized by industrialization and urbanization with a population of 100,000 to 500,000, excluding cities with populations exceeding 500,000. Because the extremely large values from bigger cities can significantly affect the vulnerability in medium-size cities during the normalization process, the homogeneity of target areas in size should be maintained. Additionally, this study closely examined regions that encompass both established urban and developed areas, where significant socio-economic differences exist and where there may be a workforce unaffected by specific circumstances. As shown in Table 1 and Figure 1, 20 medium-sized cities, including Icheon and Yangpyeong, were selected as study locations. Each of the 20 cities is assigned a label starting with the letter ‘A’.

2.2. Procedure

Flood vulnerability due to climate change in South Korea was estimated using several MCDM approaches combined with fuzzy- and grey-set theory, and cities were ranked using ten General Circulation Models (GCM) and two shared socioeconomic pathway (SSP) scenarios. This study consists of five steps. In Step 1, relevant flood vulnerability indicators were selected considering the social, economic, and environmental factors that affect flood vulnerabilities in accordance with the DPSIR framework. In Step 2, the values of flood vulnerability indicators were normalized using the re-scaling method. In Step 3, subjective and objective weighting values were determined, respectively using the entropy and Delphi methods and grey numbers. In Step 4, a ranking was derived using MCDM approaches for flood vulnerability in 20 medium-sized cities in South Korea. In Step 5, all rankings were compared using the Spearman rank correlation coefficients.

2.3. General Circulation Model (GCM)

Most GCMs contain physical processes in the atmosphere, oceans, glaciers, and the surface, and so are useful when analyzing the topics of climate change and estimating future climate due to increasing concentrations of greenhouse gases. GCMs have been developed based on their own physical climate system processes and mathematical expressions, thus providing a variety of climate projections [48]. This study selected ten coupled model intercomparison project 6 (CMIP6) GCMs under two SSP scenarios for deriving monthly precipitation in a future period (2021–2100) to assess flood vulnerability. The information of the ten CMIP6 GCMs selected in this study is described in Table 2.
CMIP6 GCMs were recently developed by more than 50 organizations around the world to prepare the Intergovernmental Panel on Climate Change (IPCC) 6th Assessment Report [49,50]. The IPCC has presented a new SSP scenario. The SSP scenario considers future social and environmental changes based on the radiative forcing of the Representative Concentration Pathway (RCP) scenario, a greenhouse gas emission scenario, and is divided into five scenarios (SSP1, SSP2, SSP3, SSP4, and SSP5) in accordance with mitigation and adaptation to climate change [51].
In this study, GCM data with different spatial resolutions were downscaled to a 0.25° × 0.25° grid using linear interpolation. The inverse distance weighting (IDW) method was used as a spatial interpolation method to simulate point climate data for the study area using the downscaled GCM grid climate data. Even after spatial interpolation, it was observed that the inherent uncertainties in the GCMs and the coarse grid-format climate data hindered the accurate reproduction of simulated values in matching the observed ones. Accordingly, bias correction was performed using the most commonly used method, quantile mapping (QM). In this study, the smoothing splines method, which is a non-parametric transformation method among QM methods, was used for the historical precipitation data.

2.4. DPSIR Framework

The DPSIR framework was developed by the European Environment Agency [47] in 1999 by improving the PSR (Pressure-State-Response) framework presented by the OECD (Organization of Economic Cooperation and Development) in 1993 and the DSR (Driver-State-Response) devised by the UN in 1996.
The existing PSR framework has the disadvantage of failing to account for complex ecological processes and causal relationships within the human environment. Not only does it have the disadvantage of not explaining any impact from changes in state, but it also does not reflect situations in which the response affects the system [52]. The DPSIR framework compensated for the shortcomings of the PSR framework by adding ‘driving force’ and ‘impact’ factors to the existing PSR framework. For this reason, the DPSIR framework has been widely adopted worldwide [53,54,55,56,57,58,59,60]. In this study, indicators for flood vulnerability evaluation were selected using the DPSIR framework, and flood vulnerability evaluation was conducted in South Korea considering the mutual effects among the indicators. In addition, the CFV index (CFVI) was calculated using the indicators according to the DPSIR framework based on social, economic, and environmental factors. Specifically, for environmental factors, monthly precipitation data from each CMIP6 GCM were used for evaluating flood vulnerability. The index was calculated by applying each Delphi weight, entropy weight, and grey number to the normalized indicators as shown in Equations (1) and (2), and the final CFVI was calculated by applying each element weight to the calculated index.
S o = D s o × w d + P s o × w p + S s o × w s + I s o × w i + R s o × w r E c = D e c × w d + P e c × w p + S e c × w s + I e c × w i + ( R e c × w r ) E n = D e n × w d + P e n × w p + S e n × w s + I e n × w i + ( R e n × w r )
C F V I = S o × w s o + E c × w e c + E n × w e n
where S o , E c , and E n   mean the normalized values for social, economic, and environmental factors, respectively, and D , P , S , I , and R represent the normalized values for driving force, pressure, state, impact, and response, respectively. Correspondingly, w s o , w e c , and w e n are the weights for social, economic, and environmental factors, and w d , w p , w s , w i , and w r are the weights for driving force, pressure, state, impact, and response, respectively.

2.5. Multi-Criteria Decision-Making (MCDM) Method

This study used three MCDM methods, fuzzy-TOPSIS, grey-TOPSIS, and VIKOR, to consider various uncertainties inherent in the use of average values for decision making processes. Figure 2 shows the application and evaluation procedure of the MCDM methods.

2.5.1. Fuzzy TOPSIS

Hwang and Yoon [21] have academically defined the concept of a TOPSIS solution as the alternative that is simultaneously the farthest from the negative ideal solution (NIS) and the closest to the positive ideal solution (PIS).
The fuzzy-TOPSIS method was proposed by Chen [61] to solve the uncertainty in MCDM problems. Chen [61] clearly defined the Euclidean distance between two fuzzy numbers considering the triangle fuzzy number (TFN) and expanded the group decision-making situation by supplementing the classical TOPSIS method. A TFN is a fuzzy set in which the elements have uncertain borders, making it challenging to determine whether they belong to a specific subset, with the members being progressively altered. The membership function represents all items in the fuzzy set, and a membership degree of 1 indicates that they belong totally to the fuzzy set, whereas the boundary region has a membership degree between 1 and 0. Fuzzy numbers that express such a membership function can take many different forms. Among these many types of fuzzy numbers, TFN is easy to use because it can be expressed with three dots.
An MCDM problem can be expressed using a fuzzy decision (or performance) matrix D , with x i j indicating the fuzzy performance rating of alternative A i , i = 1 , , m with respect to criterion C j , j = 1 (indicator in this study), and with the fuzzy weight vector W with W j for each criterion C j .
As for the fuzziness in the decision data, linguistic variables are used to assess the weights ( W i j ) of all criteria and the normalized performance ratings ( r i j ) of each alternative A i with respect to each criterion C j . The weighted normalized fuzzy value v i j is initially calculated as follows:
v i j = W j × r i j
Then, the weighted normalized matrix V = v i j m × n is constructed. Next, the fuzzy positive ideal solutions FPISs A + and the negative ideal solutions FNISs A are calculated as follows:
A + = v 1 + ,   v 2 + ,   ,   v n +   &   A = ( v 1 ,   v 2 ,   ,   v n )
where v j + = max v i j i and v j = min v i j i . The distance between two TFNs m ~ = ( m 1 ,   m 2 ,   m 3 ) and n ~ = ( n 1 ,   n 2 ,   n 3 ) can be calculated by means of Equation (5). Here, the FPISs (or FNISs) for each indicator is the maximum (or minimum) of weighted normalized values regardless of benefit and cost criteria, as they are considered in the normalization process. Then, the Euclidean distances of each alternative from FPISs and FNISs and the relative closeness R C i of each alternative with respect to FPISs are calculated as follows:
d m ~ ,   n ~ = 1 3 m 1 n 1 2 + m 2 n 2 2 + m 3 n 3 2
d i + = j = 1 n ( v i j v j + ) 2 &   d i = j = 1 n ( v i j v j ) 2
R C i = d i d i + + d i
where R C i ranges from 0 to 1. The larger the value, the better the performance of the alternative.

2.5.2. Grey TOPSIS

Grey systems theory [62,63,64] provides a practical solution for handling uncertainty when dealing with highly imprecise data. Grey systems provide a solution for problems including incomplete and poor information. That is, grey refers to information that is partially known, and a grey number is a number whose exact value is unknown, but a range within which the value lies is known [36].
The grey-TOPSIS is used to prioritize all alternatives with the input data expressed as grey numbers and to provide a performance score for the alternatives. In addition, this study provides a decision support framework to the flood managers in selecting areas to vulnerable flooding. Therefore, in this paper, we propose a grey-TOPSIS method using grey theory to reduce the uncertainty inherent in MCDM process, and we evaluate city flood vulnerability for medium-sized cities.
The procedure of applying the grey-TOPSIS method consists of the following steps:
(a)
Determining the decision criteria, the set of most important attributes, and describing the alternatives.
(b)
Determining the decision matrix D ; x i j denotes the grey evaluations of the i t h alternative with respect to the j t h attribute by the decision-maker.
(c)
Constructing the normalized grey decision matrices:
r i j = x i j m a x i ( r ¯ i j ) = ( x _ i j m a x i x ¯ i j ; x ¯ i j m a x i x ¯ i j   )
r i j = 1 x i j m a x i ( x ¯ i j ) = ( 1 x i j m a x i x ¯ i j ; 1 x _ i j m a x i x ¯ i j   )
where x _ i j and x ¯ i j represent the lower and higher values of the interval.
(d)
Determining the positive and negative ideal alternatives. The positive ideal alternative A + , and the negative ideal alternative A are shown in Equation (10).
A + = ( v 1 + ,   v 2 + ,   ,   v n + )     & A = ( v 1 ,   v 2 ,   ,   v n )
where v j + = max v i j i and v j = min v i j i .
(e)
Calculating the separation measure of the positive and negative ideal alternatives, d i + and d i using Equations (11) and (12). In the Equations, w i represents the weight of each criterion.
d i + = 1 2 j = 1 m w i r j + r _ i j 2 + r j + r ¯ i j 2
d i = 1 2 j = 1 m w i r j r _ i j 2 + r j r ¯ i j 2
(f)
Calculating the relative closeness, C i + , to the positive ideal alternative using Equation (13).
C i + = d i d i + + d i
where 0 ≤ C i + ≤ 1. The larger the index value is, the better the evaluation of the alternatives will be.

2.5.3. VIKOR

The VIKOR method determines the compromised ranking, solution, and weight stability interval for the preferred stability of the compromised solution obtained with the initially given weight [65]. VIKOR can find a compromise solution and ranking in a set of alternatives when there are conflicting criteria [66].
The compromise ranking algorithm of the VIKOR method has the following steps:
(a)
Determine the best f i and the worst f i values of all criterion function, i = 1, 2, …, n. If the i t h function represents a benefit, then they are as follows:
f i = max f i j j , f i = min f i j j
(b)
Calculate the values S j and R j , j = 1, 2, …, J , with the following relations:
S j = i = 1 n w i f i f i j / f i f i
R j = max i w i f i f i j / ( f i f i )
where w i are the weights of criteria, expressing their relative importance.
(c)
Compute the values Q j values using Equation:
Q j = v ( S j S ) / ( S S ) + ( 1 v ) ( R j R ) / ( R R )
where S = min j S j ,   S = max j S j ,   R = min j R j ,   R = max j R j and v is introduced as the weight of the strategy of ‘‘the majority of criteria” (or ‘‘the maximum group utility”); here, we suppose that v = 0.5.1.
(d)
Rank the alternatives, sorting by the values S , R , and Q in decreasing order. The results are three ranking lists. Normally, we should use the ranking lists of S , R , and Q to propose the compromise solution or set of compromise solutions.

2.6. Normalization

The normalization was performed on all values for indicators because they were incommensurable. This study used the linear normalization method except fuzzy- and grey-TOPSIS as shown in Equations (18) and (19).
r i j = x i j min x i j max x i j min x i j
r i j = max x i j x i j max x i j min x i j
If the value is larger, meaning more positive indicators for flood vulnerability, Equation (19) should be used for normalization. On the contrary, if it is smaller, meaning more negative indicators, the normalization is completed using Equation (19).
In addition, this study coupled the MCDM techniques with the fuzzy theory, so TFN mentioned in Section 2.5.1 according to indicators were also normalized. Chen [61] extended TOPSIS with the TFN concept. Different scales of TFN should be normalized so that they are comparable while maintaining the properties of TFN to apply TFN to TOPSIS. The normalized fuzzy matrix R ~   can be expressed as Equation (20).
R ~ i j = r ~ i j , ( i = 1 ,   2 ,   ,   m   ; j = 1 ,   2 ,   ,   n )
where r ~ is the normalized TFN, i is the number of alternatives, and j is the number of evaluation indicators. In addition, B and C in Equations (21)–(24) represent a set of each respective benefit criterion (the larger the measure, the more preferred) and cost criterion (the smaller the measure, the more preferred).
C j = max c i j i ,     i f   j   B
r ~ i j = a i j C j ,   b i j C j ,   c i j C j , i f j   B
a j = min a i j i , i f j   C
r ~ i j = a j c i j , a j b i j ,   a j a i j ,     i f j   C
In these equations, a i j , b i j , and c i j are correspondingly the minimum, mode, and maximum values of the matrix converted to the TFN format.

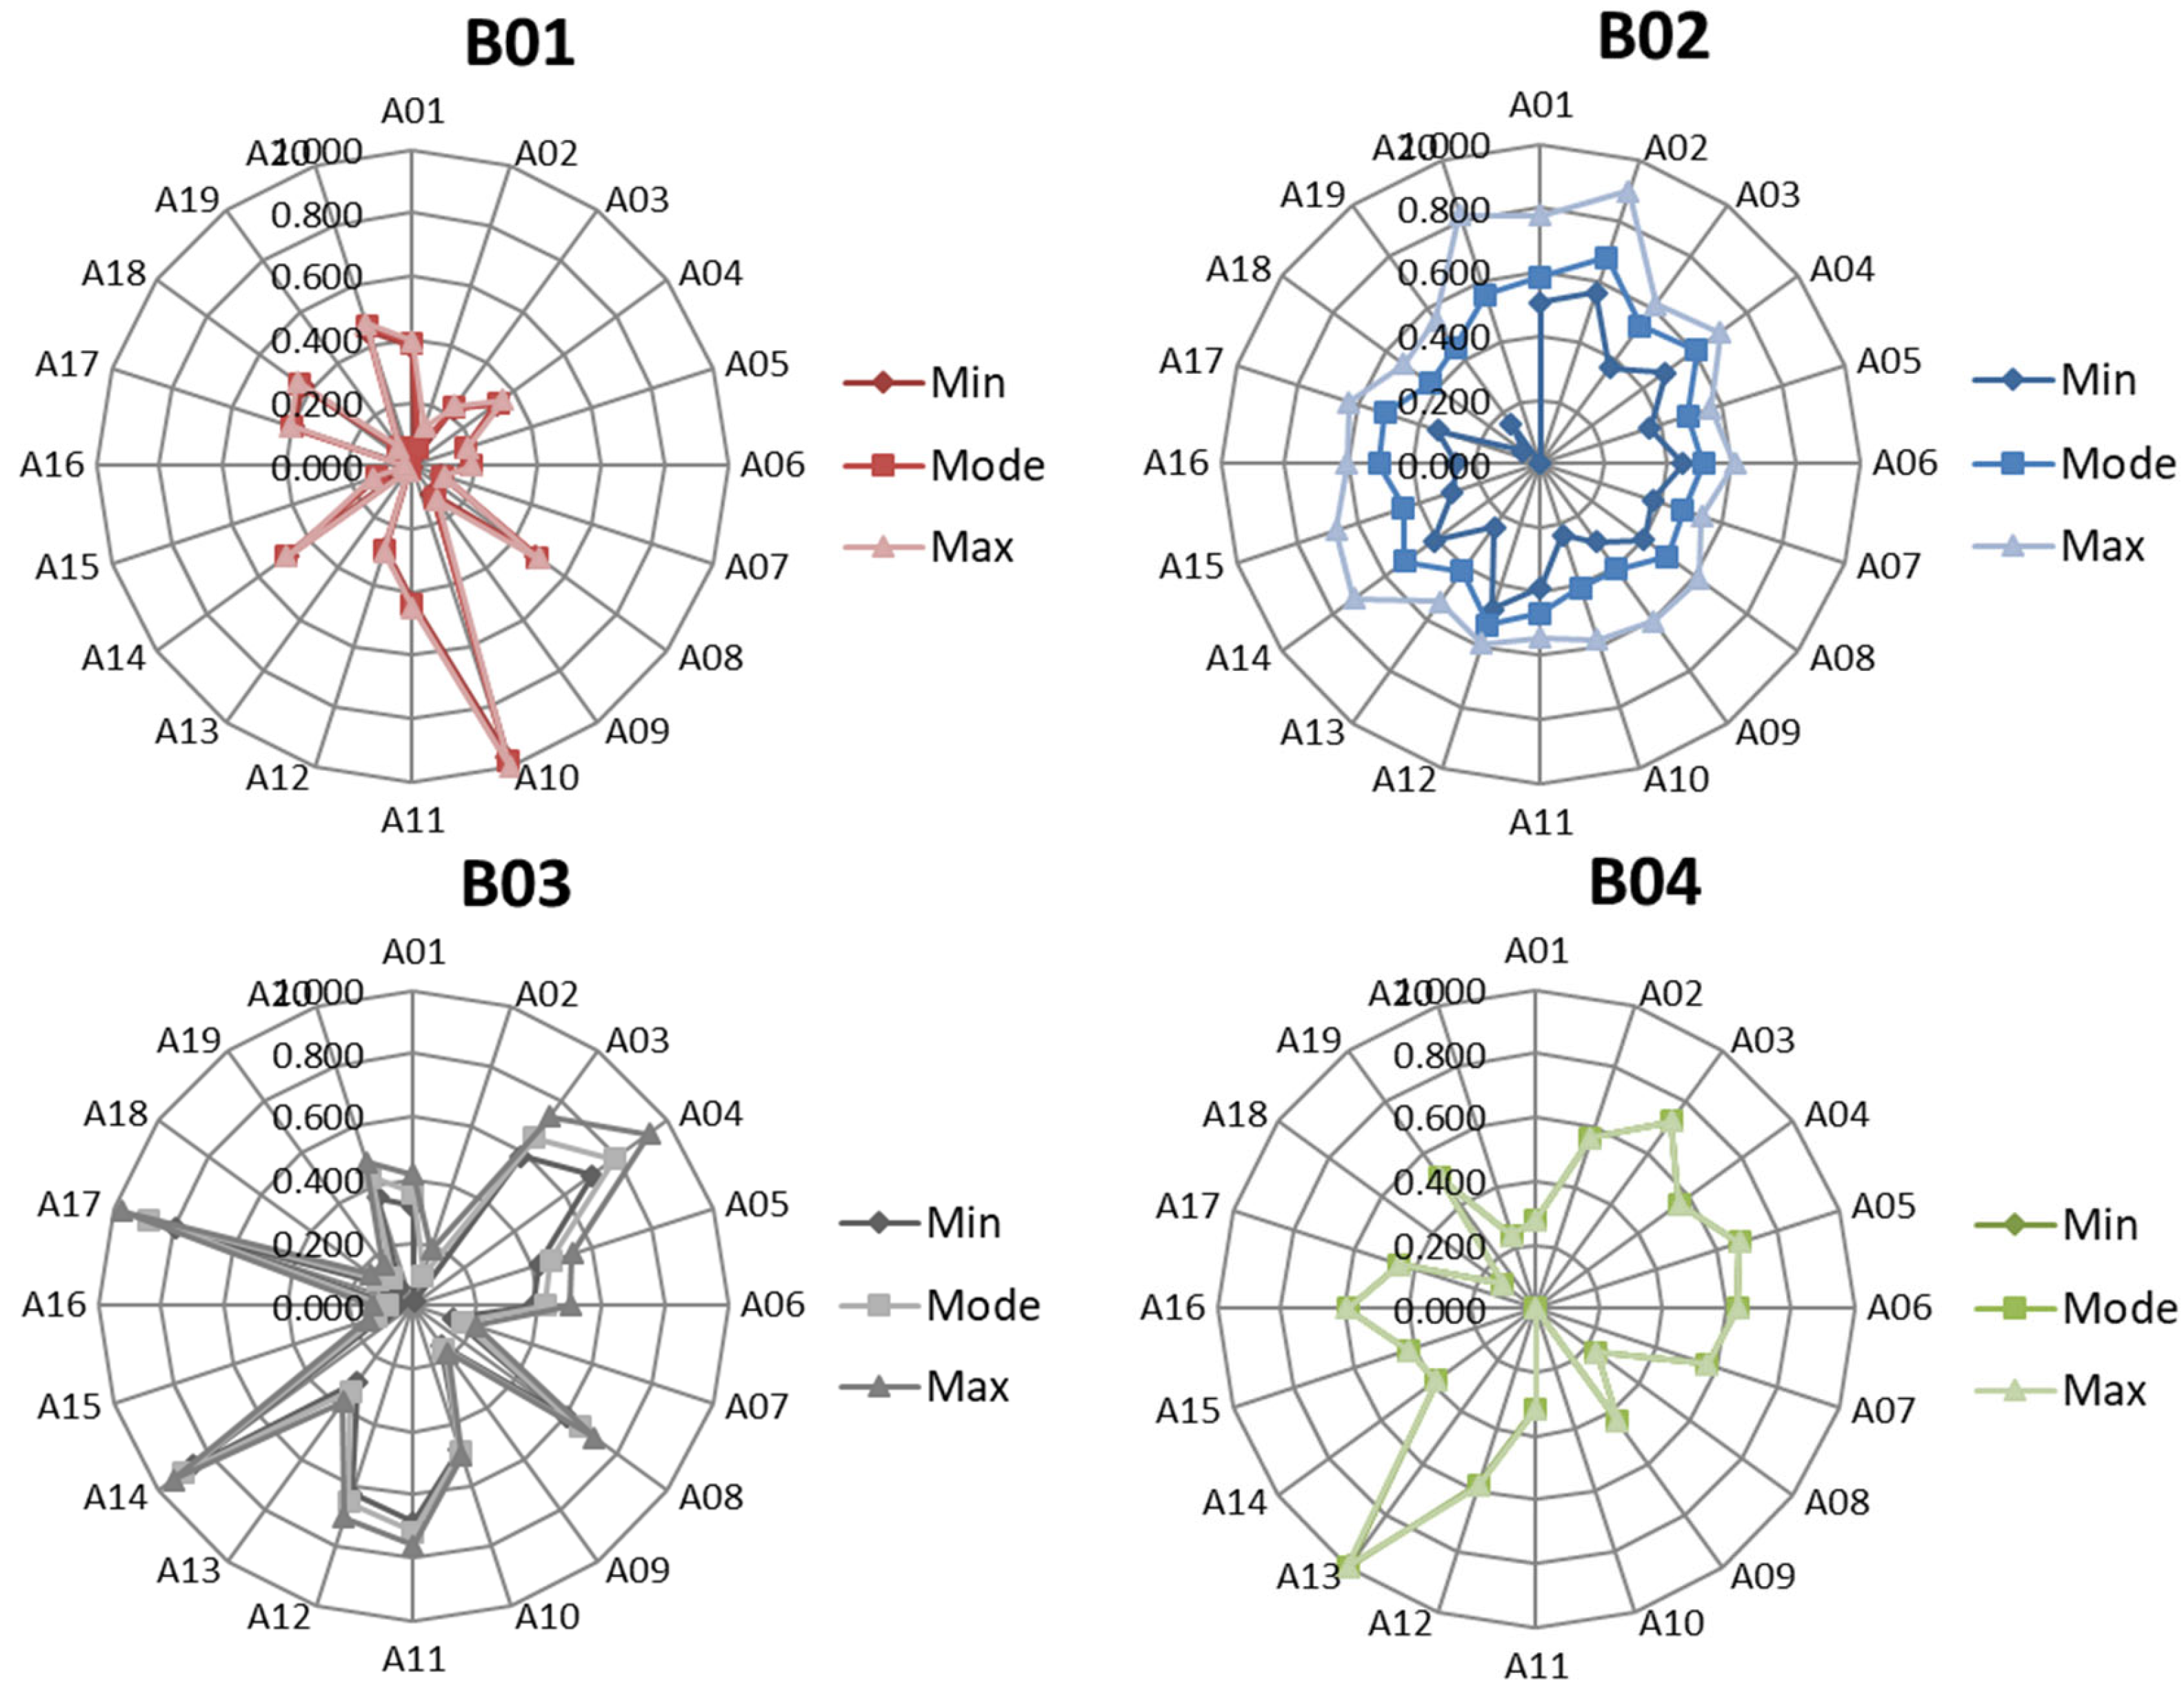
2.7. Uncertainties of Weighting Values

An assessment with a multi-criteria approach creates uncertainties in the expertise, objectivity, and collection of weights of the parties in determining the appropriate appraisers and the importance of each factor [65,67,68]. The weights of these valuation factors are one of the most important and difficult issues in applying MCDA methodologies and pose many uncertainties [69,70]. In other words, uncertainty in evaluation results can be highly dependent on how the weights are determined. Therefore, in this study, flood vulnerability was assessed by applying the method coupled with fuzzy and grey numbers to solve the uncertainty problem caused by the use of weights in the MCDM application.

2.8. Spearman Rank Correlation Coefficient

In this study, the Spearman rank correlation coefficient was calculated to investigate the correlation of uncertainty in the ranking of the MCDM method according to the application of weights and data. Therefore, we was analyzed whether uncertainties such as weights and evaluation techniques could be resolved by comparing the evaluation technique using grey numbers with the fuzzy-based evaluation technique, which is generally known to reduce uncertainty. ρ is used when the data is a scale by order, and it is calculated as Equation (25) as a useful method when the sample size is small [71].
ρ = 1 6 i = 1 n ( R x i R y i ) 2 n ( n 2 1 )
where the rank of the i -th observation of the variable x is denoted by R ( x i ) , and the rank of the i -th observation of the variable y is denoted by R ( y i ) . n is the total number of variables.

3. Results

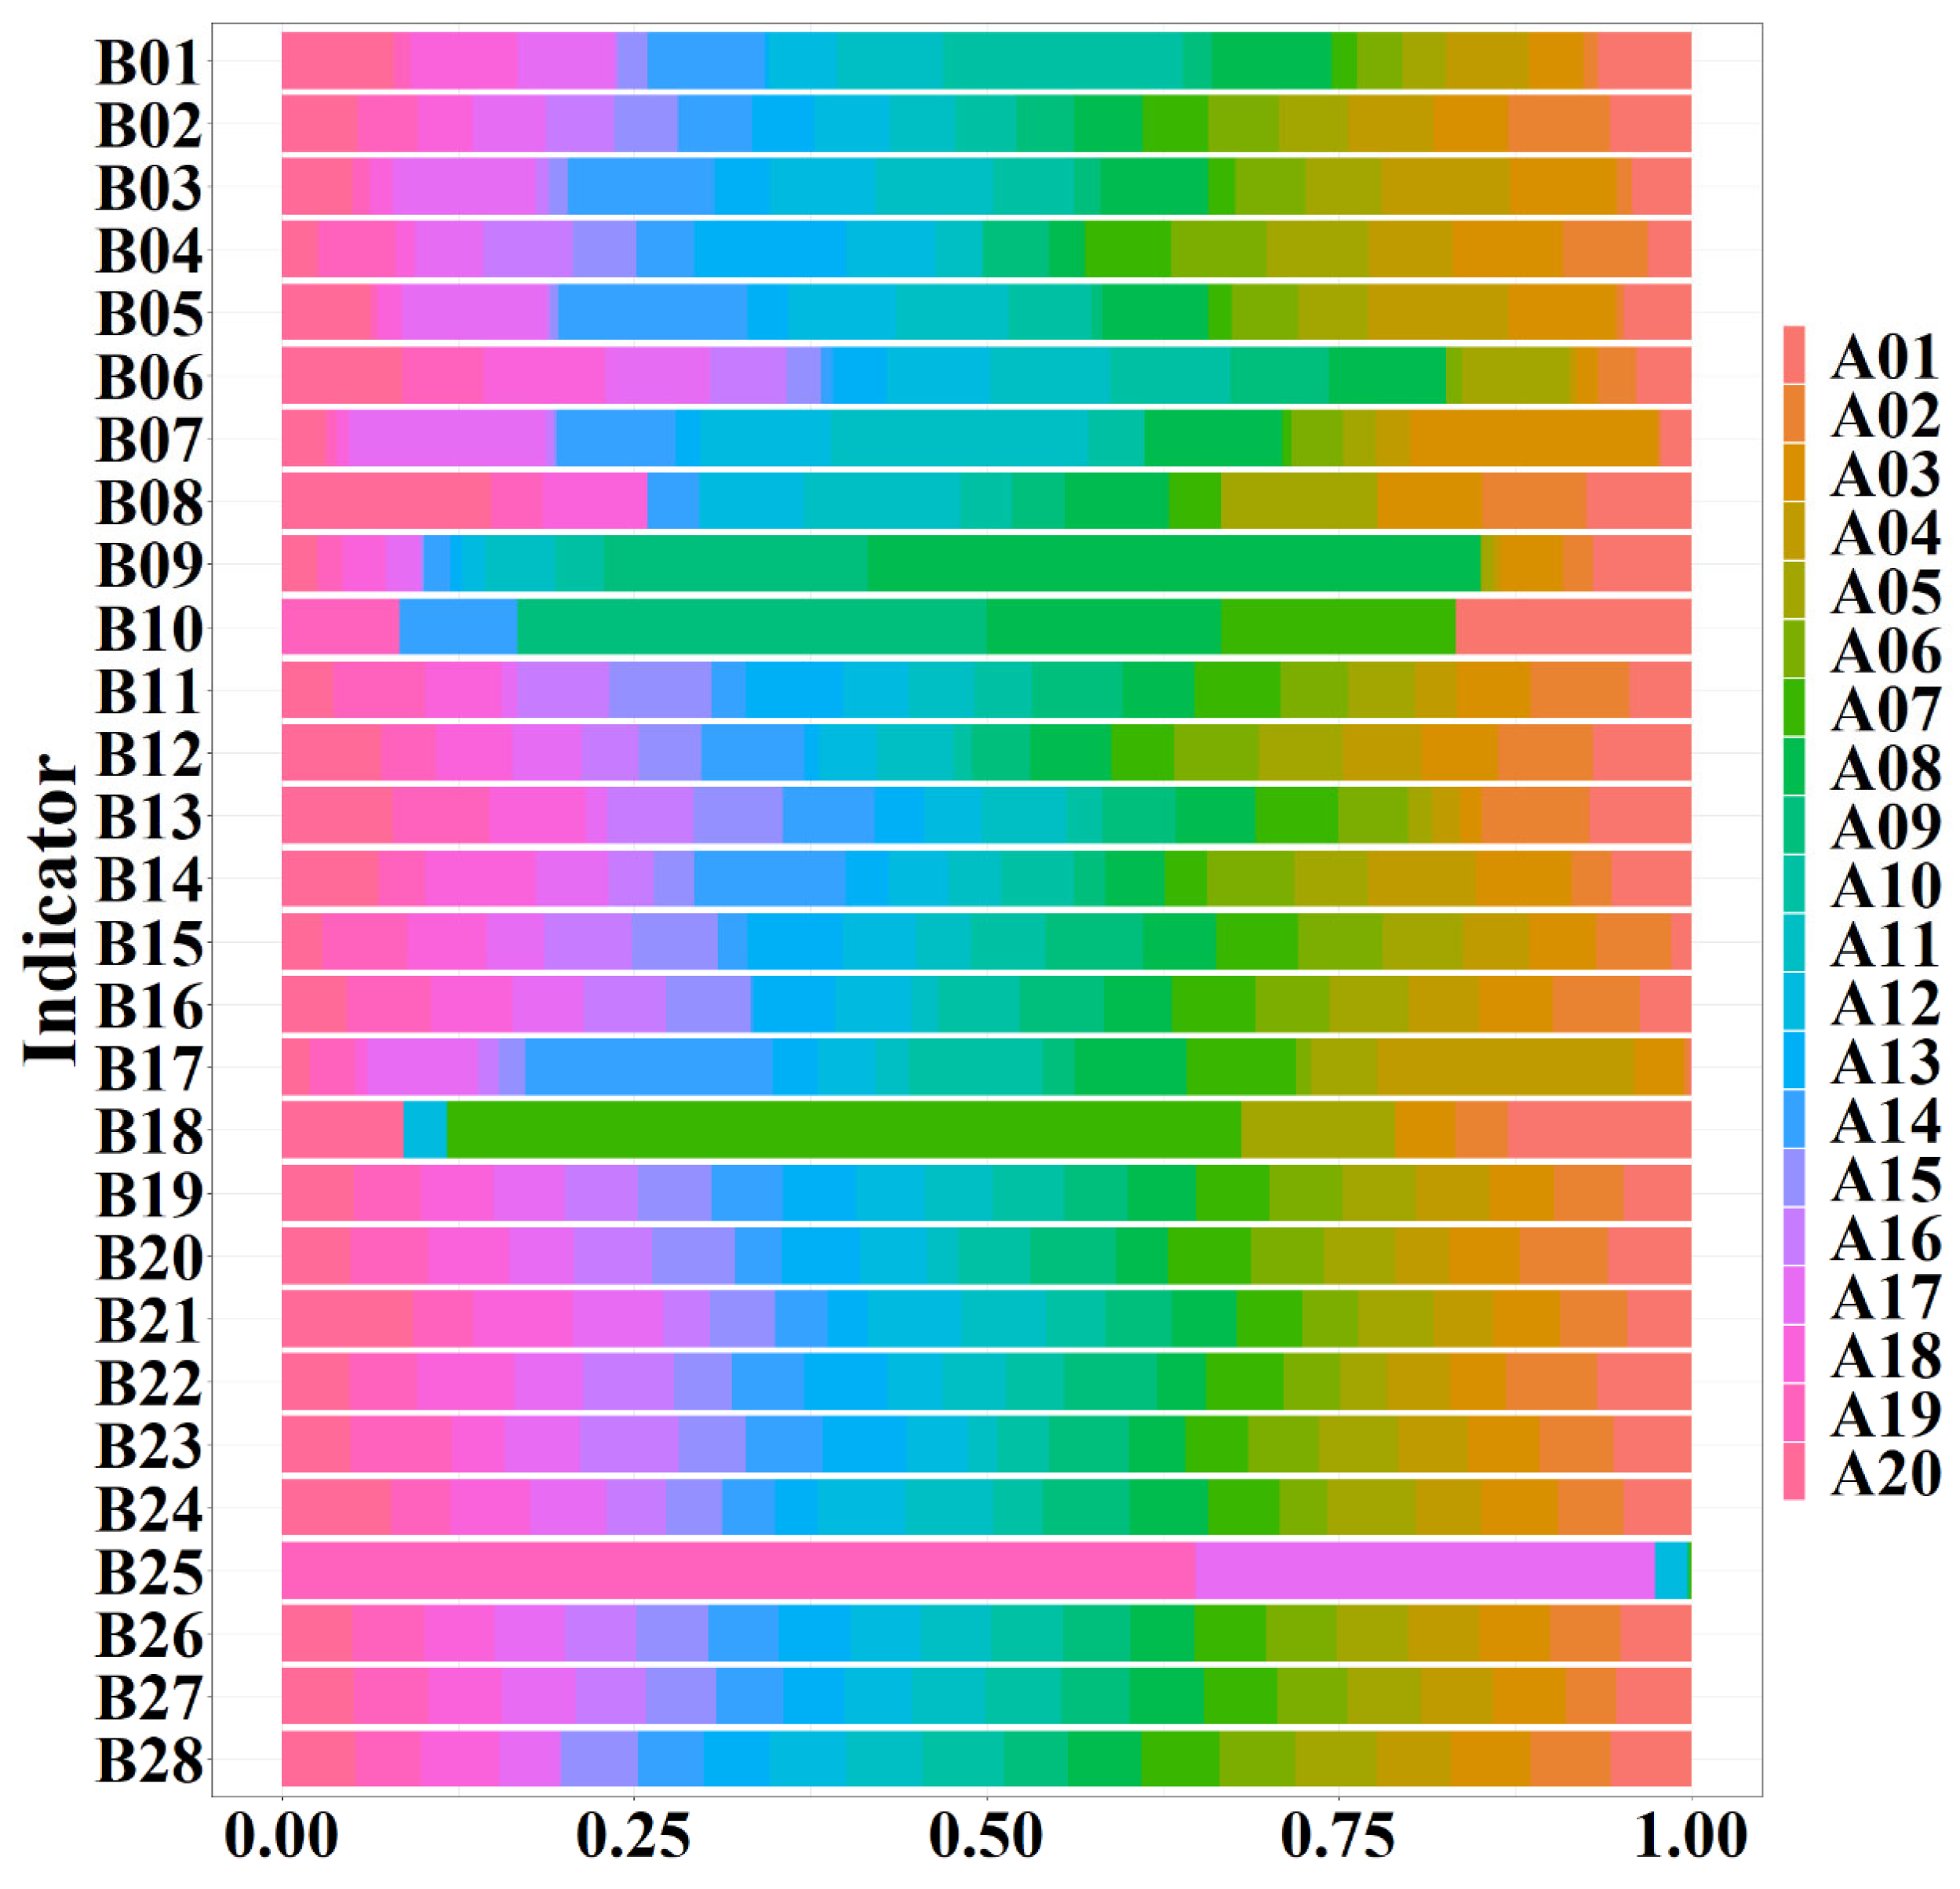
3.1. Selection of Vulnerability Indicators

The selection of indicators that reflect regional characteristics such as flood risk and vulnerability in target areas is necessary to calculate an appropriate index for flood vulnerability. In this regard, it is essential to consider meteorological and geographical requirements along with the environmental impact of human social activities.
This study chose all indicators that determine CFVI while considering social, economic, and environmental issues based on the DPSIR framework. In addition, these indicators were reconfirmed and additionally selected through expert surveys using the Delphi technique and used to estimate the flood vulnerability index. For the social factor, population density, population growth, and number of flood disaster were selected, and unemployment ratio, financial independence rate, and GRDP [72] were added as the economic factor. For the environmental factor, annual maximum precipitation, daily maximum temperature, and daily maximum precipitation were chosen. The data length of all indicators used is 10 years, from 2010 to 2020, and averaged, TFN, max-min value, etc., were applied for each MCDM technique. The structure and the data source for all selected indicators were shown in Table 3. Each indicator has 28 labels beginning with letter B.

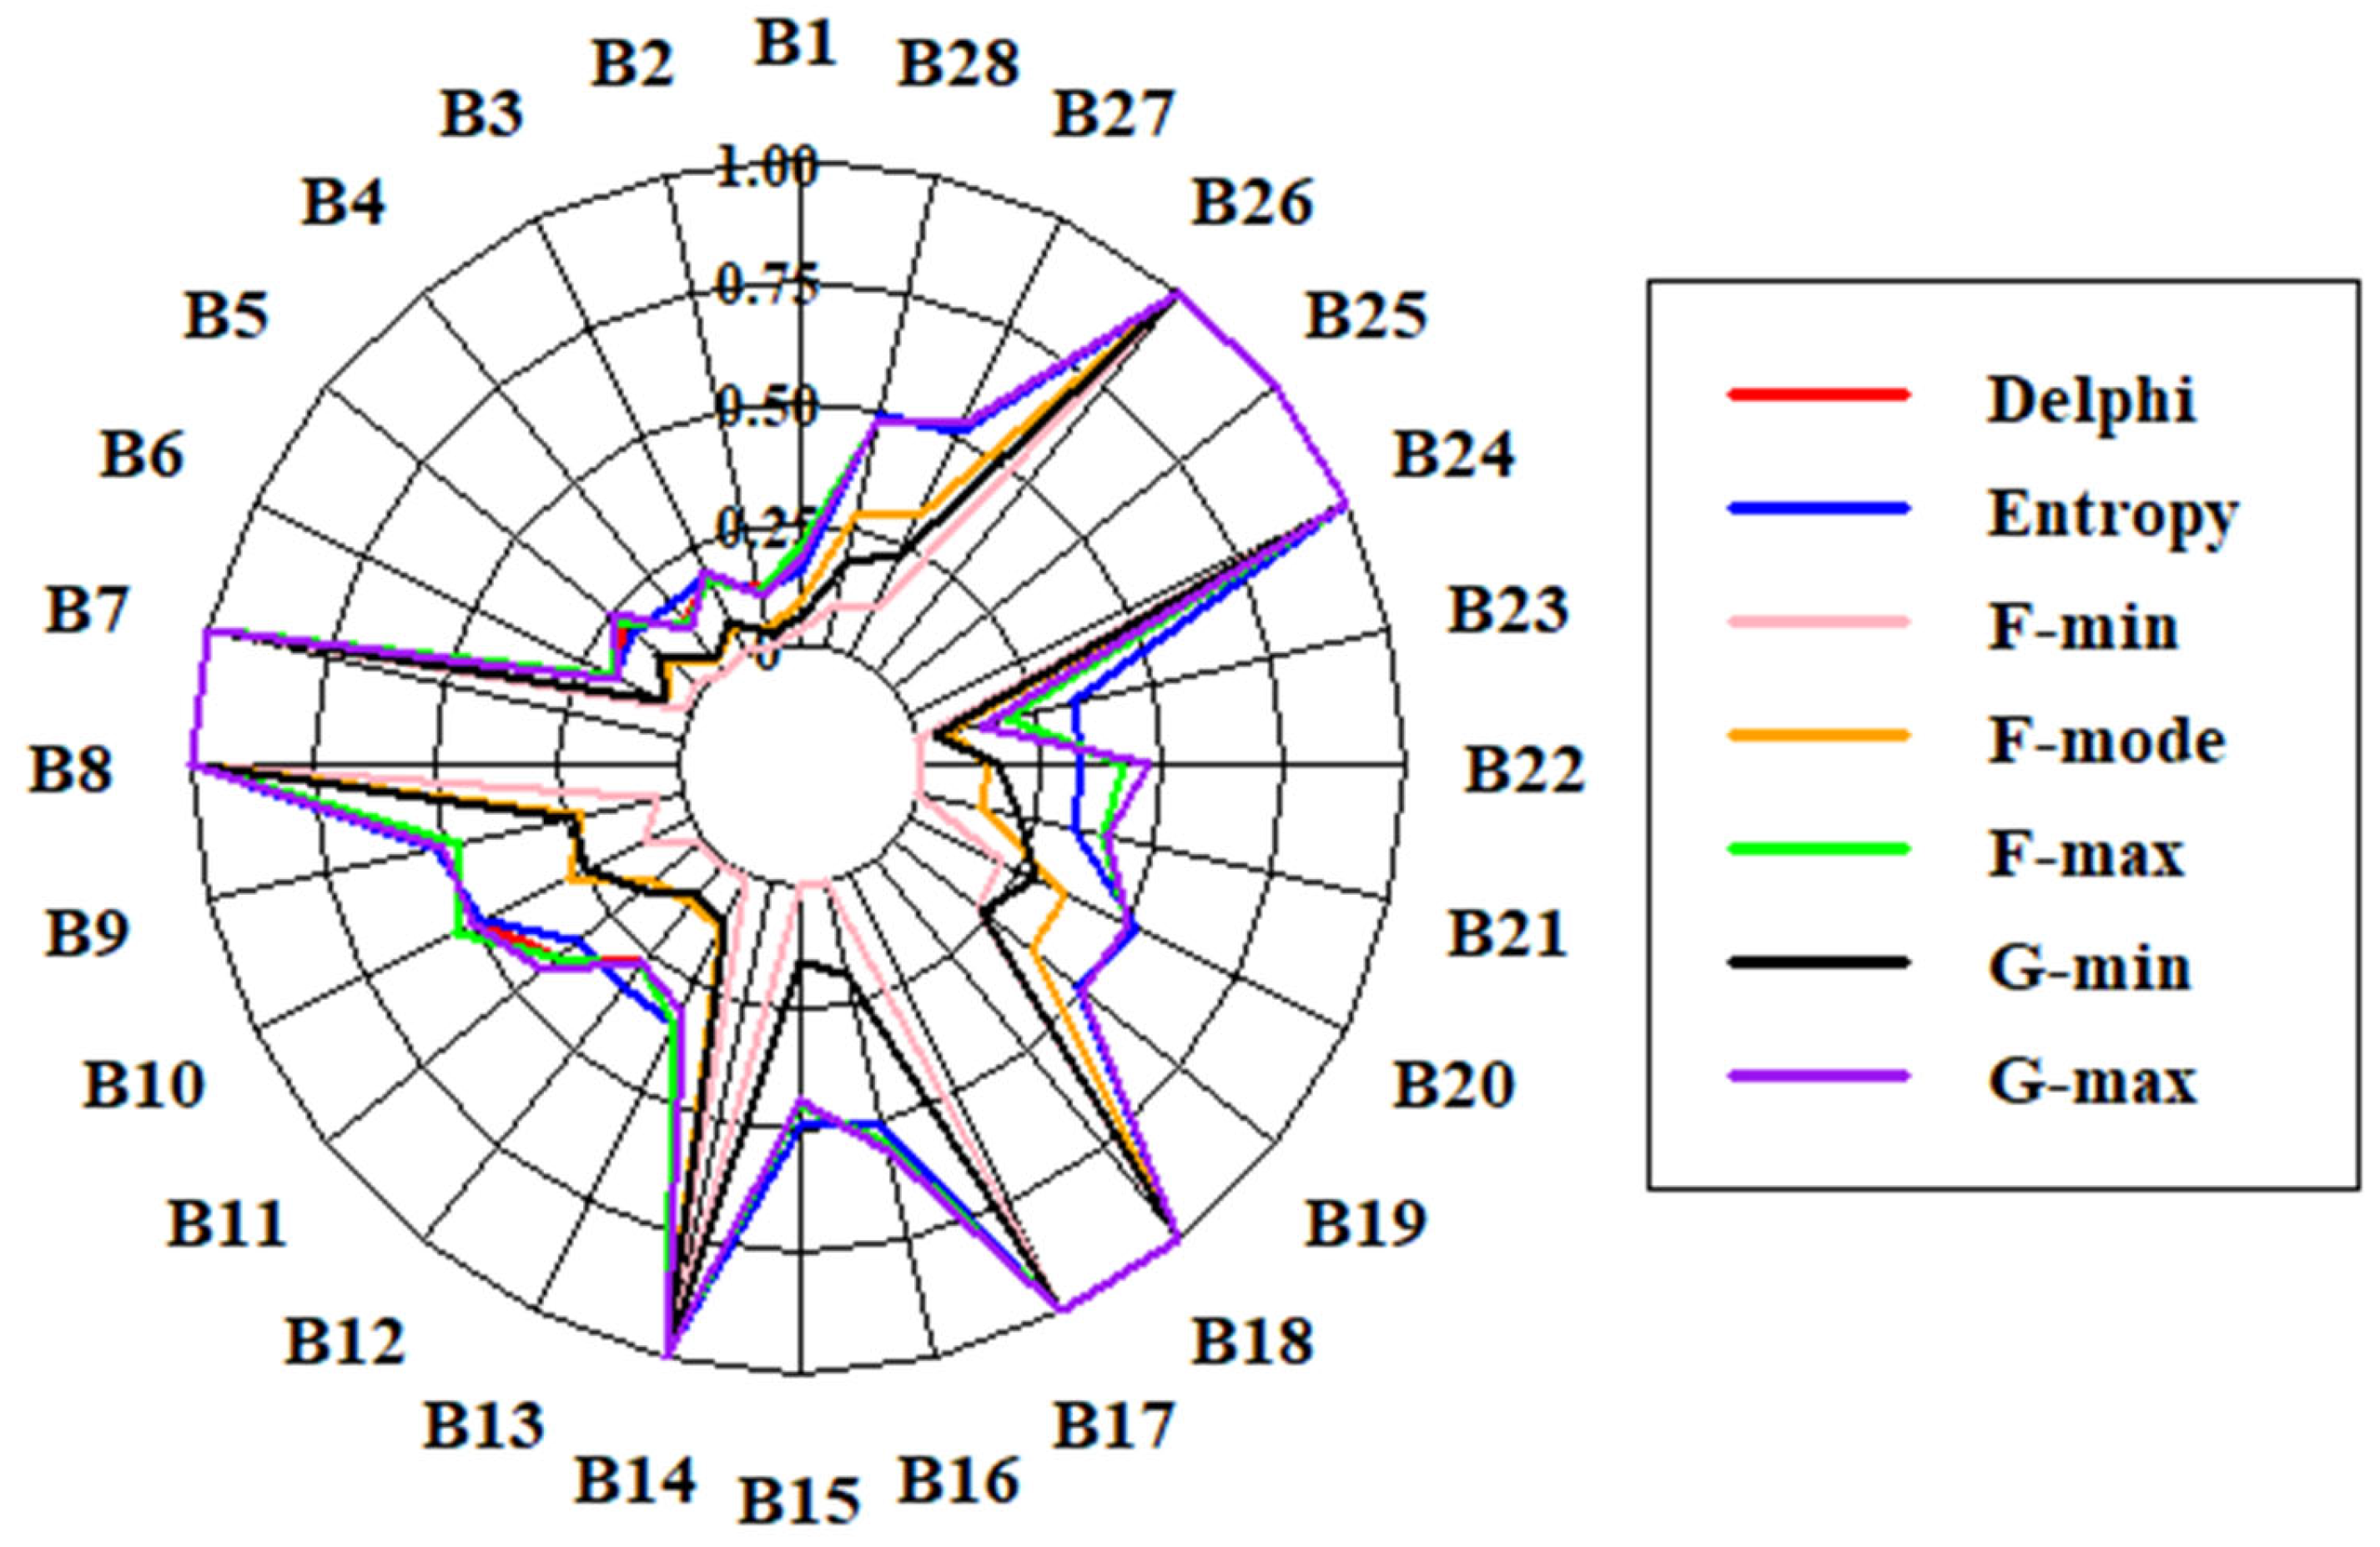
3.2. Normalization of Indicator Data

All indicators selected in this study were normalized due to their incommensurable values as explained in Section 2.6. The raw data were logarithmically transformed using min-max normalization, which was applied individually to each indicator based on their respective distributions. The average values of the normalized indicator data of all cities selected in this study are shown in Figure 3. Furthermore, as shown in Figure 4, the data of all indicators were converted into the form of TFN (Min, Mode, and Max) to quantify the vulnerability of 20 medium-sized cities. For instance, a histogram was generated for the values of 20 medium sized cities for each indicator, and from these histograms, the minimum, mode, and the maximum values were calculated and used for defining the TFN. The normalized values for all cities are shown in Figure 4 and Figure S1 (Supplementary), respectively.

3.3. Determination of Weights

This study applied the Delphi method, a survey method reliant on subjective judgment, and the entropy method, which can objectively calculate weights based only on data properties. Additionally, grey and fuzzy numbers were also introduced to reduce uncertainty in the indicator weights. Regarding the Delphi survey, a total of 13 experts in water resources-related fields with master’s degrees or higher were selected as panelists. Surveys were conducted about the importance and weight determination of flood indicators, weight ranges, and fuzzy numbers. The survey was conducted twice in total, enabling a more objective collection of expert opinions through repeated surveys. In the entropy-based weighting approach, greater entropy values result in smaller weights, smaller differences in alternatives for a specific criterion, less information provided by a specific criterion, and less importance associated with a criterion in the decision-making process. This study used the Shannon entropy method to derive the objective weights.
Weights were assigned separately for individual factors in each indicator. These weights were compared through the results for Delphi, entropy, fuzzy numbers, and grey numbers. The weights were subsequently used to calculate CFVs. Concerning weight calculation results, it was observed that there were no significant differences between the Delphi and entropy weights. However, in the case of human injury, amount of damage, and daily maximum precipitation, Delphi weights were two-to-three times larger than entropy weights, whereas the opposite results were observed for the weights related to the values of unemployment ratio and daily maximum temperature. Furthermore, the grey numbers were found to have a narrower range of weights compared to the fuzzy numbers. This discrepancy arises because grey number weights were defined using the minimum and maximum values to regard uncertainty. As a result, it is expected that this approach will further reduce uncertainty by considering variability in determined weights. The calculated weights for all indicators are shown in Figure 5.

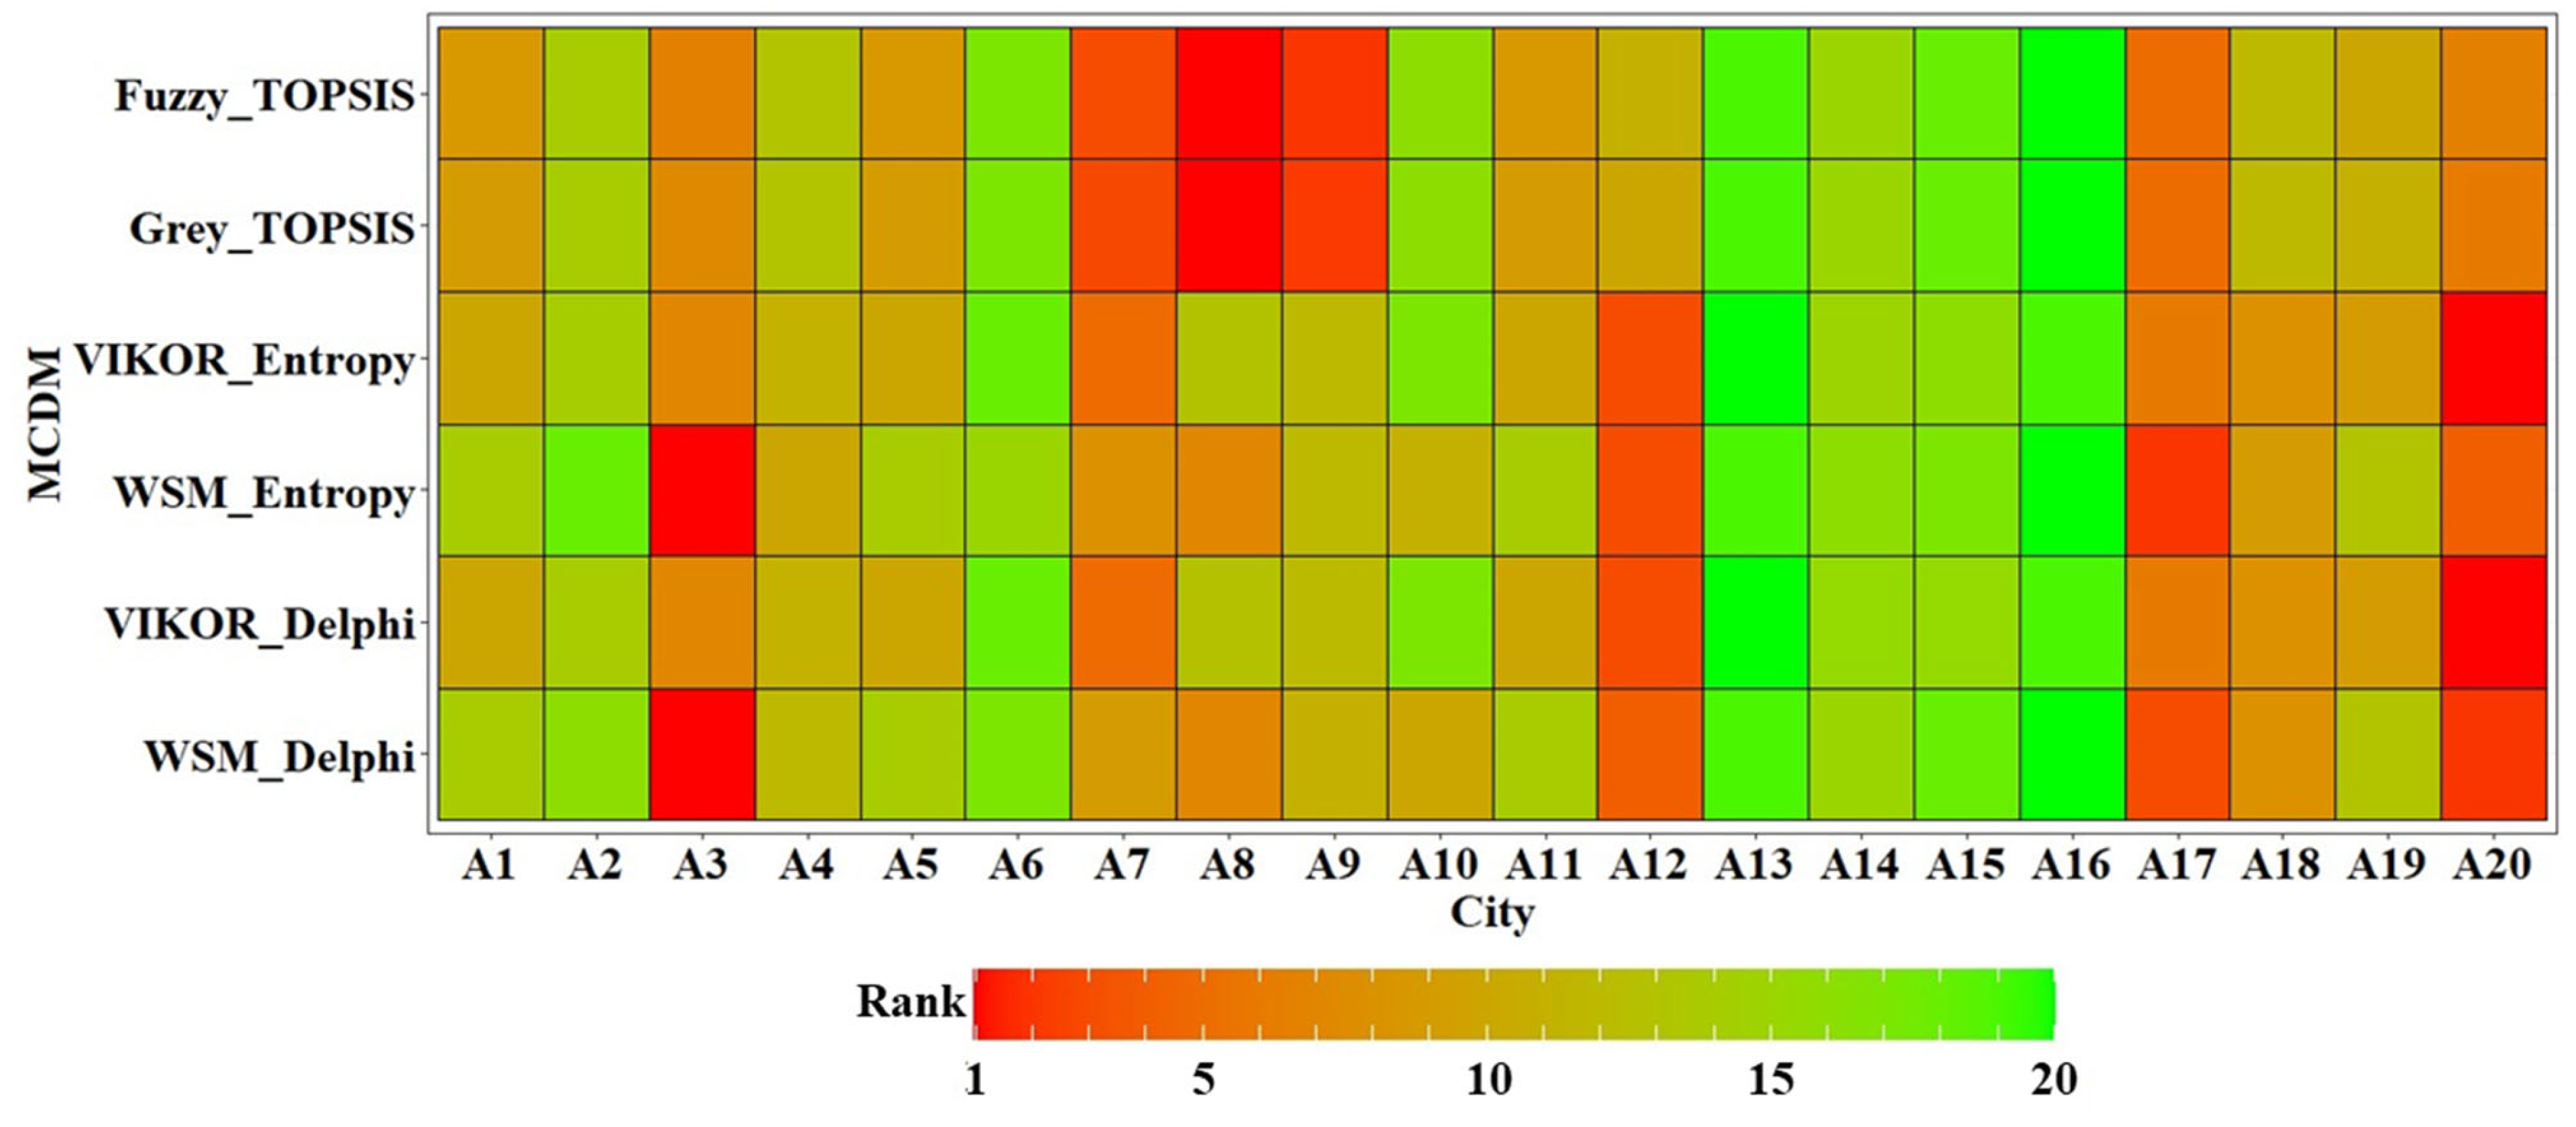
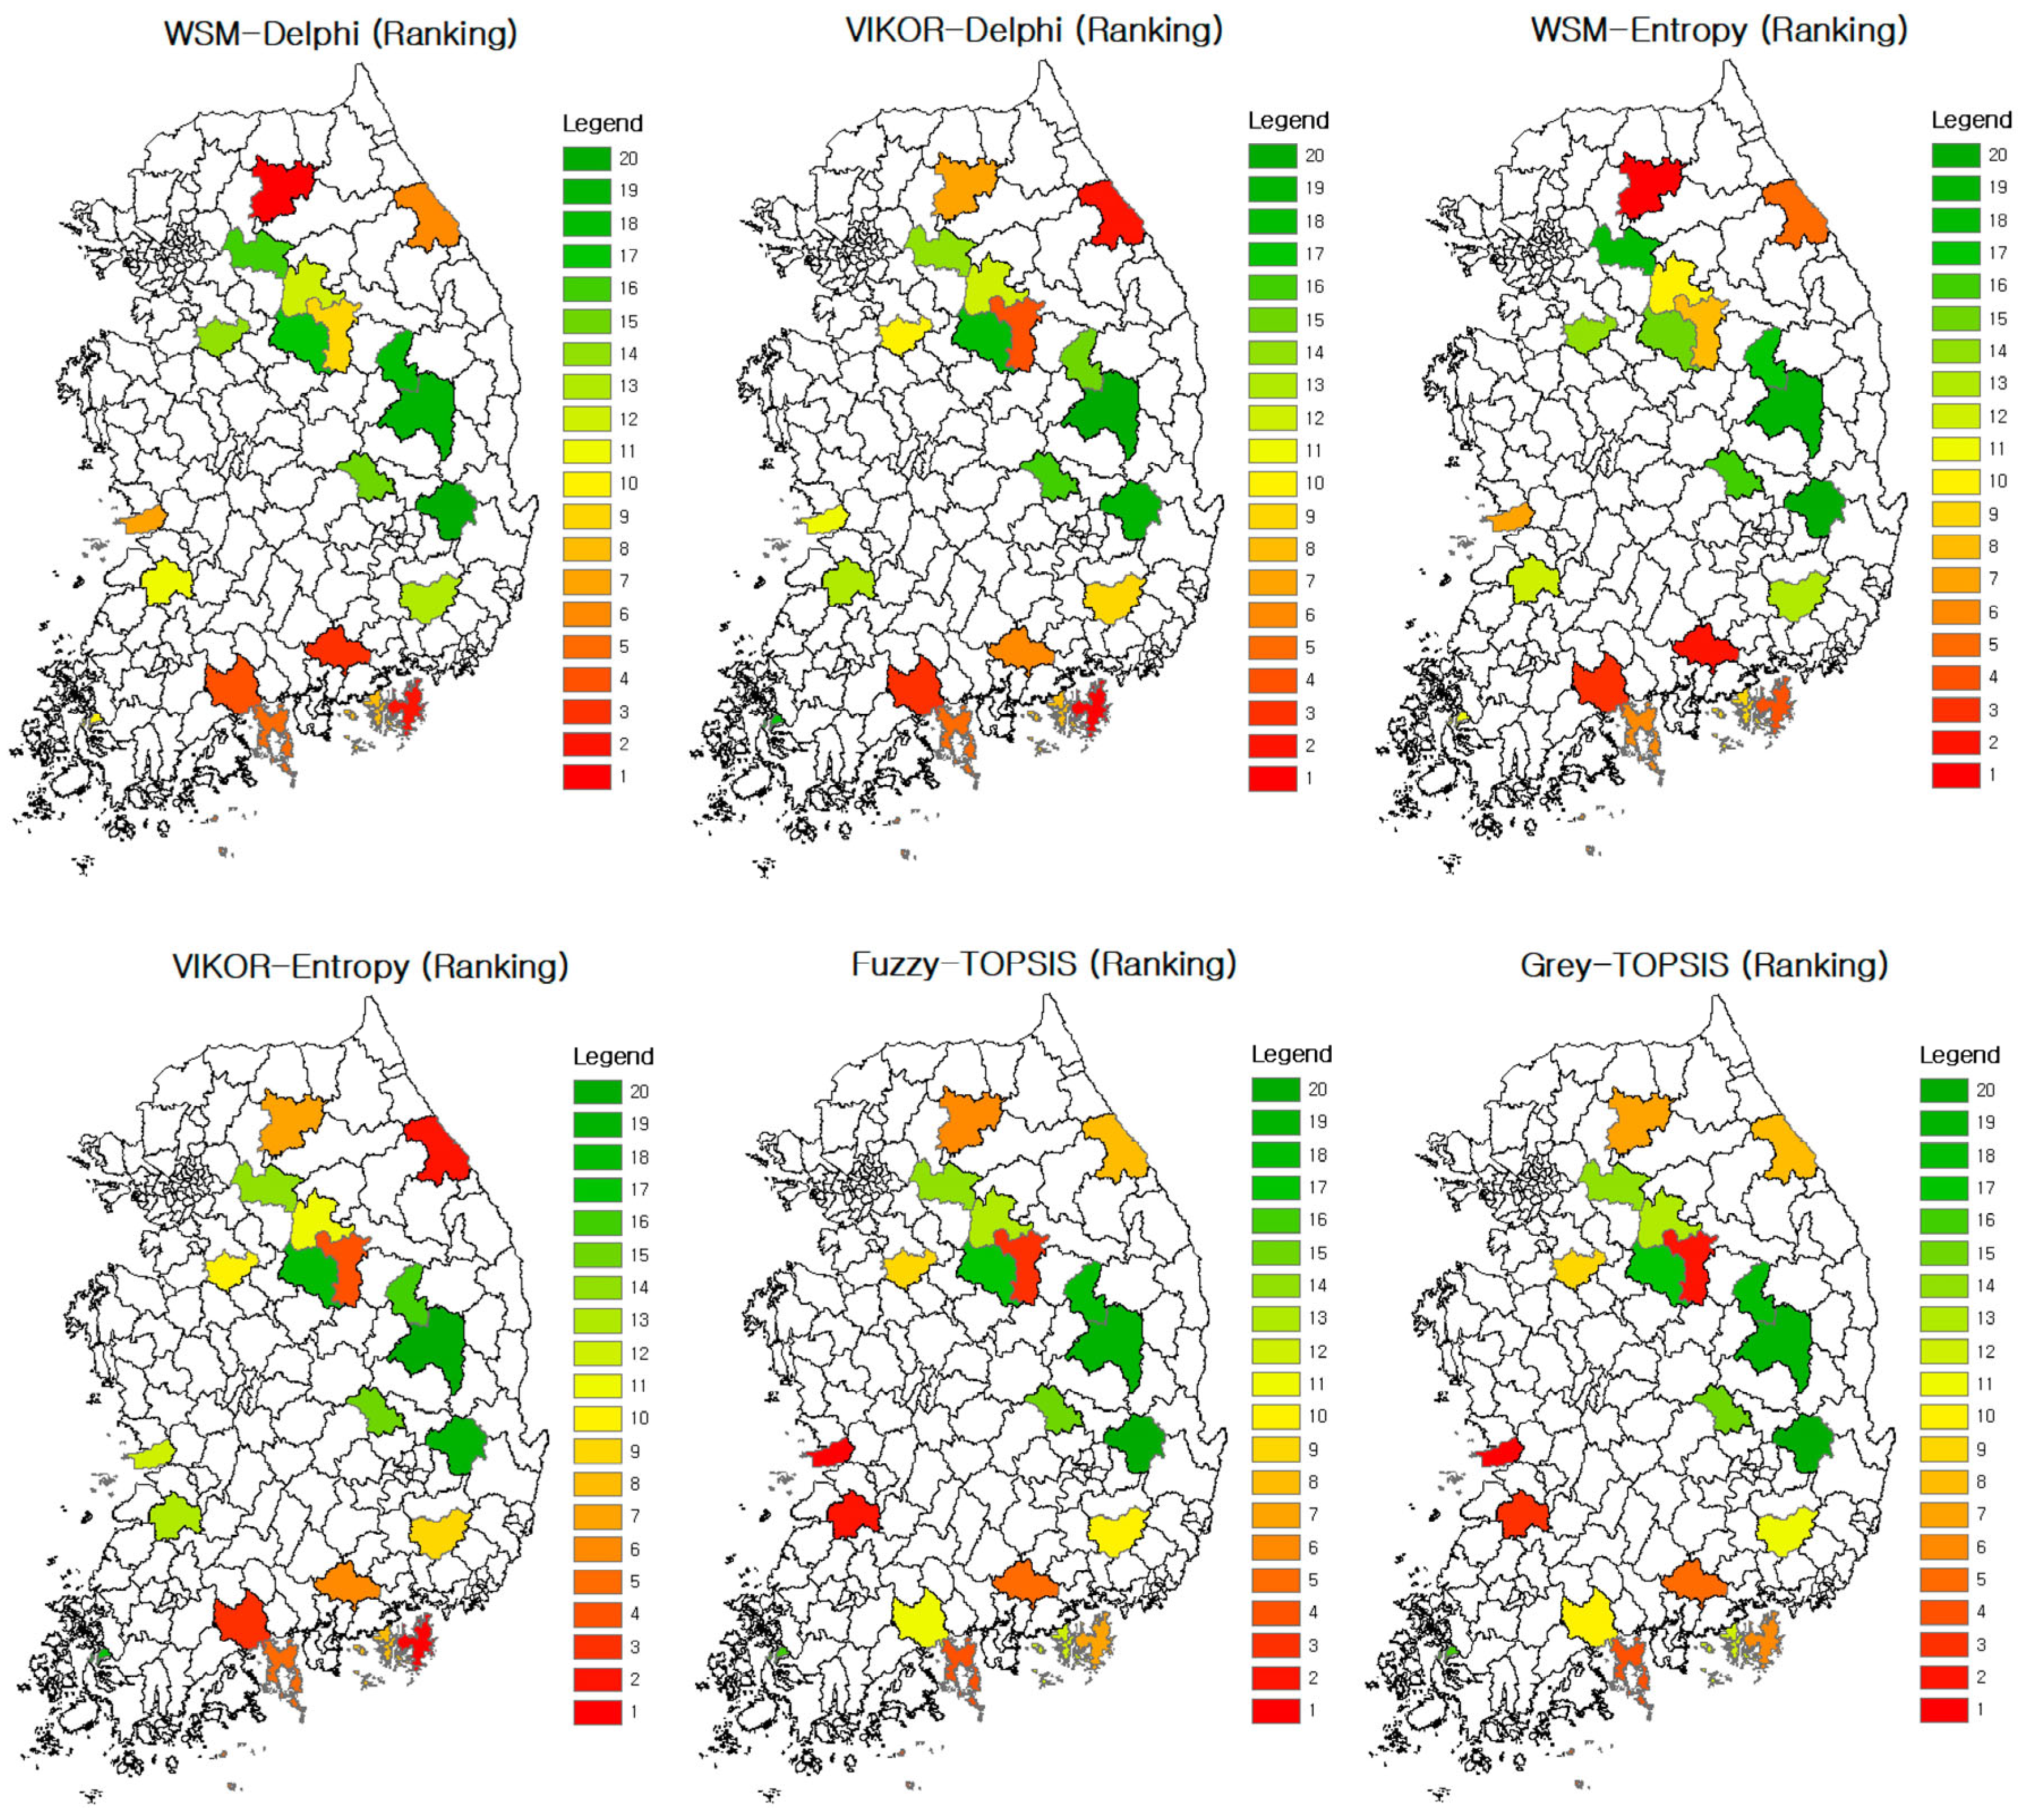
3.4. Vulnerability Assessment by MCDM Methods

The MCDM approaches were applied differently according to the methods used to derive the weights, including subjective, objective, and uncertainty-based weightings. The high rankings were assigned to areas that were vulnerable to flooding. The ranking of grey-based TOPSIS, which is expected to effectively consider weights and data uncertainty, was calculated and compared to rankings from fuzzy-based MCDM techniques, widely recognized for their ability to reduce uncertainty. In addition, a comparison was made with classical MCDM approaches such as the weighted summation method and VIKOR method, known for deriving more robust rankings. As a result, CFVs according to the MCDM method were all different, but the fuzzy-MCDM method considering uncertainty and the proposed grey-MCDM method showed similar ranking results.
The CFVI of each MCDM method according to each GCM was checked to show no significant difference. As a result, the GCM average rankings were calculated as shown in Figure 6. Because the rankings for two SSP (SSP 2–4.5, and SSP 5–8.5) scenarios are identical, one figure is shown. In addition, the spatial distribution of flood vulnerability by city was shown in Figure 7. In the end, the final rankings of all cities were calculated using the Minimax-Regret method as shown in Figure 8 and Figure S2, and the flood vulnerability was checked using the MCDM method.

3.5. Comparison of Rankings

In this study, various indicators were selected in consideration of social, economic, and environmental factors to quantify the CFVs for all cities. Subsequently, their rankings from various MCDM approaches considering uncertainty were compared. In particular, this study focused on the results of the newly proposed grey-TOPSIS method, aimed at reducing the uncertainty arising from the use of imprecise weights, and compared these with the results of fuzzy-TOPSIS. In addition, Spearman rank correlation coefficients were calculated to analyze the differences among all rankings, as shown in Table 4.
Depending on the weighting derivation method and MCDM approaches, certain cases exhibited a high correlation (0.997), such as VIKOR (Delphi) and VIKOR (Entropy). However, in most cases, low correlations (0.7 to 0.9) were calculated. In other words, it was confirmed that even when the same data and weights were used, classical MCDM methods coupled with fuzzy and grey theory could provide significantly different results due to the uncertainty of the data and weights. In the results, we found that grey-TOPSIS effectively reduces the inherent uncertainty in the MCDM process, as fuzzy-TOPSIS with TFN weights and grey-TOPSIS with grey weights consistently showed the high correlation (0.996). Therefore, grey-TOPSIS asking for less calculation efforts is expected to be used when the flood-prone areas should be determined by government ministries and related agencies.

4. Conclusions

This study evaluated flood vulnerability in medium-sized cities due to climate change. All indicators of CFVs were selected using the DPSIR framework, and the grey-TOPSIS method coupled with grey weights was used to quantify the CFVs. Further, the rankings of grey-TOPSIS were compared to the rankings of fuzzy-TOPSIS, which is known to minimize uncertainty. The findings were also compared to the WSM and VIKOR method, which have been used mostly as MCDM approaches.
The fuzzy- and grey-TOPSIS methods showed similar rankings for ten GCMs under two SSP scenarios. However, among various existing MCDM methods, the rankings of flood-vulnerable and safe areas revealed distinct results. As shown Figure S2 (Supplementary) and Figure 8, the grey- and fuzzy-TOPSIS methods identified A08 (Gunsan) as the most vulnerable to floods, while A16 (Yeongcheon) emerged as the safest. The city most vulnerable to flooding varied depending on each MCDM method used. However, A16 (Yeongcheon) consistently appeared as a safe city in all MCDM methods. This study tried to confirm whether the grey-TOPSIS method was effective in mid-sized cities. As a result, a strong correlation between the grey-TOPSIS approach utilized in the CFV evaluation and the fuzzy-TOPSIS method was confirmed, underscoring its enhanced reliability when dealing with uncertainties. Furthermore, due to the narrower weight range in grey-TOPSIS, extending from the minimum to maximum, it appears to have a more pronounced effect in reducing uncertainty than that of fuzzy-TOPSIS, even though the use of grey-TOPSIS is much easier than fuzzy-TOPSIS. This clearer distinction becomes evident when comparing results across various classical MCDM techniques. Therefore, grey-TOPSIS can provide robust and sustainable prioritization since it actively incorporates input from multiple stakeholders and addresses data uncertainty.
However, this study has some limitations for practical applications. Because the correlations between weights to all criteria can be very high, the CRITIC method can be used to generate reliable weights [74,75]. In addition, if flood damage data in the urban area exists, more techniques such as machine learning, neural networks, Bayesian networks, and deep learning algorithms can be used to improve the analysis and prediction of CFVs. Furthermore, this approach can incorporate remote sensing data and satellite imagery to improve the spatial accuracy and prediction.

Supplementary Materials

The following supporting information can be downloaded at: https://www.mdpi.com/article/10.3390/su152216061/s1, Figure S1: Normalization results of 28 indicators for all cities; Figure S2: Rankings of CFVI by GCMs using Minimax-Regret for SSP 2–4.5.

Author Contributions

Conceptualization, H.-Y.K. and E.-S.C.; methodology, H.-Y.K. and E.-S.C.; validation, H.-Y.K., S.T.C. and E.-S.C.; formal analysis, H.-Y.K.; data curation, H.-Y.K.; writing—original draft preparation, H.-Y.K. and S.T.C.; writing—review and editing, E.-S.C.; visualization, H.-Y.K. and S.T.C.; supervision, E.-S.C. All authors have read and agreed to the published version of the manuscript.

Funding

This research was funded by the National Research Foundation of Korea (2021R1A2C2005699).

Institutional Review Board Statement

Not applicable.

Informed Consent Statement

Not applicable.

Data Availability Statement

The data that support the findings of this study are available on request from the corresponding author, Chung, E.-S.

Conflicts of Interest

The authors declare no conflict of interest.

References

  1. Hossain, M.; Ramirez, J.; Haisch, T.; Speranza, C.; Martius, O.; Mayer, H.; Keiler, M. A coupled human and landscape conceptual model of risk and resilience in Swiss Alpine communities. Sci. Total Environ. 2020, 730, 138322. [Google Scholar] [CrossRef] [PubMed]
  2. Hong, C.Y.; Chang, H. Residents’ perception of flood risk and urban stream restoration using multi criteria decision analysis. River Res. Appl. 2020, 36, 2078–2088. [Google Scholar] [CrossRef]
  3. Fuchs, S.; Karagiorgos, K.; Kitikidou, K.; Maris, F.; Paparrizos, S.; Thaler, T. Flood risk perception and adaptation capacity: A contribution to the socio-hydrology debate. Hydrol. Earth Syst. Sci. 2017, 21, 3183–3198. [Google Scholar] [CrossRef]
  4. Zarch, M.A.A.; Sivakumar, B.; Sharma, A. Assessment of global aridity change. J. Hydrol. 2015, 520, 300–313. [Google Scholar] [CrossRef]
  5. Balaguru, K.; Folts, G.R.; Leung, L.R.; Emanuel, K.A. Global warming-induced upper-ocean freshening and the intensification of super typhoons. Nat. Commun. 2016, 7, 13670. [Google Scholar] [CrossRef] [PubMed]
  6. Walsh, J.; Mellilo, J.M.; Richmond, T.C.; Yohe, G.W. Our Changing Climate. Climate Change Impacts in the United States: The Third National Climate Assessment; U.S. Global Change Research Program: Washington, DC, USA, 2014; pp. 19–67. [Google Scholar]
  7. Wing, O.E.J.; Bates, P.D.; Smith, A.M.; Sampson, C.C.; Johnson, K.A.; Fargione, J.; Morefield, P. Estimates of present and future flood risk in the conterminous United States. Environ. Res. Lett. 2018, 13, 034023. [Google Scholar] [CrossRef]
  8. Jongman, B.; Ward, P.J.; Aerts, J.C.J.H. Global exposure to river and coastal flooding: Long term trends and changes. Glob. Environ. Chang. 2012, 22, 823–835. [Google Scholar] [CrossRef]
  9. NIMS. National Institute of Meteorological Science; 100-Year Climate Change on the Korean Peninsula; NIMS: Seoul, Republic of Korea, 2018. [Google Scholar]
  10. Huang, X.D.; Wang, L.; Han, P.P.; Wang, W.C. Spatial and Temporal Patterns in Nonstationary Flood Frequency across a Forest Watershed: Linkage with Rainfall and Land Use Types. Forest 2018, 9, 939. [Google Scholar] [CrossRef]
  11. Tonmoy, F.N.; El-Zein, A.; Hinkel, J. Assessment of vulnerability to climate change using indicators: A meta-analysis of the literature. Wiley Interdiscip. Rev.-Clim. Chang. 2014, 5, 775–792. [Google Scholar] [CrossRef]
  12. Juwana, I.; Muttil, N.; Perera, B.J.C. Indicator-based water sustainability assessment—A review. Sci. Total Environ. 2012, 438, 357–371. [Google Scholar] [CrossRef]
  13. Ding, T.; Liang, L.; Yang, M.; Wu, H. Multiple Attribute Decision Making Based on Cross-Evaluation with Uncertain Decision Parameters. Math. Probl. Eng. 2016, 4313247, 10. [Google Scholar] [CrossRef]
  14. Messner, F.; Meyer, V. Flood damages, vulnerability and risk perception challenges for flood damage research. In Flood Risk Management: Hazards, Vulnerability and Mitigation Measures; Springer: Dordrecht, The Netherlands, 2006; pp. 149–167. [Google Scholar]
  15. Merz, B.; Thieken, A.H.; Gocht, M. Flood risk mapping at the local scale: Concepts and challenges. Flood Risk Manag. Eur. 2007, 25, 231–251. [Google Scholar]
  16. Adger, V. Vulnerability. Glob. Environ. Chang. 2006, 16, 268–281. [Google Scholar] [CrossRef]
  17. Balica, S.F.; Popescu, I.; Beevers, L.; Wright, N.G. Parametric and physically based modelling techniques for flood risk and vulnerability assessment: A comparison. Environ. Modell. Softw. 2013, 41, 84–92. [Google Scholar] [CrossRef]
  18. Meyer, V.; Scheuer, S.; Haase, D.A. Multictiteria approach for flood risk mapping exemplified at the Mulderiver. Nat. Hazards 2009, 48, 17–39. [Google Scholar] [CrossRef]
  19. Scheuer, S.; Haase, D.; Meyer, V. Exploring multi criteria flood vulnerability by integrating economic, social and ecological dimensions of flood risk and coping capacity: From a starting point view towards an end point view of vulnerability. Nat. Hazards 2011, 58, 731–751. [Google Scholar] [CrossRef]
  20. Kienberger, S.; Land, S.; Zeil, P. Spatial vulnerability units-expert-based spatial modelling of socioeconomic vulnerability in the Salzach catchment. Nat. Hazards Earth Syt. 2009, 9, 767–778. [Google Scholar] [CrossRef]
  21. Hwang, C.L.; Yoon, K. Multiple Attribute Decision Making an Introduction; Sage Publications: Thousand Oaks, CA, USA; London, UK; New Delhi, India, 1981; Volume 104, pp. 38–45. [Google Scholar]
  22. Hajkowicz, S.; Collins, K. A review of multiple criteria analysis for water resource planning and management. Water Resour. Manag. 2007, 21, 1553–1566. [Google Scholar] [CrossRef]
  23. Elham, R.S.; Azareh, A.; Choubin, B.; Mosavi, A.H.; Clague, J.J. Evaluating urban flood risk using hybrid method of TOPSIS and Machine learning. Int. J. Disaster Risk Reduct. 2021, 66, 102614. [Google Scholar]
  24. Azazkhan, I.P.; Agnihotri, P.G.; Said, S.; Patel, D. AHP and TOPSIS based flood risk assessment—A case study of the Navsari City, Gujarat, India. Environ. Monit. Assess. 2022, 194, 509. [Google Scholar]
  25. Chung, E.S.; Abdulai, P.J.; Park, H.S.; Kim, Y.J.; Ahn, S.R.; Kim, S.J. Multi-Criteria Assessment of Spatial Robust Water Resource Vulnerability Using the TOPSIS Method Coupled with Objective and Subjective Weights in the Han River Basin. Sustainability 2017, 9, 29. [Google Scholar] [CrossRef]
  26. Yoo, G.Y.; Kim, I.A. Development and application of a climate change vulnerability index. Korea Environ. Inst. 2008, 5, 81. [Google Scholar]
  27. Zadeh, L.A. Fuzzy sets. Inf. Control 1965, 8, 338–353. [Google Scholar] [CrossRef]
  28. Simonovic, S.P.; Nirupama, A. A spatial multi-objective decision-making under uncertainty for water resources management. J. Hydroinform. 2005, 7, 117–133. [Google Scholar] [CrossRef]
  29. Chaakhori, M.; Zohrabi, N.; Fathian, H. Analysis of water resources management strategies by TOPSIS method based on water footprint of agricultural products in Dez basin. Iran. J. Ecohydrol. 2021, 8, 841–854. [Google Scholar]
  30. Roozbahani, A.; Ebrahimi, E.; Banihabib, M.E. A Framework for Ground Water Management Based on Bayesian Network and MCDM Techniques. Water Resour. Manag. 2018, 32, 4985–5005. [Google Scholar] [CrossRef]
  31. Park, J.H.; Kang, M.S.; Song, I.H. Flood Risk Assessment Based on Bias-Corrected RCP Scenarios with Quantile Mapping at a Si-Gun Level. J. Korean Soc. Agric. Eng. 2013, 55, 73–82. [Google Scholar]
  32. Deschrijver, G.; Kerre, E.E. Triangular norms and related operators in L*-fuzzy set theory. In Logical, Algebraic, Analytic and Probabilistic Aspects of Triangular Norms; Elsevier Science BV: Amsterdam, The Netherlands, 2005; pp. 231–259. [Google Scholar]
  33. Zhu, J.; Hipel, K.W. Multiple stages grey target decision making method with incomplete weight based on multi-granularity linguistic label. Inf. Sci. 2012, 212, 15–32. [Google Scholar] [CrossRef]
  34. Zavadskas, E.K.; Kaklauskas, A.; Turskis, Z.; Tamosaitiene, J. Multi-Attribute Decision-Making Model by Applying Grey Numbers. Informatica 2009, 20, 305–320. [Google Scholar] [CrossRef]
  35. Bai, R.; Li, F.; Yang, J. A dynamic fuzzy multi-attribute group decision making method for supplier evaluation and selection. In Proceedings of the 26th Chinese Control and Decision Conference (2014 CCDC), Changsha, China, 31 May–2 June 2012; p. 215006. [Google Scholar]
  36. Oztaysi, B. A decision model for information technology selection using AHP integrated TOPSIS-Grey: The case of content management systems. Knowl.-Based Syst. 2014, 70, 44–54. [Google Scholar] [CrossRef]
  37. Nyaoga, R.; Magutu, P.; Wang, M. Application of Grey-TOPSIS approach to evaluate value chain performance of tea processing chains. Decis. Sci. Lett. 2016, 5, 431–446. [Google Scholar] [CrossRef]
  38. Yang, W.; Wu, Y. A Novel TOPSIS Method Based on Improved Grey Relational Analysis for Multi attribute Decision-Making Problem. Math. Probl. Eng. 2019, 2019, 8761681. [Google Scholar]
  39. Lee, G.; Choi, J.; Jun, K.S. MCDM approach for identifying urban flood vulnerability under social environment and climate change. J. Coast. Res. 2017, 79, 209–213. [Google Scholar] [CrossRef]
  40. Brahma, A.K. A Look on Some Applications of Fuzzy VIKOR and Fuzzy AHP Methods. Int. J. Appl. Eng. Res. 2018, 13, 13689–13696. [Google Scholar]
  41. Nguyen, H.X.; Nguyen, A.T.; Ngo, A.T.; Phan, V.T.; Nguyen, T.D.; Do, V.T.; Dao, D.C.; Dang, D.T.; Nguyen, A.T.; Nguyen, T.K.; et al. Hybrid Approach Using GIS-Based Fuzzy AHP-TOPSIS Assessing Flood Hazards along the South-Central Coast of Vietnam. Appl. Sci. 2020, 10, 7142. [Google Scholar] [CrossRef]
  42. Vignesh, K.S.; Anandakumar, I.; Ranjan, R.; Borah, D. Flood vulnerability assessment using an integrated approach of multi-criteria decision-making model and geospatial techniques. Model. Earth Syst. Environ. 2021, 7, 767–781. [Google Scholar] [CrossRef]
  43. King, D. Uses and limitations of socioeconomic indicators of community vulnerability to natural hazards. Nat. Hazards 2001, 24, 147–156. [Google Scholar] [CrossRef]
  44. Fekete, A. Validation of a social vulnerability index in context to river-floods in Germany. Nat. Hazards Earth Syst. 2009, 9, 393–403. [Google Scholar] [CrossRef]
  45. Kaplan, M.; Renaud, F.G.; Luchters, G. Vulnerability assessment and protective effects of coastal vegetation during the 2004 Tsunami in Sri Lanka. Nat. Hazards Earth Syst. Sci. 2009, 9, 1479–1494. [Google Scholar] [CrossRef]
  46. Sebald, C. Towards an Integrated Flood Vulnerability Index: A Flood Vulnerability Assessment. Master Thesis, University of Twente, Enschede, The Netherlands, 2010. [Google Scholar]
  47. European Environmental Agency (EEA). Environmental Indicators: Typology and Overview; Technical Report; European Environmental Agency: Copenhagen, Danmark, 1999; p. 25.
  48. Her, Y.G.; Yoo, S.H.; Cho, J.P.; Hwang, S.W.; Jeong, J.H.; Seong, C.G. Uncertainty in hydrological analysis of climate change: Multi-parameter vs. multi-GCM ensemble predictions. Sci. Rep. 2019, 9, 4974. [Google Scholar] [CrossRef]
  49. Meehl, G.A.; Boer, G.J.; Covey, C.; Latif, M.; Stouffer, R.J. The Coupled Model Intercomparison Project (CMIP). Bull. Amer. Meteorol. Soc. 2000, 81, 313–318. [Google Scholar] [CrossRef]
  50. Intergovernmental Panel on Climate Chage (IPCC). Climate Change 2021: The Physical Science Basis; Contribution of Working Group I to the Sixth Assessment Report of the Intergovernmental Panel on Climate Chage; Cambridge University Press: Cambridge, UK; New York, NY, USA, 2021; p. 2391.
  51. O’Neill, B.C.; Kriegler, E.; Riahi, K.; Ebi, K.L.; Hallegatte, S.; Carter, T.R.; Mathur, R.; van Vuuren, D.P. A new scenario framework for climate change research: The concept of shared socioeconomic pathways. Clim. Chang. 2014, 122, 387–400. [Google Scholar] [CrossRef]
  52. Chung, E.S.; Lee, K.S. Prioritization of water management for sustainability using hydrologic simulation model and multi criteria decision-making techniques. J. Environ. Manag. 2009, 90, 1502–1511. [Google Scholar] [CrossRef] [PubMed]
  53. Turner, R.K.; Subak, S.; Adger, W.N. Pressures, trends, and impacts in coastal zones: Interactions between socioeconomic and natural systems. Environ. Manag. 1996, 20, 159–173. [Google Scholar] [CrossRef]
  54. Newton, A.; Icely, J.D.; Falcao, M.; Nobre, A.; Nunes, J.P.; Ferreira, J.G.; Vale, C. Evaluation of eutrophication in the Ria Formosa coastal lagoon, Portugal. Cont. Shelf Res. 2003, 23, 1945–1961. [Google Scholar] [CrossRef]
  55. WSM. The Water Strategy Man DSS. A Comprehensive Decision Support System for the Development of Sustainable Water Management Strategies; EU DG Research, Contract No: EVK1-CT-2001-00098; European Commission: Brussels, Belgium, 2004. [Google Scholar]
  56. Kagalou, I.; Leonardos, I.; Anastasiadou, C.; Neofytou, C. The DPSIR approach for an integrated river management framework. A preliminary application on a Mediterranean site (Kalamas River-NW Greece). Water Resour. Manag. 2012, 26, 1677–1692. [Google Scholar] [CrossRef]
  57. Chiang, Y.C. Exploring community risk perceptions of climate change—A case study of a flood-prone urban area of Taiwan. Cities 2018, 74, 42–51. [Google Scholar] [CrossRef]
  58. Rehman, J.; Sohaib, O.; Asif, M.; Pradhan, B. Applying systems thinking to flood disaster management for a sustainable development. Int. J. Disaster Risk Reduct. 2019, 36, 101101. [Google Scholar] [CrossRef]
  59. Bruno, M.F.; Saponieri, A.; Molfetta, M.G.; Damiani, L. The DPSIR Approach for Coastal Risk Assessment under Climate Change at Regional Scale: The Case of Apulian Coast (Italy). J. Mar. Sci. Eng. 2020, 8, 531. [Google Scholar] [CrossRef]
  60. Malmir, M.; Javadi, S.; Moridi, A.; Neshat, A.; Razdar, B. A new combined framework for sustainable development using the DPSIR approach and numerical modeling. Geosci. Front. 2021, 12, 101169. [Google Scholar] [CrossRef]
  61. Chen, C.T. Extensions of the TOPSIS for group decision-making under fuzzy environment. Fuzzy Sets Syst. 2000, 114, 1–9. [Google Scholar] [CrossRef]
  62. Deng, J.L. Control problem of grey system. Syst. Control Lett. 1982, 5, 288–294. [Google Scholar]
  63. Deng, J.L. Introduction to grey system theory. J. Grey Syst. 1989, 1, 1–24. [Google Scholar]
  64. Deng, J.L. A Course of Grey System Theory; Huazhong Polytechnic University Press: Wuhan, China, 1990. [Google Scholar]
  65. Sayadi, M.K.; Heydari, M.; Shahanaghi, K. Extension of VIKOR method for decision-making problem with interval numbers. Appl. Math. Model. 2009, 33, 2257–2262. [Google Scholar] [CrossRef]
  66. Opricovic, S.; Tzeng, G.H. Compromise solution by MCDM methods; A comparative analysis of VIKOR and TOPSIS. Eur. J. Oper. Res. 2004, 156, 445–455. [Google Scholar] [CrossRef]
  67. Feng, C.M.; Wang, R.T. Performance evaluation for airlines including the consideration of financial ratios. J. Air Transp. Manag. 2000, 6, 133–142. [Google Scholar] [CrossRef]
  68. Kaufman, A.; Gupta, M.M. Introduction to Fuzzy Arithmetic: Theory and Applications; Van Nostrand Reinhold: New York, NY, USA, 1991. [Google Scholar]
  69. Larichev, O.I.; Moskovich, H.M. Unstructured problems and development of prescriptive decision making methods. Adv. Multicriteria Anal. 1995, 5, 47–80. [Google Scholar]
  70. Roy, B.; Vincke, P. Multi criteria analysis: Survey and new directions. Eur. J. Oper. Res. 1981, 8, 207–218. [Google Scholar] [CrossRef]
  71. Chung, E.S.; Lee, K.S. Identification of Spatial Ranking of Hydrological Vulnerability Using Multi-Criteria Decision Making Techniques: Case Study of Korea. Water Resour. Manag. 2009, 23, 2395–2416. [Google Scholar] [CrossRef]
  72. Gross Regional Domestic Product (GRDP). Statistical Year Book; Ministry of Interior and Safety: Seoul, Republic of Korea, 2021. [Google Scholar]
  73. Ministry of the Interior and Safety (MOIS). The Statistical Year Book of Natural Disaster; Ministry of the Interior and Safety: Seoul, Republic of Korea, 2021.
  74. Anil, S.; Manikanta, V.; Pallakury, A.R. Unravelling the influence of subjectivity on ranking of CMIP6 based climate models: A case study. Int. J. Climatol. 2021, 41, 5998–6016. [Google Scholar] [CrossRef]
  75. Manikanta, V.; Ganguly, T.; Umamahesh, N.V. A Multi criteria Decision Making based nonparametric method of fragments to disaggregate daily precipitation. J. Hydrol. 2023, 617, 128994. [Google Scholar] [CrossRef]
Figure 1. Map of study area over South Korea.
Sustainability 15 16061 g001
Figure 2. Evaluation procedure of MCDM methods in this study.
Sustainability 15 16061 g002
Figure 3. Criteria graph of 28 indicators for all cities.
Sustainability 15 16061 g003
Figure 4. Normalized values of four representative indicators for all cities.
Sustainability 15 16061 g004
Figure 5. Weighting values for selected indicators.
Sustainability 15 16061 g005
Figure 6. Ranking of CFVIs for all cities using MCDM methods (GCM average ranking).
Sustainability 15 16061 g006
Figure 7. Map of City Flood Vulnerability Ranking.
Sustainability 15 16061 g007
Figure 8. Rankings from CFVI for GCMs using Minimax-Regret for SSP 5–8.5.
Sustainability 15 16061 g008
Table 1. Information on the 20 medium-sized cities included in this study.
No.CitiesLabelLocationArea (km2)Population
1IcheonA01127°43′ E37°27′ N(Inland)461.47223,177
2YangpyeongA02127°49′ E 37°49′ N(Inland)877.79121,230
3ChuncheonA03127°73′ E37°88′ N(Inland)1116.42284,594
4WonjuA04127°92′ E 37°34′ N(Inland)868.25357,757
5GangneungA05128°88′ E37°75′ N(Coast)104.07212,965
6ChungjuA06127°93′ E36°99′ N(Inland)983.62209,358
7JecheonA07128°19′ E37°13′ N(Inland)882.77131,591
8GunsanA08126°74′ E35°97′ N(Coast)397.45265,304
9JeongeupA09126°86′ E35°57′ N(Inland)693.10106,487
10MokpoA10126°39′ E34°81′ N(Coast)51.66218,589
11YeosuA11127°66′ E34°76′ N(Coast)512.26276,762
12SuncheonA12127°49′ E34°95′ N(Coast)910.95281,436
13AndongA13128°73′ E 36°57′ N(Inland)152.22156,972
14GumiA14128°34′ E36°12′ N(Inland)615.31412,581
15YeongjuA15128°62′ E36°81′ N(Inland)670.11101,942
16YeongcheonA16128°94′ E36°02′ N(Inland)919.19101,888
17JinjuA17128°11′ E35°18′ N(Inland)712.90347,097
18TongyeongA18128°43′ E34°85′ N(Coast)240.21125,383
19MilyangA19128°79′ E35°50′ N(Inland)798.64103,525
20GeojeA20128°62′ E34°88′ N(Coast)403.83241,216
Table 2. Resolutions and developing institutions of CMIP6 GCMs selected in this study.
ModelResolutionInstitution
ACCESS-ESM1-51.25° × 1.875°Commonwealth Scientific and Industrial Research Organization
CanESM52.81° × 2.81°Canadian Centre for Climate Modeling and Analysis
GFDL-ESM41.3° × 1.0°Geophysical Fluid Dynamics Laboratory
CMCC-ESM20.9° × 1.25°Euro-Mediterranean Centre on Climate Change
INM-CM4-82.0° × 1.5°Institute for Numerical Mathematics
IPSL-CM6A-LR2.5° × 1.27°Institute Pierre-Simon Laplace
MIROC61.4° × 1.4°Japan Agency for Marine-Earth Science and Technology, Atmosphere and Ocean Research Institute and National Institute for Environmental Studies
MPI-ESM1-2-LR1.875° × 1.86°Max Planck Institute for Meteorology (MPI-M)
MRI-ESM2-01.125° × 1.125°Meteorological Research Institute
NorESM2-MM2.5° × 1.89°Norwegian Climate Centre
Table 3. Indicators for City Flood Vulnerability Index (CFVI) selected in this study.
FactorDivisionLabelIndicatorsSource
SocialDriving forceB01Population densityStatistical Year book (https://kosis.kr/index/index.do, 2011–2020) (accessed on 30 November 2022)
[73]
B02Population growth
B03Number of disaster vulnerable class
B04Area by administrative district
B05Number of population
B06Distance to the shore
PressureB07Developed area
StateB08Number of flood disastersDisaster Year book
(https://kosis.kr/index/index.do, 2011–2020) (accessed on 30 November 2022)
ImpactB09Number of victims
B10Human injury
ResponseB11Number of inhabitants per residentStatistical Year book
(2011–2020)
B12Number of beds per thousand people
B13Number of doctors per thousand people
EconomicDriving forceB14Unemployment ratioStatistical Year book
(2011–2020)
PressureB15Financial independence rate
B16GRDP
StateB17Developing plan area
ImpactB18Amount of damageDisaster Year book
(2011–2020)
ResponseB19Recovery amount
B20Disaster prevention budget
EnvironmentalDriving forceB21Annual maximum precipitationMeteorological Administration
(https://www.weather.go.kr/w/index.do, 2011–2020) (accessed on 30 November 2022)
B22Predicted monthly precipitation (GCMs)CMIP6
B23Day maximum temperatureMeteorological Administration
(2011–2020)
PressureB24Daily maximum precipitation
StateB25Damage areaDisaster Year book
(2011–2020)
ImpactB26Number of households to be restored
ResponseB27Length of leveeStatistical Year book
(2011–2020)
B28Number of reservoirs
Table 4. Spearman rank correlation coefficients among all rankings from MCDM methods.
MCDM
Method
WSM
(Delphi)
VIKOR
(Delphi)
WSM
(Entropy)
VIKOR
(Entropy)
Fuzzy-
TOPSIS
Grey-
TOPSIS
WSM
(Delphi)
10.8450.9810.8420.7350.750
VIKOR
(Delphi)
-10.8440.9970.7040.735
WSM
(Entropy)
--10.8410.7140.731
VIKOR
(Entropy)
---10.6900.722
Fuzzy-
TOPSIS
----10.996
Grey-
TOPSIS
-----1
Disclaimer/Publisher’s Note: The statements, opinions and data contained in all publications are solely those of the individual author(s) and contributor(s) and not of MDPI and/or the editor(s). MDPI and/or the editor(s) disclaim responsibility for any injury to people or property resulting from any ideas, methods, instructions or products referred to in the content.

