1. Introduction
Land is a limited natural resource and is vital not only for the provision of our raw materials but also for the establishment of settlements, which provide humans with habitation and spaces for industrial production and commercial exchange. The global population living in urban areas has risen by 1.7 billion persons, equivalent to an 11% increase, over 25 years [
1]. Furthermore, urban expansion has had a higher rate of growth (28%) than the global population increase over the same period (17%). Settlements, and particularly urban areas, are expanding and putting pressure on the limited land resources, especially in small states and island contexts.
This study looks at the case study of the island-state of Malta, selected for its highest share of artificial land cover in Europe [
2]. In 2015, it was estimated that artificial land cover on the islands ranged between 23.7% [
2] and 32.9% [
3]. The first figure is based on Eurostat’s Land Use and Land Cover Survey (LUCAS), whilst the second figure is published by Malta’s National Statistics Office (NSO) and is based on development-planning application boundaries accessible on the web platform of the national mapping agency within the islands’ Planning Authority. Both methodologies used to calculate land cover have their own limitations; however, both show that between a quarter and a third of Malta’s land cover is artificial. Malta is followed by the Netherlands and Belgium, with 12.1% and 11.4% of artificial land cover, respectively [
2]. This reality emphasises the greater need to ensure appropriate policies to regulate and plan for sustainable urban development and environmental protection of undeveloped areas.
This study aims to contribute to the literature on Mediterranean urbanism and islands and showcase Malta as a densely built Mediterranean island. The Mediterranean region is characterised by a strong urban tradition, with Giner [
4] defining Mediterranean history as “the history of its cities”. Other studies that have contributed to the understanding of urban growth in Mediterranean islands include those on Sicily [
5]; Sardinia [
5,
6]; Ischia [
7]; Capri [
8]; the Balearic Islands [
9]; and the Greek islands [
10], in particular, the Aegean Islands [
11].
This study is the first attempt to draw information on urban growth on the islands of Malta from the text-mining of development-planning applications. This type of data provides rich information on permitted or rejected development applications. According to Preece [
12] and Cecchini et al. [
13], the spatial and functional components of this data make it a good instrument in urban geography and can be considered as a “barometer” for building activity through the quantification of developments and different types of developments [
14]. Development-planning data also provide “a continuous record of development trends, tracking new construction, renovations, additions, and demolitions” [
15]. This information can also be a good indicator of the developments planned for a region in the short to medium term. This approach builds on data-driven methods, such as those developed by Lai and Kontokosta [
16], who studied building alterations and redevelopment by analysing planning descriptors. The study took this data-driven approach and used it to categorise granted development-planning applications.
The aim of the study is to show how the text mining of granted development-planning applications (also known as building permits) can be used to analyse urban growth in Malta. The objective of this paper is to present a methdology, that was developed as part of this study, that(i) determines keywords mined from the descriptors of granted development-planning applications, (ii) helps to identify applications that denote growth, and (iii) analyses growth from granted development-planning applications in relation to zoning plans using Geographic Information Systems (GIS), where necessary. The paper is structured in 6 sections, with a literature review following this introduction, the case study description and methodology in
Section 3, and the results presented in
Section 4 and discussed in
Section 5.
Section 6 presents the conclusions of the study.
2. Literature Review
In this paper, we present a review of selected literature focused on patterns of urban growth, data-driven approaches in research, and development-planning applications and their relationship to urban growth. Our literature analysis involved a systematic search of relevant studies from reputable databases, such as Scopus. To ensure the relevance and quality of the included studies, we established specific exclusion criteria, such as limiting the search to the following fields of study: “environmental science”, “agricultural and biological sciences”, “Earth and planetary sciences”, and “social sciences”.
Land cover studies are used to study urban growth and to determine trajectories and cycles of urban growth, such as cycles of diffusion and coalescence, as proposed by Dietzel et al. [
17,
18]. Remotely sensed data together with landscape metrics, originally developed for studying landscape ecology, have been the preferred approach to quantify urban expansion to date [
19,
20,
21,
22,
23,
24]. The use of landscape metrics has its own shortcomings related to its dependence on the particular data models being used and the lack of comparability between studies based on data at different resolutions or scales [
25]. The challenges encountered in studies using landscape metrics can be categorised in (i) conceptual flaws (mainly related to the relationship between patterns and underlying processes); (ii) inherent limitations (for example, the use of different classifications systems can result in different patterns); and (iii) improper use [
26].
Over the last three decades, Malta’s Planning Authority, which is responsible for the granting of development-planning application permits, has developed an extensive database with information on development-planning applications. This vast repository of information has never been analysed in toto and using text-mining approaches, this study will make use of development-planning data to determine which of these applications will result in developments leading to urban growth. One of the strengths of development-planning applications is their high spatiotemporal resolution [
27,
28] in the complete spatial coverage across the whole area regulated by the national Planning Authority. Online databases and registers with development-planning applications and planning decisions provide researchers with a lot of information about development. Planning applications have the potential, therefore, to be an appropriate tool to study urban growth in Malta, given the small size of the island-state and the accessibility of the online database, which is in the public domain.
The use of online development-planning application databases and registers is linked to the rapid growth in data availability, supported by advances in information technology. Indeed, the data-driven approach has resulted in a paradigm shift in science. Gray [
29] described this shift as the “fourth paradigm”, alternatively known as “eScience”. The first paradigm is linked to empirical and descriptive science, the second to theoretical science linked to the discovery of laws and generation of models, and the third is linked to computational science. Finally, the last paradigm is characterised by data mining and computational analysis [
30]. During the last twenty years, this paradigm shift has led to social sciences, including geography, taking a quantitative turn. This has resulted in the creation of what is known as computational social science [
31,
32]. Within this context, development-planning applications and subsequent decisions are useful tools to gauge the rate and type of development underway at any point in an area and concurrently showcase the planning process [
14].
Four different types of methodologies have been identified in studies focusing on development-planning decisions [
33,
34]. The simplest methodology is the “simple statistical and cartographic analysis”. The strength of this methodology is that it can provide valuable initial information to the researcher. Another approach is logical positivism, which helps to identify trends, using statistics. However, this approach misses the struggle between different key players in the planning process. This lacuna is addressed through an approach that focuses on the structural analysis of the planning process in relation to a power economy. This approach makes use of case studies and gives more weight to the planning process rather than to the planning decision. The final approach is a postmodern approach that is rooted in development-planning complexities and focuses on the behavioural side of the process. Looking at the behavioural aspects in planning decisions, Yu and Hui [
35] identified four research areas that focused on (i) the effectiveness of planning decisions, (ii) development pressures in the land market, (iii) planning restrictions and their relationship with property prices, and (iv) the Planning Authority’s behaviour vis-a-vis consistency and rent-seeking attitudes.
Understanding development-planning permits can inform us of not only the behavioural aspects related to planning decisions but also the identification of spatiotemporal patterns that showcase the evolution of urban development [
36,
37]. One way to better analyse development-planning applications and decisions is by undertaking quantitative analysis using non-aggregate data, that is, individual development-planning applications [
38,
39]. Although they are complementary to aggregate data, non-aggregate data facilitate focused research on different development types and, in particular, planning zones.
An analysis of planning decisions can focus on how these were taken in relation to different planning zones. The literature shows multiple studies that have used Hong Kong as a case study. For example, Lai and Ho [
38] looked into the effectiveness of Hong Kong’s open storage zones in the permitting of storage facilities. The study found that market forces did not influence planning permission and that storage facilities were permitted irrespective of the statutory planning zones. Tang et al. [
40] studied development-planning decisions for different types of uses (both approvals and rejections) within Hong Kong’s green belt. Furthermore, Chau and Lai [
37] analysed different non-agricultural uses permitted within the agricultural zone.
Apart from analysing proposed developments, development-planning applications are also used as an urban planning tool for redevelopment and resource mapping. Lai and Kontokosta [
16] used text mining and topic modelling to discover different spatiotemporal patterns in relation to building alterations and redevelopment in seven US cities. Redevelopment is not limited to renovation and reconstruction works but can also be linked to recovery following natural disasters. Planning permissions following these disasters can be a gauge of the progression of recovery efforts [
41,
42]. Development-planning permits can also be coupled with other data sources to improve resource management. Hosseinihaghighi et al. [
43] used building permits together with heat permits in order to develop a housing energy model to determine where heating systems could be upgraded through housing retrofit programs.
Planning policy could also have an effect on the location and the nature of development. Carlson and Dierwechter [
44] analysed development-planning permits within and outside the Pierce County Urban Growth Boundary (UGB) in Washington, USA. They superimposed the UGB upon the location of development-planning permits even before the UGB introduction in 1995. Their study showed that the UGB had succeeded in curbing urban sprawl and concentrating planning permits within the development zone. Nonetheless, planning tools, like the UGB, are not always effective. Tang et al. [
40] showed that Hong Kong’s green belt was not effective in curbing development. This zone was more of a transitional zone rather than a no-development zone. The introduction of another level of protection (the ‘Conservation Area’) in Hong Kong continued weakening the ability of the green belt in restraining urban sprawl. Hence, analysing building permits can also contribute to the correction from existing boundaries to observed realities. After studying building permits for multi-family and one-family residential developments in a suburban area in Krakow, Poland, Ziobro [
45] proposed the rectification of the Krakow administrative boundary so that the functional area of the city is reflected in the city limit itself. This correction aimed to ensure better planning of this suburban area that is undergoing urbanisation.
Studies making use of development-planning applications can also contribute to understanding political change and planning trends. As explained above, Gilg and Kelly [
33] and Kelly and Gilg [
34] have shown that development-planning applications can be interpreted as struggles between different stakeholders and key players. Yu and Hui [
46] noted that following the reunification of Hong Kong with mainland China, there was an increased leniency in permits granted for residences within the ‘Government, Institution, or Community’ (GIC) zone and the Green Belt. Lai et al. [
47] studied the trend of repeat applications. It was shown that there was no major innovation in the design of the project, hinting that a repeat application can be a strategic business decision to commit a site for development and prolong the permitted development from being developed.
Development-planning application data can be useful in analysing and projecting future development. Willis [
48] developed a discrete choice model for planning decisions by looking into various factors that influence the choices of the planning officers, the planning committee, and any divergences between them. Statistical tools, such as probit or logistic regression, can be used to forecast these future scenarios [
36,
38,
39]. These statistical models identify and measure the strength and significance of key factors in determining particular outcomes. In this case, the outcomes are granted or rejected development-planning applications and, subsequently, urban growth. Granted development-planning applications are an example of spatial data because they include a specific location. Hence, there is the potential for undertaking spatial analysis using these data sets. The statistical models described above can work in conjunction with GIS [
27].
The literature review has shown that land cover studies have been used to explain land use changes, particularly urban growth. An established method is the use of remotely sensed data. However, there are increased examples of how development-planning applications can be useful in gauging different types of developments. Development-planning applications are data rich because they contain free text descriptions of what the development will consist of. This provides an opportunity for text mining and analysis. Text mining, which is also known as text analytics, refers to a process whereby high-level information is extracted from text data [
49]. The availability and use of online development-planning applications should be understood in the context of computational social sciences. Finally, understanding the relationship between different factors can aid to project future decisions and, subsequently, urban growth in the future. In this next section, a description of the case study is presented.
3. Materials and Methods
In this section, a case study about Malta and its urbanisation is presented, along with the methodological scheme used in the study. The case study includes a brief history of urban development in Malta from the early modern era to the present day. Additionally, an overview of the islands’ planning policy is presented. In the subsequent parts of this methodological section, we describe the web-scraping techniques that were adopted, explain how the data were cleaned, and, finally, detail how text-mining methods were employed to extract information and categorize the data set.
3.1. Study Area
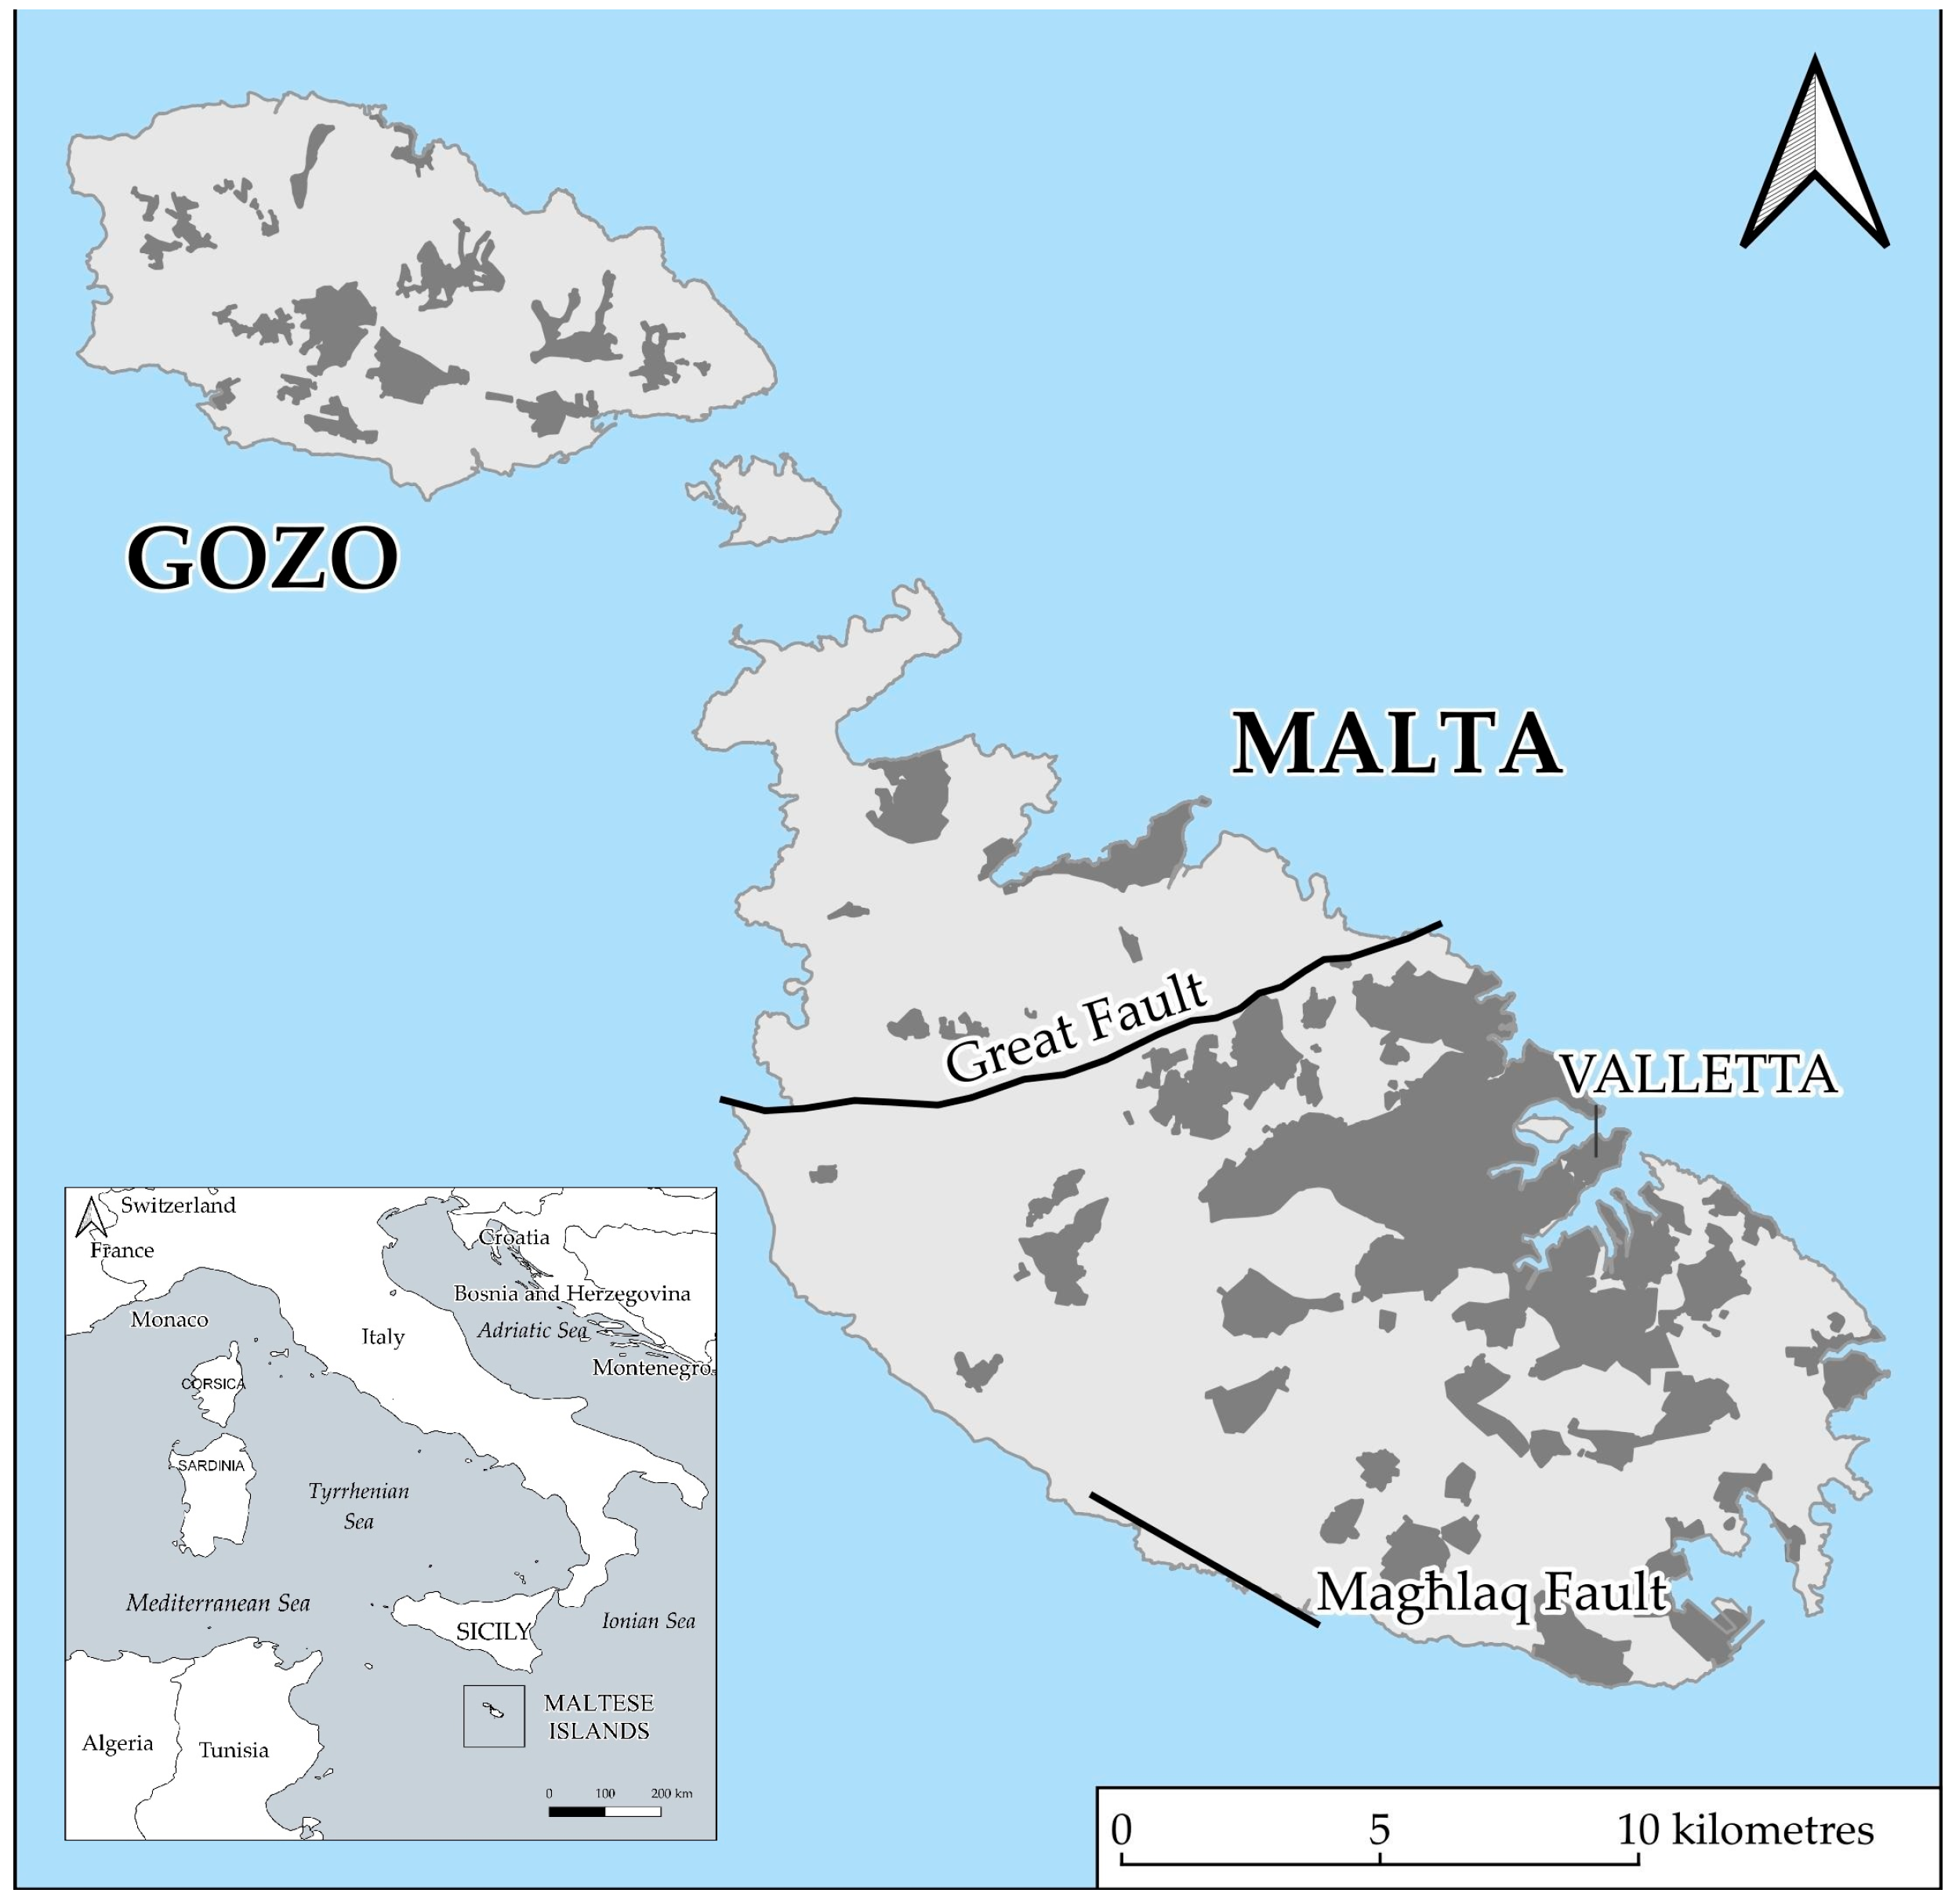
Malta is an island-state in the central Mediterranean Sea; consists of three main islands: Malta, Gozo, and Comino; and has a total surface area of 316 km
2 (
Figure 1) [
50]. The islands are characterised by two main fault systems that have shaped the islands’ topography. This has also influenced the urbanisation processes of the islands, whereby the gentler topography and the natural harbours found in the southern half of the main island have better accommodated a denser built-up area.
The Maltese islands were predominantly rural with an agrarian economy until the arrival of the Knights of the Order of St. John in the mid-sixteenth century. Their presence gradually transformed the island through the construction of defensive structures, the development of a mercantile culture, and the implementation of housing regulations and planned cities [
51,
52,
53,
54]. By the end of the eighteenth century, the population increased tenfold to an estimated 100,000 [
53], a trend that continued during British colonial rule from 1800 to 1964. Town planning during this time was regulated by the 1854 Code of Police Laws. In the mid-twentieth century, there were attempts to introduce laws regulating town planning; however, it was only in 1992 that these laws were finally enacted.
Rapid urban sprawl occurred from the second half of the twentieth century to the early 1990s [
55]. Home Ownership Schemes were adopted in the late 1960s to help potential homeowners afford property and control land speculation [
52]. Concurrently, the schemes contributed to urban sprawl through the provision of sizable parcels of land for development. The Town Planning Section of the Department of Public Works was closed in the 1970s, resulting in a negative impact on the urban development of the islands. In 1983, the Building Development Areas Act set out the process for establishing so-called ‘development areas’. However, the prerogative for designating development areas lay in the Minister’s hand. The legislation introduced 100 m green belts around these development areas, yet these zones were applicable neither between two development areas nor between the built-up area and other built-up areas and the seashore. This law resulted in considerable urban sprawl and was subsequently criticised by environmentalists and others [
52,
56,
57].
In 1988, the Town Planning Section was restored, and the Building Permits (Temporary Provision) Act was enacted. This established planning schemes and resulted in the formulation of a structure plan for the Maltese islands and, subsequently, in the approval of local plans. The planning schemes were approved by parliament and were known as the temporary provision schemes (TPS) (
Figure 2). These schemes also represented the limits of development. The areas outside these schemes became known as the outside development zone (ODZ), areas where there was a disposition against development. This designation aimed at curbing urban sprawl in an already densely built island. Several uses are still accepted in these areas, for example, development within designated rural settlements and development for agricultural uses. Even though this policy was aimed to facilitate environmental protection, the ODZ area is not free from development pressures both due to land scarcity and because the general character of these areas makes them attractive to those seeking a quieter environment.
The structure plan for the Maltese islands was approved in 1990. This plan was the main spatial policy and planning document between 1990 and 2015, when it was replaced by a Strategic Plan for the Environment and Development (SPED). The national Planning Authority (PA) was set up through the Development-Planning Act in 1992. The development-planning system has been reformed numerous times over the years. In 2006, the temporary provision schemes were reviewed and extended, as per
Figure 2. This exercise is also known as the ‘rationalisation process’ and has been a bone of contention for environmentalists and the general public because the exercise resulted in more natural and rural land being given up for development.
The PA board is responsible for granting or refusing development-planning applications. These applications can be accessed online via the Planning Authority website (
https://www.pa.org.mt, accessed in May and June 2020).
Figure 3 shows the number of applications submitted in Malta between 1993 and 2019. This reflects the total number of development applications irrespective of whether the permits were granted, refused, or are still pending.
Between the 1980s and the 2000s, Malta experienced steady economic growth. Structural reforms before Malta’s accession to the EU in 2004 resulted in a drop in the growth rate; however, the economy recovered soon thereafter. The most evident trough in the figure is the one in 2011, which can possibly be attributed to the slowdown from the 2008 global economic recession and the tightening of environmental regulations and increased bureaucracy in the permitting system following the 2010 planning and environment authority reforms. Notwithstanding global economic crises, Malta has fared better than other EU countries mainly because of the recent reforms and the approach adopted by many companies to grow based on past savings rather than credit. The negative trend was reversed in 2013, when the economy returned to a situation similar to that of the early 1990s [
58,
59,
60]. This economic crest is linked to a growing services industry, higher numbers of tourists, population increase due to migrant workers, and growth in the construction sector [
61]. Malta’s population stood at 514,564 by the end of 2019, a 20% increase in the population since 2013 [
62].
3.2. Data Collation
This research looked at granted development-planning applications to support the analysis of urban growth in Malta. This section presents the methodology developed to identify relevant keywords from the applications’ descriptors and use them to determine which applications are denoting growth or other types of development. Growth can be either horizontal (through new developments) or vertical (through the redevelopment and intensification of uses).
In Malta, development-planning applications can be accessed online through the website of the national Planning Authority or are published in the Government Gazette. The planning applications contain the following information:
the case status, which is a description of whether the application has been granted or refused or is being processed;
the case number, a unique identifier that also includes a reference to the application year;
the development’s address;
a description of the works;
the details of the applicant and the architect;
the receipt date of the application;
the validation date by the Planning Authority;
the target date for the decision;
the application types, which are broad categories showing the main characteristics of the application (for example, full development permission, renewal of development permission, and telecommunications antennae);
the date published in the news and the expiry date for the submission of objections; and
the case category, which shows whether the application is located within the development zone or ODZ.
Development-planning applications were collated using an automated web-scraping technique implemented in Python 3. Web scraping automates the process of data compilation by copying online unstructured data and organising it into a structured form. Although the availability of an API (application programming interface) to directly query a database of development-planning applications would be ideal in terms of ease of use and data formatting, the national Planning Authority in Malta does not provide such a feature. Therefore, web scraping is the best tool available to automate the data-gathering procedure. Web scraping has been used to study different urban realities. Efthymiou and Antoniou [
63] and Boeing and Waddell [
64] scraped data in relation to rental prices in Athens and the United States, respectively. Wegmann and Jiao [
65], Ellul [
66], and Gyódi [
67] used web scraping to study urban vacation rentals on the Airbnb platform. The latter included a comparative analysis of Airbnb rentals in four European cities in relation to traditional forms of accommodation. Apart from using structured lists and platforms, like Airbnb and Craigslist, social media is another interesting data source. Ensari and Kobas [
68] collated and cleaned several layers ranging from housing properties to transport in the Kadıköy municipality, Istanbul, Turkey. These layers were extracted from publicly available sources, including platforms like the Google Places API and Instagram. Although Ensari and Kobas [
68] did not provide any analysis of the collated and geo-visualised data, they provided a methodology that can be used by other researchers and urban practitioners. All these empirical studies established methodologies to tap into unexplored data sets.
At a local level, web scraping has also been used to study the rental market and development planning. Ellul [
66] and Fearne [
69] used web-scraped data from Airbnb to analyse this form of short-term accommodation in Malta. Micallef et al. [
70] web-scraped advertised rents in Malta from public sources. Another local study focused directly on web-scraped development-planning applications, with a particular focus on the ratio of the number of granted ODZ permits to the total number of permits granted within the development zone. The ratio of ODZ permits granted close to election periods, and the instances of the Planning Authority Board permitting developments, notwithstanding the planning officers’ recommendation to refuse the issuance of permits, supports the hypothesis that land development and the institutions regulating it are used as a political mechanism by incumbent governments to garner votes during elections [
71].
The planning applications used for this study span from 1993 (the year after the first national Planning Authority was set up) to 2019. The web-scraping exercise was undertaken between May and June 2020. Therefore, the data set provides a snapshot of the situation in mid-2020. Some development-planning applications, which at the moment of scraping were still being processed, had to be excluded from the data set. Python 3 was also used to mine, clean, and organise the data. The BeautifulSoup package was used for the web-scraping exercise because of its simple API and because it is backed with documentation and online support [
72,
73]. Furthermore, the package can handle multiple page formats, including HTML and XML, even when these are ill-formatted in terms of data input, and has excellent error handling. The data were cleaned using the following Python libraries: pandas, numpy, and xlsxwriter. For example, the data-scraping method included the use of vertical bars (i.e., |) for each information component. The data-cleaning process generated a separate column for each vertical bar. Subsequently, the data were cleaned manually owing to some variations in the data structure identified between one year and another. A total of 179,888 planning applications were collated.
3.3. Data Cleaning
The final data set was further limited to those applications that were granted development consent, as identified through the case status, and those that fell under a relevant application type. A closer look at the data set has shown that there are different variations of the case status. The statuses implying the granting of planning permission were identified and used to narrow down the data set. Applications that were granted planning permission were deemed to be a proxy denoting urban growth. Hence, applications that were rejected or are still being processed were removed from the data set because these will not result in growth or, in the case of the latter, it was not clear whether they would result in growth. Applications that underwent an appeal process were also omitted because the “case status” for these applications was mixed, and it was impossible to determine which were ultimately granted planning permission, as per the examples shown below (
Table 1). Application types that were irrelevant to the study of urban growth were also omitted from the data set. For example, applications for telecommunications antennae and advertisement billboards, amongst others, were not deemed to reflect urban growth; hence, they were omitted. Six application types were deemed to be irrelevant to analyse urban growth, whilst the other 11 application types were useful to analyse urban growth, see
Table 2. Following this data-cleaning process, the data set consisted of 134,510 granted applications.
3.4. Text Mining and Categorisation
Following the data-cleaning stage, a text-mining exercise was undertaken using a knowledge discovery in databases (KDD) approach [
16]. Text mining is the next step in data mining, which aims to deliver data-driven knowledge [
74,
75]. In this study, descriptors in granted development-planning applications, written in free text, were text-mined to determine whether the particular permit resulted in urban growth or just a minor alteration/change of use. Text mining is essential in this categorisation exercise because the data set of granted applications is a large data set and cannot be classified manually (e.g., permits resulting in growth or permitting another intervention, such as internal modifications or alterations to a façade). The attribute for granted applications, ‘description of works’, was used for text mining. This description is data rich because it includes information on the proposed development. This component of development-planning applications has generally been an under-utilised resource [
16,
76]. This study sought to make better use of descriptors in development-planning applications to identify keywords implying urban growth.
The use of development-planning application descriptions has its own limitations. One of the limitations arising from using this application component is related to short and generic development-planning application descriptions [
16]. For example, descriptors simply stating that the application is seeking planning consent for ‘additions’ do not specify whether this translates into minor alterations or extensions to the development, which might later translate into growth. In this study, this term was considered as an indicator for growth.
Because planning descriptions are filled in by the project architect in free-form text, a natural language processing (NLP) package, the Natural Language Toolkit (NLTK) in Python was used to determine the most popular nouns and verbs in the ‘description of words’ [
73,
74]. Words with over 200 mentions were extracted. These popular words were reviewed and classified according to whether they could imply growth. A total of 51 keywords denoting growth were listed. These keywords included construction (noun—26,424 mentions), garages (noun—14,125 mentions), construct (verb—13,234 mentions), extension (noun—12,436 mentions), apartments (noun—9900 mentions), and erect (verb—9662 mentions). Singular nouns, like garage (noun—26,228 mentions) and apartment (noun—4425 mentions), were excluded because from the observations of the data set, they were deemed to be more likely to represent alterations to an existing building rather than propose a new development. These keywords were used to automatically categorise the data set. Before proceeding any further, a sample of granted applications was generated to manually validate the use of these keywords in determining urban growth. This iterative process ensured a higher level of accuracy.
The Cochran formula was used to find a significant sample size. (The Cochran formula is as follows: . The value of Z is determined by halving the confidence level and comparing the result to a value in a z-score table. For a 95% confidence level, the z-score is 1.96. p represents the target population. When this is not clear, a target population of 50% (0.5) is used. This gives the worst-case scenario. e represents the margin of error, whereby the result from a sample may vary by 5% (0.05)). A 95% confidence level and a margin of error of 5% were used. The formula indicated that 385 applications were required. To ascertain that any stylistic changes over the years were accounted for, an equal number of applications (i.e., 15 applications) for each year of the data set were selected randomly. This returned a total of 405 applications, slightly over the required sample size.
One-hot encoding was used to text-mine the application descriptors. One-hot encoding is a function whereby a categorical variable (in this case, specific keywords) is converted into a binary value of ‘1’ [
77,
78,
79,
80]. Hence, if a keyword was found in the application descriptor, the application was assigned a value of ‘1′. The presence of certain keywords were indicative of whether an application resulted in growth. The iterative process for validating keywords resulted in the addition of more keywords. Additionally, keywords that implied that a permit would not result in growth were recognised as well. These keywords included renewal and sanctioning applications. Applications for renewal were not considered to avoid duplicating proposals that were already granted development consent. On the other hand, sanctioning applications did not permit new developments but regularised illegalities and structures that had already been developed. The omission of these types of applications can be considered as a limitation of the study; nonetheless, the use of the same text-mining approach provides the basis for future studies related to repeat applications [
47] or the sanctioning of illegalities in development. A weighting between the different keywords was also introduced following observations of descriptors in development-planning applications.
The applications were classified into two categories: ‘growth’ and ‘other’. The ‘growth’ category included new developments, redevelopment of existing buildings, and intensification of uses. These categories were included owing to their contribution to vertical urban expansion and their role in increasing the number of residential units, among other functions and uses. The ‘other’ category included minor amendments, renewals, and sanctioning applications. The applications were categorised both manually and using the one-hot encoding function. This facilitated checking the validity of the one-hot encoding and determining which applications were classified correctly or incorrectly. In this first sample, the use of one-hot encoding returned 287 applications that were classified as growth applications, whilst the remaining 118 were linked to other forms of development. A comparison between the manual categorisation and the categorisation via the one-hot encoding function showed that in 331 cases, the automated classification returned the correct result. This is equivalent to 82% of the sample. The 18% incorrect results were analysed as a part of the iterative process for refining the keywords used in the one-hot encoding process.
The above process was repeated with another sample data set of 405 granted applications. The application descriptors were categorised manually and, subsequently, the same one-hot encoding function was applied. The manual categorisation was checked against the categorisation from the one-hot encoding exercise. A review of the granted applications that were assigned to the incorrect category resulted in the introduction of new keywords (including Maltese words because in a few instances, descriptors were written in Maltese) and a revision of the weighting that was used. This exercise resulted in four weighting categories and 84 keywords, see
Table 3. The use of these weights and keywords returned correct results in 88% of the cases, further improving the performance of the approach.
To ensure that the samples were not overfitted, a hold-out sample of 108 applications was extracted from the full data set, and final keywords (
Table 3) were reapplied to this new data set. The result returned 89% correct answers, thus further improving the reliability of the developed text-mining approach. The keywords were then applied to the full data set.
In the final part of the study, the growth development-planning permits were analysed in relation to whether they were granted within the development zone or outside it. Because development-planning applications included the ‘case’ category, it was possible to know whether a permit was issued within the development zone or ODZ. However, in the initial years of the data set, some development-planning applications’ “case categories” were inputted as “not applicable”.
In order to determine where the development-planning applications categorised as “not applicable” were located, the granted development-planning applications were merged with the planning application shapefile in GIS. The planning application boundaries and the development zone shapefiles were extracted from the PA MapServer, using the ArcGIS feature service in QGIS. The site boundary shapefile has a vector format, unlike the raster format used in studies using aerial imagery. One of the main advantages of the vector data model is that it is generally more accurate than the raster format, which is dependent on the resolution of the aerial imagery. Both the site boundaries and the web-scraped development-planning applications data included the development-planning application code as a common attribute. This made it possible to join and merge the web-scraped data with the development-planning application boundaries.
A spatial query was used to determine which granted development-planning applications fell within the development zone, which overlapped with it, and the others which fell completely outside of the development zone. Two shapefiles representing the development zones were used: the first, represented the original development boundaries set in 1988, which are also referred to as the temporary provisions scheme (TPS) and the second, is considered as the 2006 rationalisation process, whereby the development boundaries were extended (
Figure 2).
4. Results
The methodology applied in this study showed that overall, 54% of all the granted permits resulted in horizontal or vertical forms of growth. By comparing the granted permits based on whether they resulted in urban growth or other developments, it was clear that over the years, there has been a trend whereby the percentage of applications resulting in growth decreased. In 1993, 73% of the granted application descriptions implied urban growth. In 2018, only 45% of the granted applications implied urban growth. Nonetheless, over the last few years, the absolute number of development-planning applications has soared, see
Figure 4. The number of dwelling units built over the last three decades supports the observed trends shown in this figure. It has been estimated that the housing stock stood at 250,000 units in 2018, which is double the number of units in 1985 [
81]. The spike in development-planning application permits in the last few years presented in
Figure 4 corroborates the observed construction boom. Economic and population growth coupled with a relaxation in planning policies has been identified as one of the main drivers behind this boom [
82].
The increase in the number of applications related to “other” types of developments that do not result in urban growth can be attributed to multiple reasons. This increase can also be explained by an increase in awareness of the need for applying for minor developments. Furthermore, the “other” category includes sanctioning and renewal applications linked to more persons seeking to regularise illegal or irregular developments and to extend the permission of elapsed granted applications. Finally, the “other” category can also be related to gentrification processes whereby older dwellings and buildings in the village and city cores are being restored and renovated. This can be linked to greater valorisation to the settlement core areas and the government incentives to regenerate these areas. All these phenomena can be avenues for more specialised studies.
Table 4 shows the number and percentage of granted permits in relation to their zoning, extracted using the “case category in the data set. It also shows whether the application description implies growth or other types of developments. Over 86% of the granted permits were located within the development zone, see
Table 4. Over 10% were granted in the ODZ. The zoning of the remaining 3.2% was classified as “not applicable”. Most of the permit applications in the initial years did not consider the zoning of the classification. If the data from years 1993 to 1997 had to be excluded from the data set, 89% of the granted permits would have been located within the development zone, whilst 11% would have been located in the ODZ. This figure includes not only built structures that are appropriate for this zone, for example, reservoirs and greenhouses, but also other buildings, like residences. Nonetheless, this is still a high percentage considering that this is a zone with a presumption against development.
In order to determine whether the granted development-planning applications assigned a case status of “not applicable” were within, overlapped, or outside the development zone, a spatial analysis was undertaken using GIS. Granted applications between 1993 and 2005 were queried against the 1988 development boundaries, whilst applications between 2006 and 2019 were queried against the 2006 development boundaries.
Table 5 and
Figure 4 show the proportion of developments resulting in urban growth within, overlapping, and outside the development zones between 1993 and 2005 and between 2006 and 2019. The percentages of granted permits within, overlapping, and outside the development zones between 2006 and 2019 are similar to the percentages between 1993 and 2005. Nonetheless, the fact that the development boundaries have been extended means that some developments that prior to 2006 could have been considered as ODZ developments, could now be located within the development zone.
Figure 5 presents urban growth permits within, overlapping, and outside the development zone between the years 1993 and 2018, with percentage distribution for each category. Although the number of applications submitted and granted have varied, the percentage share of permits leading to growth, according to their location within, overlapping, and outside the development zone, have been stable. The 2019 applications were omitted because many applications were still being processed and were awaiting a planning decision when the data were scraped.
The results show that a consistently higher percentage of granted applications are located within the development zone. Using the “case status”, it was observed that 10.7% of the granted applications are located in the ODZ. The year with the highest share of granted ODZ permits implying growth, was 2004, with a share of 13.1%, whilst the lowest share was in 1999, with a 7.5% share. If one had to look at the actual numbers, though, the year with the highest number of permitted developments was 2018, with 472 ODZ permits. The year with the lowest number of permitted developments resulting in growth was 2011, with just 58 ODZ permits. These results demonstrate a need for further reflection on and analysis of the granting of ODZ applications and a much deeper understanding and discussion on the impact of the ODZ designation in Malta’s planning system. It is clear that although the original objective of the ODZ was to safeguard the rural areas of Malta, there is considerable pressure to extend development within this area both because of the cheaper land prices and because of the attractiveness of this area away from the development zone [
71].
5. Discussion
This study has a few limitations. As explained earlier, applications that went through an appeal process could not be considered because their “case status” included applications that were ultimately rejected as well. Hence, more permissions were given planning consent than the figure for granted planning applications shown in this study. Methodological limitations included the presence of short and generic application descriptions, misspelt keywords, and the omission of renewal and sanctioning applications from the data set. Another limitation is that even though an application has been granted planning permission, the developer can still opt not to make use of that granted permit and proceed with the construction development. Notwithstanding these limitations, the findings of this study remain relevant to shed light on urban growth within the island context.
The relationship between the keywords and growth had to be manually encoded. A second set of keywords was identified following a review of the misclassified instances. These tasks imply that the process for building the classification model is not fully automatable. Therefore, whenever the method is applied to a different corpus, for example, a different language or a different use of terminology, some element of manual refinement is required. Even though this methodological approach has limited generalizability, one of its strengths is the high degree of accuracy that was attained. The final one-hot encoding function used to text-mine the planning descriptors was tested on a smaller third sample. The use of this sample showed that the one-hot encoding method developed in this study returned an accuracy level of 89%. Other studies have had lower levels of accuracy due to the limitations of text-mining free-form text [
76]. Hence, this study has succeeded in developing a method for analysing urban growth through the text-mining of unstructured, non-aggregate planning application data similar to the method developed by Lai and Ho [
38,
39]. This method has the potential for aiding the understanding of particular phenomena in urban growth within planning and development.
Apart from the methodological contributions of this paper, a few observations can be drawn from the initial results of the study. The first observation is that the number of development-planning applications plummeted during the same periods of economic slowdown. For example, the 2011 slump coincided with an economic recession. This might suggest that economic cycles could influence the number of development-planning applications and, subsequently, growth on the islands. This could be an area for further studies, similar to the studies by Romero et al. [
83], Strauss [
84], Gounaridis et al. [
85], and Cecchini et al. [
13]. From 2013 onward, the number of planning applications increased steadily. This coincided with a change in government and the adoption of new development policies [
82,
86]. The new development policies include a revision in the floor heights to increase the number of allowable additional floors and a revision of the rural policy amongst other changes. Additionally, Malta has continued to attract foreign workers. This change in policy can be attributed to a construction boom resulting in a steep increase in the number of planning applications and granted permits.
The redevelopment of existing developed sites can present another area for future studies. Official statistics have shown that the number of dwelling units permitted on sites with no other existing developments has decreased consistently between 2008 and 2015 (with the exception of 2015) [
87]. Furthermore, if one had to look at the ratio of the number of dwelling units located on new sites to the number of dwelling units on redeveloped sites, it is clear that there has been an increase in the number of dwelling units on developed sites. In 2008, 51% of all new dwelling units were on new sites, whilst in 2015, only 35% of the new dwelling units were on these sites. This suggests an increase in redevelopment and intensification of use.
Finally, the percentage of growth permits granted in relation to their zoning remained similar throughout the studied time period. Nonetheless, the number of granted applications resulting in growth has continued increasing considerably over the last few years. This is important because there is a lot of attention focused on what is happening in the ODZ [
88]. Future studies could look into specific zoning plans and policies regulating development in this zone. Development permit applications can be useful in studying the effectiveness of the ODZ designation and assessing whether this zone is fulfilling its
raison d’être in conserving rural areas or has become a transitional zone for development [
40]. Furthermore, the text-mining approach could also be used to undertake specific studies related to particular forms of development being granted in this zone.
6. Conclusions
This research aimed at studying urban growth using development-planning application data for the Maltese islands. The study successfully determined keywords by data-mining descriptors from granted development-planning applications and identified applications denoting growth, achieving a high level of accuracy in the process. Growth was also studied in relation to zoning.
The granted applications that implied growth have shown that the construction industry is closely linked to the islands’ economic cycles and changes in population. Although the number of these applications increased considerably in the last construction boom (post 2013), the numbers of other forms of permits, such as renewal and sanctioning applications, have increased as well. There has also been a stable trend in the percentage share of applications granted within the development zone and the ODZ. Notwithstanding this stable share in granted permits, the number of ODZ applications granted in 2017 and 2018 reached an all-time high, adding further pressure on the limited land resources of the islands. Urban growth during this period coincided with a period of population growth and changes in planning policies that resulted in increases in the allowable heights and a construction boom. The high number of ODZ applications suggests that the area is still vulnerable to urban sprawl. This reality can provide an area for future studies, whereby developments happening outside the development zone are analysed and measures to increase the effectivity of the ODZ designation are improved if necessary.
The study has also provided several methodological innovations. It has shown how vector-format data can be used in the study of urban growth as an alternative to the more popular raster aerial imagery. Additionally, it has integrated a text-mining approach to determine and understand urban growth. This same text-mining approach could be applied to study other phenomena, for example, renewed applications; the timings of repeat applications; rejected applications; specific types of developments, such as offices and tourist accommodations; and different development features, such as swimming pools. Hence, the methodology that has been developed in this paper can be replicated to study various aspects of development. Furthermore, the approach can be used to analyse development over specific time periods.
The study recommends more standardisation of descriptors in development-planning applications because this would improve transparency and provide a more accurate analytical platform for studying the sustainability of urban growth and development vis-à-vis the land management and adequacy of current policies in protecting the environment. The research has also created a rich data set that for the first time, can support a better understanding of patterns of urban growth on the islands. Further research will look at determining the drivers of urban growth and possibly enable the projection of future trajectories of growth.


