Article

Study on the Crop Suitability and Planting Structure Optimization in Typical Grain Production Areas under the Influence of Human Activities and Climate Change: A Case Study of the Naoli River Basin in Northeast China

1
Center for China Western Modernization, Guizhou University of Finance and Economics, Guiyang 550025, China
2
College of Big Data Application and Economic, Guizhou University of Finance and Economics, Guiyang 550025, China
3
School of Water Conservancy & Civil Engineering, Northeast Agricultural University, Harbin 150030, China
*
Authors to whom correspondence should be addressed.
Sustainability 2023, 15(22), 16090; https://doi.org/10.3390/su152216090
Submission received: 19 October 2023 / Revised: 10 November 2023 / Accepted: 17 November 2023 / Published: 19 November 2023

Abstract

:
Optimizing crop planting structures under the influence of climate change and human activities is crucial for sustainable food production and global food security. Taking the Naoli River Basin in Northeast China as a case area, a machine learning model based on maximum entropy was used to explore the suitability distribution of crops under the influence of both environmental factors and human activities. The optimized planting structure strategies were tested in combination with future climate change. The results show that considering human activities can more accurately simulate crop suitability than considering only natural environmental factors. The suitable planting areas for maize, rice, and soybeans are 18,553.54 km2, 10,335.98 km2, and 5844.80 km2, respectively. Highly adapted areas for major crops are concentrated in the plain areas of the middle reaches of the river basin, rather than in populated areas, and there are overlaps among the suitable planting areas for each crop. The optimal crop distribution for the planting structure is to plant rice in the hydrophilic areas of the plain hinterland, soybeans in the plain hinterland farther from the water source, and corn in the peripheral plains and gently sloping mountainous areas. Human activities exerted a strong influence on the potential scatter of soybeans, while climate change had the most significant implications for maize. Future climate change may reduce the area of suitable crop zones, posing challenges to regional food production. It is necessary to reflect on how to rationally balance soil and water resources, as well as how to cope with climate change in the future.

1. Introduction

In the face of global climate change, increasing occurrences of extreme weather events, and the emergence of global socioeconomic crises, food security has emerged as a pressing global concern with profound implications for the development of human civilization [1]. The intersection of human activities and climate change has a dual impact on food production, and one of the central challenges facing agriculture in adapting to these changing environmental conditions is the need to optimize crop planting structures [2]. Investigating crop distribution is a fundamental step towards establishing scientifically informed planting layouts, playing a pivotal role in addressing the uncertainties in food production under shifting environmental conditions [2]. Consequently, a thorough examination of the suitability of food crops under the influence of climate change and human activities, as well as the development of optimized crop planting structures, is of paramount importance. This not only holds sway over the income of farmers and regional economic development, but also exerts a profound influence on the sustainable supply of global food [3].
China, as one of the most populous countries in the world, faces the profound impacts of food security on its economic development and social stability [4]. Currently, China’s food production relies heavily on agriculture and environmental conditions, with the planting structure and yield fluctuations of food crops deeply intertwined with natural variables [5,6]. Simultaneously, human activities, such as the choice to cultivate rice or drought-resistant crops based on proximity to water sources, also impact crop planting patterns [7]. In summary, the configuration of crop planting is the result of multiple factors, encompassing climate change, topographical characteristics, and socioeconomic influences [8].
Agriculture stands as an acutely climate-sensitive endeavor [9]. Climatic conditions strongly affect how crops are planted, as well as their yields, quality, and the overall farming systems. Studying the suitability of crops under different climates is crucial for regional agricultural planning and ensuring food security. Currently, global warming has created significant challenges for crop cultivation [10,11]. For instance, climate change has extended the cultivation range of crops towards higher latitudes. Several studies have shown how historical climate shifts have reshaped planting structures [12], potential yields [13], and the broader agroecosystems for crops [14]. These ramifications are poised to exert far-reaching consequences on regional food security in the face of complex and evolving future climates. Therefore, in addition to examining the impact of the current climate on crop planting structures, investigating suitability zoning for crop cultivation under future climate scenarios is becoming increasingly imperative for informed planning.
Moreover, excessive and ill-advised human activities, such as the conversion of arable land into construction sites, afforestation on cultivated land, transformations between paddy fields and drylands, and shifts from staple crops to cash crops, have all amplified the uncertainties surrounding food production. These activities raise concerns about the stability of food security [15,16,17]. Thus, it is crucial to recognize the impact of human activities on crop arrangements. An exploration of the sensitivity of human activity factors in relation to food crops is also of practical importance in preserving and enhancing food production.
In recent years, scholars have conducted extensive research on crop zoning, with a focus on the impacts of climate change and human activities. For instance, Hao et al. [18] employed ecological niche models based on climate and soil conditions to analyze crop suitability in the Heihe River Basin oasis, coupled with cross-entropy multi-objective models to assess planting structures. Feng et al. [1] examined the suitability and dynamic shifts in global soybean cultivation under future climate scenarios. However, crop suitability hinges not solely on climate variables but is influenced by topography, soil composition, and the manifold effects of human activities. These multidimensional factors, subject to alteration in changing environments, collectively shape crops’ growth and development and assume dynamic roles as indicators of crop environments [19]. Current research, however, tends to predominantly consider single environmental factors and, in some instances, solely climate-related factors, thereby limiting the practical relevance of these studies to diverse planting structures [20].
Ecological niche models have gained traction in species zoning research, with the maximum entropy (MaxEnt) model standing out as a prominent ecological niche model known for its prowess in species prediction [21]. This model operates on the principle that “when entropy is maximized, the representation is closest to the true state” [22]. MaxEnt is capable of accommodating climate change and socioeconomic conditions concurrently. Through data transformation, it enables the detection of potential crop distribution at a grid-scale resolution [19]. So far, the model has found applications in mapping the distribution of crops such as potatoes, maize, and rice [23,24,25]. However, previous research has primarily focused on climate conditions, without comprehensive consideration of environmental variables and human activities. Additionally, there has been limited exploration of the analysis of shifts in crop distribution under future climate scenarios. Furthermore, existing research has often confined itself to the study of individual crop species, while in practice, cross-adaptations and overlaps exist in the suitability of crop cultivation at grid-scale levels [19,26].
The Naoli River Basin, situated in Northeast China’s Sanjiang Plain, stands as a critical hub for commodity grain production, playing a pivotal role in upholding China’s food security [27,28]. Over the past four decades, owing to shifts in the grain market and policy dynamics, the region’s grain production structure has undergone multiple adjustments. The land use and crop planting structure have been continuously changing, eventually leading to a distribution of crop planting dominated by corn, rice, and soybeans. In recent years, frequent human activities and global climate change have led to issues such as wetland degradation and water scarcity in the basin, resulting in the shrinking of water and soil resources [27]. This has posed potential food security risks to the local region and the country.
Based on the analysis of the relevant literature, it is evident that the cropping structure in the Naoli River Basin has undergone continuous changes over the years, resulting in potential risks to soil and water resources. Both climate change and human activities have played a role in influencing the land’s suitability for crop cultivation, which, in turn, has the potential to alter the existing planting patterns. The investigation into the suitability of regional land and the subsequent optimization of the planting structure serve as fundamental steps in ensuring regional food security and safeguarding the integrity of soil and water resources.
The goal of this study is to explore the impacts of climate change and human activities on crop suitability within the Naoli River Basin. This exploration will inform the development of strategies for optimizing the planting structure, a critical component in enhancing regional food security. This study can provide valuable input for decision-making processes in the region concerning agricultural practices, resource allocation, and climate adaptation efforts. It will contribute to the more effective and sustainable production of food in the Naoli River Basin and similar regions worldwide. The MaxEnt model was employed to complete this research. The main approach was as follows: (1) Analyze the pivotal factors and threshold characteristics that shape the suitability distribution of major crops in the Naoli River Basin. (2) Determine the suitability levels and spatial distribution of various crops within the watershed. (3) Propose optimized planting structures based on maximizing the suitability for different crops. (4) Investigate the potential effects of future climate change on the configuration of planting structures.
The potential innovation of this study lies in its comprehensive consideration of the dual impacts of human activities and future climate change on land suitability. It also offers more comprehensive recommendations for land development. Furthermore, this study expands the analysis from assessing suitable regions for individual crops’ cultivation to evaluating suitable distribution patterns for multiple crop planting structures. This is achieved through the division and comparison of regions suitable for paddy fields, drylands, and regional suitability levels, which aid in determining the optimal approach and adjustment strategy for planting structures. Lastly, this article delves into the food security challenges that multiple crops may face under the influence of future climate scenarios, using prediction models.

2. Materials and Methods
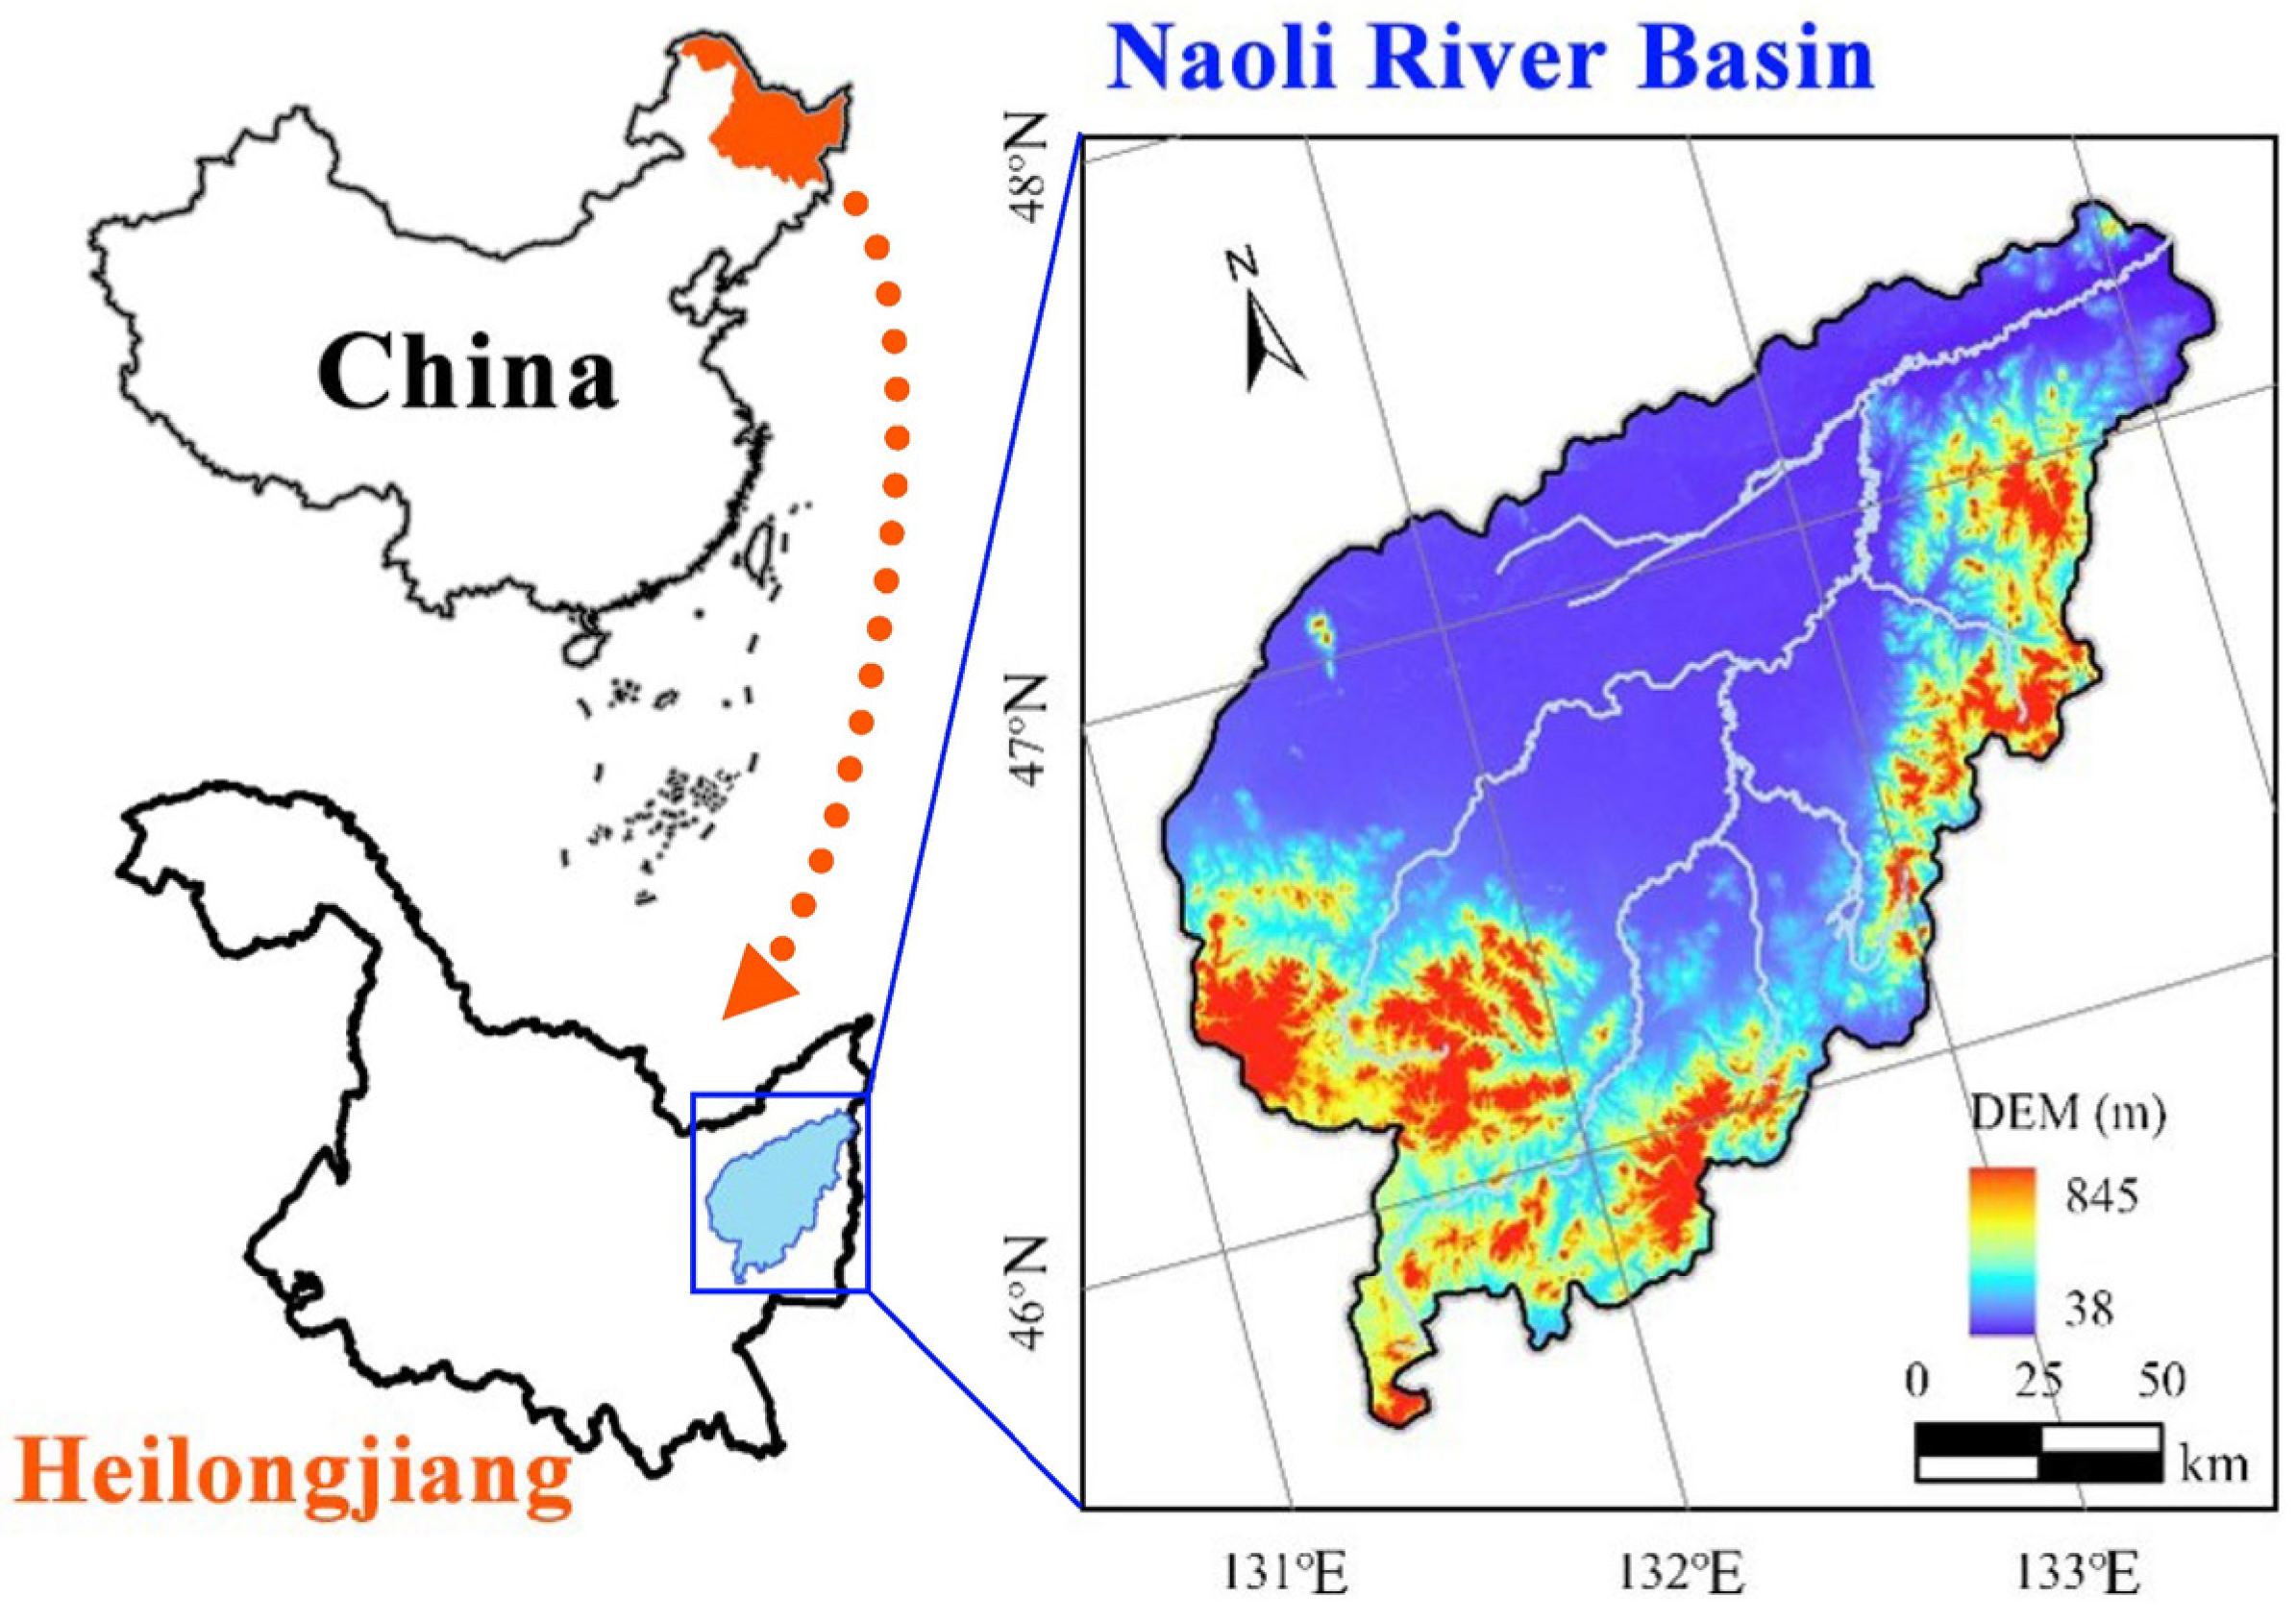
2.1. Study Area

The Naoli River Basin (45°43′~47°35′ N, 131°31′~134°10′ E) is located in Heilongjiang Province, Northeast China, with a total area of about 26,480.25 km2 and an average elevation of 60 m (Figure 1). This region experiences a continental monsoon climate that is both semi-humid and semi-arid. January and July see average temperatures of −21.6 °C and 21.6 °C, respectively. The average annual rainfall is 565 mm, with an average evaporation rate of 542.4 mm. The extensive floodplain in the area is conducive to the formation of wetlands due to its low terrain and little surface runoff.
The Naoli River Basin is a significant commodity grain base and a typical region of large-scale marsh wetlands. Unfortunately, the wetland area in the basin has been shrinking on a large scale since the 1950s, leading to a decline in wetland ecological functions. Additionally, precipitation has decreased by approximately 180 mm in recent years, which is twice the reduction rate in the Russian Far East region.

2.2. Framework

We developed a research framework based on the MaxEnt model to investigate the impacts of multidimensional environmental variables on crop suitability in the Naoli River Basin and optimize crop planting structures. We used distribution data for maize, rice, and soybeans in the Naoli River Basin as training and validation sets and collected multidimensional data, including meteorology, ecology, hydrology, soil, topography, land use, and socioeconomics. We selected factors related to crops’ growth and development and unified them in the same spatial resolution and coordinate system. Using the MaxEnt model, we simulated crop suitability in the Naoli River Basin and determined the relative influence of contributing factors, dominant factors, and their suitability distribution. We conducted cross-grid comparisons of major crops in terms of suitability and identified crops or crop combinations with the highest suitability on a spatial grid level. We proposed an optimal distribution strategy for the basin’s planting structure. Finally, we explored the characteristics of crop suitability and layout recommendations in the Naoli River Basin under different climate models by combining future climate change data. Figure 2 illustrates the framework of our study.

2.3. Data Source

2.3.1. Crops’ Spatial Information

The area of food crops (maize, rice, and soybeans) in the Naoli River Basin accounted for 56.37% of the basin area in 2021. Among these food crops, the proportions of maize, rice, and soybeans were 37.09%, 45.12%, and 17.79%, respectively. The geographic distribution information of the crop planting areas was obtained from the Crop Growth and Development Database of the China National Meteorological Information Center. The location information of the crops’ distribution was collected through basin monitoring of high-yield areas over the years (Figure 2). To facilitate analysis, the spatial distribution data for various crops were transformed into CSV format and used as the training and testing datasets.

2.3.2. Variables and Sources

  • Environmental variables
In this study, environmental variables mainly refer to climate, topography, soil, and other characteristics that affect crop growth. Climate is a crucial environmental variable for crop growth, and climate conditions form the foundation of grain production. The study of climate suitability zoning has been a focus of agricultural and land science research for many years [23]. Additionally, ecological conditions such as topography, vegetation, and soil also impact crop growth. Compared to climate conditions, ecological background conditions like topography and soil have remained relatively stable over the years [29]. While the regional distribution and growth characteristics of crops vary, precipitation, temperature, soil, topography, and other environmental factors are key factors affecting crop production. Although different crops have different optimal conditions, the environmental variables that impact their changes have similarities [30].
This study refers to related research [19,31,32] and utilizes the bioclimatic variables provided by the WorldClim dataset (https://www.worldclim.org/, accessed on 1 October 2023) to characterize climatic influencing factors. These variables represent crucial climatic factors that impact crop growth and are commonly used to assess crop conditions and population distribution [19]. The bioclimatic variables consist of 19 bioclimatic variables (BIO1-BIO19) and data on sunshine duration, which affect crop growth (Table 1). Basin climate data were generated using interpolation methods based on the climate dataset from 2000 to 2021 provided by the China National Meteorological Data Center (NMSDC) (http://data.cma.cn/, accessed on 1 October 2023). Topographic data, including altitude, slope, aspect, etc., were obtained from DEM data provided by the Resource and Environmental Science and Data Center (RESDC) (http://www.resdc.cn/, accessed on 1 October 2023). The study found a significant correlation between the normalized difference vegetation index (NDVI) and land quality, as well as fertilizer application [33]. The NDVI was extracted from the MOD13Q1 product of MODIS and calculated on the Google Earth Engine (GEE) platform. Additionally, evapotranspiration data, which characterize crops’ water consumption and the basin’s ecological water demand, were based on the MOD16 product and obtained on the GEE platform. The Cold and Arid Region Scientific Data Center (CARSDC) (http://westdc.westgis.ac.cn/, accessed on 1 October 2023) provided a wealth of measured and assimilated simulation data, including organic contents, soil particle status, soil’s physical and chemical properties, etc. The RESDC provided soil distribution data such as soil type and soil erosion.
2.
Human activities
Human activities have a significant impact on agricultural production, including factors such as irrigation, material transportation, and farmland accessibility [34]. Additionally, economic benefits and food prices can influence planting choices and farmers’ behavior [35]. Ignoring the role of human activities in crop suitability evaluations can result in inaccurate results. Therefore, it is crucial to consider both environmental factors and human activity factors when assessing crop suitability [36].
Previous studies have often included social and economic data related to human activities, such as per capita GDP, population density, and transportation networks [19]. However, in the grain-producing areas of Northeast China, the income from purchases made by state-owned grain companies is not included in regional GDP statistics. The grain produced in this area is primarily used as a commodity to supply other regions of China, with a smaller proportion consumed locally. Additionally, the agricultural production scale and mechanization are highly developed in the study area, resulting in lower labor demand. As a result, the main human activities that affect planting include the impact of water conservancy projects and farming convenience. Factors such as the distance from water bodies (e.g., rivers, canals, and reservoirs), the distribution density of residential areas, and road accessibility are considered to reflect the choice of irrigation methods, farming convenience, and transportation efficiency from an economic perspective. The vector information for these factors was obtained from field measurements, local water resources departments, transportation departments, and website of Geographic Data Sharing Infrastructure, College of Urban and Environmental Science, Peking University (https://geodata.pku.edu.cn/, accessed on 1 October 2023). Furthermore, per capita GDP, reflecting economic development, and population density, reflecting labor input and food demand, were also considered to validate the hypothesis.
3.
Future climate variables
In recent years, climate change has become increasingly severe. To assess suitability more reasonably, we added suitability estimates under future climate change conditions. The estimation was based on 2021 planting data and environmental variables, combined with bioclimatic variables under future climate change for prediction. The study used the CMIP6 implemented by the WCRP [37]. To provide researchers with more climate model references, CMIP6 upgraded RCP2.6, RCP4.5, RCP6.0, and RCP8.5 to SSP1-2.6, SSP2-4.5, SSP4-6.0, and SSP5-8.5, respectively, and added new emission patterns: SSP1-1.9, SSP4-3.4, SSP5-3.4, and SSP3-7.0. The SSP scenarios are a set of new emission scenarios driven by different socioeconomic models, which replace the four RCPs in CMIP5 and are an important upgrade of CMIP6’s scenarios [38].
While the radiative forcing projected by the new scenarios in CMIP6 is comparable to that of the RCPs in CMIP5, there are variations in emission trajectories and mixed emission paths. This divergence primarily arises from the fact that the new SSP scenarios starts their projections in 2014, whereas the RCPs initiate theirs in 2007 [39]. This study selected future climate scenarios generated by the medium-resolution climate model BCC-CSM2-MR [40] provided by the National Climate Center of China (Beijing, China), provided by WorldClim. BCC-CSM2-MR has higher resolution in the atmosphere and land surface, along with a more detailed description of the terrain, making it better at simulating terrain precipitation and local temperature distribution [40]. Four emission scenarios, SSP1-2.6, SSP2-4.5, SSP3-7.0, and SSP5-8.5, were selected to represent the four most typical scenarios, from low-emission sustainable development to high-emission conventional development [40]. The period of predicted values selected for analysis was 2021–2040.
4.
Data processing
In light of the preceding analysis and prior research findings [19,31,32], a variable dataset that may affect the growth and production of food crops was selected, as shown in Table 1. All of the data were transformed into spatial grids with 1 km2 resolution in the same coordinate system. The format of each variable was converted to ASCII.

2.4. Simulation and Prediction by MaxEnt

2.4.1. Model Mechanism

The maximum entropy principle is a technique for approximating an unknown probability distribution [41]. It requires us to choose a probability distribution with maximum entropy subject to any known constraints on the distribution. This approach can avoid making assumptions about unknown information and is therefore useful for inference. In this context, the probability distribution of interest, denoted as p, is defined over a finite set X, which will later be interpreted as the set of pixels in the study area. The individual elements of X are denoted as points, and the distribution p assigns a non-negative probability p(x) to each point x, ensuring that the sum of these probabilities equals 1.
H ( p ) = x X p ( x ) / ln p ( x )
where the entropy H(p) is a measure of the amount of choice involved in selecting an event. The maximum entropy principle mandates the selection of a probability distribution that has the highest entropy while adhering to any established constraints on the distribution.
The maximum entropy machine learning model extends the maximum entropy principle [41] to establish precise probability distributions by studying the connections between samples and environmental variables [42]. This model is capable of depicting the nonlinear relationship between input and prediction, requiring the inclusion of all relevant indicators. Multidimensional data from diverse sources are used to mitigate risks from various viewpoints and conditions [43,44]. By ensuring the accuracy of the concentration trend while relaxing the fault tolerance standard, we can obtain more useful information [45]. The maximum entropy theory, which states that systems seek maximum freedom within constraints and without external forces, underpins this approach. Maximum entropy statistical modeling is utilized, selecting the distribution with the highest entropy among those that meet the specified conditions, serving as the optimal distribution.
To forecast the distribution of maize, rice, and soybeans, the MaxEnt model was used in this study. This model uses constraints to represent the relationships between input features and categories and selects the probability distribution with the maximum entropy principle. The geographic coordinates of food crops serve as input features, while environmental and human activity factors are used as constraints to represent the probability of food crops occurring under different environmental conditions.
The MaxEnt model was utilized to simulate the suitability of crops in the watershed by training on known crop distribution points and natural–artificial environmental variable data. The model maximized the entropy of the crop suitability distribution by calculating the weighted correlation between each environmental variable and crop distribution, resulting in a crop suitability map. The adaptive mapping relationship was constructed based on the training dataset and tested using testing data, which were comprehensively evaluated by comparing them with actual values. Under a reasonable mapping model, the predicted results were displayed on a 1 km spatial grid scale. By overlaying the spatial data of different environmental conditions, the suitability levels of different crops in different regions of the river basin were obtained. Finally, by integrating the suitability maps of maize, rice, and soybeans, an optimal strategy for optimizing the planting structure was determined.

2.4.2. Model Evaluation

To evaluate the model, the AUC (area under the curve) value of the receiver operating characteristic (ROC) curve was used to measure the prediction accuracy. An AUC greater than 0.7 is considered to be reliable, while an AUC greater than 0.8 indicates high prediction accuracy. In the suitability evaluation, 75% of randomly selected sample points are used as the training set to build the model, while the remaining 25% are used as the test set for validation. The factors are diagnosed through a multicollinearity test, and inconsistent factors are removed [46].
The MaxEnt model runs for two rounds. In the first round, important variables are selected through 100 iterations. It is commonly held that when the cumulative contribution of the feature values reaches 80%, subsequent factors will not accumulate if their contribution rate is less than 5%. In the second round, based on the dominant factor indicators, the crop suitability is calculated at the grid level, and the impact of each dominant factor is studied. Similarly, 100 iterations are performed, and the classification results with high AUC values are extracted.

2.4.3. Existence Probability and Crop Layout Optimization

The simulations and predictions from the MaxEnt model are represented as grid data, with each grid cell indicating the probability of the crops’ existence, ranging from 0 to 1. Using a reclassification method and selecting an appropriate threshold for the probability of existence, the suitability zoning for different crop planting areas in the watershed can be determined. Based on the IPCC’s report on likelihood assessment methods [24] and studies of the adjacent basin [19], the land suitability for crops in the Naoli River Basin was divided into four levels: unsuitable, low suitability, moderate suitability, and high suitability. These levels correspond to value ranges of [0, 0.05], (0.05, 0.33], (0.33, 0.66], and (0.66, 1], respectively. By analyzing the existence probability of the three types of crops at the grid level, an overlay analysis was conducted to optimize the cropping structure layout for different crops.

3. Results

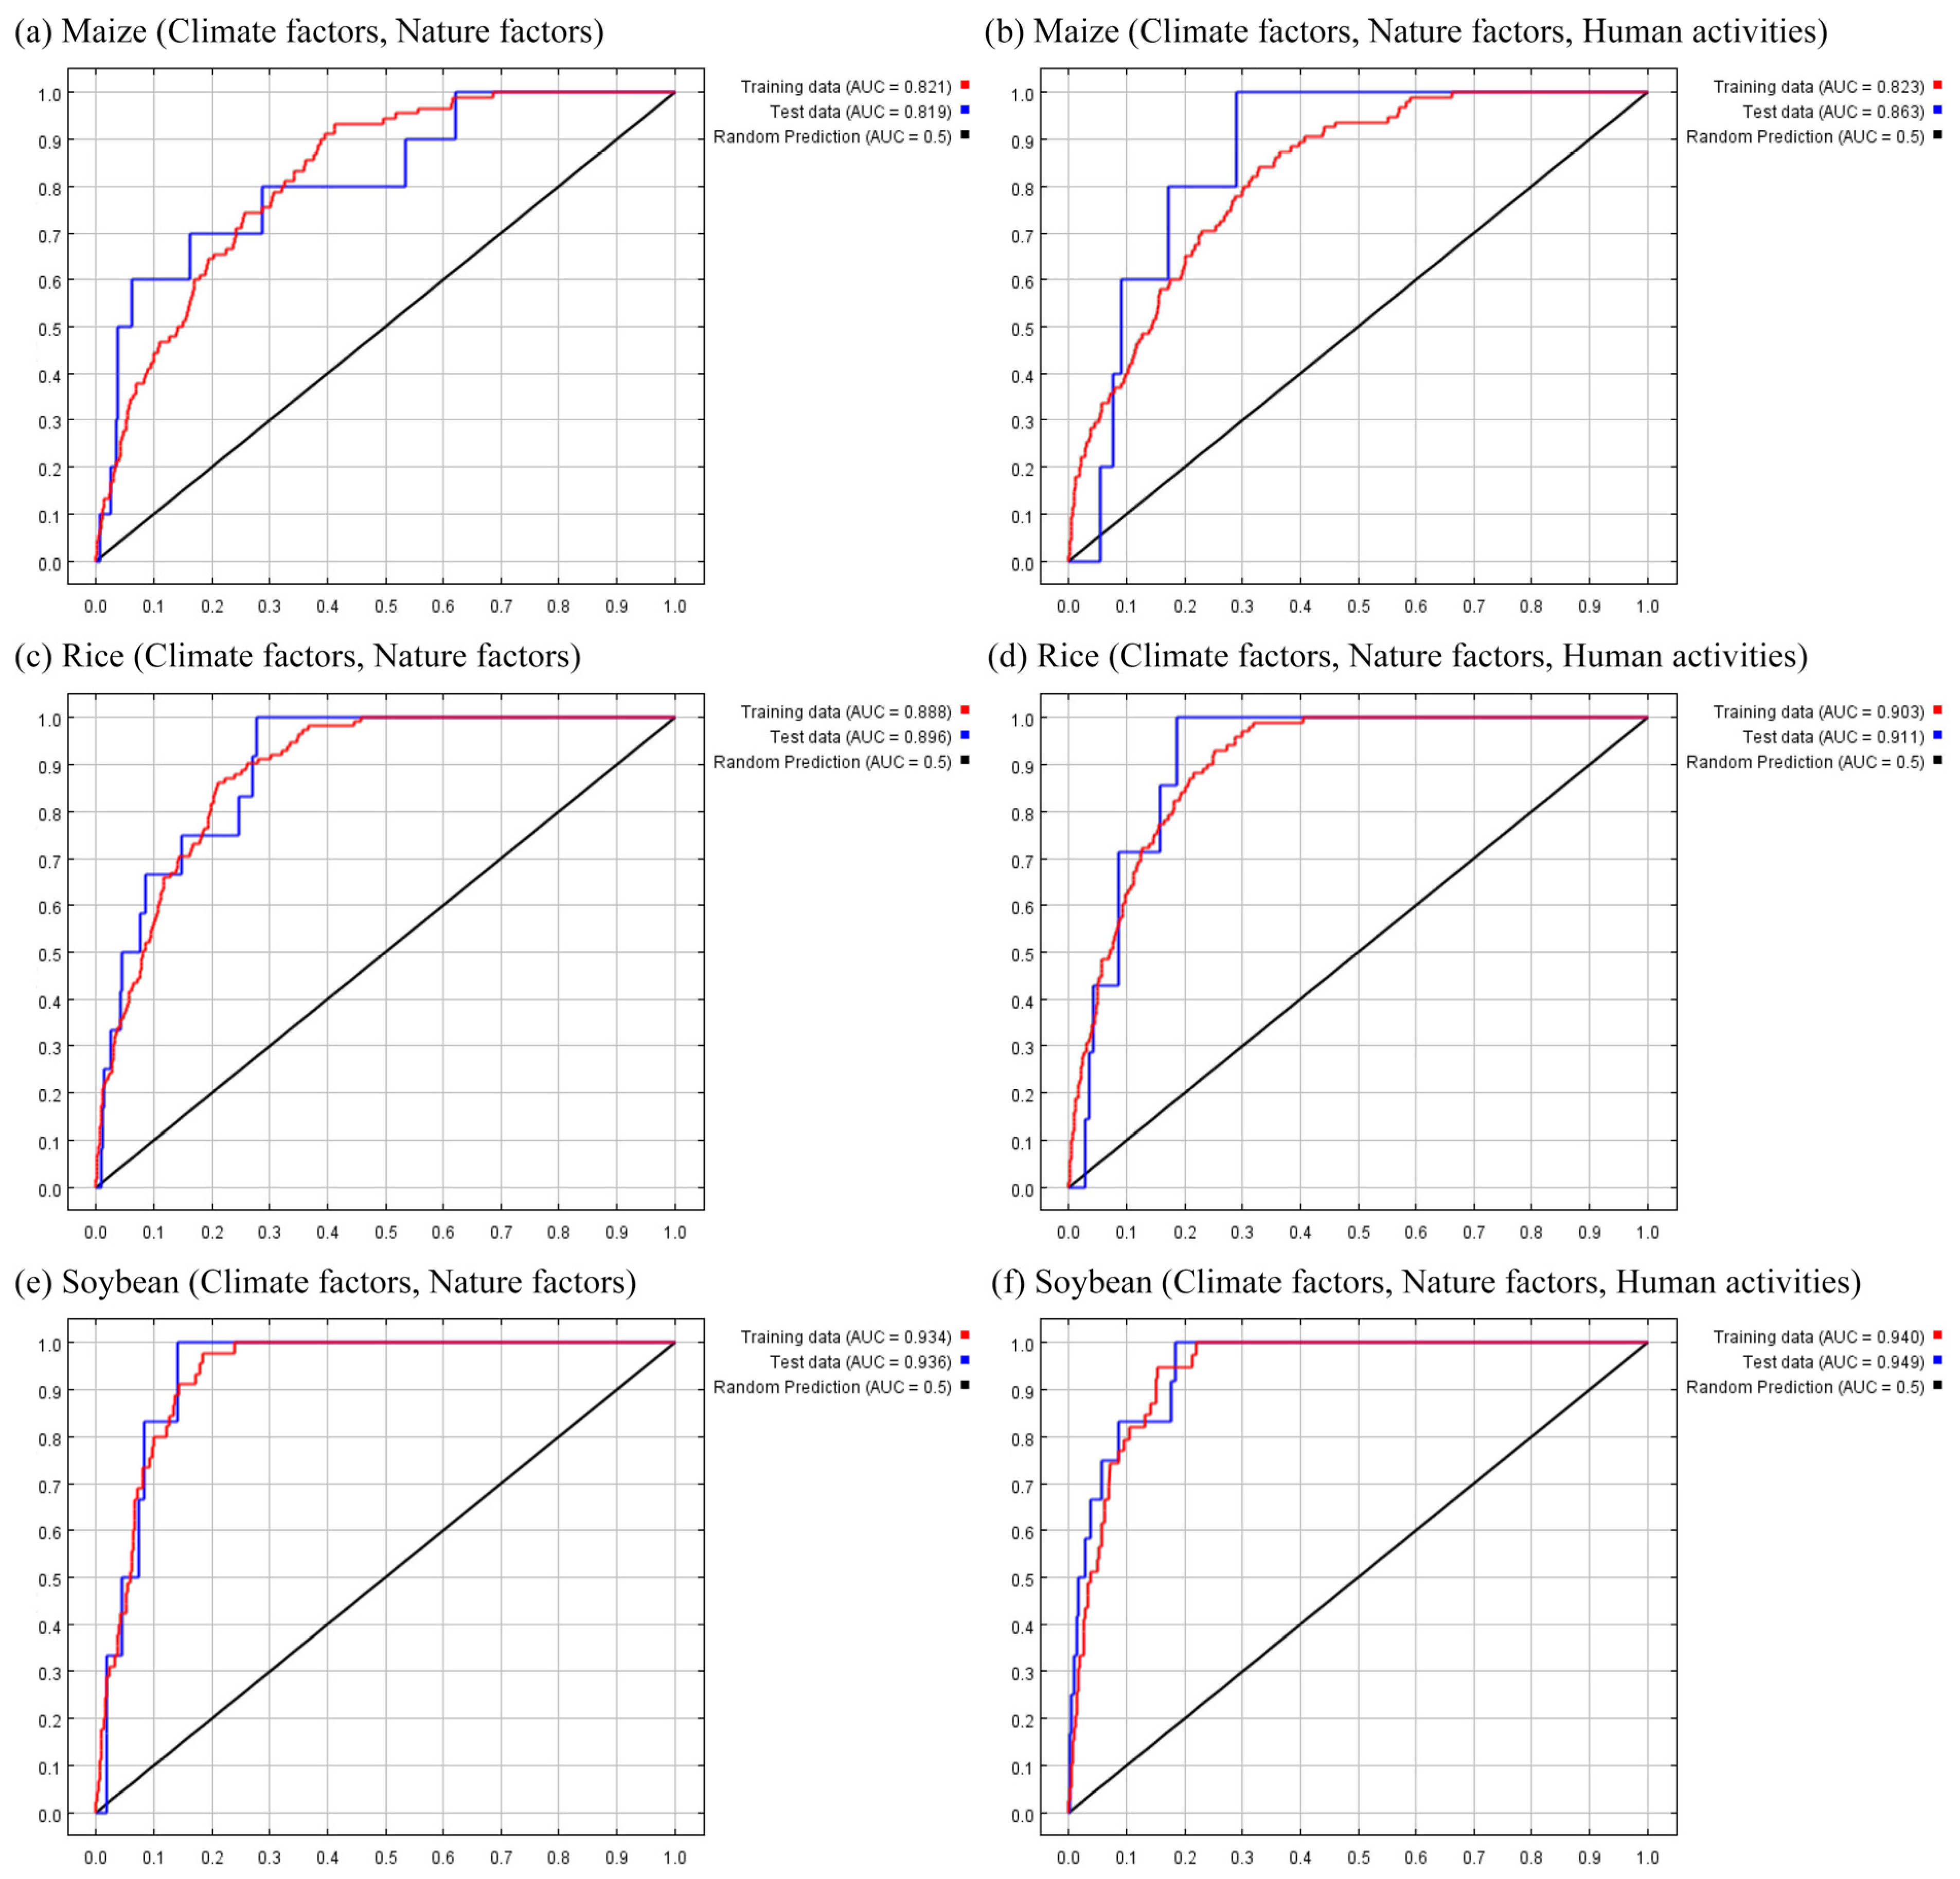
3.1. Model Evaluation

The MaxEnt model was used to calculate the suitability of maize, rice, and soybeans under the influence of natural and manmade environmental variables. The accuracy of the model’s simulations was validated through ROC curves, with the AUC value representing the accuracy (Figure 3). The training and test AUC values were all above 0.8 for maize, rice, and soybeans, with rice and soybeans having AUC values greater than 0.9. Soybeans had the highest simulation accuracy. The MaxEnt simulation had high accuracy and effectively reflected the suitable distribution of crops under the influence of environmental variables and human activities.
When comparing predictions using only comprehensive environmental variables (i.e., climate factors and nature factors) and adding human activities, it was found that the predictions with human activities had higher accuracy than those using only environmental variables. However, overall, all of the prediction simulations had good accuracy, with AUC values greater than 0.8.

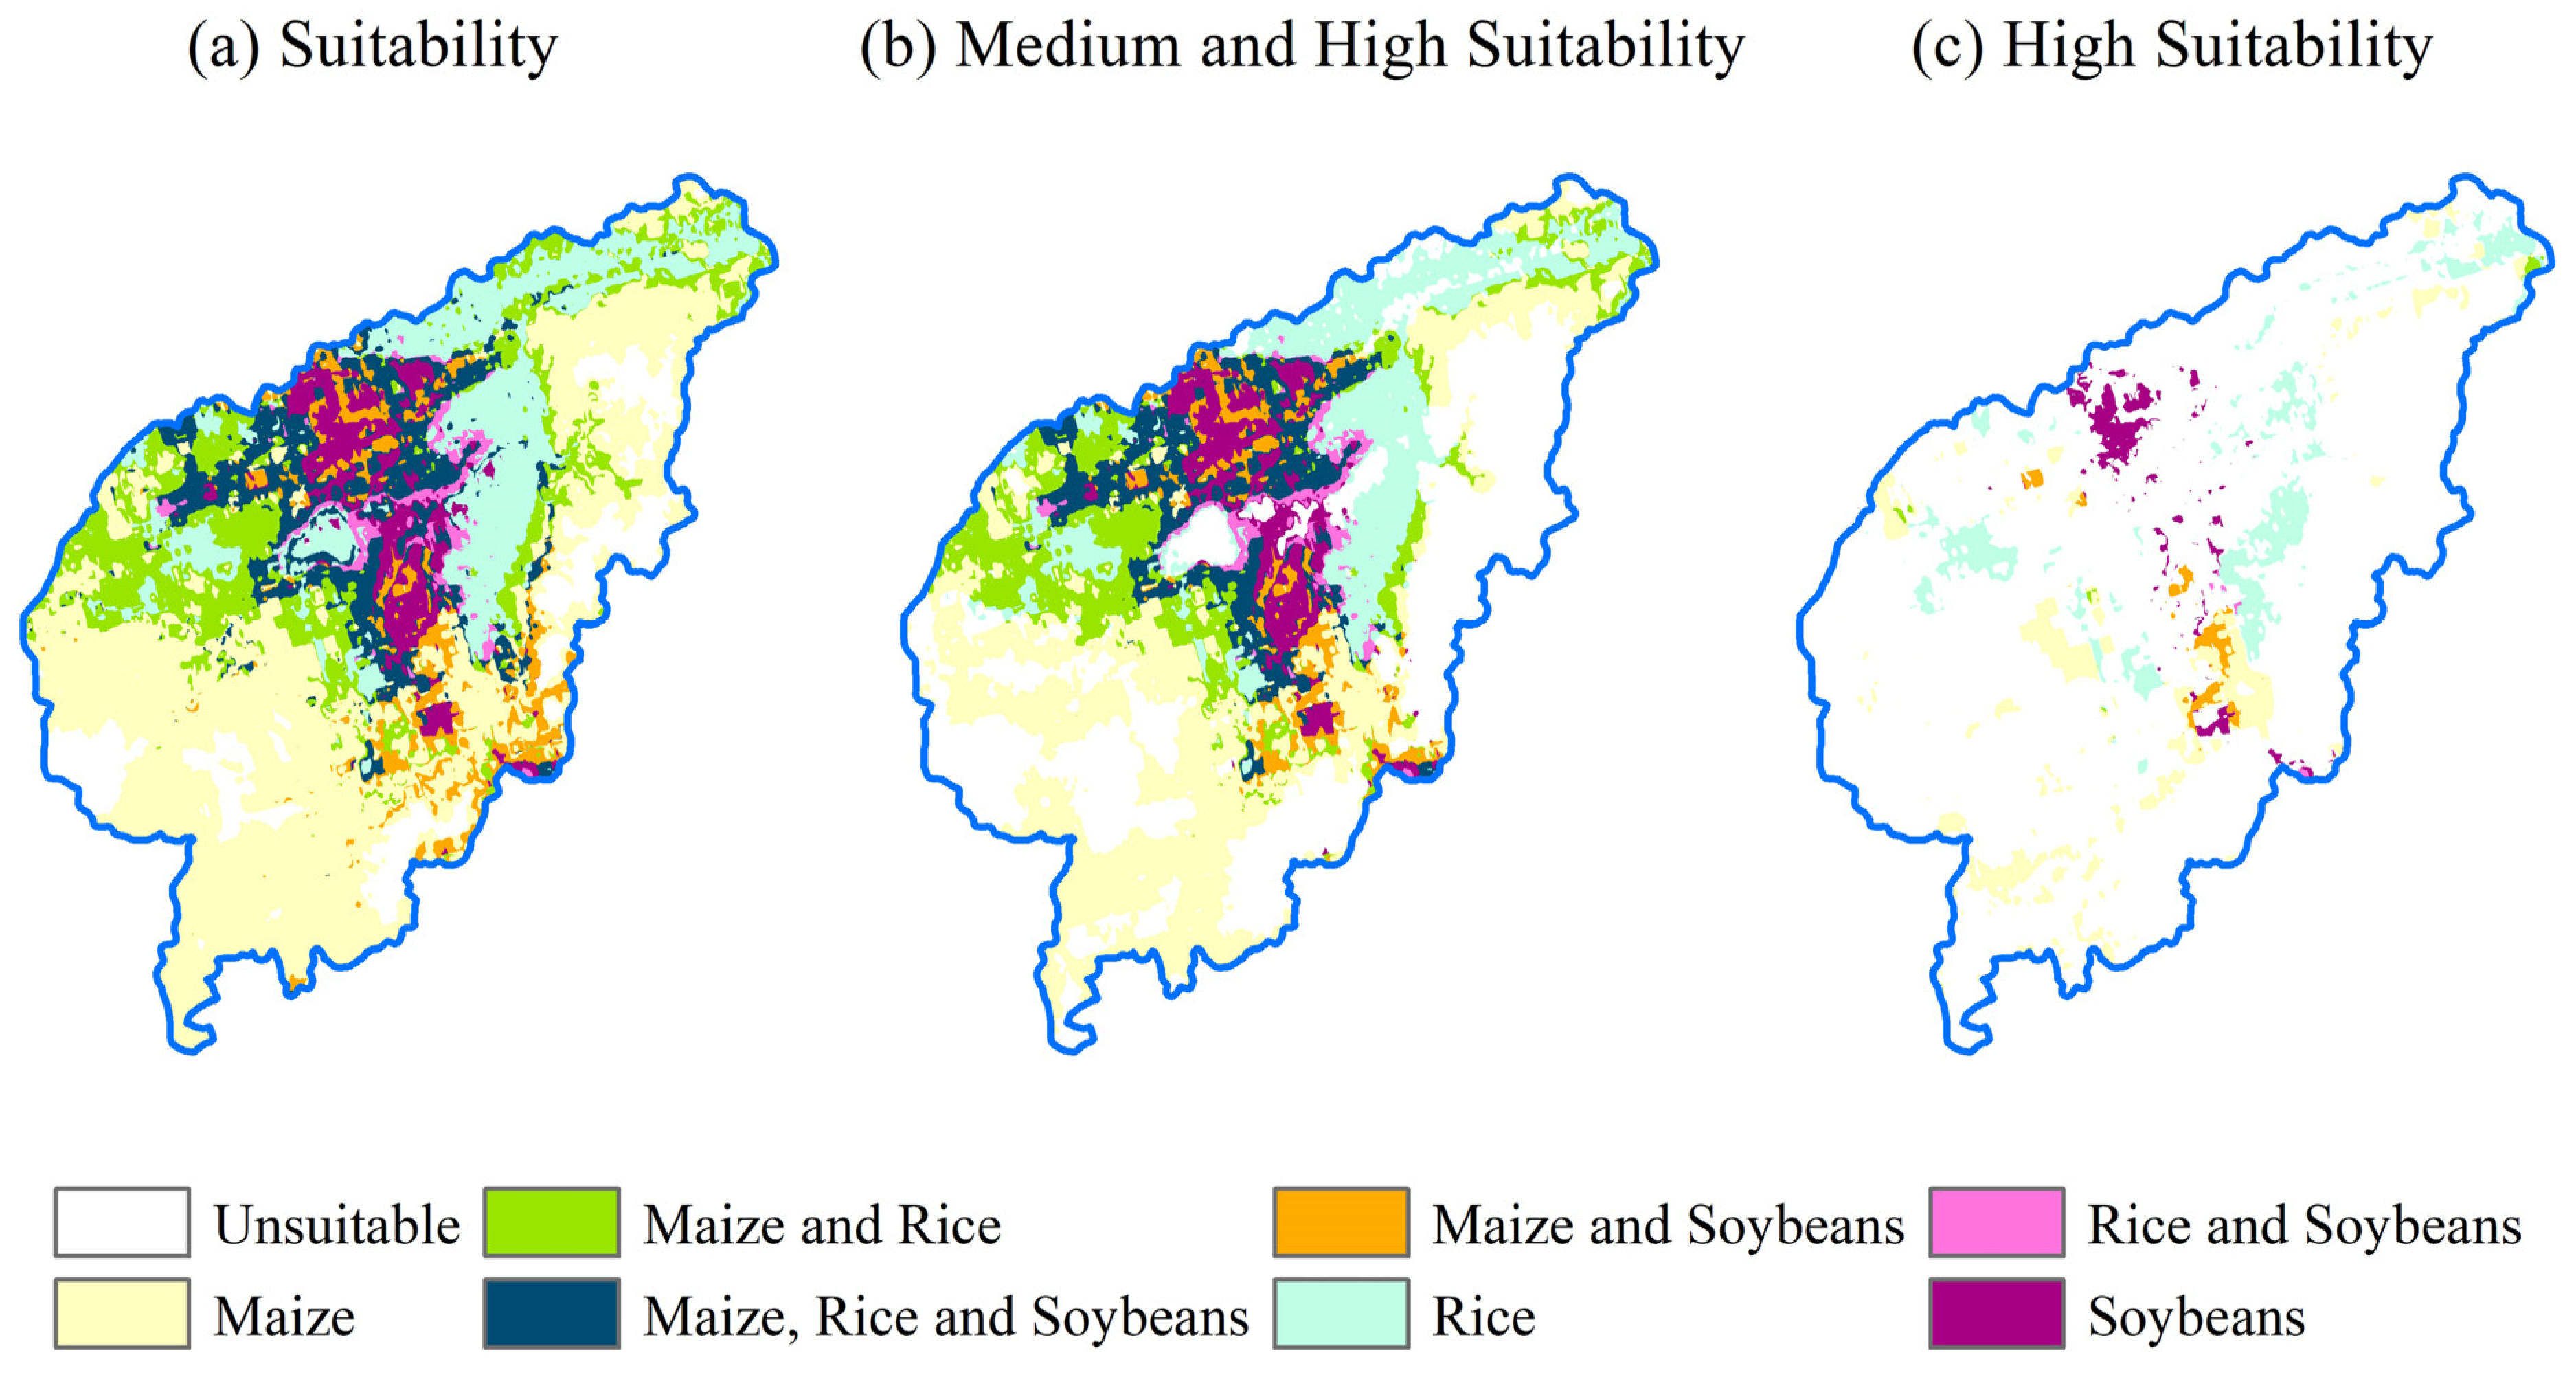
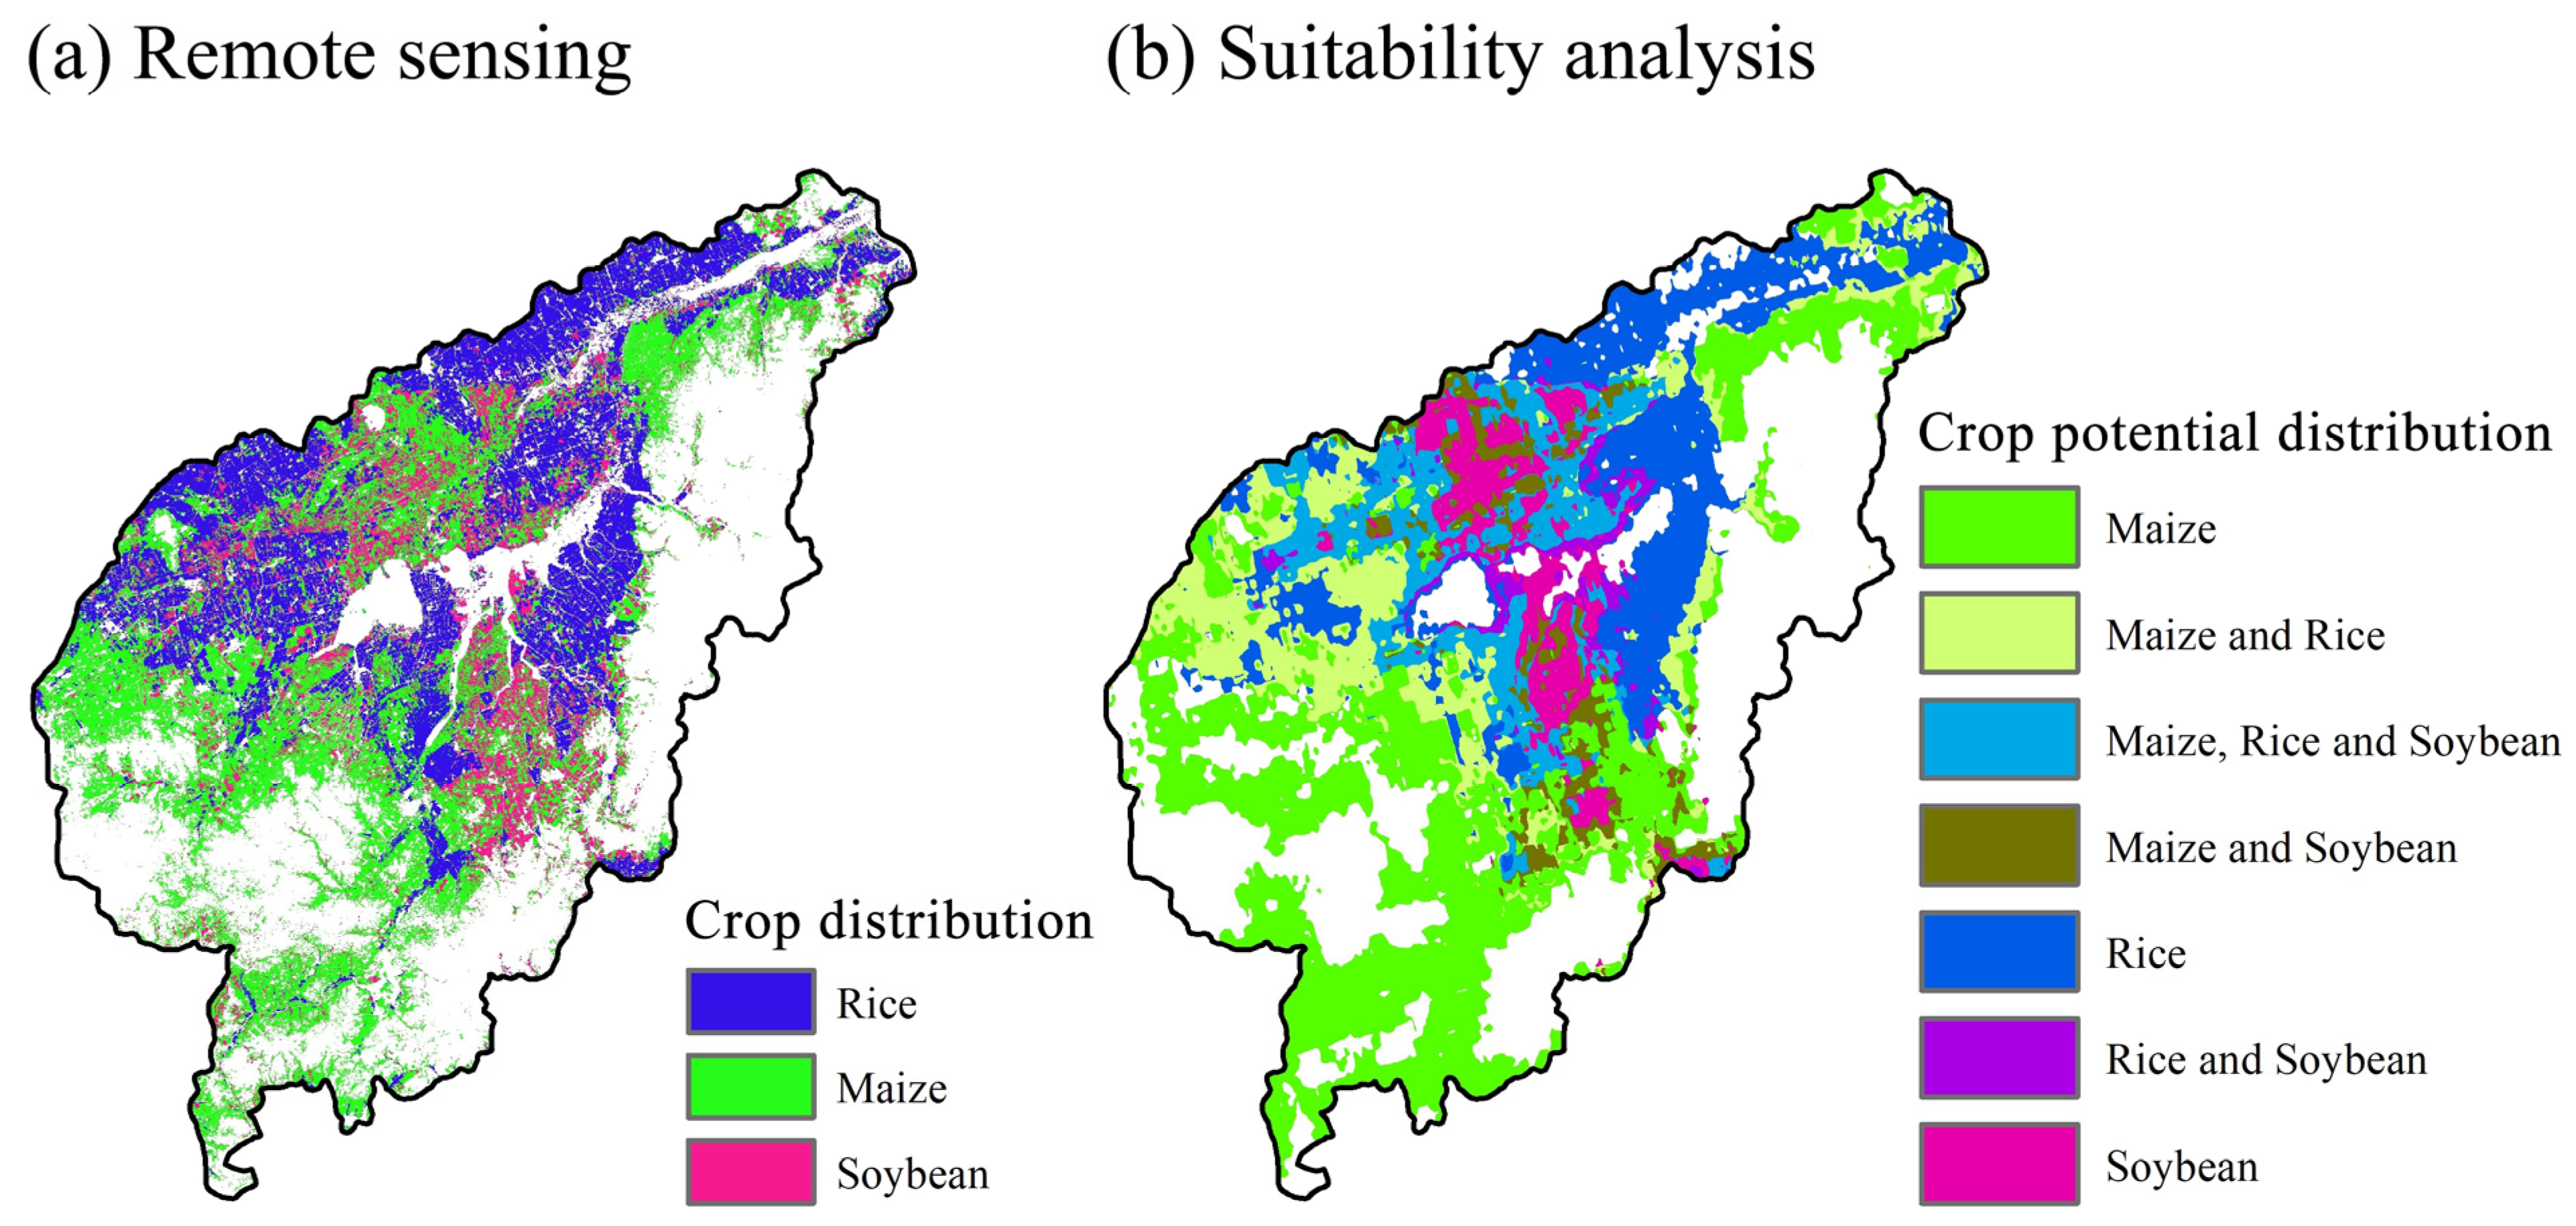
3.2. Potential Distribution and Suitability Levels

This study compared the suitable and unsuitable zones of maize, rice, and soybeans under fixed cultivated land. The suitable planting areas of all three crops were relatively large, with maize having the largest suitable area (23,700 km2), accounting for 89.40% of the total basin area. Soybeans had the smallest suitable area (13,800 km2), accounting for 52.16% of the basin area. The high-suitability area of maize in the basin was the largest, accounting for 7.07% of the basin area, while those of rice and soybeans accounted for 5.40% and 5.31%, respectively (Table 2). The unsuitable planting areas of all three crops were smaller than their suitable planting areas, with soybeans having the largest unsuitable planting area (12,700 km2) and maize having the smallest unsuitable planting area (2800 km2).
MaxEnt was utilized to assess the suitability of land in the Naoli River Basin for the three primary crops. Based on their suitability levels, the potential distribution of the crops was determined (Figure 4). Maize exhibited medium and high suitability in flat areas within the middle reaches of the basin, while low-suitability areas were primarily found in the peripheral regions. Unsuitable areas were predominantly located in the surrounding mountains, hills, and forests. Rice showed medium and high suitability in the flat and well-connected northern region of the basin, with smaller low-suitability areas nearby. For soybeans, the suitable areas varied, with high suitability upstream, medium suitability downstream, low suitability in the middle of the basin, and unsuitable areas scattered throughout.

3.3. Optimized Cropping Structure

The suitability of different plots of land for cultivation varied due to the combined limitations of climate change and comprehensive environmental conditions. The heterogeneity of maize, rice, and soybeans at the grid scale was evident when analyzing the overlaid potential distribution maps (Figure 4). Based on their suitability levels, seven cropping structure types were identified in the basin (Table 3). These cropping structures were discussed in relation to different suitability conditions, including high suitability, medium and high suitability, and suitability (Table 3 and Figure 5). Table 3 provides information on the potential distribution area and proportion of each cropping structure type under three suitability levels.
Under high-suitability conditions, the basin had six cropping structure types, accounting for 13.86% of the entire area. Maize was the most prominent crop, covering 5.20% of the basin area. Single-crop planting structures dominated, with maize, rice, and soybeans covering 44.75%, 37.52%, and 11.02% of all highly suitable areas, respectively, and a total of 93.29% of all high-suitability areas. Mixed cropping structure types made up less than 7%, with maize–soybeans, maize–rice, and rice–soybeans having decreasing area proportions.
Under medium- and high-suitability conditions, there were seven cropping structure types, with maize remaining the dominant crop, accounting for 41.40% and 26.83% of the planting areas, respectively. The top three cropping structure types under both conditions were maize, rice, and maize–rice. Suitable planting areas accounted for 90.08% and 69.02% of the basin area under medium- and high-suitability conditions, respectively, indicating that most areas in the basin are suitable for grain cultivation with good yields.
Suitable planting areas for rice, maize–rice, rice–soybeans, and maize–rice–soybeans were mainly located in plains and near-water regions. The primary locations suitable for planting soybeans, maize, and maize–soybeans were predominantly found in non-irrigated plains. Cropping areas primarily devoted to maize were less affected by topographical constraints and could be cultivated in both plains and low hills, except for areas close to water bodies. Cropping structure areas dominated by maize were mainly distributed in the uneven southern part of the basin, where there are fewer river branches, and these areas are not suitable for large-scale cultivation of rice and soybeans due to their high altitude and uneven terrain.
Based on the proposed cropping structure suggestions, decisions should be made comprehensively according to different crops’ impacts on regional ecology and grain production plans for mixed-cropping-structure areas.

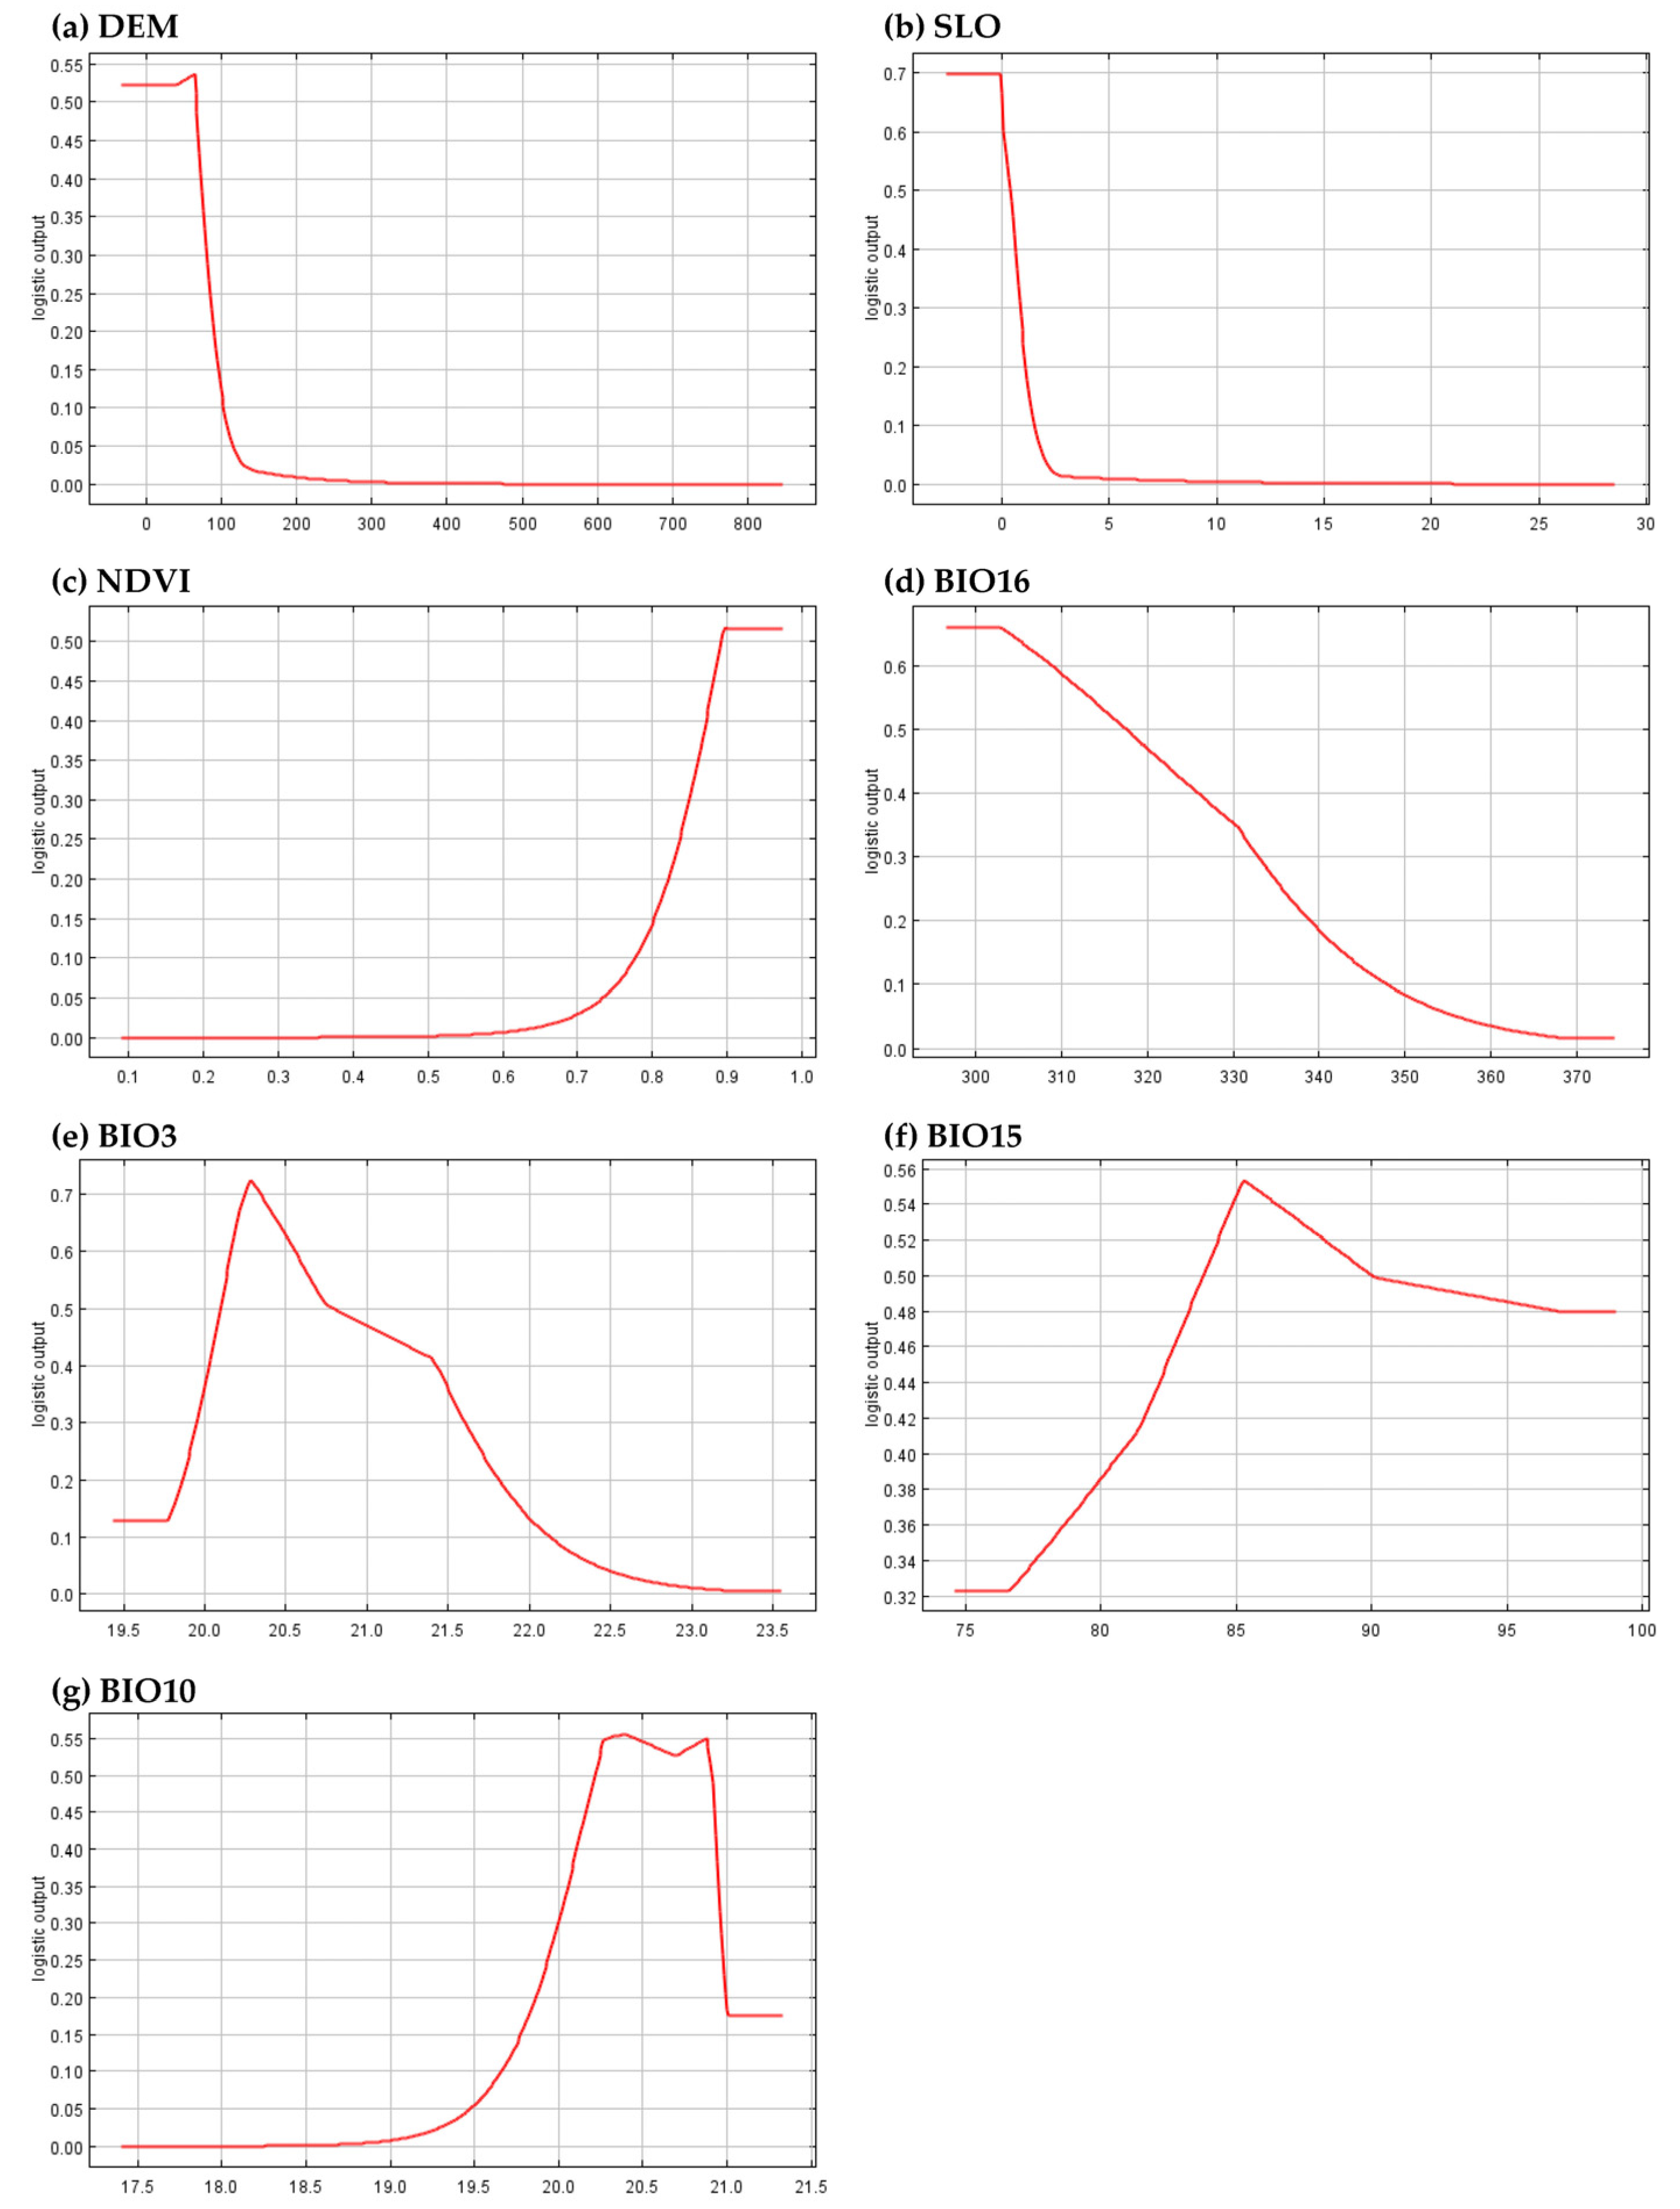
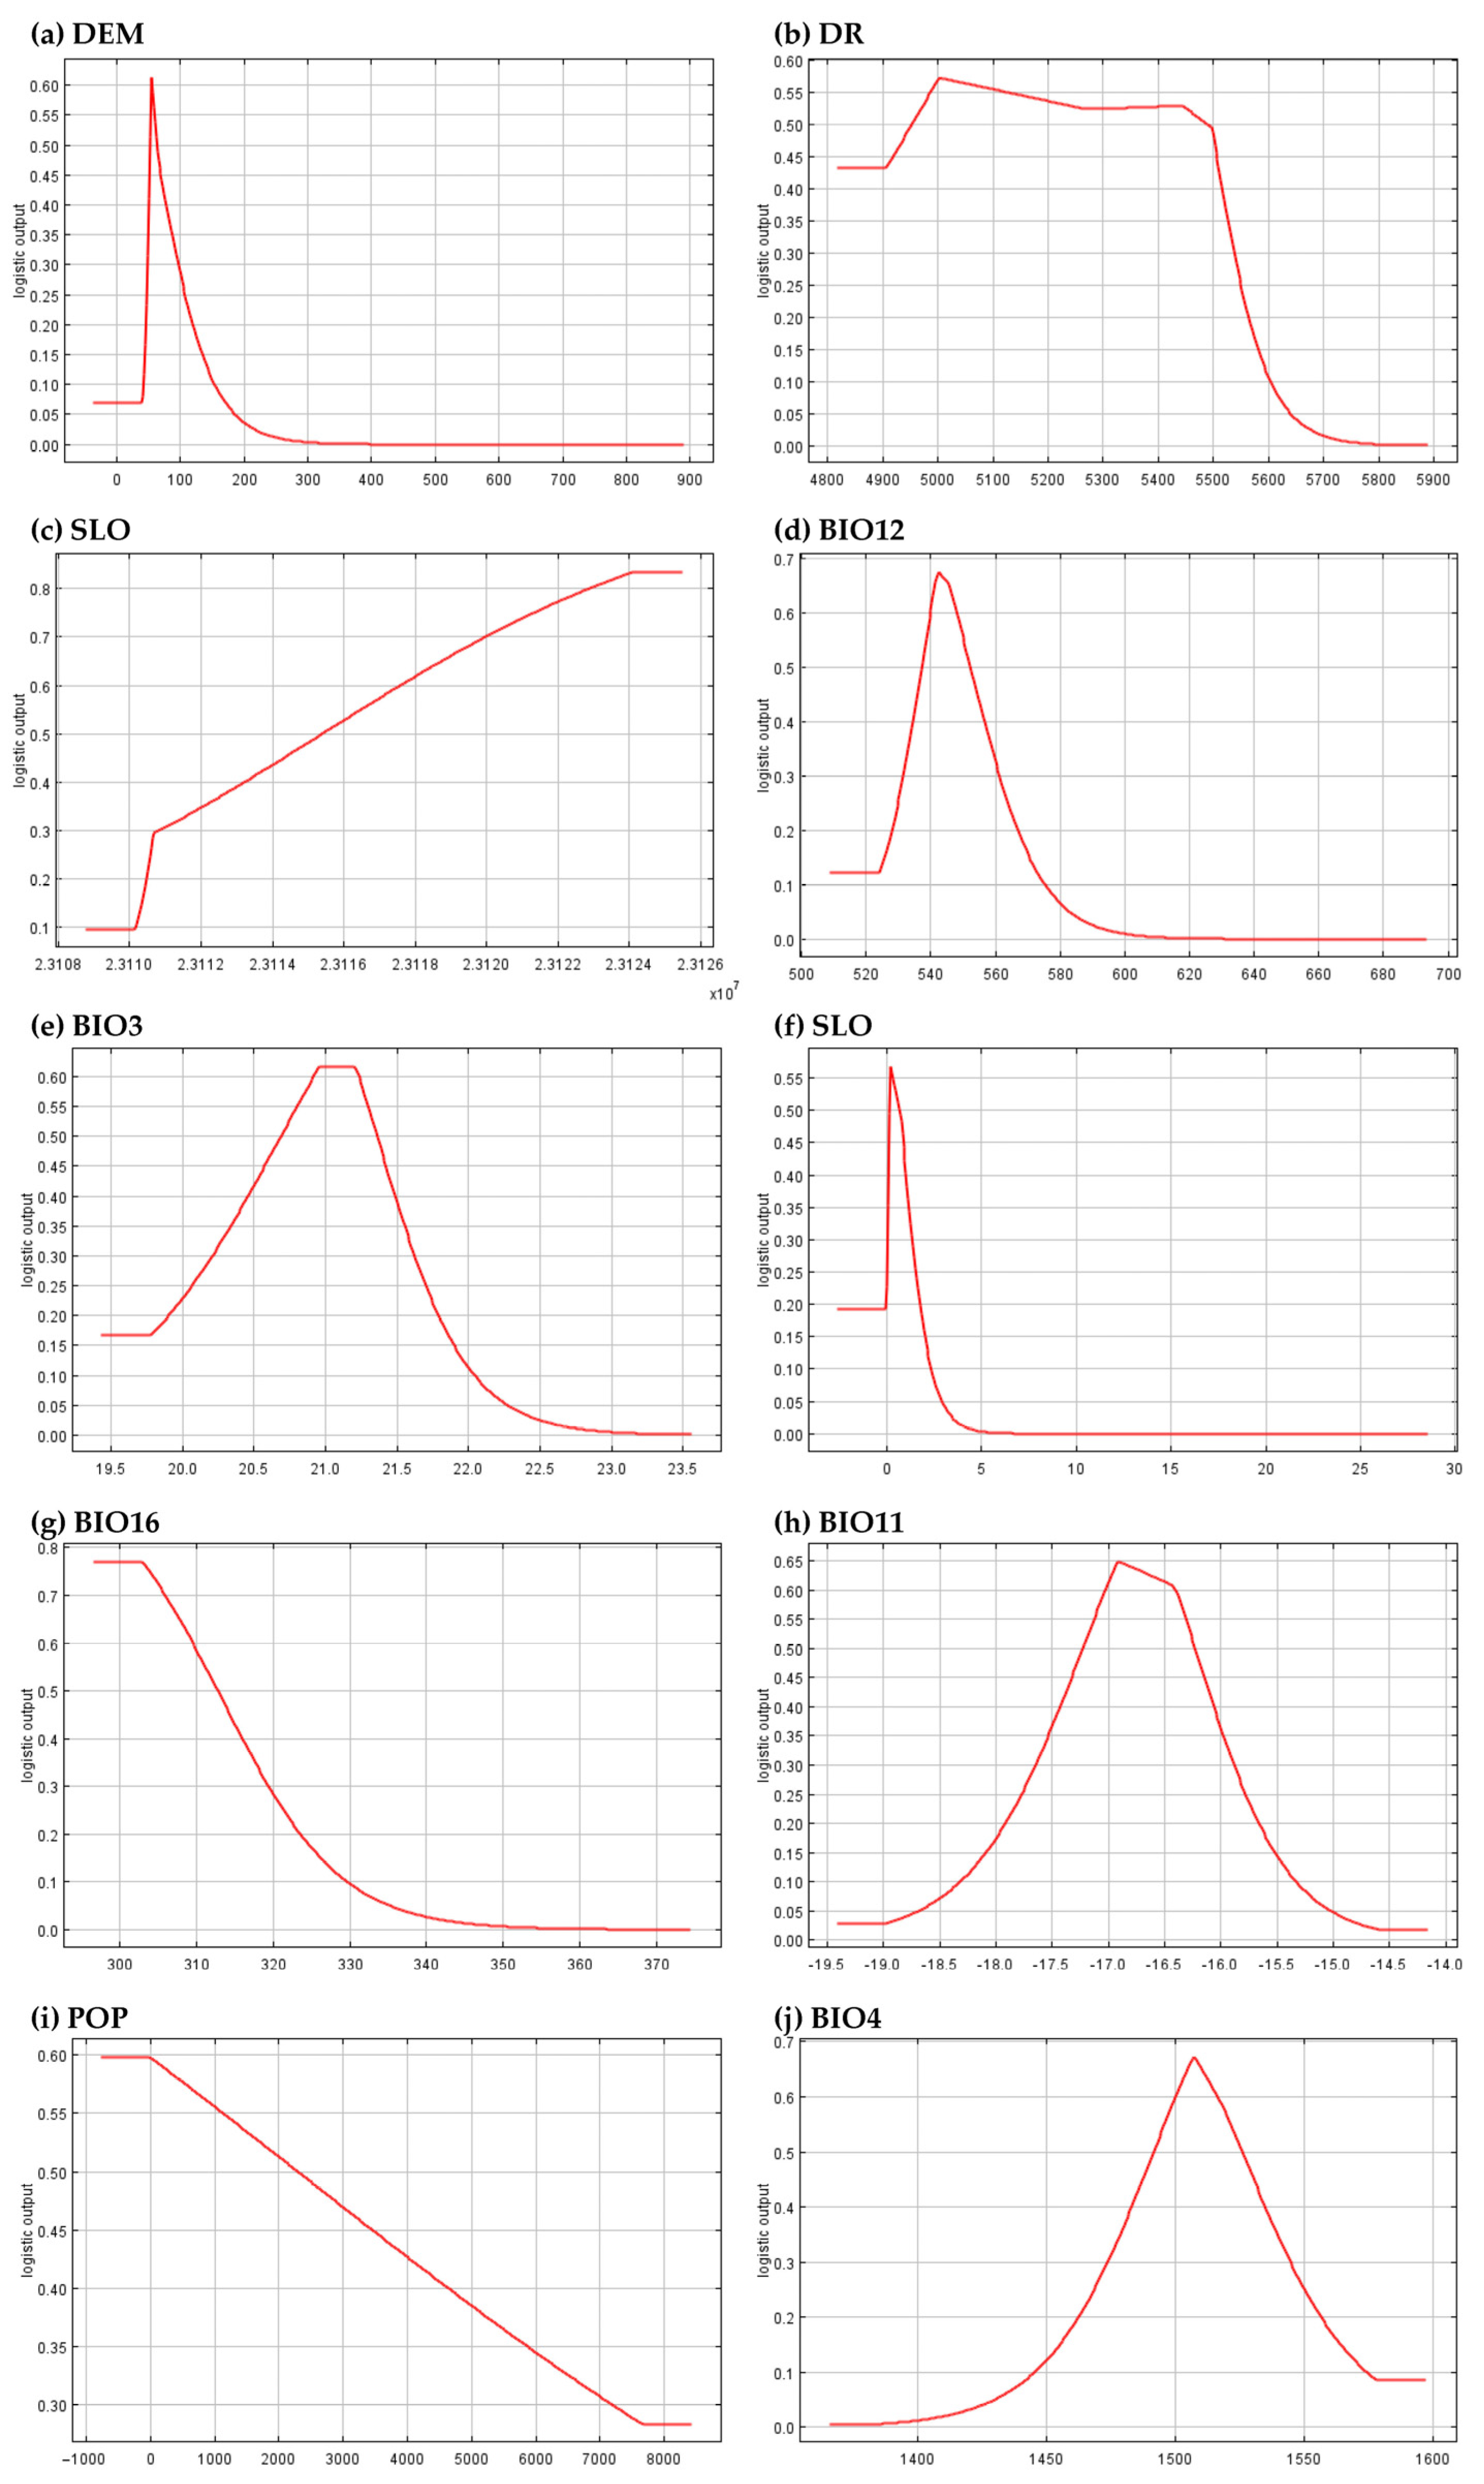
3.4. Identification of Dominant Factors and Threshold Characteristics

The percentage and cumulative contributions of the main factors affecting the existence probability of maize, rice, and soybeans in the Naoli River Basin are shown in Table 4.
All three crops—maize, rice, and soybeans—are influenced by climate change, with more than 50% of their potential distribution influenced by bioclimatic variables. Maize is mainly affected by seven climate-driven factors and four environment-driven factors. The top four factors are all bioclimatic variables, namely, bio5 (17.6%), bio3 (17%), bio10 (10%), and bio6.6 (6.6%), accounting for 51.2% of the total contribution. This indicates that climate has a relatively higher impact on the potential distribution of maize. Other factors, such as river, DEM, soil type, and slope, also have some influence on maize, but their overall contribution is relatively small.
For rice, terrain plays a significant role, with altitude and slope contributing to a cumulative total of 59.6%. This is because rice requires regular irrigation and is cultivated on standardized farmland using machinery, especially in Northeast China. Soil fertility, as indicated by the NDVI, also greatly affects rice yields. In addition to these factors, four bioclimatic variables, bio16, bio3, bio15, and bio10, are important for determining the potential distribution of rice.
Similarly, altitude has the greatest impact on soybeans, although its contribution rate is lower than that of rice, at only 18.4%. Variables such as distance from the highway and soil type have a contribution rate of more than 10%, indicating that transportation and soil texture affect soybean cultivation. Slope is also an important factor but has a contribution rate of only 4.9%, suggesting that soybeans can still be grown in areas with moderate slopes. Population is another significant influencing factor, with a contribution rate of about 3.5%. Factors like DR and POP have a greater impact on soybeans, indicating that soybean cultivation requires more human labor compared to maize and rice, which have higher levels of mechanization and scale.
All three crops—maize, rice, and soybeans—are affected by climate change to varying degrees. Bioclimatic variables account for more than 50% of the main influencing factors, suggesting that climate change has a significant impact on crop planting patterns in the Naoli River Basin.

3.5. Characteristics of Dominant Factors

The response curves of key environmental factors for maize, rice, and soybeans were studied in this research (Figure 6, Figure 7 and Figure 8). Maize shows a high probability of existence at an altitude of around 100 m. Conversely, rice shows a high probability of existence at around 60 m, and its existence sharply declines beyond 60 m, making it challenging to cultivate at altitudes exceeding 100 m. Similarly, for soybeans, the probability of existence drops significantly when the altitude exceeds 150 m.
This study also found that maize exhibits a peak occurrence between 2000 and 15,000 m of available water, and the decline rate slows down as the available water increases. This suggests that maize is less influenced by water sources and exhibits high drought resistance. Slope has a significant impact on all three crops, showing a negative correlation with the probability of existence. A slope of 0 represents the peak probability for all crops. Maize exhibits good tolerance to increased slope, with a probability of existence of approximately 0.5 even when the slope exceeds 25°. On the other hand, rice and soybeans are nearly impossible to cultivate when the slope exceeds 2.5°.
Soil fertility, as indicated by the NDVI value, strongly influences rice’s growth. The higher the NDVI value, the higher the probability of rice’s presence. When the NDVI exceeds 0.9, the existence probability for rice reaches its peak. Therefore, increasing the soil fertility is an effective approach to enhance rice cultivation. Regarding transportation accessibility, soybeans have a high probability of existence when their distance from the highway is below 5500 m. However, when the distance exceeds 5500 m, the probability of soybeans’ existence drops sharply. This suggests that planting soybeans becomes more costly when the distance from the highway increases. Population density also plays a role in soybean cultivation. A higher population density leads to a lower probability of soybeans’ presence. In areas with high population density, people are less likely to plant soybeans. Regarding soil characteristics, ST (soil type) is a dominant variable. According to the relevant soil type numbering (https://www.resdc.cn/data.aspx?DATAID=145, accessed on 1 October 2023), maize has the highest probability of occurrence in loamy black soil, while soybeans have the highest likelihood of being present in paddy soil. The physical and chemical characteristics of soils in the study region did not have a significant impact on crop distribution.
Finally, from the analysis of crops’ adaptability to bioclimatic conditions, it can be concluded that maize has the highest probability of existence when BIO1 = 0.5 °C, BIO5 = 27.6 °C, BIO3 = 23.2 °C, BIO10 = 21.0 °C, BIO12 = 520 mm, and BIO13 = 117 mm. Rice has the highest probability of existence when BIO3 = 20.3 °C, BIO15 = 86 mm, BIO10 = 20.5 °C, and BIO16 = 300 mm. Soybeans have the highest probability of existence when BIO12 = 542 mm, BIO3 = 21.0 °C, BIO16 = 300 mm, BIO11 = −16.8 °C, and BIO4 = 1510 mm.

3.6. Distribution of Crop Suitability under Future Climate

Using the MaxEnt model and considering the dominant factors for each food crop, we constructed simulations and predictions of the potential distribution of maize, rice, and soybeans under four future climate scenarios. The suitability spatial distribution maps (Figure 9) and area proportions (Table 5) of the three crops were obtained using the same classification rules as for the present year.
The spatial distribution and area proportions of suitable areas for the crops varied under the four future climates. With the exception of the SSP1-2.6 low-emission scenario, the suitable areas for maize, rice, and soybeans decreased across all climates, particularly in the medium- and high-suitability regions. The areas that were moderately and highly suitable for maize and rice experienced significant declines. However, under the low-emission scenario, there was minimal change in the most suitable area for maize, but the area of high-suitability decreased significantly. In the low-emission scenario, the moderately and highly suitable areas for rice and soybeans increased, indicating a greater possibility of expanding cultivation in these regions.
In conclusion, maintaining the low-emission scenario can ensure future regional food security and facilitate the cultivation of high-profit crops such as rice and soybeans. However, if emissions are not reduced, crop cultivation in the future may be negatively impacted by climate change, posing challenges to food supply.

4. Discussion

Optimizing the planting structure is crucial for ensuring food security in China, and even globally. This issue requires a comprehensive investigation of the planting suitability and detailed spatial distribution of various crops. Simultaneously, identifying the critical factors that influence various crops is necessary to uncover their potential optimal distribution. Furthermore, crop cultivation is a production activity that involves human behavioral habits, and its long-term and stable nature must be considered. Therefore, considering future climate change is also essential.
To ensure regional sustainable crop production, this study utilized MaxEnt to investigate the appropriateness of primary crops in the Naoli River Basin, and advised the optimal planting structure of the crops under the influence of climate change and human activities. Considering human activities can more accurately simulate crop suitability compared to only considering natural environmental factors. Including human activities in the model can provide a more comprehensive understanding of the impacts of changing environments on crop suitability. This study also discusses the importance of influencing factors, the optimal potential distribution of crops under different suitability levels, and the impact of future climate change on planting structures. This provides valuable information for decision-makers to determine regions that are highly suitable for major crops, optimize crop planting structures, and ensure regional water and soil resource security and food security.

4.1. Factors Influencing Crop Optimization Layout

From a model accuracy standpoint, integrating human activity factors into the prediction of environmental impact factors can improve the prediction accuracy of MaxEnt, indicating that human activities have a significant impact on crop distribution. An important factor analysis also revealed that POP, DW, and DR all affect the choice of planting structure to varying degrees. Wezel et al. [47] found that economic costs and accessibility affect farmers’ choices of water sources, leading to changes in agricultural practices in the mountainous regions of five European countries in the Alpine region. This emphasizes the significance of human activities as influences on crop planting structures. Yang et al. [19] discovered that considering the impact of human activities provided a more accurate understanding of the potential distribution of food crops in the Songhua River Basin. Feng et al. [1] observed that greenhouse gas emissions resulting from human activities will impact the future distribution of soybeans globally in their research on the suitability and future dynamics of soybean cultivation. These studies align with our viewpoint on the influence of human activities on planting structures.
Regarding land suitability for crops, different types of crops exhibit varying distributions. However, regardless of the crop, medium- and high-suitability regions are primarily concentrated in the central plain area of the basin. This area has a reasonable distribution of rivers and roads, flat terrain, abundant water resources, and convenient transportation resources. Similar conclusions were drawn in previous studies by Yuan et al. [48] and Yang et al. [19], who found that the proportion of highly suitable areas was relatively small. MaxEnt mainly relies on the distribution characteristics of species’ basic niche responses under ideal conditions [41]. The actual planting situation is also restricted by factors such as crops’ response to land changes and complex human interference, and it cannot fully correspond to suitability predictions, especially for crops that are more controlled by human activities. However, compared with remote-sensing-based research [49], our study’s results show similar crop proportions and distribution characteristics in the medium- and high-suitability areas. Furthermore, the actual distribution area of crops in the basin is maize > rice > soybeans, which is consistent with the ranking of suitable area sizes for the three crops (Figure 10).
Figure 10 shows a degree of overlap between remote sensing interpretation and crop suitability zoning, but also some areas where the boundaries do not coincide. This is because factors such as large-scale land, the use of agricultural machinery, and the ownership of insured land can lead to the planting of uniform crops [19,50], which breaks the constraints of the ideal suitability zone. Therefore, planning of the planting structure should be based not only on simulated suitability, but also on the actual land situation and the convenience of farmers’ labor.

4.2. Impacts of Dominant Factors on Crop Planting

In the past, most research focused on the impact of climate change on crops. Additionally, most studies delineated suitable areas of crops based on historical climate change. This study found that introducing human activity variables, including population density, water and road accessibility, soil fertility, bioclimatic variables, and terrain, enhanced the model’s simulated accuracy. This study also found that the contribution rates of dominant factors vary for maize, rice, and soybeans. Compared with rice and maize, soybeans are more affected by human factors such as population density and road network accessibility, and they may not be entirely related to the expected large-scale production. Nevertheless, in general, the potential distribution of existing crops in the Naoli River Basin is not as strongly impacted by human activities as initially anticipated.
Furthermore, we predicted the potential distribution of crops in the Naoli River Basin under future climate change. We found that, due to different climate factors affecting different crops differently, maize, rice, and soybeans exhibit varying distribution characteristics under future climate change scenarios. Maize is the crop most affected by climate factors, and highly suitable areas are the most sensitive to the influencing factors. Thus, in future climate change scenarios, the percentage of highly suitable areas for maize will decrease the most. The percentage contribution of climate factors for rice and soybeans is relatively small, so their suitable area changes little in future low-emission scenarios, and it even increases in the SSP1-2.6 scenario. However, overall, there is a risk of a decrease in crop suitability zones with future climate change in the study area.

4.3. Impacts of Human Activities on Planting Structures

In this study, we found that although introducing human activity factors improved the predictive accuracy of the MaxEnt model, the contribution of human activity indicators such as population density, transportation accessibility, and economic level to crop suitability in the Naoli River Basin was not very high. Yang et al. [19] studied the distribution of four crops in the northeast Songhua River Basin and found that introducing human activity could improve the predictive accuracy of crop suitability distribution. In terms of dominant factors, transportation accessibility was the dominant factor, but its contribution was small, while GDP always made a small contribution to crop suitability. This is similar to the results of our study.
The Naoli River Basin is in Heilongjiang Province in Northeast China. The population density in this region is relatively low, and the farmland area is extensive. This population distribution characteristic makes it more suitable for large-scale mechanized agricultural production. In areas with low population density, farmland can be more easily operated on a large scale, improving the agricultural production efficiency while also reducing production costs. Therefore, crop planting in Heilongjiang Province is usually more concentrated for mechanized operations and unified management. Therefore, the impact of population density on planting structures may be weak or even reversed. Therefore, we found that in the optimal planting structure, the dominant areas are mainly distributed downstream of rivers, with lower population density.
In this study, we found that transportation accessibility mainly affects the planting of corn and soybeans. Yang et al. [19] found that transportation accessibility not only affects corn and soybeans but is also the dominant factor for rice. This difference is related to the spatial scale. The study of Yang et al. [19] was targeted at the Songhua River Basin, and the selected road network data level was higher, reflecting a developed transportation network and improved infrastructure, which improved the convenience of transporting agricultural products to the market, reduced costs, and increased farmers’ potential planting willingness. In contrast, our study focused on small-scale watersheds and selected a more detailed road network, which not only reflects transportation accessibility but also reflects farmers’ access to fields. Due to the completion of standardized farmland transformation and full mechanized planting of rice in the Naoli River Basin in recent years, farmers’ access to fields has become a major factor affecting crop suitability.
Therefore, due to the continuous development and large-scale planting in the watershed, the agricultural mechanization level is relatively high, and a standardized land and production model has gradually formed. In addition, due to the regional planning policy for grain supply, the grain produced in the watershed is mainly used for national supply rather than local consumption. Therefore, the impact of population, the economy, transportation, and other conditions on the potential distribution of crops is not as significant as expected.

4.4. Potential Impacts of the Watershed’s Ecological and Water Security

Apart from climate conditions, ecological hydrological characteristics play a crucial role in crop growth. They not only affect the probability of crop distribution but also influence the natural ecological security of the watershed. Two important variables, namely, the normalized difference vegetation index (NDVI) and evapotranspiration (ET), are used to characterize the ecological hydrological stability of the watershed. Although these variables are not dominant factors in determining crop suitability distribution, their changes must be considered to maintain a balance among regional food security, ecological security, and water resource security. To analyze the change rate of NDVI and ET, we conducted a Mann–Kendall (MK) trend analysis using the average values from 2000 to 2021 for paddy fields and dryland, which represent cultivated land.
Figure 11 illustrates the interannual variation in the NDVI during the growing season (May to October), the average NDVI during the growing season, the annual average NDVI, and the maximum NDVI value. The analysis reveals an overall upward trend in the NDVI during the growing season and an increasing pattern in the maximum NDVI value for the entire year. However, there is no significant alteration in the overall annual average value. These findings suggest that multiyear grain planting has not had a significant impact on the vegetation greenness in the watershed.
Furthermore, this study investigated the changes in evapotranspiration across different land uses (Figure 12). All land uses exhibited an increasing trend in evapotranspiration. Natural ecological land, including forests, grasslands, and wetlands, experienced a relatively small increase in evapotranspiration (2.75 mm/year). In contrast, both drylands and paddy fields showed significant increasing trends, indicating that farmland cultivation has led to increased water consumption through evapotranspiration in the basin over the past 20 years. This raises concerns regarding water resource security. The rate of evapotranspiration increase followed the order paddy fields > drylands > entire basin > ecological land. These findings suggest that evapotranspiration in cultivated land is more influenced by climate and human activities, making farmland water consumption more susceptible to climate change. The overall increase rate of evapotranspiration in the basin is 4.49 mm/year, posing a challenge to water resource security as annual water consumption through evapotranspiration rises. This will also impact the arrangement of the crop planting structure.
As time goes on, the NDVI and ET may become important variables affecting the distribution of crop suitability in the future. According to the current trend, evapotranspiration is increasing while the NDVI is decreasing. These changes may have negative impacts on the ecological stability of the basin and local agriculture. According to the planting recommendations provided by the study, the optimal planting structure in the Naoli River Basin is to plant rice in the hydrophilic inland plain area, soybeans in the inland plain far from water sources, and corn in the peripheral plains and gentle-slope mountainous areas. This planting structure will help ensure sustainable use of water resources and environmental protection by reducing ineffective evapotranspiration during irrigation.
This study found that future climate change may reduce the suitable area for crops, posing challenges to regional food production. Therefore, it is crucial to combine climate change simulations of regional land and crop processes in future research. This will help in considering how to balance soil and water resources reasonably and cope with climate change in the future. In addition to optimizing planting structures, it is also necessary to develop a comprehensive and integrated water and soil resource management plan for the Naoli River Basin to ensure the safety of regional water and soil resources. This plan should take into account the needs of the environment and local residents, as well as being flexible enough to adapt to the constantly changing climate.

4.5. Limitations and Prospects

Apart from major factors such as climate, soil, terrain, and human activities, crop suitability is influenced by multiple factors, such as natural disasters and environmental pollution. For instance, the flood caused by a typhoon in Heilongjiang Province in China during the summer of 2023 posed risks to regional food production. Thus, the crop planting structure needs to consider resistance to such unexpected events and effectively utilize the terrain to change the layout of cultivation. However, these influences are difficult to reflect in a single model.
Moreover, due to data limitations, we only considered river networks, reservoirs, and irrigation channels for water supply, and the data on sprinkler networks in farmland were not reflected. Although the data that we collected largely reflected water supply, more detailed irrigation water data could further reduce the uncertainty in the study. Additionally, the response curves of certain influencing factors may not provide a comprehensive representation of the complete spectrum of crop responses to the environment, especially the lower and upper limits. Furthermore, this study did not determine the influence characteristics of all factors, including secondary factors, based on response curves. Despite these constraints, the innovative application of MaxEnt in the Naoli River Basin remains a valuable resource for guiding the optimization of crop planting strategies in the Naoli River Basin.
In the future, we will improve our data collection and train more accurate models for simulation and prediction. For example, artificial intelligence methods combined with remote sensing detection and deep learning could further optimize crop suitability assessment models and improve their accuracy and predictive capabilities. Additionally, multi-objective optimization methods could be employed to develop optimal crop layout strategies that maximize yields and minimize negative impacts. Furthermore, complex system modeling methods could be used to better understand the complex relationships between crop suitability and environmental factors. Finally, necessary field monitoring could be applied for comprehensive assessments that provide real-time monitoring of crop growth, yields, water resources, and ecology to assist in planning crop planting layouts.

5. Conclusions

This study used variables that encompass both natural and human-induced factors to simulate the existence probability and factor response characteristics, along with optimized planting structure strategies, for maize, rice, and soybeans in the Naoli River Basin using MaxEnt. The following conclusions were drawn:
  • The MaxEnt model accurately simulated crop suitability when considering the comprehensive influence of human activities along with natural environmental factors compared to when only considering natural factors.
  • The suitability distribution of different crops varied, with maize having the largest area of medium and suitable regions, followed by rice and soybeans.
  • The highly suitable areas for major crops in the Naoli River Basin were primarily concentrated in the central plain area of the basin rather than in areas with higher population density, indirectly indicating highly mechanized and large-scale agricultural production in the basin.
  • Population density (POP) and accessibility (DR) were the main human activity factors influencing the distribution of crop suitability, especially for soybeans.
  • Climate change had varying degrees of impact on crop suitability, with maize being the most affected. Under low-emission scenario climate models, there was no significant change in maize’s suitability, while the suitability of rice and soybeans increased. Under high-emission scenario models, the suitable area for all crops decreased, posing challenges to regional food security due to climate change.

Author Contributions

Conceptualization, methodology, software, validation, formal analysis, investigation, resources, J.Y.; data curation, writing—original draft preparation, J.Y. and D.W.; writing—review and editing, visualization, D.W.; project administration, funding acquisition, J.Y. All authors have read and agreed to the published version of the manuscript.

Funding

This research was funded by the MOE (Ministry of Education in China) Liberal Arts and Social Sciences Foundation (Grant No. 19YJCZH228).

Institutional Review Board Statement

Not applicable.

Informed Consent Statement

Not applicable.

Data Availability Statement

The data used to support the findings of this study are available from the corresponding author upon request.

Acknowledgments

The authors are thankful for the support of the Digital Economy Theory and Practice Provincial Innovation Team, Guizhou University of Finance and Economics. At the same time, the authors would also like to thank the respected editor and reviewer for their support.

Conflicts of Interest

The authors declare no conflict of interest.

References

  1. Feng, L.; Wang, H.; Ma, X.; Peng, H.; Shan, J. Modeling the current land suitability and future dynamics of global soybean cultivation under climate change scenarios. Field Crop. Res. 2021, 263, 108069. [Google Scholar] [CrossRef]
  2. Rising, J.; Devineni, N. Crop switching reduces agricultural losses from climate change in the United States by half under RCP 8.5. Nat. Commun. 2020, 11, 4991. [Google Scholar] [CrossRef]
  3. Gil, J.D.B.; Reidsma, P.; Giller, K.; Todman, L.; Whitmore, A.; Van Ittersum, M. Sustainable development goal 2: Improved targets and indicators for agriculture and food security. Ambio 2019, 48, 685–698. [Google Scholar] [CrossRef]
  4. Yang, S.; Wang, H.; Tong, J.; Ma, J.; Zhang, F.; Wu, S. Technical Efficiency of China’s Agriculture and Output Elasticity of Factors Based on Water Resources Utilization. Water 2020, 12, 2691. [Google Scholar] [CrossRef]
  5. Xiao-guang, Y.; Zhi-juan, L.I.U.; Fu, C. The Possible Effects of Global Warming on Cropping Systems in China Ⅰ. The Possible Effects of Climate Warming on Northern Limits of Cropping Systems and Crop Yields in China. Sci. Agric. Sin. 2010, 43, 329–336. [Google Scholar]
  6. Fujimori, S.; Hasegawa, T.; Krey, V.; Riahi, K.; Bertram, C.; Bodirsky, B.L.; Bosetti, V.; Callen, J.; Despres, J.; Doelman, J.; et al. A multi-model assessment of food security implications of climate change mitigation. Nat. Sustain. 2019, 2, 386–396. [Google Scholar] [CrossRef]
  7. Jiang, L.; Jiapaer, G.; Bao, A.; Guo, H.; Ndayisaba, F. Vegetation dynamics and responses to climate change and human activities in Central Asia. Sci. Total Environ. 2017, 599–600, 967–980. [Google Scholar] [CrossRef]
  8. Lombardo, U.; Iriarte, J.; Hilbert, L.; Ruiz-Perez, J.; Capriles, J.M.; Veit, H. Early Holocene crop cultivation and landscape modification in Amazonia. Nature 2020, 581, 190–193. [Google Scholar] [CrossRef] [PubMed]
  9. Zhu, Z.; Piao, S.; Myneni, R.B.; Huang, M.; Zeng, Z.; Canadell, J.G.; Ciais, P.; Sitch, S.; Friedlingstein, P.; Arneth, A.; et al. Greening of the Earth and its drivers. Nat. Clim. Chang. 2016, 6, 791–795. [Google Scholar] [CrossRef]
  10. Lobell, D.B.; Field, C.B. Global scale climate–crop yield relationships and the impacts of recent warming. Environ. Res. Lett. 2007, 2, 014002. [Google Scholar] [CrossRef]
  11. Tao, F.; Zhang, Z. Impacts of climate change as a function of global mean temperature: Maize productivity and water use in China. Clim. Chang. 2011, 105, 409–432. [Google Scholar] [CrossRef]
  12. Lawler, J.J.; Shafer, S.L.; White, D.; Kareiva, P.; Maurer, E.P.; Blaustein, A.R.; Bartlein, P.J. Projected climate-induced faunal change in the Western Hemisphere. Ecology 2009, 90, 588–597. [Google Scholar] [CrossRef] [PubMed]
  13. Bisbis, M.B.; Gruda, N.; Blanke, M. Potential impacts of climate change on vegetable production and product quality–A review. J. Clean Prod. 2018, 170, 1602–1620. [Google Scholar] [CrossRef]
  14. Song, Y.; Lu, Y.; Liu, T.; Li, H.; Yue, Z.; Liu, H.; Gao, T. Variation of vegetation fractional coverage and its relationship with climate in a desert steppe: Optimization of farmland layout in a farming-pastoral ecotone using the ecological suitability index. Ecol. Eng. 2020, 150, 105834. [Google Scholar] [CrossRef]
  15. Arowolo, A.O.; Deng, X. Land use/land cover change and statistical modelling of cultivated land change drivers in Nigeria. Reg. Environ. Chang. 2018, 18, 247–259. [Google Scholar] [CrossRef]
  16. Ladha, J.K.; Jat, M.L.; Stirling, C.M.; Chakraborty, D.; Pradhan, P.; Krupnik, T.J.; Sapkota, T.B.; Pathak, H.; Rana, D.S.; Tesfaye, K.; et al. Achieving the sustainable development goals in agriculture: The crucial role of nitrogen in cereal-based systems. Adv. Agron. 2020, 163, 39–116. [Google Scholar] [CrossRef]
  17. Yan, X.; Liu, M.; Zhong, J.; Guo, J.; Wu, W. How human activities affect heavy metal contamination of soil and sediment in a long-term reclaimed area of the Liaohe River Delta, North China. Sustainability 2018, 10, 338. [Google Scholar] [CrossRef]
  18. Hao, L.; Su, X.; Singh, V.P.; Ayantobo, O.O. Spatial Optimization of Agricultural Land Use Based on Cross-Entropy Method. Entropy 2017, 19, 592. [Google Scholar] [CrossRef]
  19. Yang, S.; Wang, H.; Tong, J.; Bai, Y.; Alatalo, J.M.; Liu, G.; Fang, Z.; Zhang, F. Impacts of environment and human activity on grid-scale land cropping suitability and optimization of planting structure, measured based on the MaxEnt model. Sci. Total Environ. 2022, 836, 155356. [Google Scholar] [CrossRef]
  20. Tang, Y.H.; Luan, X.B.; Sun, J.X.; Zhao, J.F.; Yin, Y.L.; Wang, Y.B.; Sun, S.K. Impact assessment of climate change and human activities on GHG emissions and agricultural water use. Agric. For. Meteorol. 2021, 296, 108218. [Google Scholar] [CrossRef]
  21. Abdelaal, M.; Fois, M.; Fenu, G.; Bacchetta, G. Using MaxEnt modeling to predict the potential distribution of the endemic plant Rosa arabica Crep. in Egypt. Ecol. Inform. 2019, 50, 68–75. [Google Scholar] [CrossRef]
  22. Tan, J.; Li, A.; Lei, G.; Xie, X. A SD-MaxEnt-CA model for simulating the landscape dynamic of natural ecosystem by considering socio-economic and natural impacts. Ecol. Model. 2019, 410, 108783. [Google Scholar] [CrossRef]
  23. He, Q.; Zhou, G. The climatic suitability for maize cultivation in China. Chin. Sci. Bull. 2012, 57, 395–403. [Google Scholar] [CrossRef]
  24. Duan, J.; Zhou, G. Potential distribution of rice in china and its climate characteristics. Acta Ecol. Sin. 2011, 31, 6659–6668. [Google Scholar]
  25. Duan, J.; Zhou, G. Climatic suitability of double rice planting regions in China. Sci. Agric. Sin. 2012, 45, 218–227. [Google Scholar]
  26. Zhang, K.; Zhang, Y.; Zhou, C.; Meng, J.; Sun, J.; Zhou, T.; Tao, J. Impact of climate factors on future distributions of Paeonia ostii across China estimated by MaxEnt. Ecol. Inform. 2019, 50, 62–67. [Google Scholar] [CrossRef]
  27. Bai, X.F.; Wang, B.; Qi, Y. The effect of returning farmland to grassland and coniferous forest on watershed runoff—A case study of the Naoli River Basin in Heilongjiang Province, China. Sustainability 2021, 13, 6264. [Google Scholar] [CrossRef]
  28. Dai, X.L.; Wang, Y.; Li, X.H.; Wang, K.; Zhou, J.; Ni, H.W. Effects of temporal and spatial changes in wetlands on regional carbon storage in the Naoli River Basin, Sanjiang Plain, China. Land 2023, 12, 1300. [Google Scholar] [CrossRef]
  29. Wang, J.-J.; Liu, Z.-R.; Wan, S.-Q.; Han, H.-Y.; Zhu, W.-Z.; Zhang, Z.-T.; Huang, W.-L.; Zeng, H. Relatively stable metal(loid) levels in surface soils of a semiarid Inner Mongolia steppe under multiple environmental change factors. Geoderma 2019, 352, 268–276. [Google Scholar] [CrossRef]
  30. Kogo, B.K.; Kumar, L.; Koech, R.; Kariyawasam, C.S. Modelling climate suitability for rainfed maize cultivation in Kenya using a maximum entropy (MaxENT) approach. Agronomy 2019, 9, 727. [Google Scholar] [CrossRef]
  31. Xian, Y.; Liu, G.; Yao, H. Predicting the current and future distributions of major food crop designated geographical indications (GIs) in China under climate change. Geocarto Int. 2022, 37, 8148–8171. [Google Scholar] [CrossRef]
  32. Yu, X.; Tao, X.; Liao, J.; Liu, S.; Xu, L.; Yuan, S.; Zhang, Z.; Wang, F.; Deng, N.; Huang, J.; et al. Predicting potential cultivation region and paddy area for ratoon rice production in China using Maxent model. Field Crop. Res. 2022, 275, 108372. [Google Scholar] [CrossRef]
  33. Sun, D.; Wang, Y.; Li, H.; Zhang, W.; Zhou, L. Spatializing regional fertilizer input based on MODIS NDVI time series. Trans. Chin. Soc. Agric. Eng. 2010, 26, 175–180. [Google Scholar]
  34. Singh, C.; Dorward, P.; Osbahr, H. Developing a holistic approach to the analysis of farmer decision-making: Implications for adaptation policy and practice in developing countries. Land Use Policy 2016, 59, 329–343. [Google Scholar] [CrossRef]
  35. Lalani, B.; Dorward, P.; Holloway, G.; Wauters, E. Smallholder farmers’ motivations for using Conservation Agriculture and the roles of yield, labour and soil fertility in decision making. Agric. Syst. 2016, 146, 80–90. [Google Scholar] [CrossRef]
  36. Fiorella, K.J.; Bageant, E.R.; Schwartz, N.B.; Thilsted, S.H.; Barrett, C.B. Fishers’ response to temperature change reveals the importance of integrating human behavior in climate change analysis. Sci. Adv. 2021, 7, eabc7425. [Google Scholar] [CrossRef] [PubMed]
  37. Bouramdane, A.A. Assessment of CMIP6 multi-model projections worldwide: Which regions are getting warmer and are going through a drought in Africa and Morocco? What changes from CMIP5 to CMIP6? Sustainability 2023, 15, 690. [Google Scholar] [CrossRef]
  38. Lei, Y.W.; Chen, J.; Xiong, L.H. A comparison of CMIP5 and CMIP6 climate model projections for hydrological impacts in China. Hydrol. Res. 2023, 54, 330–347. [Google Scholar] [CrossRef]
  39. Douglas, H.C.; Harrington, L.J.; Joshi, M.; Hawkins, E.; Revell, L.E.; Frame, D.J. Changes to population-based emergence of climate change from CMIP5 to CMIP6. Environ. Res. Lett. 2023, 18, 014013. [Google Scholar] [CrossRef]
  40. Wu, T.W.; Lu, Y.X.; Fang, Y.J.; Xin, X.G.; Li, L.; Li, W.P.; Jie, W.H.; Zhang, J.; Liu, Y.M.; Zhang, L.; et al. The Beijing Climate Center Climate System Model (BCC-CSM): The main progress from CMIP5 to CMIP6. Geosci. Model Dev. 2019, 12, 1573–1600. [Google Scholar] [CrossRef]
  41. Phillips, S.J.; Anderson, R.P.; Schapire, R.E. Maximum entropy modeling of species geographic distributions. Ecol. Model. 2006, 190, 231–259. [Google Scholar] [CrossRef]
  42. Elith, J.; Phillips, S.J.; Hastie, T.; Dudik, M.; Chee, Y.E.; Yates, C.J. A statistical explanation of MaxEnt for ecologists. Divers. Distrib. 2011, 17, 43–57. [Google Scholar] [CrossRef]
  43. Cao, J.; Wang, H.; Li, J.; Tian, Q.; Niyogi, D. Improving the forecasting of winter wheat yields in Northern China with machine learning-dynamical hybrid subseasonal-to-seasonal ensemble prediction. Remote Sens. 2022, 14, 1707. [Google Scholar] [CrossRef]
  44. Heumann, B.W.; Walsh, S.J.; McDaniel, P.M. Assessing the application of a geographic presence-only model for land suitability mapping. Ecol. Inform. 2011, 6, 257–269. [Google Scholar] [CrossRef]
  45. Dai, S.; Zhao, B. Trends and challenges of ecosystem observations in the age of big data. Biodivers. Sci. 2016, 24, 85–94. [Google Scholar] [CrossRef]
  46. Chhogyel, N.; Kumar, L.; Bajgai, Y.; Jayasinghe, L.S. Prediction of Bhutan’s ecological distribution of rice (Oryza sativa L.) under the impact of climate change through maximum entropy modelling. J. Agric. Sci. 2020, 158, 25–37. [Google Scholar] [CrossRef]
  47. Wezel, A.; Vincent, A.; Nitsch, H.; Schmid, O.; Dubbert, M.; Tasser, E.; Fleury, P.; Stoeckli, S.; Stolze, M.; Bogner, D. Farmers’ perceptions, preferences, and propositions for result-oriented measures in mountain farming. Land Use Policy 2018, 70, 117–127. [Google Scholar] [CrossRef]
  48. Yuan, B.; Guo, J.; Ye, M.; Zhao, J. Variety distribution pattern and climatic potential productivity of spring maize in Northeast China under climate change. Chin. Sci. Bull. 2012, 57, 3497–3508. [Google Scholar] [CrossRef]
  49. Chen, H.; Li, Z.G.; Tang, P.Q.; Hu, Y.N.; Tan, J.Y.; Liu, Z.H.; You, L.Z.; Yang, P. Rice area change in Northeast China and its correlation with climate change. J. Appl. Ecol. 2016, 27, 2571–2579. [Google Scholar] [CrossRef]
  50. He, P.; Li, J.; Wang, X. Wheat harvest schedule model for agricultural machinery cooperatives considering fragmental farmlands. Comput. Electron. Agric. 2018, 145, 226–234. [Google Scholar] [CrossRef]
Figure 1. The location of the Naoli River Basin. Note: the map of China appearing in Figure 1 is based on the standard map (No. GS(2023)2763) (http://bzdt.ch.mnr.gov.cn/, accessed on 11 October 2023), without modification.
Sustainability 15 16090 g001
Figure 2. The research framework diagram.
Sustainability 15 16090 g002
Figure 3. The ROC curves of the MaxEnt model in crops under environmental forces (climate factors and nature factors) and comprehensive forces (the environment and human activities). Note: the x-axis of the ROC curve represents TPR, and the y-axis represents FPR.
Sustainability 15 16090 g003
Figure 4. Suitability of land in the Naoli River Basin for (a) maize, (b) rice, and (c) soybeans.
Sustainability 15 16090 g004
Figure 5. Crop distribution in different types of planting structure under different suitability conditions.
Sustainability 15 16090 g005
Figure 6. Response curves of dominant factors for maize (x-axis: factor’s value, y-axis: existence probability).
Sustainability 15 16090 g006
Figure 7. Response curves of dominant factors for rice (x-axis: factor’s value, y-axis: existence probability).
Sustainability 15 16090 g007
Figure 8. Response curves of dominant factors for soybeans (x-axis: factor’s value, y-axis: existence probability).
Sustainability 15 16090 g008
Figure 9. Potential distribution of various crops under the four future climate change scenarios.
Sustainability 15 16090 g009
Figure 10. Crop distribution for (a) actual remote sensing interpretation and (b) suitability distribution by model calculation.
Sustainability 15 16090 g010
Figure 11. Yearly variations in the NDVI in each month during the growing season in the Naoli River Basin (The solid line represents specific numerical changes, while the dashed line represents a linear trend).
Sustainability 15 16090 g011aSustainability 15 16090 g011b
Figure 12. Annual fluctuations in evapotranspiration for various land uses in the Naoli River Basin (The solid line represents specific numerical changes, while the dashed line represents a linear trend).
Sustainability 15 16090 g012
Table 1. The input variables and their sources for the model.
TypeFactorsAbbreviationData Sources
Climate
Factors
Bioclimatic
variables
Annual mean temperatureBIO1NMSDC
Mean diurnal rangeBIO2
Isothermality (BIO2/BIO7) (×100) (%)BIO3
Temperature seasonality (standard deviation × 100)BIO4
Max temperature of warmest monthBIO5
Min temperature of coldest monthBIO6
Temperature annual range (BIO5–BIO6)BIO7
Mean temperature of wettest quarterBIO8
Mean temperature of driest quarterBIO9
Mean temperature of warmest quarterBIO10
Mean temperature of coldest quarterBIO11
Annual precipitation (mm)BIO12
Precipitation of wettest monthBIO13
Precipitation of driest monthBIO14
Precipitation seasonalityBIO15
Precipitation of wettest quarterBIO16
Precipitation of driest quarterBIO17
Precipitation of warmest quarterBIO18
Precipitation of coldest quarterBIO19
SunshineSunshine durationSUN
Nature
Factors
TerrainDigital elevation modelDEMRESDC
SlopeSLO
AspectASP
VegetationNormalized difference vegetation indexNDVIGEE
Water consumptionEvapotranspirationETGEE
SoilOrganic contentOCCARSDC
Total nitrogenTN
Total phosphorusTP
Total potassiumTK
Topsoil calcium carbonate (CaCO3)TC
PhPh
Pore available water capacityPAWC
Soil typeSTRESDC
Soil erosionERO
Human
Activities
Socioeconomic
factors
Distance from a water sourceDWGIS interpolation
Distance from the settlementDS
Distance from the roadDR
Population densityPopRESDC
Gross domestic productGDP
Future Climate Bioclimatic variables with strong importance under the climate scenarios of SSP1-2.6, SSP2-4.5, SSP4-6.0, and SSP5-8.5 in BCC-CSM2-MRBIO1–BIO19WorldClim
Table 2. Suitable areas and percentages for various crops.
MaizeRiceSoybeans
Area (km2)Unsuitable2807.1410,731.4711,445.82
Low suitability8821.375010.367967.24
Medium suitability12,978.778813.324438.23
High suitability1872.981430.011405.9
Suitable23,673.1115,253.6913,811.37
Percentage of AreaUnsuitable10.60%42.40%47.84%
Low suitability33.31%18.92%30.09%
Medium suitability49.01%33.28%16.76%
High suitability7.07%5.40%5.31%
Suitable89.40%57.60%52.16%
Table 3. Area and percentage of dominant planting structures under different suitability conditions.
Crop DistributionSuitabilityMedium and High SuitabilityHigh Suitability
Area (km2)PercentageArea (km2)PercentageArea (km2)Percentage
Unsuitable2389.589.02%8203.8230.98%22,811.3386.14%
Soybeans1372.635.18%1341.135.06%404.361.53%
Rice3706.2313.99%3449.3813.02%1378.195.20%
Rice and Soybeans461.171.74%461.211.74%17.410.07%
Maize10,964.2141.40%7104.2626.83%1642.746.20%
Maize and Rice3578.3413.51%2825.7810.67%35.830.14%
Maize and Soybeans1420.765.36%958.443.62%194.180.73%
Maize, Rice, and Soybeans2590.249.78%2138.958.08%
Table 4. Percentage and cumulative contributions of different factors affecting crop distribution in the Naoli River Basin.
Driving Force for MaizeContributionDriving Force for RiceContributionDriving Force for SoybeansContribution
PercentCumulativePercentCumulativePercentCumulative
BIO517.617.6DEM36.436.4DEM18.418.4
BIO31734.6SLO23.259.6DR15.834.2
BIO1016.651.2NDVI9.368.9ST14.949.1
DW5.857BIO163.772.6BIO125.154.2
BIO15.262.2BIO33.676.2BIO35.159.3
DEM4.867BIO152.678.8SLO4.964.2
BIO124.471.4BIO102.581.3BIO164.869
ST475.4 BIO114.473.4
BIO133.779.1 POP3.576.9
SLO3.582.6 BIO43.480.3
Table 5. The proportions of various crop types in terms of land area under different future climate change scenarios.
Maize
SSP1-2.6SSP2-4.5SSP3-7.0SSP5-8.5Currently
Unsuitable10.68%11.46%11.65%11.01%10.60%
Low Suitability37.00%41.11%41.20%40.29%33.31%
Medium Suitability47.75%47.39%47.40%46.17%49.01%
High Suitability4.57%2.04%1.74%2.53%7.07%
Suitability89.32%88.54%88.35%88.99%89.40%
Medium and High Suitability51.33%49.43%49.15%48.70%56.09%
Rice
SSP1-2.6SSP2-4.5SSP3-7.0SSP5-8.5Currently
Unsuitable42.80%43.77%45.14%45.62%42.40%
Low Suitability18.24%19.53%22.15%24.88%18.92%
Medium Suitability33.16%32.71%28.56%25.58%33.28%
High Suitability5.80%4.99%4.14%3.93%5.40%
Suitability57.20%56.23%54.86%54.38%57.60%
Medium and High Suitability38.96%36.70%32.71%29.50%38.68%
Soybeans
SSP1-2.6SSP2-4.5SSP3-7.0SSP5-8.5Currently
Unsuitable47.98%54.01%52.45%53.76%47.84%
Low Suitability29.21%28.22%29.12%29.11%30.09%
Medium Suitability17.75%13.86%14.01%13.18%16.76%
High Suitability5.06%3.91%4.41%3.94%5.31%
Suitability52.02%45.99%47.55%46.24%52.16%
Medium and High Suitability22.81%17.77%18.43%17.13%22.07%
Disclaimer/Publisher’s Note: The statements, opinions and data contained in all publications are solely those of the individual author(s) and contributor(s) and not of MDPI and/or the editor(s). MDPI and/or the editor(s) disclaim responsibility for any injury to people or property resulting from any ideas, methods, instructions or products referred to in the content.

