Article

Examining the Impact of Crowding Perception on the Generation of Negative Emotions among Users of Small Urban Micro Public Spaces

School of Landscape Architecture, Northeast Forestry University, Harbin 150040, China
*
Author to whom correspondence should be addressed.
Sustainability 2023, 15(22), 16104; https://doi.org/10.3390/su152216104
Submission received: 29 August 2023 / Revised: 18 October 2023 / Accepted: 15 November 2023 / Published: 20 November 2023

Abstract

:
The improvement of urban congestion and the mood of the populace is vital for achieving the United Nations Sustainable Development Goals. This paper aims to test the hypothesis that crowding in urban micro public spaces (UMPSs) affects emotions, and two different methods were used: a psychological questionnaire to measure whether crowding in such spaces elicits negative emotional responses from users and a portable electroencephalography (EEG) device to explore emotional responses. This study was conducted in Shenyang, China, based on the city’s relevant policies and the type and number of micro spaces and micro public spaces, proving that Shenyang City has paid more attention to planning micro spaces and micro public spaces in its urban development. The results show that 1. UMPS crowding awakens negative emotions in users, which affects their intention to revisit the UMPS, and 2. If the UMPS is more attractive to users, it also improves the negative emotions due to crowding, which implies that the attractiveness of the environment does play an important moderating role. This study may inspire the construction concept of UMPSs in different countries and cities, complementing the planning of urban public spaces to provide more social equity. The creation of UMPS has a positive effect on neighborhood interactions, community network construction, and the reproduction of social capital, which can contribute to the sustainable development of cities.

1. Introduction

In recent years, urban areas in China have been facing spatial constraints and saturation, necessitating a shift towards stock planning [1]. In China, “urban sprawl” has resulted in the spatial growth of cities, with megacities accounting for one-eighth of the country’s total land area expansion, reaching 1060 km. Many planned satellite towns have been “annexed” as part of the city’s spatial expansion. This process has led to the internal migration of residents, resulting in localized spatial congestion. As a result, the area of public space enjoyed by urban residents in China is generally tiny. The construction of extensive public spaces in densely populated urban regions is gradually becoming a luxury. As a result, small and micro public spaces, which are decentralized, flexible, and designed on a human scale, will become a more viable alternative that can be more accessible to citizens, frequently applied, and economically efficient in terms of land resource utilization [2]. In order to enhance the concept of healthy design of urban micro and small public spaces as well as the users’ sense of well-being in micro and small public spaces, crowding will be considered; crowding is an important factor affecting human emotions and experiences in other fields of research, so this paper takes the awakening of users’ emotions by crowding perceptions as research content, and provides a strategy for design optimization of urban micro and small public spaces [3].
“Urban micro public space” (UMPS) should be defined as a public space with a small scale, mainly serving urban residents and carrying urban daily life, with a scale usually between 300 and 5000 m2. It is a space type defined as large- and medium-sized urban public spaces, including small street parks, small squares, community gardens, stadiums, and so on [4]. UMPSs exhibit a functional network dimension that integrates with the overall spatial network system, enabling cross-fertilization with culture, economy, and the environment [5,6]. They can also contribute to environmental restoration and facilitate certain beneficial functions such as psychological healing [7]. At the micro-scale, these spaces play a positive role in placemaking and everyday public life. The term ‘micro’ encompasses both the physical aspects of space and the complexities of architectural scale, including human behavior, psychology, and the associated effects [8]. The micro public space directly influences activity behavior, physical form, visual representation, and the range of functions accommodated to facilitate interpersonal interactions [9]. However, in the context of rapid global urban expansion and population growth, there may be a demand for an increase in the supply of urban micro public spaces, leading to potential crowding in certain popular micro public spaces.
In the field of environmental psychology, the distinction between crowding and population density is primarily based on the work of Stokols [10]. The term ‘density’ denotes the objective physical aspect of a spatial scenario, specifically the number of individuals in each defined area, while ‘crowding’ pertains to the psychological dimension characterized by negative perceptions [11]. This psycho-environmental process arises from an individual’s interpretation of a specific social situation as lacking sufficient resources, thereby inducing stress and eliciting negative emotions in the user.
Extensive research has demonstrated the positive influence of urban space size on the physical and mental activities of users. Specifically, UMPSs offer a range of advantages, particularly in terms of enhancing the psychological well-being and self-perception of individuals [12]. UMPSs establish closer connections between users and the natural environment, presenting abundant opportunities for immersive natural experiences. Moyle and Croy have placed significant emphasis on the issue of crowding in outdoor spaces [13]. Findings from related investigations have consistently indicated that crowding has been playing a crucial role in users’ destination choices [14]. Consequently, crowding in urban settings has become a prominent subject of research. Traditionally, the study of congestion has primarily focused on examining the detrimental effects of high population density on physical and mental health, particularly with regard to resident safety and urban sustainability [15]. Crowding has predominantly been investigated within specific contexts such as prisons or hospitals, with other residential settings, including cities, homes, schools, or workplaces, being incorporated gradually over time [16]. Currently, most studies concentrate on individuals’ perceptions of crowding in tourist environments, while only a limited number of studies have explored the impacts of crowding perceptions on negative emotional arousal, environmental attractiveness, and revisit intentions. Furthermore, a dearth of research concerning the perceptions of crowding still exists, specifically within small urban micro and public spaces [17]. Hence, it is imperative to delve into these aspects comprehensively to gain a deeper understanding.
This study addresses two primary inquiries. Firstly, it investigated the impact of user-perceived crowding on emotions, specifically whether it promoted negative emotions in users and subsequently influenced environmental attractiveness [18]. This was accomplished by establishing the structural relationship between users’ perceptions of crowding and their intentions to revisit [19], mediated by the influence of environmental attractiveness. Through the measurement of users’ electroencephalogram (EEG) features and emotional states in response to crowded and non-crowded imagery of small urban micro public spaces across different age groups, the study verified the influence of crowded and non-crowded states on individuals’ negative emotional disposition [20]. Secondly, this research explored the presence of variables that can effectively moderate the effect of users’ perceived crowding on their revisiting intentions. Environmental attractiveness was proposed as a potential moderating variable. Subsequently, the study examined whether the variable of environmental attractiveness can effectively moderate the impact of user-perceived crowding on revisit intentions [21]. In the past, the perception of crowding was mainly a concern for psychology and geography scholars. However, in recent years, it has expanded to other fields, especially urban planning and environment, regional and urban planning, and environmental ecology [22]. The perception of crowding in urban micro spaces and micro public spaces is at the intersection of urban planning and design and psychology, and this study will have a specific contribution to urban planning and environmental psychology.
Regulating crowding has been acknowledged as a crucial indicator of environmental place popularity and its negative impact on stress relief among urban users [23]. Although prior research has primarily focused on tourist crowding and its influence on satisfaction, there has been a dearth of studies examining recreational crowding in urban areas, particularly concerning small green spaces and pocket parks within micro public spaces [24,25]. The study highlighted the moderating role of environmental attractiveness in the influence of positive and negative emotions on users’ intentions to revisit the environment. Consequently, the outcomes of this study can serve as a valuable demonstration of the current usage patterns of small urban public spaces and user feedback regarding their emotional experiences. These findings can provide essential reference data for future design optimization efforts and provide new perspectives for the sustainable development of the urban environment.
The subsequent sections of the thesis progress as follows. Section 2 provides a survey of the relevant literature and presents the research hypothesis. Section 3 describes the data and methods adopted in this study. The empirical results and analytical findings are presented in Section 4. Section 5 and Section 6 provide a summary.

2. Literature Review and Hypothesis

2.1. Perceived Crowding

Crowding perception is a psychological state that distinguishes itself from the concept of density, which quantitatively represents the number of individuals per unit area and can be objectively measured by counting individuals and assessing spatial occupancy [26]. In contrast, crowding perception is an evaluative term that emphasizes an individual’s subjective value judgment. Adopting an environmental psychology perspective, Stokols defined crowdedness perception as an individual’s psychological perception of actually or potentially experiencing inadequate space influenced by a combination of physical, environmental, social, and personal factors [27]. Stokols has further suggested that crowdedness perception encompasses multiple dimensions, classifying it into two primary dimensions: physical crowdedness perception and social crowdedness perception [28]. Physical crowding perception pertains to the perception of spatial constraints resulting from non-human factors, such as facility layouts or spatial distribution [29]. On the other hand, social crowding perception refers to the perception of the number of individuals present in the environment, as well as the frequency and extent of social interactions and engagements [30]. For the purposes of practical research, this study analyzed the crowding perception in terms of social crowding perception, focusing on the impact of other users on an individual’s self-psychology and emotional state during the recreational process.

2.2. Emotional Response and Arousal Theory

The concept of emotion in psychology originated from the understanding of an individual’s stress-induced response to external and internal stimuli within their environment [31]. An emotional response can be characterized as a subjective emotional state that can develop when individuals receive information from their surroundings, influenced by social context and individual factors [32]. Arousal theory, an influential theory in environmental psychology, can be applied to investigate the relationship between the environment and human behavior. It focuses on understanding the connection between an individual’s perceived emotional changes and the environmental stimuli [33]. Arousal theory suggests that the environment interacts with human emotions, and that the stimuli present in the environment can naturally generate emotional fluctuations in individuals [34]. The theory encompasses three essential dimensions: environmental stimuli, emotional appraisal, as well as arousal levels. These dimensions can be examined to explore individuals’ affective experiences within their environment and the impact of the environment on their psychological behavior. Arousing factors within the environment are necessary to generate stimuli capable of arousing individuals. In this study, social crowding was examined as a stimulus for emotional arousal, with a specific focus on exploring whether perceptions of crowding in small urban micro public spaces can evoke negative emotions in users.

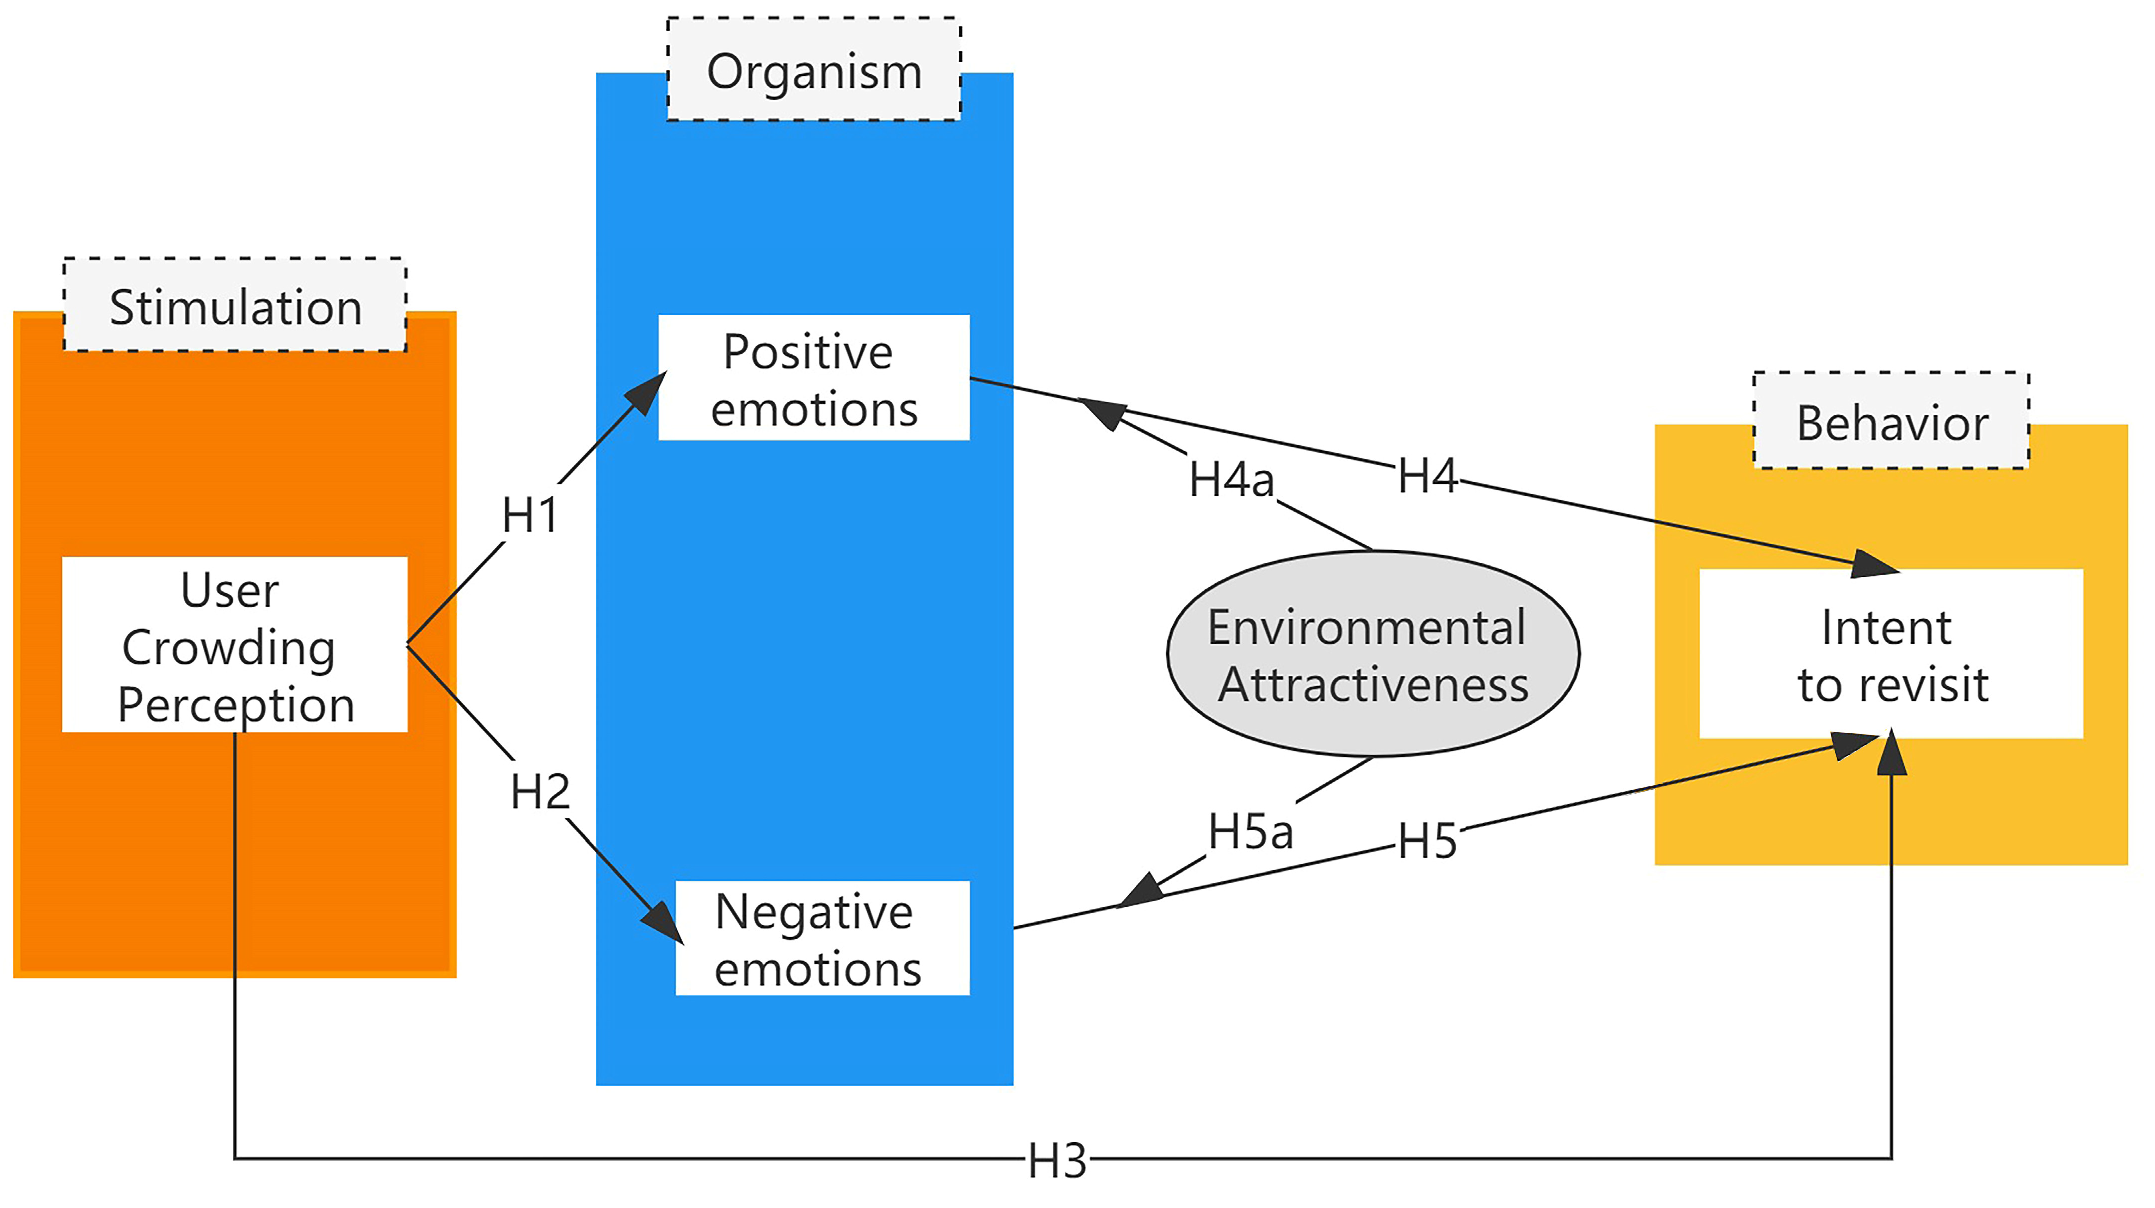
2.3. Stimulus–Organism–Response (SOR) Model

The conceptual framework of this study can be grounded in the SOR model proposed by Mehrabian and Russell [35]. This model presents that environmental stimuli (S) trigger emotional responses (O) in organisms, subsequently leading to corresponding behavioral responses (R) [36]. Based on a comprehensive review and synthesis of relevant studies, it was observed that existing research has primarily focused on users’ responses such as satisfaction, the impact of environmental crowding on environmental attractiveness, and the influence of revisit intentions on environmental attractiveness. However, limited attention has been paid to exploring the arousal effect of social crowding on users’ emotions and the consequential impact of these emotions on revisit intentions. In contrast to an individual’s subjective perceptions, which often shape the nature of their emotions, as well as influence their emotional state in conjunction with these emotions, this study emphasized the relationship between the effects of users’ experiences with social crowding and the manifestation of positive and negative emotions, as well as the implications for environmental attractiveness and revisit intentions.
The user’s perception of social crowding can be regarded as an environmental stimulus, while positive and negative emotions can represent individual subjective perceptions. Revisit intentions, on the other hand, can reflect individual behavioral responses. In this process, environmental attractiveness plays a potential mediating role. Accordingly, a structural relationship model of “perception of crowding–emotional response–intention to revisit” was established, incorporating environmental attractiveness as a moderating variable (Figure 1).
In accordance with arousal theory, individuals require a certain level of spatial, social, and psychological safety distances. When strangers or objects invade this personal space, spatial crowding can induce feelings of anxiety and stress, subsequently generating negative emotional responses, particularly in the context of social crowding [12]. Li et al. proposed that spatial crowding can evoke negative emotions and constrain positive emotions, thereby influencing overall experiential satisfaction [37]. Although social crowding has been suggested to trigger negative emotions such as frustration, annoyance, and anxiety during peak tourism periods including Golden Week, it has also been observed that crowding in specific contexts can amplify positive emotions [34]. For instance, crowding in the setting of festivals, ancient villages, or even night market leisure activities may not adversely affect users’ emotions. Several studies have indicated that crowding can influence users’ willingness to revisit or recommend, though the precise mechanism underlying this effect remains unclear [38]. Thus, the mechanism through which crowding impacts user sentiment in small urban micro public spaces necessitates further investigation. According to the SOR paradigm, a stimulus elicits an emotional reaction from an organism and based on these observations, this study presents the following research hypotheses:
H1. 
A significant negative effect of crowding perception on users’ positive emotional responses.
H2. 
A significant positive effect of crowding perception on users’ negative emotional responses.
H3. 
Perception of congestion produces a significant negative relationship on revisit intention.
According to the SOR paradigm, a stimulus can trigger emotional reflection in an organism, and that organism could then elicit a response. This chain might indicate that the emotional reaction of the organism might play a mediating role in the SOR paradigm. Therefore, crowding of users can be considered as an environmental stimulus. Emotional arousal is considered to be an emotional and cognitive reflection of the organism, while revisiting intentions is considered to be a behavioral response of the organism. Positive emotions have been indicated to exhibit physiological effects such as reducing cortisol levels, suppressing sympathetic nerve activity, and influencing the cognitive processing of environmental stimuli by the human brain [39]. Notably, Wang et al. demonstrated that positive emotions effectively enhanced well-being and amplified the health benefits derived from being in a green space [2]. Conversely, when individuals experience negative emotional states, their cognitive abilities may be compromised, impeding the effective exchange of information between humans and their natural surroundings. Drawing upon the extensive literature reviewed on the impact of crowding perceptions on human emotions, it is evident that studies have consistently proved a link between perceptions of crowding, the development of negative emotions in users, and a decreased likelihood of revisiting the destination. The following hypotheses are proposed that are not sufficiently explored in the existing literature:
H4. 
A significant positive effect of positive emotional responses on users’ intention to revisit.
H5. 
Negative emotional responses significantly negatively affects users’ intention to revisit.

2.4. Environmental Attractiveness, User Sentiment, and Revisit Intentions

Revisit intention is the behavior of a user to travel to a destination; this behavior occurs when the destination is considered special and has natural resources, man-made attractions, or culture [40]. Users’ intention to revisit can be interpreted as the likelihood that residents will revisit a destination. This behavior is considered loyalty or actual action and refers to a person’s or tourist’s willingness to revisit the same destination. Residents interested in revisiting are characterized by their willingness to revisit the same destination and recommend the destination [41].
Crowded and dense environments may cause confusion and frustration among residents and lead to poor experiences. Services in public spaces may not function well in crowded environments, so the negative emotions associated with crowding may affect users’ intentions to revisit environmental destinations [42,43]. The notion of environmental attractiveness builds upon the concept of tourism attractiveness, which was initially proposed in 1927. Notably, following Professor Mariotti from Italy who reported that tourism attractiveness encompassed both inherent and derived aspects, Lew’s concept of tourism attractiveness gained significant influence and widespread acceptance [44]. According to Lew, tourism attractiveness encompasses all the factors and conditions that motivate individuals to leave their places of residence and visit a particular destination for the purpose of enjoyment [44]. It serves as a quantitative measure of a recreational area or facility’s ability to attract users. Holding other factors constant, the abundance of environmental resources directly correlates with the level of recreational attractiveness, thus providing greater incentives for users to visit. Consequently, environmental attractiveness serves as a crucial moderating variable. Based on this understanding, it can be hypothesized that environmental attractiveness plays a moderating role in the relationship between emotional responses and revisit intentions. Therefore, this study formulates the following research hypothesis:
H4a. 
Environmental attractiveness moderates the relationship between positive emotions and users’ intention to revisit.
H5a. 
Environmental attractiveness moderates the relationship between negative emotions and users’ intention to revisit.

2.5. EEG (Electroencephalogram) Emotional Response

In recent years, there has been a significant advancement in research pertaining to the integration of landscape gardening and EEG technology [45]. The utilization of EEG technology in studying landscape emotions has gained prominence over the past decade [46]. This trend reflects the growing interest in exploring the relationship between landscapes and emotional responses through adopting EEG technology. EEG technology has obtained extensive application in various research domains, including landscape gardening psychology, behavioral studies, landscape rehabilitation for health purposes, and assessing the performance of built environments [47].
Emotions are complex physiological and psychological responses exhibited by humans in reaction to external stimuli, intricately related to the functioning of the cerebral cortex [48]. The dimensional emotion recognition model, based on human cognitive appraisal, commonly categorizes the emotion space into two dimensions: valence and arousal. Valence pertains to the positive and negative natures of emotions, while arousal relates to the intensity or activation level of emotions [49]. EEG activity observed in the left frontal region of the brain can be generally associated with positive emotions, conveying an upbeat disposition, whereas that in the right frontal region is frequently associated with negative emotions [50]. Furthermore, emotional valence is also discerned through distinctive frequency responses. For example, prefrontal lateralization of alpha waves is indicative of positive or negative emotions, while beta and theta waves can reflect various emotional processes [51]. Therefore, in this paper, we choose the experimental method of EEG measurement to determine the effect of crowding on human emotions through the changes of α-band and β-band.
This study aimed to validate the structural relationship model of “perception of crowding–emotional response–intention to revisit”. It was an experimental protocol implemented in a crowded urban micro public space. By designing an experimental scenario that was able to trigger emotions within a crowded setting, the emotional responses of participants were assessed and validated through a specific example.

3. Materials and Methods
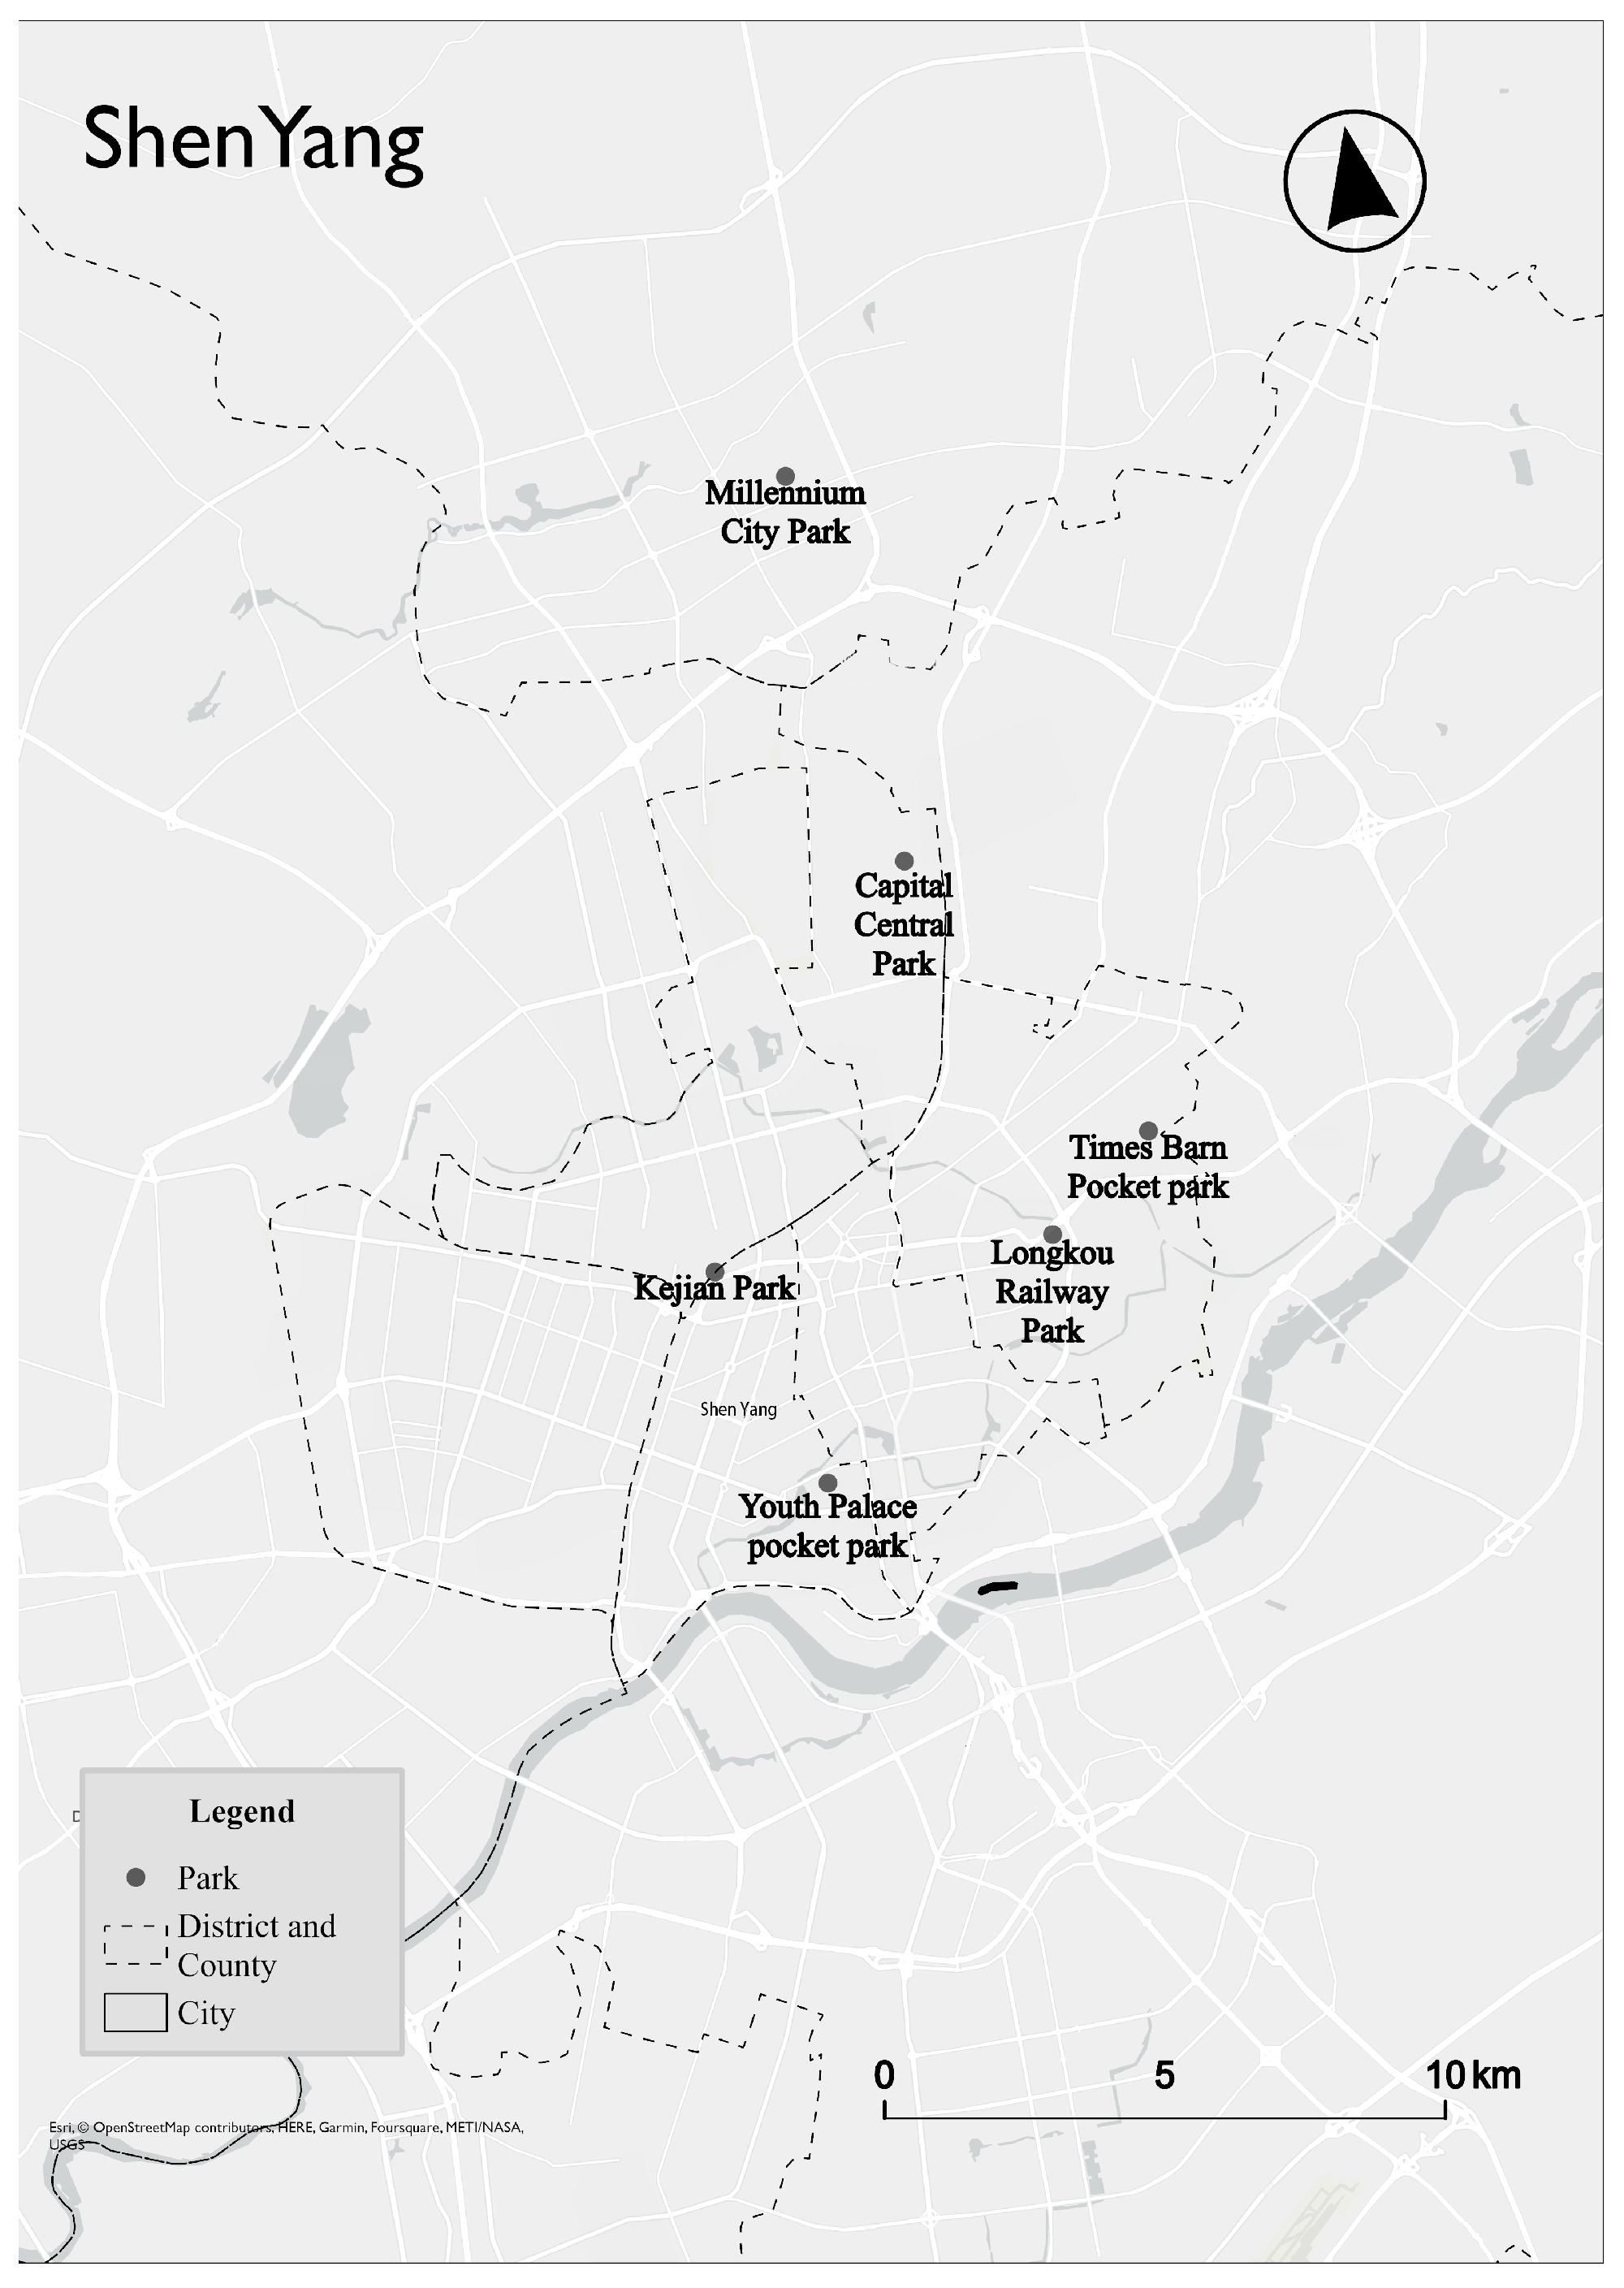
3.1. Study Area

In December 2020, a framework agreement was signed between the Ministry of Housing and Construction and the Liaoning Provincial Government to construct an urban renewal pilot zone. In November 2021, Shenyang was designated as one of the first pilot cities for urban renewal in China. A significant development in 2021 was the construction and renovation of 1070 new urban micro public spaces in Shenyang. Furthermore, in 2022, an additional 1000 micro public spaces were planned to be established, aimed at enhancing the accessibility and proximity of micro public services. These initiatives highlighted the Shenyang municipal government’s commitment to exploring innovative approaches to participatory urban regeneration and the enhancement of urban governance capacity, with a particular emphasis on the utilization of small and micro public spaces as instrumental mediums. Based on the above description, we understand that small and micro public spaces are significant in the future urban planning policy of Shenyang City. Therefore, in this study, we focus on the small and micro public spaces in the main urban area of Shenyang City.
To ensure the adequacy of the sample size for statistical analysis, according to the “Chongqing Urban Small and Micro Public Space Renewal Guidelines (for Trial Implementation)”, from the perspective of governance, it is more meaningful to categorize and identify small and micro public spaces by clarifying the design, construction, management, and maintenance of the main body. Based on this, small and micro public spaces are categorized into four types: community living type, public visiting type, infrastructure type, and unit territorial type.
Micro public spaces can exhibit unique spatial forms, functions, and patterns of usage. According to the previous research on urban public space, large-scale places are often dominated, and the research on small and micro public spaces needs to be addressed. In order to make up for the research gap, this study takes urban small and micro public spaces as the primary research place. Although the scale of micro and small public spaces is small, the type is wealthy, including unit entrances, community entrances and exits, walking paths, street green spaces, pocket parks, community gardens, community squares, and other unused small public spaces. There are many unrecognized micro and small spaces, some of which have a blurred boundary, so this study researched Shenyang City’s micro and small public spaces and selected the street green space, the community garden, the small square, and so on, in order to ensure the familiarity of people with the public spaces in question. The primary research sites were street-side green spaces, pocket parks, and community gardens (Table 1). Each of these three spatial options meets the needs of the groups most likely to use the space, e.g., a corner green space can present a biodiverse environment and provide opportunities for walkers to engage with the natural landscape; a pocket park has more functions. Because of this, we focused our investigation on six representative small urban micro public spaces in relatively densely populated and well-planned locations (Figure 2).

3.2. Participants

In the current society, individuals across various age groups face diverse stress sources, such as academic pressure, familial responsibilities, occupational demands, and general life challenges. Middle-aged and elderly individuals, in particular, have been experiencing declining physical conditions, rendering them more vulnerable to the physiological and psychological impacts of both internal and external factors. They are highly susceptible to stress and anxiety induced by their surrounding environment. Given their extensive engagement with urban micro and public spaces, these age groups possess valuable experiential insights and feedback regarding their crowding perception in UMPS. Therefore, although our study included participants from different age groups, we emphasized a more complete representation of the middle-aged and elderly population to ensure a focused selection ratio.
The study consisted of administering a questionnaire and conducting EEG data measurements. The questionnaire was administered online, and 609 samples were collected. For the EEG experiment, 18 participants were selected from different age groups based on the questionnaire responses, including 9 males and 11 females. Before their inclusion in the study, all participants provided informed consent and had either normal or corrected-to-normal vision. Due to the Emotiv EPOC electroencephalograph’s high sensitivity and the requirement for participants to remain stationary during data collection, conducting live dynamic measurements outdoors may lead to significant data errors. Therefore, a quiet indoor space was selected as the experimental site to ensure optimal operation conditions.

3.3. Instruments

3.3.1. Questionnaire Design

The questionnaire utilized in this study encompassed four distinct sections: Demographic Characteristics, Crowding Perception Scale, Emotional Response Scale, and Environmental Attractiveness Scale (refer to Appendix A for a detailed overview of the questionnaire and its items) [30]. The Demographic Characteristics section captured essential participant information, such as gender, age, education, income, occupation, and marital status, as well as the motivations and locations of their visits. The Crowdedness Perception Measurement [33] Scale was developed based on established definitions of crowding and tourist crowding, with adaptations made to an existing scale to suit the context of the study. The Emotional Experience Scale [52] was crafted by incorporating principles from emotional psychology theory and tailored to the specific contexts of small urban micro public spaces. The Mood Experience Scale [53] measured users’ perceptions of anxiety, regret, disappointment, happiness, and joy following visits to street-side green spaces, pocket parks, and community gardens. Environmental attraction was measured by using the seven items recommended by Hu and Ritchie [54] and Li et al. [37]. Revisit intention was measured using one item [55]. These items were measured using the five-point Likert-type scale from strongly disagree to agree strongly.
The data collection for the questionnaire was conducted between October and November 2022, employing a random sampling method. Questionnaires are mainly distributed online because the sample of online questionnaires is more random and it is easier to spread the sample. The survey specifically targeted users of urban micro and public spaces. It utilized the questionnaire to gather site-specific statistics. The results revealed that 66.14% of individuals resided in areas with street-level green spaces, 40.56% had access to pocket parks, and 53.44% had access to community gardens. This indicated a significant portion of users had various types of urban micro and public spaces within their living environment (Table 2). Prior to completing the questionnaire, a concise explanation of the questions and their content was provided to ensure thorough understanding among participants. Throughout the survey period, a total of 609 questionnaires were distributed, of which 567 were deemed valid after careful collection and collation, resulting in a robust response rate of 93.1%. Data analysis and the examination of the structural equation model were conducted using SPSS 26.0 and Mplus 8.3 software.
Note: Based on the information presented in Table 3, a majority of individuals residing in proximity to their residences had access to street-side green spaces, constituting approximately 66.14% of the sample population. Moreover, the primary motivation for visiting small urban micro public spaces, including street-side green spaces, pocket parks, and community gardens, was to alleviate stress and seek relaxation, accounting for a significant proportion of 76.72%.

3.3.2. Physiological Instrument: Emotiv EPOC-Based EEG Data Collection

The brain, the highest part of the human central nervous system, is the basis of all consciousness and spirituality. EEG technology connects with the surface of the human head through electrodes to record the electrophysiological signals on the surface of the cerebral cortex or scalp [39]. Moreover, different potential changes can affect a person’s psychological activities and cognitive behaviors. EEG analysis technology has gradually become essential for landscape garden evaluation, analysis, design, and research. EEG equipment has the technical advantage of objectivity and stability and accurately analyses human emotions and cognition from the brain science perspective [56].
Emotion is human beings’ physiological and psychological reaction to the stimulation of external things, which is closely related to the cerebral cortex [57]. EEG technology, as a newly developed technology in landscape architecture, compared with the traditional subjective questionnaire measurement and other physiological technical means, has the advantage of being more accurate and objective. Researchers usually combine scientific EEG technology with subjective questionnaires to explore the interaction between individual residents and the urban environment from psychological and physiological perspectives and improve residents’ well-being [58].
The Emotiv EPOC (Emotiv Systems, San Francisco, CA, USA), a low-cost EEG device, incorporates 14 channels for capturing EEG data along with a gyroscope measurement. The EEG channel locations adhere to the International 10–20 system, specifically positioned at AF3, F7, F3, FC5, T7, P7, O1, O2, P8, T8, FC6, F4, F8, and AF4 (Figure 3). To establish a reference point, two electrodes placed just above the participant’s ear (CMR/DRL) were employed, with one electrode assigned to each hemisphere of the head. Internally, the Emotiv EPOC operated at a sampling rate of 2048 Hz, which was then transmitted to the computer at a rate of 128 Hz via Bluetooth. Prior to the application, it was essential to moisten all the felt pads on top of the sensors with saline solution [28]. This study was conducted in an undisturbed indoor environment. In a previous evaluation conducted by Alejandro Rodríguez, Beatriz Rey, Miriam Clemente, Maja Wrzesien, and Mariano Alcañiz [59], the Emotiv EPOC headset was assessed for usability during emotion elicitation using mood pictures. Previous research has indicated that the Emotiv EPOC headset can exhibit potential as an objective assessment tool for investigating emotional processes [14].

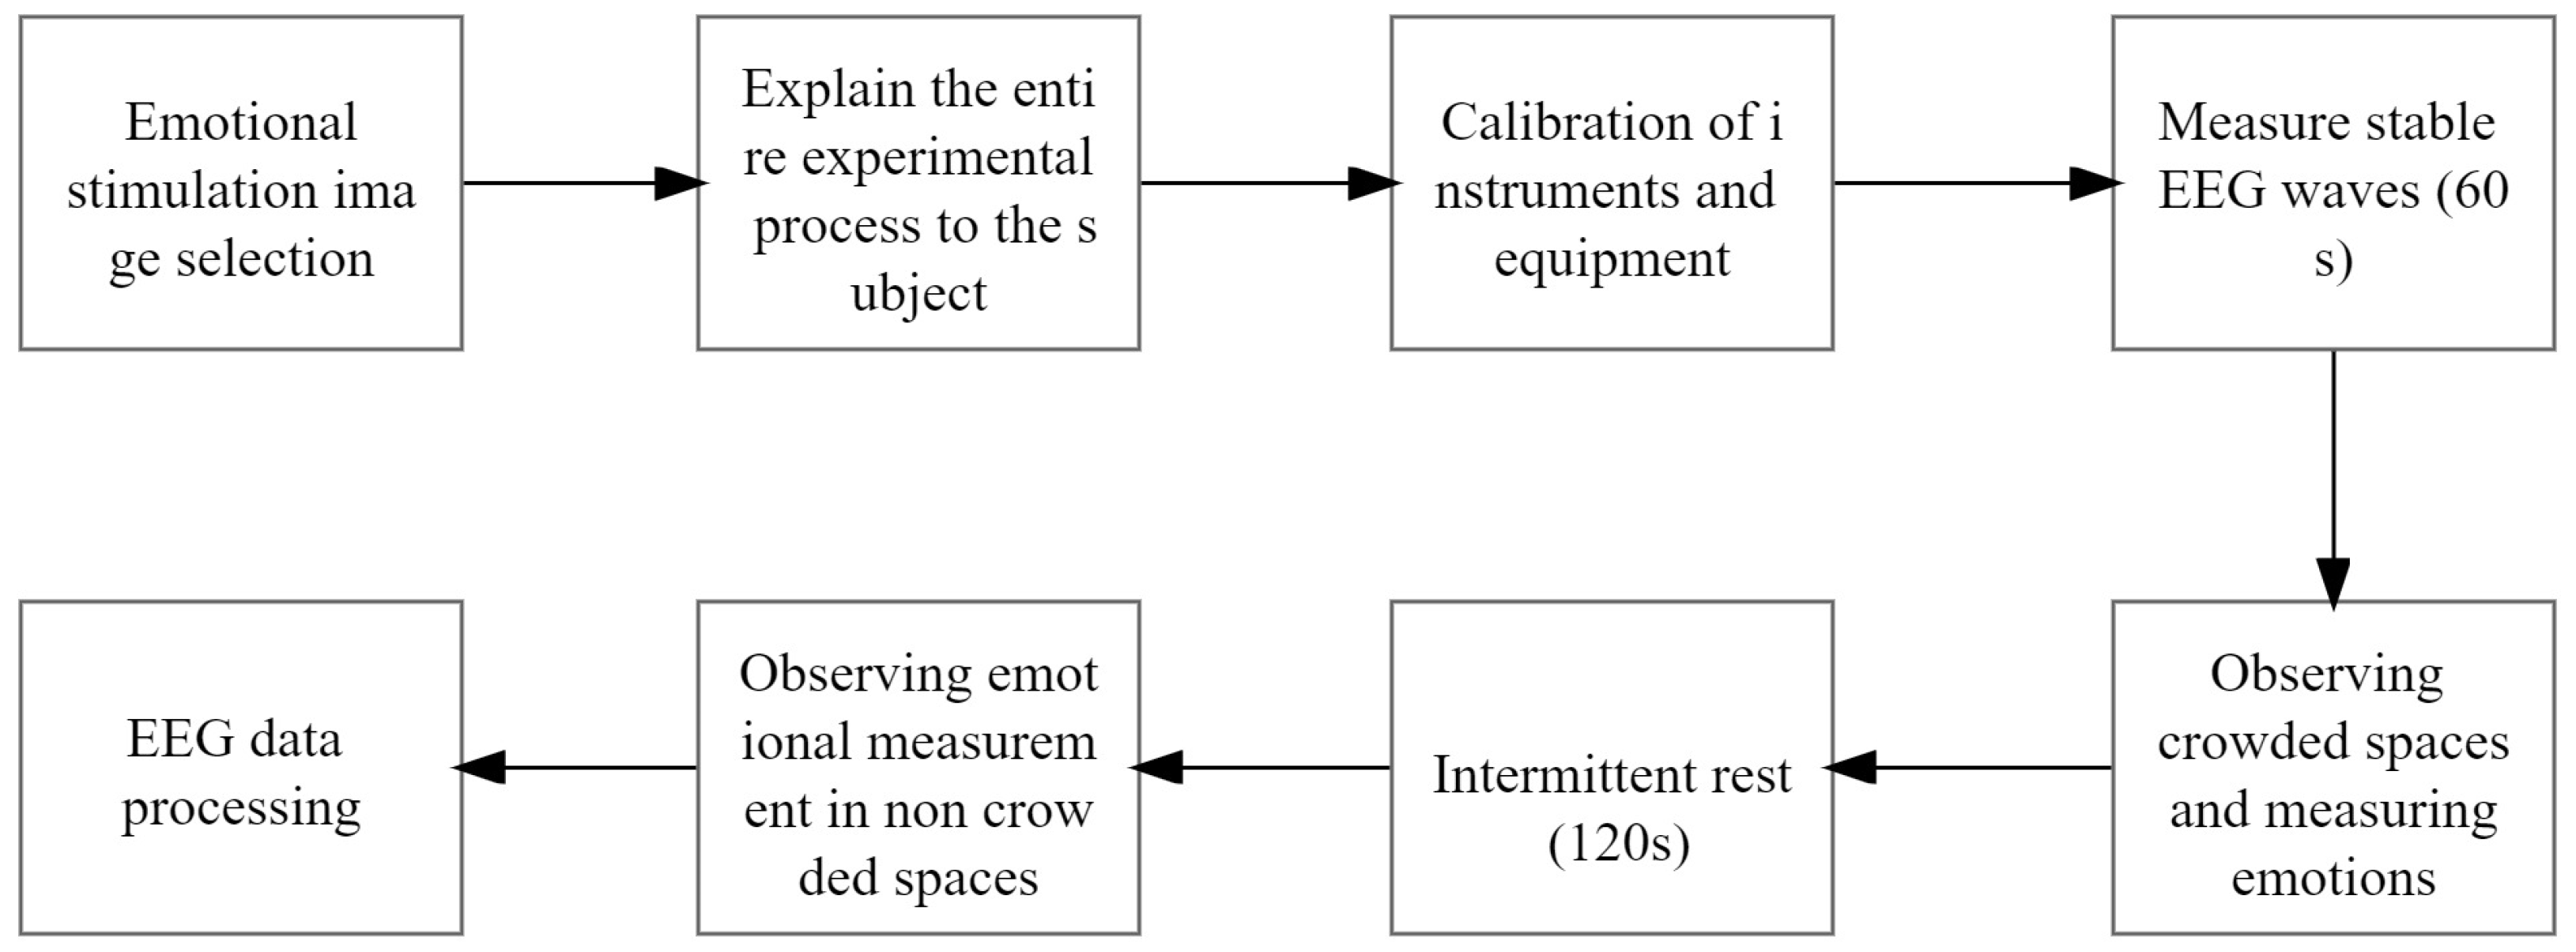
3.3.3. Experimental Design

The experimental part of this paper wants to measure whether the crowdedness of urban micro public spaces will cause negative emotional responses in users through physiological experiments, and compares the EEG physiological responses of users in crowded and uncrowded states according to previous relevant studies is a more direct and reliable method. In order to ensure the stability and accuracy of the data, a quiet indoor environment was chosen for the test site. Therefore, this experiment was conducted with one group of subjects in both crowded and uncrowded conditions.
This experiment adopted the 1 × 2 (crowded/uncrowded) within-subjects experimental design to investigate the impact of crowded and uncrowded conditions in small urban micro public spaces on human emotions, as observed through EEG activity with specific indicators of alpha (8–12 Hz) and beta (13–28 Hz). All subjects were given the same task, and upon arrival at the designated indoor environment, participants provided informed consent, researchers installed EEG headphones and Emotiv sensors, and data-logging tests began. Successful testing led to the formal experimental condition, in which each subject viewed separate pictures representing two categories, crowded and uncrowded. The valid time for each category of pictures was 60 s. The EEG device underwent a 30-s baseline alignment to ensure accurate data collection before the test commenced. The EEG device continuously captured and stored brainwave data on a hard disk throughout the experiment. Before the post-test phase, a verification process confirmed the proper functioning of the EEG device. Participants were instructed to remain fixed and focus on the presented pictures without leaving their seats. After a duration of 90 s, the entire procedure was completed, with the total time strictly controlled to 15 min or less (Figure 4). Two additional participants were recruited for this experiment to compensate for data loss due to technical issues during data recording. It was more significant with 18 participants as it was conducted in a relatively quiet and stable environment; therefore, the final dataset consists of data collected from 18 participants [60].
The EEG data of all participants were processed through the MATLAB 2022a platform with the EEGLAB 2023.0 toolkit. The pre-processing of data involved electrode placement, removal of faulty leads, application of band-pass filters (0.1–40 Hz), and noise reduction by independent component analysis. This resulted in the selection of valid data from 18 participants. Subsequently, the pre-processed data underwent spectral analysis, following a specific procedure. Firstly, the continuous EEG data of each subject were divided into segments of 2 s. Then, the data were categorized and overlaid according to the specific condition type. Finally, the EEG activity within the target frequency bands (α/β) was isolated for further observation.

3.3.4. Data Analysis Tools and Methods

The data were subjected to analysis through the application of the statistical package process 4.1 and Mplus version 8.3, employing the technique of structural equation modeling (SEM). SEM can represent, measure, and analyze complex relationships between sample data using model equations. Among them, confirmatory factor analysis (CFA) is a research method used to measure whether the correspondence between factors and items (scale items) is consistent with the researcher’s predictions, and structural modeling focuses on sorting out the causal relationships between factors. Following the recommendation of Anderson and Gerbing, the SEM analysis involved two stages. In the first stage, a validated factor analysis (CFA) was conducted to assess the validity and reliability of the structures and items utilized in this study. This step aimed to ensure the robustness and integrity of the measurement model. Second, Process 4.1 was employed to analyze the structural model and clarify the causal relationships between the constructs. Next, moderating effects were analyzed using the Process Macro Model 4. The collected EEG data will first be pre-processed, including removing bad leads, filtering the data, and independent component analysis for artifact removal and noise reduction.

4. Results

4.1. Descriptive Statistics

The socio-demographic profile of the participants is presented in Table 3. Females (53.44%) slightly outnumbered males (46.56%). Approximately 43.21% of the participants were aged between 18 and 45, with 15.34% falling within the age range of 26–35, 21.87% within the age range of 36–45, and 55.56% within the age range of 46–65. Only a small proportion (1.23%) of participants were over 65 years old. In terms of occupation, 41.8% were employed in enterprises and institutions, and 56.61% worked in the service sector.

4.2. Measurement Model Validation

Mplus is a widely used statistical analysis software that is powerful and particularly suitable for structural equation modeling (SEM), offering a wide range of SEM analysis capabilities, including exploratory and validation factor analyses. Mplus can handle many data structures and types and is suitable for complex data and models. Using Mplus 8.3 software, an exploratory factor analysis was performed to remove items with factor loadings below 0.5. The validation was then conducted by CFA, and the model fit met the acceptable criteria [61,62] (Baumgartner and Humboldt, 1996; Hu and Bentler, 1999) (χ2 = 242, χ2/df = 2.27, p < 0.001), RMSEA = 0.059 < 0.08, SRMR = 0.052 < 0.08, CFI = 0.935 > 0.9, and TLI = 0.926 > 0.9.
Verification of the convergence validity of the measurement model was assessed by two criteria. The first was that the standardized factor loading for each item corresponding to the construct should exceed 0.5. The second was that the average variance extracted (AVE) for each construct should exceed the cut-off value of 0.5. The standardized factor loadings and AVE values are displayed in Table 3. The results demonstrated that all items had standardized factor loadings within the recommended range. For example, the factor loading for spatial crowding ranged from 0.763 to 0.78; for crowding, it ranged from 0.772 to 0.784; for positive and negative sentiment, it ranged from 0.69 to 0.764; and for environmental attractiveness, it ranged from 0.789 to 0.838. The AVE values exceeded 0.5 for all dimensions, and the composite reliability (CR) values exceeded 0.7 for the potential structure.
This study produced correlation analyses of the relationship between feelings of crowding and four variables (positive emotions, environmental attractiveness, negative emotions, and intention to revisit). Pearson’s correlation coefficient was utilized to assess the strength of these relationships. Notably, significant correlations were observed between crowding perception and positive emotions, environmental attractiveness, negative emotions, and intention to revisit, with a coefficient of −0.230 at a significance level of 0.01. The correlation coefficient between crowding perception and environmental attractiveness was −0.193, indicating a significant negative relationship at the 0.01 significance level. Similarly, the correlation coefficient between crowding perception and negative emotions was 0.206, revealing a significant positive relationship at the 0.01 significance level. Furthermore, the correlation coefficient between crowding perception and the intention to revisit was −0.339, indicating a significant negative correlation at the 0.01 significance level.

4.3. Structural Model Testing

A structural model was adopted to verify the relationships among the potential variables. The fitted indicators of the structural model were feasible. H1, H2, H3, H4, and H5 were supported according to the data presented in Figure 1 of the conceptual framework.
As shown in Table 4, the analysis revealed that the coefficient of crowding on positive emotions was −0.212 and statistically significant (p < 0.05), indicating a significant negative relationship between crowding perception and positive emotions. Similarly, the coefficient of crowding perception on negative emotions was 0.221 and significant (p < 0.05), suggesting that crowding perception had a significant positive impact on negative emotions. Furthermore, the coefficient of crowding perception on revisit intention was −0.218 and significant (p < 0.05), indicating that crowding perception had a significant negative influence on revisit intention. In contrast, the coefficient of positive emotions on revisit intention was 0.392 and significant (p < 0.05), demonstrating a significant positive effect of positive emotions on revisit intention. Conversely, the coefficient of negative emotions on revisit intention was −0.443 and significant (p < 0.05), indicating a significant negative impact of negative emotions on revisit intention. Overall, the model fit indices χ2/df = 2.034, RMSEA = 0.043, CFI = 0.987, and TLI = 0.983 met the recommended thresholds (χ2/df < 3, RMSEA < 0.08, CFI > 0.9, TLI > 0.9), indicating a sound fit of the model to the data.

4.4. Moderated Mediation Effect

To examine the mediation through moderation, we employed process 4.1 to assess the mediation effect of −0.083 from crowding perception to positive emotion to revisit intention. The 95% confidence interval for this mediation effect did not include 0, indicating the presence of mediation. Similarly, the mediation effect of −0.098 from crowding perception to negative emotion to revisit intention was observed, and the 95% confidence interval did not contain 0, confirming the presence of mediation. In both cases, the non-zero values within the 95% confidence intervals indicated the validity of the mediating effects.
The moderating role of environmental attractiveness on the relationship between positive emotions and intention to revisit is evident in the results of the moderation analysis, examining the relationship between environmental attractiveness, positive emotion, and intention to revisit. The coefficient for the interaction term positive emotion × environmental attractiveness was 0.339, and it reached statistical significance (p < 0.05). This finding indicated that environmental attractiveness served as a positive moderator in the relationship between positive emotion and revisit intention. In other words, when environmental attractiveness was high, the positive impact of positive emotion on revisit intention can become more pronounced and influential.
As shown in Table 5, moderating mediator 1 demonstrated that, for the mediating variable of positive emotion, the boot 95% CI included the number 0 at low levels, which suggested that there was no mediating effect at this level; at the mean level, the boot 95% CI did not include the number 0, indicating a mediating effect at this level, as did the effect value of −0.086; at high levels, the absence of the number 0 in the boot 95% CI represented a mediating effect at this level, with an effect value of −0.134. In summary, the analysis indicated that the mediating effect was inconsistent at different levels, indicating a moderating mediating effect.
Environmental attractiveness has a moderating role on the relationship between negative emotions and intention to revisit. The coefficient of the interaction term negative emotion × environmental attractiveness was 0.467 and statistically significant (p < 0.05). This finding suggested that environmental attractiveness positively moderated the association between negative emotion and revisit intention. Specifically, when environmental attractiveness was low, the detrimental impact of negative emotion on revisit intention was more pronounced, indicating a stronger negative effect.
Table 6 presents the results of the mediation analysis for the mediating variable of negative emotion. At low levels, the bootstrapped 95% CI did not include zero, which indicated a significant mediating effect at this level, with an effect value of −0.139. At the mean level, the bootstrapped 95% CI also did not include zero, which can suggest a significant mediating effect, with an effect value of −0.075. However, at high levels, the bootstrapped 95% CI includes zero, indicating no mediating effect at this level. In summary, the analysis revealed inconsistent mediating effects at different levels, indicating a moderating mediating effect.
To illustrate the moderating effect, a figure was generated for depicting the predicted environmental attractiveness in relation to higher or lower levels of negative and positive emotions (Figure 5), serving as moderating variables. The findings revealed that negative emotions exerted a more pronounced adverse impact on revisit intentions when environmental attractiveness was low, while positive emotions exhibited a more substantial positive effect on revisit intentions when environmental attractiveness was high. Figure 6 provides an overview of the overall results, indicating whether the proposed hypothesis was supported.

4.5. EEG Emotional Arousal Results

The crowded stimulus exhibited weaker activation in the right temporal lobe compared to the uncrowded condition [26]. Similarly, in the beta band, the left hemisphere indicated reduced activation compared to the uncrowded condition. These findings suggested that decreased activity in these regions during crowded conditions triggered a certain level of negative emotion among the participants. It was recognized that alpha and beta waves in the EEG were associated with relaxation and tension states, respectively, while the right temporal lobe was implicated in emotion perception. The parallel results of the current experiment validated the aforementioned conclusion regarding neural responses. Specifically, they affirmed that the uncrowded environment of a small urban micro public space facilitates heightened activation in the brain’s temporal lobe, thereby eliciting positive emotional responses in the participants (Figure 7 and Figure 8).

5. Discussion

The level of crowding in urban micro public spaces serves as a crucial indicator of spatial planning effectiveness in a given destination. Although attention has been directed towards crowding in tourist destinations, this study specifically focused on the emotional impact of social crowding in urban micro public spaces [63]. Through the application of both psychometric and physiological measures, the study aimed to assess the arousal of negative emotions among users in two distinct conditions: crowded and uncrowded. Six micro public spaces, representing three types (pocket parks, street-corner green spaces, and community parks) in Shenyang City, Liaoning Province, China, were selected to examine the influence of social crowding on users’ emotional responses and revisit intentions. Additionally, the study investigated whether environmental attractiveness was able to mitigate users’ negative emotions and influence their revisit intentions [64]. Large commercial premises and some units in the urban center are densely populated, and the surrounding public space is missing, although the small and micro public space that has been built, such as pocket parks, can be perfect in the conditions of the land constraints to alleviate the problem of space constraints and to improve the living environment of the residents [65]. However, the number of built and renewed small and micro public spaces in the city may still need to meet most people’s use. Take Shenyang Youth Palace Pocket Park as an example. The surrounding gathering of businesses, medical infrastructure, schools, city parks, attractions, and other people-intensive spaces are still unable to meet people’s demand for public space, resulting in crowded conditions during peak hours, affecting the attractiveness of the small and micro public space, the crowd’s intention to revisit, and the unwillingness to carry out too many stays and ornamental and physical activities. It harms urban traffic, urban image, and urban environment [66]. Through these investigations, this study aimed to determine the impact of social crowding on users’ emotional experiences and revisit intentions, while also exploring the potential role of environmental attractiveness in alleviating negative emotions and fostering revisit intentions.
EEG has been used for many years and is certainly considered a safe procedure that does not cause discomfort. These electrodes are passive and do not produce any sensation on the user’s side [67]. However, the reliability and validity of EEG measurements can be questioned in field studies, so we chose to conduct our experiment in a quiet indoor environment [68]. As this experiment has a degree of uncertainty (see Section 5.4), a more in-depth study is needed. As the sample size of the psychometric measurements was significant and could not be matched by the sample size of the EEG measurements, we have taken the psychometric results as the primary study and the physiological indices of the EEG as a secondary study. However, it can be considered a valuable tool in urban small and micro public spaces as a precedent for research on the relationship between perceived crowding on mood, environmental attractiveness, and revisit intention. A complete combination of psychometric and EEG-physiological indicators is also expected to be studied in the future.

5.1. Crowding Perception on Emotional Arousal

Previous studies have shown that increasing exposure decreases visitors’ acceptability and positive emotions (e.g., happiness, relaxation, and excitement) about the level of use [69]. Social carrying capacity norms can be used as an important management tool in public spaces to develop management strategies for visitor use in order to maintain high-quality environmental experiences and positive moods and to increase willingness to revisit [70]. This is consistent with our findings.
Firstly, the impact of perception of crowding on emotional responses was examined through adopting psychometric measures. The findings revealed a significant negative effect of perception of crowding on users’ positive emotional responses, indicating that crowding evoked a reduction in positive emotions among users [69]. Conversely, a significant positive effect of perception of crowding on users’ negative emotional responses was observed, suggesting that crowding triggered the arousal of negative emotions in users. These results indicated that the perception of crowding in small urban micro public spaces was associated with the generation of negative emotions [71]. Our results agree with the hypothesis that negative emotions are evoked in crowded environments. Furthermore, our analyses of brain activity suggest that this is associated with reduced attentional control and higher physiological arousal [72]. Overall, these ideas are consistent with earlier theories about the “cognitive complexity” associated with crowding. Consequently, this negative emotional experience may lead users to develop a disliking for revisiting such environments in the future [73].
Secondly, the study further corroborated the role of crowding as an emotional elicitor by employing physiological measures [74]. Specifically, the investigation focused on the induction of negative emotions in users due to crowding. Moreover, in this study, brain activity was assessed through two conditioning strategies: crowded and non-crowded conditions. EEG signals were measured using Emotiv EPOC [75,76] in both conditions. Consistent with the findings from the subjective evaluation study, the results from the physiological analysis aligned. Specifically, significant evidence emerged indicating that subjects experienced a pronounced negative emotional state in the crowded condition.

5.2. Relationship between Perception of Crowding and Mood and Revisit Intention

Firstly, it was evident that positive emotions exhibited a noteworthy positive impact on revisit intentions, whereas negative emotions exhibited a significant detrimental effect on revisit intentions [77,78]. It was important to recognize that social crowding did not directly influence revisit intentions as its influence operated indirectly through emotions. Consequently, emotions played a mediating role in the relationship between physical crowding and revisit intentions [79]. The significance of emotion as a mediator in the association between social crowding and revisit intentions expanded our comprehension of the mediating function of emotion in this context.
Secondly, this study provided empirical evidence supporting the notion that environmental attractiveness can moderate the influence of positive and negative emotions on revisit intentions [80]. This suggested that environmental attractiveness acted as a moderator in the relationship between emotions and revisit intentions. Specifically, in micro public spaces characterized by high environmental attractiveness, the negative impact of users’ negative emotions on revisit intentions may not be exacerbated. Conversely, in micro public spaces with low environmental attractiveness, the positive influence of users’ positive emotions on revisit intentions may be affected. This finding aligned with prior research highlighting the significant positive impact of environmental attractiveness on revisit intentions. Consequently, if users perceived a micro public space as visually appealing, it may attenuate the effect of emotions on their likelihood of revisiting [81]. This study not only investigated the influence of crowding on emotional states but also enriched our understanding of the moderating role of environmental attractiveness. It underscored the significance of environmental attractiveness in small and micro public spaces, providing a valuable strategy for future design optimization in these settings.

5.3. Implications for Urban Sustainability

Rational planning and design of urban public space can not only improve the image and quality of a city and attract talent and investment, but it can also promote the sustainable development of the city [82]. As the grassroots organization of the urban public space system, the urban micro public space is also the “vitality cell” of the urban living environment. It will promote the construction of child-friendly, all-age-friendly, green, and healthy public space systems in neighborhoods and communities. This study demonstrates the impact of the environment on people’s emotions through the perception of crowding in micro and small public spaces, thereby improving residents’ quality of life.
Understanding the intricate relationship between urban micro public spaces and the emotional well-being of urban dwellers is crucial for optimizing the design of such spaces and promoting overall urban sustainability and human well-being [83,84]. Our study findings demonstrated that crowded environments can trigger negative emotions in individuals, while positive emotions were associated with intentions to revisit these environments. Moreover, we have identified that the attractiveness of the environment is playing a moderating role in this relationship. These insights have clear implications for the optimal siting, layout, and design of small urban micro public spaces to foster positive urban emotions [82]. In addition, urban micro and small public spaces can constitute a vital component of urban planning, characterized by their small scale and large number, serving as daily gathering places for urban residents and reflecting the essence of urban life [85]. These spaces can be deeply integrated into every corner of the city, providing accessible and frequently utilized spaces for ordinary citizens, particularly disadvantaged groups at the grassroots level [86]. They serve as the foundation of grassroots urban life and the physical manifestation of residents’ daily routines, which can reflect their needs [9]. Therefore, when conceptualizing and designing small urban public spaces, it is imperative to consider human emotions in order to optimize the site layout, infrastructure, and overall perception, thereby enhancing their equitable availability, accessibility, and attractiveness [87,88].

5.4. Limitations of the Study and Future Perspectives

This study is still subject to certain limitations. Firstly, although this study has provided valuable insights into the association between crowding and users’ emotions, caution should be applied in generalizing the findings due to potential variations in crowding perceptions resulting from environmental factors across different seasons. Further research is required to explore and compare the effects of users’ perceptions of crowding in diverse environmental contexts, which would necessitate the design of specialized EEG equipment capable of capturing data in these specific settings [89]. Secondly, the EEG equipment utilized in this study was primarily suited for controlled indoor environments characterized by tranquility and smoothness. In order to minimize potential fatigue in subjects, our experimental setup consisted of a small number of stimuli, which inevitably limited the presented environment [90]. Due to the experimental equipment’s functional limitations, we could only conduct our tests in a quiet indoor environment. Due to our experimental design, the effects of subjective experience and environmental evaluations could only be studied in a between-subjects analysis. Future work could investigate how other types of urban environments and multiple levels of social density interact and infuse people’s attention, cognition, and subjective experience. To gain a more comprehensive understanding, future studies should enhance the design of EEG equipment to enable data collection on-site in small urban micro public spaces, allowing users to experience the actual crowdedness of these environments firsthand [75]. This may help gain distinct findings that can capture the nuanced dynamics of emotions in small urban public spaces.
Urban micro spaces and micro public spaces are advantageous in many ways, and this paper provides strategies for optimizing urban public spaces and improving healthy urban habitats through the feedback of human emotions [91,92], which is essential in current sustainable urban development. Firstly, the many potential locations throughout the city make it more feasible to develop urban micro spaces and micro public spaces than large public spaces to maximize proximity to residents’ lives. Second, the accessibility of urban micro spaces and micro public spaces facilitates daily outdoor activity destinations for nearby residents and reduces the pressure on other urban public spaces to be used during normal times. Third, urban micro public spaces may help foster stronger community relationships. Finally, highly accessible micro and small spaces will improve the living conditions of residents in disadvantaged neighborhoods compared to larger urban public spaces. It is hoped that our study will provide some strategies for improving healthy urban living environments by increasing the number of small micro public spaces for daily outdoor activities of neighborhood residents and reducing the pressure to use them. In addition, building urban micro public spaces can promote people’s health.

6. Conclusions

The purpose of the current study was to determine if perceptions of crowding in small urban micro public spaces can evoke negative emotions in users. First of all, according to analysis of the previous literature, most of the research on the perception of crowding focuses more on the investigation of user satisfaction and loyalty, and a small portion of the research considers the relationship between the attractiveness of the user and the destination and tends to focus on large-scale venues such as tourist attractions and urban parks as the main object of research. There needs to be more research related to crowding in small and micro urban public spaces. Whether the environment can make people feel good is considered an essential indicator of the popularity of the environment, and the degree of crowding may be one of the reasons why people have a negative perception of the environment. In order to construct urban micro public spaces that can promote people’s health, this study focuses on the emotional arousal of crowding perception.
Moreover, our findings indicated a positive association between users’ levels of positive emotions and their intention to revisit various types of micro public spaces, including pocket parks [1,44], street-corner green spaces, and community parks. Notably, the attractiveness of these urban micro public spaces emerged as a significant factor influencing users’ revisit intentions. These insights hold substantial implications for urban and landscape planners seeking to enhance user satisfaction and optimize the design of micro public spaces. Perceived crowding may hurt human emotions. Since negative emotions exacerbate the negative impact of perceived crowding on the attractiveness of the environment, environmental managers should endeavor to provide a comfortable, relaxed atmosphere and a safe environment for crowds so as to help people have an excellent emotional experience during recreation [93]. For example, they are enhancing environmental management, arranging executives to carry out safety supervision, and controlling the crowds when necessary, optimizing the layout of public infrastructure, increasing the number of small and micro public spaces in areas where crowds are more concentrated, and dispersing the flow of people. A relaxed and comfortable environment will be conducive to the relaxation of the crowd and enhance the degree of pleasure. In addition to regulating the order of tourists at destinations to promote orderly visits, a safe atmosphere should be generated; consideration of the capacity of small and micro public spaces in cities can also be effective in alleviating the anxiety of tourists in crowded environments. This study demonstrated a promising approach to gaining a deeper comprehension of user emotions and advancing urban sustainability [94].

Author Contributions

Conceptualization, R.Q.; methodology, R.Q.; software, R.Q.; validation, R.Q.; formal analysis, R.Q.; investigation, R.Q.; resources, J.Z.; data curation, H.Z.; writing—original draft preparation, R.Q.; writing—review and editing, R.Q.; supervision, J.Z.; project administration, R.Q. All authors have read and agreed to the published version of the manuscript.

Funding

This research received no external funding.

Institutional Review Board Statement

According to relevant policies and regulations, the questionnaires and experiments in the article do not involve human life science and medical research, and have no influence or harm on the participants. Research that does not involve sensitive personal information, has no commercial interests, and uses anonymized information and data can undergo ethical review.

Informed Consent Statement

Informed consent was obtained from all subjects involved in the study.

Data Availability Statement

The data presented in this study are available on request from the corresponding author.

Conflicts of Interest

The authors declare no conflict of interest.

Appendix A

  • Questionnaire
  • A. Crowding Perception.
  • A1. Crowded road.
  • A2. Crowded rest areas.
  • A3. Crowded play areas.
  • A4. Crowded cultural/artistic areas.
  • A5. Weekends are too crowded for me to experience.
  • A6. Weekday daytime was too crowded for my experience.
  • A7. Weekday evenings are too crowded for me to feel comfortable with my experience.
  • A8. Too much contact with other visitors makes me feel depressed and anxious.
  • A9. Too many people affect the effectiveness of self-regulation of negative emotions.
  • A10. Too many people spoil the quiet environment.
  • B. Positive emotions.
  • B1. Here I feel pleasure.
  • B2. Here I feel excited and active.
  • B3. Here I feel passionate.
  • B4. Here I feel focused.
  • B5. Here I feel relaxed.
  • C. Negativity emotions.
  • C1. Here I feel impatient.
  • C2. Here I feel restless.
  • C3. Here I feel upset and angry.
  • C4. Here I feel sorry for myself.
  • C5. Here I feel anxious.
  • D. Environmental Attraction.
  • D1. The natural environment appeals to me.
  • D2. The space to move around attracts me.
  • D3. The pleasant climate is breathtaking and it makes me crave it.
  • D4. The social atmosphere attracts me.
  • D5. The unique culture and artistic behavior attract me.
  • D6. The children’s rides appeal to me and I would love to take my children there.
  • E. Intent to Revisit
  • I’ll come to the UMPS area again.

References

  1. Yang, B.; Hong, B. Pocket park in urban regeneration of China: Policy and perspective. City Environ. Interact. 2023, 19, 100109. [Google Scholar] [CrossRef]
  2. Wang, Z.; Wang, L.; Lu, X.; Dai, X.; Zhai, F.; Du, H.; Xie, C.; Gao, X.; Yang, D.; Ji, D. The Function of Urban Green Space in Avoiding Disasters in Central Shanghai, China. J. Urban Plan. Dev. 2023, 149, 05023017. [Google Scholar] [CrossRef]
  3. Van Kerrebroeck, H.; Brengman, M.; Willems, K. Escaping the crowd: An experimental study on the impact of a Virtual Reality experience in a shopping mall. Comput. Hum. Behav. 2017, 77, 437–450. [Google Scholar] [CrossRef]
  4. De Magalhaes, C.; Trigo, S.F. Contracting out publicness: The private management of the urban public realm and its implications. Prog. Plan. 2017, 115, 1–28. [Google Scholar] [CrossRef]
  5. Zhu, J. Micro-regeneration in Shanghai and the public-isation of space. Habitat Int. 2023, 132, 102741. [Google Scholar] [CrossRef]
  6. Popovski, H.; Young, A. Small things in everyday places: Homelessness, dissent and affordances in public space. Br. J. Criminol. 2023, 63, 727–747. [Google Scholar] [CrossRef]
  7. Li, X.; Zhang, X.; Jia, T.; Greening, U. Humanization of nature: Testing the influences of urban park characteristics and psychological factors on collegers’ perceived restoration. Urban For. Urban Green. 2023, 79, 127806. [Google Scholar] [CrossRef]
  8. Song, Q.; Liu, Y.; Qiu, W.; Liu, R.; Li, M. Investigating the impact of perceived micro-level neighborhood characteristics on housing prices in Shanghai. Land 2022, 11, 2002. [Google Scholar] [CrossRef]
  9. Fathi, M.; Ní Laoire, C.; Studies, M. Urban home: Young male migrants constructing home in the city. J. Ethn. Migr. Stud. 2023, 49, 813–831. [Google Scholar] [CrossRef]
  10. Stokols, D.; Rall, M.; Pinner, B.; Schopler, J. Physical, social, and personal determinants of the perception of crowding. Environ. Behav. 1973, 5, 87. [Google Scholar]
  11. Westover, T.N.; Collins, J.R., Jr. Perceived crowding in recreation settings: An urban case study. Leis. Sci. 1987, 9, 87–99. [Google Scholar] [CrossRef]
  12. Stemmer, K.; Gjerald, O.; Øgaard, T. Crowding, emotions, visitor satisfaction and loyalty in a managed visitor attraction. Leis. Sci. 2022, 1–23. [Google Scholar] [CrossRef]
  13. Moyle, B.; Croy, G. Crowding and visitor satisfaction during the off-season: Port Campbell National Park. Ann. Leis. Res. 2007, 10, 518–531. [Google Scholar] [CrossRef]
  14. Hadinejad, A.; Gardiner, S.; Kralj, A.; Scott, N.; Moyle, B.D.; Management, T. Cognition, metacognition and attitude to tourism destinations: The impact of emotional arousal and source credibility. J. Hosp. Tour. Manag. 2022, 51, 502–511. [Google Scholar] [CrossRef]
  15. Hou, J.; Wang, Y.; Zhou, D.; Gao, Z.J.A. Environmental Effects from Pocket Park Design According to District Planning Patterns—Cases from Xi’an, China. Atmosphere 2022, 13, 300. [Google Scholar] [CrossRef]
  16. Milman, A.; Tasci, A.D.; Wei, W. Crowded and popular: The two sides of the coin affecting theme-park experience, satisfaction, and loyalty. J. Destin. Mark. Manag. 2020, 18, 100468. [Google Scholar] [CrossRef]
  17. Ruiz, C.; Delgado, N.; García-Bello, M.Á.; Hernández-Fernaud, E. Exploring crowding in tourist settings: The importance of physical characteristics in visitor satisfaction. J. Destin. Mark. Manag. 2021, 20, 100619. [Google Scholar] [CrossRef]
  18. Engelniederhammer, A.; Papastefanou, G.; Xiang, L. Crowding density in urban environment and its effects on emotional responding of pedestrians: Using wearable device technology with sensors capturing proximity and psychophysiological emotion responses while walking in the street. J. Hum. Behav. Soc. Environ. 2019, 29, 630–646. [Google Scholar] [CrossRef]
  19. Pradhan, D.; Moharana, T.R.; Malik, G. Influence of celebrity, destination and tourist personality on destination attachment and revisit intention: Moderating roles of endorsement embeddedness, destination crowding and gender. J. Destin. Mark. Manag. 2023, 27, 100754. [Google Scholar] [CrossRef]
  20. Suhaimi, N.S.; Mountstephens, J.; Teo, J. EEG-based emotion recognition: A state-of-the-art review of current trends and opportunities. Comput. Intell. Neurosci. 2020, 2020, 8875426. [Google Scholar] [CrossRef]
  21. Natarajan, T.; Veera Raghavan, D.R. Does pickup service quality explain BOPIS users’ store relationship performance? The moderating role of users’ service experience consciousness. TQM J. 2023. [Google Scholar] [CrossRef]
  22. Chen, M.; Wang, X.; Law, R.; Zhang, M. Research on the frontier and prospect of service robots in the tourism and hospitality industry based on international core journals: A review. Behav. Sci. 2023, 13, 560. [Google Scholar] [CrossRef] [PubMed]
  23. Shan, W.; Xiu, C.; Meng, Y. How to Design Greenway on Urban Land Utilization: Linking Place Preference, Perceived Health Benefit, and Environmental Perception. Int. J. Environ. Res. Public Health 2022, 19, 13640. [Google Scholar] [CrossRef] [PubMed]
  24. Yuan, P.F.; Yan, C. Community Meta-Box: A Deployable Micro Space for New Publicness in High-Density City. J. Des. Econ. Innov. 2023, 9, 58–75. [Google Scholar] [CrossRef]
  25. Huang, Y.; Huang, X.; Zhao, J.; Chen, Y.J. Practical Research on Mixed-PPGIS Promoting Public Participation in Urban Micro-Public Space Renewal. Eng. Proc. 2023, 38, 84. [Google Scholar] [CrossRef]
  26. Hirvonen, H. Affects on Crowded Trails: A Narrative Study on the Affective Atmosphere of Finnish National Parks during Perceived Crowding. 2021. Available online: https://urn.fi/URN:NBN:fi-fe2021061838703 (accessed on 9 August 2023).
  27. Chang, T.-S.; Services, C. Social distancing in retail: Influence of perceived retail crowding and self-efficacy on employees’ perceived risks. J. Retail. Consum. Serv. 2021, 62, 102613. [Google Scholar] [CrossRef]
  28. Blut, M.; Iyer, G.R. Consequences of perceived crowding: A meta-analytical perspective. J. Retail. 2020, 96, 362–382. [Google Scholar] [CrossRef]
  29. Simanjuntak, M.; Nur, H.; Sartono, B.; Sabri, M.J. A general structural equation model of the emotions and repurchase intention in modern retail. Manag. Sci. Lett. 2020, 10, 801–814. [Google Scholar] [CrossRef]
  30. Qiu, H.; Wang, G.; Ren, L.; Zhang, J.; Wang, J. The impact of restorative destination environments on tourists’ well-being and environmentally responsible behavior: A Reasonable Person Model. Tour. Manag. Perspect. 2022, 44, 101028. [Google Scholar] [CrossRef]
  31. Abdullah, S.; Tengku, T.K.S.; Mahamood, A.F.; Hussin, N.S.; Ramli, A.J.; Ab Rahman, Z. Function of the Neuroscience Aspect in Surah Al-Insyirah and Al-Ankabut in Increasing Happiness and Alleviating Stress During the Post COVID-19 Pandemic Era. J. Pharm. Negat. Results 2022, 13, 2351–2357. [Google Scholar] [CrossRef]
  32. Torres, E.N.; Milman, A.; Park, S. Customer delight and outrage in theme parks: A roller coaster of emotions. Int. J. Hosp. Tour. Adm. 2021, 22, 338–360. [Google Scholar] [CrossRef]
  33. Park, I.-J.; Kim, J.; Kim, S.S.; Lee, J.C.; Giroux, M. Impact of the COVID-19 pandemic on travelers’ preference for crowded versus non-crowded options. Tour. Manag. 2021, 87, 104398. [Google Scholar] [CrossRef] [PubMed]
  34. Yin, J.; Cheng, Y.; Bi, Y.; Ni, Y. Tourists perceived crowding and destination attractiveness: The moderating effects of perceived risk and experience quality. J. Destin. Mark. Manag. 2020, 18, 100489. [Google Scholar] [CrossRef]
  35. Hahm, J.J.; Kwun, D.J.; Kang, J. Analysis of environmental stimuli, satisfaction, and behavioral responses: An extended Mehrabian-Russell model to alternative golf. Int. J. Hosp. Manag. 2023, 109, 103407. [Google Scholar] [CrossRef]
  36. Chen, G.; So, K.K.F.; Hu, X.; Poomchaisuwan, M. Travel for affection: A stimulus-organism-response model of honeymoon tourism experiences. J. Hosp. Tour. Res. 2022, 46, 1187–1219. [Google Scholar] [CrossRef]
  37. Li, L.; Zhang, J.; Nian, S.; Zhang, H. Tourists’ perceptions of crowding, attractiveness, and satisfaction: A second-order structural model. Asia Pac. J. Tour. Res. 2017, 22, 1250–1260. [Google Scholar] [CrossRef]
  38. Albayrak, T.; Güzel, Ö.; Caber, M.; Kılıçarslan, Ö.; Dursun Cengizci, A.; Güven, A. How does perceived crowding moderate tourist shopping experience and satisfaction relationship? Int. J. Tour. Cities 2021, 7, 46–62. [Google Scholar] [CrossRef]
  39. Hu, W.; Huang, G.; Li, L.; Zhang, L.; Zhang, Z.; Liang, Z. Video-triggered EEG-emotion public databases and current methods: A survey. Brain Sci. Adv. 2020, 6, 255–287. [Google Scholar] [CrossRef]
  40. Mohamad, N.; Ruslan, P.W.A.-R.; Shaipudeain, N.N. Motivation and behavioural intention towards urban recreational parks: A case of Putrajaya. Int. J. Leis. Tour. Mark. 2022, 7, 280–301. [Google Scholar] [CrossRef]
  41. Khairi, M.; Darmawan, D. The Relationship Between Destination Attractiveness, Location, Tourism Facilities, And Revisit Intentions. J. Mark. Bus. Res. (MARK) 2021, 1, 39–50. [Google Scholar] [CrossRef]
  42. Yin, J.; Bi, Y.; Zheng, X.-M.; Tsaur, R.-C. Safety forecasting and early warning of highly aggregated tourist crowds in China. IEEE Access 2019, 7, 119026–119040. [Google Scholar] [CrossRef]
  43. Yin, J.; Zheng, X.-M.; Tsaur, R.-C. Occurrence mechanism and coping paths of accidents of highly aggregated tourist crowds based on system dynamics. PLoS ONE 2019, 14, e0222389. [Google Scholar] [CrossRef] [PubMed]
  44. Lew, A.A. A framework of tourist attraction research. Ann. Tour. Res. 1987, 14, 553–575. [Google Scholar] [CrossRef]
  45. Herman, K.; Ciechanowski, L.; Przegalińska, A. Emotional well-being in urban wilderness: Assessing states of calmness and alertness in informal green spaces (IGSs) with muse—Portable EEG headband. Sustainability 2021, 13, 2212. [Google Scholar] [CrossRef]
  46. Cimtay, Y.; Ekmekcioglu, E. Investigating the use of pretrained convolutional neural network on cross-subject and cross-dataset EEG emotion recognition. Sensors 2020, 20, 2034. [Google Scholar] [CrossRef]
  47. Rahman, M.M.; Sarkar, A.K.; Hossain, M.A.; Hossain, M.S.; Islam, M.R.; Hossain, M.B.; Quinn, J.M.; Moni, M.A. Recognition of human emotions using EEG signals: A review. Comput. Biol. Med. 2021, 136, 104696. [Google Scholar] [CrossRef]
  48. Weng, L.; Wu, Y.; Han, G.; Liu, H.; Cui, F. Emotional State, Psychological Resilience, and Travel Intention to National Forest Park during COVID-19. Forests 2022, 13, 750. [Google Scholar] [CrossRef]
  49. Toder Alon, A.; Tahar, H. Employing face reading technology to study the effects of the fake news’ message sidedness on consumers’ emotional valence and arousal. Online Inf. Rev. 2023. [Google Scholar] [CrossRef]
  50. Alexander, R.; Aragón, O.R.; Bookwala, J.; Cherbuin, N.; Gatt, J.M.; Kahrilas, I.J.; Kästner, N.; Lawrence, A.; Lowe, L.; Morrison, R.G.; et al. The neuroscience of positive emotions and affect: Implications for cultivating happiness and wellbeing. Neurosci. Biobehav. Rev. 2021, 121, 220–249. [Google Scholar] [CrossRef]
  51. Mavros, P.; Wälti, M.J.; Nazemi, M.; Ong, C.H.; Hölscher, C. A mobile EEG study on the psychophysiological effects of walking and crowding in indoor and outdoor urban environments. Sci. Rep. 2022, 12, 18476. [Google Scholar] [CrossRef]
  52. Rogers, S.L.; Cruickshank, T.; Nosaka, K. The Brief Emotional Experience Scale (BEES): Reliability and validity as a measure of positive and negative emotion. Psyarxiv 2021. [Google Scholar] [CrossRef]
  53. Terry, P.C.; Skurvydas, A.; Lisinskiene, A.; Majauskiene, D.; Valanciene, D.; Cooper, S.; Lochbaum, M. Validation of a Lithuanian-language version of the Brunel Mood Scale: The BRUMS-LTU. Int. J. Environ. Res. Public Health 2022, 19, 4867. [Google Scholar] [CrossRef] [PubMed]
  54. Hu, Y.; Ritchie, J.B. Measuring destination attractiveness: A contextual approach. J. Travel Res. 1993, 32, 25–34. [Google Scholar] [CrossRef]
  55. Wei, M.; Liu, M.; Xu, J.; Li, S.; Cao, J. Understanding the influence of sensory advertising of tourism destinations on visit intention with a modified AIDA model. Asia Pac. J. Tour. Res. 2022, 27, 259–273. [Google Scholar] [CrossRef]
  56. Ancora, L.A.; Blanco-Mora, D.A.; Alves, I.; Bonifácio, A.; Morgado, P.; Miranda, B. Cities and neuroscience research: A systematic literature review. Front. Psychiatry 2022, 13, 983352. [Google Scholar] [CrossRef]
  57. Pace-Schott, E.F.; Amole, M.C.; Aue, T.; Balconi, M.; Bylsma, L.M.; Critchley, H.; Demaree, H.A.; Friedman, B.H.; Gooding, A.E.K.; Gosseries, O.J.N.; et al. Physiological feelings. Neurosci. Biobehav. Rev. 2019, 103, 267–304. [Google Scholar] [CrossRef]
  58. Li, J.; Jin, Y.; Zhao, R.; Han, Y.; Habert, G. Using the EEG+ VR+ LEC evaluation method to explore the combined influence of temperature and spatial openness on the physiological recovery of post-disaster populations. J. Affect. Disord. 2023, 243, 110637. [Google Scholar] [CrossRef]
  59. Rodríguez, A.; Rey, B.; Clemente, M.; Wrzesien, M.; Alcañiz, M. Assessing brain activations associated with emotional regulation during virtual reality mood induction procedures. Expert Syst. Appl. 2015, 42, 1699–1709. [Google Scholar] [CrossRef]
  60. Tian, T.; Wang, L.; Luo, M.; Sun, Y.; Liu, X. ResNet-50 based technique for EEG image characterization due to varying environmental stimuli. Comput. Methods Programs Biomed. 2022, 225, 107092. [Google Scholar] [CrossRef]
  61. Baumgartner, H.; Homburg, C. Applications of structural equation modeling in marketing and consumer research: A review. Int. J. Res. Mark. 1996, 13, 139–161. [Google Scholar] [CrossRef]
  62. Hu, L.; Bentler, P.M. Cutoff criteria for fit indexes in covariance structure analysis: Conventional criteria versus new alternatives. Struct. Equ. Model. A Multidiscip. J. 1999, 6, 1–55. [Google Scholar] [CrossRef]
  63. Tan, R.; Wang, R.; Wang, Y.; Yi, D.; Chen, Y.; Cai, W.; Wang, X. The Park city perspective study: Revealing the park accessibility influenced by experiences of visitors under different travel modes. Front. Environ. Sci. 2022, 10, 924996. [Google Scholar] [CrossRef]
  64. Nian, S.; Chen, M.; Zhang, X.; Li, D.; Ren, J. How Outstanding Universal Value Attractiveness and Tourism Crowding Affect Visitors’ Satisfaction? Behav. Sci. 2023, 13, 112. [Google Scholar] [CrossRef] [PubMed]
  65. Wei, Y.; Jin, L.; Xu, M.; Pan, S.; Xu, Y.; Zhang, Y. Instructions for planning emergency shelters and open spaces in China: Lessons from global experiences and expertise. Int. J. Disaster Risk Reduct. 2020, 51, 101813. [Google Scholar] [CrossRef] [PubMed]
  66. Feng, X.; Lei, J.; Xiu, C.; Li, J.; Bai, L.; Zhong, Y. Analysis of spatial scale effect on urban resilience: A case study of Shenyang, China. Chin. Geogr. Sci. 2020, 30, 1005–1021. [Google Scholar] [CrossRef]
  67. Du, J.; Chen, X.; Li, X.; Pan, Y.; Fu, E.; Huang, Y.; Zhu, C.; Jiang, M.; Hassan, A.; Wu, D.; et al. Neuro-emotions based on electroencephalograph response to different color Ardisia mamillata Hance plants in elderly people with and without cognitive impairment. Front. Public Health 2022, 10, 955393. [Google Scholar] [CrossRef]
  68. Mostafavi, A.; Cruz-Garza, J.G.; Kalantari, S. Enhancing lighting design through the investigation of illuminance and correlated color Temperature’s effects on brain activity: An EEG-VR approach. J. Build. Eng. 2023, 75, 106776. [Google Scholar] [CrossRef]
  69. Xiao, X.; Gao, J.; Lu, J.; Li, P.; Zhang, Y. Social carrying capacity and emotion dynamics in urban national parks during the COVID-19 pandemic. J. Outdoor Recreat. Tour. 2023, 41, 100451. [Google Scholar] [CrossRef]
  70. Tokarchuk, O.; Gabriele, R.; Maurer, O. Estimating tourism social carrying capacity. Ann. Tour. Res. 2021, 86, 102971. [Google Scholar] [CrossRef]
  71. Coppola, A. The Differentiation of the Trivial. The Bars in NoLo (Milan) as Micro-Publics in the Age of Urban Super-Diversification. Lo Squaderno 2019, 41–44. Available online: www.losquaderno.net (accessed on 9 August 2023).
  72. Qi, M.; Gao, H. Acute psychological stress promotes general alertness and attentional control processes: An ERP study. Psychophysiology 2020, 57, e13521. [Google Scholar] [CrossRef] [PubMed]
  73. Tabaeeian, R.A.; Yazdi, A.; Mokhtari, N.; Khoshfetrat, A. Host-tourist interaction, revisit intention and memorable tourism experience through relationship quality and perceived service quality in ecotourism. J. Ecotourism 2023, 22, 406–429. [Google Scholar] [CrossRef]
  74. Gedecho, E.K.; Kim, S.; Senbeto, D.L. Emotional and Hedonic Well-Being Experiences of Diaspora Festival Visitors: A Contemporary Migrants’ Perspective. J. Travel Res. 2023, 00472875231195738. [Google Scholar] [CrossRef]
  75. Freiberger, R.; Pracharn, D. Observation of Time on Alpha and Theta Brain Waves Implicated in Memory Recall Using Emotiv-14 EPOC X EEG Headgear. Symposium of Student Scholars. 2023. Available online: https://digitalcommons.kennesaw.edu/undergradsymposiumksu/spring2023/presentations/244/ (accessed on 9 August 2023).
  76. Osornio García, F.U.; Fragoso González, G.A.; Martínez Pérez, M.V.; Báez Martínez, F.; Salas Barraza, M.H.; González, V.M. Emotional Analysis through EEG on In-Store Journey: Pilot Methodology for Evocation of Emotions Through Video Stimuli to Measure Performance Metrics Using EEG Emotiv EPOC+ on In-Store Experiences. In Proceedings of the International Conference on Human-Computer Interaction, Copenhagen, Denmark, 23–28 July 2023; pp. 155–169. [Google Scholar] [CrossRef]
  77. Kim, J.-H.; Guo, J.; Wang, Y. Tourists’ negative emotions: Antecedents and consequences. Curr. Issues Tour. 2022, 25, 1987–2005. [Google Scholar] [CrossRef]
  78. Xie, Y.; He, E.; Jia, X.; Chen, W.; Skakun, S.; Bao, H.; Jiang, Z.; Ghosh, R.; Ravirathinam, P. Fairness by “Where”: A Statistically-Robust and Model-Agnostic Bi-level Learning Framework. In Proceedings of the AAAI Conference on Artificial Intelligence, Online, 22 February–1 March 2022; pp. 12208–12216. [Google Scholar] [CrossRef]
  79. Peng, J.; Yang, X.; Fu, S.; Huan, T.-C. Exploring the influence of tourists’ happiness on revisit intention in the context of Traditional Chinese Medicine cultural tourism. Tour. Manag. 2023, 94, 104647. [Google Scholar] [CrossRef]
  80. Yin, J.; Ji, Y.; Ni, Y. Love me, love my dog: Does destination attractiveness not only mitigate tourists’ anger and regret emotions but also prevent negative word of mouth? Curr. Issues Tour. 2023, 26, 2166–2184. [Google Scholar] [CrossRef]
  81. An, S.; Jiang, L.; Woosnam, K.M.; Eck, T. Volunteer tourists’ revisit intentions explained through emotional solidarity and on-site experience. J. Hosp. Tour. Manag. 2022, 53, 70–80. [Google Scholar] [CrossRef]
  82. Yin, J.; Song, H. Does the perception of smart governance enhance commercial investments? Evidence from Beijing, Shanghai, Guangzhou, and Hangzhou. Heliyon 2023, 9, e19024. [Google Scholar] [CrossRef]
  83. Fang, X.; Li, J.; Ma, Q. Integrating green infrastructure, ecosystem services and nature-based solutions for urban sustainability: A comprehensive literature review. Sustain. Cities Soc. 2023, 98, 104843. [Google Scholar] [CrossRef]
  84. Samus, A.; Freeman, C.; Van Heezik, Y.; Krumme, K.; Dickinson, K.J. How do urban green spaces increase well-being? The role of perceived wildness and nature connectedness. J. Environ. Psychol. 2022, 82, 101850. [Google Scholar] [CrossRef]
  85. Yu, L.; Chang, J. Residents’ Sense of Place on Micro Small Public Spaces on Epidemic Perspective. SHS Web Conf. 2023, 163, 04023. [Google Scholar] [CrossRef]
  86. Jang, S.-G.; Gim, T.-H.T. Considerations for encouraging citizen participation by information-disadvantaged groups in smart cities. Sustain. Cities Soc. 2022, 76, 103437. [Google Scholar] [CrossRef]
  87. Zaman, U.; Aktan, M.; Agrusa, J.; Khwaja, M.G. Linking regenerative travel and residents’ support for tourism development in Kaua’i Island (Hawaii): Moderating-mediating effects of travel-shaming and foreign tourist attractiveness. J. Travel Res. 2023, 62, 782–801. [Google Scholar] [CrossRef]
  88. Gaglione, F.; Gargiulo, C.; Zucaro, F.; Cottrill, C. Urban accessibility in a 15-minute city: A measure in the city of Naples, Italy. Transp. Res. Procedia 2022, 60, 378–385. [Google Scholar] [CrossRef]
  89. Le, V.D.; Carthen, C.D.; Kamaruddin, N.; Tavakkoli, A.; Dascalu, S.M.; Harris, F.C., Jr. Generalized EEG Data Acquisition and Processing System. In Proceedings of the International Conference on Information Technology-New Generations, Las Vegas, NV, USA, 24–26 April 2023; pp. 173–179. [Google Scholar] [CrossRef]
  90. Zhang, H.-Y.; Stevenson, C.E.; Jung, T.-P.; Ko, L.-W. Stress-induced effects in resting EEG spectra predict the performance of SSVEP-based BCI. IEEE Trans. Neural Syst. Rehabil. Eng. 2020, 28, 1771–1780. [Google Scholar] [CrossRef]
  91. Mavroudi, S.; Parthenios, P. A Methodological Approach for Creating Urban Commons of Wellness in Public Open Spaces in the City of Chania. In Smart Cities and Machine Learning in Urban Health; IGI Global: Hershey, PA, USA, 2022; pp. 47–68. [Google Scholar] [CrossRef]
  92. Noe, E.E.; Stolte, O. Dwelling in the city: A qualitative exploration of the human-nature relationship in three types of urban greenspace. Landsc. Urban Plan. 2023, 230, 104633. [Google Scholar] [CrossRef]
  93. Yin, J.; Cheng, Y.; Ni, Y. Staging a comeback? The influencing mechanism of tourist crowding perception on adaptive behavior. Tour. Manag. 2024, 100, 104827. [Google Scholar] [CrossRef]
  94. Hammad, A. Developing a Parametric Design Tool as a Decision Support System for Designing Pocket Parks. Ph.D. Thesis, Institute of Science and Technology, Kansas City, MO, USA, 2020. [Google Scholar]
Figure 1. The conceptual framework.
Sustainability 15 16104 g001
Figure 2. Study area.
Sustainability 15 16104 g002
Figure 3. EEG equipment (from the web).
Sustainability 15 16104 g003
Figure 4. EEG experimental process.
Sustainability 15 16104 g004
Figure 5. Adjustment effect. (a) The moderating effect of environmental attractiveness on negative emotions and revisit. (b) The moderating effect of environmental attractiveness on positive emotions and revisit intentions.
Sustainability 15 16104 g005
Figure 6. Results of the model.
Sustainability 15 16104 g006
Figure 7. Alpha-band brain activity spectra of all subjects in uncrowded and crowded conditions.
Sustainability 15 16104 g007
Figure 8. Beta-band brain activity spectra of all subjects in uncrowded and crowded conditions.
Sustainability 15 16104 g008
Table 1. Classification of small and micro public spaces in urban areas.
TypeDescription Number
Street Green SpaceStreet green space are located next to the street for pedestrians or nearby residents to rest for a short time. Smaller ones can be decorative green areas for pedestrians to enjoy; larger ones can be a form of small garden.2
Pocket ParkPocket parks are small-scale, diverse shapes, open to the public, with certain recreational functions and greening activities; generally between 400 and 10,000 square meters, including small gardens, small micro green space, etc.3
Community GardenCommunity gardens are autonomous “mini-gardens” designed, created, maintained, and managed by community residents and public interest organisations using fragmented urban space, providing a public space for community residents to participate in building and interacting with each other.1
Table 2. Situation of small urban micro public space near residential areas.
FrequencyPercentage (%)
Premises near the place of residenceStreet-level green space37566.14
Pocket park23040.56
Community garden30353.44
The main purpose of your visit to a small urban public space (street-level green space/pocket park/community garden)Stress relief and relaxation43576.72
Parent–child interaction, intergenerational interaction11820.81
Photography6611.64
Learn about plants and gain insight305.29
Physical activity/exercise23441.27
Enhancing neighbourhood (social) communication254.41
Table 3. Socio-demographic profile of the participants.
NameOptionsFrequencyPercentage (%)Cumulative Percentage (%)
AgeUnder 18 years old10.180.18
18–25 years335.826
26–35 years old8715.3421.34
36–45 years12421.8743.21
46–65 years31555.5698.77
65+ years71.23100
GenderMale26446.5646.56
Female30353.44100
Education levelLower secondary and below8214.4614.46
High school or secondary school10718.8733.33
Tertiary or undergraduate33158.3891.71
Master and above478.29100
OccupationCivil Servants/Military/Police223.883.88
Professional and technical staff
(e.g., teachers, doctors)
21537.9241.8
Service industry, sales, business8414.8156.61
Workers/Farmers
(including migrant workers)
6411.2967.9
Students315.4773.37
Retired/Freelance/Unemployed559.783.07
Other9616.93100
Monthly income1000 and below447.767.76
1001–30007913.9321.69
3001–500018732.9854.67
5001–800018933.3388.01
8000–10,0006811.99100
Table 4. Standardized parameter estimates for the structural model and hypothesis testing.
EstimateS.E.Est./S.E.Two-Tailed p-Value
Crowding PerceptionPositive emotions−0.2120.05−4.2020.000
Crowding PerceptionNegative emotions0.2210.0464.8410.000
Crowding PerceptionIntention to revisit−0.2180.054−4.0640.000
Positive emotionsIntention to revisit0.3920.0616.3920.000
Negative emotionsIntention to revisit−0.4430.059−7.5520.000
Note: χ2 = 124.077, df = 61, χ2/df = 2.034, RMSEA = 0.043, SRMR = 0.083, CFI = 0.987, TLI = 0.983.
Table 5. Reconciliation intermediary 1.
Positive EmotionsRe-Defence Intent
βSEt-Valuep-ValueβSEt-Valuep-Value
Constant4.1890.13131.9570.000 **4.5530.6926.5810.000 **
Crowding Perception−0.2230.04−5.6260.000 **−0.1450.047−3.0820.002 **
Environmental appeal −0.6340.218−2.9150.004 **
Positive emotions −0.4850.211−2.2970.022 *
Positive emotions *
Environmental appeal
0.270.0624.3560.000 **
Sample size567567
R20.0530.324
Adjustment R20.050.318
F Value F (1,565) = 31.655, p = 0.000F (4,562) = 67.272, p = 0.000
Results of conditional indirect effects
Intermediate variablesLevelHorizontal valuesEffectSEBootLLCIBootULCI
Positive emotionsLow level
(−1 SD)
2.42−0.0380.028−0.0990.008
Average3.215−0.0860.02−0.129−0.05
High level
(+1 SD)
4.01−0.1340.022−0.178−0.09
Note: BootLLCI refers to the lower limit of the 95% interval for bootstrap sampling and BootULCI refers to the upper limit of the 95% interval for bootstrap sampling. * p < 0.05; ** p < 0.01.
Table 6. Reconciliation intermediary 2.
Negative EmotionsRe-Defence Intent
βSEt-Valuep-ValueβSEt-Valuep-Value
Constant2.2450.13117.1990.000 **8.3110.49416.8280.000 **
Crowding Perception0.1970.044.9910.000 **−0.1820.04−4.5250.000 **
Environmental appeal −0.9930.155−6.4240.000 **
Negative emotions −1.6880.153−11.020.000 **
Negative emotions *
Environmental appeal
0.4060.0488.4830.000 **
Sample size567567
R20.0420.388
Adjustment R20.0390.382
F Value F (1,565) = 24.914, p = 0.000F (4,562) = 89.025, p = 0.000
Results of conditional indirect effects
Intermediate variablesLevelHorizontal valuesEffectBootSEBootLLCIBootULCI
Negative emotionsLow level (−1 SD)2.42−0.1390.031−0.203−0.08
Average3.215−0.0750.019−0.115−0.042
High level (+1 SD)4.01−0.0120.013−0.0390.013
BootLLCI represents the lower limit of the 95% interval for bootstrap sampling, while BootULCI represents the upper limit of the 95% interval for bootstrap sampling. * p < 0.05; ** p < 0.01.
Disclaimer/Publisher’s Note: The statements, opinions and data contained in all publications are solely those of the individual author(s) and contributor(s) and not of MDPI and/or the editor(s). MDPI and/or the editor(s) disclaim responsibility for any injury to people or property resulting from any ideas, methods, instructions or products referred to in the content.

