Article

Continuous Dynamic Analysis Method and Case Verification of Cable Structure Based on Digital Twin

1
School of Civil Engineering, Tianjin University, Tianjin 300350, China
2
Beijing Building Construction Research Institute Co., Ltd., Beijing 100039, China
3
Faculty of Architecture, Civil and Transportation Engineering, Beijing University of Technology, Beijing 100124, China
*
Author to whom correspondence should be addressed.
Sustainability 2023, 15(22), 16125; https://doi.org/10.3390/su152216125
Submission received: 21 August 2023 / Revised: 6 November 2023 / Accepted: 16 November 2023 / Published: 20 November 2023

Abstract

:
The safety and quality of cable structure construction necessitate a comprehensive analysis approach. However, conventional methods suffer from difficulties in the temporal and spatial integration of construction information and low efficiency in construction analysis. This study proposes a multi-dimensional digital twin model for cable structure construction to optimize conventional calculation methods. Firstly, this study proposes a continuous dynamic analysis method for cable structures based on the digital twin, which reveals the mechanism behind the continuous dynamic analysis of cable structures. Furthermore, a multidimensional digital twin model is established, and the model is continuously corrected using real-time data collected by sensors. The intrinsic constitution equation and equilibrium equation are also corrected to improve the finite element analysis method of the cable structure. An intelligent simulation system for cable structures was developed and effectively applied to actual cable structure construction scenarios. The same finite element analysis model was used to calculate all stages from lifting to tension forming. Construction information fusion ensured continuous dynamic analysis with an average calculation accuracy higher than 97%.

1. Introduction

1.1. Research Background

Cable structures find extensive applications in large-span space structures due to their lightweight materials, flexible arrangement, and aesthetic appeal [1,2,3]. However, complex cable structures entail intricate force transmission paths and significant structural nonlinearities. Therefore, to ensure the safety and quality of structural construction, a thorough analysis of cable structure construction is essential. The conventional approach to cable structure construction analysis is characterized by its intermittent and discrete nature, as depicted in Figure 1. The conventional construction analysis model of cable structures mainly contains the following steps: before construction, divide the construction steps, respectively, establish finite element models of different stages of the cable structure, and analyze the mechanical response of the structure. There are two significant disadvantages of this model: I. The mechanical response parameters of the structure during the construction process and the pre-construction finite element analysis values have spatial and temporal differences, which makes it difficult for the analysis model to guide the on-site construction. II. The multiple establishment of the finite element model leads to the low efficiency of the analysis. Therefore, it is necessary to establish a new construction analysis model of cable structures to accurately analyze the mechanical response of the structure during the construction process and improve the efficiency of finite element analysis.

1.2. Literature Review

Finite element analysis [4,5,6,7,8] of cable structures is widely used as a primary means of analyzing their safety and quality. Li et al. [4] investigate a new cable-girder anchorage (CGA) structure for long-span hybrid cable-stayed suspension bridges, revealing its reasonable and reliable design, stress distribution, and cable load transfer pathway through a 1:2 scale specimen test and finite element analysis. Liu et al. [5] investigate the performance of a wedge-shaped clamp anchorage for CFRP lamella cables through finite element analysis and static tensile testing. Chen et al. [6] used finite element analysis in order to investigate the effect of the main design parameters on the relationship between the deflected span ratio and the coefficient of safety against skidding. Traditional finite element analysis software often exhibits poor convergence, necessitating the division of the continuous construction process into discrete stages for simulation and analysis [7]. Ye et al. [8] employed a mechanical multi-rigid body system dynamics analysis approach to achieve dynamic simulation of the complete construction process of a cable dome structure. Despite these efforts, there remains a dearth of literature concerning the cohesive interplay between physical construction processes and virtual simulation modeling for the continuous dynamic analysis of cable structures. The intricate interrelationship between the virtual and real aspects during the cable structure’s construction phase, alongside the quest for continuity in dynamic analysis, necessitate in-depth exploration.
Cable force [9,10,11] and displacement [12] are the primary focal points of analysis in cable structure construction. In order to control the safety and quality of structures, many articles in the literature have investigated methods and techniques for structural monitoring. Within the realm of non-destructive evaluation (NDE), Kim et al. [13] demonstrate the reliability and accuracy of Magnetic Flux Leakage (MFL) techniques in wire rope inspection, while Qu et al. [14] introduce an innovative approach to predicting cable corrosion width using Spontaneous Magnetic Flux Leakage (SMFL) principles. Mehrabi et al. [15] address cable sheathing damage, emphasizing cable replacement as a solution for the Hale Boggs Bridge’s structural integrity. Temperature fluctuations and their impact on vibration properties in long-span bridges are reviewed by Zhou et al. [16], emphasizing the need for temperature considerations in damage detection. Zejli et al. [17] focus on acoustic emission (AE) techniques for detecting broken wires in cable bridge anchorages, considering surface conditions and interwire friction. Sensing technologies are explored, with Hu et al. [18] presenting Fiber Bragg Grating (FBG) sensors for cable force monitoring, and Zheng et al. [19] assessing adhesive bonding for FBG sensors. Computer vision (Dong et al. [20]) is identified as a promising avenue for SHM, with applications at local and global levels. GNSS technology’s evolution [21] in dynamic deformation measurement and modal identification is discussed, as is its potential for cable force and weight-in-motion measurements. Wang et al. [22] underscore GNSS applications in bridge SHM, considering positioning solutions and receiver technology. The integration of robotics [23] into SHM highlights various robotic systems for defect inspection, vibration measurement, and modal identification. Lastly, Li et al. [24] propose an intelligent real-time prediction model for Cable’s Fundamental Frequency (CFF) using Long Short-Term Memory (LSTM) networks, optimizing bridge cable maintenance and operation. However, seamlessly synchronizing real-time construction simulation data with live monitoring data to achieve continuous dynamic analysis of the cable structure’s construction process remains a pressing challenge.
The digital twin (DT) serves as a multifaceted tool that encompasses various scales and dimensions of entity representation. Its application facilitates the convergence and alignment of physical and informational realms [25]. The concept of the DT was initially advanced by Prof. Michael Grieves [26]. Within the DT model, there exists a symbiotic relationship between physical and virtual entities, bolstered by their interconnectedness. The scope of DT application extends across domains, ranging from aerospace to manufacturing and construction [27,28]. Tao et al. [29,30] introduced a five-dimensional DT model and a DT maturity model to construct and assess DT frameworks. Liu et al. harnessed DT technology in the realm of building construction [31], operation, and maintenance [32], propounding a DT framework and methodology for the phases of construction, operation, and maintenance. Driven by data, DT technology facilitates interactive feedback across all tiers. Many data processing methods have been proposed: Phoon et al. [33] promote a data-centric approach for machine learning in geotechnical engineering and achieving smart digital twin capabilities, with a focus on data-driven site characterization challenges. Zhang et al. [34] explore the application of machine learning (ML), deep learning (DL), and optimization algorithms (OA) in geoengineering and geoscience, and provide methods for data processing in digital twin databases. Zhang et al. [35] provide a comprehensive overview of the application of deep learning (DL) in geotechnical engineering, highlighting major algorithms (FNN, RNN, CNN, GAN) and their applications. Shehadeh et al. [36] propose machine learning-based methods, such as a Modified Decision Tree (MDT), for the accurate prediction of heavy construction equipment residual values, with MDT showing the highest accuracy, highlighting machine learning’s potential in the construction industry. Alshboul et al. [37] present an ensemble machine learning technique (EMLT) for accurately predicting liquidated damages (LDs) in highway construction projects, demonstrating superior performance compared to other machine learning models and highlighting machine learning’s potential in this context.
DT technology stands distinguished by its fusion of tangible and virtual realities, characterized by a state of continuous dynamics. Notably, it enables the potential for perpetual dynamic analyses of the physical world.

1.3. Research Significance

Although DT techniques can obtain the mechanical response values of structures in real time, the spatial and temporal fusion of data and the inefficiency of modeling are still urgent problems to be solved. The optimization of the finite element calculation method for cable structures and the establishment of a multidimensional digital twin model proposed in this study can overcome two shortcomings of conventional cable structure construction analysis. First, a digital twin model of the construction process of the cable structure is established to integrate the construction mechanical response values with the finite element analysis values to guide the real-time construction in the field. Secondly, the intrinsic equations and equilibrium equations of the cable structure are corrected to improve the convergence of the finite element analysis, and the multiple analyses from lifting, tensioning, and forming can be realized by constructing the finite element model only once.
Following this introduction, Section 2 proposes a continuous dynamic analysis method for cable structures. Section 2.1 introduces the mechanism of continuous dynamic analysis. Section 2.2 proposes a multi-dimensional digital twin modeling method for the construction process of cable structures. Section 2.3 proposes an optimization method for the finite element computation of cable structures. Section 3 presents a case study for validating the proposed method of continuous dynamic analysis. In Section 3.1, based on the modeling method in Section 2.2, the digital twin model in the actual project is established. Section 3.2 develops an intelligent simulation system for the construction of cable structures based on the optimization method in Section 2.3. Section 3.3 carries out the continuous dynamic analysis of the actual construction process. Section 4 concludes the validity of the method of continuous dynamic analyses of cable structures.

2. Continuous Dynamic Analysis Method of Cable Structure Based on DT

The traditional construction analysis has two problems: I. The difficulty of temporal and spatial integration of construction information. II. The low efficiency of construction analysis. In this paper, a continuous dynamic simulation and analysis method based on digital twins is proposed to solve the above problems, and the flowchart of the method is shown in Figure 2.

2.1. Continuous Dynamic Analysis Mechanism

Continuous dynamic analysis involves the ongoing and dynamic acquisition and comparison of simulation and monitoring data related to the mechanical response of a structure throughout the construction process. This practice enables real-time assessment of structural quality and safety. During the construction of a cable structure, the mechanical response of the structure evolves over time due to the influence of various on-site factors. In this process, prestressing of the cords is required to increase the stiffness of the structure. As a result, the cable forces and displacements of the structural members are constantly changing during construction [3].
The essence of achieving continuous dynamic analysis within digital twin-enabled cable structures hinges upon two pivotal factors: the real-time transmission of mechanical response parameters and the establishment of a mapping correlation between construction stages and the structural mechanical response. This mechanism is illustrated in Figure 3.
The real-time transmission of mechanical response parameters within the cable structure forms the foundational dataset for enabling the continuous dynamic analysis. Parameters like displacement and cable force are extracted from the cable structure through sensory tools like the Beidou displacement monitor and external traction devices. These parameters subsequently serve as the bedrock for building the digital twin model and conducting the dynamic construction analysis. To facilitate this data flow, an intelligent gateway equipped with embedded devices such as Raspberry Pi (RPI) is employed. This gateway employs a highly stable, high-speed, and low-latency data transmission protocol to relay the data to the digital twin database, utilizing both wired and wireless connectivity approaches.
Establishing the mapping relationship between the cable structure’s construction steps and the mechanical response of the structure serves as the logical foundation for achieving the continuous dynamic analysis. This study segments the cable structure’s construction process into distinct steps based on construction characteristics. Through the utilization of sensory equipment, essential mechanical response parameters of the critical structure are promptly conveyed to the simulation application layer. This information is then juxtaposed against the outcomes of construction simulations, thereby effectuating the ongoing dynamic analysis of the cable structure. The relationship between the cable structure’s construction steps and its mechanical response can be mathematically represented by Equation (1):
Y M R = f X C S
where f represents the mapping relationship between the construction step and the mechanical response, X C S represents the divided construction step, and Y M R represents the result of the variation in the structural mechanical response with the construction step.
Building upon the finalized form post the initial construction phase, the subsequent construction analysis is undertaken in the second phase. In this stage, the structural analytical model is restructured, the second-phase model is amalgamated into the overarching stiffness matrix, the pertinent boundary conditions for the second construction phase are incorporated, and the corresponding equivalent nodal force vectors for the second phase are assembled. The governing Equation (2) for the control is as follows:
K 2 1 U 1 + K 2 2 U 2 Δ u 2 = F 2
where K 2 1 U 1 is the stiffness matrix of the first stage installed build, K 2 2 U 2 is the stiffness matrix of the second stage build, and F 2 is the construction load of the second construction stage installed build, and the solution to obtain the displacement of the second construction stage build Δ u 2 includes two parts: the first part is the displacement of the nodes of the first-stage installed build in the second construction stage Δ u 2 , and the second part is the displacement of the nodes of the second-stage installed structure Δ u 2 , where the displacement of several points of the second-stage installed construction also needs to consider the change in the initial installation position of the second-stage installed construction caused by the displacement of the first stage.

2.2. Multi-Dimensional DT Model Establishment Method

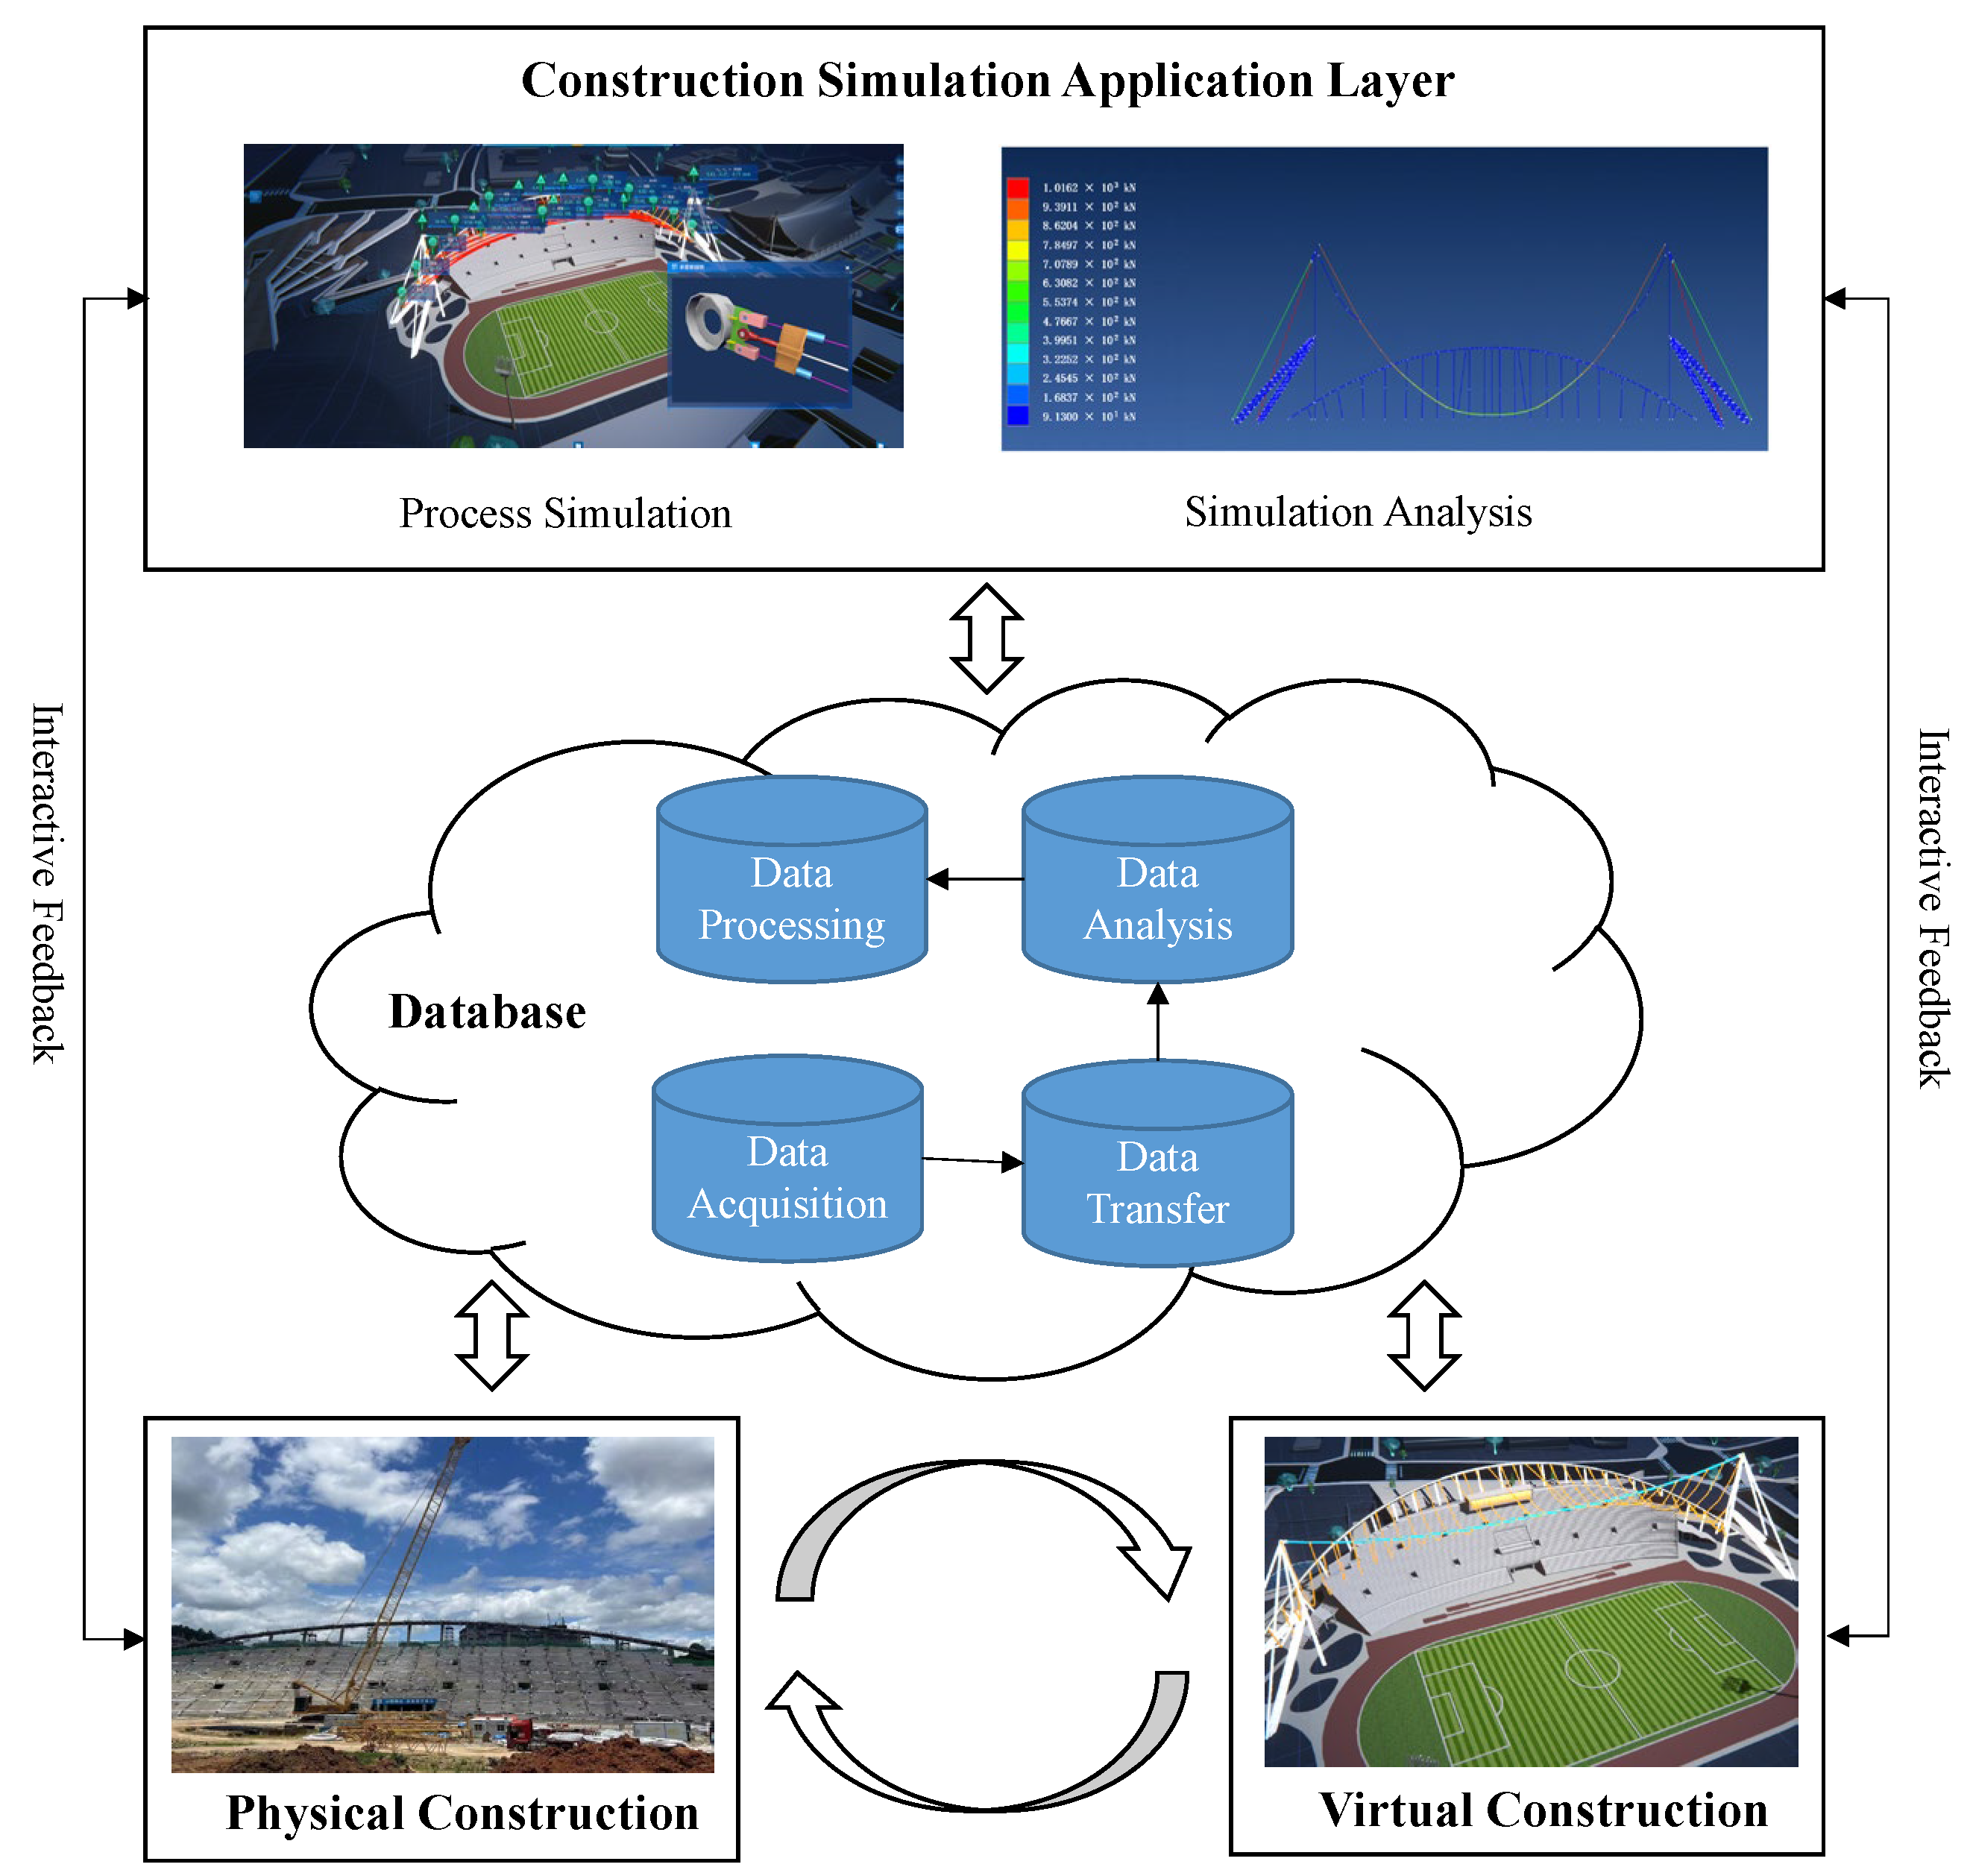
2.2.1. DT Framework for Dynamic Construction Process of Cable Structures

A conventional cable structure construction analysis encounters challenges related to deficient synergy and interaction. Addressing these issues, the employment of a digital twin (DT) model emerges as a promising solution. In the context of this study, a comprehensive DT framework tailored to cable structure construction is formulated, visualized in Figure 4. This DT framework, specific to cable structure construction, encompasses five distinctive dimensions, and its mathematical representation is articulated through Equation (3).
M = B P C ,     B V C ,     B D D ,     B C S ,   B C N
where M denotes the DT model of the construction process of the cable structure; B P C denotes the physical construction process, B V C denotes the virtual construction model, B D D denotes the twin database, B C S denotes the construction simulation application layer, and B C N denotes the connection between the components.
(1) Physical Construction Process ( B P C )
The physical embodiment of the building can be delineated into two dimensions: categorial and temporal. The categorial dimension encompasses the diverse constituent elements shaping the physical form of the building throughout the construction phase. This dimension encompasses not only the structural facets of the building itself but also encompasses the involvement of personnel, materials, machinery, methodologies, and the surrounding environment throughout construction. The temporal dimension, on the other hand, entails the informational data generated by the various elements within the categorial dimension at any given moment during the construction phase, thus epitomizing the entirety of the building’s physical manifestation.
(2) Virtual Construction Model ( B V C )
The virtual construction model encompasses dimensions of time, categorial type, and information. The temporal dimension signifies the incorporation of the building voxel model during the design stage, which comprises the theoretical design model, transitioning to the real-time monitoring model during construction, and culminating in the correction model established in response to feedback. The categorial dimension encompasses an extensive array of models including, but not confined to, the Building Information Model (BIM), finite element model, and 3D laser scanning point cloud model. The informational dimension implies that the building voxel model incorporates components such as the geometric model, physical model, behavioral model, and rule model.
(3) Digital Twin Database ( B D D )
The twin database of the construction stage provides data support for the intelligent simulation system (ISS). The twin database of the construction stage mainly includes physical construction data ( D P ), virtual construction data ( D V ), simulation system data ( D C ), knowledge data ( D K ), and fusion-derived data ( D F ), as in Equation (4):
B D D = D P ,     D V ,   D C ,   D K ,   D F
where D P mainly includes attribute data of physical construction elements in B P C and dynamic process data reflecting construction conditions, mechanical properties of components, environmental parameters, etc., which can be collected by sensors and other IoT devices; D V mainly includes geometrical, physical, behavioral, and rule-based modeling data of B V C ; D C mainly includes simulation and analysis data generated by the simulation system; D K includes constraint data such as standard specifications and knowledge and experience; and D F is the derivative data derived from the data preprocessing, correlation, fusion, and other related processes of D P , D V , D C , and D K .
(4) Construction Simulation Application Layer ( B C S )
The construction simulation application layer facilitates the achievement of the continuous dynamic analysis for the cable structure. It establishes a connection between simulation data and real-time monitoring data, facilitating the fusion of both virtual and real aspects within the cable structure’s construction process.
(5) Connection of components ( B C N )
The primary role of component connections is to establish interconnections among components within the dynamic construction digital twin (DT) framework.

2.2.2. Construction of Multi-Dimensional DT Model

(1) Information capture in physical space
Sensor equipment collects mechanical response data from key components of the cable structure, facilitating the virtual-to-real mapping of the construction process. This involves inputting marking numbers, basic information, and construction details of these components onto RFID tags. Construction steps are dynamically updated as per on-site sequencing. Monitoring the cable structure’s cable force, deformation, and displacement is crucial. These data are actively monitored by the cable force sensor and the Beidou displacement monitor within the external traction device. Subsequently, this information is wirelessly or through wired means transmitted to the digital twin database. The mechanism for acquiring cable force, displacement, and deformation is illustrated in Figure 5.
(2) Construction of virtual construction model
The virtual model of the cable structure construction process maps the physical construction process in multiple dimensions, as shown in Equation (5).
B V E = B V G ,   B V P ,   B V B ,   B V R
where B V G is a geometric model, which is mainly used to describe the 3D model of the geometric parameters of the building physical entity ( B P E ). B V P is a physical model, which is used to describe the physical attributes of the physical entity, which are added on the basis of the geometric model. B V B is a behavioral model, which is used to describe the real-time response and behavioral changes generated by the physical entity as it evolves in space and time. B V R is a rule model, which includes the construction process standards, norms, expert knowledge, and experience, so that the DT model has the ability to judge, evaluate, optimize, and predict.
Through the above analysis, combined with the functional requirements of this study, this study proposes the modeling process of the DT model, as shown in Figure 6.
The geometric model offers fundamental information regarding cable structure members and equipment for the construction process. At the geometric level, it shapes, sizes, and locates members and equipment. This model is created using software like Revit, 3Dsmax, and serves as the foundation for the intelligent simulation system. The physical model gathers data on the physical dimensions of cable structure construction and augments the virtual construction model with physical attributes. This includes modeling material parameters and mechanical properties of structural components and construction equipment, enabling mechanical interactions during the construction process. The behavioral model portrays the construction process in terms of spatial and temporal evolution. It acquires real-time data on construction changes during this evolution and parameterizes it. The rule model imparts rule-based constraints to all data within the twin database, thus governing the virtual construction model. By referencing national standards, norms, engineering knowledge, and experience, mechanical performance parameters of cable structure construction components, equipment operation statuses, and other indicators are parameterized. This allows for the quantitative limitation of these indicators.

2.3. Optimization of Finite Element Calculation Method for Cable Structure

The distinctive attributes of cable structures pose challenges for finite element dynamic simulation calculations. Overcoming these challenges and achieving continuous simulation calculations to derive a mechanical response continuity curve over time is another intricate aspect of realizing the continuous dynamic analysis of cable structures. To tackle these issues, this paper revisits the fundamental equations and equilibrium equations, while also introducing a method to connect cable units with rigid units. These measures are taken to enhance and optimize the finite element dynamic simulation analysis of cable structures.

2.3.1. Correction of the Intrinsic Constitution Equation and Equilibrium Equation

Cable structures exhibit several distinctive characteristics, with two particularly prominent ones being: I. cables primarily endure tension forces rather than compression forces, and II. cable structures often encompass a combination of significant displacements and minor strains, falling under the realm of geometric nonlinearity. To address these unique features, the Newton–Raphson (N-R) iteration technique is employed to formulate the adjusted cable unit by modifying both the principal structural equation and the equilibrium equation.
The aforementioned characteristics of cable structures give rise to the following two challenges in their finite element solution calculations: I. Conventional cable units designed to accommodate the first characteristic exhibit zero stiffness when subjected to compression, leading to a discontinuous stress–strain relationship. Consequently, this can result in an unfavorable condition number of the stiffness matrix, rendering it challenging to solve. II. Owing to the second characteristic, the nonlinear iteration process also faces difficulties in achieving convergence. In this study, the principal and equilibrium equations of the cable structure are adapted to tackle these issues, and the procedure is outlined as follows:
To address the first challenge, this study employs a revised principal structural relationship for the cable unit, as presented by the following Equation (6) [38]:
R · e = E A 1 + x 1 1 x
where R is the cable force, E and A are Young’s modulus and the cross-sectional area of the cable, and x is the coordinate. The relationship [38] between the cable force and strain is shown in Figure 7. However, even with this approach, the nonlinear iterative process is equally difficult to converge in the second problem. To reduce the difficulty of iteration, the support reaction force λ is introduced into the equilibrium equation. The specific Equation (7) is as follows:
0 = K X X b p A T λ 0 = A X c
where λ is the introduced support reaction force, K is the stiffness matrix of the coordinate degrees of freedom, b and p are the body force and external load, respectively, A T is the part of the stiffness matrix corresponding to the support reaction force as a degree of freedom, and c is the coordinate of the support. The full stiffness matrix and the right end term are as in Equation (8):
K a l l = K A T A 0 R = r A T X A X c
Based on the N-R method, the displacement dimensionless tangent stiffness matrix consists of two components, as in Equations (9)–(12):
H e X e = K e X e + K ¯ e X e
where the dimensionless stiffness matrix K e X e :
K e X e = 0 1 1 1 + l e 1 1 B d ζ
K ¯ e X e = 0 1 1 l e 1 + 1 2 sgn l e 1 l e B X e X e Τ B d ξ
sgn ς = 1 ς 0 1 ς < 0
where l e is the dimensionless unit length, the original length of the unit is used as the dimensionless criterion, and the corner scale e indicates the unit level. In the process of nonlinear iteration, it is necessary to determine whether the cable unit is in tension. When in tension, the iterative load r e of the force at the right end term of the equation is K e X k X k , and the tangent stiffness matrix is H e X e = K e X e + K ¯ e X e . When the unit is in compression, the iterative load r e of the force is 0 and the unit tangential stiffness matrix is H e X e = K e X k .
The algorithm utilizes the incremental displacement values and support reaction force as a combined convergence criterion, with a convergence accuracy of minus 12 times the second parameter, equivalent to minus 6 times the hybrid accuracy. This approach ensures highly accurate solutions for cable structures that adhere to mechanical norms. The computational efficiency and time required are contingent on the precise value of the convergence criterion. For each cable network structure, the computational time typically falls within the order of minutes. The convergence accuracy aligns with the existing norms of the project.

2.3.2. Adjustment of Equations during Construction Simulation

Since the process of lifting and tensioning of the cable structure is not fast, quasi-static can be used for the simulation during construction. During the construction process, for the lifting of the cable end points, the end points can be lifted by modifying the actual coordinate points of the end points. The tensioning of the cable (including the traction cable) can be performed by modifying the original length of the cable, modifying the l e in Equations (10) and (11) to tension the cable. For example, if the traction cable is tensioned from the original length to 0, l e gradually changes from the initial value to 0 in each construction step, and its value change process can be adjusted according to the actual tensioning process.

2.3.3. Calculation Method of Connection of Cable Unit and Rigid Unit

The decoupling algorithm used for calculating the cable unit and rigid unit consists of the following three main steps: I. Calculation of Cable Structure: The cable structure calculation is carried out with the fixed point and the connection point between the cable unit and the rigid unit as boundary points. After completing the calculation, the support reaction force within the cable structure is recorded. This support reaction force is then applied to the nodes requiring the calculation of the rigid structure, acting as the boundary condition for force. II. Rigid Structure Calculation: The calculation of the rigid structure is performed next. Once this calculation is finished, the displacement at the connection point between the cable unit and the rigid unit is applied to the corresponding node of the cable structure as a displacement boundary condition. III. Iteration and Convergence: The above steps are iterated multiple times until the displacement between the cable structure and the rigid structure becomes negligible and can be considered as converged. Generally, this iterative process involves about four to five steps to achieve convergence.

3. Case Study

The roof structure of a stadium project located in Fujian Province, China, features a single-layer cable network roof with a rigid boundary on one side and flexible linear boundaries on three sides. The three-dimensional structure is depicted in Figure 8. Given the unique structural configuration of a single-layer cable network roof with open flexible boundaries, this project presents challenges such as intricate force transmission paths, notable nonlinearity, and intricate mast balancing during construction. To ensure the overall quality and safety throughout the construction phase, a thorough analysis of the cable structure construction process’s continuous dynamics is imperative. This project has been chosen as a case study to validate the effectiveness of the continuity dynamic analysis method based on the digital twin (DT) concept for cable structures. The approach involves the establishment of a DT model for the cable structure, the development of an intelligent simulation system rooted in the DT framework, and the subsequent execution of the continuity dynamic analysis across the cable structure’s construction phases.

3.1. Multidimensional DT Modeling of Cable Structures

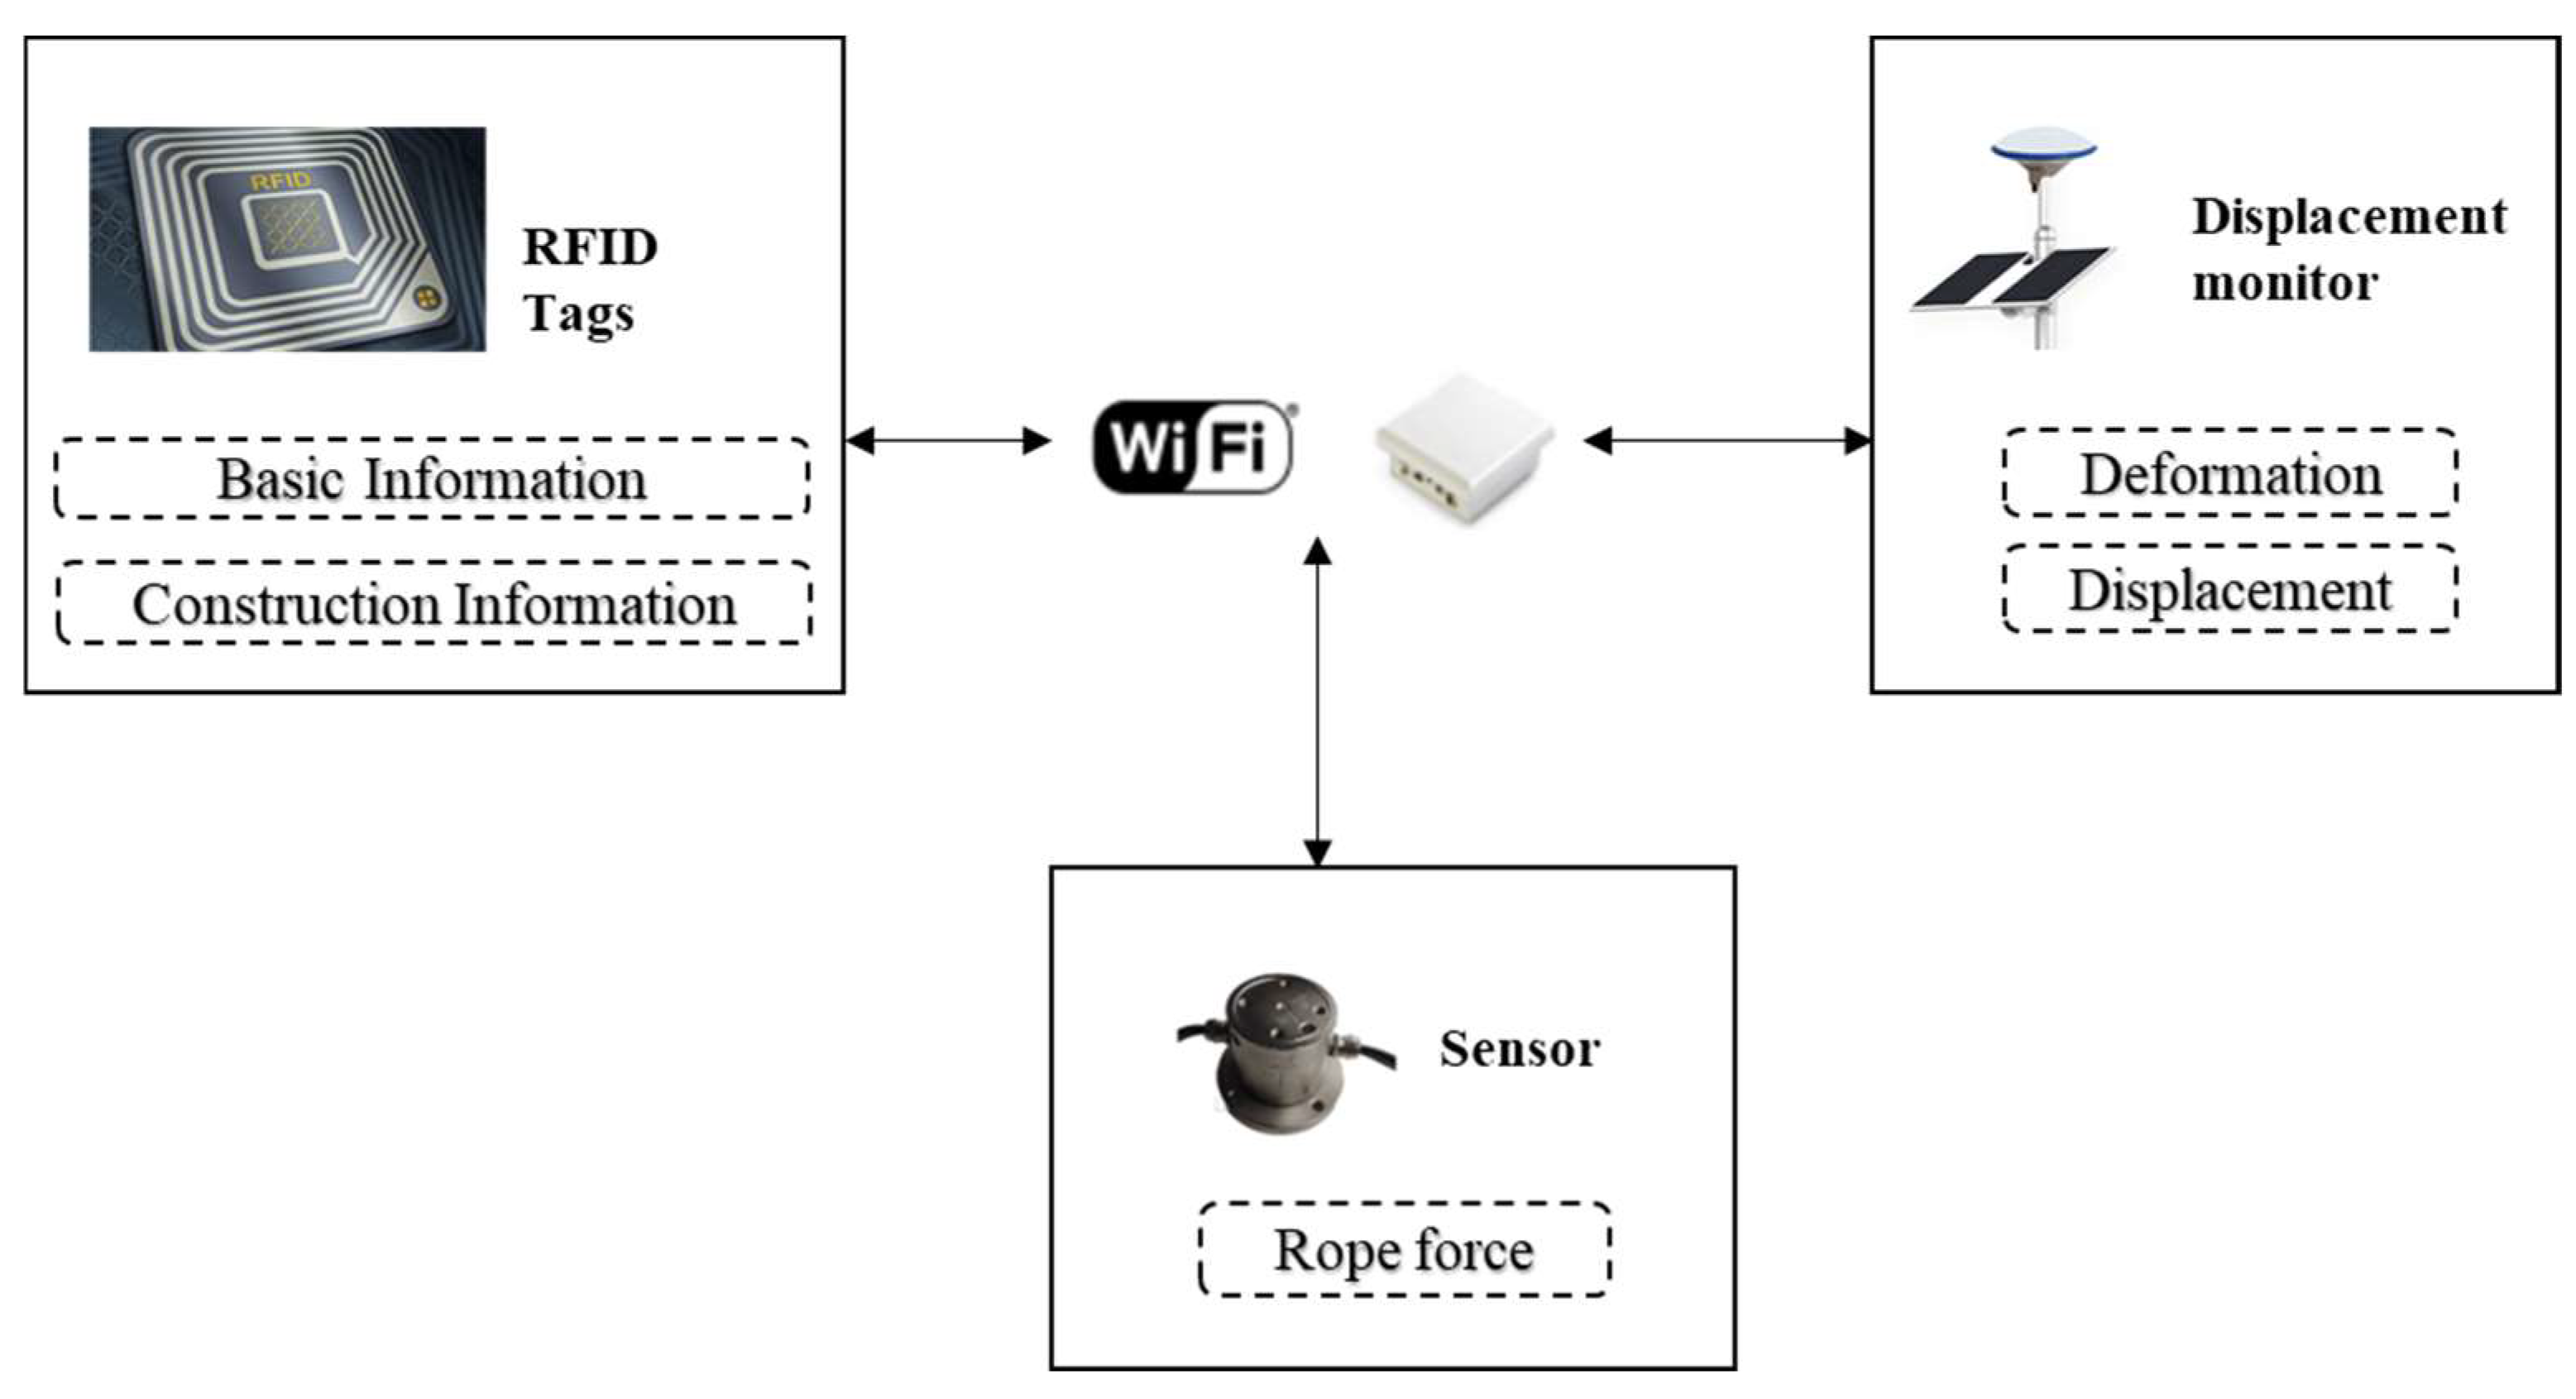
3.1.1. Information Capture in Physical Space

Considering the deformation occurring in critical components and cable forces during the installation, tensioning, and lifting of prestressed steel cables, the cable structure’s construction process is comprehensively observed through the lens of spatial and temporal evolution. Physical and spatial data are captured using tools like total stations, handheld laser rangefinders, and GPS devices. During the installation and tension stages of prestressed steel cables, the overall structural integrity may undergo deformation. Understanding the patterns of structural deformation throughout the construction process, as well as investigating the impact of construction activities on deformations, is pivotal. Thus, monitoring the deformation of key structural elements during construction becomes imperative, offering accurate guidance and calibration for construction activities and helping to determine the magnitude of the prestressing application.
Consequently, during the process of prestressed steel cable tensioning, coupled with the outcomes of construction simulation calculations, deformation monitoring of the steel structure is employed to ensure the safety and effectiveness of the prestressing construction. Specifically, the total station is utilized for monitoring structural deformations, enabling precise tracking of structural displacement variations. The arrangement of measuring points for the total station and the GPS-based monitoring configuration is illustrated in Figure 9.

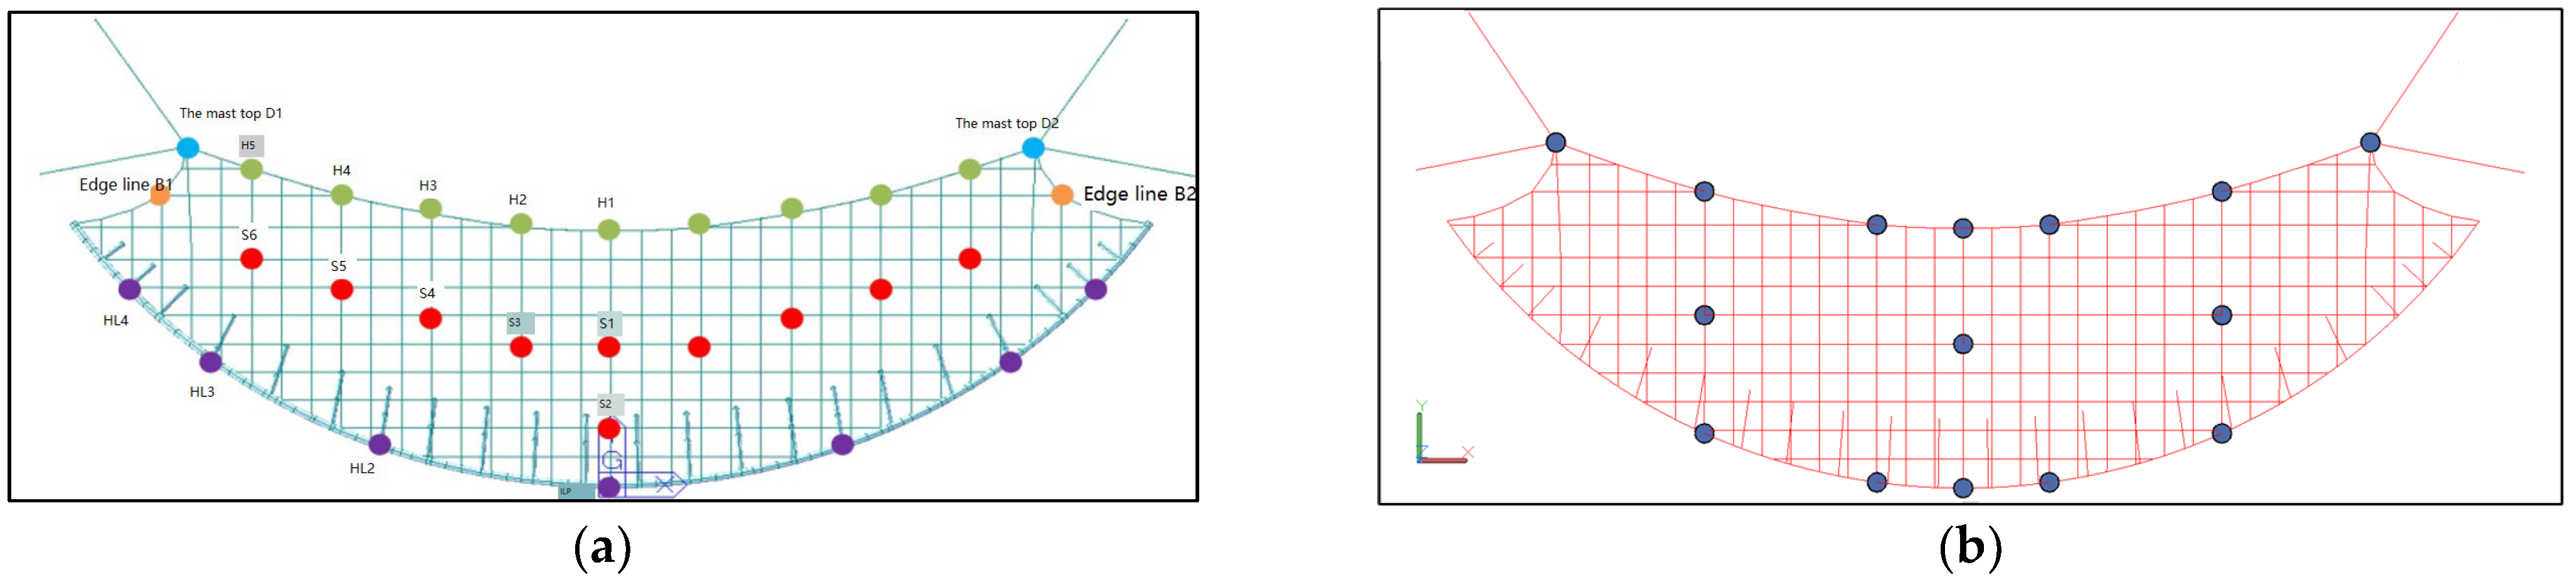
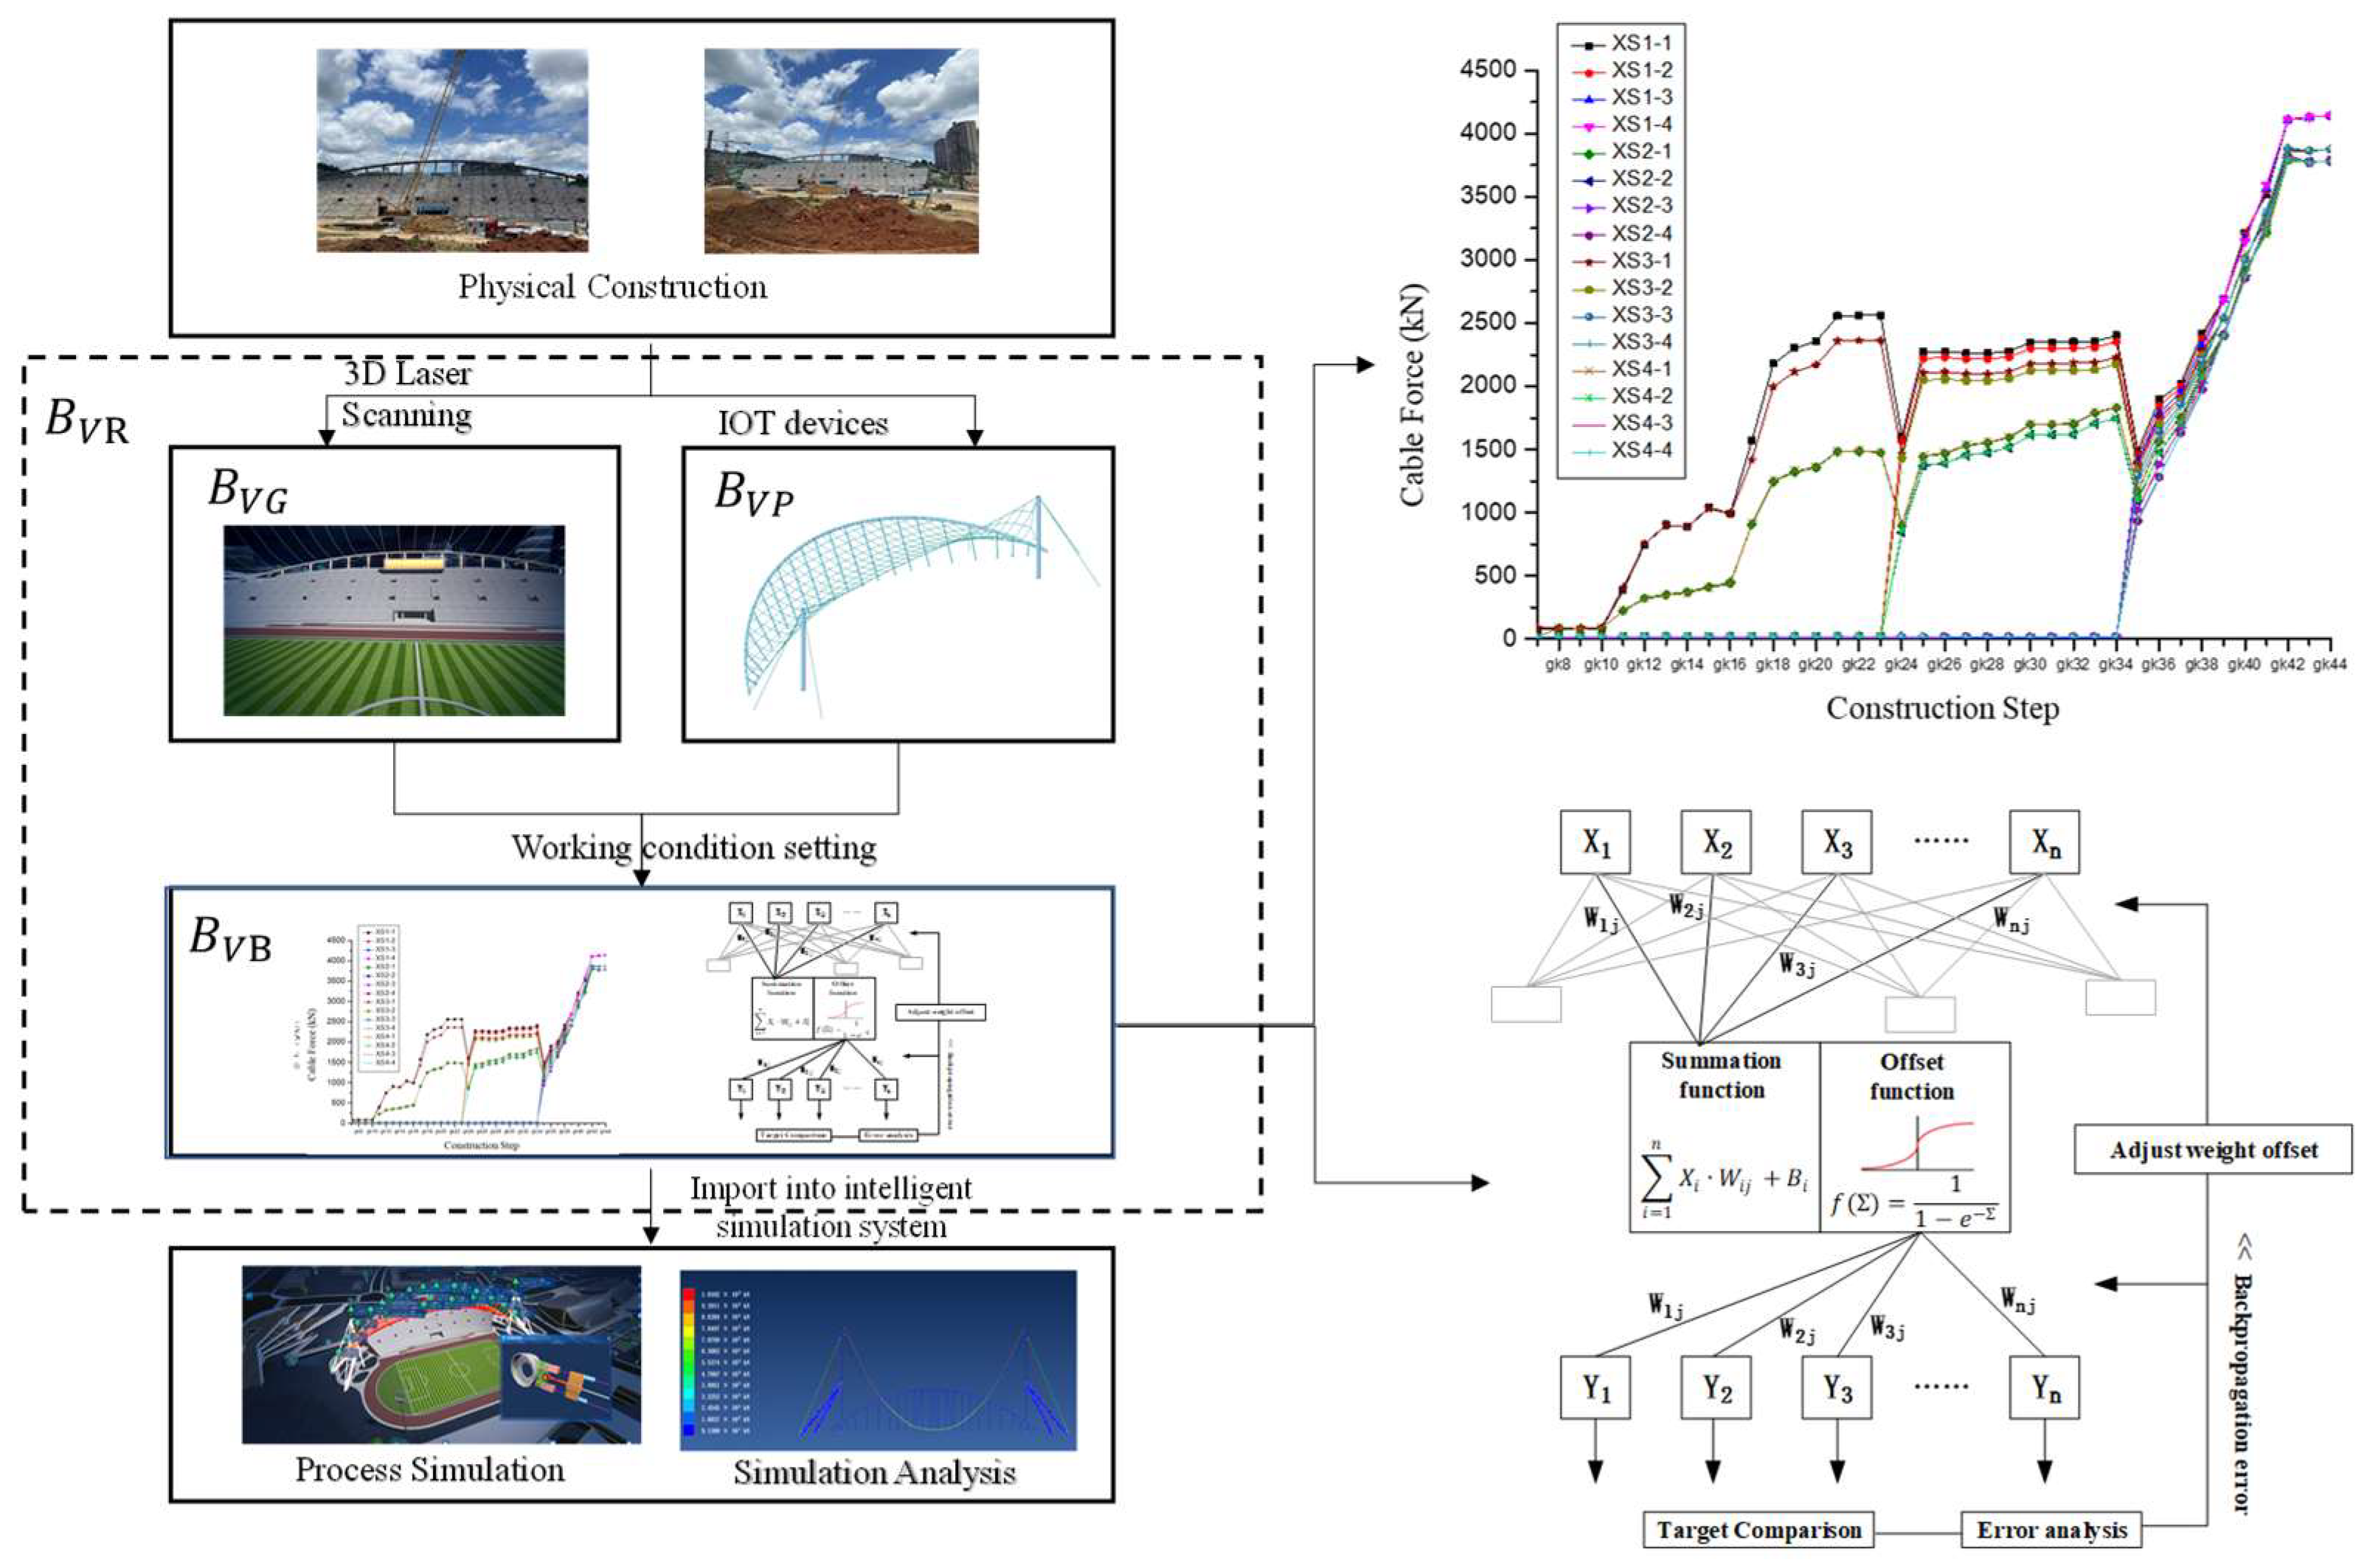
3.1.2. Virtual Construction Model Construction

Building Information Modeling (BIM) serves as a central repository of dynamic building data. In this project, BIM modeling software, such as Revit, is harnessed to create geometric models encompassing fundamental information like appearance, size, and specifications of key components and equipment. Furthermore, the BIM model is leveraged to map the geometric characteristics of the cable structure’s lifting and tensioning phases. By employing an optimized finite element calculation method for cable structures, the continuous mechanical response of pivotal members during the construction phase is calculated over time. The physical model is formulated by integrating information obtained from field sensing equipment, including cable force and strain.
Encompassing the entire spatiotemporal evolution of the cable structure’s construction process, the behavioral model is fashioned by establishing connections between time and geometric, physical, and environmental data. This entails deducing a mapping relationship that accurately captures the evolution of these parameters. To this end, mechanical performance parameters of components within the cable structure’s construction process, equipment operating conditions, and other relevant indicators are parameterized in line with pertinent national standards, engineering expertise, and experience. This parameterization enforces quantifiable limitations on these indicators, thereby constructing a rule model governing the entire construction process. The virtual construction process model of the cable structure is visually depicted in Figure 10.

3.2. Development of Intelligent Simulation System Based on DT

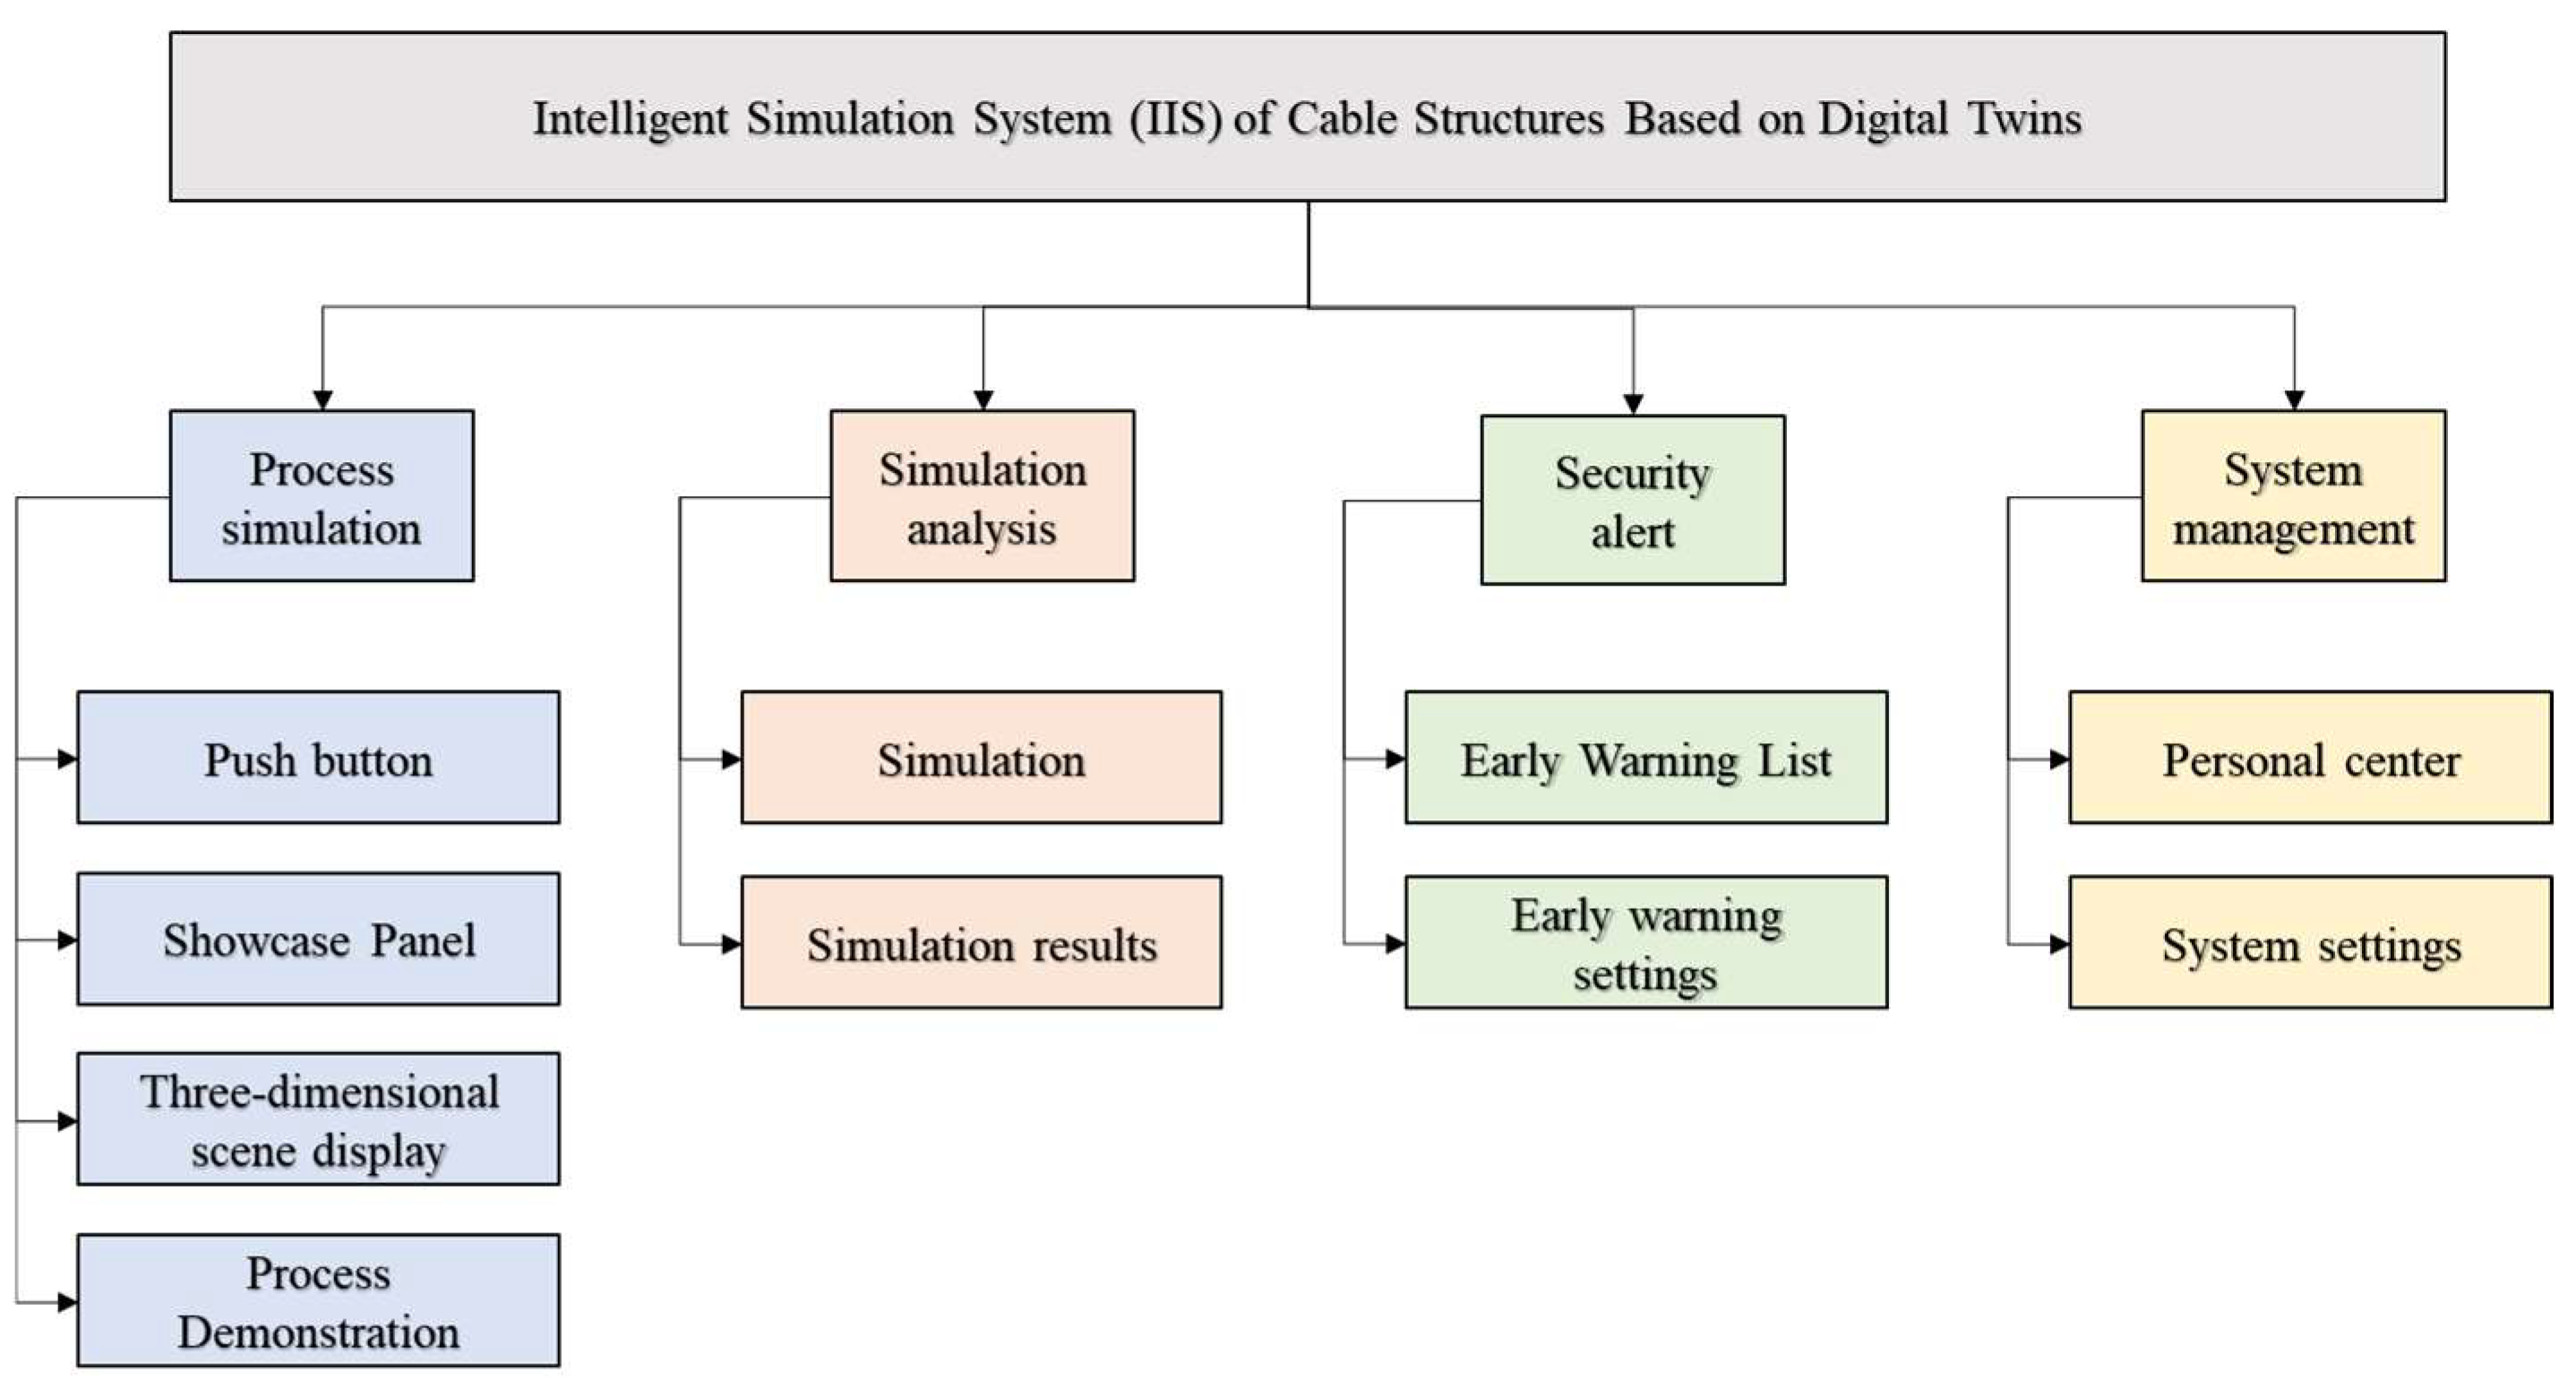
3.2.1. System Functional Requirements Analysis

(1) Construction process visualization requirements
In preparation for the construction of the cable structure, it is imperative to visualize and illustrate the construction process, tailored to the unique attributes of the project. Leveraging construction drawings and pertinent design criteria, a digital twin (DT) model is formulated, and its 3D representation adeptly captures the spatial interrelationships among distinct components of the cable structure. Through construction simulation, the DT model effectively identifies design-related issues, facilitating project management and familiarizing construction personnel with the intricacies of the cable structure’s construction process. This comprehensive approach not only supports collaborative efforts among all stakeholders involved in the construction but also enables the optimization of both the design and construction processes for the cable structure.
(2) Demand for continuous dynamic analysis
The conventional analysis of the cable structure’s construction process occurs in discrete stages, characterized by intermittent and disjointed characteristics between successive construction steps. This approach fails to capture the continuous curve of the structural mechanical response over time. The discrete nature of the analysis means that a comprehensive assessment between individual construction steps is unattainable. Additionally, the finite element analysis for each construction step necessitates model reconfiguration and load application, leading to suboptimal convergence and an inability to satisfy the prerequisites of a continuous construction analysis for cable structures. Thus, there is a pressing need for immediate improvement in this regard.

3.2.2. System Solution Design

(1) Overall architecture design
The monitoring data are transmitted to the backend through the Rabbitmq message queue service for data processing. The data storage business data are stored using Mysql primary and secondary storage. The file data are stored using Minio service. The monitoring data are stored using Influxdb. The data are orchestrated through Springboot architecture. The interface specification is developed through Rest specification. Nginx is used to proxy the service, and Vue + WebGL is used to visualize the page. The overall architecture design is shown in Figure 11.
(2) System functional module design
Based on the outcomes of the functional requirement analysis and the overarching architecture of the system design. The functional modules of the system have been outlined. The system is composed of four key functional modules, namely process simulation, simulation analysis, safety warning, and system management. These modules are visualized and presented in Figure 12 for a clear understanding of their roles within the system.
Process Simulation: The “Process Simulation” module encompasses a comprehensive visualization of the construction project, featuring various functionalities such as operation buttons, display panels, 3D scene visualization, and process flow demonstration. This module plays a vital role in providing users with an intuitive understanding of the ongoing construction activities. Here is an overview of its key components and functions: I. Operation Buttons: The operation buttons enable quick access to different aspects of the construction project. Users can switch between weather information, construction overview, real-time monitoring, measurement point list, construction stage, process simulation, and reset functionalities by simply clicking the corresponding buttons. II. Meteorological Information: The module gathers and presents real measurements and predictions of meteorological data such as temperature, weather conditions, wind speed, wind direction, and precipitation over time. These data help users understand the prevailing weather conditions at the construction site. III. Construction Overview: This section provides a summary of the construction progress, including metrics like the number of ties and the current stage’s completion level. It offers a concise view of the ongoing construction activities and their status. IV. Real-Time Monitoring: The module monitors the real-time status of measurement points equipped with sensors. It calculates and displays the count of online measurement points and any warnings detected by the sensors. The simulation analysis results of the measured data are presented based on the measurement point names. V. 3D Scene Display: Users can interact with a 3D model representing the construction site and its components. The model can be scaled, panned, and rotated for a detailed view. Measurement point information, monitoring values, and simulation results for critical construction components are visualized within the 3D model. VI. Process Flow Demonstration: The process flow is demonstrated using a progress bar. Users can click on different stages to initiate demonstrations from the first step of the selected stage. This feature allows users to observe the construction progress at different stages. VII. Local Process Details: For a more detailed view of specific construction processes, users can click on animation icons to pause the process demonstration. This action switches the model to the corresponding stage, displaying measurement point information, process details, animation markers, and localized demonstrations.
The “Process Simulation” module serves as a visual gateway for users to explore, analyze, and comprehend the various aspects of the construction project. By providing real-time information, simulation results, and interactive visualizations, this module contributes to effective project management and decision making during the construction process.
Online simulation: The “Online Simulation” function offers two key components: simulation calculation and simulation results display. These components contribute to the continuous dynamic analysis of the cable structure and provide a user-friendly interface for visualizing and interacting with simulation outcomes. Here is a breakdown of each component:
I.
Simulation Calculation Function: This feature is responsible for executing the continuous dynamic analysis of the cable structure. It achieves this by optimizing the finite element calculation method used for cable structures. The optimization is designed to enhance the accuracy and efficiency of the simulation process. By employing this function, users can obtain reliable and comprehensive insights into the structural behavior of the cable system during various construction phases.
II.
Simulation Result Function: This component is focused on displaying and filtering the outcomes generated from the continuous dynamic analysis. Users can access the simulation results, which may include information about structural displacement, cable forces, deformations, and other relevant mechanical responses. The simulation results can be presented in a structured and visually informative manner, allowing users to better comprehend the dynamic behavior of the cable structure. Additionally, this function may provide filtering options to refine and customize the displayed results. Users can select specific parameters, time frames, or construction stages for analysis, enabling them to extract meaningful insights from the simulation data. The simulation model’s dynamic visualization is a notable aspect of this function. Users can explore the simulation models interactively, switch between different views, and manipulate the visual representation to gain a clearer understanding of the structural behavior. Moreover, the ability to switch between simulation models from various projects through new creations and imports enhances flexibility and adaptability in the analysis process.
The “Online Simulation” function brings together advanced simulation techniques and user-friendly presentation to empower users in comprehending the behavior and response of the cable structure under different conditions and construction stages. This functionality aids in making informed decisions related to construction, safety, and quality assurance.
Safety warning: The “Safety Warning” function encompasses two primary components: The Warning List and Warning Setting. These features work in tandem to ensure that any potential safety concerns or deviations from expected behavior are promptly identified and addressed. Here is an explanation of each component:
I.
Early Warning Setting Function: This component is dedicated to configuring parameters that govern the early warning system. Users can establish a comparison between real-time monitoring values of key structural components’ mechanical responses and the corresponding simulation values. For each component, users can define threshold values that act as triggers for early warnings. When the real-time monitoring value surpasses the predefined threshold, the system will initiate an early warning to indicate a potential issue.
II.
Early Warning Display Function: The primary role of this feature is to provide an interface for users to access and visualize early warnings. When the system detects that a monitored component’s mechanical response exceeds the set threshold value, it generates an early warning. This information is then compiled into a warning list, which users can access through this function. The warning list presents all pertinent details about the components that have triggered early warnings. Additionally, to enhance user understanding and rapid response, this function employs a 3D model visualization approach. By overlaying early warning markers on the 3D model of the cable structure, users can swiftly identify the specific location of the components causing concern. This visual representation is highly effective in conveying the urgency and location of potential issues.
In essence, the “Safety Warning” function is designed to prevent and mitigate risks by promptly detecting and addressing deviations from expected mechanical responses. By allowing users to configure threshold values, access a warning list, and visualize warnings in the context of the 3D model, the system ensures that safety-related information is readily available and easily comprehensible, facilitating timely corrective actions.
System management: The system management functions include the personal center and system settings. Among them, the personal center provides functions such as personal information improvement, modification, and password retrieval. System settings provide functions such as modification of function settings and switching items.

3.2.3. System Reliability Check

To further validate the effectiveness of the intelligent simulation system based on the DT, this study compares the analysis results of the system’s operational unit tests and beam–cable structures with commonly used finite element software. These comparisons are primarily divided into three segments: single-cable tests as shown in Figure 13, cable network tests as shown in Figure 14, and beam–cable structure tests as shown in Figure 15. For these models, the study conducts a comparison of the test results using Midas, Orcaflex, and Ansys, respectively. Furthermore, a comparison with the data from the literature is also undertaken as part of this study [38].
(1)
In the single cable self-weight problem, the displacement results obtained from the modified cable unit, Orcaflex, Midas, and the analytical solution exhibit strong agreement. Additionally, the maximum displacement error between Ansys and the analytical solution is approximately 4.58%. In the case of the single cable subjected to a point load, the results obtained from the modified cable unit, Orcaflex, and Midas closely correspond, whereas the Ansys results are not directly comparable due to loading considerations. For various other single cable scenarios, the maximum error between the modified cable unit and Midas is 5.71%, with an error of about 2.1% when considering only self-weight.
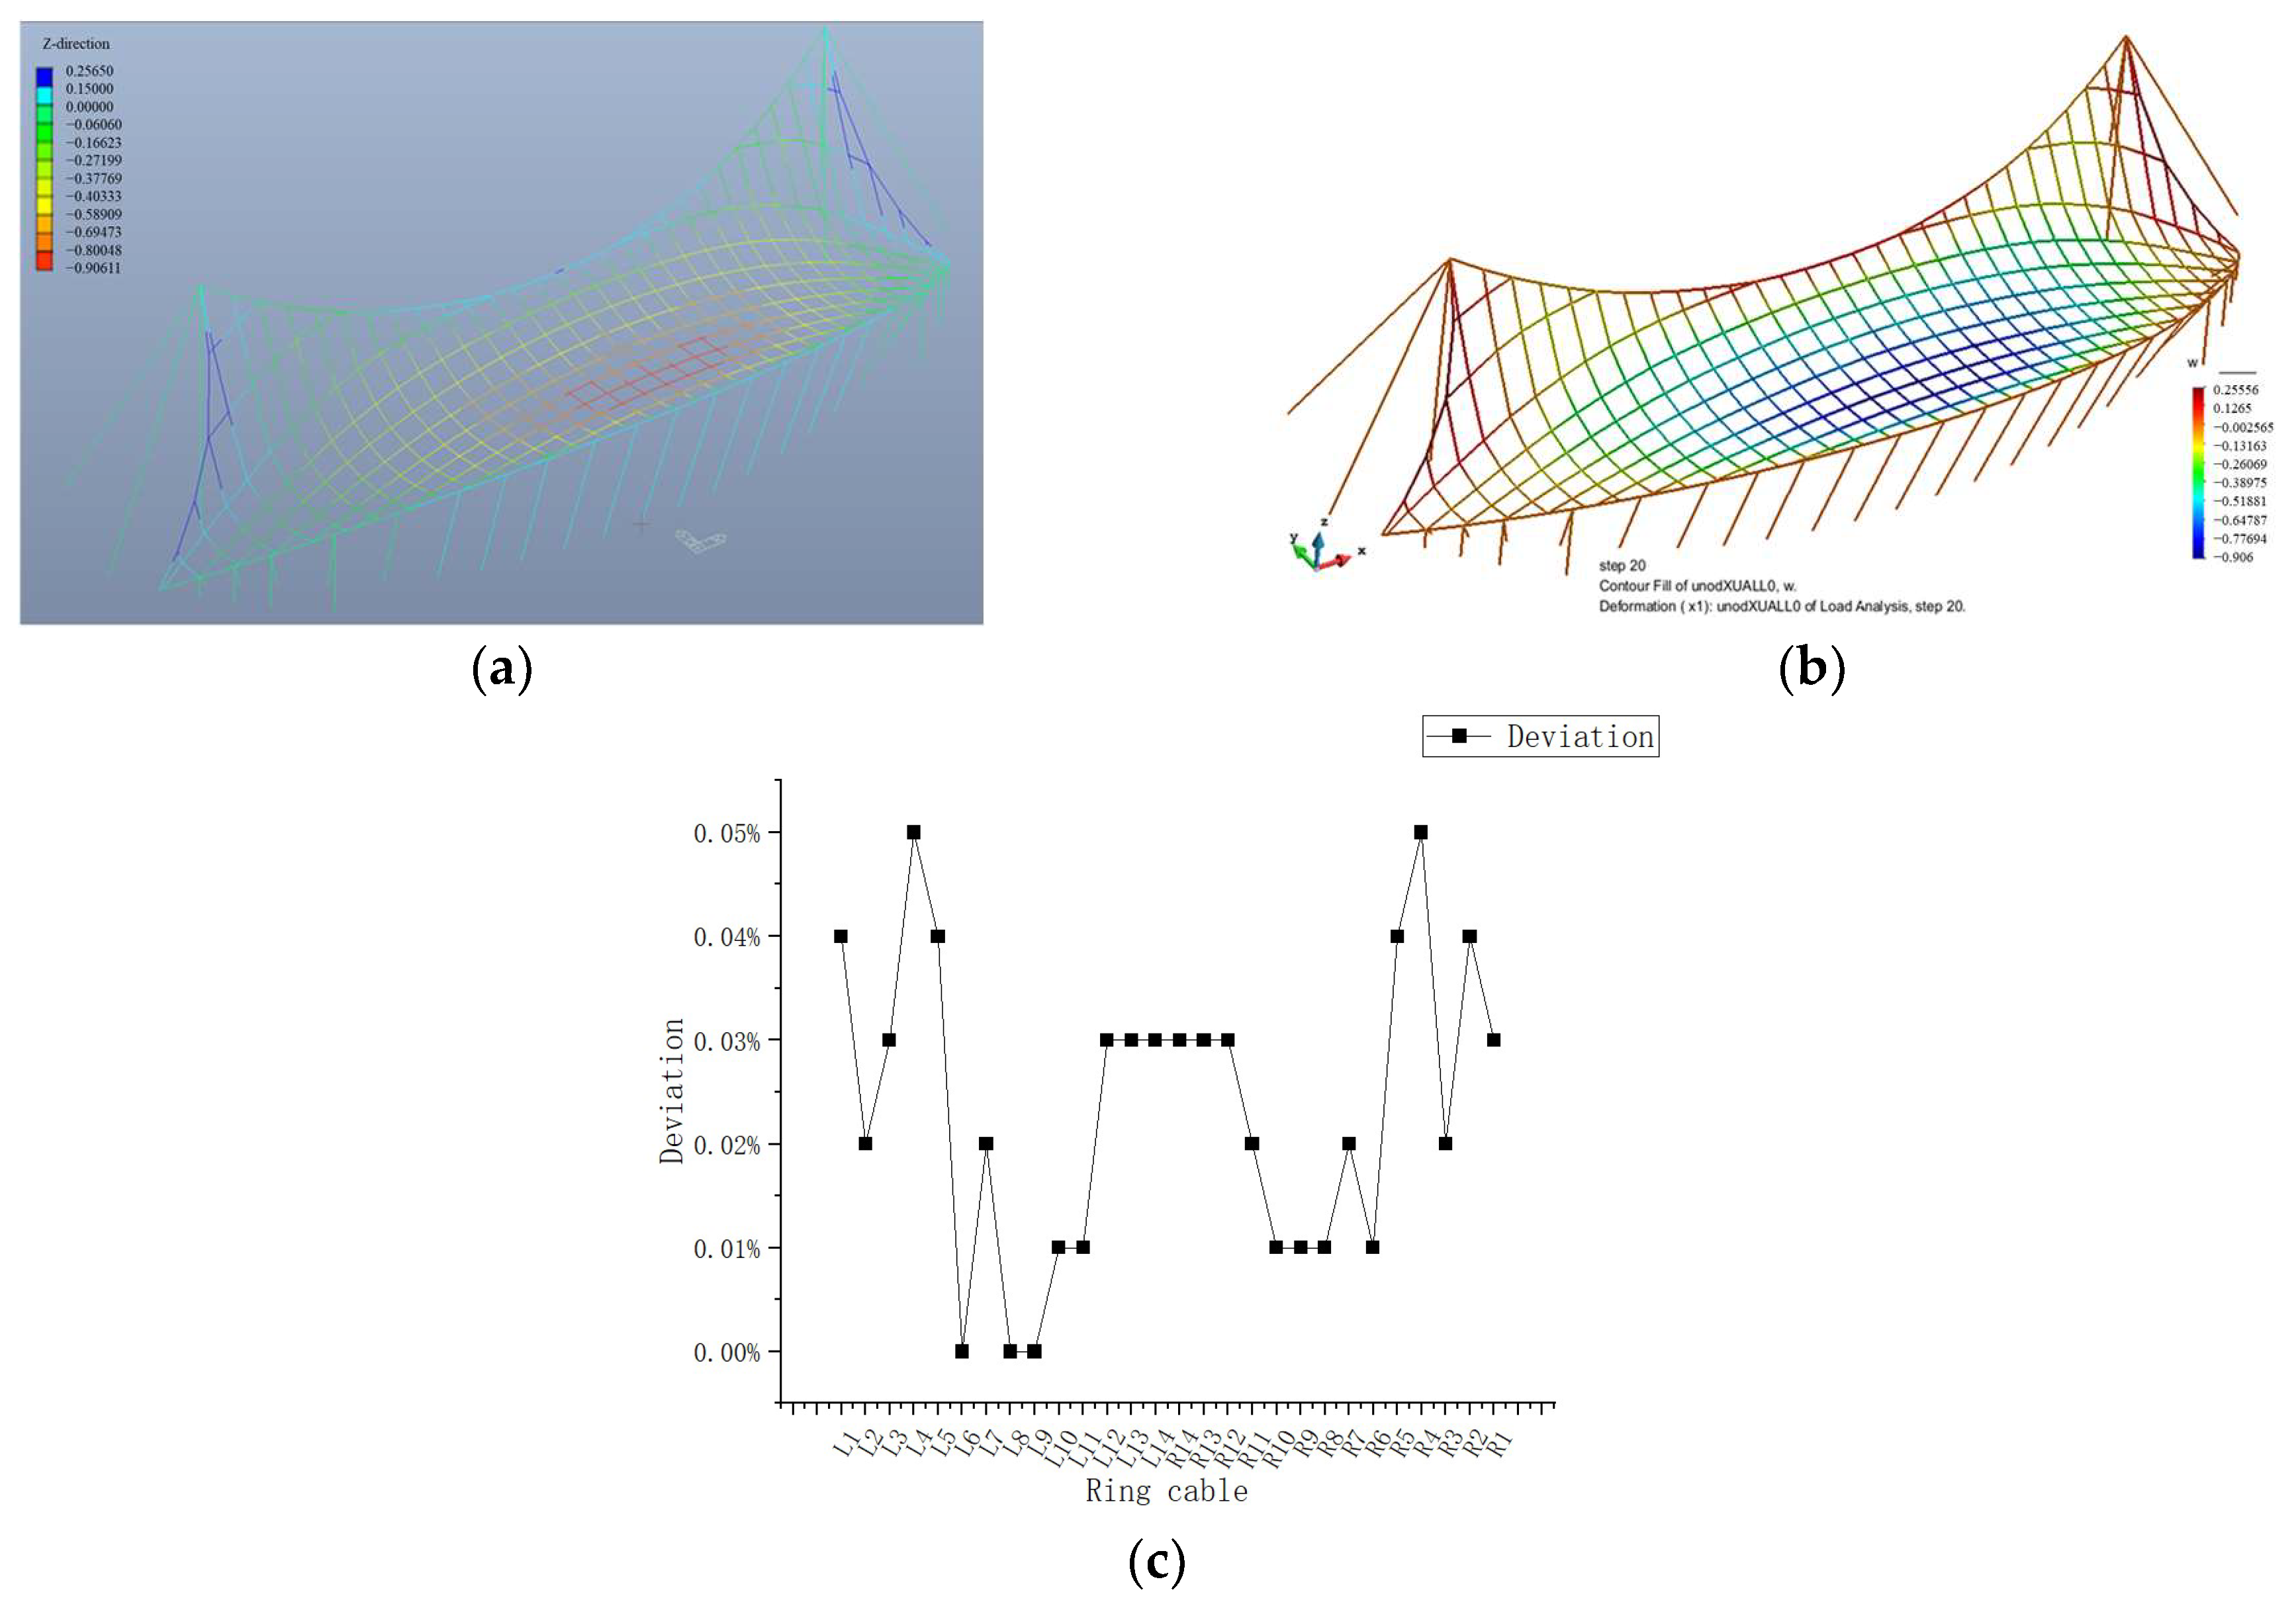
(2)
In the self-weight problem of the cable network, the shapes of the modified cable unit, Orcaflex, Midas, and Ansys exhibit remarkable similarity. Regarding cable force, the difference between the modified cable unit and Orcaflex is minimal, with a maximum discrepancy of only 0.14%. Midas is compared with a single 100-unit and a 10-unit planar model due to the relatively lower number of units per cable in the network. It is observed that the difference between the 100-unit and 10-unit modified cable units is negligible. The average discrepancy between the modified cable units and Midas is approximately 5%, with specific values of 5.46% for 100 units and 4.95% for 10 units. There are four groups showing errors exceeding 10% in the 100-unit comparison and three groups in the 10-unit comparison, all of which occur at internal nodes of the cable network, with deviations remaining within 10% or less.
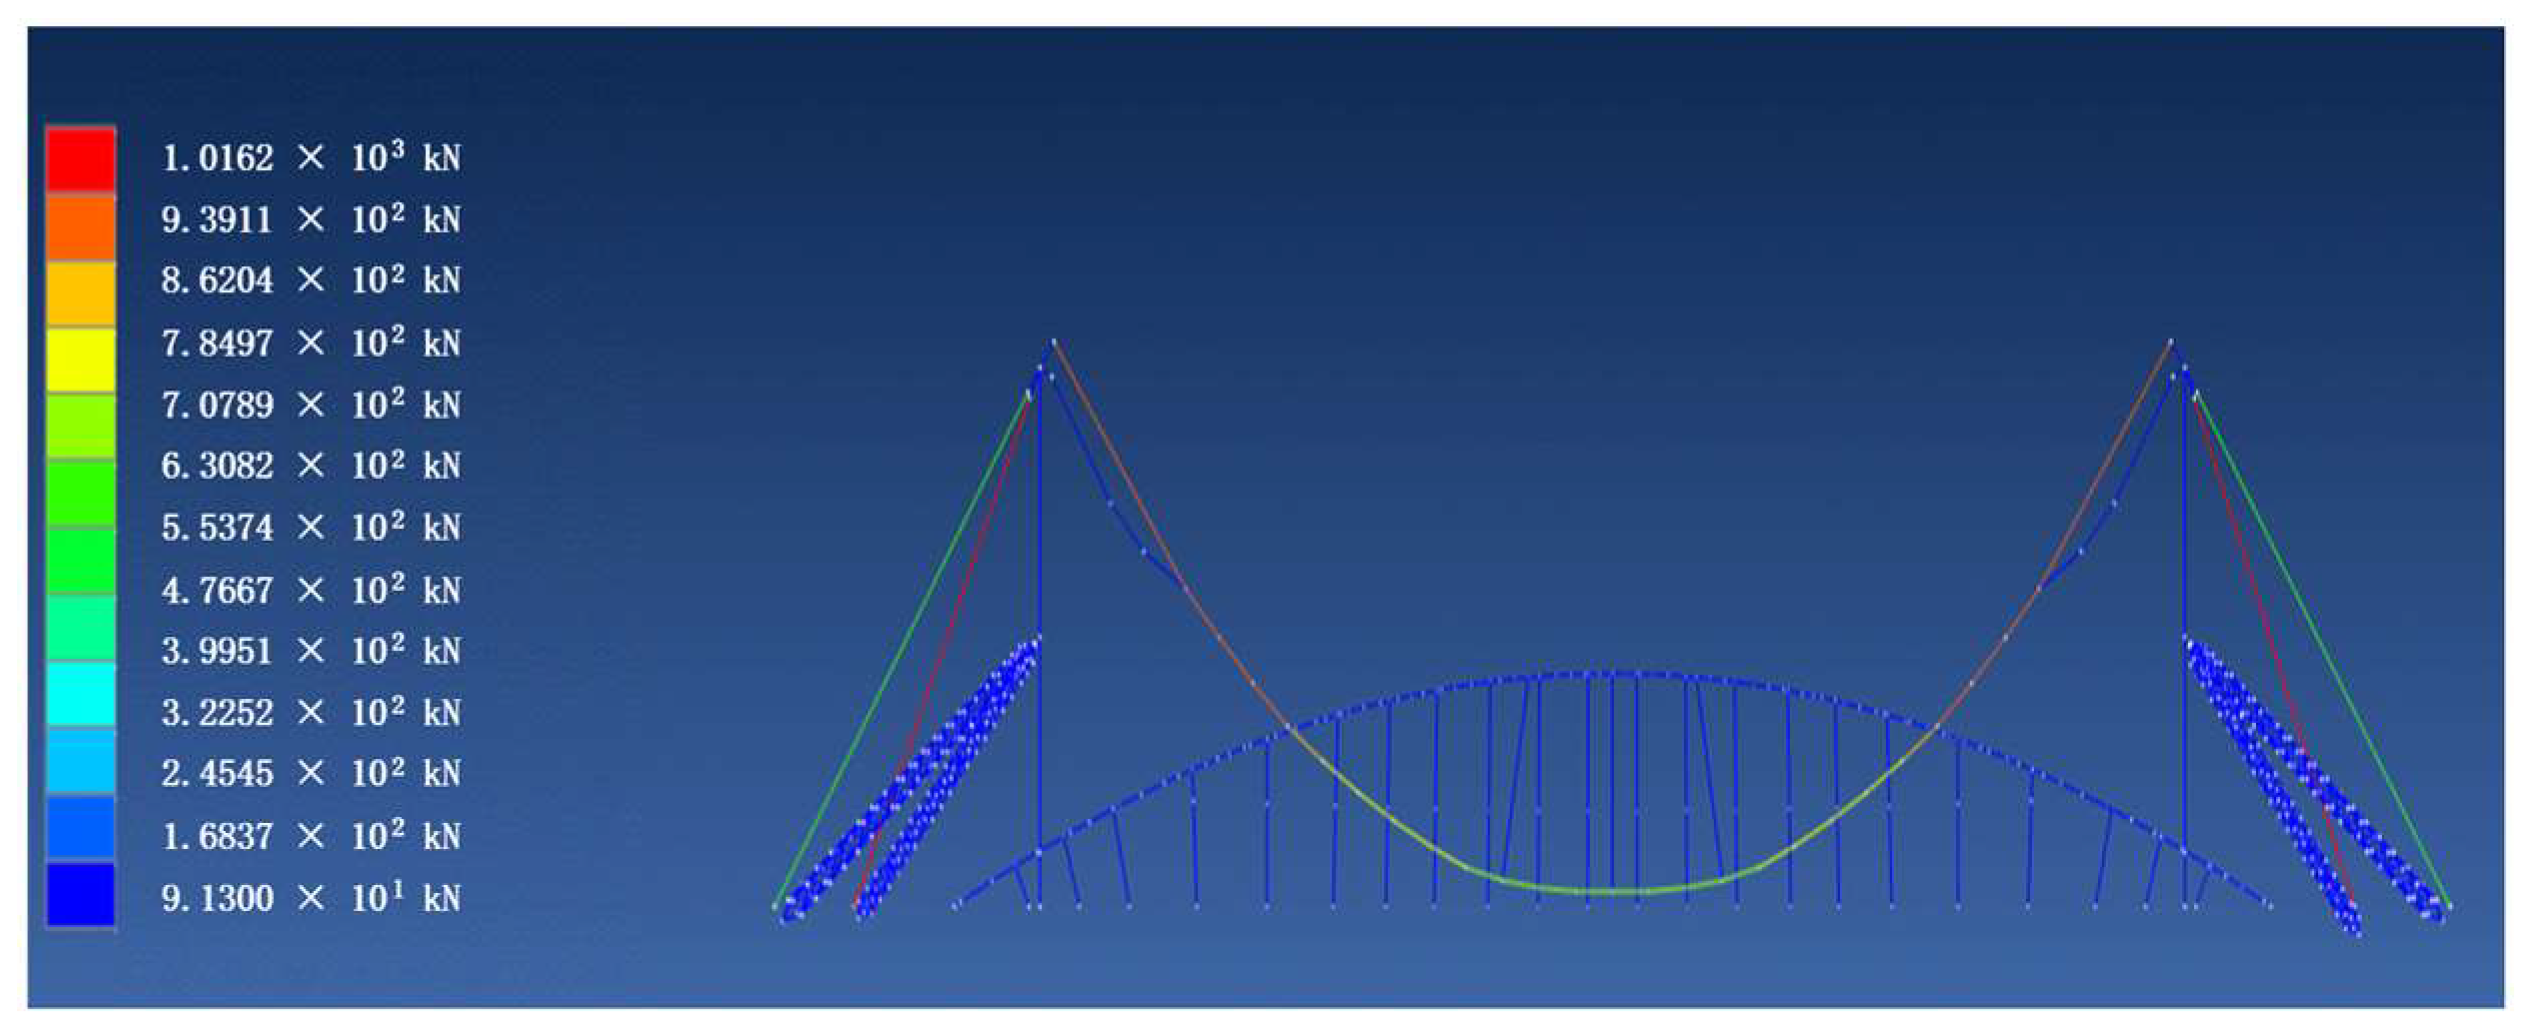
(3)
From the comparison of the beam cable forces, it can be observed that the discrepancies in cable forces among the diagonal cable, vertical cable, ring cable, left and right diagonal cable platform, and Midas are all within 0.6%, indicating a close alignment. Although there is a difference of more than 20% in the vertical cable force, a specific analysis reveals that the vertical cable force exhibiting larger divergence differs in magnitude from the normal cable force by an order of magnitude. As a result, this difference has minimal influence on the analysis outcomes. The discrepancies in the transverse cable force are predominantly constrained to within ±1.7%, falling within an acceptable range.
During the actual testing, it was observed that both the Orcaflex and Ansys modeling processes are more complex. Notably, Ansys is incapable of imposing additional node loads. In contrast, the intelligent simulation system based on DT is enhanced by the finite element algorithm, allowing steady-state modeling across various shapes with robust convergence. This intelligent simulation system serves as a foundational data source for the subsequent dynamic analysis of the cable structure’s construction process continuity.

3.3. Continuous Dynamic Simulation Analysis

To ensure project safety throughout the entire construction process and to understand structural deformations and internal force changes during construction, on-site structural monitoring is essential. This monitoring guides construction safety and accuracy, while also accumulating prestressing engineering construction data. Therefore, this study divides the project into two phases: the construction preparation stage and the construction progress stage. Both stages are subjected to continuous dynamic simulation analysis using the intelligent simulation system.
In this study, the cable structure construction process is broken down into five main construction steps: mast erection, ring cable hoisting, load-bearing -side cable hoisting, stabilizing diagonal cable tensioning, tensioning back cable in place, and structure forming. These steps encompass a total of 32 smaller construction stages. These construction steps are employed for the purpose of process simulation and project progress management.
During the construction preparation stage, the cable structure construction process is simulated based on the divided construction steps. Detailed insights into the construction process of key elements are depicted in Figure 16. This aims to validate the feasibility of the tensioning construction plan and ensure the safety of the tensioning and forming process. The cable structure’s digital twin (DT) model is employed to simulate the mechanical response parameters for each construction step of the cable structure. This enables the continuous simulation analysis of the cable structure’s construction process, facilitating an analysis of cable force and displacement variations throughout construction, as illustrated in Figure 17. This approach ensures adherence to existing standards and specifications.
By conducting construction simulation calculations and analyses during the construction preparation stage, several key benefits are realized. Firstly, the feasibility of the tensioning construction plan can be effectively verified, ensuring the safety of the tensioning and forming process. This verification process involves evaluating the adequacy and appropriateness of the tensioning construction plan.
Secondly, the magnitude of the tensioning force required for each tensioning step can be determined. This provides a crucial theoretical foundation for establishing the tensioning force values that need to be applied during the actual tensioning process.
Moreover, detailed insights into the deformation and stress distribution of the structure during each tensioning step are obtained. This information serves as a theoretical basis for the subsequent deformation monitoring and cable force monitoring activities that occur during the tensioning process.
Additionally, based on the calculated tensioning force values, appropriate tensioning tools can be selected or designed in a rational manner. This ensures that the tensioning process is conducted using suitable tools, optimizing its efficiency and accuracy.
Furthermore, through sensitivity analysis, the potential impact of various construction errors on the structure’s behavior after forming can be evaluated. By identifying sensitive sources, construction and processing activities can be tailored and adapted to effectively address these potential sources of error.
Upon completion of the sensitivity analysis, an error analysis is undertaken to define error limits. This enables precise data control during the manufacturing and construction phases of the components, ensuring that the final structure conforms to the desired standards and specifications. In the construction stage, the intelligent simulation system facilitates the continuous dynamic simulation analysis of the cable structure’s construction phase by means of real-time data comparison between monitoring and simulation data. The system presents visual representations of meteorological conditions and construction progress, aiding in the assessment of current weather conditions and the advancement of construction activities.
Real-time monitoring of cable force and displacement data is conducted using a list of designated measurement points and monitoring and simulation values, as illustrated in Figure 18. These real-time data are then compared to the ongoing simulation results, allowing for immediate determination of the actual state of the cable structure’s construction process. This comparison provides insights into the alignment or deviation between the predicted simulation outcomes and the actual monitored data, assisting in the assessment of the construction’s conformity to the planned trajectory.
Utilizing the dynamic continuity simulation analysis approach for cable structures, this project has successfully developed an intelligent simulation system founded on the concept of the digital twin. This system has enabled the comprehensive analysis of the cable structure’s construction process. Through this system, potential issues can be identified, such as cable units that exhibit cable force and displacement values exceeding safety thresholds as compared to simulation predictions during the construction process.
The continuous dynamic analysis method adopted by this system has furnished both theoretical and methodological foundations for the management and control of the cable structure’s subsequent construction phases. By enabling real-time monitoring, comparison with simulation data, and identification of safety concerns, the intelligent simulation system contributes to enhancing construction safety, quality, and decision making throughout the cable structure’s construction process.

4. Conclusions

The traditional construction analysis model’s lack of synergy and interactivity with on-site processes has hindered the level of sophistication achievable in the construction of cable structures. However, the emergence of DT technology in the construction domain presents an opportunity to enhance the intelligence of cable structure construction processes. By leveraging the DT to gather mechanical response data for each construction step and conducting dynamic analysis at each stage, it is theoretically possible to achieve continuous dynamic analyses throughout the cable structure’s construction phase.
Nevertheless, the prevailing construction analysis for cable structures remains intermittent, posing challenges to achieving continuous dynamics. This study proposes a DT-driven approach for the continuous dynamic analysis of cable structures, aiming to enable seamless analysis throughout construction.
I.
The DT model of the construction process of the cable structure integrates the construction mechanical response values with the finite element analysis values, realizing the continuous comparison in time.
II.
The finite element optimization method of the cable structure adopts the same analytical model to calculate all stages from lifting to tension forming. The results showed that the optimization method has good convergence and the average calculation accuracy is higher than 97%.
III.
The Intelligent Simulation System developed based on the continuous dynamic simulation method realizes continuous analysis of each stage of cable structure construction in the actual project, which ensures the safety and quality of the construction process.
The validation results from case studies demonstrate the system’s accuracy. The maximum error in single-cable self-weight validation between the intelligent simulation system and Midas cable force is 5.71%. In cable network self-weight validation, the average error is approximately 5% (5.46% for 100 units and 4.95% for 10 units). In beam cable validation, the transverse cable force difference remains within ±1.7% or less. Additionally, continuous dynamic simulation calculations and real-time monitoring of mechanical responses confirm the feasibility of the proposed DT-based approach.
The optimization of the finite element calculation method and the establishment of the multidimensional DT model of the cable structure proposed in this paper are the core of the method. Through the verification of actual engineering cases, the intelligent simulation system developed according to the method can overcome the two shortcomings of the traditional construction analysis of cable structures. The continuous dynamic method proposed in this paper was applied in the construction process. Relying on this platform, analyzing the changes in structural reliability caused by the extreme loading is the next step of the research focus.

Author Contributions

Conceptualization, Z.W.; methodology, Z.W.; software, Z.W.; validation, Z.W., M.L., Z.L., M.D., Y.Z. and Y.H.; writing—original draft preparation, Z.W.; writing—review and editing, M.L.; project administration, M.L. and Z.L. All authors have read and agreed to the published version of the manuscript.

Funding

This research received no external funding.

Institutional Review Board Statement

Not applicable.

Informed Consent Statement

Not applicable.

Data Availability Statement

The data presented in this study are available on request from the corresponding author. The data are not publicly available for confidentiality reasons.

Acknowledgments

The authors would like to thank Tianjin University and the Beijing Building Construction Research Institute Co., Ltd., for their support throughout the research project.

Conflicts of Interest

The authors declare no conflict of interest. The funders had no role in the study’s design, collection, analyses, or interpretation of data, the writing of the manuscript, or in the decision to publish the results.

References

  1. Wang, X.; Chen, Z.; Liu, H.; Yu, Y. Experimental study on stress relaxation properties of structural cables. Constr. Build. Mater. 2018, 175, 777–789. [Google Scholar] [CrossRef]
  2. Kotsovinos, P.; Judge, R.; Walker, G.; Woodburn, P. Fire performance of structural cables: Current understanding, knowledge gaps, and proposed research agenda. J. Struct. Eng. 2020, 146, 03120002. [Google Scholar] [CrossRef]
  3. Shi, G.; Liu, Z.; Xian, D.; Zhang, R. Intelligent Assessment Method of Structural Reliability Driven by Carrying Capacity Sustainable Target: Taking Bearing Capacity as Criterion. Sustainability 2023, 15, 10655. [Google Scholar] [CrossRef]
  4. Li, G.; Xiao, L.; Huang, Q.; Pu, L.; Wei, X. Experimental investigation on the performance of Cable-Girder anchorage structure of hybrid Cable-Stayed suspension bridges. Structures 2023, 56, 104911. [Google Scholar] [CrossRef]
  5. Liu, Y.; Xie, J.Z.; Tafsirojjaman, T.; Yue, Q.R.; Tan, C.; Che, G.J. CFRP lamella stay-cable and its force measurement based on microwave radar. Case Stud. Constr. Mater. 2022, 16, e00824. [Google Scholar] [CrossRef]
  6. Chen, Y.; Zheng, K.; Cheng, Z.; Deng, P.; Zhang, Q. Competing mechanism between vertical stiffness and anti-slip safety in double-cable multi-span suspension bridges. Struct. Infrastruct. Eng. 2022, 1–13. [Google Scholar] [CrossRef]
  7. Liu, M.; Li, X.; Xing, G.; Wu, M.; Li, J. Monitoring and simulation analysis of construction process for large-span spatial spoke chord-supported truss structure. J. Archit. Civ. Eng. 2023, 40, 95–102. [Google Scholar]
  8. Ye, X.; Ge, J.; Cheng, S.; Wang, W.; Zhang, G.; Hu, Q. Dynamic simulation of cable dome construction. J. Build. Struct. 2012, 33, 60–66. [Google Scholar]
  9. Han, F.; Dan, D.; Zou, Y.; Lei, H. Experimental and theoretical study on cable-supporting system. Mech. Syst. Signal Process. 2020, 140, 106638. [Google Scholar]
  10. Yao, Y.; Yan, M.; Bao, Y. Measurement of cable forces for automated monitoring of engineering structures using fiber optic sensors: A review. Autom. Constr. 2021, 126, 103687. [Google Scholar] [CrossRef]
  11. Zhang, L.; Qiu, G.; Chen, Z. Structural health monitoring methods of cables in cable-stayed bridge: A review. Measurement 2021, 168, 108343. [Google Scholar] [CrossRef]
  12. Xu, Y.; Brownjohn, J.M. Review of machine-vision based methodologies for displacement measurement in civil structures. J. Civ. Struct. Health Monit. 2018, 8, 91–110. [Google Scholar] [CrossRef]
  13. Kim, J.W.; Park, S. Magnetic flux leakage sensing and artificial neural network pattern recognition-based automated damage detection and quantification for wire rope non-destructive evaluation. Sensors 2018, 18, 109. [Google Scholar] [CrossRef] [PubMed]
  14. Qu, Y.; Zhang, H.; Zhao, R.; Liao, L.; Zhou, Y. Research on the method of predicting corrosion width of cables based on the spontaneous magnetic flux leakage. Materials 2019, 12, 2154. [Google Scholar] [CrossRef] [PubMed]
  15. Mehrabi, A.B.; Ligozio, C.A.; Ciolko, A.T.; Wyatt, S.T. Evaluation, rehabilitation planning, and stay-cable replacement design for the hale boggs bridge in Luling, Louisiana. J. Bridge Eng. 2010, 15, 364–372. [Google Scholar] [CrossRef]
  16. Zhou, G.D.; Yi, T.H. A summary review of correlations between temperatures and vibration properties of long-span bridges. Math. Probl. Eng. 2014, 2014, 638209. [Google Scholar] [CrossRef]
  17. Zejli, H.; Gaillet, L.; Laksimi, A.; Benmedakhene, S. Detection of the presence of broken wires in cables by acoustic emission inspection. J. Bridge Eng. 2012, 17, 921–927. [Google Scholar] [CrossRef]
  18. Hu, D.; Guo, Y.; Chen, X.; Zhang, C. Cable force health monitoring of Tongwamen bridge based on fiber Bragg grating. Appl. Sci. 2017, 7, 384. [Google Scholar] [CrossRef]
  19. Zheng, R.; Liu, L.; Zhao, X.; Chen, Z.; Zhang, C.; Hua, X. Investigation of measurability and reliability of adhesive-bonded built-in fiber Bragg grating sensors on steel wire for bridge cable force monitoring. Measurement 2018, 129, 349–357. [Google Scholar] [CrossRef]
  20. Dong, C.Z.; Catbas, F.N. A review of computer vision–based structural health monitoring at local and global levels. Struct. Health Monit. 2021, 20, 692–743. [Google Scholar] [CrossRef]
  21. Yu, J.; Meng, X.; Yan, B.; Xu, B.; Fan, Q.; Xie, Y. Global Navigation Satellite System-based positioning technology for structural health monitoring: A review. Struct. Control Health Monit. 2020, 27, e2467. [Google Scholar] [CrossRef]
  22. Wang, X.; Zhao, Q.; Xi, R.; Li, C.; Li, G. Review of bridge structural health monitoring based on GNSS: From displacement monitoring to dynamic characteristic identification. IEEE Access 2021, 9, 80043–80065. [Google Scholar] [CrossRef]
  23. Tian, Y.; Chen, C.; Sagoe-Crentsil, K.; Zhang, J.; Duan, W. Intelligent robotic systems for structural health monitoring: Applications and future trends. Autom. Constr. 2022, 139, 104273. [Google Scholar] [CrossRef]
  24. Li, Y.Q.; Zhao, H.W.; Yue, Z.X.; Li, Y.W.; Zhang, Y.; Zhao, D.C. Real-Time Intelligent Prediction Method of Cable’s Fundamental Frequency for Intelligent Maintenance of Cable-Stayed Bridges. Sustainability 2023, 15, 4086. [Google Scholar] [CrossRef]
  25. Tao, F.; Liu, W.; Liu, J.; Liu, X.; Liu, Q.; Qu, T.; Hu, T.; Zhang, Z.; Xiang, F.; Xu, W.; et al. Digital twin and its potential application exploration. Comput. Integr. Manuf. Syst. 2018, 24, 1–18. [Google Scholar]
  26. Grieves, M. Intelligent digital twins and the development and management of complex systems. Digit. Twin 2022, 2, 8. [Google Scholar] [CrossRef]
  27. Hosamo, H.H.; Imran, A.; Cardenas-Cartagena, J.; Svennevig, P.R.; Svidt, K.; Nielsen, H.K. A review of the digital twin technology in the AEC-FM industry. Adv. Civ. Eng. 2022, 2022, 2185170. [Google Scholar] [CrossRef]
  28. Tuhaise, V.V.; Tah, J.H.M.; Abanda, F.H. Technologies for digital twin applications in construction. Autom. Constr. 2023, 152, 104931. [Google Scholar] [CrossRef]
  29. Tao, F.; Liu, W.; Zhang, M.; Hu, T.; Qi, Q.; Zhang, H.; Sui, F.; Wang, T.; Xu, H.; Huang, Z.; et al. Five-dimension digital twin model and its ten applications. Comput. Integr. Manuf. Syst. 2019, 25, 1–18. [Google Scholar]
  30. Tao, F.; Zhang, C.; Qi, Q.; Zhang, H. Digital twin maturity model. Comput. Integr. Manuf. Syst. 2022, 28, 1267–1281. [Google Scholar]
  31. Liu, Z.; Li, A.; Meng, X.; Shi, G.; Cao, C. Establishment Method of Digital Twin Model for Hoisting Safety Risk Management of Assembly Building. J. Inf. Technol. Civ. Eng. Archit. 2022, 14, 26–33. [Google Scholar]
  32. Liu, Z.; Shi, G.; Meng, X.; Sun, Z. Intelligent control of building operation and maintenance processes based on global navigation satellite system and digital twins. Remote Sens. 2022, 14, 1387. [Google Scholar] [CrossRef]
  33. Phoon, K.K.; Zhang, W. Future of machine learning in geotechnics. Georisk Assess. Manag. Risk Eng. Syst. Geohazards 2023, 17, 7–22. [Google Scholar] [CrossRef]
  34. Zhang, W.; Gu, X.; Tang, L.; Yin, Y.; Liu, D.; Zhang, Y. Application of machine learning, deep learning and optimization algorithms in geoengineering and geoscience: Comprehensive review and future challenge. Gondwana Res. 2022, 109, 1–17. [Google Scholar] [CrossRef]
  35. Zhang, W.; Li, H.; Li, Y.; Liu, H.; Chen, Y.; Ding, X. Application of deep learning algorithms in geotechnical engineering: A short critical review. Artif. Intell. Rev. 2022, 54, 5633–5673. [Google Scholar] [CrossRef]
  36. Shehadeh, A.; Alshboul, O.; Al Mamlook, R.E.; Hamedat, O. Machine learning models for predicting the residual value of heavy construction equipment: An evaluation of modified decision tree, LightGBM, and XGBoost regression. Autom. Constr. 2022, 129, 103827. [Google Scholar] [CrossRef]
  37. Alshboul, O.; Shehadeh, A.; Mamlook, R.E.A.; Almasabha, G.; Almuflih, A.S.; Alghamdi, S.Y. Prediction liquidated damages via ensemble machine learning model: Towards sustainable highway construction projects. Sustainability 2022, 14, 9303. [Google Scholar] [CrossRef]
  38. Bertrand, C.; Acary, V.; Lamarque, C.H.; Ture Savadkoohi, A. A robust and efficient numerical finite element method for cables. Int. J. Numer. Methods Eng. 2020, 121, 4157–4186. [Google Scholar] [CrossRef]
Figure 1. Discrete analysis state diagram.
Sustainability 15 16125 g001
Figure 2. Architecture of continuous dynamic analysis method based on DT.
Sustainability 15 16125 g002
Figure 3. Mechanisms for continuous dynamic analysis of cable structures.
Sustainability 15 16125 g003
Figure 4. DT frame for the construction process of the cable structure.
Sustainability 15 16125 g004
Figure 5. Information collection mechanism.
Sustainability 15 16125 g005
Figure 6. DT model building process for the construction process of cable structures.
Sustainability 15 16125 g006
Figure 7. Soldier–strain relationship diagram [38].
Sustainability 15 16125 g007
Figure 8. Single-layer cable net roofing.
Sustainability 15 16125 g008
Figure 9. Layout of measurement points: (a) description of total station measurement point layout; (b) description of GPS bit-type monitoring arrangement diagram.
Sustainability 15 16125 g009
Figure 10. Virtual construction model of cable structure.
Sustainability 15 16125 g010
Figure 11. Overall architecture diagram.
Sustainability 15 16125 g011
Figure 12. Functional modules of DT-based intelligent simulation system for cable structures.
Sustainability 15 16125 g012
Figure 13. Comparison of the results of the single-cord deadweight bit pattern test. (a) Single cable ends at the same level; (b) the difference between the two ends of the single cable is 8 m [38].
Sustainability 15 16125 g013
Figure 14. Comparison of calculation results under the self-weight of the cable network. (a) Intelligent simulation system for calculating deflection (unit: m); (b) Ansys calculation of deflection (unit: m); (c) Midas calculates deflection (unit: m); (d) Orcaflex calculates deflection (unit: m); (e) computational deflection in the literature (unit: m); (f) deviation of calculation results by above software.
Sustainability 15 16125 g014
Figure 15. Comparison of the results of the two software bitmap calculations (unit: m). (a) Midas calculates deflection (unit: m); (b) intelligent simulation system for calculating deflection (unit: m); (c) deviation of calculation results by Midas.
Sustainability 15 16125 g015
Figure 16. Simulation of the construction process of the cable structure (detailing).
Sustainability 15 16125 g016
Figure 17. Continuous finite element simulation results.
Sustainability 15 16125 g017
Figure 18. Monitoring and simulation value of ring cable force.
Sustainability 15 16125 g018
Disclaimer/Publisher’s Note: The statements, opinions and data contained in all publications are solely those of the individual author(s) and contributor(s) and not of MDPI and/or the editor(s). MDPI and/or the editor(s) disclaim responsibility for any injury to people or property resulting from any ideas, methods, instructions or products referred to in the content.

