Article

The Influence of Urbanization and Environmental Factors on the Financial Performance of Retail and Automotive Industries in China

1
College of Business Administration, Al-Hamd Islamic University, Quetta 87300, Pakistan
2
College of Business Administration, Gulf University for Science and Technology, Mubarak Al-Abdullah 32093, Kuwait
3
College of Business Administration, Alfaisal University, Riyadh 11533, Saudi Arabia
4
College of Business Administration, Prince Sultan University, Riyadh 12435, Saudi Arabia
5
College of Business Administration, American University of Kuwait, Safat 13034, Kuwait
6
Faculty of Commerce, Mansoura University, Mansoura City 35516, Egypt
*
Authors to whom correspondence should be addressed.
Sustainability 2023, 15(23), 16138; https://doi.org/10.3390/su152316138
Submission received: 20 October 2023 / Revised: 13 November 2023 / Accepted: 14 November 2023 / Published: 21 November 2023
(This article belongs to the Special Issue Advances in Ecosystem Services and Urban Sustainability)

Abstract

:
This study probes the intersection of urbanization, environmental degradation, and corporate performance in China’s retail and automotive sectors. Utilizing data from 23 regions spanning 2000–2022, the research elucidates the impacts of urban growth, infrastructure development, and particulate matter 2.5 pollution (PM2.5) on these industries. The study uses panel data from 2000 to 2022 and the corresponding analytical random effect model, along with pre- and post-estimation tests for the main results. The findings reveal that while urban population growth bolsters retail sales, it adversely affects the automotive industry. Urban infrastructure does not influence conventional sectors, yet it negatively impacts online retail sales. PM2.5 pollution depresses retail and automotive sales but boosts online sales, underscoring the rising environmental consciousness among consumers. The urban population significantly moderates the relationship between PM2.5 pollution and sales across sectors, hinting at unique consumption patterns in populated urban areas. This study provides critical insights for policymakers aiming for sustainable economic growth, and encourages further research with more region-specific factors and extended time frames.

1. Introduction

Urbanization and environmental degradation are pivotal phenomena shaping the 21st century, and their intersection with corporate performance necessitates attention. The United Nations estimated that the proportion of the global population in urban areas will increase to 68% by 2050 from 55% in 2018, heralding unprecedented urban expansion [1]. Simultaneously, air quality is deteriorating globally due to the increased presence of pollutants like particulate matter 2.5 pollution (PM2.5), posing significant threats to human health and ecosystems [2,3,4]. These conditions, directly and indirectly, impact corporate landscapes. Companies in the retail and automotive industries are significantly influenced by these urban and environmental dynamics, leveraging the opportunities presented by urban environments, while also being affected by environmental challenges [5,6,7,8,9].
Although some studies have investigated the relationship between environmental sustainability and financial performance [10,11,12], comprehensive research examining the influence of urbanization on this relationship is still limited. There has been a considerable amount of work on the effects of urbanization on environmental degradation [13,14,15,16,17]. Still, the intersection of these dynamics with corporate financial performance remains relatively untouched. Earlier research has predominantly addressed the influence of urbanization on broader economic growth [18,19,20] or the implications of environmental factors on business operations and performance [21,22,23,24]. Notably, the spotlight on ecological performance has often been on the manufacturing sector, with industries like retail and automotive sectors receiving less focus [25]. Even though evidence suggests a noteworthy connection between environmental performance and financial results [10,11,26,27,28], the potential moderating effect of urbanization in this nexus is yet to be thoroughly explored. Given the consistent rise in urban populations and consequent environmental challenges, this research gap needs attention. This study aims to delve deeply into how urbanization and ecological considerations influence corporate financial performance.
The current study contributes to the existing literature in the following ways: First, it delves into the overarching influence of urbanization on corporate financial performance, exploring how the burgeoning urban landscapes might potentially catalyze or impede corporate profitability. Second, the research turns its attention to the pervasive issue of air pollution, seeking to comprehend its tangible impact on corporate financial outcomes. Air quality is often compromised, particularly in rapidly urbanizing regions, leading to many socio-economic ramifications. Lastly, in recognizing the intertwined nature of urbanization and environmental degradation, the study probes the potential moderating effect of urbanization on the relationship between air pollution and corporate financial performance.
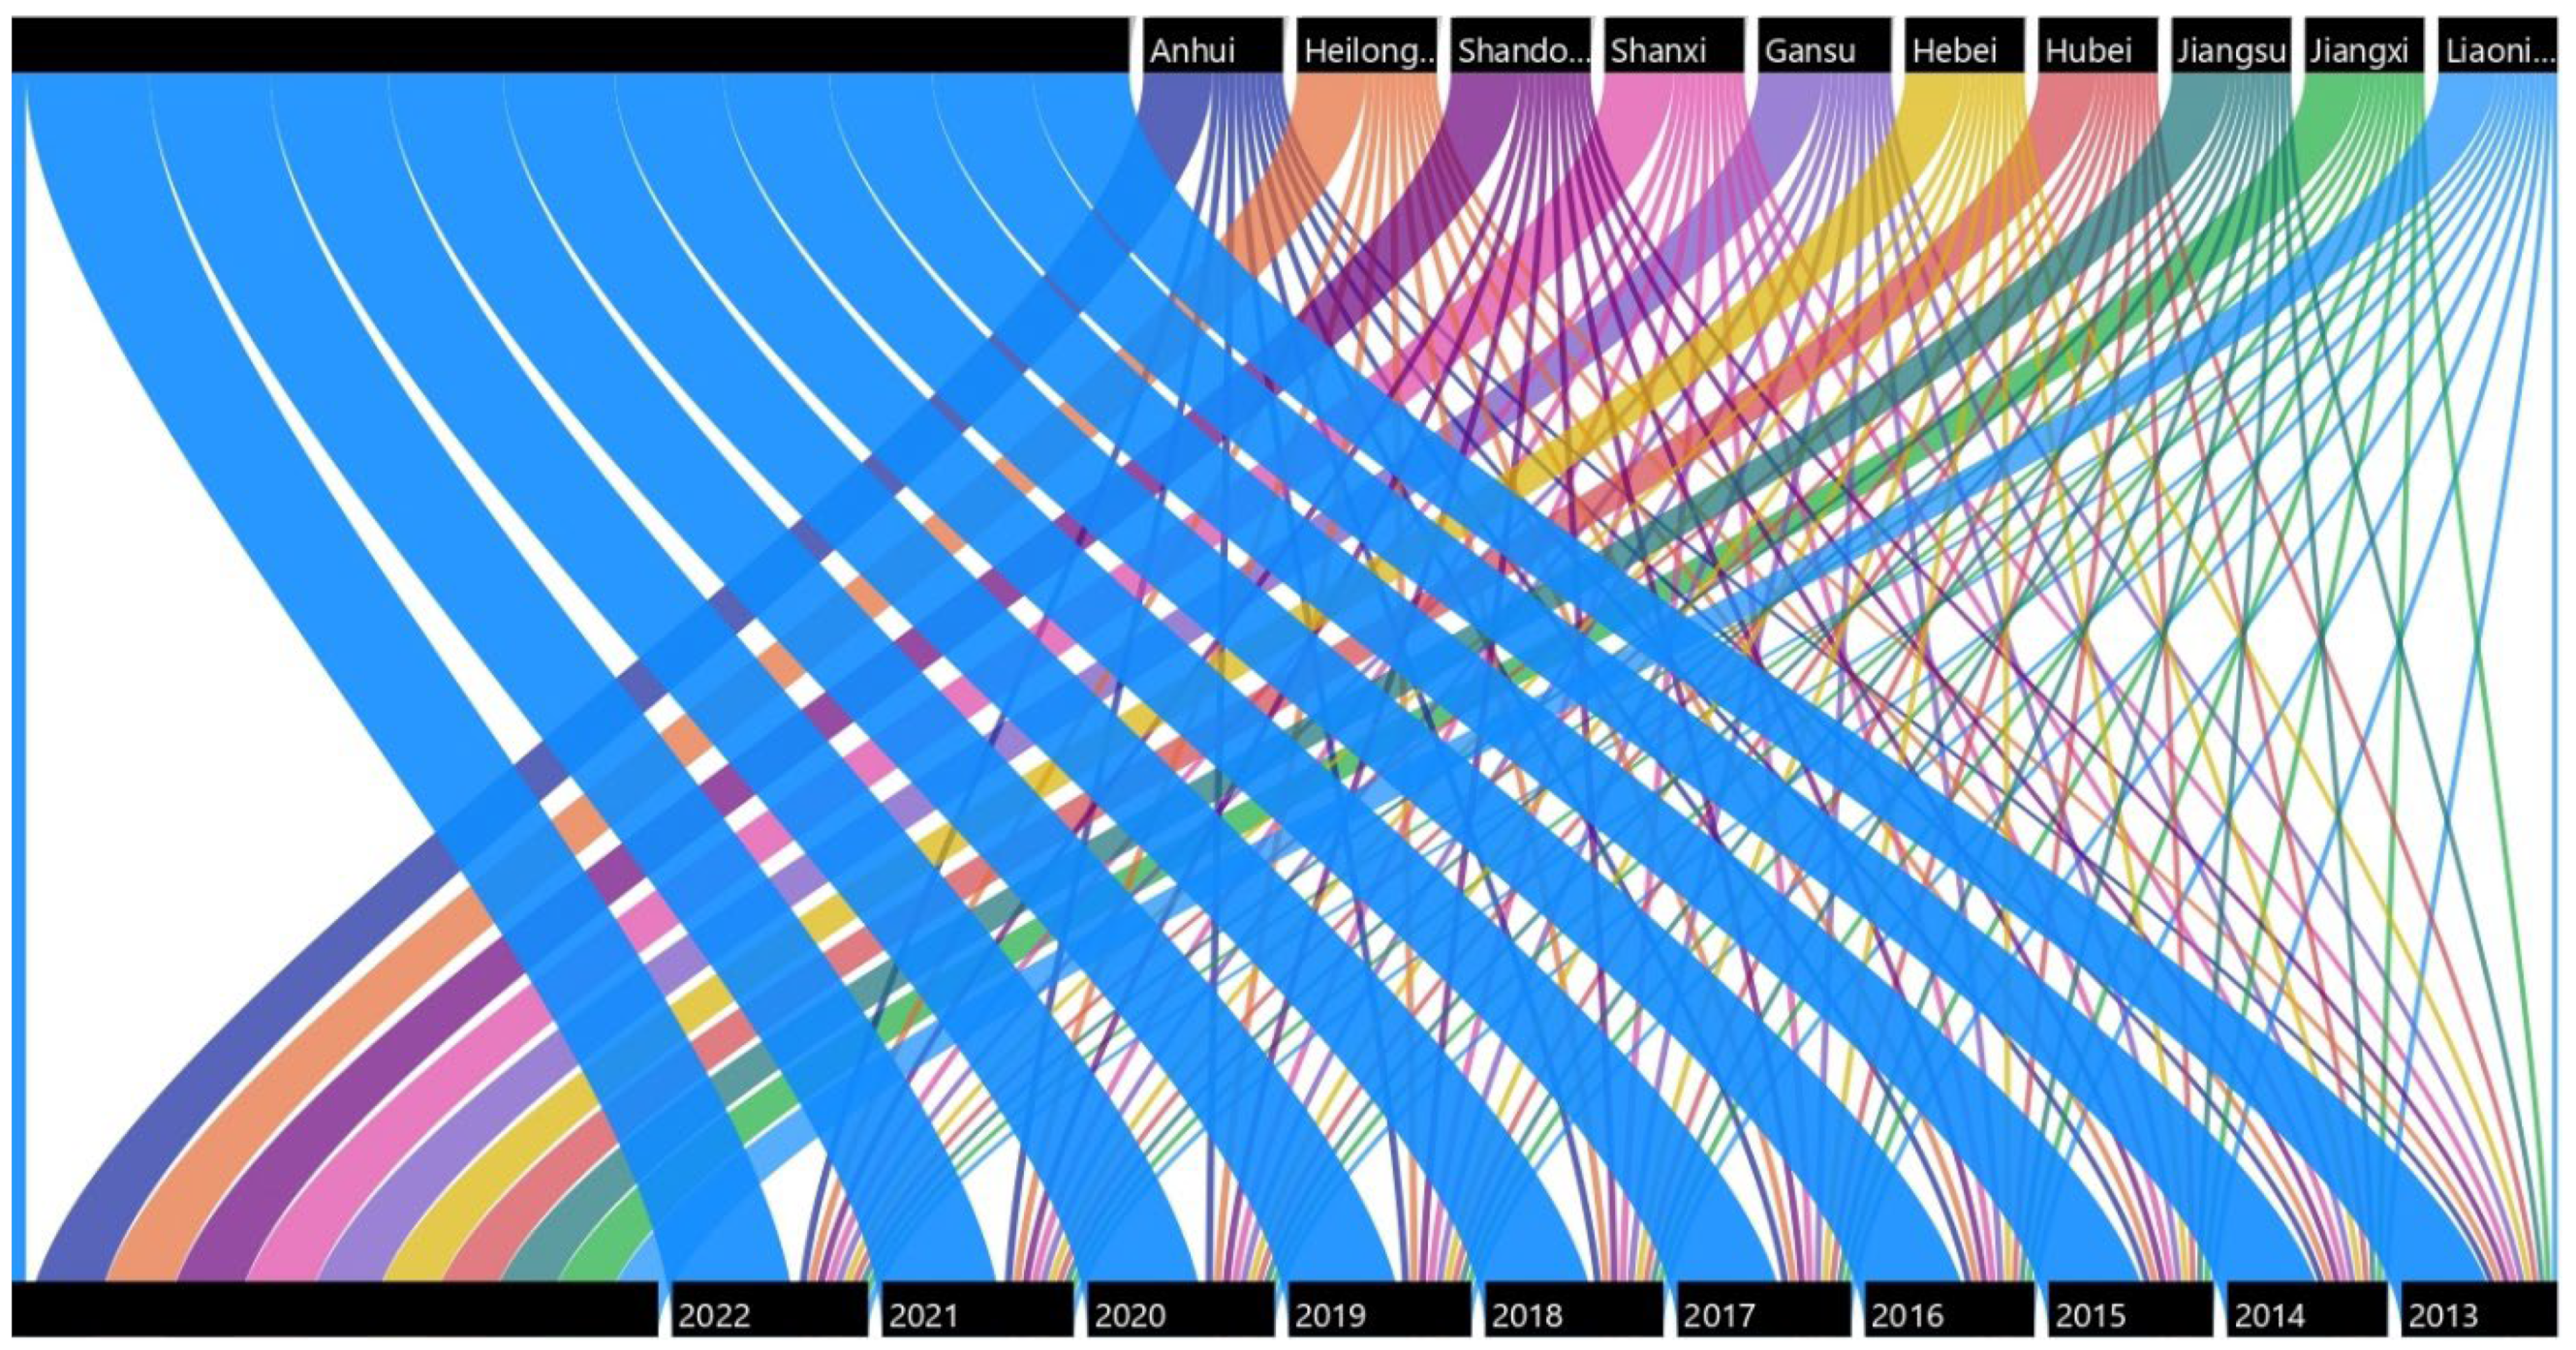
The current study focuses on traditional and online retail, in addition to passenger car sales, which provides an insightful lens through which to explore the intricate relationships between urbanization, air pollution, and corporate financial performance. Urban center growth has historically been linked to increased retail demand, with the rapid surge in e-commerce further influenced by technological advancements and connectivity in urban settings [29]. The automotive sector, especially the sale of passenger cars, stands at a unique juncture. While urban expansion boosts the demand for vehicles, increasing concerns about air pollution can alter consumer preferences and usher in stricter regulatory standards [24,30,31,32]. Hence, the selected sectors encapsulate the complexities inherent in this research endeavor. The year-wise and region-wise retail sale details are given in Figure 1. Figure 1 shows the year-wise and regional retail sales in China. The figure provides a visual representation of the changes in retail sales over time and across different regions of China. The study uses these data to understand the local factors shaping urban growth, pollution, infrastructure, and retail sales. By analyzing these data, the study aims to provide insights into how policymakers and industry stakeholders can promote sustainable economic growth and reduce environmental pollution in China.
This study uses PM2.5, a particulate matter with a diameter of 2.5 μm, as a pivotal pollution measure due to significant health and environmental impacts. These particles deeply penetrate the respiratory system, leading to health issues and even premature mortality [30,33,34,35,36,37]. Additionally, PM2.5 affects atmospheric visibility and can alter climate patterns [37,38]. With its heightened industrial and vehicular activities, urbanization magnifies PM2.5 emissions, influencing health and industry dynamics [3,19,35,39]. Residents in high-PM2.5 areas often avoid outdoor ventures, impacting traditional retail [40]. Regulatory responses to PM2.5 elevation can also reshape the automotive sector’s cost structure and market conditions [41]. Hence, PM2.5 bridges urban growth and corporate financial performance.
The current study is conducted from the perspective of Chinese industries, climate, and urbanization. With its rapid urbanization and economic growth from 2000 to 2022, China provides a valuable case for this study. According to the United Nations, this period saw a vast urban population shift, from 36% living in urban areas in 2000 to nearly 61% by 2020. The marked urban population and infrastructure changes during this period significantly impacted consumer behavior and environmental conditions [42,43,44], offering a compelling backdrop for our analysis. Additionally, China’s digital revolution during these years, resulting in over 989 million internet users by 2020, has fundamentally transformed its retail landscape [42]. The nation has the world’s largest e-commerce market, providing a rich context for studying online retail sales dynamics. The year-wise and region-wise sales detail is presented in Figure 1 Using regional data allows us to appreciate the heterogeneity of China’s national economy and understand the local factors shaping urban growth, pollution, infrastructure, and retail sales. Thus, the choice of China, the timeframe, and regional data considerably enhance the study’s relevance and robustness.

1.1. Literature Review

Urban population growth often leads to increased economic activity and opportunities for businesses. This process of urbanization, characterized by increasing density, diversity, and complexity of economic interactions, tends to boost corporate financial performance. As the population in urban areas grows, it stimulates demand for products and services, offering businesses opportunities for expansion and revenue growth [45,46]. In addition, urbanization brings about agglomeration effects, such as reduced transaction costs and improved access to skilled labor, which can enhance productivity and innovation in firms, positively influencing their financial performance [47]. However, an increased urban population growth can also result in market saturation and intense business competition, potentially diluting profitability [48].
The quality of urban infrastructure can have significant implications for corporate financial performance. Infrastructure such as transportation, energy, telecommunications, and essential utilities can influence the efficiency of business operations, customer accessibility, and, consequently, the financial health of companies [49].
Transport infrastructure, for instance, can reduce transportation costs, enable access to broader markets, and improve supply chain efficiency, contributing to better financial performance [50]. Energy infrastructure, particularly the reliability and accessibility of electricity, directly affects the operational efficiency of businesses and can significantly impact their productivity [17].
Further, in the era of digital business and e-commerce, telecommunication infrastructure plays a critical role. Companies with better access to digital infrastructure are likely to show improved financial performance due to a broader market reach and improved customer service [24]. However, as Glaeser [51] notes, while adequate infrastructure can enhance business performance, poorly planned and inefficient infrastructure can hinder business success. Thus, while significant, the relationship between urban infrastructure and corporate financial performance is complex and warrants further empirical examination.
Air pollution, particularly particulate matter with a diameter of 2.5 μm or less (PM2.5), has increasingly become a concern for businesses. PM2.5 breakdown has been shown to, directly and indirectly, affect corporate financial performance [22]. Directly, PM2.5 pollution can lead to increased operational costs for corporations. These costs could come from the need for mitigation measures to protect employee health and productivity or reduce emissions in response to environmental regulations [32]. In this regard, research has found a significant negative relationship between the levels of PM2.5 and firm profitability [52].
PM2.5 is distinctively alarming when juxtaposed against other potential pollution measures due to its intrinsic properties and associated hazards. Its delicate particulate nature allows it to penetrate deeply into the respiratory system, often leading to severe health outcomes such as cardiovascular diseases and lung cancer [33,37,53]. Specifically, in urban regions of China, rapid industrialization coupled with vehicular emissions has exacerbated PM2.5 concentrations, making it a dominant pollutant of concern [54]. While other pollutants like the ozone or NO2 have notable effects, PM2.5 carries a unique dual burden. It directly influences health and acts as a proxy for a cocktail of harmful substances, as PM2.5 particles often adsorb toxic organic compounds, metals, and other pollutants [55]. Given this compounded impact and its omnipresence in urban Chinese settings, PM2.5 stands out as a critical measure of air quality and its ramifications on human health and the environment.
Understanding the intersection of environmental factors and urbanization in the context of corporate financial performance is a complex endeavor. Research has shown that urbanization and ecological conditions, such as air quality, can interact in ways that affect businesses both positively and negatively [15]. Environmental factors can sway operational expenses for businesses and mold both consumer choices and regulatory interventions. Heightened public consciousness and examination of environmental concerns can cause changes in consumer inclinations and more stringent regulations, affecting a company’s financial outcomes [56]. The interaction between urban growth and environmental factors highlights the significance of eco-friendly urban planning and sustainable business practices in improving a company’s financial results. Further research is needed to better understand these interactions and how corporations can navigate them for improved financial performance.
The role of urbanization as a moderator in the relationship between environmental factors and corporate financial performance is an area of growing interest in the research community. Urbanization can create a unique context that significantly alters how ecological factors affect corporate financial performance. From an operational perspective, the concentration of infrastructure, human capital, and market demand within urbanized areas can mitigate the negative impacts of environmental challenges [45]. For example, Liang [16] suggests that urbanization can bolster the resilience of corporations to the detrimental effects of environmental factors, such as air pollution, by providing access to advanced technologies, infrastructure, and institutional support that help manage environmental risks and costs.
Urbanization is a dynamic moderator in discerning how environmental factors like PM2.5 pollution influence corporate financial outcomes. As urban centers swell, the density of human activity augments the production and concentration of PM2.5, primarily due to increased vehicular emissions, industrial outputs, and energy consumption [36]. This dense population makes industries both vulnerable and potentially resilient. On the one hand, elevated PM2.5 levels, apart from detrimental health outcomes [33], can deter outdoor activities and influence consumer purchasing behaviors, adversely affecting businesses reliant on physical consumer presence [57]. Conversely, specific sectors, especially those capitalizing on e-commerce or indoor experiences, may grow as urban populations seek alternatives to outdoor activities or purchases. Hence, urbanization’s interaction with PM2.5 adds complexity to how industries navigate and are influenced by environmental challenges.
From a strategic standpoint, urbanization often leads to heightened awareness and stricter enforcement of environmental regulations [58]. This can drive corporations to adopt environmentally friendly practices, which yield positive reputational and financial rewards [56]. However, the moderating role of urbanization is complex and contingent on numerous factors such as the pace and quality of urban development, local governance, and sector-specific dynamics [22]. Thus, a nuanced and context-specific understanding of urbanization as a moderator is crucial for corporate strategizing and policymaking. Another study by [19] revealed that urbanization could enhance the positive effect of green innovation on corporate financial performance. The study found that firms in urban areas were better positioned to capitalize on the benefits of green innovation due to greater access to resources and more stringent environmental regulations, which often incite greener practices.
Given the shortcomings in the existing literature, the present study is both timely and necessary. First, considering the geographical limitations in the current body of research [14,20,51,59], this study contributes to the literature by examining the phenomena in various geographical contexts. Exploring diverse environments will provide a more comprehensive understanding of the relationship between environmental factors, urbanization, and corporate financial performance [45]. Second, the current study will address the shortage of research on sector-specific effects. The impact of environmental factors and urbanization could significantly differ across industries such as retail, e-commerce, and automotive sectors [60]. Our research will contribute valuable insights into these varying effects. Finally, this study contributes to the literature by employing a longitudinal design to understand the evolving impacts of environmental factors and urbanization on corporate financial performance. This will enable the capture of dynamic effects, a significant improvement over the largely cross-sectional existing studies [56]. Overall, the proposed study holds considerable potential to fill existing research gaps and provide a more nuanced understanding of the complex interplay between environmental factors, urbanization, and corporate financial performance.

1.2. Research Questions

The research questions of this paper are as follows:
  • How do urbanization and environmental factors affect the financial performance of the retail and automotive industries in China?
  • Are there sector-specific effects of environmental factors and urbanization on these industries?
  • How do the effects of environmental factors and urbanization on corporate financial performance evolve over time?
  • What are the implications of the study’s findings for policymakers and industry stakeholders?
The structure of the paper will follow standard academic conventions starting with the next section, Section 2, explaining the data detail and estimation strategy. The Section 3 and Section 4 sections present and interpret the findings. Finally, the Section 5 summarizes the findings and suggests implications and future research directions.

2. Data and Methodology

2.1. Theoretical Framework

2.1.1. Urbanization and Corporate Financial Performance

As urban centers expand, they often foster economic affluence and heightened consumer demand. Batten [61] argued that a growing urban population directly relates to increased total retail sales due to a surge in consumer demand in densified areas. As more individuals access technological infrastructures in urban areas, the propensity for online shopping increases [62]. This urban growth boosts e-commerce and impacts industries like automotive sales. As cities grow, the need for personal mobility solutions such as passenger cars rises, even facing challenges like congestion or enhanced public transit. Therefore, we postulate the following hypotheses regarding urban population growth and the financial performance of selected industries.
H1a. 
Urban population growth positively influences total retail sales.
H1b. 
Urban population growth positively influences online retail sales.
H1c. 
Urban population growth positively influences the sale of passenger cars.
Robust urban infrastructure, from transportation to digital connectivity, plays a pivotal role in economic activities. According to Tsai [63], well-developed infrastructure, particularly in transport, directly catalyzes total retail sales. A reliable internet infrastructure can accelerate online retail sales growth, facilitating a smoother shopping experience for consumers. For the automotive sector, good-quality roads and parking facilities can increase the attractiveness and feasibility of owning passenger cars, as observed by Banister [64]. Therefore, we postulate the following hypotheses regarding urban infrastructure and the financial performance of selected industries as follows.
H2a. 
Urban infrastructure positively influences total retail sales.
H2b. 
Urban infrastructure positively influences online retail sales.
H2c. 
Urban infrastructure positively influences the sale of passenger cars.

2.1.2. PM2.5 Air Pollution and Corporate Financial Performance

The assertion that PM2.5 air pollution might positively influence total retail sales finds a basis in the notion of “avoidance behavior”. As PM2.5 levels rise, consumers may gravitate more toward indoor shopping venues, driving up sales in these controlled environments. A study by Zhang [65] documented a surge in mall footfalls during periods of higher air pollution in major Asian cities. Elevated PM2.5 levels can also drive consumers toward online retail as a protective strategy against exposure. As urban inhabitants become more environmentally conscious and technologically connected, they may prefer e-commerce platforms over traditional shopping to reduce outdoor exposure during high-pollution days. This behavior was highlighted by [33] who found an uptick in online sales in Chinese cities during smoggy days. As for the positive influence on passenger car sales, the reasoning is more indirect. Increased PM2.5 levels can raise concerns about public health, leading city dwellers to prefer personal vehicles over public transportation to minimize outdoor exposure. Moreover, newer car models with advanced filtration systems might attract buyers seeking refuge from outdoor pollutants while commuting, as suggested by Wang [66]. Hence, the subsequent hypotheses are formulated as follows.
H3a. 
PM2.5 air pollution positively influences total retail sales.
H3b. 
PM2.5 air pollution positively influences online retail sales.
H3c. 
PM2.5 air pollution positively influences the sale of passenger cars.
With growing urban populations, there is a heightened concentration of consumers in a limited geographic area. In this context, PM2.5 air pollution, when combined with this dense populace, may drive individuals to seek indoor recreational activities, including shopping, leading to increased retail sales. This aligns with the findings from Liu [67], who noticed a positive correlation between air pollution episodes and increased footfall in enclosed shopping venues across major South Asian cities. As urban areas become more populated, they also witness increased internet penetration and digital literacy. Hence, during high-PM2.5 events, urban dwellers might opt for online shopping as a safer alternative to physical stores to mitigate health risks. Research by Kraus [68] underscores this behavior, noting a spike in e-commerce transactions during days with poorer air quality in urbanized sectors of East Asia. The relationship between urban population, PM2.5 pollution, and car sales is multifaceted. A larger urban population might amplify the effects of air pollution, making public transportation or walking less appealing due to air quality concerns. Consequently, consumers might purchase personal vehicles for safer, filtered air during commutes. A study by Beyhum [69] highlighted that adverse air quality events correlated with increased sales of cars equipped with advanced air filtration systems in densely populated urban centers.
H4a. 
Urban population positively moderates the influence of PM2.5 air pollution on total retail sales.
H4b. 
Urban population positively moderates the influence of PM2.5 air pollution on online retail sales.
H4c. 
Urban population positively moderates the influence of PM2.5 air pollution on the sale of passenger cars.

2.2. Model Construction

Firstly, the study is framed by the premise that urbanization, as evidenced by urban population growth, plays a critical role in shaping the financial performance of corporations. Due to the high density of people and industries, metropolitan areas create a unique environment that can potentially affect the business performance of companies in or influenced by these areas. The following statistical model is used to test the influence of urban population growth on corporate financial performance.
C F P i t = α + β 1 U P G i t + β 2 P D i t + β 3 U P i t + β 4 U L A i t + β 5 P L S i t + λ t + η i + ε i t
where CFP is the corporate financial performance and UPG is the urban population growth. The other variables, i.e., population density (PU), urban population (UP), metropolitan living area (ULA), and the people living in slums (PLS), are the control variables of the study. i indicates the regions of China ranging from 1 to 30. t shows the time in years ranging from 1 to 23, representing the years 2000 to 2022. The error term contains three components representing the year effect error, λ t , industry effect error, η i , and journal error term, ε i t   , of the regression equation.
We also measure another aspect of urbanization called “urban infrastructure”, and derive the following statistical model.
C F P i t = α + β 1 U I S i t + β 2 P D i t + β 3 U P i t + β 4 U L A i t + β 5 P L S i t + λ t + η i + ε i t
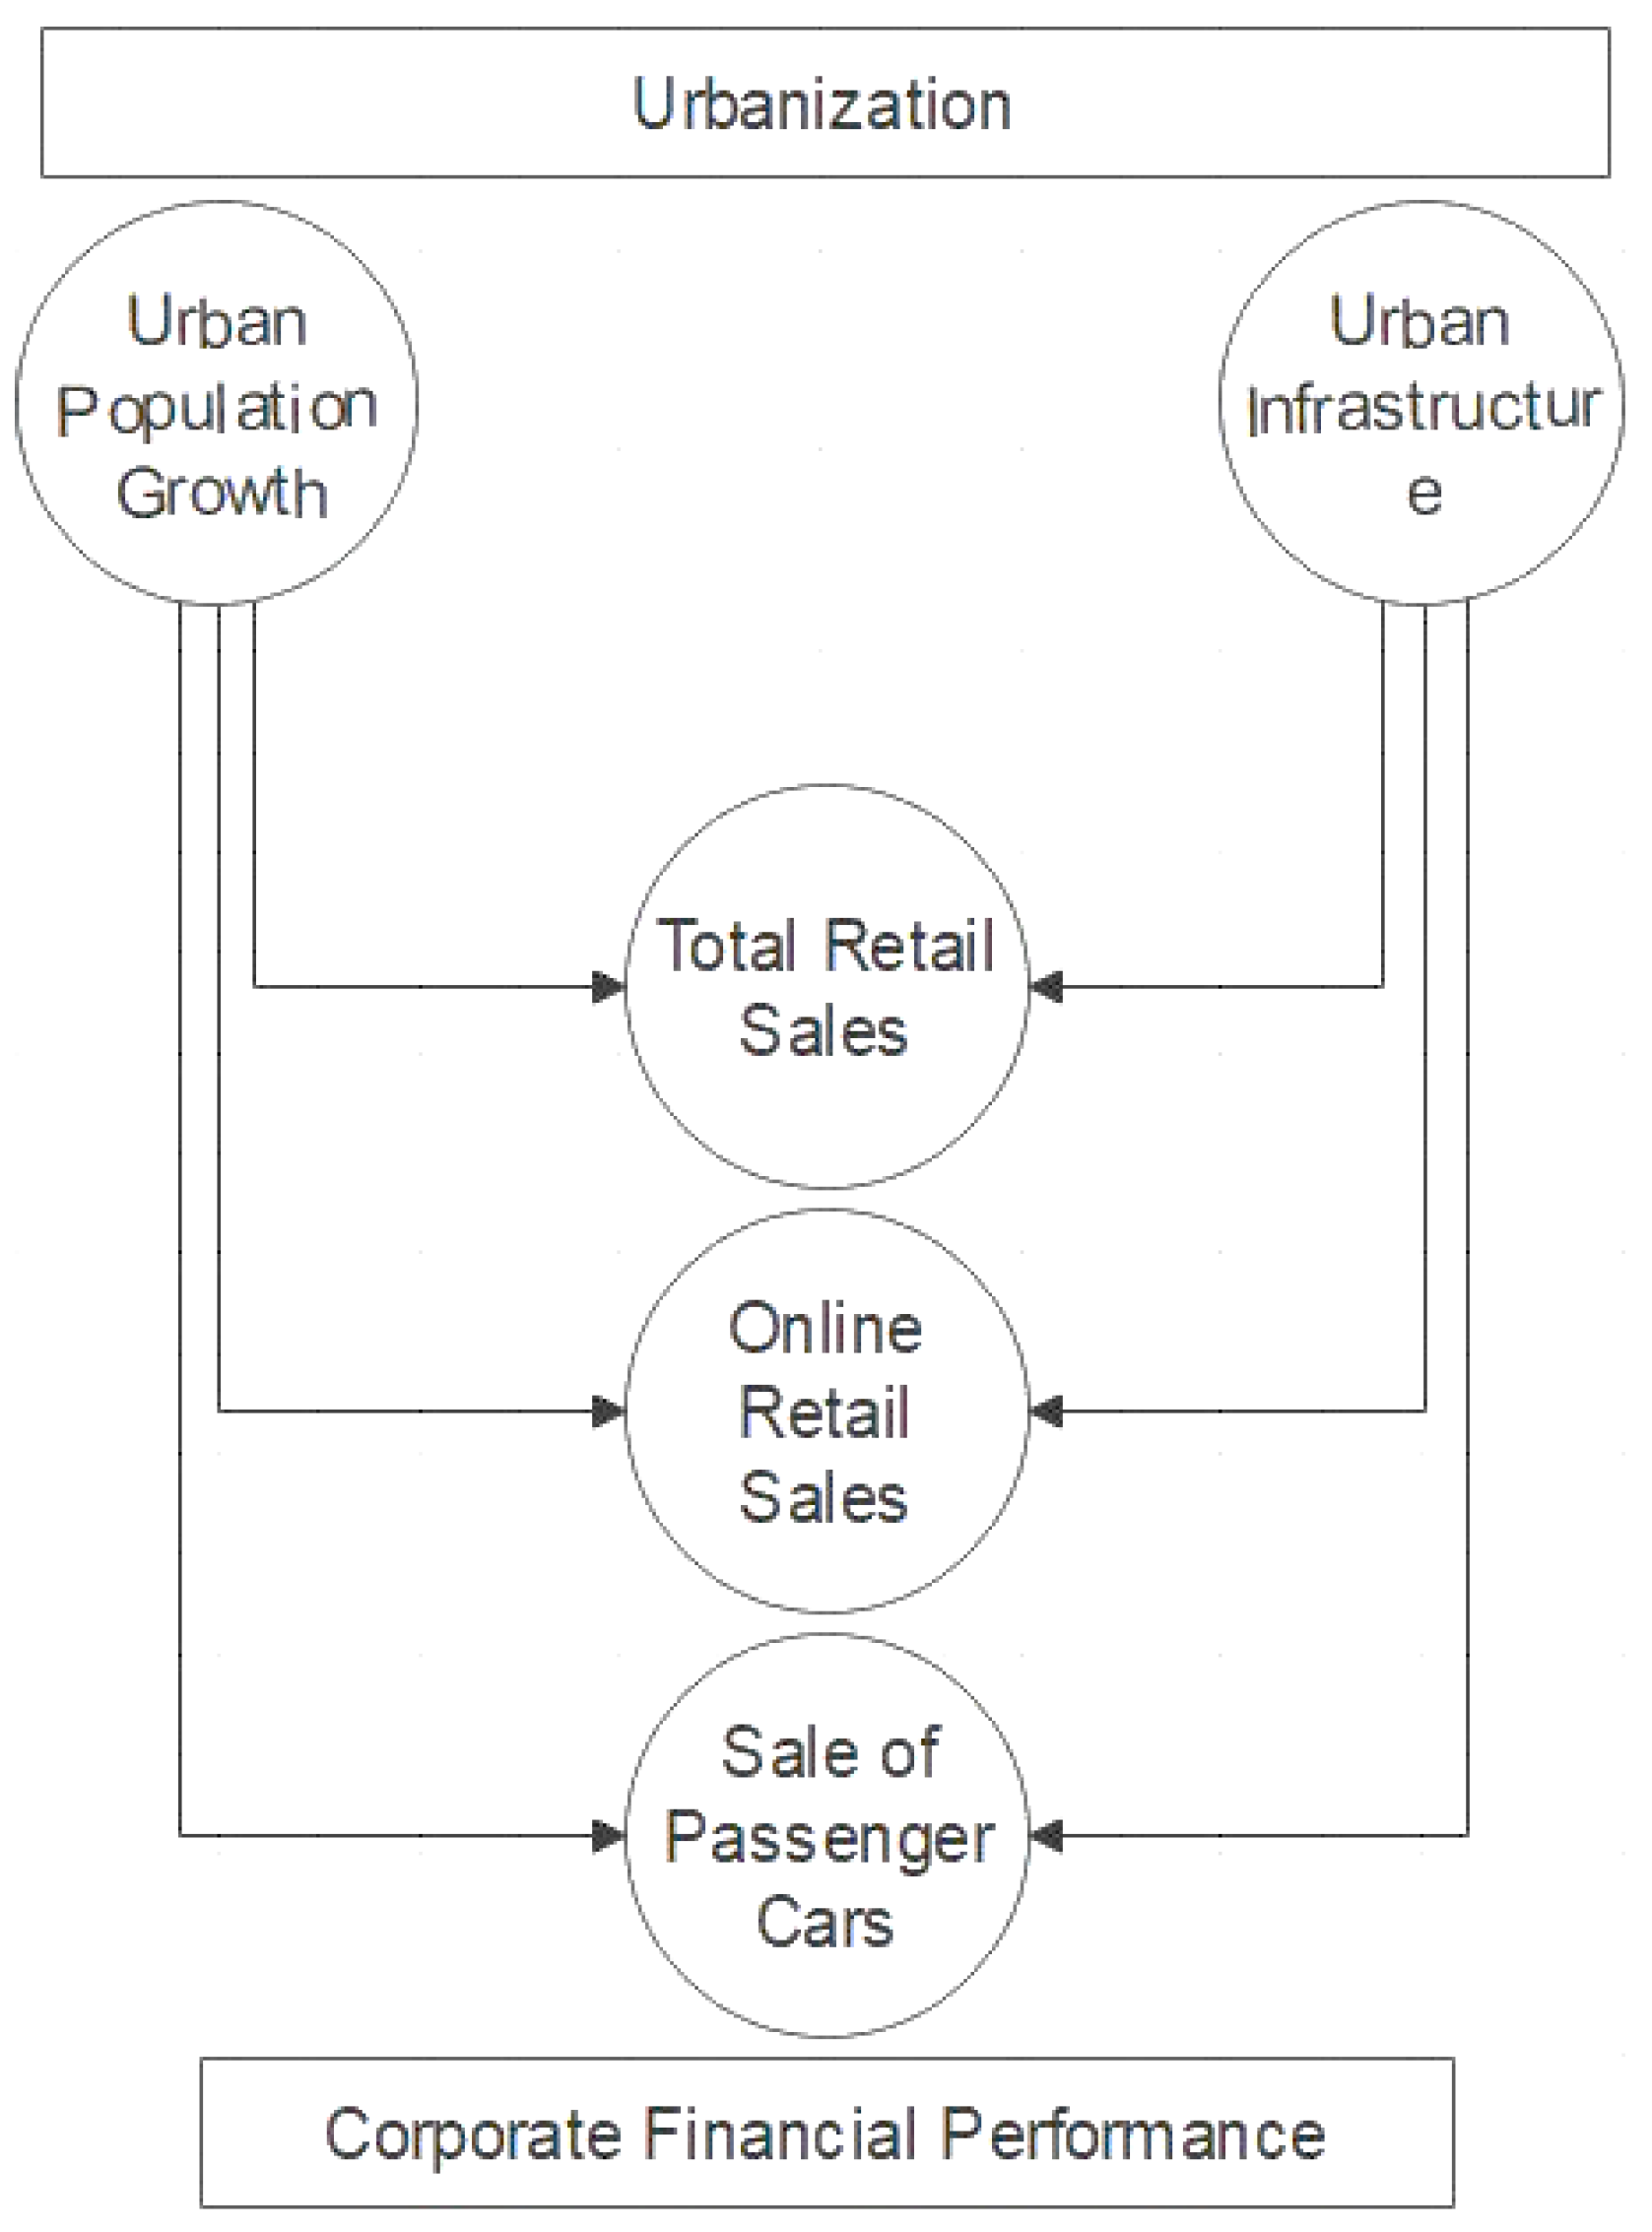
The graphical form of the model, showing the influence of urbanization on the financial performance of the retail and automotive industry, is presented in Figure 2.
Secondly, environmental factors, specifically PM2.5 air pollution, are integral to this framework. PM2.5 air pollution represents the ecological footprint of urbanization. This factor is expected to impact the financial performance of corporations directly. The study uses the following statistical model to assess the influence of environmental factors on corporate financial performance.
C F P i t = α + β 1 P M 2.5 i t + β 2 P D i t + β 3 U P i t + β 4 U L A i t + β 5 P L S i t + λ t + η i + ε i t
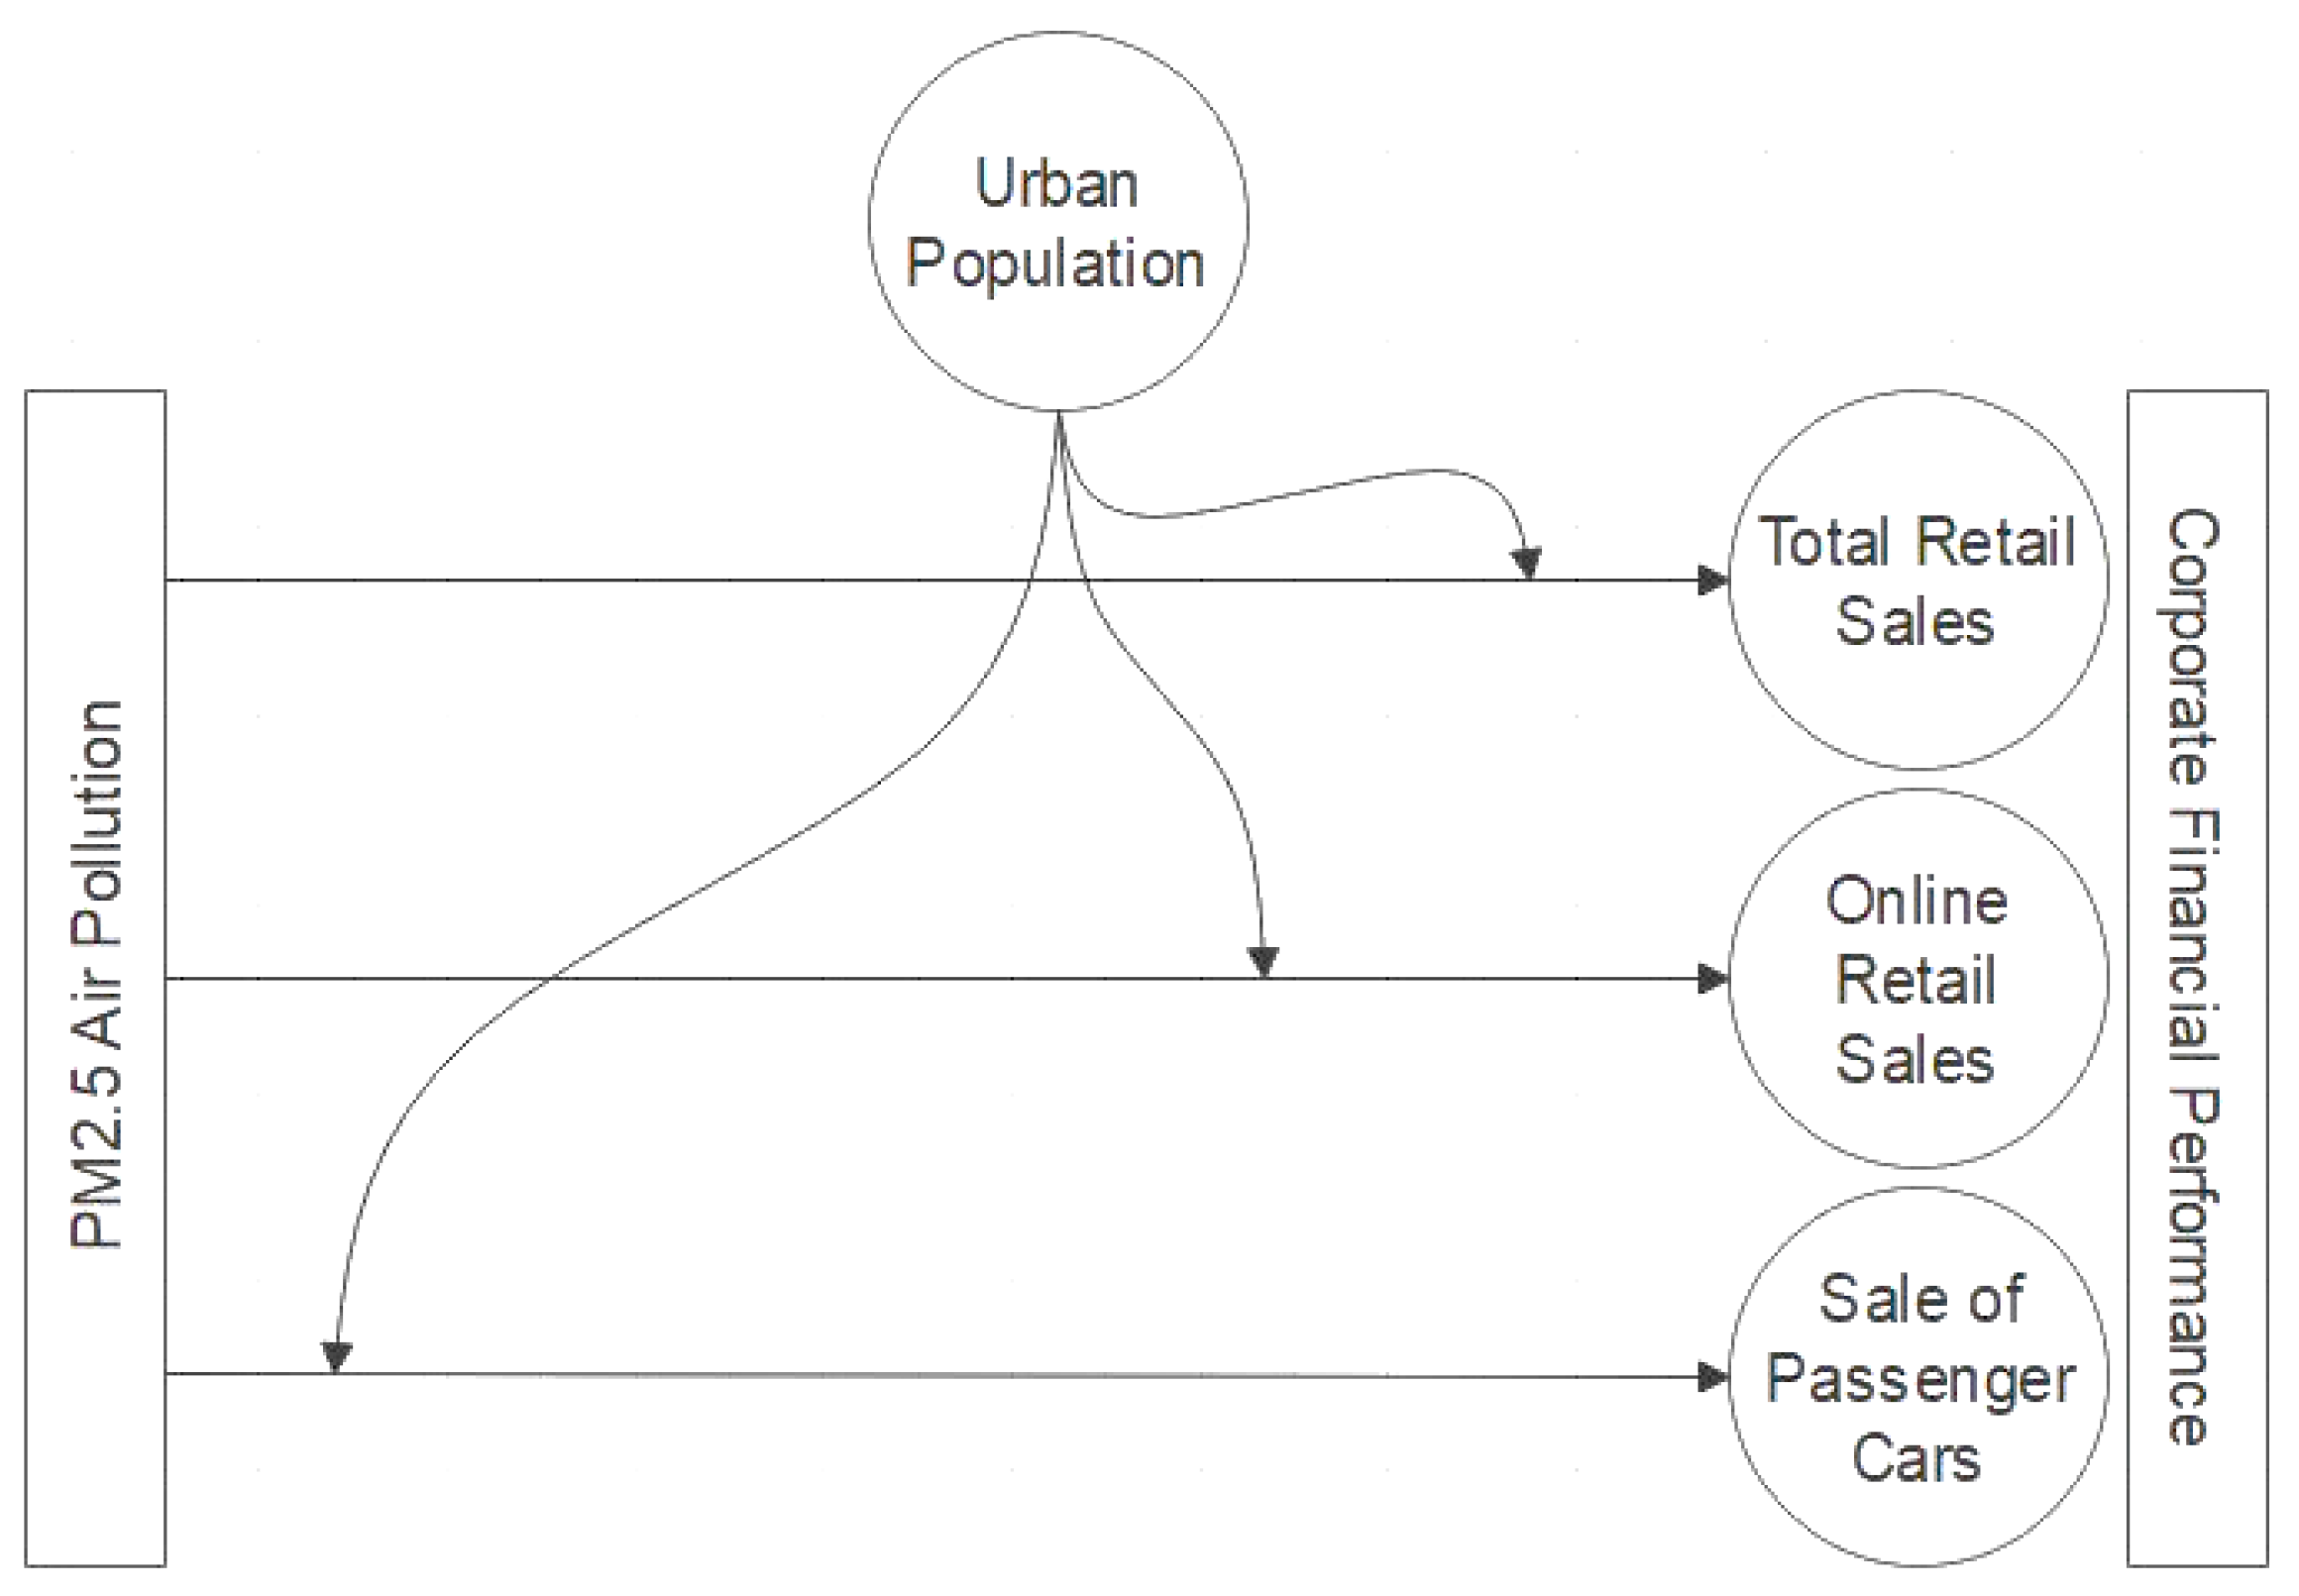
The graphical presentation for this model is given in Figure 3.
Moreover, urbanization (via urban population growth) is proposed to moderate the relationship between environmental factors and corporate financial performance. This suggests that the effect of ecological factors on corporate financial performance could vary depending on the level of urban population. This study uses the following statistical models to incorporate the moderating role of urbanization in the relationship between environmental factors and corporate financial performance.
C F P i t = α + β 1 P M 2.5 i t + β 2 P D i t + β 3 U P i t + β 4 U L A i t + β 5 P L S i t + β 6 ( P M 2.5 i t * U P ) + λ t + η i + ε i t
The graphical presentation of the above model is given in Figure 4.
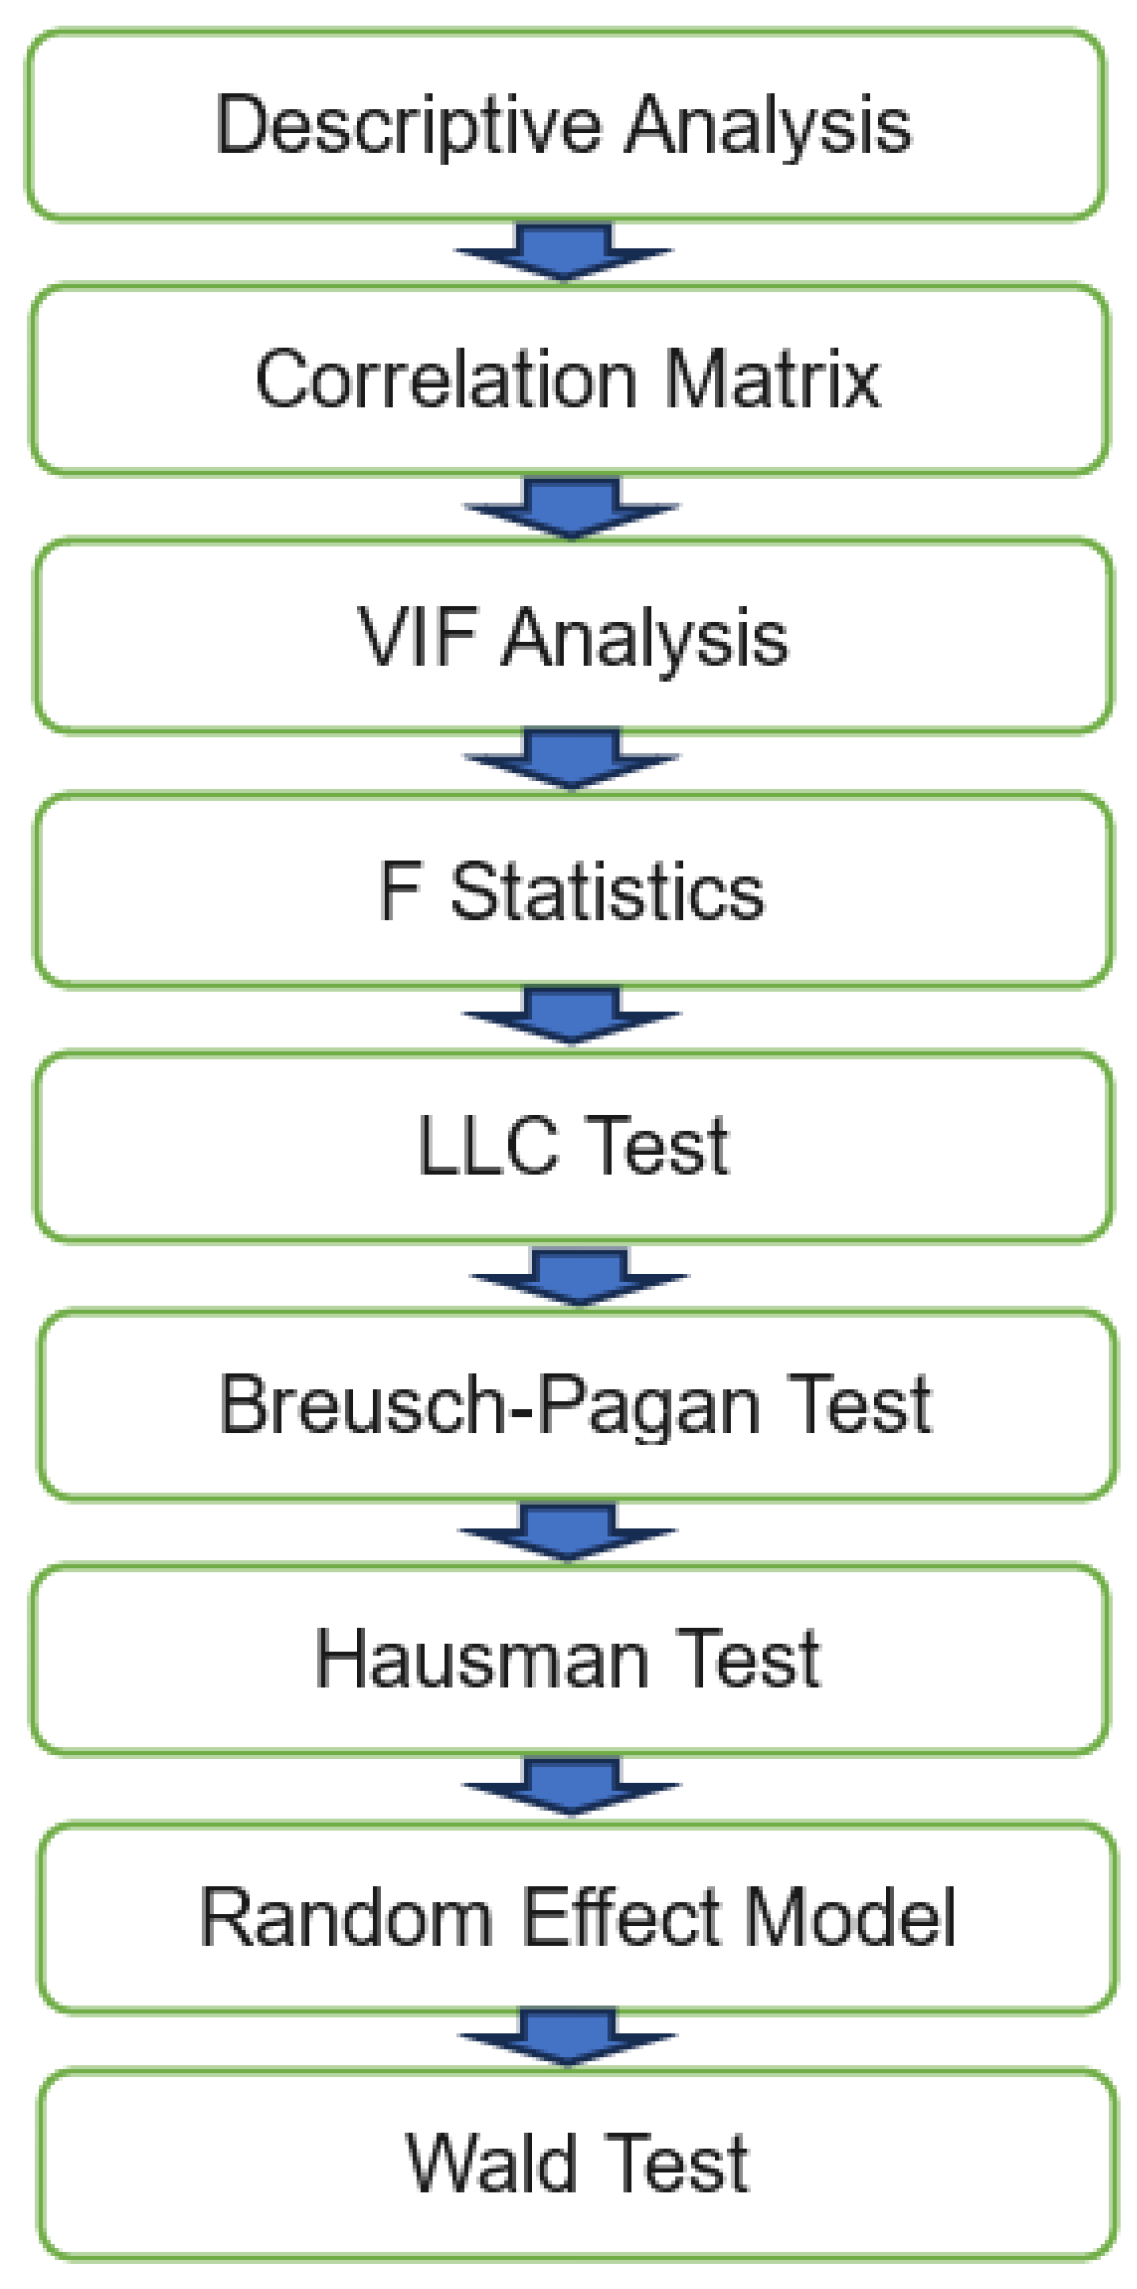
The summary of the estimation strategy is given in the following flow chart shown in Figure 5.

2.3. Data Collection

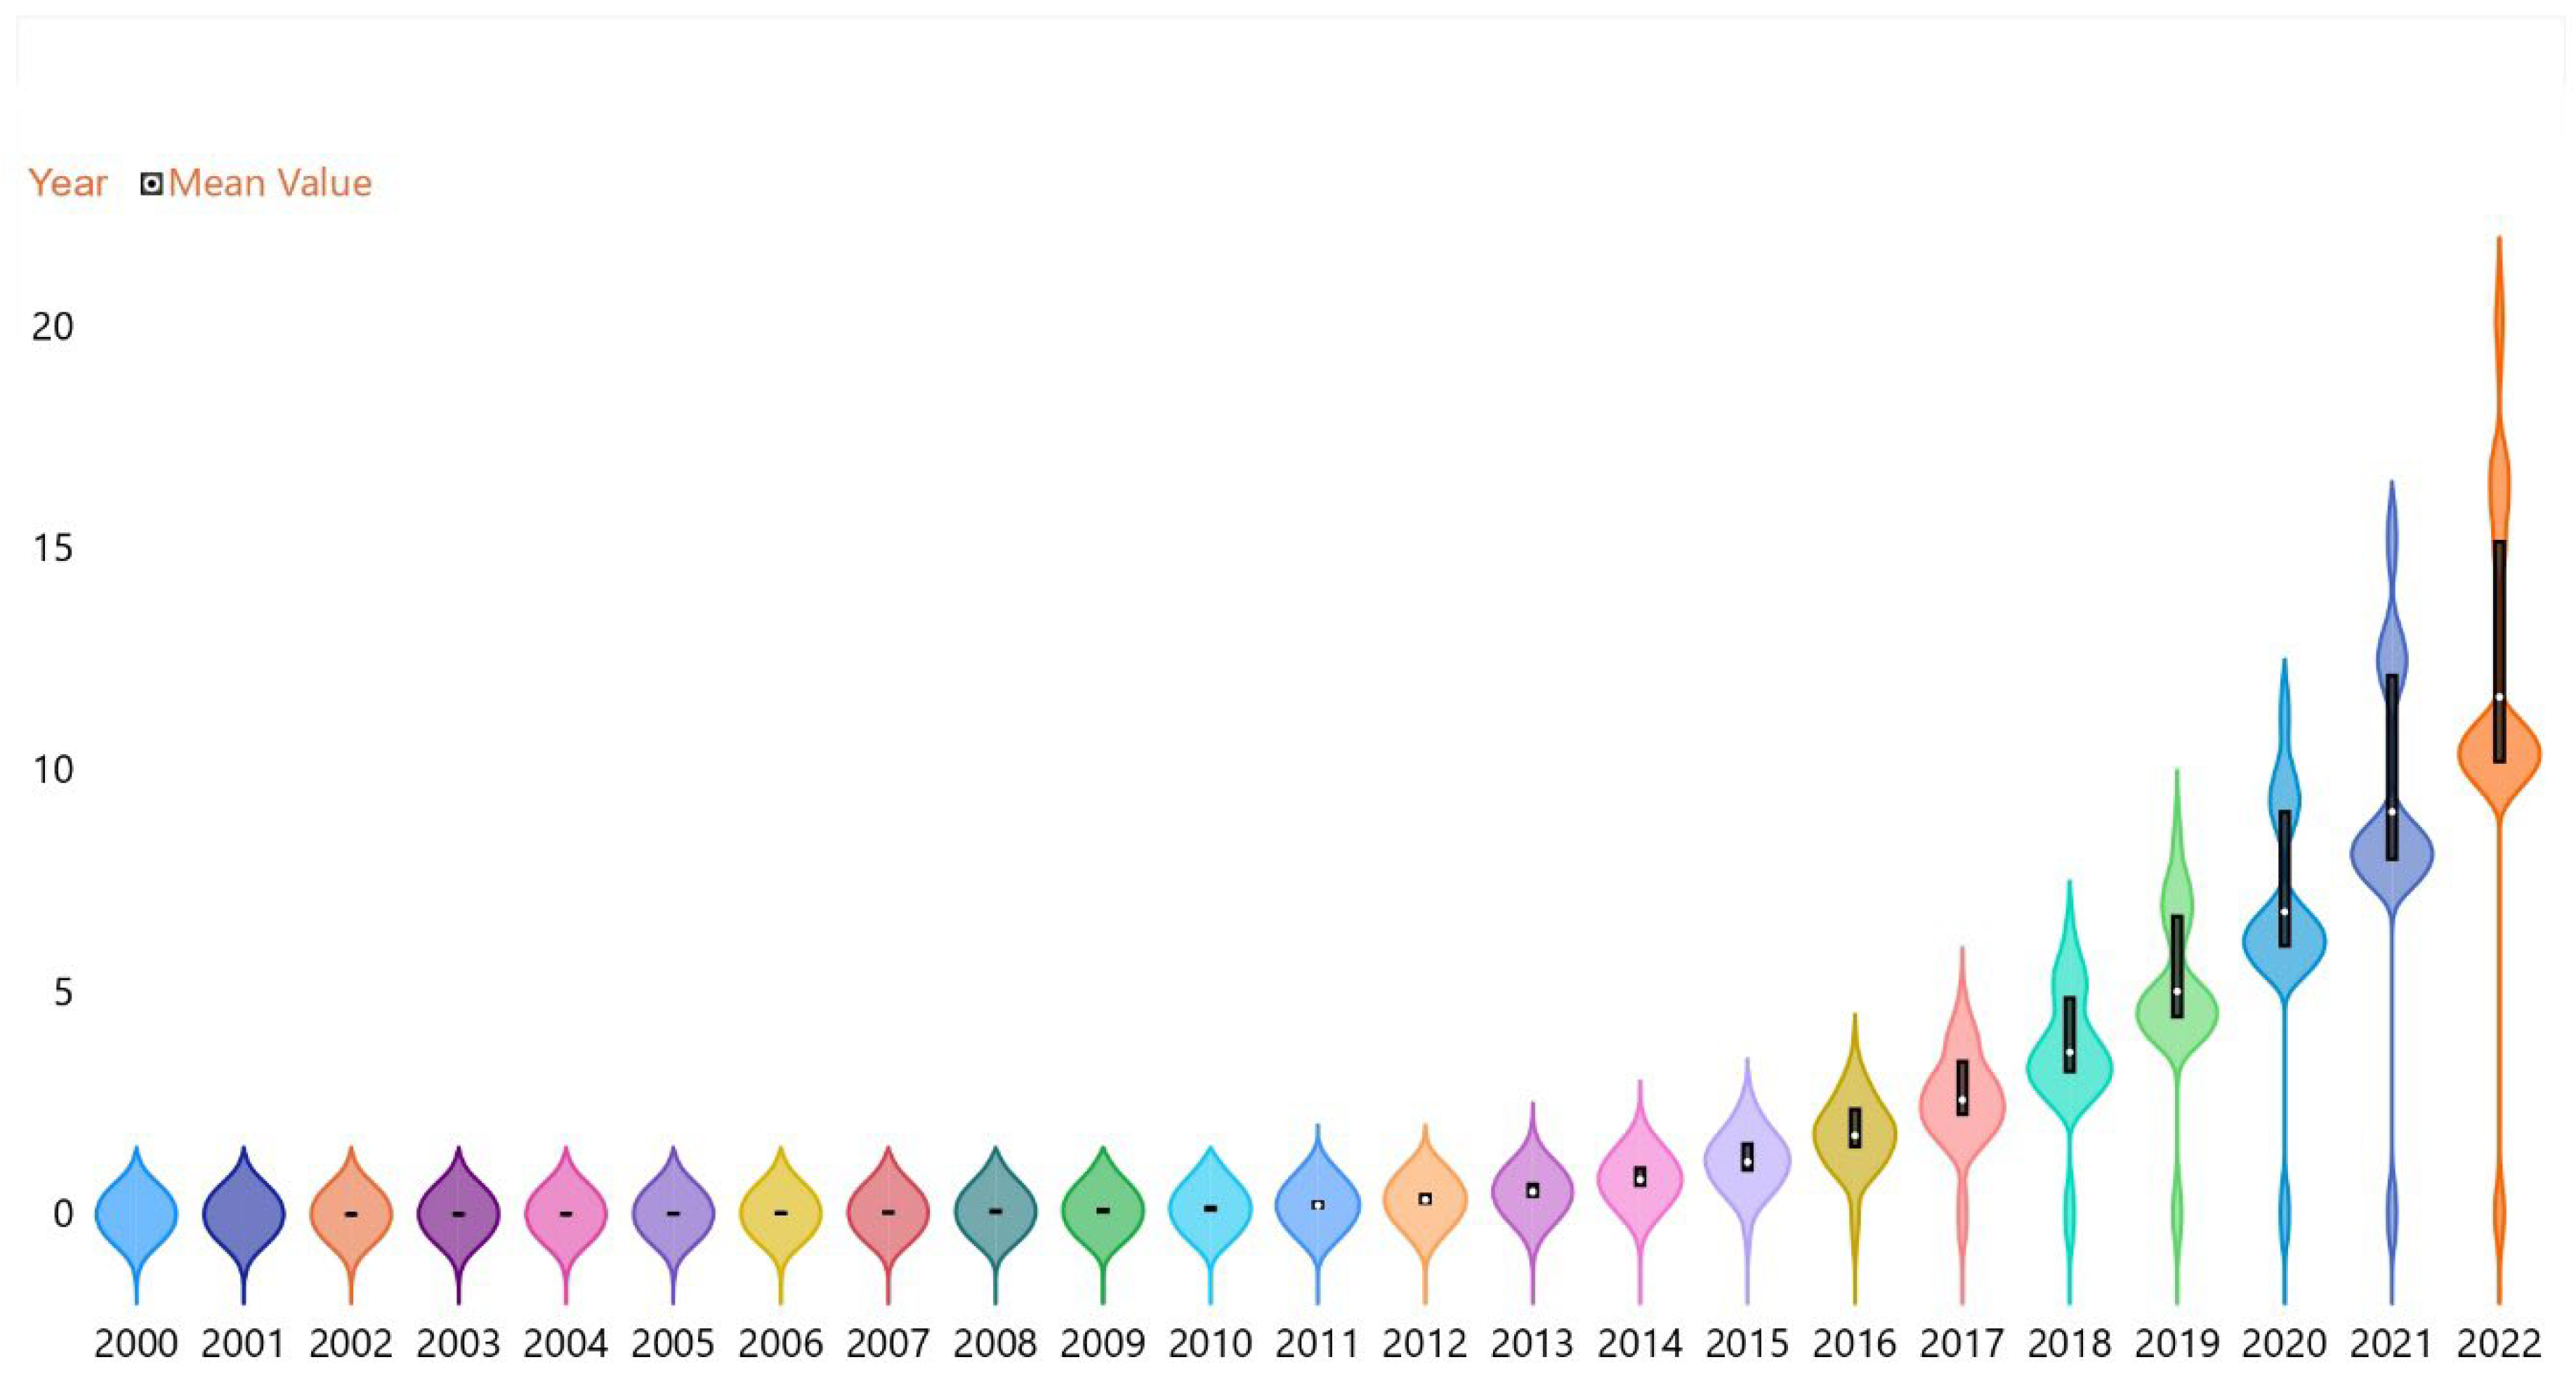
Data for this study are compiled from multiple sources to ensure a comprehensive dataset that captures urbanization, environmental factors, and corporate financial performance. The seeds are primarily and secondary, and are selected for their credibility and the relevance of the data they provide. The detail of online retail sales from 2000 to 2022 is shown in Figure 6. This study chooses China as the study area due to its marked urban population and infrastructure changes during the study period, which significantly impacted consumer behavior and environmental conditions. Additionally, China’s digital revolution during these years, resulting in over 989 million internet users by 2020, has fundamentally transformed its retail landscape. The nation has the world’s largest e-commerce market, providing a rich context for studying online retail sales dynamics. This study also used regional data to appreciate the heterogeneity of China’s national economy and understand the local factors shaping urban growth, pollution, infrastructure, and retail sales. Therefore, the choice of China, the timeframe, and regional data considerably enhance the study’s relevance and robustness.
Data for the independent variables (urban population growth, PM2.5 air pollution, and urban infrastructure) are obtained from the World Bank’s World Development Indicators (World Bank, 2020), a reliable global development data source widely used in similar studies. Information related to corporate financial performance is derived from financial databases such as Bloomberg, FactSet, and Compustat, following the practice of [40]. These databases provide comprehensive financial information about corporations across various sectors. Data for control variables such as population density, urban population, urban land area, and the population living in slums are obtained from the World Bank’s World Development Indicators (World Bank, 2020). By integrating these data sources, we aim to create a rich panel dataset that covers a broad range of corporations across different urban areas and spans several years, providing a solid basis for the proposed econometric analyses.
The Table 1 summarizes the data collection detail.

3. Results

3.1. Preliminary Statistics

3.1.1. Descriptive Statistics

Table 2 showcases statistics for nine variables across 690 observations, primarily focused on China’s urbanization, environmental elements, and market conditions. The average total retail sales of consumer goods are 1.851 billion Yuans, displaying wide dispersion. Similarly, online retail sales average 1.913 billion Yuans, revealing significant regional differences. Passenger car sales and urban population size also show substantial variability, with respective averages of 3.983 (in 000s) and 28.714 million. The year-wise and region-wise sale of passenger cars is presented in Figure 7. The urban population growth rate and density show more minor variations. PM2.5 air pollution is high, averaging 165.333 μg/m3. Nearly all of the urban population (99.957%) has urban infrastructure. The metropolitan land area averages 4.059 square Km with slight variation, while living conditions in slums vary significantly, with an average of 10.291 thousand inhabitants. The detailed results are presented in Table 2.

3.1.2. Correlation Matrix

Table 3 provides a correlation matrix of the variables in the study. Strong positive correlations are observed between “Total Retail Sales of Consumer Goods” and both “Sales of Passenger Cars” (0.776) and “Population Density in Urban Areas” (0.720), indicating concurrent increases. “Online Retail Sales by Region” correlates positively with “PM2.5 Air Pollution” (0.6473), suggesting that regions with higher online sales have more pollution. “Urban Population Growth” and “Urban Population” are negatively correlated (−0.525), implying that larger cities grow less quickly. “PM2.5 Air Pollution” negatively correlates with “Population Living in Slums” (−0.220), while “Urban Infrastructure” has a little optimistic correlation with “Total Retail Sales of Consumer Goods” (0.341). Correlation does not mean causation, so further analysis is required.

3.2. Urbanization and Corporate Financial Performance

3.2.1. Influence of Urban Population Growth on Total Retail Sales of Consumer Goods

The random effect model results indicate that all variables significantly impact online retail sales of consumer goods. This suggests that these variables correspond to changes in online retail sales. The positive coefficients mean that an increase in these variables is associated with increased online retail sales, all other things being equal. The model’s R-squared value of 0.563 suggests that these variables can explain approximately 56.3% of the variation in online retail sales.
The positive association between urban population growth and online retail sales can be explained by the fact that as more people inhabit urban areas, there is an increase in demand for goods, some of which is met through online purchases due to the convenience and variety they offer. These findings are consistent with the results of Zhou [70]. Similarly, urban population and population density contribute to a larger potential market for online retailers. Interestingly, the positive coefficient for the population living in slums might indicate an increasing trend of online shopping even among lower-income groups due to its convenience and potentially lower prices. Urban land area’s positive effect could be attributed to the possibility that in larger urban areas, access to physical retail may be challenging, leading consumers to opt for online retail [71]. The detailed results are presented in Table 4.

3.2.2. Influence of Urban Population Growth on the Online Retail Sales of Consumer Goods

The random effect model results demonstrate that the coefficient for urban population growth varies based on whether the time effects, region effects, or both are accounted for. In the model without any impact and with time effect only, the coefficient for urban population growth is not statistically significant. However, when considering the regional implications, urban population growth becomes significant and negatively associated with online retail sales of consumer goods.
The negative correlation in the region effect model suggests that online retail sales may decrease as urban population growth increases. This could be due to infrastructural strain or overpopulation leading to decreased economic productivity. However, when both time and regional effects are considered, the urban population growth variable is again insignificant. This might be attributed to temporal trends or broad economic shifts that could diminish the influence of urban population growth on online retail sales. In essence, these findings suggest that the relationship between urban population growth and online retail sales of consumer goods in China is complex and might depend on local variables and temporal factors. The detailed results are presented in Table 5.

3.2.3. Influence of Urban Population Growth on the Sales of Passenger Cars

In the random effect model, there is a statistically significant negative association between the urban population growth and the sales of passenger cars. This finding indicates that as the rate of urban population growth rises, car sales in China tend to decline, with this correlation being significant at the 1% level.
A potential reason for these findings might stem from China’s urban growth trends and evolving policies. As the urban populace surges, China’s authorities have rolled out urban development strategies emphasizing public transit, aiming to curtail the reliance on private vehicles to mitigate traffic jams and combat air pollution [60]. Furthermore, advancements in urban infrastructure, the emergence of car-sharing platforms, and the introduction of license plate lotteries in key metropolises such as Beijing and Shanghai may deter private vehicle acquisitions, even amidst the swelling urban dwellers. Therefore, these factors might explain the negative correlation observed between urban population growth and passenger car sales in China. These results are consistent with Kolster [72], who discusses the implications of this result for vehicle taxation, car ownership growth in developing countries, and new transport technologies such as automated vehicles. The detailed results are presented in Table 6.
A graphical presentation of the above results is presented in Figure 8.

3.2.4. Influence of Urban Infrastructure on Total Retail Sales of Consumer Goods

The random effects model shows a positive but non-significant relationship (at the conventional levels of significance) between urban infrastructure and the retail sales of consumer goods in China, with a coefficient of 0.006.
Urban infrastructure has been widely recognized as a critical factor affecting retail business performance. According to [73], better infrastructure (including transportation and utilities) provides the necessary conditions for economic activities and is thus expected to contribute to retail sales. However, the observed non-significance suggests that urban infrastructure might not have a statistically significant direct impact on retail sales in China. A possible explanation might be the rapid rise in e-commerce in China, which somewhat weakens the importance of physical infrastructure for retail sales, as consumers can now make purchases without the need for physical stores or well-established urban infrastructure. Nonetheless, the positive sign of the coefficient implies that improvements in urban infrastructure might have a positive, albeit statistically non-significant, effect on retail sales. These results are also contradictory to those of Wang [74], which reveals that urban infrastructure resilience has a significant positive impact on the total retail sales of consumer goods per capita and that there is a differential spatial spillover effect of national urban infrastructure resilience under the role of various factors such as economy, financial development, population agglomeration, and government funding. The detailed results are presented in Table 7.

3.2.5. Influence of Urban Infrastructure on Online Retail Sales

The results from the random effects model show a statistically significant negative relationship between urban infrastructure and online retail sales in China, with a coefficient of −1.279 at the 1% significance level.
This implies that as urban infrastructure improves, online retail sales decrease. One possible explanation for this could be the “substitution effect”. As urban infrastructure improves, it may facilitate traditional retail shopping, making it more convenient and efficient, which could shift consumer behavior from online shopping toward physical stores [75].
Another possible explanation is related to the “digital divide”. As urban areas in China become more developed, with improved infrastructure, people might have more offline opportunities, such as entertainment and leisure activities, which could reduce their time spent online shopping [73]. However, this relationship is counterintuitive, as improved urban infrastructure typically includes better internet infrastructure, which should boost online sales. Further research may be needed to understand this complex relationship fully. The detailed results are presented in Table 8.

3.2.6. Influence of Urban Infrastructure on the Sale of Passenger Cars

The random effects model result shows a positive but statistically non-significant relationship (based on conventional levels of significance), between urban infrastructure and sales of passenger cars in China, with a coefficient of 0.014.
Urban infrastructure, encompassing a variety of factors like road networks, public transit, and utilities, can affect car sales. For instance, a well-developed road network may encourage car ownership and use [76]. However, in this case, the relationship is not statistically significant, suggesting that urban infrastructure, while positive, might not be a critical determinant of car sales in China. One potential explanation for this could be the fast-paced growth of China’s high-speed rail network and public transit system over the past two decades [77], which offers a viable alternative to car ownership. The rise in ride-sharing services could also have contributed. Despite this, the positive coefficient does suggest a potential positive influence of infrastructure development on car sales. The detailed results are presented in Table 9.
A graphical presentation of the above results is presented in Figure 9.

3.3. Environment and Corporate Financial Performance

3.3.1. Influence of PM2.5 Pollution on the Total Retail Sales of Consumer Goods

The outcomes from the random effect model highlight a statistically significant inverse association between PM2.5 pollution and the retail sales of consumer goods in China, evident at the 10% significance threshold. This implies that with rising PM2.5 pollution levels, there is a tendency for retail sales of consumer goods to diminish.
A plausible rationale for these findings might be tied to how pollution affects consumer habits and health. Elevated PM2.5 pollution levels can discourage outdoor pursuits, like shopping, due to health-related apprehensions. Additionally, the detrimental health consequences of air pollution can deplete consumers’ discretionary income because of rising healthcare costs, potentially curtailing consumer expenditure [57]. On the other hand, high pollution levels may also stimulate the purchases of certain goods, such as air purifiers or face masks, so it would be beneficial to consider the type of consumer goods under analysis. This outcome underscores the complex relationship between environmental conditions and economic activities in China. The detailed results are presented in Table 10.

3.3.2. Influence of PM2.5 Pollution on Online Retail Sales

The results from the random effects model suggest a significant positive relationship between PM2.5 pollution and online retail sales in China, as shown by a coefficient of 1.379 and significance at the 1% level. This indicates that increased PM2.5 pollution levels are associated with increased online retail sales.
One possible reason for these results might be the potential impact of air pollution on consumers’ shopping habits. Higher pollution levels can discourage people from going to physical stores, causing them to switch to online shopping as a safer, more convenient alternative. Moreover, in situations of higher air pollution, consumers may buy specific products online that can mitigate pollution effects, like air purifiers, indoor plants, or masks, contributing to higher online sales. Further research may investigate the categories of products contributing to these increased sales to corroborate these interpretations. However, these findings illustrate how environmental factors such as air pollution can significantly impact consumer behavior and the digital economy in China. The detailed results are presented in Table 11.

3.3.3. Influence of PM2.5 Pollution on the Sale of Passenger Cars

The random effects model results illustrate a significant negative relationship between PM2.5 pollution and the sale of passenger cars in China, with a coefficient of −0.068, significant at the 1% level. This implies that an increase in PM2.5 pollution levels is associated with a decrease in the sale of passenger cars.
The observed relationship could reflect people’s growing environmental awareness in China. Air pollution is a public health concern in many Chinese cities, and citizens are becoming increasingly conscious of the environmental impact of their consumption choices. As a result, consumers may be discouraged from purchasing cars due to their contribution to air pollution. Furthermore, government regulations may also play a role. China has implemented several policies to reduce car usage and emissions, such as car purchase restrictions and the promotion of electric vehicles, in response to high levels of air pollution [78]. The exact factors influencing this trend would require further investigation. However, the results underline the potential influence of environmental pollution on consumer behavior and market dynamics. The detailed results are presented in Table 12.
A graphical presentation of the above results is given in Figure 10.

3.4. Urban Population Moderation in the Environment and Corporate Financial Performance Nexus

3.4.1. Urban Population Moderation in the Influence of PM2.5 on the Total Retail Sales of Consumer Goods

The results reveal that PM2.5 pollution negatively affects the retail sales of consumer goods in China, implying that increased pollution levels can decrease retail sales. The coefficient of −0.022, significant at the 10% level, suggests that a one-unit increase in PM2.5 pollution can reduce retail sales by approximately 2.2%.
Moreover, the urban population has a moderating role, indicated by the positive and significant coefficient of 0.001. This suggests that the negative effect of PM2.5 pollution on retail sales is slightly diminished in areas with larger urban populations, perhaps due to more robust retail markets or pollution mitigation strategies. The possible reasons for this include pollution deterring consumers from outdoor shopping, thereby reducing retail sales. However, in more populous urban areas, the prevalence of more diverse and robust retail sectors, or better urban planning and pollution mitigation strategies, may counteract this effect [79]. The detailed results are presented in Table 13.

3.4.2. Urban Population Moderation in the Influence of PM2.5 on Online Retail Sales

The model’s results indicate a strong positive correlation between PM2.5 pollution levels and online retail sales (coefficient = 1.293, p < 0.01). This implies that an increase in pollution levels correlates with a surge in online retail sales. One reason could be that severe pollution prompts consumers to stay indoors, thus encouraging online shopping [80].
The relationship is further influenced by the size of the urban population (coefficient = 0.001, p < 0.01). This indicates that with a rise in the urban populace, the effect of PM2.5 pollution on online retail sales becomes more pronounced. In densely populated urban regions, heightened pollution levels might encourage consumers to favor online shopping, given its ease and the benefit of minimizing outdoor exposure [81]. The detailed results are presented in Table 14.

3.4.3. Urban Population Moderation in the Influence of PM2.5 on the Sales of Passenger Cars

The findings from the model indicate a notable inverse relationship between PM2.5 pollution and the sales of passenger cars (coefficient = −0.064, p < 0.01). This implies that an increase in pollution levels is associated with a decline in passenger car sales. This trend could be attributed to the implementation of environmental regulations that limit car usage in areas with high pollution or a shift in consumer behavior toward more eco-friendly modes of transportation. Interestingly, the model also demonstrates that the urban population moderates this relationship (coefficient = 0.002, p < 0.05). This indicates that in more populated urban areas, the negative effect of pollution on car sales is somewhat lessened. It might be due to larger urban populations increasing the demand for personal vehicles, thereby counteracting the adverse impact of pollution on car sales. The detailed results are presented in Table 15.
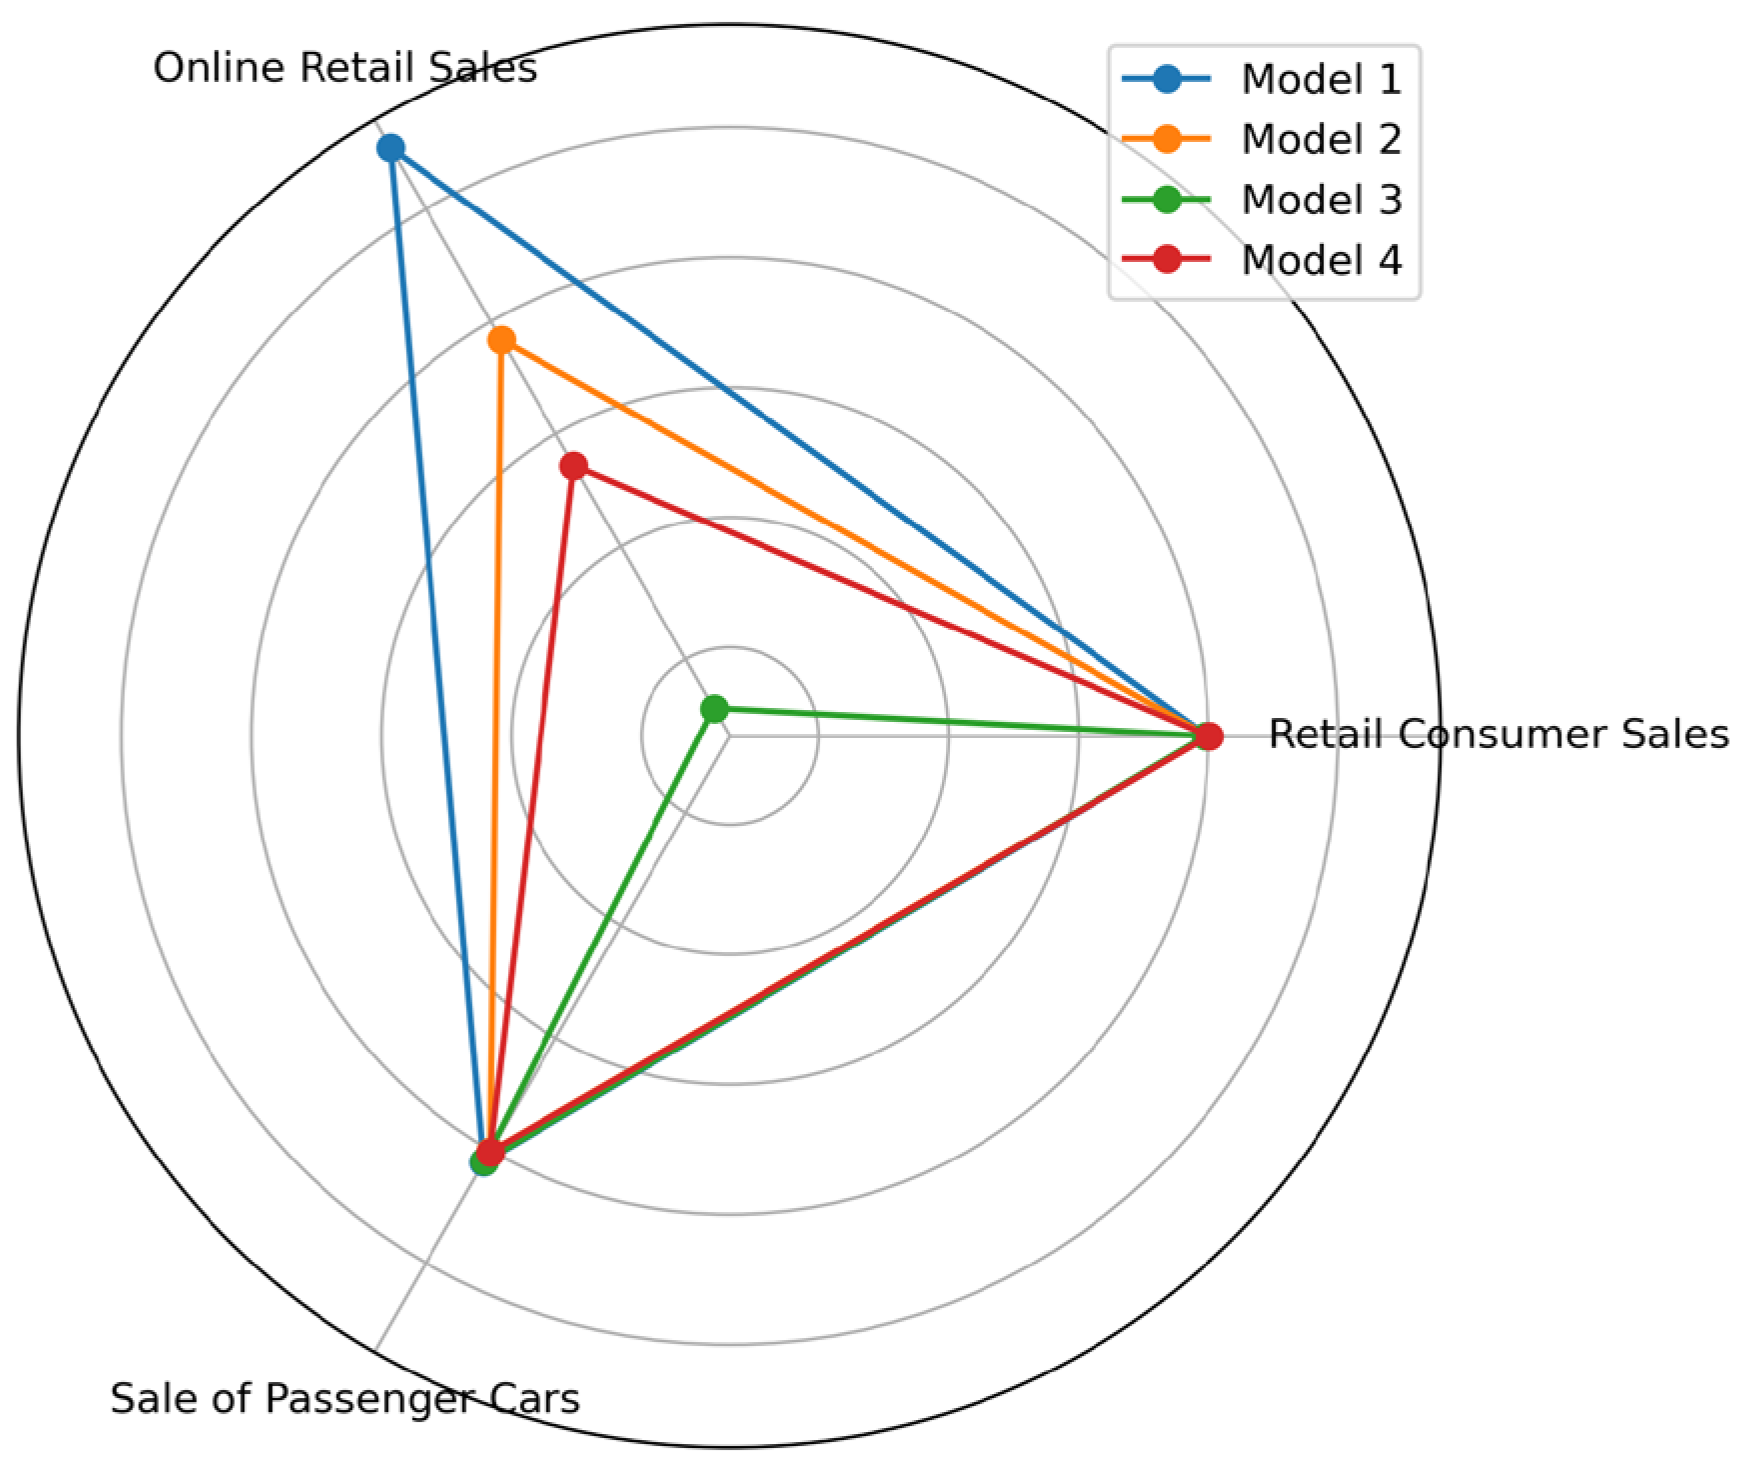
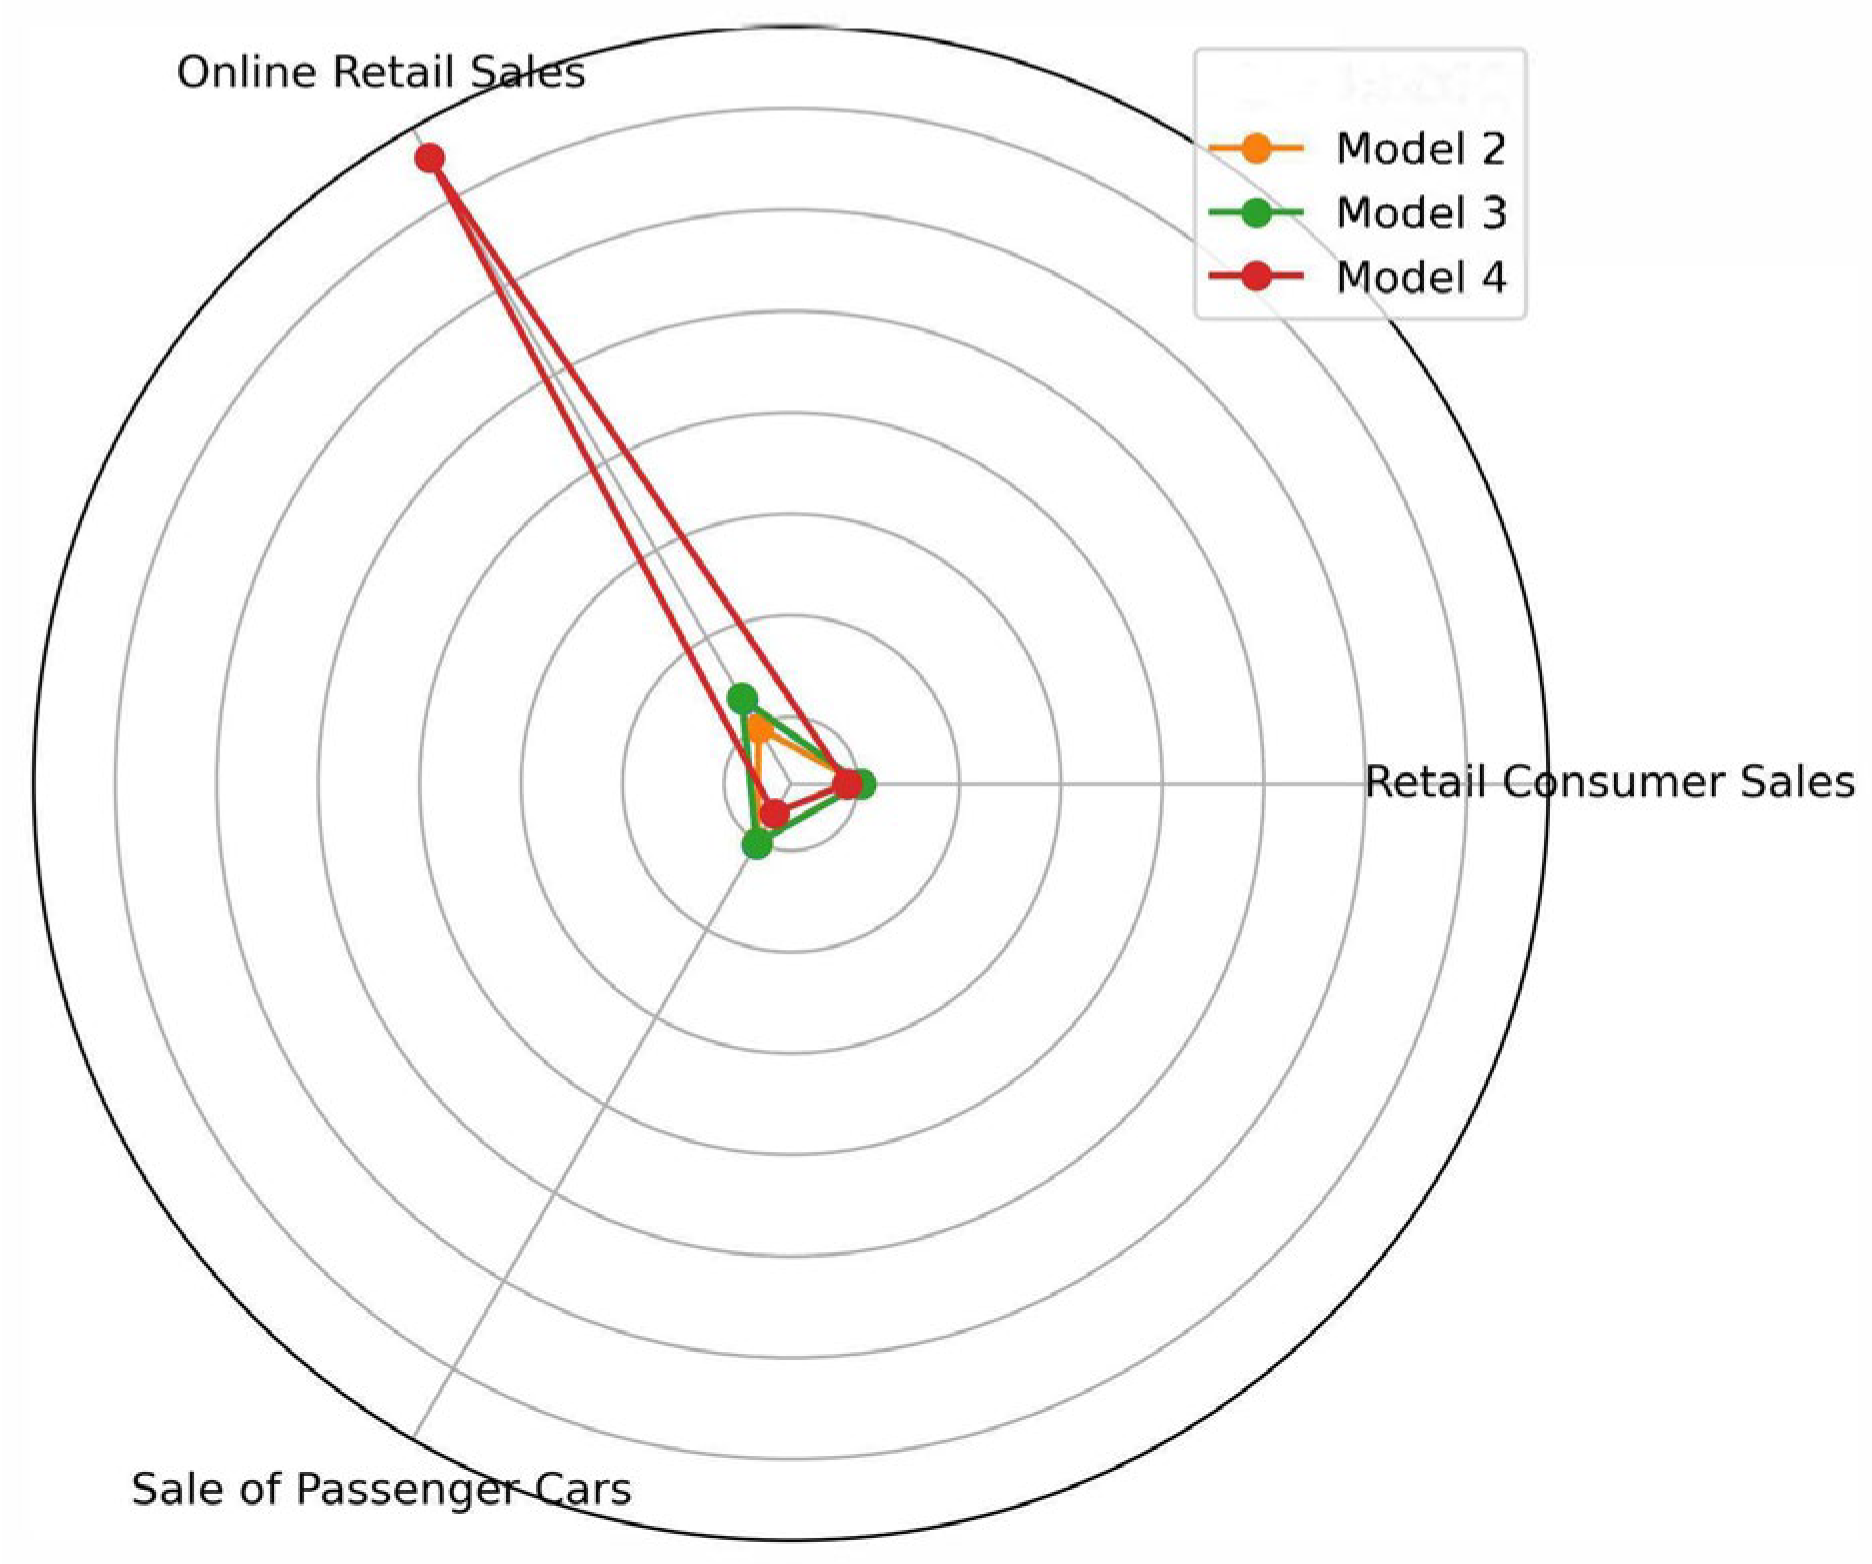
A graphical presentation of the above results is given in Figure 11.

4. Discussion

The observed results encompass a dynamic period from 2000 to 2022, marked by rapid urbanization in China. It is imperative to acknowledge the evolving relationship between the economy, environment, and the automotive industry during different stages of this period, as these nuances can shape the interpretation of the conclusions.

4.1. Temporal Dynamics: Unraveling Changing Trends

The period under consideration encapsulates distinct stages of China’s economic and urban development. In the early 2000s, China experienced unprecedented economic growth, triggering substantial urbanization. During this phase, the positive correlation between urban population growth and online retail sales can be contextualized within the broader narrative of rising consumerism amid economic prosperity. However, as urbanization progressed, so did the focus on sustainable practices, leading to the observed decline in passenger car sales in recent years. Government initiatives emphasizing public transit and environmental consciousness have redefined the landscape, influencing consumer behavior and market dynamics.

4.2. Transitions in Infrastructure and Consumer Behavior

The non-significant relationship between urban infrastructure and total retail sales, particularly in the context of online retail, reflects the transformative impact of digitalization. Over the years, the surge in e-commerce has shifted the traditional role of physical infrastructure in driving retail sales. The unexpected negative correlation between urban infrastructure and online retail sales might signify a transitional phase where improved infrastructure still coexists with strong online shopping trends. As urban infrastructure continues to evolve, its impact on consumer behavior in the digital era warrants continual scrutiny.

4.3. Environmental Concerns across Eras

The discussion of PM2.5 pollution and its contrasting effects on total retail sales and online retail sales also requires temporal consideration. In the early 2000s, economic growth may have taken precedence over environmental concerns, resulting in the observed negative impact of pollution on retail sales. However, as environmental issues gained prominence, consumers adapted by shifting toward online platforms, leading to the paradoxical positive correlation between pollution and online retail sales in more recent years.

4.4. Urban Population Moderation over Time

The moderation effect of urban population size on the relationship between PM2.5 pollution and retail sales is likely influenced by the varying stages of urbanization. In the initial phases, larger urban populations might have exhibited resilience to pollution’s impact, driven by robust retail markets. As urbanization progressed, the intensified correlation between pollution and online retail sales in densely populated areas could signify an adaptive response, emphasizing the role of convenience and safety in shaping consumer preferences.

4.5. Navigating Changing Tides: Implications for the Future

These temporal nuances underscore the need for adaptable policies and business strategies that recognize the shifting dynamics over the years. Policymakers and businesses must consider the evolving interplay between urbanization, environmental consciousness, and consumer behavior. Strategies that may have been effective in one era may require recalibration to align with the changing priorities of society and the economy.
In conclusion, the discussion’s integration of temporal dynamics elucidates the evolving nature of the relationships between urbanization, environment, and market dynamics in China. By contextualizing findings within different stages of the 2000–2022 period, this study provides a more nuanced understanding of the complex interdependencies shaping China’s economic and environmental landscape. This recognition of temporal transitions is crucial for informed decision-making and strategic planning in the face of continual change.

5. Conclusions

This study examines the influence of urbanization on the financial performance of several industries, specifically consumer goods and automotive industries. The consumer goods industry is further explored by splitting it into conventional retail and online sales. The current study takes two perspectives of urbanization: urban population growth and urban infrastructure development. Additionally, this study evaluates the influence of environmental issues, notably PM2.5 pollution, on said industries’ financial performance. Finally, the study assesses urbanization’s moderating role in the relationship between PM2.5 pollution and corporate financial performance. The study uses data from 23 regions in China from 2000 to 2022.
The findings of the study reveal that urban population growth positively influences retail sales and negatively Influences the automotive industry. On the other hand, urban infrastructure fails to prove any influence on retail goods and automotive sectors. However, an increase in urban infrastructure appears to affect online retail sales negatively. This surprising finding calls for more in-depth exploration. Similarly, an increase in PM2.5 pollution levels negatively affected retail and car sales but appeared to boost online retail sales. These findings reflect the growing environmental consciousness among Chinese consumers and the potential impact of pollution on consumption patterns. The moderating effect of the urban population is significant in the relationship between PM2.5 pollution and all three types of sales. This demonstrated that densely populated urban areas may have specific consumption dynamics that can counteract or amplify the effects of pollution.
The results of the current study have several implications. Policymakers can use this information to frame strategies considering the interconnected influences of urbanization, environmental pollution, and infrastructure development on economic growth. Understanding these relationships can help create a balanced and sustainable growth model for the Chinese economy.
However, the study is not without its limitations. The study is specific to the retail and automotive sectors. The findings might not be applicable to other sectors of the economy. The study mainly focuses on PM2.5 pollution. Other environmental factors like water pollution, noise pollution, or CO2 emissions might also impact these industries but are not considered. Future research should consider more specific regional factors and longer time horizons to provide more detailed insights.

Author Contributions

Conceptualization, F.M. and B.A.-S.; methodology, F.M. and W.A.-S.; software, F.M.; validation, F.M., R.H. and W.A.-S.; formal analysis, F.M., B.A.-S. and R.H.; investigation, F.M.; resources, F.M.; data curation, F.M.; writing—original draft preparation, F.M. and W.A.-S.; writing—review and editing, B.A.-S., R.H., K.B., A.H., Y.T. and W.A.-S.; visualization, F.M.; supervision, B.A.-S.; project administration, R.H. All authors have read and agreed to the published version of the manuscript.

Funding

This research received no external funding, and the APC was funded by the Gulf University of Science and Technology/Kuwait.

Institutional Review Board Statement

Not applicable.

Informed Consent Statement

Not applicable.

Data Availability Statement

The datasets generated and/or analyzed during the study are available from the corresponding author upon reasonable request.

Acknowledgments

The authors would like to thank Prince Sultan University for their support.

Conflicts of Interest

The authors declare no conflict of interest.

References

  1. Blankespoor, B.; Khan, A.; Selod, H. Consolidating Data of Global Urban Populations: A Comparative Approach. AGUFM 2017, 2017, IN52B-03. Available online: https://ui.adsabs.harvard.edu/abs/2017AGUFMIN52B..03B/abstract (accessed on 13 June 2023).
  2. Cohen, A.J.; Brauer, M.; Burnett, R.; Anderson, H.R.; Frostad, J.; Estep, K.; Balakrishnan, K.; Brunekreef, B.; Dandona, L.; Dandona, R.; et al. Estimates and 25-year trends of the global burden of disease attributable to ambient air pollution: An analysis of data from the Global Burden of Diseases Study 2015. Lancet 2017, 389, 1907–1918. [Google Scholar] [CrossRef]
  3. Zhou, Q.; Nizamani, M.M.; Zhang, H.-Y. The air we breathe: An In-depth analysis of PM2.5 pollution in 1312 cities from 2000 to 2020. Environ. Sci. Pollut. Res. 2023, 30, 93900–93915. [Google Scholar] [CrossRef]
  4. Shah, J.; Mishra, B. Analytical equations based prediction approach for PM2.5 using artificial neural network. SN Appl. Sci. 2020, 2, 1–15. [Google Scholar] [CrossRef]
  5. Wang, C.; Yang, Y.; Zhang, J. China’s sectoral strategies in energy conservation and carbon mitigation. Clim. Policy 2015, 15, S60–S80. [Google Scholar] [CrossRef]
  6. Ennouri, K.; Smaoui, S.; Triki, M.A. Detection of Urban and Environmental Changes via Remote Sensing. Circ. Econ. Sustain. 2021, 1, 1423–1437. [Google Scholar] [CrossRef] [PubMed]
  7. Yang, L.; Ma, N. Empirical Study on the Influence of Urban Environmental Industrial Structure Optimization on Ecological Landscape Greening Construction. Int. J. Environ. Res. Public Health 2022, 19, 16842. [Google Scholar] [CrossRef] [PubMed]
  8. Hashmi, S.H.; Fan, H.; Fareed, Z.; Shahzad, F. Asymmetric nexus between urban agglomerations and environmental pollution in top ten urban agglomerated countries using quantile methods. Environ. Sci. Pollut. Res. 2020, 28, 13404–13424. [Google Scholar] [CrossRef]
  9. Kuddus, A.; Tynan, E.; McBryde, E. Urbanization: A problem for the rich and the poor? Public Health Rev. 2020, 41, 1–4. [Google Scholar] [CrossRef]
  10. Horváthová, E. Does environmental performance affect financial performance? A meta-analysis. Ecol. Econ. 2010, 70, 52–59. [Google Scholar] [CrossRef]
  11. Pham, D.C.; Do, T.N.A.; Doan, T.N.; Nguyen, T.X.H.; Pham, T.K.Y. The impact of sustainability practices on financial performance: Empirical evidence from Sweden. Cogent Bus. Manag. 2021, 8, 1912526. [Google Scholar] [CrossRef]
  12. Nguyen, L.-T. The relationship between environmental performance and financial performance: Evidence from an emerging East Asian economy. Int. J. Discl. Gov. 2022, 20, 1–14. [Google Scholar] [CrossRef]
  13. Seto, K.C.; Güneralp, B.; Hutyra, L.R. Global forecasts of urban expansion to 2030 and direct impacts on biodiversity and carbon pools. Proc. Natl. Acad. Sci. USA 2012, 109, 16083–16088. [Google Scholar] [CrossRef] [PubMed]
  14. Zhang, T.; Song, Y.; Yang, J. Relationships between urbanization and CO2 emissions in China: An empirical analysis of population migration. PLoS ONE 2021, 16, e0256335. [Google Scholar] [CrossRef]
  15. Zhang, N.; Yu, K.; Chen, Z. How does urbanization affect carbon dioxide emissions? A cross-country panel data analysis. Energy Policy 2017, 107, 678–687. [Google Scholar] [CrossRef]
  16. Liang, W.; Yang, M. Urbanization, economic growth and environmental pollution: Evidence from China. Sustain. Comput. Inform. Syst. 2019, 21, 1–9. [Google Scholar] [CrossRef]
  17. Wang, Q.; Wu, S.-D.; Zeng, Y.-E.; Wu, B.-W. Exploring the relationship between urbanization, energy consumption, and CO2 emissions in different provinces of China. Renew. Sustain. Energy Rev. 2016, 54, 1563–1579. [Google Scholar] [CrossRef]
  18. Glaeser, E.L.; Nathanson, C.G. An extrapolative model of house price dynamics. J. Financ. Econ. 2017, 126, 147–170. [Google Scholar] [CrossRef]
  19. Wang, S.; Li, G.; Fang, C. Urbanization, economic growth, energy consumption, and CO2 emissions: Empirical evidence from countries with different income levels. Renew. Sustain. Energy Rev. 2018, 81, 2144–2159. [Google Scholar] [CrossRef]
  20. Chen, H.; Tackie, E.A.; Ahakwa, I.; Musah, M.; Salakpi, A.; Alfred, M.; Atingabili, S. Does energy consumption, economic growth, urbanization, and population growth influence carbon emissions in the BRICS? Evidence from panel models robust to cross-sectional dependence and slope heterogeneity. Environ. Sci. Pollut. Res. 2022, 29, 37598–37616. [Google Scholar] [CrossRef]
  21. Lankoski, L. Corporate responsibility activities and economic performance: A theory of why and how they are connected. Bus. Strat. Environ. 2008, 17, 536–547. [Google Scholar] [CrossRef]
  22. Ruan, L.; Liu, H. Environmental, Social, Governance Activities and Firm Performance: Evidence from China. Sustainability 2021, 13, 767. [Google Scholar] [CrossRef]
  23. Bag, D.; Mohanty, S. Impact of Environmental, Social and Governance (ESG) Factors on Stock Returns of Emerging Markets. SSRN Electron. J. 2021. [Google Scholar] [CrossRef]
  24. Trevlopoulos, N.S.; Tsalis, T.A.; Evangelinos, K.I.; Tsagarakis, K.P.; Vatalis, K.I.; Nikolaou, I.E. The influence of envi-ronmental regulations on business innovation, intellectual capital, environmental and economic performance. Environ. Syst. Decis. 2021, 41, 163–178. [Google Scholar] [CrossRef]
  25. Zhu, Q.; Sarkis, J.; Lai, K.-H. Green supply chain management innovation diffusion and its relationship to organizational improvement: An ecological modernization perspective. J. Eng. Technol. Manag. 2012, 29, 168–185. [Google Scholar] [CrossRef]
  26. Busch, T.; Lewandowski, S. Corporate Carbon and Financial Performance: A Meta-analysis. J. Ind. Ecol. 2018, 22, 745–759. [Google Scholar] [CrossRef]
  27. Gleißner, W.; Günther, T.; Walkshäusl, C. Financial sustainability: Measurement and empirical evidence. J. Bus. Econ. 2022, 92, 467–516. [Google Scholar] [CrossRef]
  28. Chen, Y.; Tan, X.; Cao, S. Financial Development and Energy Environmental Performance: Evidence from China’s Re-gional Economies. Environ. Sci. Pollut. Res. 2023, 30, 76528–76542. [Google Scholar] [CrossRef] [PubMed]
  29. Glaeser, E.L.; Kolko, J.; Saiz, A. Consumer city. J. Econ. Geogr. 2001, 1, 27–50. [Google Scholar] [CrossRef]
  30. Zhang, K.; Batterman, S. Air pollution and health risks due to vehicle traffic. Sci. Total. Environ. 2013, 450–451, 307–316. [Google Scholar] [CrossRef]
  31. Lanoie, P.; Patry, M.; Lajeunesse, R. Environmental regulation and productivity: Testing the porter hypothesis. J. Product. Anal. 2008, 30, 121–128. [Google Scholar] [CrossRef]
  32. Hamed, R.; Al-Shattarat, W.; Mahmood, F.; Al-Shattarat, B.; Hassanein, A. Does corporate sustainable development still promote corporate financial performance during global crises? Empirical Study from China. Cogent Bus. Manag. 2023, 10, 2190195. [Google Scholar] [CrossRef]
  33. Pope, C.A.; Burnett, R.T.; Thun, M.J.; Calle, E.E.; Krewski, D.; Ito, K.; Thurston, G.D. Lung Cancer, Cardiopulmonary Mortality, and Long-Term Exposure to Fine Particulate Air Pollution. JAMA Net. 2002, 287, 1132–1141. [Google Scholar] [CrossRef] [PubMed]
  34. Manisalidis, I.; Stavropoulou, E.; Stavropoulos, A.; Bezirtzoglou, E. Environmental and Health Impacts of Air Pollution: A Review. Front. Public Health 2020, 8, 505570. [Google Scholar] [CrossRef] [PubMed]
  35. Sharma, S.; Chandra, M.; Kota, S.H. Health Effects Associated with PM2.5: A Systematic Review. Curr. Pollut. Rep. 2020, 6, 345–367. [Google Scholar] [CrossRef]
  36. Gurjar, B.; Jain, A.; Sharma, A.; Agarwal, A.; Gupta, P.; Nagpure, A.; Lelieveld, J. Human health risks in megacities due to air pollution. Atmos. Environ. 2010, 44, 4606–4613. [Google Scholar] [CrossRef]
  37. Brook, R.D.; Rajagopalan, S.; Arden PopeIII, C.; Brook, J.R.; Bhatnagar, A.; Diez-Roux, A.V.; Holguin, F.; Hong, Y.; Luepker, R.V.; Mittleman, M.A.; et al. Particulate matter air pollution and cardiovascular disease: An update to the scientific statement from the American Heart Association. Circulation 2010, 121, 2331–2378. [Google Scholar] [CrossRef] [PubMed]
  38. Sun, X.; Zhao, T.; Liu, D.; Gong, S.; Xu, J.; Ma, X. Quantifying the Influences of PM2.5 and Relative Humidity on Change of Atmospheric Visibility over Recent Winters in an Urban Area of East China. Atmosphere 2020, 11, 461. [Google Scholar] [CrossRef]
  39. Pala, K.; Aykac, N.; Yasin, Y. Premature deaths attributable to long-term exposure to PM2.5 in Turkey. Environ. Sci. Pollut. Res. 2021, 28, 51940–51947. [Google Scholar] [CrossRef] [PubMed]
  40. Kan, H.; London, S.J.; Chen, G.; Zhang, Y.; Song, G.; Zhao, N.; Jiang, L.; Chen, B. Differentiating the effects of fine and coarse particles on daily mortality in Shanghai, China. Environ. Int. 2007, 33, 376–384. [Google Scholar] [CrossRef]
  41. Huang, R.-J.; Zhang, Y.; Bozzetti, C.; Ho, K.-F.; Cao, J.-J.; Han, Y.; Daellenbach, K.R.; Slowik, J.G.; Platt, S.M.; Canonaco, F.; et al. High secondary aerosol contribution to particulate pollution during haze events in China. Nature 2014, 514, 218–222. [Google Scholar] [CrossRef]
  42. Liu, Y.; Zang, Y.; Yang, Y. China’s rural revitalization and development: Theory, technology and management. J. Geogr. Sci. 2020, 30, 1923–1942. [Google Scholar] [CrossRef]
  43. Zhang, S.; Zhao, J.; Jiang, Y.; Cheshmehzangi, A.; Zhou, W. Assessing the Rural–Urban Transition of China during 1980–2020 from a Coordination Perspective. Land 2023, 12, 1175. [Google Scholar] [CrossRef]
  44. Cheng, M.; Duan, C. The changing trends of internal migration and urbanization in China: New evidence from the seventh National Population Census. China Popul. Dev. Stud. 2021, 5, 275–295. [Google Scholar] [CrossRef]
  45. Glaeser, E.L.; Resseger, M.G. The complementarity between cities and skills. J. Reg. Sci. 2010, 50, 221–244. [Google Scholar] [CrossRef]
  46. Khan, K.I.; Mata, M.N.; Martins, J.M.; Nasir, A.; Dantas, R.M.; Correia, A.B.; Saghir, M.U. Impediments of Green Finance Adoption System: Linking Economy and Environment. Emerg. Sci. J. 2022, 6, 217–237. [Google Scholar] [CrossRef]
  47. Duranton, G.; Puga, D. Micro-Foundations of Urban Agglomeration Economies. In Handbook of Regional and Urban Economics; Elsevier: Amsterdam, The Netherlands, 2004; Volume 4, pp. 2063–2117. [Google Scholar] [CrossRef]
  48. Knoben, J. Localized inter-organizational linkages, agglomeration effects, and the innovative performance of firms. Ann. Reg. Sci. 2009, 43, 757–779. [Google Scholar] [CrossRef]
  49. Melitz, M.J.; Redding, S.J. Heterogeneous Firms and Trade. In Handbook of International Economics; Elsevier: Amsterdam, The Netherlands, 2014; Volume 4, pp. 1–54. [Google Scholar] [CrossRef]
  50. Donaldson, D. Railroads of the Raj: Estimating the Impact of Transportation Infrastructure. Am. Econ. Rev. 2018, 108, 899–934. [Google Scholar] [CrossRef]
  51. Glaeser, E.L.; Kohlhase, J.E. Cities; Regions, and the Decline of Transport Costs; Springer: Berlin/Heidelberg, Germany, 2004. [Google Scholar] [CrossRef]
  52. Tang, D.Y.; Zhang, Y. Do shareholders benefit from green bonds? J. Corp. Financ. 2018, 61, 101427. [Google Scholar] [CrossRef]
  53. Hang, N.P.T. Policy Implications for the Green Bank Development in the Context of Global Climate Change. Emerg. Sci. J. 2022, 6, 817–833. [Google Scholar] [CrossRef]
  54. Guo, Y.; Li, S.; Tian, Z.; Pan, X.; Zhang, J.; Williams, G. The burden of air pollution on years of life lost in Beijing, China, 2004–2008: Retrospective regression analysis of daily deaths. BMJ 2013, 347, f7139. [Google Scholar] [CrossRef] [PubMed]
  55. Li, W.J.; Chen, S.R.; Xu, Y.S.; Guo, X.C.; Sun, Y.L.; Yang, X.Y.; Wang, Z.F.; Zhao, X.D.; Chen, J.M.; Wang, W.X. Mixing state and sources of submicron regional background aerosols in the northern Qinghai–Tibet Plateau and the influence of biomass burning. Atmos. Chem. Phys. 2015, 15, 13365–13376. [Google Scholar] [CrossRef]
  56. Flammer, C. Corporate Social Responsibility and Shareholder Reaction: The Environmental Awareness of Investors. Acad. Manag. J. 2013, 56, 758–781. [Google Scholar] [CrossRef]
  57. Zhang, X.; Zhang, X.; Chen, X. Happiness in the air: How does a dirty sky affect mental health and subjective well-being? J. Environ. Econ. Manag. 2017, 85, 81–94. [Google Scholar] [CrossRef]
  58. Li, H.; Zhou, L.-A. Political turnover and economic performance: The incentive role of personnel control in China. J. Public Econ. 2005, 89, 1743–1762. [Google Scholar] [CrossRef]
  59. Cao, S.; Nie, L.; Sun, H.; Sun, W.; Taghizadeh-Hesary, F. Digital finance, green technological innovation and energy-environmental performance: Evidence from China’s regional economies. J. Clean. Prod. 2021, 327, 129458. [Google Scholar] [CrossRef]
  60. Suoniemi, S.; Meyer-Waarden, L.; Munzel, A.; Zablah, A.R.; Straub, D. Big data and firm performance: The roles of market-directed capabilities and business strategy. Inf. Manag. 2020, 57, 103365. [Google Scholar] [CrossRef]
  61. Batten, D.F. Network Cities: Creative Urban Agglomerations for the 21st Century. Urban Stud. 1995, 32, 313–327. [Google Scholar] [CrossRef]
  62. Monsuwé, T.P.Y.; Dellaert, B.G.; de Ruyter, K. What drives consumers to shop online? A literature review. Int. J. Serv. Ind. Manag. 2004, 15, 102–121. [Google Scholar] [CrossRef]
  63. Tsai, Y.-H. Quantifying Urban Form: Compactness versus “Sprawl”. Urban Stud. 2005, 42, 141–161. [Google Scholar] [CrossRef]
  64. Banister, D. The sustainable mobility paradigm. Transp. Policy 2008, 15, 73–80. [Google Scholar] [CrossRef]
  65. Zhang, J.; Mu, Q. Air pollution and defensive expenditures: Evidence from particulate-filtering facemasks. J. Environ. Econ. Manag. 2017, 92, 517–536. [Google Scholar] [CrossRef]
  66. Wang, P.; Liu, Q.; Qi, Y. Factors influencing sustainable consumption behaviors: A survey of the rural residents in China. J. Clean. Prod. 2014, 63, 152–165. [Google Scholar] [CrossRef]
  67. Liu, L.; Fang, J.; Li, M.; Hossin, A.; Shao, Y. The effect of air pollution on consumer decision making: A review. Clean. Eng. Technol. 2022, 9, 100514. [Google Scholar] [CrossRef]
  68. Kraus, S.; Jones, P.; Kailer, N.; Weinmann, A.; Chaparro-Banegas, N.; Roig-Tierno, N. Digital Transformation: An Overview of the Current State of the Art of Research. SAGE Open 2021, 11. [Google Scholar] [CrossRef]
  69. Bayham, J.; Burkhardt, J.; Coffman, M.; Hayashida, S.; La Croix, S. Does air pollution increase electric vehicle adoption? Evidence from U.S. metropolitan areas, 2011–2018. J. Environ. Econ. Policy 2022, 11, 438–462. [Google Scholar] [CrossRef]
  70. Zhou, L.; Dai, L.; Zhang, D. Online Shopping Acceptance Model-A Critical Survey of Consumer Factors in Online Shopping. jecr.org. Available online: http://www.jecr.org/sites/default/files/08_1_p04.pdf (accessed on 1 July 2023).
  71. Tao, F.; Cheng, Y.; Zhang, L.; Nee, A.Y.C. Advanced manufacturing systems: Socialization characteristics and trends. J. Intell. Manuf. 2015, 28, 1079–1094. [Google Scholar] [CrossRef]
  72. Ostermeijer, F.; Koster, H.R.A.; van Ommeren, J.; Nielsen, V.M. Automobiles and urban density. J. Econ. Geogr. 2022, 22, 1073–1095. [Google Scholar] [CrossRef]
  73. Alam, K.; Imran, S. The digital divide and social inclusion among refugee migrants: A case in regional Australia. Inf. Technol. People 2015, 28, 344–365. [Google Scholar] [CrossRef]
  74. Wang, H.; Huang, Z.; Liang, Y.; Zhang, Q.; Hu, S.; Cui, L.; An, X. Dynamic evolution of urban infrastructure resilience and its spatial spillover effects: An empirical study from China. PLoS ONE 2023, 18, e0282194. [Google Scholar] [CrossRef]
  75. Hortaçsu, A.; Syverson, C. The Ongoing Evolution of US Retail: A Format Tug-of-War. J. Econ. Perspect. 2015, 29, 89–112. [Google Scholar] [CrossRef]
  76. Bento, A.M.; Cropper, M.L.; Mobarak, A.M.; Vinha, K. The Effects of Urban Spatial Structure on Travel Demand in the United States. Rev. Econ. Stat. 2005, 87, 466–478. [Google Scholar] [CrossRef]
  77. Long, F.; Zheng, L.; Song, Z. High-speed rail and urban expansion: An empirical study using a time series of nighttime light satellite data in China. J. Transp. Geogr. 2018, 72, 106–118. [Google Scholar] [CrossRef]
  78. Hao, H.; Wang, H.; Ouyang, M. Comparison of policies on vehicle ownership and use between Beijing and Shanghai and their impacts on fuel consumption by passenger vehicles. Energy Policy 2011, 39, 1016–1021. [Google Scholar] [CrossRef]
  79. Nora, H.; Allison, H.; Richard, W. The Environment in Anthropology (Second Edition); NYU Press: New York, NY, USA, 2020; ISBN 9781479862689. [Google Scholar]
  80. Zheng, S.; Wang, J.; Sun, C.; Zhang, X.; Kahn, M.E. Air pollution lowers Chinese urbanites’ expressed happiness on social media. Nat. Hum. Behav. 2019, 3, 237–243. [Google Scholar] [CrossRef]
  81. Qiu, Q.; Wang, Y.; Qiao, S.; Liu, R.; Bian, Z.; Yao, T.; Nguyen, T.S. Does air pollution affect consumer online purchasing behavior? The effect of environmental psychology and evidence from China. J. Clean. Prod. 2020, 260, 120795. [Google Scholar] [CrossRef]
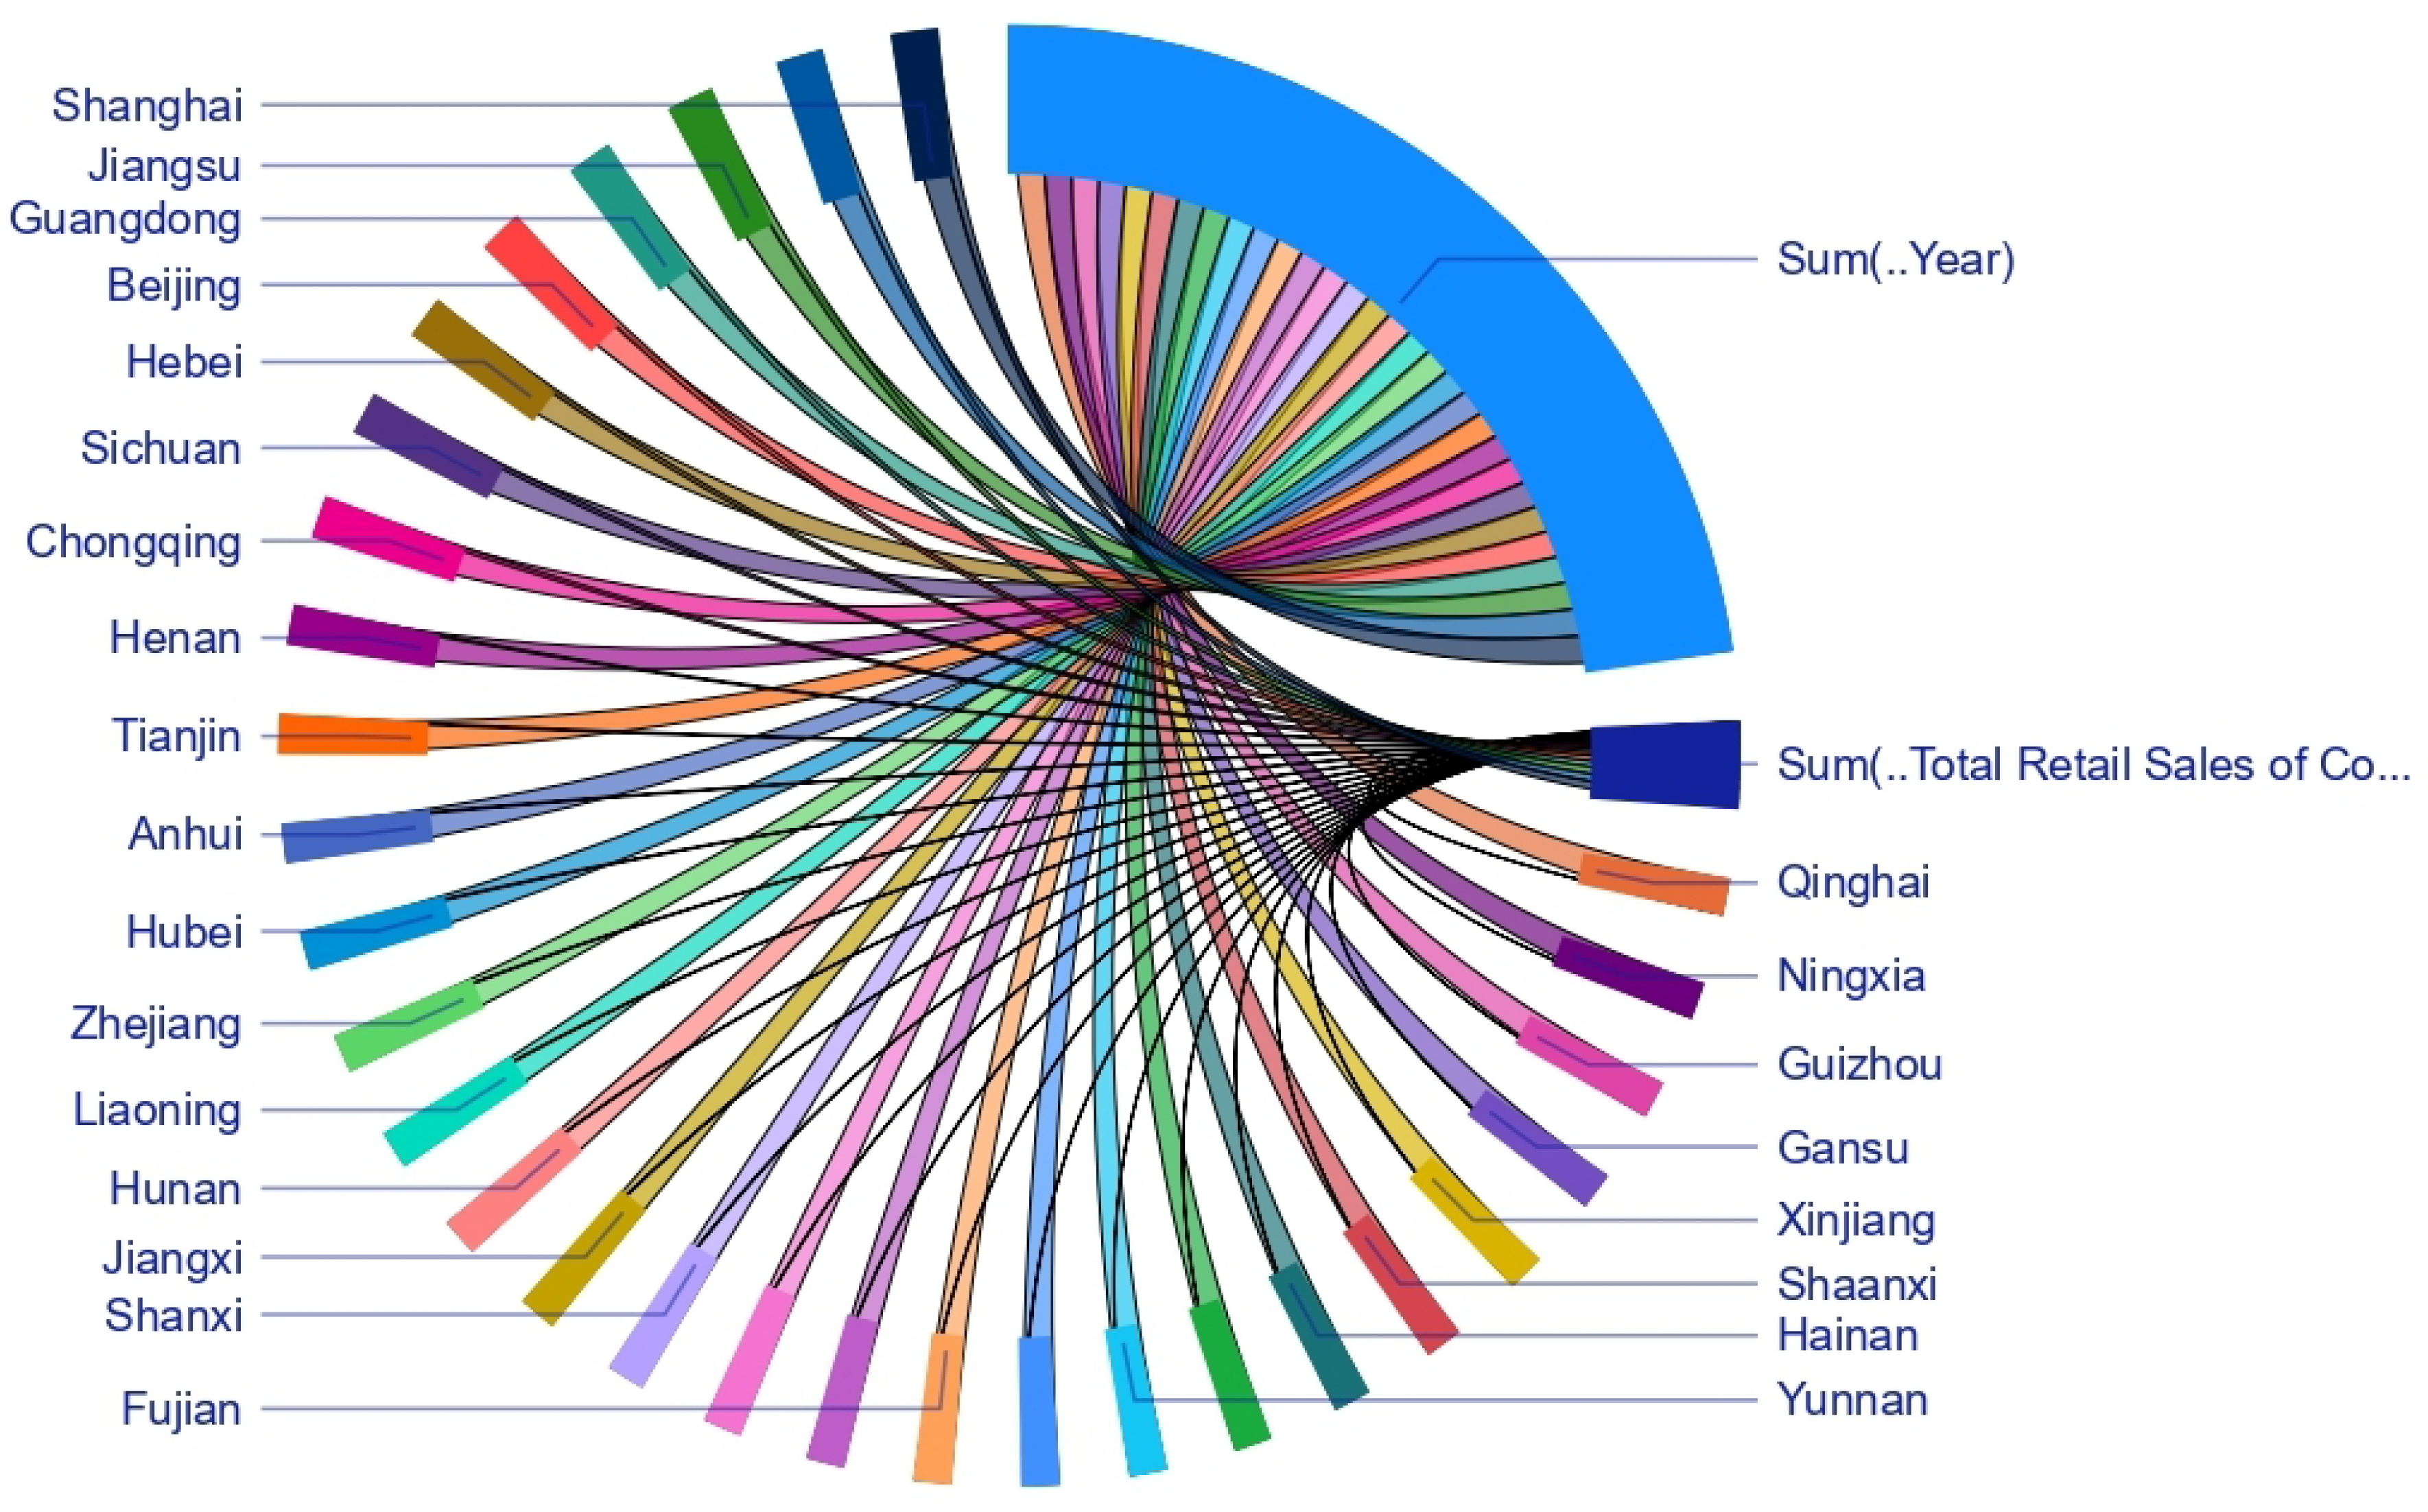
Figure 1. Year-wise and regional retail sales.
Sustainability 15 16138 g001
Figure 2. Influence of urbanization on corporate financial performance.
Sustainability 15 16138 g002
Figure 3. Influence of environment on corporate financial performance.
Sustainability 15 16138 g003
Figure 4. Urban population moderation in environment and corporate financial performance nexus.
Sustainability 15 16138 g004
Figure 5. Estimation strategy.
Sustainability 15 16138 g005
Figure 6. The detail of online sales from 2000 to 2022.
Sustainability 15 16138 g006
Figure 7. Sale of passenger cars of the top ten provinces in the last 10 years.
Sustainability 15 16138 g007
Figure 8. Urban population growth and corporate financial performance.
Sustainability 15 16138 g008
Figure 9. Urban infrastructure and corporate financial performance.
Sustainability 15 16138 g009
Figure 10. Environment and corporate financial performance.
Sustainability 15 16138 g010
Figure 11. Urban population moderation in environment and corporate financial performance nexus.
Sustainability 15 16138 g011
Table 1. Data collection detail.
Variable NameNature of DataData SourceCollection Method
Total Retail Sales of Consumer Goods (Billion Yuans)SecondaryBloombergDownloaded from Website
Online Retail Sales by Region (Billion Yuans)SecondaryBloombergDownloaded from Website
Sales of Passenger Cars (000)SecondaryBloombergDownloaded from Website
Urban Population (Millions)SecondaryWorld BankDownloaded from Website
Urban Population Growth (%)SecondaryWorld BankDownloaded from Website
PM2.5 Air Pollution (μg/m3)SecondaryWorld BankDownloaded from Website
Urban InfrastructureSecondaryWorld BankDownloaded from Website
Population Density in Urban Areas (Per Square Km)SecondaryWorld BankDownloaded from Website
Urban Land Area (Square Km)SecondaryWorld BankDownloaded from Website
Population Living in Slums (Thousands)SecondaryWorld BankDownloaded from Website
Table 2. Descriptive statistics.
VariableObs.MeanStd. Dev.Min.Max.
Total Retail Sales of Consumer Goods (Billion Yuans)6901.8510.612−0.0453.228
Online Retail Sales by Region (Billion Yuans)6901.9133.4610.00120.571
Sales of Passenger Cars (000)6903.9830.6991.8755.732
Urban Population (Millions)69028.71420.1040.88103.640
Urban Population Growth (%)6902.3010.6691.0005.447
PM2.5 Air Pollution (μg/m3)690165.33339.31270.000260.000
Urban Infrastructure69099.9570.17098.300100.000
Population Density in Urban Areas (Per Square Km)6902.6890.4891.2303.766
Urban Land Area (Square Km)6904.0590.4802.7674.804
Population Living in Slums (Thousands)69010.29117.5570.000120.000
Table 3. Correlation matrix of the key variables of the study. ** and *** indicate the significance levels at, 5%, and 1%, respectively.
Variable12345678910
(1) Total Retail Sales of Consumer Goods1.000
(2) Online Retail Sales by Region0.313 ***1.000
(3) Sales of Passenger0.776 ***0.247 ***1.000
(4) Urban Population0.644 ***0.238 ***0.527 ***1.000
(5) Urban Population Growth−0.451 ***−0.220 ***−0.398 ***−0.525 ***1.000
(6) PM2.5 Air Pollution0.416 ***0.647 ***0.318 ***0.366 ***−0.339 ***1.000
(7) Urban Infrastructure0.341 ***0.109 ***0.367 ***0.216 ***−0.158 ***0.236 ***1.000
(8) Population Density in Urban Areas0.720 ***0.081 **0.703 ***0.414 ***−0.362 ***0.0410.416 ***1.000
(9) Urban Land Area0.150 ***0.139 ***−0.079 **0.588 ***−0.326 ***0.317 ***0.011−0.143 ***1.000
(10) Population Living in Slums0.142 ***−0.174 ***0.043 ***0.196 ***0.060−0.220 ***0.077 **0.115 ***0.265 ***1.000
Table 4. Influence of urban population growth on total retail sales of consumer goods.
Without Any EffectWith the Time EffectWith the Region EffectWith the Time and Region Effects
Urban Population Growth0.026 ***
(0.006)
0.033 ***
(0.008)
0.028 ***
(0.005)
0.03 ***
(0.008)
Urban Population0.018 ***
(0.001)
0.007 ***
(0.0009)
0.019 ***
(0.0009)
0.006 ***
(0.001)
Population Density1.779 ***
(0.088)
0.561 ***
(0.096)
1.545 ***
(0.134)
0.397 ***
(0.133)
Urban Land Area1.197 ***
(0.088)
−0.064 ***
(0.096)
1.588 ***
(0.131)
−0.274 ***
(0.161)
Population Living in Slums0.001 ***
(0.0003)
0.001 ***
(0.0002)
0.002 ***
(0.0003)
0.001 ***
(0.0003)
R20.5630.7100.6700.713
Wald Test8089.36 ***15,573.68 ***69,511.90 ***101,080.73 ***
No. of Groups23232323
No. of Observations690690690690
Standard errors are in parentheses. *** indicate the significance levels at 1%.
Table 5. Influence of urban population growth on online retail sales of consumer goods.
Without Any EffectWith the Time EffectWith the Region EffectWith the Time and Region Effects
Urban Population Growth−0.593
(0.25)
0.254
(0.176)
−0.803 ***
(0.212)
0.189
(0.192)
Urban Population0.054 ***
(0.013)
0.049 ***
(0.009)
0.339 ***
(0.037)
0.217 ***
(0.025)
Population Density0.125
(0.467)
−0.659 *
(0.360)
13.918 ***
(5.171)
21.973 ***
(2.940)
Urban Land Area0.398
(0.535)
−0.789 **
(0.401)
6.032
(5.042)
3.064
(3.568)
Population Living in Slums−0.06 ***
(0.009)
0.001
(0.005)
0.032 **
(0.013)
0.012 **
(0.006)
R20.1130.2330.5690.615
Wald Test118.84 ***434.55 ***865.94 ***647.70 ***
No. of Groups23232323
No. of Observations690690690690
Standard errors are in parentheses. *, ** and *** indicate the significance levels at 10%, 5%, and 1%, respectively.
Table 6. Influence of urban population growth on the sale of passenger cars.
Without Any EffectWith the Time EffectWith the Region EffectWith the Time and Region Effects
Urban Population Growth0.091 ***
(0.007)
−0.022 ***
(0.004)
0.096 ***
(0.006)
−0.022 ***
(0.004)
Urban Population0.01 **
(0.001)
0.002 ***
(0.0005)
0.011 ***
(0.001)
0.002 ***
(0.0006)
Population Density2.429 ***
(0.108)
0.72 ***
(0.065)
2.2 ***
(0.164)
0.674 ***
(0.072)
Urban Land Area1.563 ***
(0.107)
−0.021
(0.074)
2.054 ***
(0.16)
0.006
(0.088)
Population Living in Slums−0.001 ***
(0.0004)
0.005 ***
(0.0002)
0.005
(0.0004)
0.005 ***
(0.0001)
R20.3630.4130.5290.638
Wald Test622.10 ***724.50 ***642.49 ***4532.52 ***
No. of Groups23232323
No. of Observations690690690690
Standard errors are in parentheses. ** and *** indicate the significance levels at 5%, and 1%, respectively.
Table 7. Influence of urban infrastructure on total retail sales of consumer goods.
Without Any EffectWith the Time EffectWith the Region EffectWith the Time and Region Effects
Urban Infrastructure−0.008
(0.021)
−0.003
(0.016)
−0.021
(0.021)
0.006
(0.017)
Urban Population0.018 ***
(0.001)
0.008 ***
(0.0009)
0.019 ***
(0.001)
0.006 ***
(0.001)
Population Density1.769 ***
(0.097)
0.511 ***
(0.099)
1.619 ***
(0.162)
0.292 *
(0.156)
Urban Land Area1.146 ***
(0.088)
−0.139
(0.094)
1.479 ***
(0.139)
−0.397 **
(0.159)
Population Living in Slums0.001 ***
(0.0003)
0.001 ***
(0.0002)
0.002 ***
(0.0003)
0.001 ***
(0.0002)
R20.5700.6170.6530.712
Wald Test778.04 ***1520.60 ***6688.63 ***9916.76 ***
No. of Groups23232323
No. of Observations690690690690
Standard errors are in parentheses. *, ** and *** indicate the significance levels at 10%, 5%, and 1%, respectively.
Table 8. Influence of urban infrastructure on online retail sales.
Without Any EffectWith the Time EffectWith the Region EffectWith the Time and Region Effects
Urban Infrastructure1.542 *
(0.822)
−0.16
(0.349)
−3.433 ***
(0.791)
−1.279 ***
(0.388)
Urban Population0.06 ***
(0.013)
0.049 **
(0.009)
0.25 ***
(0.041)
0.198 ***
(0.026)
Population Density0.118
(0.478)
−0.775 **
(0.358)
28.36 ***
(6.093)
27.423 ***
(3.394)
Urban Land Area0.547
(0.531)
−0.932
(0.393)
1.142
(5.239)
1.06
(3.466)
Population Living in Slums−0.065 **
(0.009)
0.003
(0.005)
0.02
(0.013)
0.011 *
(0.006)
R20.1140.2110.5720.626
Wald Test116.81 ***4822.81 ***876.29 ***6151.72
No. of Groups23232323
No. of Observations690690690690
Standard errors are in parentheses. *, ** and *** indicate the significance levels at 10%, 5%, and 1%, respectively.
Table 9. Influence of urban infrastructure on the sale of passenger cars.
Without Any EffectWith the Time EffectWith the Region EffectWith the Time and Region Effects
Urban Infrastructure0.107 ***
(0.029)
0.010
(0.009)
0.095 ***
(0.028)
0.014
(0.009)
Urban Population0.013 ***
(0.001)
0.002 ***
(0.0006)
0.014 ***
(0.001)
0.002 ***
(0.006)
Population Density2.14 ***
(0.124)
0.728 ***
(0.075)
1.767 ***
(0.220)
0.662 ***
(0.086)
Urban Land Area1.362 ***
(0.112)
0.062
(0.074)
2.016 ***
(0.189)
0.108
(0.087)
Population Living in Slums−0.001 **
(0.0004)
−0.006 ***
(0.0001)
0.002
(0.0004)
−0.006 ***
(0.0001)
R20.37520.60630.6260.698
Wald Test5334.18 ***68,294.77 ***4699.98 ***43,062.72 ***
No. of Groups23232323
No. of Observations690690690690
Standard errors are in parentheses. ** and *** indicate the significance levels at 5%, and 1%, respectively.
Table 10. Influence of PM2.5 pollution on the total retail sales of consumer goods.
Without Any EffectWith the Time EffectWith the Region EffectWith the Time and Region Effects
PM2.5 Pollution0.005 ***
(0.0002)
0.005 *
(0.003)
0.005 ***
(0.0004)
−0.018 *
(0.013)
Urban Population0.008 ***
(0.0009)
0.007 ***
(0.0009)
0.007 ***
(0.001)
0.006 ***
(0.001)
Population Density0.642 ***
(0.091)
0.517 ***
(0.091)
0.549 ***
(0.138)
0.323 **
(0.132)
Urban Land Area−0.102
(0.096)
−0.194 **
(0.100)
−0.181
(0.166)
−0.404 **
(0.158)
Population Living in Slums0.001 ***
(0.0002)
0.001 ***
(0.0002)
0.001 ***
(0.0003)
0.001 ***
(0.0002)
R20.7330.7190.6920.742
Wald Test1358.04 ***1525.04 ***8783.45 ***9929.11 ***
No. of Groups23232323
No. of Observations690690690690
Standard errors are in parentheses. *, ** and *** indicate the significance levels at 10%, 5%, and 1%, respectively.
Table 11. Influence of PM2.5 pollution on online retail sales.
Without Any EffectWith Time EffectWith Region EffectWith Time and Region Effect
PM2.5 Pollution0.064 ***
(0.003)
0.003
(0.007)
0.097 **
(0.017)
1.379 ***
(0.291)
Urban Population0.011
(0.01)
0.047 ***
(0.009)
0.119 **
(0.052)
0.217 ***
(0.025)
Population Density0.095
(0.357)
−0.775 **
(0.345)
−2.127
(5.885)
21.522 ***
(2.904)
Urban Land Area−0.916 **
(0.420)
−0.961 **
(0.392)
−20.479 ***
(7.088)
2.264
(3.474)
Population Living in Slums−0.00
(0.007)
0.003
(0.005)
0.011
(0.013)
0.013 **
(0.006)
R20.4260.4920.5800.613
Wald Test617.46 ***4813.67 ***904.90 ***6047.11 ***
No. of Groups23232323
No. of Observations690690690690
Standard errors are in parentheses. ** and *** indicate the significance levels at 5%, and 1%, respectively.
Table 12. Influence of PM2.5 pollution on the sale of passenger cars.
Without Any EffectWith the Time EffectWith the Region EffectWith the Time and Region Effects
PM2.5 Pollution0.005 ***
(0.0003)
0.003
(0.003)
0.002 ***
(0.0006)
−0.068 ***
(0.007)
Urban Population0.001
(0.001)
0.002 ***
(0.0006)
0.006 ***
(0.001)
0.002 ***
(0.0006)
Population Density1.311 **
(0.127)
0.769 ***
(0.066)
1.74 ***
(0.214)
0.728 ***
(0.073)
Urban Land Area0.263 **
(0.132)
0.056
(0.076)
1.104 ***
(0.258)
0.095
(0.087)
Population Living in Slums−0.001 **
(0.0004)
−0.006 ***
(0.0001)
−0.004
(0.0004)
−0.006 ***
(0.0001)
R20.5460.6190.6760.712
Wald Test677.65 ***6819.19 ***4730.54 ***4298.84 ***
No. of Groups23232323
No. of Observations690690690690
Standard errors are in parentheses. ** and *** indicate the significance levels at 5%, and 1%, respectively.
Table 13. Urban population moderation in the influence of PM2.5 on total retail sales of consumer goods.
Without Any EffectWith the Time EffectWith the Region EffectWith the Time and Region Effects
PM2.5 Pollution0.005 ***
(0.0002)
0.005 *
(0.003)
0.005 ***
(0.001)
−0.022 *
(0.013)
Population Density0.713 ***
(0.092)
0.581 ***
(0.092)
0.599 ***
(0.138)
0.36 ***
(0.131)
Urban Land Area−0.012
(0.101)
−0.100
(0.104)
−0.144
(0.167)
−0.298 **
(0.157)
Population Living in Slums0.001 ***
(0.0002)
0.001 ***
(0.0002)
0.001 ***
(0.0003)
0.001 ***
(0.0003)
PM2.5 Pollution * Urban Population0.001 ***
(0.0003)
0.001 ***
(0.0003)
0.001 ***
(0.0002)
0.001 ***
(0.0002)
R20.7100.6910.7220.763
Wald Test1358.94 ***1549.88 ***8817.73 ***1012.97 ***
No. of Groups23232323
No. of Observations690690690690
Standard errors are in parentheses. *, ** and *** indicate the significance levels at 10%, 5%, and 1%, respectively.
Table 14. Urban population moderation in the influence of PM2.5 on online retail sales.
Without Any EffectWith the Time EffectWith the Region EffectWith the Time and Region Effects
PM2.5 Pollution0.059 ***
(0.003)
−0.004
(0.007)
0.064 ***
(0.017)
1.293 ***
(0.284)
Population Density−0.268
(0.334)
−0.734 **
(0.305)
−0.185
(5.819)
22.699 ***
(2.861)
Urban Land Area−1.361 ***
(0.383)
−0.831 **
(0.341)
−8.591
(7.056)
4.881
(3.419)
Population Living in Slums0.0008
(0.007)
0.006
(0.005)
0.019 *
(0.012)
0.01 *
(0.006)
PM2.5 Pollution * Urban Population0.001 ***
(0.0002)
0.001 ***
(0.0002)
0.001 ***
(0.0003)
0.001 ***
(0.0002)
R20.4290.8440.5910.604
Wald Test645.00 ***5147.70 ***949.42 ***6278.86 ***
No. of Groups23232323
No. of Observations690690690690
Standard errors are in parentheses. *, ** and *** indicate the significance levels at 10%, 5%, and 1%, respectively.
Table 15. Urban population moderation in the influence of PM2.5 on the sales of passenger cars.
Without Any EffectWith the Time EffectWith the Region EffectWith the Time and Region Effects
PM2.5 Pollution0.005 ***
(0.0004)
0.001
(0.003)
0.003 ***
(0.0006)
−0.064 ***
(0.007)
Population Density1.307 ***
(0.128)
0.773 ***
(0.066)
1.742 ***
(0.216)
0.731 ***
(0.073)
Urban Land Area0.192
(0.138)
0.013
(0.078)
0.703 ***
(0.263)
0.038
(0.087)
Population Living in Slums−0.001 ***
(0.0003)
0.002 ***
(0.0003)
−0.001 **
(0.0004)
0.007 ***
(0.0009)
PM2.5 Pollution * Urban Population0.004
(0.0027)
0.003 *
(0.0017)
0.002
(0.0031)
0.002 **
(0.0008)
R20.5520.5990.6860.698
Wald Test6771.33 ***6758.76 ***4649.53 ***4259.37 ***
No. of Groups23232323
No. of Observations690690690690
Standard errors are in parentheses. *, ** and *** indicate the significance levels at 10%, 5%, and 1%, respectively.
Disclaimer/Publisher’s Note: The statements, opinions and data contained in all publications are solely those of the individual author(s) and contributor(s) and not of MDPI and/or the editor(s). MDPI and/or the editor(s) disclaim responsibility for any injury to people or property resulting from any ideas, methods, instructions or products referred to in the content.