Article

Design and Analysis of a Peak Time Estimation Framework for Vehicle Occurrences at Solar Photovoltaic and Grid-Based Battery-Swappable Charging Stations

1
Energy Research Center, COMSATS University Islamabad, Lahore Campus, Lahore 54000, Pakistan
2
Department of Food Biotechnology and Environmental Science, Kangwon National University, Chuncheon 24341, Republic of Korea
3
Institute of Environmental Sciences & Engineering (IESE, NUST), Islamabad 24090, Pakistan
4
College of Engineering and Information Technology, Ajman University, Ajman 346, United Arab Emirates
5
Department of Electronic Engineering, NED University of Engineering and Technology, Karachi 76500, Pakistan
6
Agriculture and Life Sciences Research Institute, Kangwon National University, Chuncheon 24341, Republic of Korea
*
Author to whom correspondence should be addressed.
Sustainability 2023, 15(23), 16153; https://doi.org/10.3390/su152316153
Submission received: 12 October 2023 / Revised: 16 November 2023 / Accepted: 17 November 2023 / Published: 21 November 2023
(This article belongs to the Section Environmental Sustainability and Applications)

Abstract

:
Due to global environmental impacts, the electric vehicle (EV) adoption rate is increasing. However, unlike conventional petrol vehicles, EVs take a considerable time to charge. EVs on the road with different battery charging statuses and driving demographics may cause uncertain peak time arrivals at charging stations. Battery-swappable charging stations are a quick and easier way to replace uncharged batteries with charged ones. However, charging due to uncertain EV arrival causes higher charging profiles posing load to the grid, management of charged and discharged batteries, and peak time charging tariffs. These challenges hinder the wide operation of battery-swappable charging stations. Nevertheless, a pre-assessment of peak hours using EV demographics can reduce congestion. In recent literature surveys for battery-swappable charging stations, spot congestion has not been given much attention, which has a direct influence on the sizing and operation of battery-swappable charging stations. This research study is focused on estimating peak time events using a novel integrated techno-economic assessment framework. A fuzzy-based parametric assessment tool is developed that identifies the factors that influence higher congestion events. Based on the peak event assessment, grid, and solar PV-based generation is optimized using mixed integer linear programming. In the final step, an environment analysis of a swappable charging station is performed. Furthermore, the results achieved using the proposed framework for battery-swappable charging stations (BSCSs) were compared with fast-charging (FC) stations. FC can economically perform well if integrated with solar PV systems; however, the capital cost is 80% greater than the BSCSs designed under the proposed framework. The operational cost of BSCSs is 39% higher than FC stations as they use 29% higher grid units than FC stations due to night operations under congestion.

1. Introduction

With the overwhelming response from policymakers on EV intrusion, leading car manufacturers have proactively started developing state-of-the-art electric vehicles. In recent years, electric vehicle adoption has improved in China, the USA, and Europe. The reason behind the better adoption rate of EVs has many different compelling factors, among which, at the top of the list, are state policies to incentivize EV owners and technological advancements in EVs as well as battery storage systems. It is anticipated that EV adoption will continue to rise in the future, which certainly would trigger challenges such as the quick deployment of EV charging stations. EV charging station infrastructure is one of the biggest challenges that requires attention to provide hassle-free charging points after massive EV adoption. Battery-swappable charging stations (BSCSs) are the quickest form of refueling for electric vehicles, where discharged/used batteries are replaced/swapped with charged ones. However, the challenge is the uncertainty associated with BSCSs [1]. On the other hand, fast charging as well as swappable charging stations pose a serious challenge to the grid in terms of demand and supply loss, reactive power compensation, and voltage dips during peak hours [1,2]. Moreover, uncertain peak hours at charging stations may also require relatively larger capacity charging station infrastructure in terms of their power ratings. There are charging stations that were developed to support hybrid power feeding, i.e., renewable power such as solar and wind accompanied by the grid [3]. However, the hybrid approach requires robust control in order to address the intermittency issues of renewable power generation. Moreover, charging equipment compatibility is another issue related to the rise in EV manufacturers. AC and DC charging station compatibility with EV cars, connection with the grid in a hybrid approach, and appropriate sizing are the key features that are directly influenced by the uncertain charging profiles of EVs [1,2,3]. It is known that uncertainty parameters can be addressed by using statistical tools and other independent parameters such as traffic flows. There is much more research that needs to be conducted to comprehensively address spot congestion uncertainty. Two major uncertainties indicated by [1], which are associated with the BSCS are the arrival of too many vehicles at one time, i.e., spot congestion, and unpredictable grid prices, i.e., tariff rates. As mentioned by [1], uncertain arrivals are dependent on more than one parameter including owner behavior toward charging vehicles, daily demographics, tariff rates, and finally, the state of the charge (SoC) of the battery bank of the car. The study of significant factors of spot congestion in densely populated areas has not been given attention in current research developments. Furthermore, it has not been given the tools, techniques, or mechanisms to assess spot congestion during higher EV penetration while including multi-dimensional factors that are interdependent and influence spot congestion both in individual and collective capacities, thus making identifying spot congestion events more challenging. Researchers are developing models to address the uncertain arrival of EVs at BSCSs, which may cause congestion, using independent parameters such as traffic flow and interview surveys, whereas other researchers have used statistical tools to address congestion. The literature review section below adequately covers the research work being performed in the area.

2. Literature Review

To address the uncertain parameters, researchers have used different statistical and optimization tools. The authors of [4] considered vehicle arrival rate as one of the parameters to model charging station infrastructure. Although the EV arrival rate was considered one of the factors, the dependence of arrival rate uncertainty on different factors was not considered. A scenario generation (SG) method was developed in [5] to address the uncertainties in wind power generation when integrated with charging stations. The authors also considered the uncertainty in vehicle arrival as one of the factors that impact charging station performance. In [6], the Poisson distribution was used to assess the arrival of EVs for battery swapping. The authors of [7] used extreme events scenarios and assumed that all vehicles would reach the charging stations at a particular time span. Whereas in [8], the authors used surveys to estimate congestion periods. The authors of [9] used traffic flow data to understand spot congestion. The authors of [10] developed EV scheduling at a BSCS to reduce congestion.
However, researchers are more focused on optimal techniques that can be used to address congestion. Optimization techniques have been widely used by researchers to reduce the operational cost of charging stations and optimally size distributed generation sources. Researchers have widely used intermittently distributed generation sources to electrify charging stations along with mainstream networks to make a hybrid generation source. Economic sizing and dispatch using optimizing algorithms for charging stations have been widely tested and implemented by researchers in various case studies. In [11], the genetic algorithm is used to solve a multi-objective optimization model with the goal of controlling grid load variation, decreasing abandoned wind and solar energy, and increasing profit [12]. The study in [13] describes real-time energy monitoring for a BSS-based smart community that uses variable renewable energy resources (VREs) to charge EV batteries (EVBs) and ordinary household loads, allowing BSS to be fully used (RLs) [13]. Several nano grids with a BSS serve as a battery-swapping charging system (BSCS), with trucks collecting FBs from various nano grids and transporting them to the BSS to service electric vehicles (EVs). Many effective advanced technologies for facilitating a BSCS’s joint optimal scheduling are detailed, as well as a nano grid-based BSCS that encourages both distributed renewables and electric automobiles [14]. In [15], an optimal stochastics power demand algorithm is designed that includes the short-term and long-term as well as hour-based operation decision to integrate PV with a charging station with an option to charge a battery from the grid when either the cost is low or solar PV is not available. A hybrid distributed generation system having PV, pumped hydro, geothermal, and wind power is designed by the authors of [16] to charge the battery bank of swappable charging stations. All renewable resources including micro-hydro pumps, PV, wind, and geothermal resources are integrated into the common bus bar system for charging BSS. Mixed nonlinear programming (MINLP) is used to control the flow of energy to the BSS system. In their research paper, the second-life batteries are charged with excess energy from renewable energy and are delivered to BSS on demand.
The aim of the authors of [17] is to harvest the maximum feasible energy from the sun and wind and make sure the power output is constant. Two methods are used to place the BSS in their study, which are analytical and meta-heuristic (artificial bee colony (ABC)) methods. The ABC is used to find the optimal size of BSS and the distributed generator (DG) output. The results show that the analytical and optimization methods give similar results in finding the optimal location of BSS, which is better than the randomization of BSS placement. Furthermore, the analysis of the optimal size of BSS and DG output (simultaneously) gives the lowest power loss compared with other analyses [18]. In [19], energy loss reduction and the voltage stability factor are enhanced with the optimal allocation of distributed generation (DG) and BSS using the new grasshopper optimizer algorithm (GOA). A capacity and location planning demand-side management method for electric vehicles is devised in [19]. A bilevel optimal configuration model of a battery storage system along with its optimal location is simulated. In [20], the concept of the battery-switching station (BSS) is introduced. A new meta-heuristic optimization known as ranked evolutionary particle swarm optimization (REPSO) and multi-objective REPSO (MOREPSO) were used to find the optimum results for DG output and BSS placement [15]. In [21], a multi-objective formulation for the siting and sizing of DG resources into existing distribution networks is proposed. The implemented technique is based on a genetic algorithm and constrained method that allows obtaining a set of feasible solutions [21]. A capacity planning problem is formulated in [22] to determine the optimal sizing of photovoltaic (PV) generation and a battery-based energy storage system (BESS). The problem is formulated based on mixed-integer linear programming (MILP) and then solved using a robust optimization approach. The study in [23] considers networked nano grids with an electric vehicle battery swapping station (BSS) as a cyber–physical energy management system (CPEMS) for enhancing energy supply reliability, resilience, and economics. The authors of [24] present a model of an electric charging station that combines battery swapping and fast charging, where the decision process to select either one is based on the battery stockage level of idle batteries in a charging station and power congestion on the grid. A meta-heuristic algorithm (tabu search) is used to solve the non-linear model. The results show that the system effectively tackled the power spikes that occurred due to EV charging. A decision matrix that manages the charging, discharging, and battery swapping of a swappable battery station based on power security and economic aspects is designed in [25]. The author presents a power flow model that combines AC–DC power lines, and the DC line is taken from the swappable battery station linked to the grid. The proposed system in [26] uses line-to-line voltage wholly as the main AC source but the line-to-ground power can be used from the swappable battery station when there is congestion on the feeder. The idle batteries are effectively used in the process, and the system shows an overall increase in power security [26]. The study in [27] presents the advantages of swappable battery charging stations in the context of the power grid; furthermore, an optimization strategy that hybridizes particle swarm optimization and the genetic algorithm is used to reduce the power loss and voltage deviation for the power networks that power swappable battery charging stations. In [28], a solution to reduce overloading that uses swappable charging stations is developed. The batteries in the system can be used to power auxiliary services using the battery-to-grid (B2G) topology, and as a result, the load congestion on the grid is greatly reduced when the source produces ample energy. The author of [29] presents a scheme to manage the overloading of a power grid due to a swappable battery charging station. The unused batteries in the station can be used as a frequency regulatory service. The idle batteries effectively perform frequency regulatory services for the grid, and they also have economic advantages [29].
Though researchers are striving to address spot congestion in BSCSs, this part of the research has received less focus. If congestion events are not known, then appropriate sizing of the charging stations is difficult. This will lead to undersized or oversized charging stations, with more stress on the grid, in the case of undersized stations, and more burden on overall economics, in the case of oversized stations [30]. There is a need to develop an integrated framework that analyzes congestion events of battery-swappable charging stations and the subsequent optimal sizing of charging stations followed by environmental analysis. This study develops a comprehensive charging station assessment framework while developing a congestion analysis followed by optimal sizing and environmental analysis. The main contributions of this article are given in the next section.

Novelty and Contribution

This research demonstrates the importance of the spot congestion challenge for densely penetrated electric vehicles and its impact on charging station sizing and grid power requirements. The main contributions of this article are
  • A comprehensive techno-economic integrated assessment framework of battery-swappable charging stations that is dependent on the dynamic parameters that influence the penetration rate.
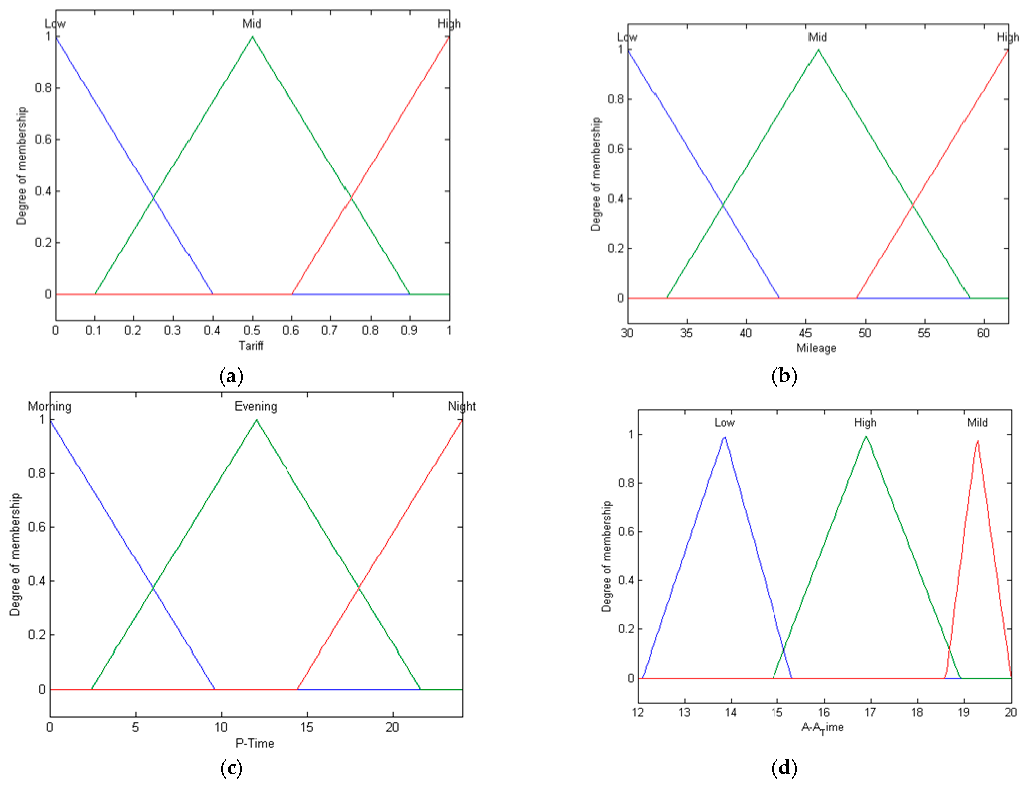
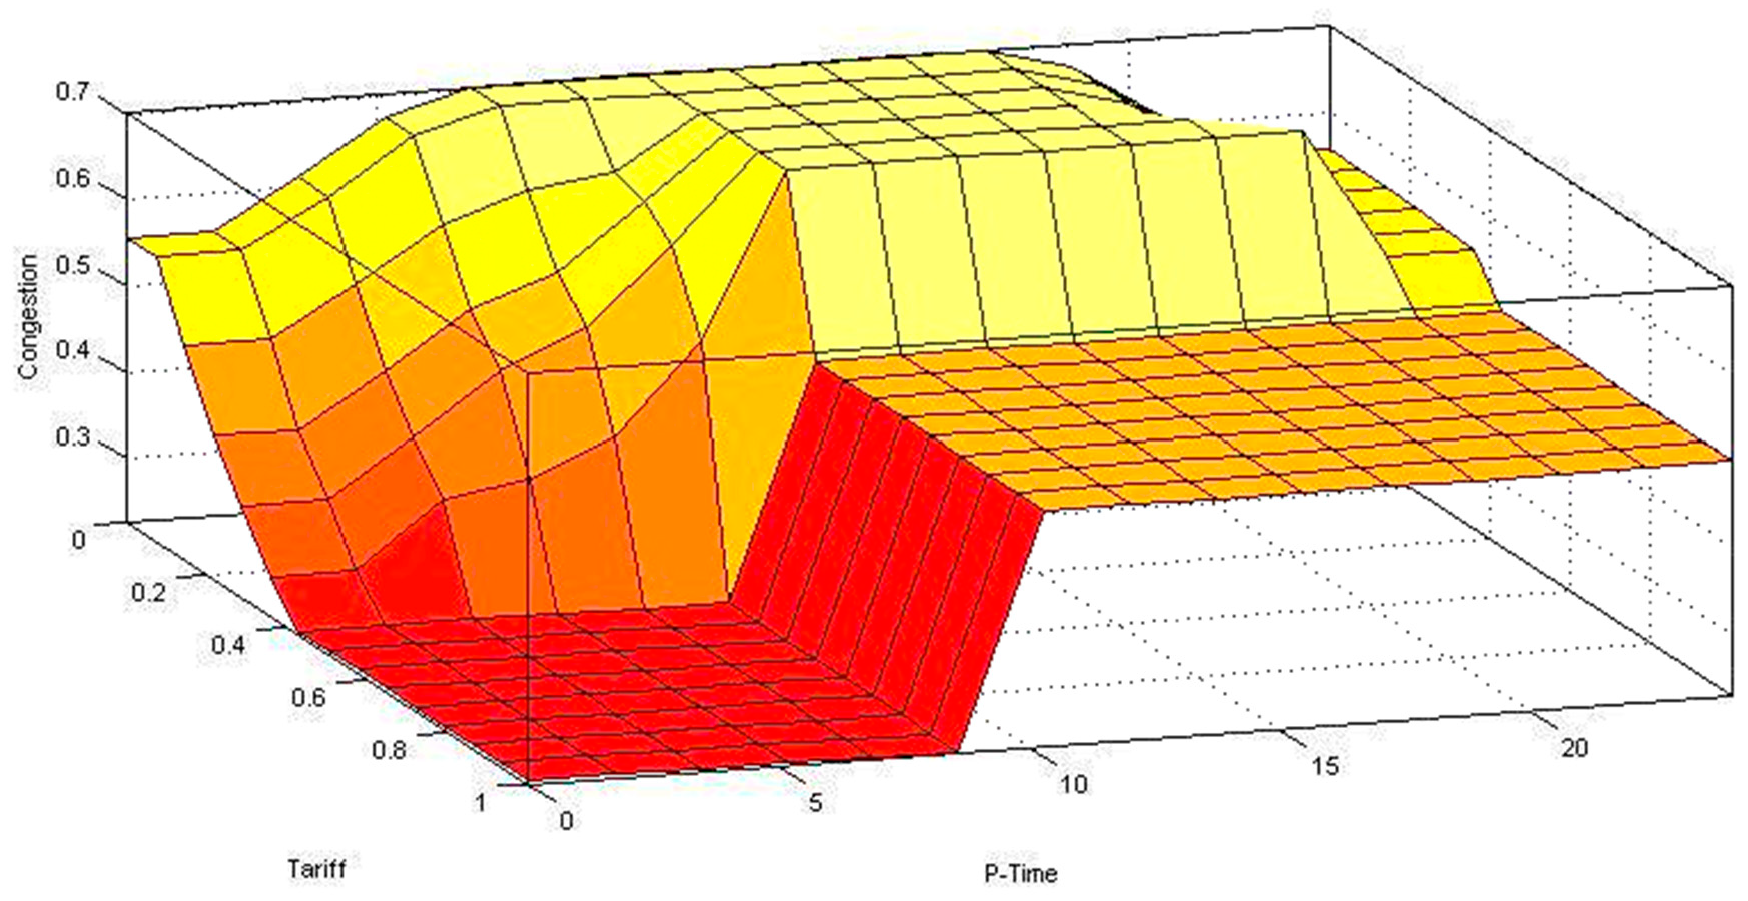
  • The design of a novel time-based spot congestion analysis tool using a fuzzy-based approach to analyze the impact of multi-dimensional parameters on charging station congestion.
  • Mixed integer linear programming-based optimal sizing of hybrid charging stations based on the spot congestion.
  • Environmental analysis based on spot congestion and subsequent optimal sizing of a battery-swappable charging station.

3. Materials and Methods
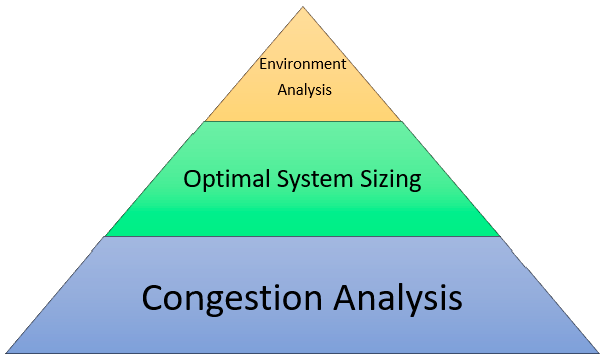
3.1. Methodology

A bottom-up approach is shown in Figure 1. In this proposed study, a multi-layered comparative analysis is performed using appropriate tools and techniques. There are three main layers of comparison. The economic sizing layer is for distributed generation and gird, the environment analysis layer is for estimating emissions, and the congestion analysis layer is for identifying spot congestion using the social demographics of EV owners. Figure 1 shows the layered operation.

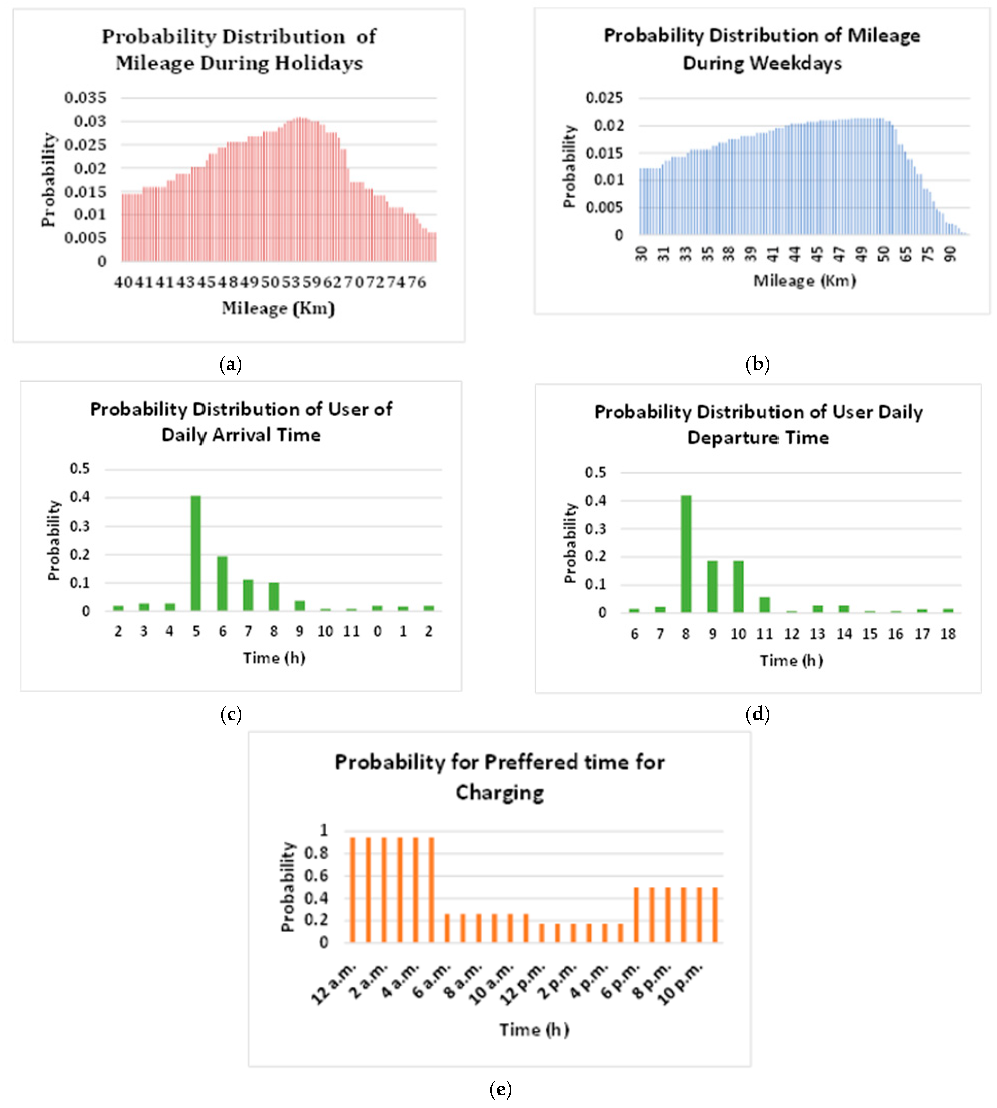
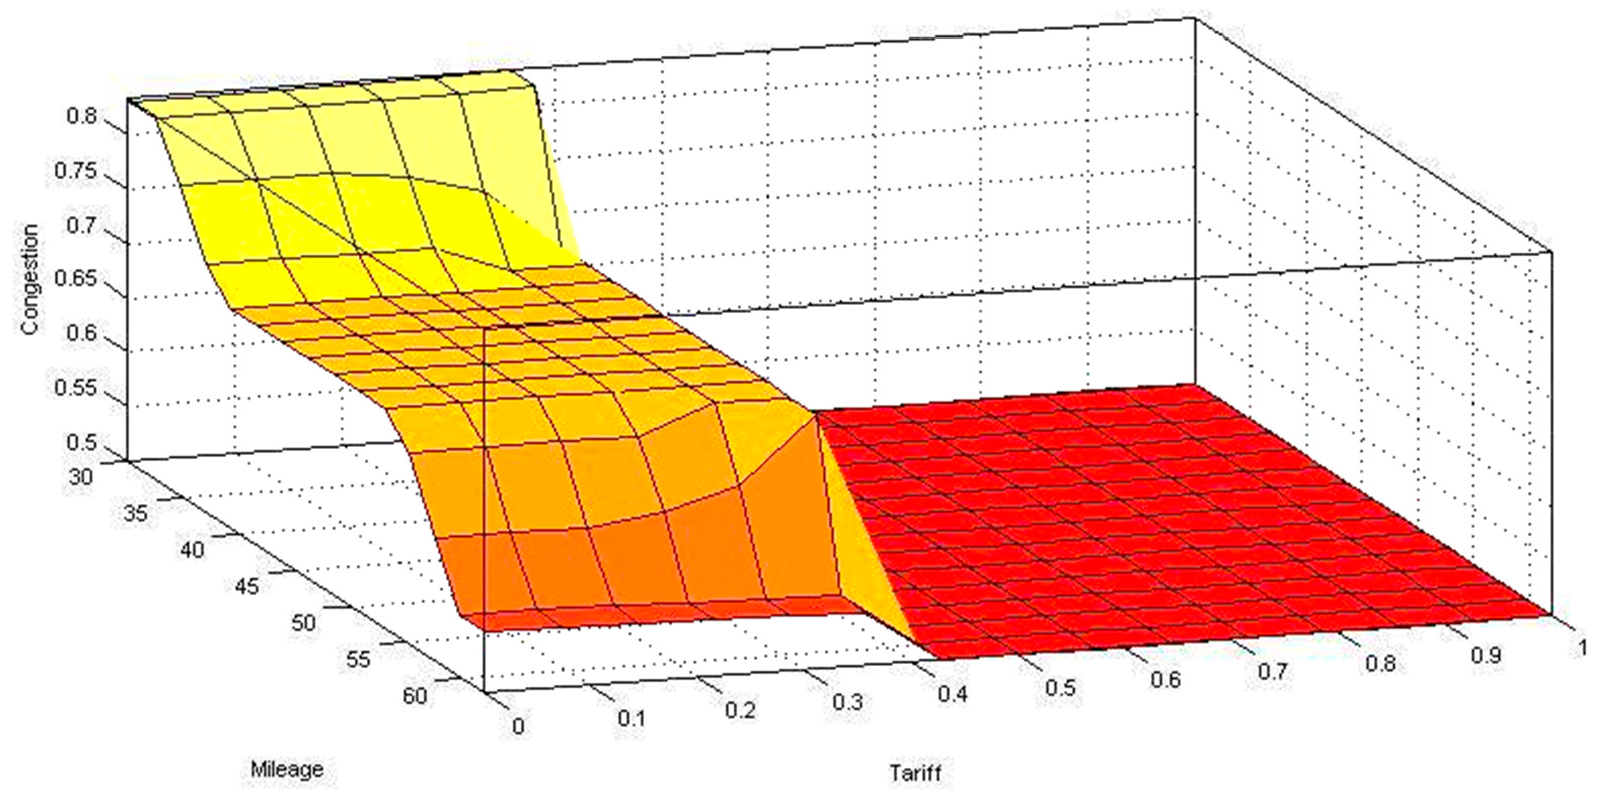
3.2. Congestion Analysis for Fast Charging Stations

A charging spot congestion analysis is essential to estimate the exact times of congestion. For spot congestion, an appropriate understanding of the demographics of EV owners is necessary. In this research, interviews were conducted to assess the various factors that may affect spot charging congestion, and factors such as departure and arrival times of the users, travel mileage during weekdays and weekends, and preferred time for charging vehicles were recorded. The Nissan Leaf was considered a generic car for battery swapping. The PDF for the discussed responses was developed to estimate the probability distributions of various attributes within the recorded factors. It can be seen in Figure 2 that the probability distribution for mileage during the weekdays shows the span of 50 to 65 km traveling at peak levels, which gradually reduces to 30 km. Similarly, the weekends have slightly lower peak driving mileages starting from 53 and spanning over 62 km. The arrival and departure time probabilities can be seen in Figure 2.
It is worth noting that the developed PDFs provide a picture of the intrinsic characteristics of the specific factors such as arrival or departure time, which reflect when the charging stations will be over-occupied and at what times the occupation would be low. However, integrating all the factors to estimate spot congestion is very difficult since every factor has its own intrinsic dynamic characteristics whose probability varies over a given range. A fuzzy logic technique was used to analyze spot congestion while taking the PDF ranges as input variable membership functions to analyze the level of congestion as output. The membership functions, as shown in Figure 3, of the input variables are based on the developed probability normal distribution functions shown in Equations (1) and (2).
f x = d F ( x ) d x
F x = P a x b = a b f x d x
The fuzzy membership functions are based on Equations (3)–(5). We consider E as a set having a real number. A fuzzy subset including T, M, and P of E is a set of ordered pairs. Here, μ represents the membership function of subsets T, M, and P with E → [0, 1] [26], where T represents travel time, M represents milage, and P represents peak time. The rest of the membership functions can be modeled using the same set of equations.
T ~ = X , μ L X x , X , μ M X x , X , μ H X x E
M ~ = X , μ L X x , X , μ M X x , X , μ H X x E
P ~ = X , μ M X x , X , μ A X x , X , μ E X x E
To analyze spot congestion in response to the multi-dimensional parameters, surface graphs were analyzed against the developed fuzzy rules. The fuzzy rules were developed based on the demographics of EV owners’ driving and sub-sequent PDFs. To effectively analyze two multi-dimensional factors and their impact on congestion, simulations were performed using MATLAB Simulink.

3.2.1. Tariff Rates and Preferred Time for Battery Swapping

It is observed from the surface plot in Figure 4 that tariff has a significant impact on congestion. The low tariff rates are mostly not at the preferable time, but having low tariff rates can still cause higher congestion. The plot reveals that preferred time has an impact on congestion, but congestion is mild even during the preferred time when tariff rates are higher. On their other hand, when tariff rates are lower, the congestion plot rises even during the less preferred time for charging.

3.2.2. Tariff Rates and Mileage

In Figure 5, the tariff and mileage factors are assessed to observe the impact on congestion. Higher tariff rates have a very low impact on congestion even if the traveling mileage is higher, and with low tariff rates, the congestion is high even if the travel mileage is very low. This shows that there is no significant impact of traveling mileage on spot congestion.

3.2.3. Departure Time and State of the Charge of the Vehicle

Figure 6 shows the departure time and SoC input variables to assess the impact on congestion. The SoC has no significant impact on the congestion during the departure time. There is nearly a flat surface when the SoC is 100% and an unusual departure time that slowly increases as the SoC decreases and reaches a peak when the SoC is very low. This shows that spot congestion is expected from 8 to 10 a.m. when SoC is very low. However, this situation barely happens as most of the cars are charged during the night and early morning, and chances for spot congestion are lower.

3.2.4. Arrival Time and State of the Charge of the Vehicle

Upon arrival, the users will replace their batteries with charged ones and will leave the uncharged batteries for charging at night, thus burdening the night operation of the BSCS, as shown in Figure 7.
In a nutshell, the SoC of the storage is the main driving force behind spot congestion on BSCSs with the mutual impact of departure time. The arrival time and SoC are two major interdependent factors for spot congestion including tariffs. However, the mileage contributes least to spot congestion and preferred time mildly contributes when tariffs are high. During low tariff rates, the preferred time factor is also found to be effective for spot congestion.

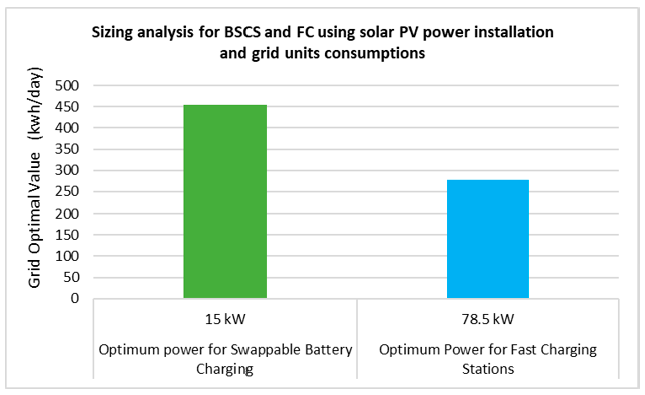
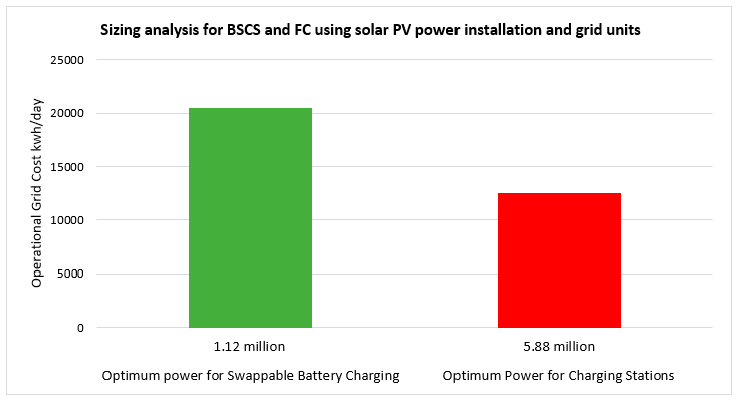
3.3. Economic Sizing

Based on the spot congestion analysis, arrival time has the highest congestion, which means that during night hours, spot congestion may occur. However, during night hours, there is no solar power available. To address this, day and night optimization is required. Economic sizing of battery-swappable charging stations is performed using mixed integer linear programming with a set of constraints and objective functions. As analyzed in the fuzzy spot congestion, maximum power consumption from swappable battery charging is expected during night hours. Due to night-hour consumption, there is a need for renewable power to be incorporated for utilization during the daytime to reduce the stress on the grid over 24 h. For the day–night operation, there are three major components of economic sizing for battery-swappable charging stations, i.e., solar power, batteries, and the grid system.
The overall cost of solar PV power includes.
P V c o s t = P V c a p + P V O M
P V O M includes P V O M = P c l , where P c l is the cleaning cost and it is approximately 5 PKR/kW (in USD).
P V c a p = P V m + P V w + P V i + P V h r
where P V c a p is the capital cost of the PV power installation and P V O M is the operation and maintenance cost of the PV plant. P V c a p of the solar PV further includes P V m , P V w , and P V i , which are mounting structure cost, wiring cost of the PV system, and installation cost of the PV system, respectively.
The factors to be incorporated in the capital cost of a battery-swappable charging station involve:
C B S = C c + O c + B r
where C B S is the cost of battery swapping, C c is the capital cost, O c is the operational cost, and B r is the battery replacement cost. The capital cost involves:
C c = C P V + C e + B c
The capital cost for fast charging equipment can be found using Equation (10)
C c = C P V + C e
where C c ,     C P V ,   C e ,   a n d   B c are the capital cost, the cost of a solar PV, the cost of charging equipment, and the battery cost, respectively. The operational cost can be found using Equation (11)
COE = C a n n , t   E a n n , t + E g r i d s a l e s
where E a n n , t = total energy (kWh/yr) consumed and E g r i d s a l e s is total grid sales (kWh/yr).
In the case of no PV power, the battery charging to be supported by the grid over the span of time of one hour is as given below:
P g r i d = 0 n B C
where n is the number of hours of continuous operation of battery charging using the grid during the arrival time, which is at night. C g r i d is the cost of the grid power in kwh, which depends on the time of use. The best-suited time for using the grid power is during off-peak hours. The grid power can be divided into two parts: C g r i d = Cgrid m i n and C g r i d = Cgrid m a x .
Where Cgrid m i n is the minimum cost of the grid, while Cgrid m a x is the cost of the grid at the peak
C g r i d = C g r i d   m i n ,     c ( g r i d ) < 21   Rs / kwh C g r i d   m a x ,     c ( g r i d ) 30   Rs / kwh
The higher the price, the higher the cost of operation of the system.

3.4. Optimal Capital and Operational Cost for Battery-Swappable Charging Stations

The optimal capital and operational cost of the battery-swappable charging station is found using linear programming using the objective functions and set of constraints.

3.4.1. Objective Function

The optimal cost objective function was evaluated using linear programming. The objective function reduces the overall cost for 24 h based on the day and night operation of the system with minimum power requirements. During the daytime, the objective is to optimally select solar PV power requirements with minimum grid involvement. During the nighttime, the optimum grid power is used under given constraints. The overall objective is to minimize the cost of solar PV installations and grid operation costs. Z is the overall cost of the day and night operations, where Zd refers to the day operation and Zn refers to night operation.
Zmin = Zd+Zn
Zd = PV + Grid − Load
Zn = PV + Grid − Load
Equations (15) and (16) show that the power of PV and grid should not be less than the required load for both the day and night conditions.
PV = power of the solar PV.
Grid = power of the grid.
Load = consumption power.

3.4.2. Constraints for Zd

For the day constraints, the grid power should not be more than the power available from PV, whereas PV power should be selected between the maximum and minimum loads as per the given ranges.
Grid < PV
25 < PV < 50

3.4.3. Constraints for Zn

As per the revealed PDFs, most of the vehicles will swap batteries at night while leaving discharged batteries at charging stations for charging. The burden on the charging station therefore increases during the nighttime, forcing it to charge batteries during night hours. This will increase the utilization of the grid power. During the nighttime, when solar PV is not available, the grid should supply power more to fulfill the required charging. To limit the load, the constraints in Equation (20) show that 75% of the battery charging runs during the nighttime, whereas the total PV during the night is 0, as shown in Equation (21).
Grid > Load
Load < 0.75
PV = 0

3.5. Environmental Analysis

The emission factors involved in the development of electric vehicle parts and battery manufacturing can be calculated as:
E m = E b m + E c m
where E m is the total manufacturing emissions and E b m   and   E c m are the manufacturing emissions from the batteries and electric vehicles. The battery emissions are 15–35% of the total manufacturing emissions [31,32].
E 2 = E e l e c t r i c i t y   + F e l e c t r i c i t y  
where electricity is the Eelectricity transferred from the outside and Felectricity is the emission factor of the regional power grid [30].
For the environmental comparison of CO2 mitigation while using production with renewable energy resources, the avoided emissions can be calculated as [33]:
M i t C O 2 = E g × F e
where M i t C O 2 is the mitigation of CO2, E g is the annual electricity production using renewable energy, and F e is the emission factor. The emission factor is taken as 389 tCO2/GWh [33].

4. Results and Discussion

Based on the fuzzy tool observations, nighttime congestion is always expected because the arrival time and SoC parameters have a higher impact on congestion. The arrival times are during the night hours as per the interviews, which is why nighttime congestion is expected at BSCSs. For nighttime congestion, the charging station sizing was formulated using mixed integer linear programming. The congestion results and subsequent sizing of the BSCSs are directly influenced by grid unit purchases and environmental impacts. In this section, the results of the battery purchases, the capital cost of the sizing of BSCSs, and the environmental impacts are summarized. Further, for a realistic comparison, the results of the battery-swappable charging stations are techno-economically compared with fast-charging stations. Figure 8 shows the sizing values for battery-swapping and fast-charging stations. It is assumed that both charging options are 50 kW power and at most 100 cars are accommodated at both charging stations. The Nissan Leaf is considered a generic car for a battery-swapping solar PV system, and the sizing for battery-swappable charging stations is 15 kW with 455 kWh grid purchases every day. The reason for low solar PV sizing and higher grid purchasing is that, as per the PDFs of arrival and departure times, solar PV power is not available at the peak time, whereas the grid is mostly utilized at that time, especially during arrival times. On the other hand, fast charging stations are available in offices as well, where the consumer can charge their car. A total of 277 grid units for FCS were found using HOMER Grid software (https://www.homerenergy.com/products/grid/index.html).
The cost analysis is shown in Figure 9. The capital cost for the battery-swappable charging station using solar PV systems was found to be 1.12 million at the cost of 75 PKR/kW of solar PV using the cost factors of Equations (1) and (2). The operational cost of grid per day for battery-swappable charging stations was found to be 20,475, whereas for fast-charging stations, it was found to be 12,465 kWh/day.
Table 1 shows the annual production from solar PV for BSCSs and FC stations. The annual production of BSCSs is less because fewer solar PV plants are installed compared with FC stations. Furthermore, the annual grid requirements for BSCSs are higher because of nighttime operation based on the congestion event analysis using the fuzzy logic tool. As grid utilization of BSCSs is higher, the CO2 emissions are higher, and there is less mitigation of CO2 compared with FC stations, as shown in Table 1. Table 2 provides a comparative techno-economic assessment for BSCSs and FC stations. The capital cost of FC stations is 80% greater than BSCSs integrated with solar PV systems. The operational cost of BS charging stations is 39% higher than FC stations as they use 29% higher grid units than FC stations due to night operations under congestion. The reason is an 80.9% lower solar PV system installation than FC stations. The emission mitigation is 65% > in FCSs than in BSCSs. The spot congestion analysis validates the lower installation of solar PV at BSCSs because, as per the PDFs developed and associated fuzzy surface congestion plots, during the arrival of users, drained batteries will be replaced with charged ones, causing a burden on BSCSs to charge batteries during night hours. Since at night, there is no solar PV available, this will reduce PV sizing and enhance the grid unit consumption.

5. Conclusions

This study develops an assessment framework for BSCSs using a novel fuzzy-based congestion analysis tool followed by optimal sizing and environment analysis. This study concludes that the tariff rate, arrival time, and SoC are the influencing parameters that individually and interdependently affect the occurrence of congestion events at BSCSs. The results achieved using the proposed framework for BSCSs were compared with the fast-charging stations technique having no congestion analysis. This paper concludes that BSCSs are good as far as capital cost is concerned. BSCSs are equally good for environmentally friendly operation, whereas congestion can be controlled by setting tariff rates, proper scheduling of EVs, and a distributed approach to installing BSCSs. The current research can be further extended to analyze the optimal location of battery-swappable charging stations in the context of peak charging times so as to reduce spot congestion. Furthermore, parametric factors used in fuzzy analysis can be enhanced; for example, the driving demographics of cabs may be added to find their peak charging times to further decrease the load on charging stations.

Author Contributions

Conceptualization, F.A.; methodology, F.A. and T.M.; software, F.A. and B.I.; validation, H.A.Z.; formal analysis, M.I.H.; investigation, M.I.H.; resources, M.I.H.; data curation, F.A.; writing—F.A.; writing—review and editing, F.A., H.A.Z. and T.M.; visualization, B.I.; supervision, G.B.N.; project administration, M.I.H.; funding acquisition, M.I.H. All authors have read and agreed to the published version of the manuscript.

Funding

This research received no external funding.

Institutional Review Board Statement

Not applicable.

Informed Consent Statement

Not applicable.

Data Availability Statement

Data are contained within the article.

Acknowledgments

Authors are thankful to the HEC-NRPU project 10640 for their valuable contribution and support related to batteries performance in general as well as its suitability in the context for swappable charging stations. Authors are also thankful to the graduate student (Aizz Mohy Uddin) for conducting survey on Electric vehicles demographics in Pakistan under supervision of Fawad Azeem.

Conflicts of Interest

The authors declare no conflict of interest. The funders had no role in the design of this study; in the collection, analyses, or interpretation of data; in the writing of this manuscript, or in the decision to publish the results.

References

  1. Cui, D.; Wang, Z.; Liu, P.; Wang, S.; Dorrell, D.G.; Li, X.; Zhan, W. Operation optimization approaches of electric vehicle battery swapping and charging station: A literature review. Energy 2022, 263, 126095. [Google Scholar] [CrossRef]
  2. Coban, H.H.; Lewicki, W.; Sendek-Matysiak, E.; Łosiewicz, Z.; Drożdż, W.; Miśkiewicz, R. Electric Vehicles and Vehicle–Grid Interaction in the Turkish Electricity System. Energies 2022, 15, 8218. [Google Scholar] [CrossRef]
  3. Saadati, R.; Saebi, J.; Jafari-Nokandi, M. Effect of uncertainties on siting and sizing of charging stations and renewable energy resources: A modified capacitated flow-refueling location model. Sustain. Energy Grids Netw. 2022, 31, 100759. [Google Scholar] [CrossRef]
  4. Alrubaie, A.J.; Salem, M.; Yahya, K.; Mohamed, M.; Kamarol, M. A comprehensive review of electric vehicle charging stations with solar photovoltaic system considering market, technical requirements, network implications, and future challenges. Sustainability 2023, 15, 8122. [Google Scholar] [CrossRef]
  5. Zhang, J.; Wang, S.; Zhang, C.; Luo, F.; Dong, Z.Y.; Li, Y. Planning of electric vehicle charging stations and distribution system with highly renewable penetrations. IET Electr. Syst. Transp. 2021, 11, 256–268. [Google Scholar] [CrossRef]
  6. Sun, B.; Sun, X.; Tsang, D.H.; Whitt, W. Optimal battery purchasing and charging strategy at electric vehicle battery swap stations. Eur. J. Oper. Res. 2019, 279, 524–539. [Google Scholar] [CrossRef]
  7. Wu, H.; Pang GK, H.; Choy, K.L.; Lam, H.Y. A charging-scheme decision model for electric vehicle battery swapping station using varied population evolutionary algorithms. Appl. Soft Comput. 2017, 61, 905–920. [Google Scholar] [CrossRef]
  8. Zhang, L.; Zhou, S.; An, J.; Kang, Q. Demand-side management optimization in electric vehicles battery swapping service. IEEE Access 2019, 7, 95225–95232. [Google Scholar] [CrossRef]
  9. Infante, W.; Ma, J.; Han, X.; Liebman, A. Optimal recourse strategy for battery swapping stations considering electric vehicle uncertainty. IEEE Trans. Intell. Transp. Syst. 2019, 21, 1369–1379. [Google Scholar] [CrossRef]
  10. You, P.; Pang, J.Z.; Low, S.H. Online station assignment for electric vehicle battery swapping. IEEE Trans. Intell. Transp. Syst. 2020, 23, 3256–3267. [Google Scholar] [CrossRef]
  11. Wang, H.; Ma, H.; Liu, C.; Wang, W. Optimal scheduling of electric vehicles charging in battery swapping station considering wind-photovoltaic accommodation. Electr. Power Syst. Res. 2021, 199, 107451. [Google Scholar] [CrossRef]
  12. Yan, J.; Menghwar, M.; Asghar, E.; Panjwani, M.K.; Liu, Y. Real-time energy management for a smart-community microgrid with battery swapping and renewables. Appl. Energy 2019, 238, 180–194. [Google Scholar] [CrossRef]
  13. Ban, M.; Zhang, Z.; Li, C.; Li, Z.; Liu, Y. Optimal scheduling for electric vehicle battery swapping-charging system based on nanogrids. Int. J. Electr. Power Energy Syst. 2021, 130, 106967. [Google Scholar] [CrossRef]
  14. Quddus, M.A.; Kabli, M.; Marufuzzaman, M. Modeling electric vehicle charging station expansion with an integration of renewable energy and Vehicle-to-Grid sources. Transp. Res. Part E Logist. Transp. Rev. 2019, 128, 251–279. [Google Scholar] [CrossRef]
  15. Jordehi, A.R.; Javadi, M.S.; Catalão, J.P. Optimal placement of battery swap stations in microgrids with micro pumped hydro storage systems, photovoltaic, wind and geothermal distributed generators. Int. J. Electr. Power Energy Syst. 2021, 125, 106483. [Google Scholar] [CrossRef]
  16. Hamidi, A.; Weber, L.; Nasiri, A. EV charging station integrating renewable energy and second-life battery. In Proceedings of the 2013 International Conference on Renewable Energy Research and Applications (ICRERA), Madrid, Spain, 20–23 October 2013; pp. 1217–1221. [Google Scholar]
  17. Jamian, J.J.; Mustafa, M.W.; Mokhlis, H.; Baharudin, M.A. Simulation study on optimal placement and sizing of Battery Switching Station units using Artificial Bee Colony algorithm. Int. J. Electr. Power Energy Syst. 2014, 55, 592–601. [Google Scholar] [CrossRef]
  18. Sultana, U.; Khairuddin, A.B.; Sultana, B.; Rasheed, N.; Qazi, S.H.; Malik, N.R. Placement and sizing of multiple distributed generation and battery swapping stations using grasshopper optimizer algorithm. Energy 2018, 165, 408–421. [Google Scholar] [CrossRef]
  19. Liu, W.; Niu, S.; Xu, H.; Li, X. A New Method to Plan the Capacity and Location of Battery Swapping Station for Electric Vehicle Considering Demand Side Management. Sustainability 2016, 8, 557. [Google Scholar] [CrossRef]
  20. Celli, G.; Ghiani, E.; Mocci, S.; Pilo, F. A Multiobjective Evolutionary Algorithm for the Sizing and Siting of Distributed Generation. IEEE Trans. Power Syst. 2005, 20, 750–757. [Google Scholar] [CrossRef]
  21. Ban, M.; Yu, J.; Shahidehpour, M.; Guo, D. Optimal sizing of PV and battery-based energy storage in an off-grid nanogrid supplying batteries to a battery swapping station. J. Mod. Power Syst. Clean Energy 2019, 7, 309–320. [Google Scholar] [CrossRef]
  22. Ban, M.; Shahidehpour, M.; Yu, J.; Li, Z. A Cyber-Physical Energy Management System for Optimal Sizing and Operation of Networked Nanogrids with Battery Swapping Stations. IEEE Trans. Sustain. Energy 2019, 10, 491–502. [Google Scholar] [CrossRef]
  23. Zhang, J.; Bai, L.; Jin, T. Joint planning for battery swap and supercharging networks with priority service queues. Int. J. Prod. Econ. 2021, 233, 108009. [Google Scholar] [CrossRef]
  24. Garcia-Guarin, J.; Infante, W.; Ma, J.; Alvarez, D.; Rivera, S. Optimal scheduling of smart microgrids considering electric vehicle battery swapping stations. Int. J. Electr. Comput. Eng. 2020, 10, 5093. [Google Scholar]
  25. Khalid, M.; Ahmad, F.; Panigrahi, B.K.; Rahman, H. A capacity efficient power distribution network supported by battery swapping station. Int. J. Energy Res. 2022, 46, 4879–4894. [Google Scholar] [CrossRef]
  26. Kang, Q.; Wang, J.; Zhou, M.; Ammari, A.C. Centralized charging strategy and scheduling algorithm for electric vehicles under a battery swapping scenario. IEEE Trans. Intell. Transp. Syst. 2015, 17, 659–669. [Google Scholar] [CrossRef]
  27. Revankar, S.R.; Kalkhambkar, V.N.; Gupta, P.P.; Kumbhar, G.B. Kumbhar. Economic Operation Scheduling of Microgrid Integrated with Battery Swapping Station. Arab. J. Sci. Eng. 2022, 47, 13979–13993. [Google Scholar] [CrossRef]
  28. Zhang, F.; Yao, S.; Zeng, X.; Yang, P.; Zhao, Z.; Lai, C.S.; Lai, L.L. Operation Strategy for Electric Vehicle Battery Swap Station Cluster Participating in Frequency Regulation Service. Processes 2021, 9, 1513. [Google Scholar] [CrossRef]
  29. Zhan, W.; Wang, Z.; Zhang, L.; Liu, P.; Cui, D.; Dorrell, D.G. A review of siting, sizing, optimal scheduling, and cost-benefit analysis for battery swapping stations. Energy 2022, 258, 124723. [Google Scholar] [CrossRef]
  30. Ferrer-Comalat, J.C.; Linares-Mustarós, S.; Rigall-Torrent, R. Incorporating Fuzzy Logic in Harrod’s Economic Growth Model. Mathematics 2021, 9, 2194. [Google Scholar] [CrossRef]
  31. Chiluwal, S.; Rao, A.M.; Podila, R. Strategies for improving rechargeable lithium-ion batteries: From active materials to CO2 emissions. Nanotechnol. Rev. 2021, 10, 1993–2026. [Google Scholar] [CrossRef]
  32. Praveenkumar, S.; Agyekum, E.B.; Kumar, A.; Ampah, J.D.; Afrane, S.; Amjad, F.; Velkin, V.I. Techno-Economics and the Identification of Environmental Barriers to the Development of Concentrated Solar Thermal Power Plants in India. Appl. Sci. 2022, 12, 10400. [Google Scholar] [CrossRef]
  33. Available online: https://www.irena.org/IRENADocuments/Statistical_Profiles/Asia/Pakistan_Asia_RE_SP.pdf (accessed on 1 June 2023).
Figure 1. A bottom-up layered approach for comparative analysis between FS and BSCS.
Sustainability 15 16153 g001
Figure 2. Probability distributions for various parameters including (a) mileage during holidays, (b) mileage during weekdays, (c) arrival time, (d) departure time, and (e) preferred time for charging.
Sustainability 15 16153 g002
Figure 3. Membership function plots for control parameters of fuzzy decision tool (a) is the tariff input parameter, (b) is mileage, (c) is p time (d) is arrival time (e) is state of the charge and (f) is departure time.
Sustainability 15 16153 g003aSustainability 15 16153 g003b
Figure 4. Surface plot of tariff and preferred time.
Sustainability 15 16153 g004
Figure 5. Surface plots for the congestion analysis using peak time, tariff, and mileage factors.
Sustainability 15 16153 g005
Figure 6. Surface plots for the congestion analysis of a BSCS using arrival time, SoC, and departure time factors.
Sustainability 15 16153 g006
Figure 7. Surface plots for the congestion analysis of a BSCS using arrival time, SoC, and departure time factors.
Sustainability 15 16153 g007
Figure 8. Sizing analysis for BSCSs and FC stations using solar PV power installation and grid unit consumption.
Sustainability 15 16153 g008
Figure 9. Cost analysis for BSCSs and FC stations.
Sustainability 15 16153 g009
Table 1. Emissions analysis for BSCS and FC.
Emissions AnalysisOptimum Power for Swappable Battery ChargingOptimum Power for Charging Stations
Charging type 50 kW50 kW
Solar PV15 kW78.5 kW
Annual production of solar power GWh0.04320.126
Annual grid production (Gwh)0.170.12
Annual CO2 emissions from grid
(kg CO2/Yr)
2,791,152102,102
Mitigation of CO2 t/GWh16.804849.014
Cost of charging station for solar PV @ 100 Rs/Watt (PKR one million)1.57.8
Annual grid production @ 30 Rs/kWh
(PKR one million)
170120
Table 2. Comparative assessment between BSCSs and FCSs under economic, environment, sizing, and congestion analysis.
FactorsBattery-Swappable Charging StationsFast Charging StationsPercentage Difference Fast Charging StationBSCSFCS
Capacity 50 kW50 kW--
Capital cost1.125.8880.95% > BSCSx
Operational cost7.47 4.54 39% < BSCSx
Annual grid units consumed0.170.1229% < BSCSx
Solar PV installation capacity1578.580.89% > BSCSx
Carbon mitigation16.804849.01465% > BSCSx
Disclaimer/Publisher’s Note: The statements, opinions and data contained in all publications are solely those of the individual author(s) and contributor(s) and not of MDPI and/or the editor(s). MDPI and/or the editor(s) disclaim responsibility for any injury to people or property resulting from any ideas, methods, instructions or products referred to in the content.

