Article

Lifecycle Assessment of Two Urban Water Treatment Plants of Pakistan

1
Earthworks, Calgary, AB T3P 1B9, Canada
2
Department of Environmental Engineering, University of Engineering and Technology, Taxila 47050, Pakistan
3
Department of Earth and Environmental Sciences, Bahria University, Islamabad 44000, Pakistan
4
Department of Microbiology, Quaid-i-Azam University, Islamabad 44100, Pakistan
5
Department of Biological Sciences, Muslim Youth University, Islamabad 44310, Pakistan
6
Department of Chemistry and Biology, Toronto Metropolitan University, Toronto, ON M5B 0C3, Canada
*
Authors to whom correspondence should be addressed.
Sustainability 2023, 15(23), 16172; https://doi.org/10.3390/su152316172
Submission received: 6 October 2023 / Revised: 7 November 2023 / Accepted: 16 November 2023 / Published: 21 November 2023
(This article belongs to the Special Issue Life Cycle Assessment as an Environmental Sustainability Tool)

Abstract

:
Water treatment technologies are striving to retain their ecological and economic viability despite the rising demand, conventional infrastructure, financial constraints, fluctuating climatic patterns, and highly stringent regulations. This study evaluates the lifecycle environmental impact of urban water treatment systems within the two densely populated South Asian municipalities of Islamabad and Rawalpindi, Pakistan. The scope of this study includes a process-based Life Cycle Assessment (LCA) of the entire water treatment system, particularly the resources and materials consumed during the operation of the treatment plant. The individual and cumulative environmental impact was assessed based on the treatment system data and an in-depth lifecycle inventory analysis. Other than the direct emissions to the environment, the electricity used for service and distribution pumping, coagulant use for floc formation, chlorine gas used for disinfection, and caustic soda used for pH stabilization were the processes identified as the most significant sources of emissions to air and water. The water distribution consumed up to 98% of energy resources. The highest global warming impacts (from 0.3 to 0.6 kg CO2 eq./m3) were assessed as being from the coagulation and distribution processes due to extensive electricity consumption. Direct discharge of the wash and wastewater to the open environment contributed approximately 0.08% of kg-N and 0.002% of kg-P to the eutrophication potential. The outcome of this study resulted in a thorough lifecycle inventory development, including possible alternatives to enhance system sustainability. A definite gap was identified in intermittent sampling at the treatment systems. However, more stringent sampling including the emissions to air can provide a better sustainability score for each unit process.

1. Introduction

Water and wastewater treatment facilities are among the primary contributors to greenhouse emissions, leading to environmental deterioration and global climate change [1]. This is primarily due to the heavy reliance of water utilities on the energy sector in addition to their extensive chemical usage [2]. In the U.S. alone, an estimated 45 million tons of greenhouse gases (GHGs) are emitted annually from the energy used for water and wastewater treatment [3]. The need to evaluate the environmental impact of water treatment systems is driven by multiple challenges, particularly the regulatory criteria, present infrastructure condition, population growth, and financial constraints [4,5]. Rothausen and colleagues highlighted that wastewater treatment plants are a prominent contributor to GHG emissions as compared to water treatment plants; however, recently, more stringent environmental regulations are being applied to water treatment systems globally [6,7]. The major types of GHGs produced from water and wastewater treatment systems include CO2, CH4, and N2O [8].
Quantifying environmental emissions other than just greenhouse gases is also crucial for formulating recommendations for the implementation of modern and sustainable water and wastewater treatment approaches. Other emissions, particularly, include contaminant loadings to water and waste disposal to land. Numerous research studies have explored innovative treatment technologies to achieve sustainable water quality [1]. For instance, nanotechnology-enabled systems have reported a high efficiency and reduced resource use [9], while magnetic separation is recognized as an eco-friendly alternative [10]. Membrane technology, as discussed by Issaoui and colleagues, provides a sustainable water treatment option [11]. Each of these alternatives has varying GHG emissions. Although extensive research has been conducted on emissions from wastewater treatment plants [12,13,14], there is a significant gap in research concerning emissions from water treatment plants.
When considering reducing emissions and improving the water quality from water treatment systems [5,15,16], it becomes evident that measuring the environmental impacts of the service would allow for the development of a sustainable plan. Environmental assessment methods such as economic and energy analysis, Environmental Impact Assessment (EIA), and Net Environmental Benefit Analysis (NEBA) [17] play a significant role in facilitating decision-making towards more environmentally and economically sustainable operations. However, in order to achieve sustainability goals across the entire lifecycle of a system, a method capable of evaluating the environmental impact at all of the stages of the process is highly desirable. To accomplish this, the preferred method for modelling environmental sustainability is the Life Cycle Assessment (LCA).
The ISO defines Life Cycle Assessment (LCA) as a well-established methodology for quantifying the environmental impact of products or processes throughout their lifecycle [18,19]. Additionally, LCA can be employed to assess the environmental effects of individual unit processes [20]. The proper implementation of LCA facilitates the transition to alternative technologies and the advancement of technologies with a superior environmental performance and sustainability [21].
Regardless of the chosen methodology for evaluating the sustainability of water treatment systems, it is widely observed that a substantial portion of the economic and environmental burden arises from electricity and chemical consumption during plant operation [1,22,23]. The estimated electricity demand for producing 1 m3 of treated water typically ranges from 0.26 kWh to 0.64 kWh [14,22]. In terms of scale, this consumption is comparable to sustaining a hospital bed continuously for 24 h, 7 days a week, depending on the plant’s flow capacity [24]. Following electricity, the utilization of chemicals emerges as a prominent concern [1,25,26], imposing environmental and economic constraints on sustainable water treatment systems. Notably, discussions on the direct emissions from water treatment processes are sparse in the existing literature, with only a few studies addressing this aspect [1,27]. This scarcity is primarily attributed to the limited availability of direct emissions data collected from water treatment plants.
The primary aim of this study was to conduct a comprehensive sustainability analysis of the treatment processes designed to meet the water quality standards for human consumption. The LCA method was selected as the most appropriate environmental sustainability assessment framework for analysis of the processes involved in water treatment. Although researchers have underscored specific drawbacks of the LCA method, such as the need for extensive data collection and the requirement to incorporate detailed unit process information for the study systems [1,5], it remains an effective method for quantifying environmental impacts along respective pathways [28]. Typical emission pathways for water treatment plants are listed in Table S1 [1]. Moreover, given that the LCA framework is structured to assess environmental effects from the initial extraction of raw materials from the earth to the point of their return, the anticipated outcomes can offer a comprehensive evaluation of plant performance and sustainability rating [29].
This study’s novelty lies in the utilization of the LCA method to evaluate drinking water systems in Pakistan and the assembly of the necessary dataset to evaluate the life cycle environmental impact from both of the analyzed systems. Notwithstanding the abundance of studies covering comparable subjects [16,30,31,32,33], this research stands out for applying the LCA method, and employing a thorough inventory analysis of both foreground and background processes.

2. Materials and Methods

2.1. Goal and Scope Definition

The primary goal of this study was to measure the environmental impact of processes involved in operating community water treatment systems. This involved assessing the overall resources needed and the environmental footprint of individual unit processes. Additionally, the underlying aim was to gather treatment data from actual plant scenarios and utilize them as input for the sustainability analysis. In cases where precise data were constrained, a proxy or alternative values closely aligning with actual plant operations were used.

2.2. Functional Unit

The functional unit in this LCA analysis serves to establish a standardized unit of measurement for the study system [34]. To maintain consistency with prior LCA studies and enable comparable assessments, the functional unit was defined as 1 m3 of treated water [5,14,18,21].

2.3. System Boundaries

LCA analyses of similar water treatment systems have applied the cradle to gate concept [35]. In this study, the analysis encompasses all unit processes, spanning from the collection of raw water to the production of treated water. This scope adequately justifies the utilization of the term ‘cradle to gate’ in defining the system boundaries. However, only those processes, whether foreground or background, which could be readily modified to optimize treatment plant performance, were considered within the system boundary. Processes necessitating system infrastructure reconstruction or redesign were excluded from the study’s system boundaries. The system boundaries for this study encompassed:
(i)
Input and output flows for all material resources utilized in the treatment plants, encompassing production, transportation, and associated primary background processes like combustion and pipeline transport, among others;
(ii)
All sources of electricity generation within the grid mix that are used to power the water treatment plants;
(iii)
The construction and decommissioning of the treatment system and water abstraction systems (pipes, pumps, buildings, and reservoirs) were excluded from the scope of this study for two primary reasons: (a) they contribute only minimally to environmental impact [16,36,37], mainly due to their relatively longer functional lifespan [38], and (b) these processes do not directly impact the day-to-day operations of a water treatment system.

2.4. System Description of Case Study Example

To effectively understand the unit processes and the operational parameters of an urban water system, the water treatment plants in the adjacent cities of Islamabad and Rawalpindi, Pakistan, were used as a case study example. The Rawal Lake Water Treatment Plant (RLWTP) and Sang-Jani Water Treatment Plant (SJWTP) are designed to supply drinking water to the residents of the twin cities, with an operating capacity of 23 MGD and 51.7 MGD, respectively. The drinking water supply of the RLWTP dates back to 1962. The plant draws its water from the Rawal lake and is managed by the Water and Sanitation Agency (WASA) under the Rawalpindi Development Authority (RDA). The major feeding channel to Rawal lake is the Korang River originating in the Murree Hills area [39]. The source water quality for the RLWTP is relatively turbid due to the impurities carried by the nearby rivers and streams. This plant is a surface water treatment plant focusing on the removal of pathogens, micro-pollutants, pesticides, and organic matter.
In contrast, the SJWTP, operational since 2000 and managed by the Capital Development Authority (CDA) in Islamabad, draws raw water from the Khanpur Dam, located approximately 40 km from the Islamabad Capital Territory (ICT) in the village of Khanpur, Khyber Pakhtunkhwa. Operating at a daily capacity of 98,420 m3, this plant also treats surface water to effectively eliminate pathogens, micro-pollutants, pesticides, and organic matter. The geographic location and a satellite view of both the treatment plants are presented in Figure 1.
In Pakistan, the conventional water treatment process train includes screening, aeration, coagulation, flocculation, sedimentation, filtration, and chlorine disinfection. Raw water is drawn from the surface water sources at the receiving well, which is equipped with screening and control chambers. Flash mixers are designed to provide mechanical mixing for uniform dispersion of coagulant aids and any additional chemicals added to the raw water stream. At the RLWTP, an aeration system is installed for inducing airflow into the raw water stream at a flow rate of approximately 6 m3 per minute. From the flash mixers, the aerated and coagulant mixed water flows to the flocculation chamber for particle agglomeration followed by a solid settling process at a surface loading rate of 2.55 and 1.3 m/h for the RLWTP and SJWTP, respectively. At the RLWTP, coagulation and flocculation are carried out through clariflocculators and shaft-paddle flocculators attached to circular and rectangular basins.
In contrast, at the SJWTP, zig-zag baffles are designed to facilitate a sustainable flocculation process followed by rectangular sedimentation tanks. The water then undergoes further purification through rapid sand filtration. Finally, chlorine is introduced in the clear well storage unit just before distribution. Any sludge generated from the sedimentation tank and filtration backwash is directed to a sludge lagoon. Backwash water is recycled back to the receiving pond, while the settled sludge is disposed of into a rainwater-fed natural stream running through the city [40]. At the RLWTP, the sludge produced from the sedimentation tank and filtration backwash is directed for disposal to the Korang River [41,42].
Incorporating all the unit treatment processes, a total of 14 processes were identified to delineate the treatment sequences at the RLWTP and SJWTP. These processes are listed in Table 1 with the operational parameter details. The design schematic and process train diagram of the RLWTP and SJWTP can be found in Figures S1 and S2, also with processes and operational details for each treatment component for both systems.

2.5. Lifecycle Inventory Analysis

2.5.1. Data Quality

In-person plant visits were organized for on-site data collection, plant process observation, and conducting operator and staff interviews. These visits were conducted during the month of March in the year 2023. As a result, all of the data for unit flows and modeled processes pertaining to the core system were sourced from the present-day operations at the treatment plants. These data encompass processes listed in Table 1, plus additional processes including maintenance routines. Background data for electricity, chemicals, and materials were derived from the specific conditions in the countries of origin for the electricity, chemicals, and materials, respectively. Parametric impact scores for each impact category related to the electricity grid were sourced from the European geographic region, as it closely aligns with the electricity grid mix of Pakistan. For chemicals and materials, specifically aluminum sulfate and chlorine gas, data were obtained from North American repositories [43,44]. The processes modeled from these databases were adapted to suit local electricity and transportation scenarios exclusively. Table S2 provides an overview of the data sources for each category, indirectly indicating their quality. These data sources include published reports and inventory datasets designed and developed for transportation and manufacturing processes for general chemicals and materials.

2.5.2. Inventory Analysis

The lifecycle inventory constructed for this study was structured around technical (foreground) data and environmental (background) data. Altering foreground processes typically leads to an immediate impact on production quantities, whereas background processes do not directly influence production procedures [45]. The details of the foreground and background data collected for the studied systems are provided in the following sub-sections. The foreground inventory includes water quality, waste sludge, energy consumption, and chemical consumption, while the background inventory includes electricity, transport, chemicals, and materials.

2.6. Foreground Lifecycle Inventory Analysis

The foreground inventory was compiled from the RLWTP and SJWTP through on-site data collection and field measurements, which included interviews with plant personnel during site visits conducted in March 2023 and a detailed review of technical reports, documents, and lab records. The gathered information was systematically recorded using notes and data sheets. Operation and maintenance specifics for aeration, coagulation, flocculation, sand filtration, disinfection, and distribution treatment steps were compiled from annual plant reports, design guidelines, process models, and discussions with plant operation staff. The collected inventory data were validated for each unit process and then translated into functional unit terms, resulting in a meticulously calculated inventory set. The foundational foreground inventory for both treatment systems is briefly outlined in the following subsections.

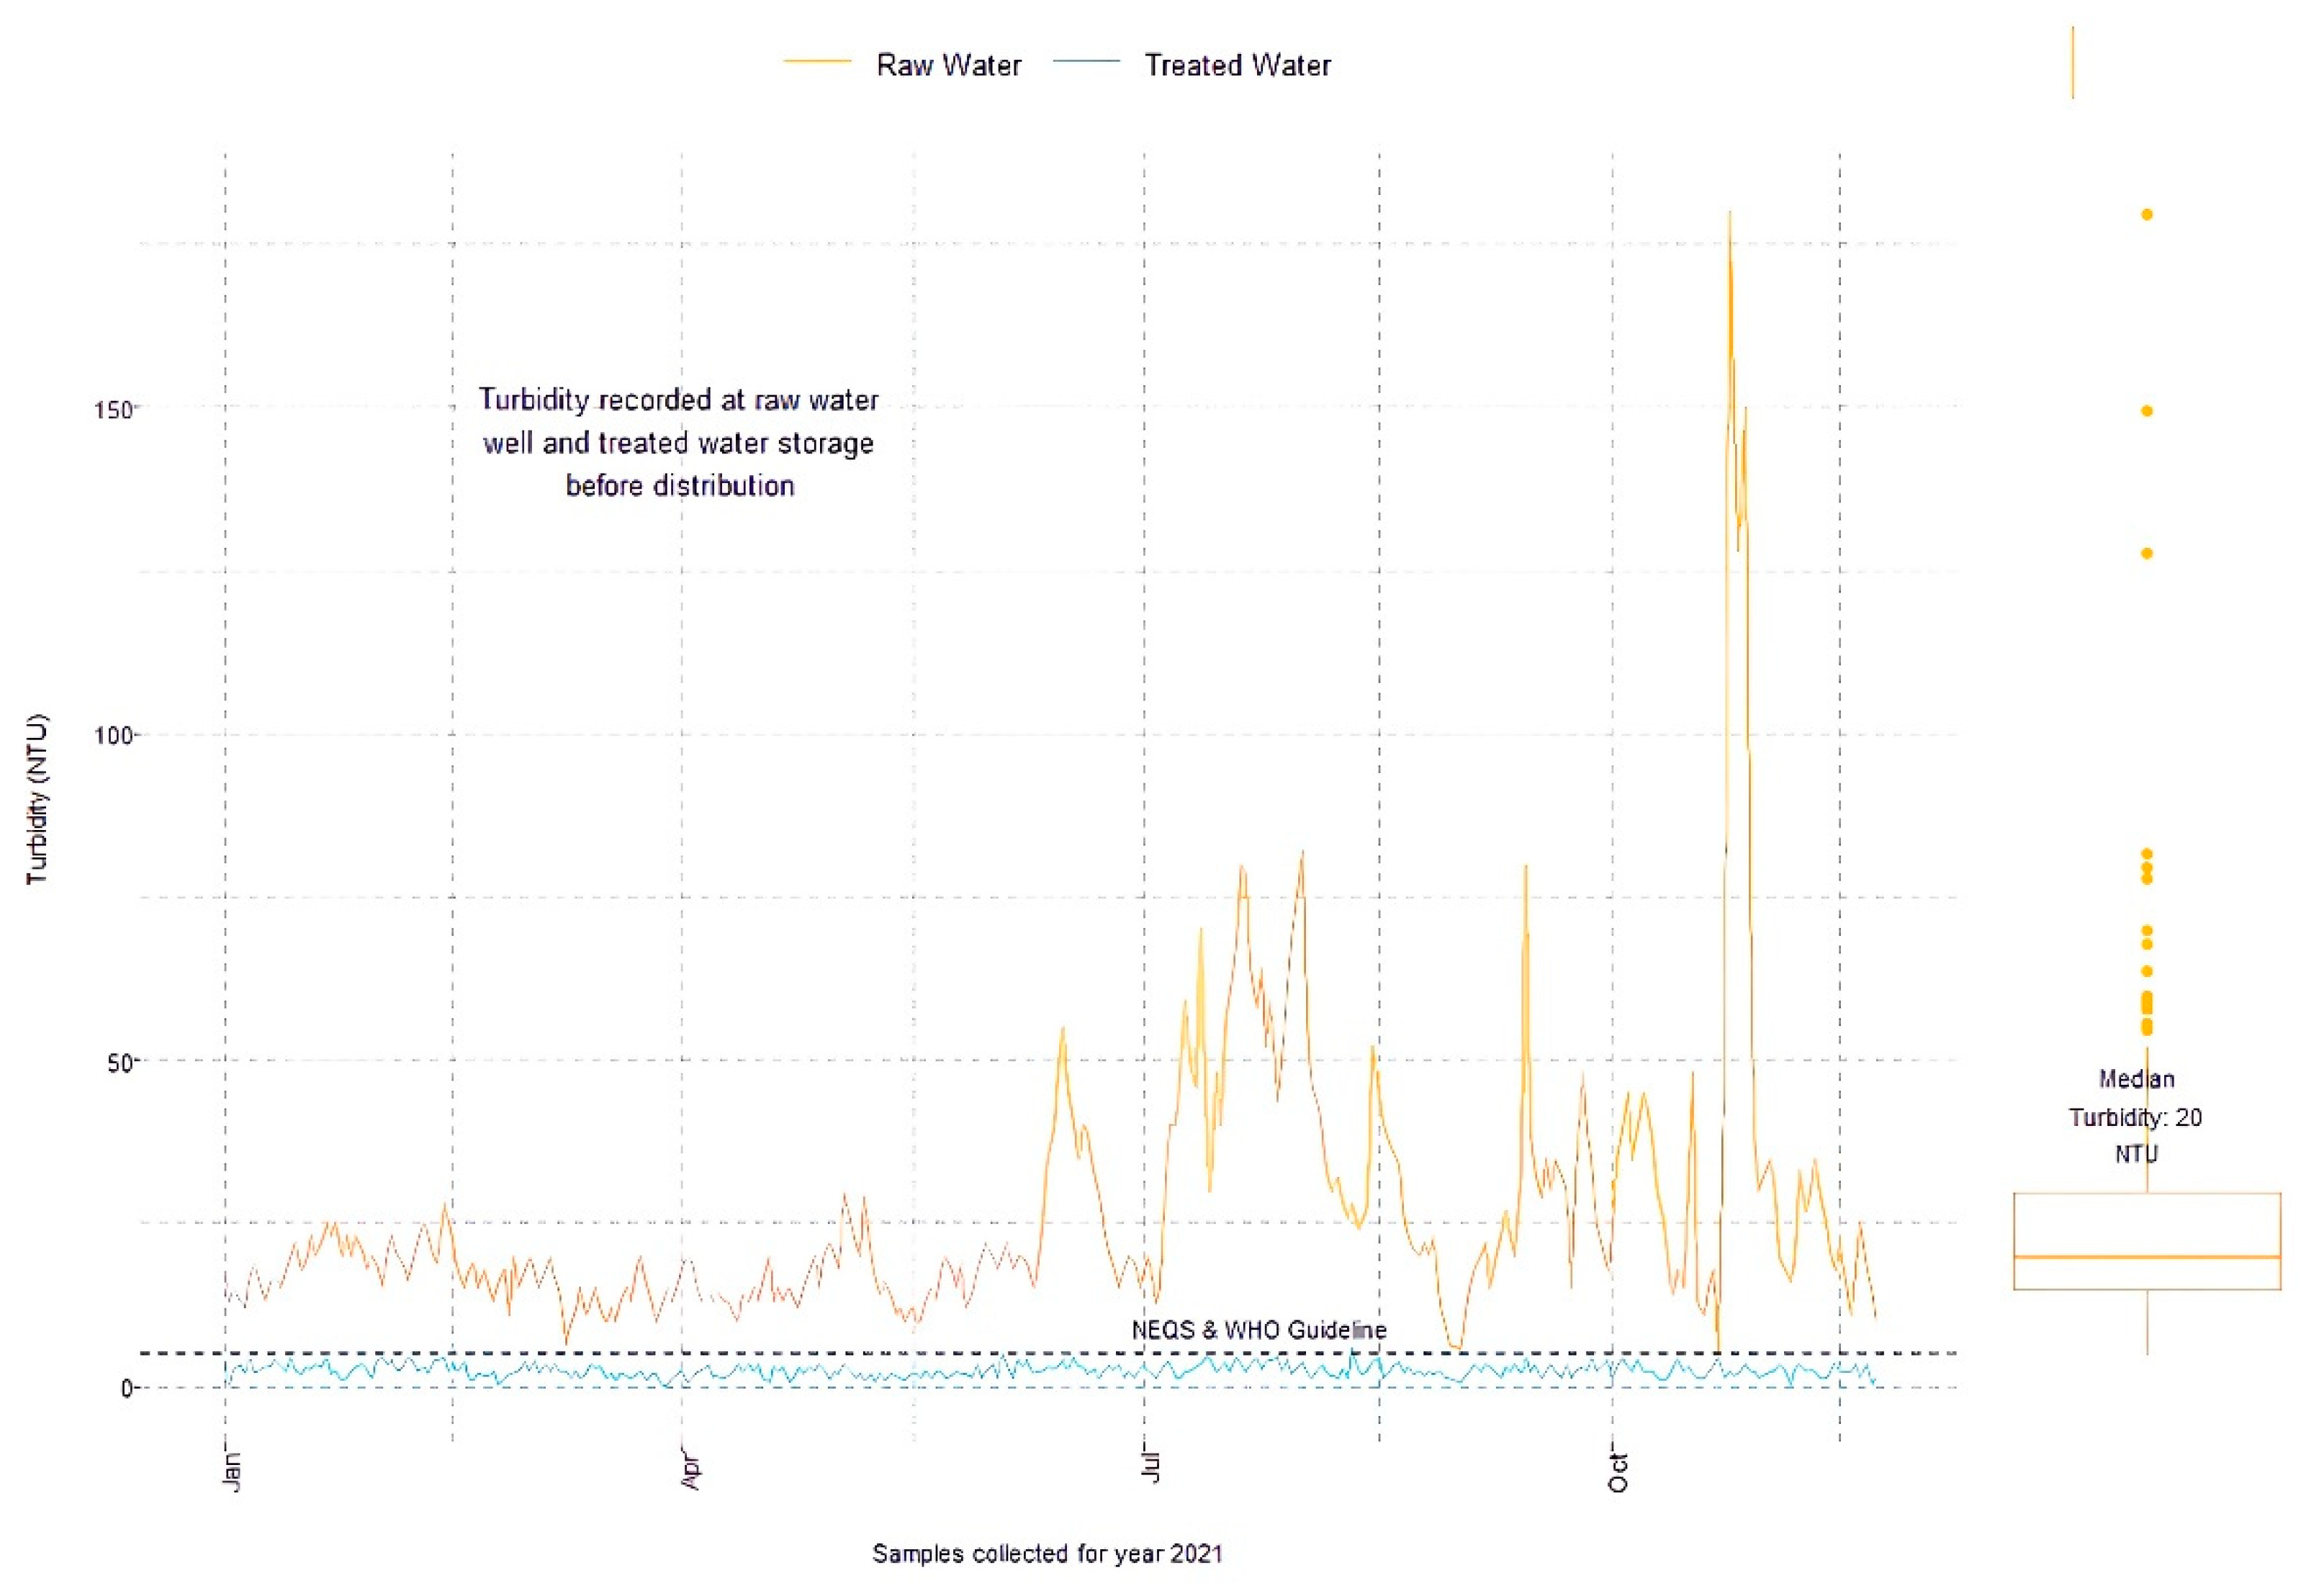
2.6.1. Water Quality

The raw and treated water quality were routinely assessed at the study plants through systematic sampling. Briefly, grab samples were obtained from both the raw water well and the treated water storage (before distribution) and subjected to analysis by designated laboratories and staff. Figure 2 illustrates the water quality at the studied plants for the year 2021, with turbidity as the featured parameter. Additionally, Table S3 provides details on other water quality parameters including pH, alkalinity, hardness, conductance, calcium, TDS (total dissolved solids), chlorides, nitrite, and ammonia.

2.6.2. Waste Sludge

The wastewater and sludge generated during maintenance and backwash procedures were quantified through mass balance calculations in addition to the system process parameters. These wastes contain elevated levels of aluminum from the coagulant and chemical waste from the sedimentation basin, rendering their discharge into the environment undesirable. At the SJWTP, a dedicated lagoon is designed to receive wash water and settled sludge from the sedimentation basin. The treated water is recycled back to the receiving well, while the sludge is directed to the open rainwater stream.
In contrast, the RLWTP disposes of sludge and wash water directly into the receiving environment. This practice heightens the potential hazard exposure levels due to the presence of aluminum from the alum used in the coagulation-flocculation process. Both plants collectively produce an estimated 800 kg of solid waste daily, accumulating to an approximate sludge quantity of 322 tons annually.
Due to limited data availability on sludge quality sampling, primarily stemming from the absence of chromatographic and spectrometry analysis equipment, an alternative approach was adopted. Average pollutant concentrations from various water treatment plant residuals were utilized. Table S3 outlines the pollutant concentration values specific to the treatment systems employing coagulation and filtration processes, ensuring an accurate representation of the sludge characteristics at the studied plants.

2.6.3. Energy Consumption

Based on the real electricity consumption of the plants, the operating energy requirements were estimated at a total electricity consumption of 113 kWh for the RLWTP and 1977 kWh for the SJWTP. The distinct difference in the total electricity consumption of both systems was due to the mechanism of distribution pumping, as mentioned in Table S4. The former system was based on gravitational distribution flow while the latter system used heavy-duty pumps.

2.6.4. Chemical Consumption

Dry alum, gaseous chlorine, and lime (CaCO3) were the primary chemicals applied for the treatment at the study plants. The alum dosing rate at the RLWTP and SJWTP was comparable to similar systems, being from 15 to 20 mg/L. Chlorine gas was dosed to disinfect the treated water at a feed rate of 2 mg/L. Lime (CaCO3) was dosed to adjust the pH of the treated water at a feed rate of 0.2 mg/L.

2.7. Background Lifecycle Inventory Analysis

Background inventories for upstream processes, in particular electricity production, chemical production, and transportation of chemical products, were referenced from electricity supplier companies, chemical manufacturers, suppliers, and technical reports. These data were integrated with publicly available LCI (Life Cycle Inventory) sources, in particular the ELCD (European Platform on Lifecycle Assessment) database, the Ecoinvent 2.0 database, and the available literature on similar water treatment systems [25,46,47].

2.7.1. Electricity

In Pakistan, many different sources are used to generate electricity and they all have different economic and environmental profiles. About 32.3% of the electricity in Pakistan is produced from natural gas while 24.7% of the total electricity is produced from hydropower. Furnace oil, coal, and nuclear sources contribute to the overall energy mix at 14.3%, 12.8%, and 8.8%. The grid further draws electricity comprising 4.8% from wind sources and 1.4% from solar [48].

2.7.2. Transport

For modeling transport processes in LCA, the transport means are categorized into: (i) heavy-heavy duty trucks (HDTs), (ii) medium-heavy duty trucks (MDTs), (iii) rail, (iv) Ocean-Going Vessel (OGV) container, and (v) OGV tanker [49]. For this study, the transport through road, rail, and sea was modeled according to the Ecoinvent database while the impact factors and distances were collected from [45,50] and other primary data where available.
Some of the transport distances, in particular for barge and overseas transportation, were adapted from the pre-defined inventory processes. For the transport through pipelines for oil and natural gas products, the original processes defined by ERG (Eastern Research Group) [51] were used.
Considering that most of the chemicals and materials were imported from China via ocean ways and then transported to the treatment plant through truck and rail transport, the closest prognosis of the specific emissions and transport distances are detailed in Table S5.

2.7.3. Chemicals and Materials

Based on the scope defined for this study, the background inventory for chemicals and materials used in the LCA process mainly includes the raw materials mined from the ground and the chemicals manufactured through industrial processes. A list of the chemicals and materials used in developing the lifecycle model is included in Table 1. The inputs and outputs directly associated with the extraction and manufacturing of each chemical and material are also included along with the source and reviewer of the data. This is to ensure the highest data quality and effective assessment of the lifecycle impact of the chemical and material resources consumed during the water treatment process at the study plants.

2.8. Life Cycle Impact Assessment

Various methods are designed for translating the life cycle inventory flows into environmental impact categories [52,53,54,55,56]. Because each method has specific characterization factors, the end results may vary based on the method selected [57]. For this study, version 1.0.8 of the Environmental Footprint (EF or OEF) method was used. The method is organized through 15 midpoint impact categories and 4 end-point impact categories, presented in Table S6. This is a recommended LCA method by the European Union as it is designed to account for the supply chain processes related to raw material extraction, chemical manufacturing, and waste disposal [58]. The EF method does offer region-specific characterization factors; nevertheless, the accuracy of the spatially correlated characterization factors (especially for the South Asian region) can produce high offsets in the assessed impact scores.

3. Results

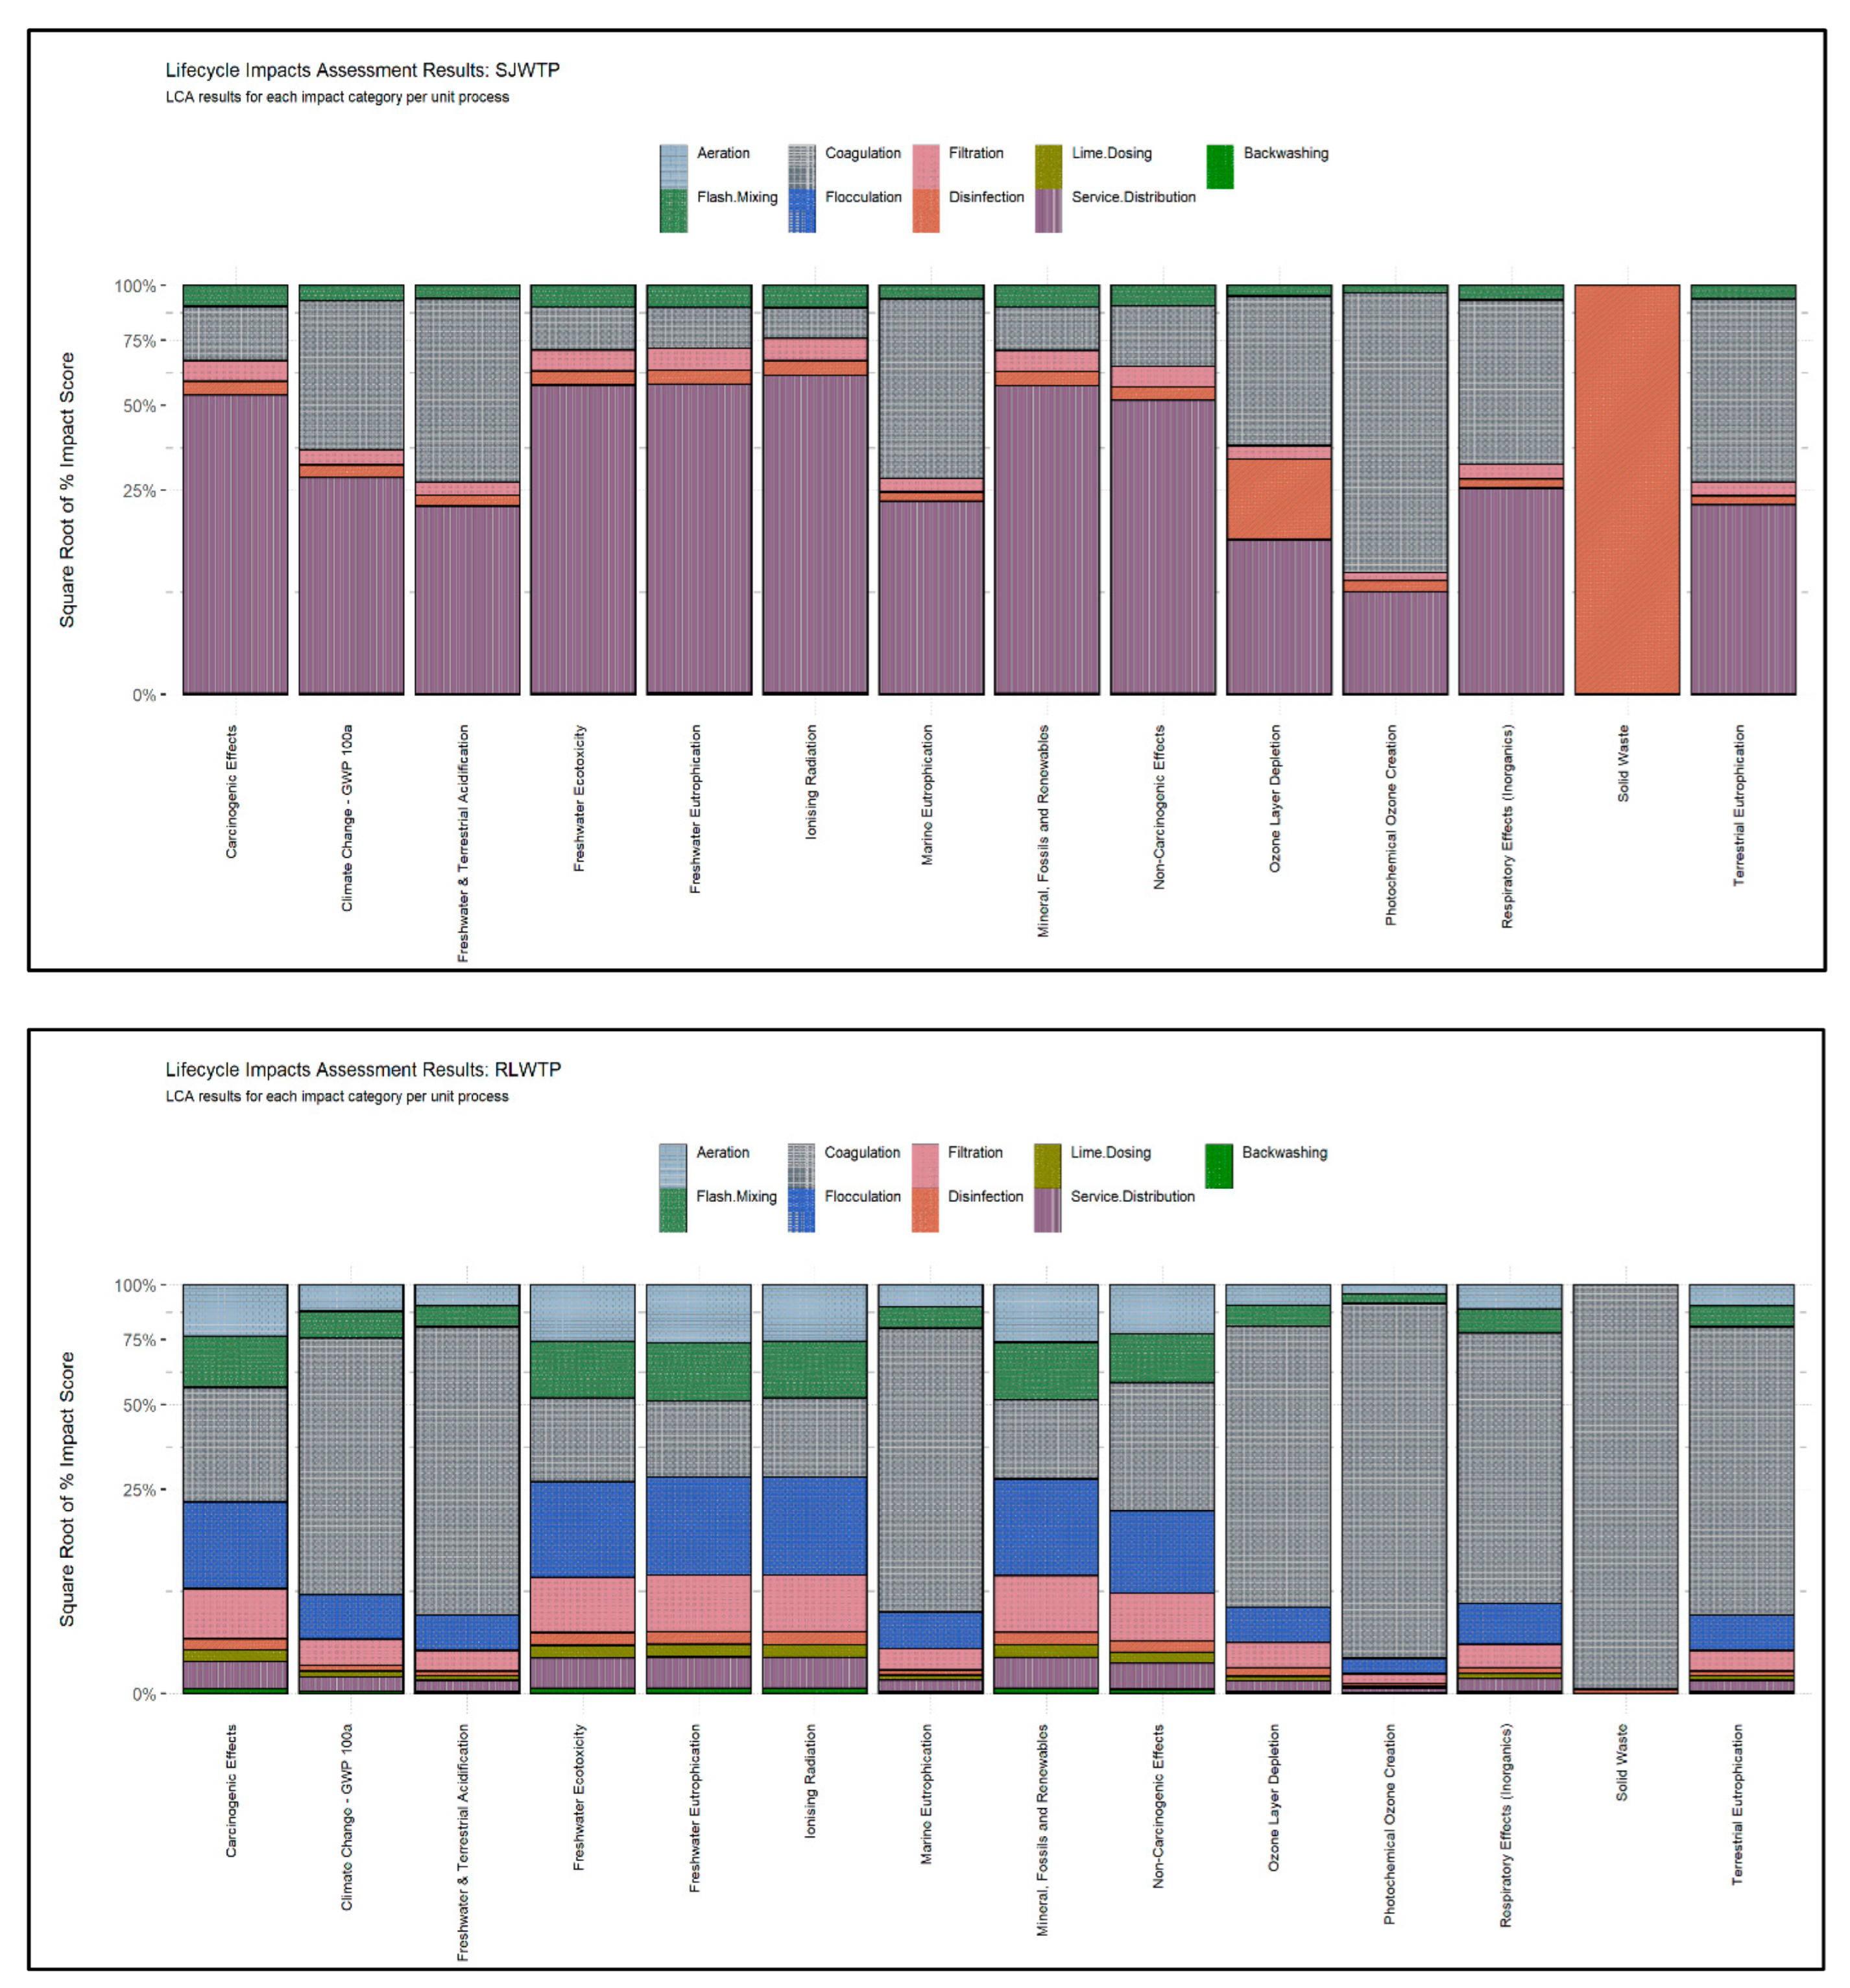
3.1. Contribution of Unit Processes

To effectively communicate the outcome of the LCA model for the two water treatment plants, the results were structured based on the resources utilized in each treatment stage and their corresponding environmental impact. The main resources that were considered are the electricity and chemicals used. This is in addition to the environmental impact generated in form of direct emissions from the water treatment plant.
Figure 3 graphically represents the impact contributed by each unit process that is operational at the study plants. For the SJWTP, the results were dominated by the service and distribution process in all impact categories. This was due to the heavy reliance of the distribution pumps on grid electricity. The lifecycle impacts of the electricity grid powering the studied plants are further discussed in the following sections and Table S7.
For the RLWTP, the highest impacts were contributed by the coagulation and floculation processes. The coagulation process was also found to be a significant contributor to the life cycle impacts at the SJWTP. The impact from the production and transportation of energy and chemicals, along with the waste by-product, rendered coagulation as a heavy contributor to all the impact categories. For both of the studied plants, noticeable impacts were produced from the media filtration processes. These impacts can be traced to the extraction, manufacturing, and transportation of the filter media used at both plants. At the SJWTP, the contribution of the disinfection and backwashing processes was also prominent for most of the impact categories, while, at the RLWTP, the aeration, lime-dosing, and flocculation were distinct processes notably contributing to the environmental sustainability profile of the plant.
The most significant impact was observed for the climate change and freshwater eco-toxicity impact categories, as illustrated in Figure 4. A cumulative total of 1.23 kg of CO2 generation was estimated per m3 production of treated water. The RLWTP contributed only 25% towards the total climate change impact, whereas the 0.65 CTUs of human toxicity estimated per m3 production of treated water at both plants had a 96% contribution from the SJWTP and only a 4% contribution from the RLWTP. The impact of the ionising radiation and terrestrial eutrophication categories, even though subtle, was also observed across all the unit processes for both treatment systems, with a cumulative estimated value of 0.022 kg U235 equivalent and 0.014 moles of N equivalent.
These impacts are to be attributed to the substantial release of carbon dioxide, carbon monoxide, and other toxic chemicals during the electricity generation, chemical manufacturing, and transportation sub-processes, as shown in Figure 5. The direct emissions from the operation of the water treatment plants must also be attributed to the life cycle impact categories. Withstanding that the inventory data for these direct emissions are yet to be established for most water treatment systems, the calculations listed in Supplementary Materials were employed to incorporate the air, land, and water emissions into the Lifecycle Assessment model. Most of the land and water emissions were from solid waste, organic content, metals, and salts. As for emissions to the air, the most frequently documented emissions include carbon dioxide, carbon monoxide, and methane.
Furthermore, based on the mid-point and end-point hot-spot analyses of unit treatment processes presented in Tables S8 and S9, the cumulative life cycle impacts from coagulation, flocculation, and distribution are comparable across all impact categories. The life cycle impacts from aeration, disinfection, lime dosing, and backwashing may be subdued; nevertheless, these processes are critical factors towards the sustainability of the water treatment systems. From the LCA results of the unit process, coagulation and flocculation emerged as the most energy-intensive processes, reserving the distribution pumping process. For the coagulation process, 0.0076 kW and 0.017 kW were consumed per cubic meter at the RLWTP and SJWTP, respectively. The flocculation at the SJWTP is carried out through zig-zag baffles, which require no energy input, while the RLWTP consumed 0.016 kW per cubic meter, factoring in the rectangular and circular clarifiers (clariflocculators). In terms of the environmental impact solely attributed to electricity consumption, this equates to 0.02 kg of CO2 emissions and 0.019 CTUh of eco-toxic effects per cubic meter of treated water.

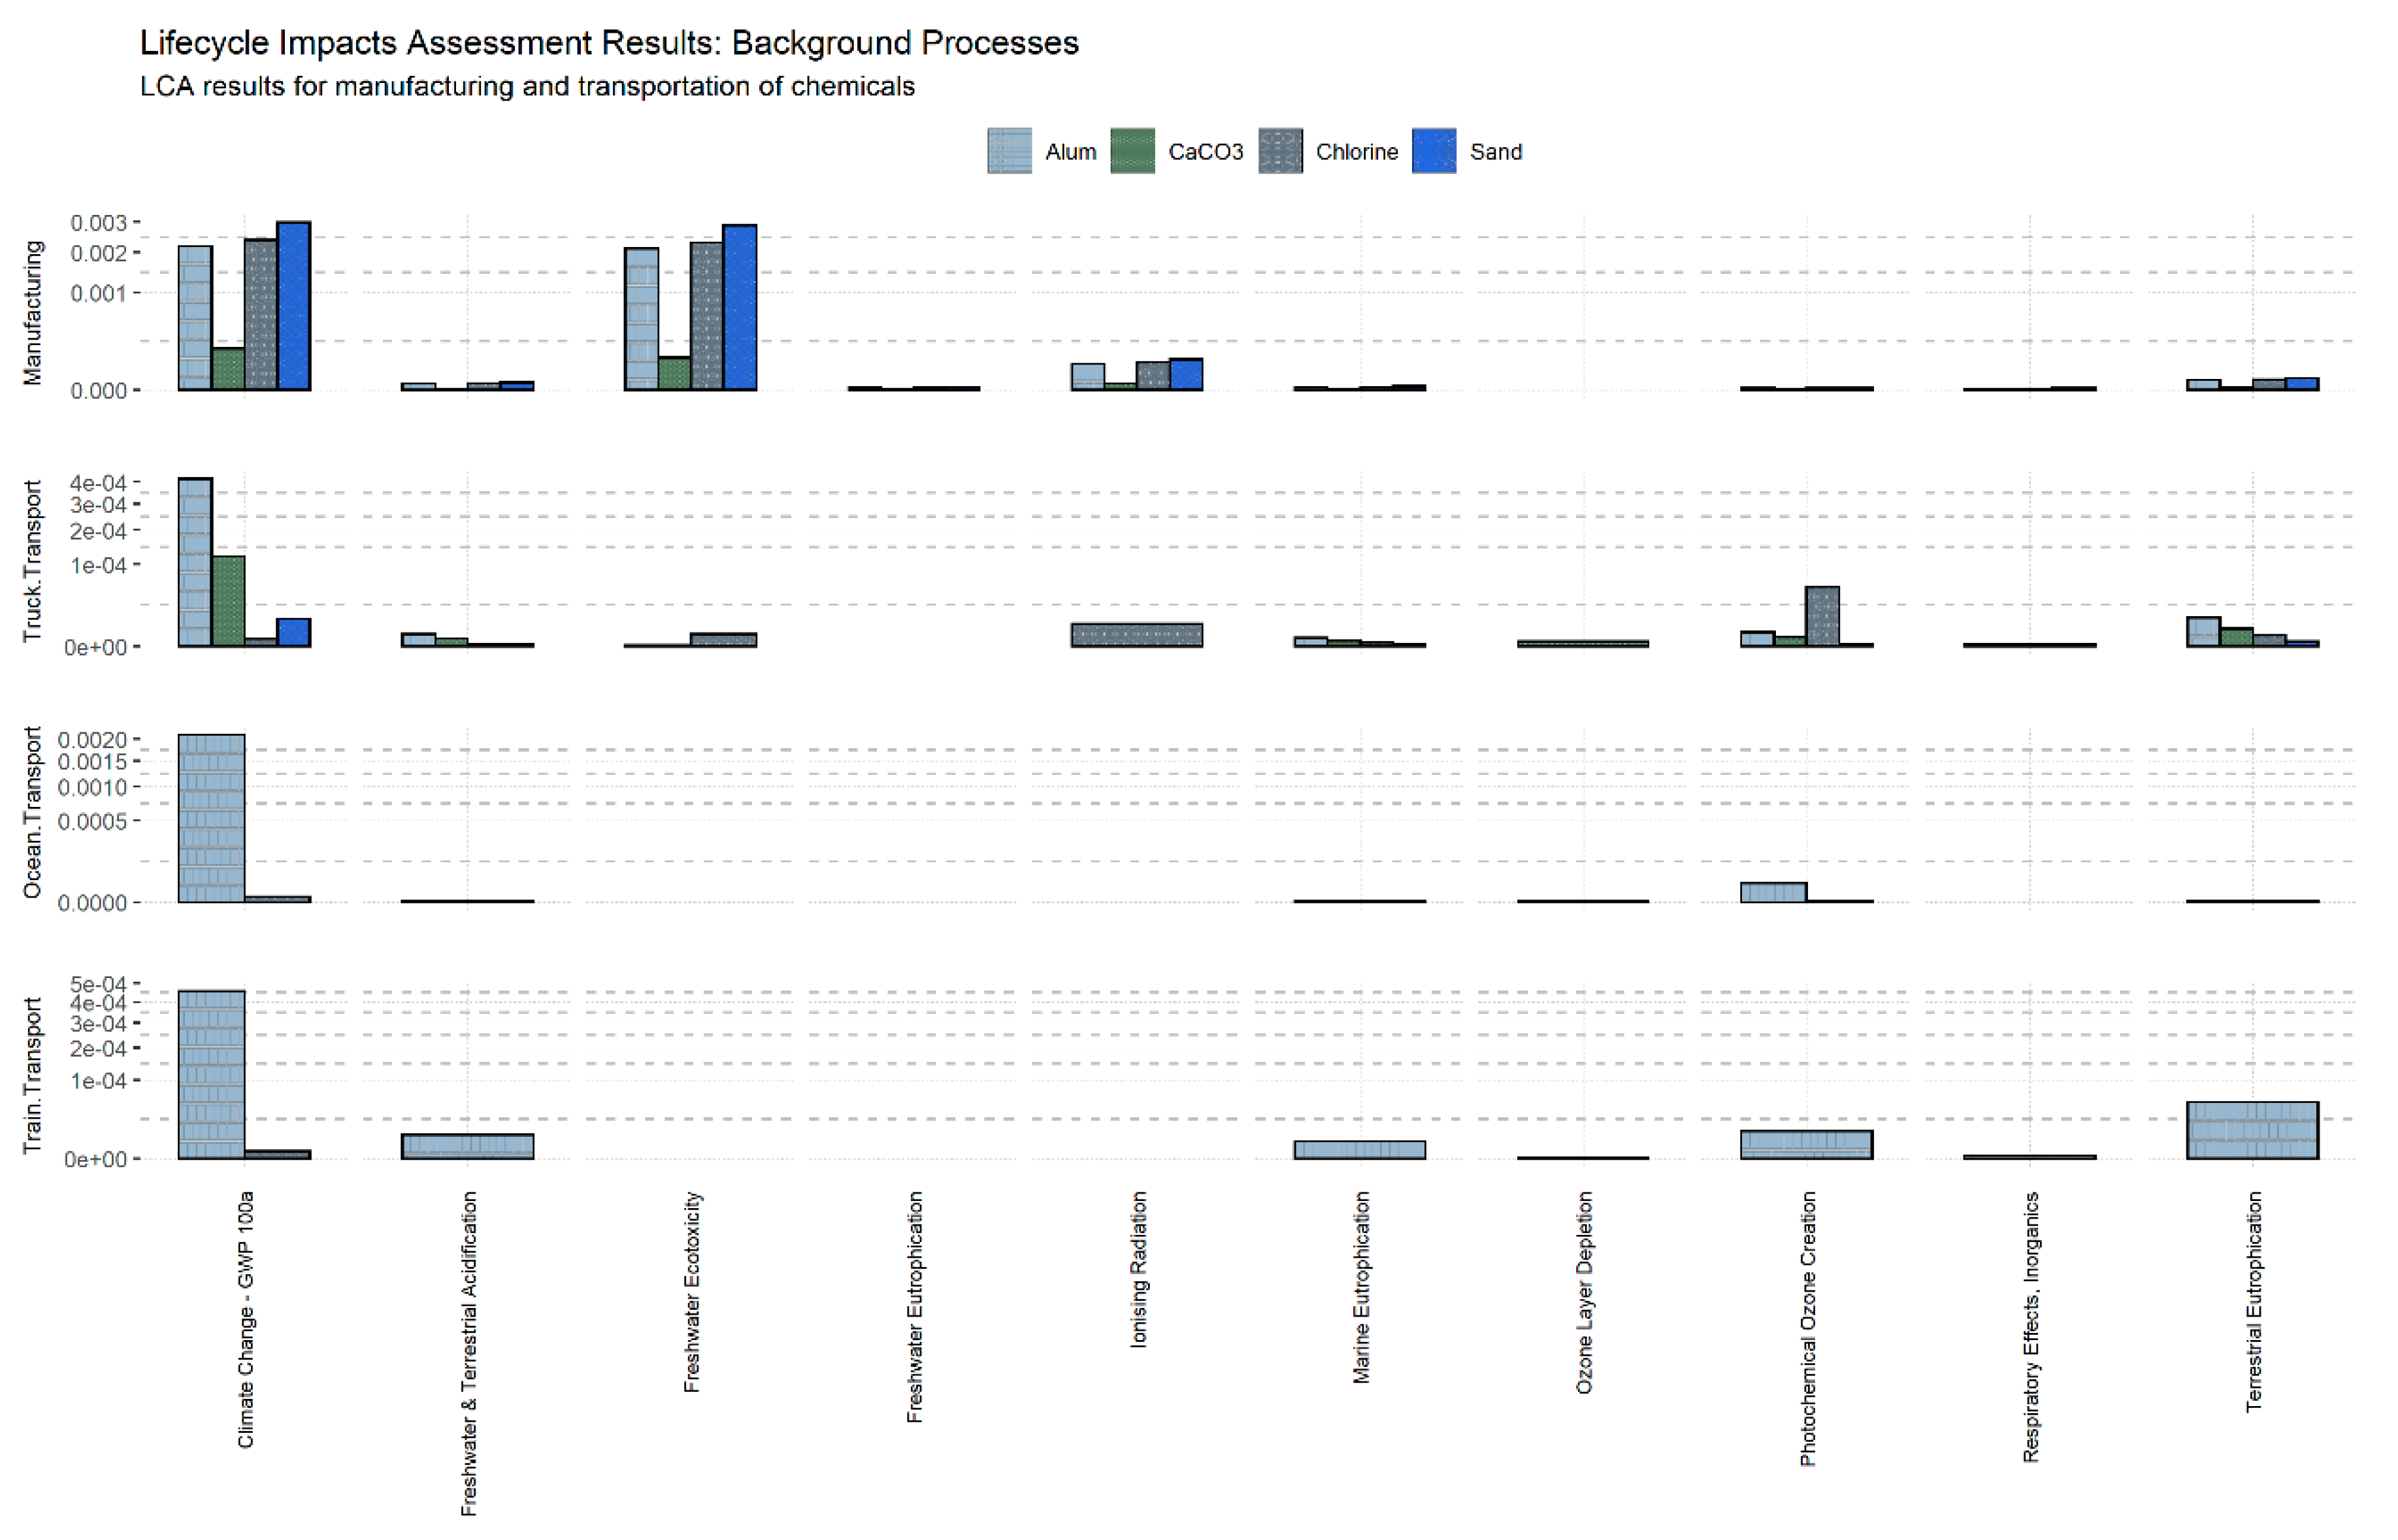
3.2. Contribution of Background Processes

The contribution of background processes towards each impact category was assessed systematically for both treatment plants. The results of the impacts contributed by the chemicals and raw materials are presented in Figure 6 and the impacts contributed by electricity consumption are presented in Figure 7.
Out of the total 0.018 kg of CO2 (m3) produced from the background processes, a significant portion, specifically 68.7%, was contributed by the production and transportation of the coagulant. Additionally, 16.5% was contributed by the production and transportation of sand for filtration modules, 13.006% was contributed by chlorine gas used for disinfection, and 1.717% was contributed by lime for pH adjustment. When analyzed in further detail, it was observed that the total impact of transportation was more visible for railways as compared to ocean ways. Furthermore, the impacts from railway transportation were visible over a broader spectrum regarding its impacts on, in particular, terrestrial eutrophication and photochemical ozone creation.
A total electricity consumption of 1.16 kW per m3 of treated water for both treatment systems produced approximately 0.65 kg of CO2 emissions. Only 3% of these emissions were contributed by the RLWTP, while 97% were produced from the operations of the SJWTP. The same applies to toxic emissions to freshwater and hazardous emissions to air. In contrast to the SJWTP, the environmental impact of the RLWTP seemed negligible. Even so, the 0.037 kW electricity usage per m3 of treated water was still comparable to similar water treatment systems. A brief elaboration of this argument is included in the discussion section of this paper.

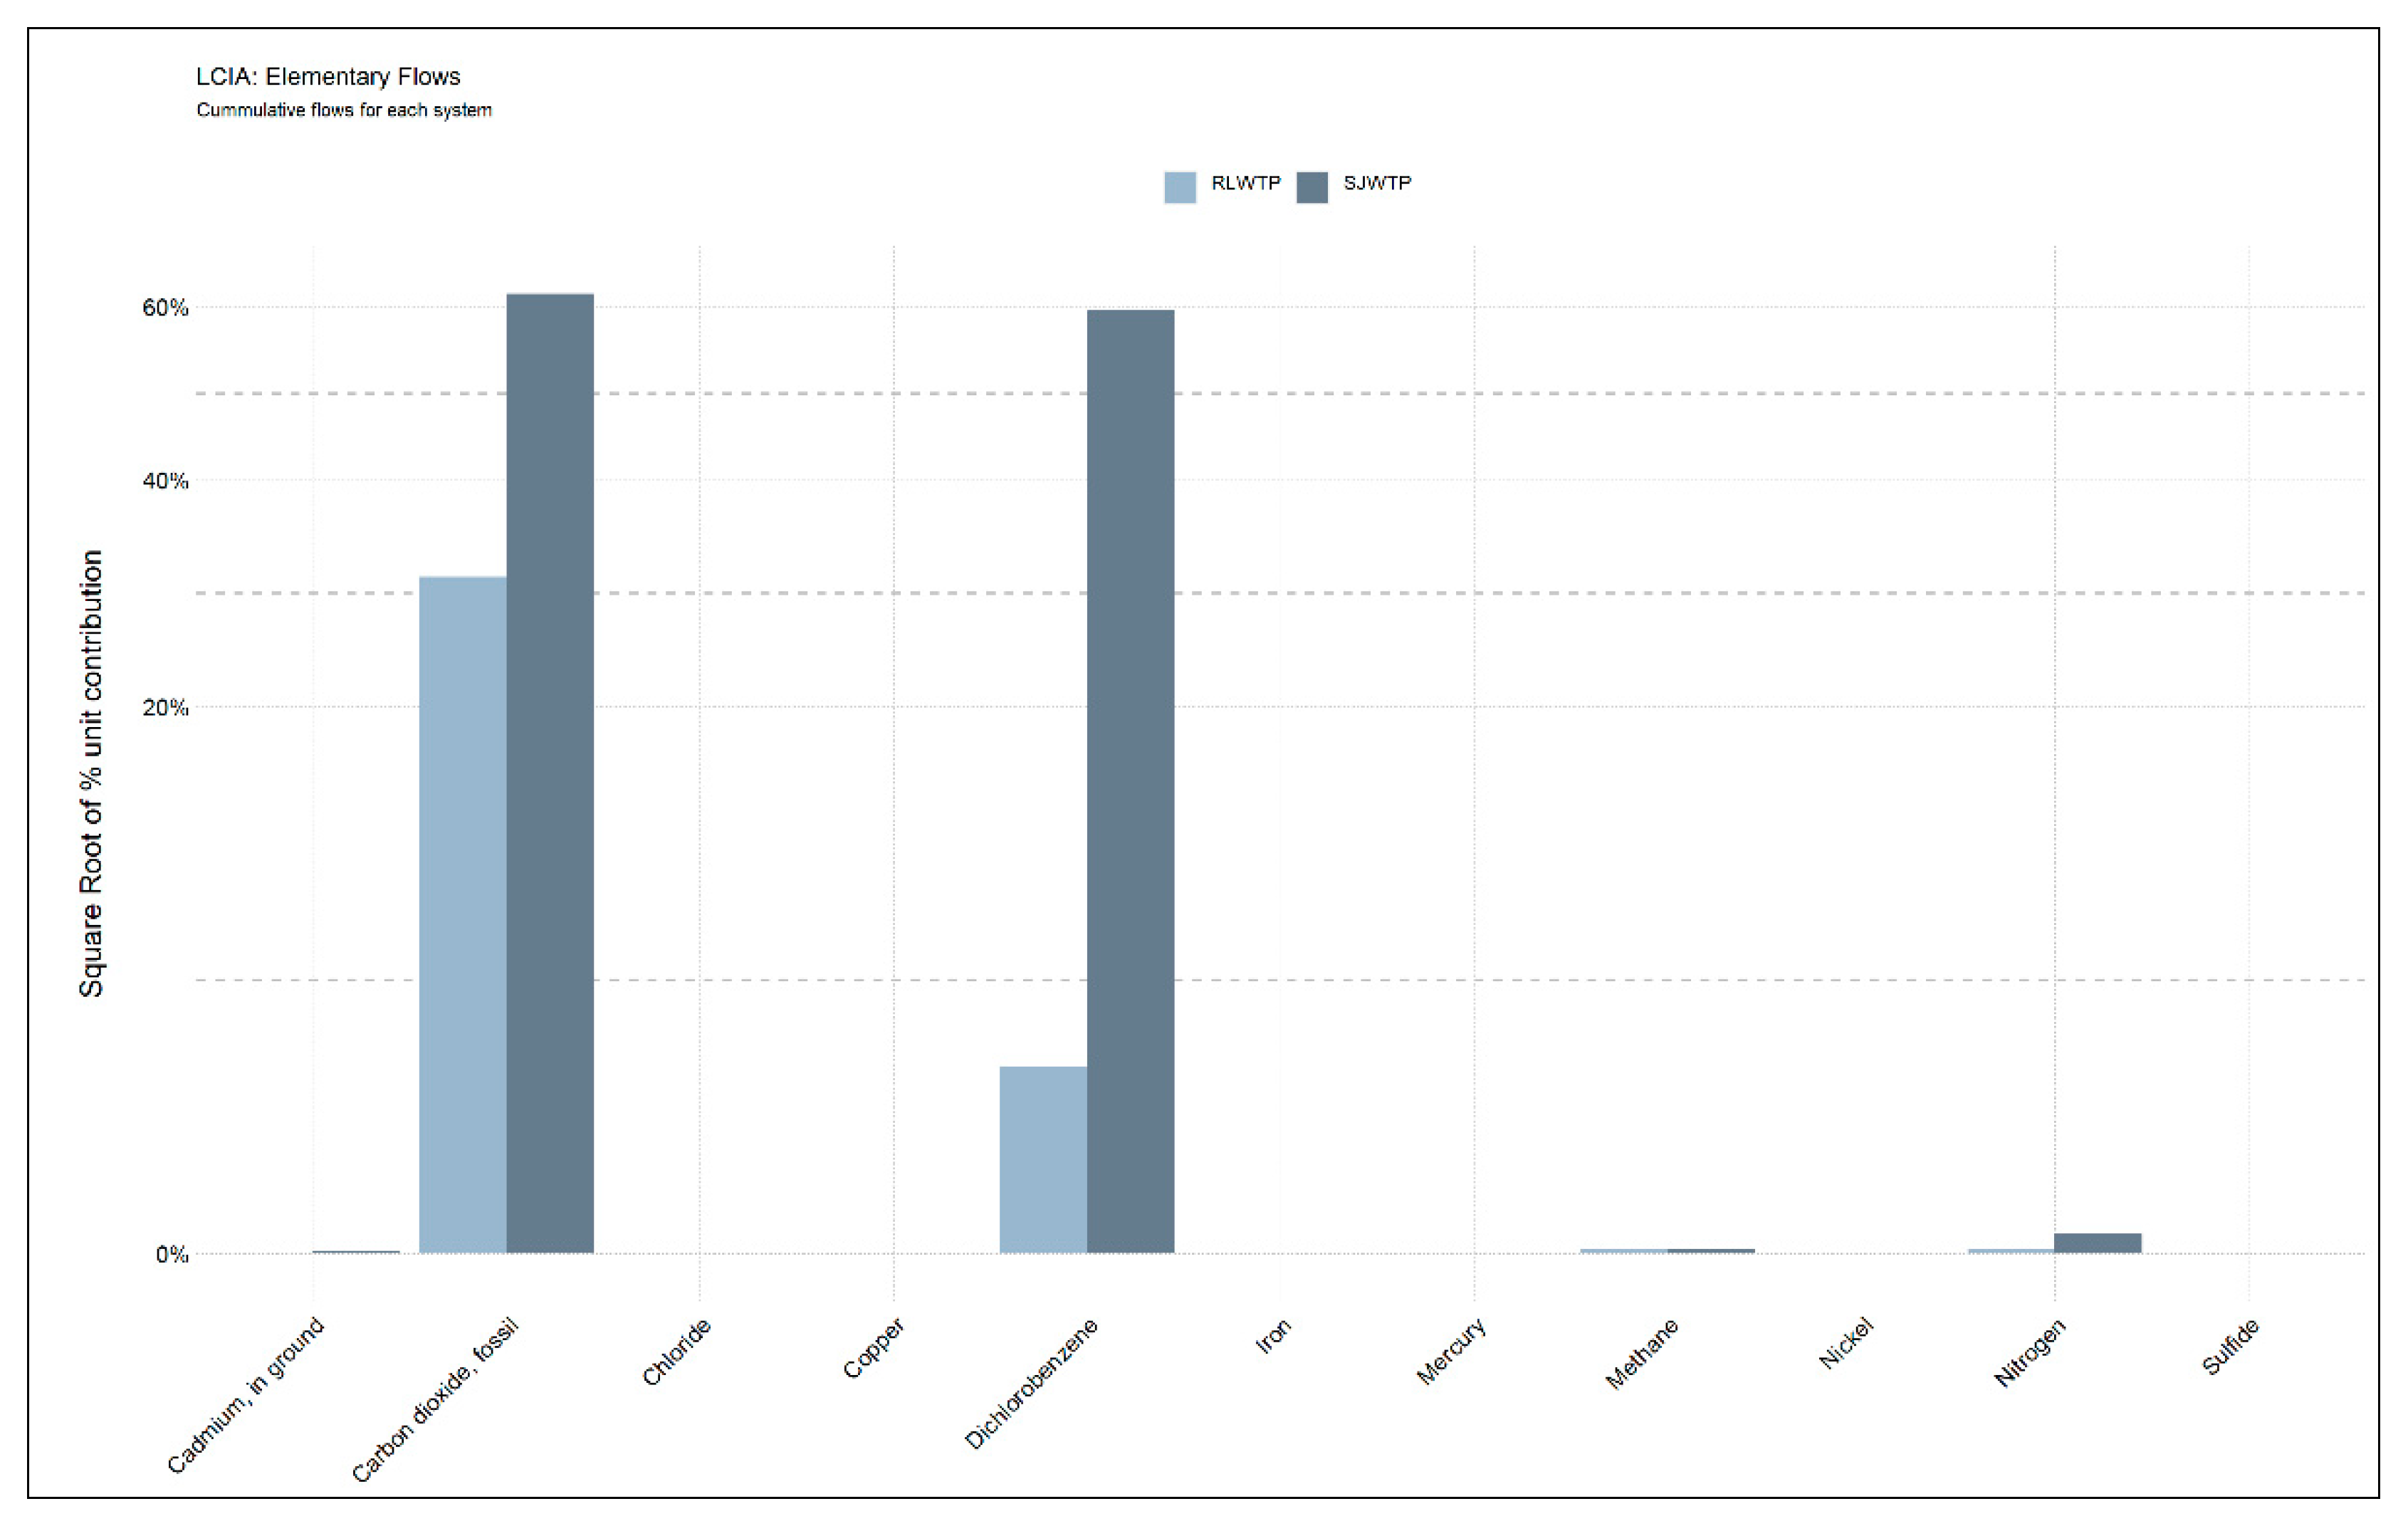
3.3. Comparative Analysis of Both Systems

The RLWTP is designed to leverage natural elevation for providing the hydraulic head for water flow throughout the treatment system and distribution. This eliminates the requirement of centrifugal pumps for raw water extraction and distribution. The SJWTP, on the other hand, does not have an aeration mechanism and the flocculation basin is also designed to operate on gravity. The environmental emissions from both plants are equal to 1.23 kg CO2 and 0.648 CTUh of eco-toxic effect per cubic meter of treated water. Service and distribution mechanisms aside, the treatment processes at the RLWTP contributed 26.96% while the processes at the SJWTP contributed about 30.37% to the total environmental impact.
For the service and distribution processes only, the environmental impacts contributed by the RLWTP and SJWTP were 0.06% and 42.6%, respectively. The reason for this is that, at the RLWTP, the distribution was gravity-driven, with only a single service pump, while at the SJWTP, six high-capacity pumps were used for transferring the treated water from the plant to the community reservoirs via DIP conduction lines.
Another important aspect of the treatment process is the filter backwashing mechanism which uses the air scour pumps. Both plants used high-capacity air scour pumps with a rating of 93 and 53 kWh. Still, the environmental impacts contributed by the backwash systems are only 0.002% and 0.0008% for the RLWTP and SJWTP, respectively. This is due to the daily operating time of the backwash system, which is only up to 2 hours as compared to the other unit processes which operate on a 24 hour schedule. Figure 8 is a graphical representation of the impacts contributed towards each LCA impact category per unit treatment process. Based on the illustration, it is clear that the average environmental performance of both plants is comparable, with the exception of the aeration, flocculation, and lime dosing processes.
Considering only the treatment processes for both systems, there is a mere 3.74% difference in the overall environmental impact of the systems. The significant difference in the sustainability ratings of the systems is due to the high energy demand for distributing the water through the distribution system. Finding alternative energy sources could reduce the high resource demand and allow for more sustainable operating conditions.

4. Discussion

Urban drinking water treatment plants are vital for providing sustainable safe water to ever-growing populations [59]. Effective resource management, including water, energy, and chemicals, is essential for financial sustainability and continued dependence on this technology [60]. Furthermore, emissions produced onsite pointedly affect resource sustainability and, in this regard, it is crucial to consider the type and quantity of coagulants used. Conclusively, balancing immediate needs with future freshwater protection is central to urban water sustainability [61]. The introduction of green infrastructure and the use of renewable energy sources can significantly reduce the carbon footprint of the two water treatment facilities, aligning with broader environmental goals [62]. Collaboration between the local communities, local authorities, and water treatment plants would promote more responsible water use and nurture a culture of sustainability [63].
Both of the water treatment systems (RLWTP and SJWTP) assessed in this study were operating at a maximum capacity using only the traditional treatment methods. Raw water quality is one of the key factors affecting the treatment process efficiency and finished water aesthetics [64]. During high water and flood season, up to 1000 NTU of turbidity was recorded, therefore requiring increased coagulant dosage. The continuous operation of the unit processes through timely maintenance of the equipment may significantly improve the resource utilization; still, the real Achilles heel for both the systems is the implementation of proper monitoring and sampling programs. As water usage from these plants includes human consumption, it is imperative to ensure that the treated water meets stringent quality standards to safeguard public health [65]. Contaminants or impurities in the water supply can pose significant risks to consumers, potentially leading to a range of adverse health effects. These can range from gastrointestinal issues to more serious long-term health concerns [66]. Additionally, water quality is considered of prime importance for food safety, as it is often used in various stages of food production and preparation [67]. Thus, continuous water surveillance measures are integral to safeguarding not only operational efficiency but also the health and safety of end-users.
When analyzing each unit process with respect to the inputs and outputs, the highest environmental impacts observed were due to the electricity consumed during the plant (foreground) processes. Totals of 0.03 kWh and 1.13 kWh per cubic meter were consumed at the RLWTP and SJWTP, respectively. This was compared to similar sustainability and energy-consumption studies of water treatment systems which reported approximately 0.07 kWh [68], 0.38 kWh [69], 0.51 kWh [70], and 1.0434 kWh [71] per cubic meter of treated water production. This analysis highlights the significant role of energy consumption in the treatment process, which necessitates a judicious approach to resource allocation.
When translated into GHG emissions, 0.31 kg of CO2 was emitted from RLWTP operations and 0.92 kg of CO2 was emitted from the SJWTP operations. These emissions were per cubic meter of treated water produced, accounting for foreground and background processes including the electricity consumed during the plant operations. The 99.18% difference in the CO2 emissions from both systems was due to the high-intensity distribution mechanism. Specifically, 0.61 kg of CO2 was emitted for every cubic meter of treated water pumped through the distribution system. With a daily production of 79,500m3, the estimated daily CO2 emissions can range up to 48,996.64 kg from the distribution pumps only. The detrimental impacts of CO2 emissions on global warming and climate change are well documented [72]. This substantial environmental footprint necessitates a thorough assessment of potential mitigation strategies.
Additionally, the distribution process of treated water also significantly contributed to acidification, smog, ozone depletion, metal depletion, and other eco-toxic impacts [5,52]. Environmental impacts resulting from the distribution network, e.g., pipelines, storage tanks, etc., were not included in this study. Still, it can be projected that accounting for the distribution infrastructure will further contribute towards the environmental emissions and reveal a compromised water quality at the tap.
The other important aspect in terms of high environmental impacts is the treatment and disposal of solid and water waste produced by the treatment process. A significant impact is caused by the nutrients, metals, and organic waste transmitted to the environment through untreated waste disposal. For instance, up to 68% of eutrophication and acidification impacts were reported by [73] as being from the effluent produced at similar systems. Both the RLWTP and SJWTP directly discharge sludge and water waste into the receiving environment, underscoring the critical need for rigorous waste management strategies to safeguard both environmental quality and public health [74]. A total of 16.04039 CTUh.m3.yr of freshwater eco-toxicity, 0.00042 kg P-eq of freshwater eutrophication, and 0.00376 kg N-eq of marine eutrophication per functional unit were calculated based on the sludge quantity and characteristics. When projected over a year, the phosphorus and nitrogen loadings can amount up to 122.74 kg/m3 and 105,623.7 kg/m3, respectively. These values are comparable to nutrient loading rates in highly eutrophic environments, leading to enhanced sludge production. In our study, on one hand, a high eutrophication potential and energy feed to the plants can lead to higher operational and environmental costs [61] and, on the other hand, this may be a resource for the energy-intensive production of phosphorus-containing chemical fertilizers [62]. Similarly, backwash water that already has less environmental impact may be ascribed as a sustainable resource retrieval if done sludge-free. The advancements in treatment technologies have undeniably enhanced the quality of effluents, but have also led to a substantial upsurge in sewage sludge production [75]. Direct sludge disposal carries the potential risk of soil contamination from organic and inorganic contaminants, pathogens, and virulence factors, including ARGs [76,77]. On the other hand, dehydrated or treated sludge is viewed as a resource with nutrients and organic matter, presenting potential utility as a fertilizer in agriculture or an organic enhancer in the restoration of contaminated sites [78].
Tracing the background processes (chemicals and materials) and mapping the exact inventory flows is as important as defining the system processes themselves [79]. The limitation in mapping the background processes is due to the unavailability of data specific to the study regions. For example, this study was conducted for plants in the South Asian region of the world. The precise processes for extraction, manufacturing, and transportation of chemicals and materials are seldom documented. Therefore, most of the time, the LCA models are based on assumptions or pre-defined inventory datasets. Even when using pre-defined inventories from foreign sources, the default energy and transportation flows were substituted with the local energy and transportation flows to maintain a constant baseline while using the default allocation values [80].
Furthermore, the choice of the most appropriate characterization model is also critical; the reason being the variation in the characterization factors and impact pathways for different models [81]. While the different characterization methods are discussed in the Lifecycle Impact Assessment section, the primary reason for selecting the EF 1.0.8 method for this study was to accurately map the inventory data for the most important background process, i.e., electricity generation. The EF 1.0.8 method also adequately translated the other inventory flows to their respective impact categories. Even so, when comparing to other methods (TRACI, ReCiPe), there is a distinct difference in the characterization factors, plus the TRACI method includes a broader flow library. The objective of this study is not to compare the characterization factors for different methods. Still, the variation in the impact factor values is interesting and should be observed when using multiple methods.
Lastly, when developing a holistic picture of the entire system’s sustainability, it is recommended to consider all of the possible impacts and the respective pathways listed in Table S10. Now, because each impact category is tied to a specific inventory flow, developing a list of emissions (air, water, land) with precise allocations is equally important. This is only possible with an accurate catalog of the main processes (foreground), associated processes (background), and sub-processes (further background processes). Nevertheless after reviewing the literature on the LCA of water treatment systems, meticulously completing a lifecycle inventory analysis, and compiling the assessment results, it appears that the most prominent environmental impacts are for the global warming and eutrophication impact categories only [82]. Furthermore, most LCA studies have identified these impacts from the production and supply chain of the resources (electricity and chemicals) used at the treatment plant. To support this argument, the most relevant examples are from previous work [1,16,23,25,46], where the high environmental impact is identified from the nature of the energy source and the production of the coagulant chemical. The cradle to gate LCA of 10 alternative water treatment plants [83] further confirmed that the most prominent and noteworthy contribution to the environmental impact is from the chemical and electricity consumption during the plant operation. Furthermore, these impacts are actually from the electricity generation and chemical manufacturing and transportation, and they are not directly related to the operation of the plant itself; rather they can be contributed to the use quantities, which are therefore referred to as off-site emissions.
The emissions generated on-site during the operation of the water treatment system [84,85,86] stem from chemical reactions such as alkalinity consumption by coagulants in mechanical mixing processes (e.g., rapid mixing and flocculation) [1] and are calculated based on the emissions factors for the type of coagulant used.
In summation, while this study provides valuable insights into the energy consumption and associated environmental impacts of water treatment systems, it is imperative to expand the assessment scope to encompass the broader implications for environmental health. This would include a comprehensive evaluation of potential impacts on water quality, air quality, ecosystem health, and human well-being. Such a holistic approach is instrumental in providing a comprehensive overview of water treatment systems’ overall sustainability, environmental impact, and implications for public health. Future studies should aim to integrate these facets to develop a nuanced understanding of the environmental health considerations associated with water treatment systems.

5. Conclusions

In conclusion, this comprehensive assessment of two water treatment plants, the RLWTP and the SJWTP, conducted under maximum operational capacity and principal treatment methods, sheds light on critical factors influencing treatment process efficiency and environmental impacts. Notably, the real challenge is the proper implementation of monitoring and sampling programs. The forefront processes, particularly electricity consumption, emerged as the primary drivers of environmental impacts, revealing a noteworthy disparity between the plants. While the RLWTP and SJWTP exhibited distinct energy consumption patterns of 0.03 kWh and 1.13 kWh per cubic meter, respectively, the ensuing greenhouse gas emissions showed a significant influence of distribution mechanisms, accounting for a 99.18% difference. Moreover, the treatment and disposal of solid and water waste presented significant environmental ramifications, emphasizing the need for proper waste management strategies.
Furthermore, this study highlights the critical importance of a thorough background process evaluation, acknowledging the challenges of acquiring region-specific data. The choice of characterization model, exemplified by the adoption of the EF 1.0.8 method, played a pivotal role in accurately depicting the inventory data, especially for electricity generation. While our research promotes a holistic consideration of all conceivable impacts, it emphasizes the dominant influence of global warming and eutrophication, rooted in the production and supply chain of key resources. The on-site emissions generated during water treatment operations were predominantly attributed to chemical reactions, highlighting the need for tailored emission factors for coagulant usage. Considering these findings, this study provides valuable insights into the sustainability of water treatment systems, emphasizing the imperative of informed decision-making and targeted interventions to mitigate environmental footprints.

Supplementary Materials

The following supporting information can be downloaded at: https://www.mdpi.com/article/10.3390/su152316172/s1, Figure S1: Process design and treatment schematic of Rawal Lake Water Treatment System. The treatment process train with unit process details are listed in notes adjacent to each process. Red dashed lines represent sludge and waste flows while black solid lines represent water flows. Modified after [37]. Figure S2: Process design and treatment schematic of Sang-Jani Water Treatment System. The treatment process train with unit process details are listed in notes adjacent to each process. Red dashed lines represent sludge and waste flows while black solid lines represent water flows. Modified after [37]. Table S1: Environmental emission pathways relevant to the LCA of the water treatment studies; Table S2: Data types and sources indicating the quality and authenticity of inventory dataset; Table S3: Characteristic parameters for raw and treated water and sludge for the study systems; Table S4: Electricity consumption in kWh per m3 for unit processes at the study water treatment plants; Table S5: Transport distances for chemicals and materials used at the study plants; Table S6: Environmental impact categories and measurement units for each category for the EF characterization method; Table S7: Lifecycle impact and percentage contribution for electricity generation option most applicable to the Pakistan electricity grid mix; Table S8: Mid-Point hot-spot analysis from the environmental life cycle impact assessment of study water treatment plants. The blue bars represent horizontal correlation. The heat map colors represent vertical correlation; Table S9: End-Point hot-spot analysis from the environmental life cycle impact assessment of study water treatment plants; Table S10: Lifecycle environmental impact assessment and the characterized impacts for all the possible pathways.

Author Contributions

Conceptualization, S.J., S.P. and S.U.U.J.; methodology, S.J., S.P. and S.U.U.J.; software, R.A. and H.W.; validation, F.S.; formal analysis, R.A. and H.W.; investigation, S.J., S.P. and S.U.U.J.; resources, F.S.; data curation, F.S.; writing—original draft preparation, S.J., S.P. and S.U.U.J.; writing—review and editing, R.A., H.W. and K.A.G.; visualization, R.A. and H.W.; supervision, F.S., H.W. and K.A.G.; project administration F.S. and K.A.G. All authors have read and agreed to the published version of the manuscript.

Funding

This research received no external funding.

Informed Consent Statement

Not applicable.

Data Availability Statement

The data supporting the findings of this study is available within the article and its Supplementary Materials.

Acknowledgments

All the authors extend their appreciation to the Department of Biological Sciences, Bahria University, Islamabad for cooperating throughout the entire study. We would also extend appreciation to the management and staff at the CDA (Capital Development Authority), particularly Mohsin Imran from CDA Bulk Water Management, and WASA (Water and Sanitation Authority) for their support and co-operation throughout this research.

Conflicts of Interest

The authors declare no conflict of interest.

Abbreviations

TermAbbreviation
Green House GasesGHGs
Environmental Impact AssessmentEIA
Net Environmental Benefit AnalysisNEBA
International Organization for StandardizationISO
Rawal Lake Water Treatment PlantRLWTP
Sang-Jani Water Treatment PlantSJWTP
Water and Sanitation AgencyWASA
Rawalpindi Development AuthorityRDA
Capital Development AuthorityCDA
Islamabad Capital TerritoryICT
Total Dissolved SolidsTDS
LimeCaCO3
Life Cycle InventoryLCI
European Platform on Lifecycle AssessmentELCD
Heavy-Heavy Duty TrucksHDTs
Medium-Heavy Duty TrucksMDTs
Ocean-Going VesselOGV
Eastern Research GroupERG
Environmental FootprintEF
Antimicrobial Resistance GenesARGs
Virulence Factor Activity RelationshipsVFARs

References

  1. Kyung, D.; Kim, D.; Park, N.; Lee, W. Estimation of CO2 emission from water treatment plantModel development and application. J. Environ. Manag. 2013, 131, 74–81. [Google Scholar] [CrossRef]
  2. Raucher, R.S. Risks and Benefits of Energy Management for Drinking Water Utilities Subject Area: Efficient and Customer-Responsive Organization; AWWA Research Foundation: Washington, DC, USA, 2008. [Google Scholar]
  3. Bukhary, S.; Batista, J.; Ahmad, S. Design aspects, energy consumption evaluation, and offset for drinkingwater treatment operation. Water 2020, 12, 1772. [Google Scholar] [CrossRef]
  4. Waseem, H.; Abid, R.; Ali, J.; Oswald, C.J.; Gilbride, K.A. Wastewater-Based Epidemiology of SARS-CoV-2 and Other Respiratory Viruses: Bibliometric Tracking of the Last Decade and Emerging Research Directions. Water 2023, 15, 3460. [Google Scholar] [CrossRef]
  5. Xue, X.; Cashman, S.; Gaglione, A.; Mosley, J.; Weiss, L.; Ma, X.C.; Cashdollar, J.; Garland, J. Holistic analysis of urban water systems in the Greater Cincinnati region: (1) life cycle assessment and cost implications. Water Res. X 2019, 2, 100015. [Google Scholar] [CrossRef]
  6. Rothausen, S.G.S.A.; Conway, D. Greenhouse-gas emissions from energy use in the water sector. Nat. Clim. Change 2011, 1, 210–219. [Google Scholar] [CrossRef]
  7. WHO. A Global Overview of National Regulations and Standards for Drinking-Water Quality. Available online: https://www.who.int/publications/i/item/9789240023642 (accessed on 24 April 2021).
  8. Shahabadi, M.B.; Yerushalmi, L.; Haghighat, F. Impact of process design on greenhouse gas (GHG) generation by wastewater treatment plants. Water Res. 2009, 43, 2679–2687. [Google Scholar] [CrossRef]
  9. Qu, X.; Brame, J.; Li, Q.; Alvarez, P.J.J. Nanotechnology for a safe and sustainable water supply: Enabling integrated water treatment and reuse. Acc. Chem. Res. 2013, 46, 834–843. [Google Scholar] [CrossRef]
  10. Linley, S.; Leshuk, T.; Gu, F.X. Magnetically separable water treatment technologies and their role in future advanced water treatment: A patent review. Clean Soil Air Water 2013, 41, 1152–1156. [Google Scholar] [CrossRef]
  11. Issaoui, M.; Jellali, S.; Zorpas, A.A.; Dutournie, P. Membrane technology for sustainable water resources management: Challenges and future projections. Sustain. Chem. Pharm. 2022, 25, 100590. [Google Scholar] [CrossRef]
  12. Yang, M.; Peng, M.; Wu, D.; Feng, H.; Wang, Y.; Lv, Y.; Sun, F.; Sharma, S.; Che, Y.; Yang, K. Greenhouse gas emissions from wastewater treatment plants in China: Historical emissions and future mitigation potentials. Resour. Conserv. Recycl. 2023, 190, 106794. [Google Scholar] [CrossRef]
  13. Wang, J.; Zhang, N.; Xu, S.; Shao, Z.; Jiang, C.; Yuan, H.; Wang, C.; Zheng, X.; Chi, Y.; Zhang, W.; et al. Carbon footprint analysis and comprehensive evaluation of municipal wastewater treatment plants under different typical upgrading and reconstruction modes. Sci. Total Environ. 2023, 880, 163335. [Google Scholar] [CrossRef]
  14. Sala-Garrido, R.; Maziotis, A.; Mocholi-Arce, M.; Molinos-Senante, M. Assessing eco-efficiency of wastewater treatment plants: A cross-evaluation strategy. Sci. Total Environ. 2023, 900, 165839. [Google Scholar]
  15. Loubet, P.; Roux, P.; Loiseau, E.; Bellon-Maurel, V. Life cycle assessments of urban water systems: A comparative analysis of selected peer-reviewed literature. Water Res. 2014, 67, 187–202. [Google Scholar] [CrossRef]
  16. Bonton, A.; Bouchard, C.; Barbeau, B.; Jedrzejak, S. Comparative life cycle assessment of water treatment plants. Desalination 2012, 284, 42–54. [Google Scholar] [CrossRef]
  17. Rashid, S.S.; Harun, S.N.; Hanafiah, M.M.; Razman, K.K.; Liu, Y.Q.; Tholibon, D.A. Life Cycle Assessment and Its Application in Wastewater Treatment: A Brief Overview. Processes 2023, 11, 208. [Google Scholar] [CrossRef]
  18. ISO 14040; Environmental Assessment—Life Cycle Assessment—Principles and Framework; ISO: Geneva, Switzerland, 2009.
  19. Guinée, J. Handbook on Life Cycle Assessment—Operational Guide to the ISO Standards; Springer Science & Business Media: Berlin/Heidelberg, Germany, 2001; Volume 6. [Google Scholar]
  20. Guinee, J.B.; Heijungs, R.; Huppes, G.; Zamagni, A.; Masoni, P.; Buonamici, R.; Ekvall, T.; Rydberg, T. Life Cycle Assessment: Past; ACS Publications: Washington, DC, USA, 2011. [Google Scholar]
  21. Nizam, N.U.M.; Hanafiah, M.M.; Mahmoudi, E.; Halim, A.A.; Mohammad, A.W. The removal of anionic and cationic dyes from an aqueous solution using biomass-based activated carbon. Sci. Rep. 2021, 11, 8623. [Google Scholar] [CrossRef]
  22. Lemos, D.; Dias, A.C.; Gabarrell, X.; Arroja, L. Environmental assessment of an urban water system. J. Clean. Prod. 2013, 54, 157–165. [Google Scholar]
  23. Molinos-Senante, M.; Guzmán, C. Reducing CO2 emissions from drinking water treatment plants: A shadow price approach. Appl. Energy 2018, 210, 623–631. [Google Scholar] [CrossRef]
  24. Ji, R.; Qu, S. Investigation and evaluation of energy consumption performance for hospital buildings in China. Sustainability 2019, 11, 1724. [Google Scholar] [CrossRef]
  25. Barrios, R.; Siebel, M.; van der Helm, A.; Bosklopper, K.; Gijzen, H. Environmental and financial life cycle impact assessment of drinking water production at Waternet. J. Clean. Prod. 2008, 16, 471–476. [Google Scholar] [CrossRef]
  26. Saad, A.; Elginoz, N.; Germirli Babuna, F.; Iskender, G. Life cycle assessment of a large water treatment plant in Turkey. Environ. Sci. Pollut. Res. 2019, 26, 14823–14834. [Google Scholar] [CrossRef]
  27. Sabeen, A.H.; Noor, Z.Z.; Ngadi, N.; Almuraisy, S.; Raheem, A.B. Quantification of environmental impacts of domestic wastewater treatment using life cycle assessment: A review. J. Clean. Prod. 2018, 190, 221–233. [Google Scholar] [CrossRef]
  28. Jolliet, O.; Soucy, G.; Houillon, G. Life Cycle Analysis: Understanding and Carrying Out an Eco-Balance; PPUR Presses Polytechniques: Lausanne, Switzerland, 2010; Volume 23, ISBN 2880748860. [Google Scholar]
  29. Kolotzek, C.; Helbig, C.; Thorenz, A.; Reller, A.; Tuma, A. A company-oriented model for the assessment of raw material supply risks, environmental impact and social implications. J. Clean. Prod. 2018, 176, 566–580. [Google Scholar] [CrossRef]
  30. Nicholson, S.; Ugursal, V.I. A lifecycle assessment-based environmental analysis of building operationally energy efficient houses in Nova Scotia. J. Build. Eng. 2023, 76, 107102. [Google Scholar] [CrossRef]
  31. Raluy, R.G.; Serra, L.; Uche, J. Life Cycle Assessment of water production technologies. Part 1: Life Cycle Assessment of different commercial desalination technologies (MSF, MED, RO). Int. J. Life Cycle Assess. 2005, 10, 285–293. [Google Scholar] [CrossRef]
  32. Li, Y.; Xu, Y.; Fu, Z.; Li, W.; Zheng, L.; Li, M. Assessment of energy use and environmental impacts of wastewater treatment plants in the entire life cycle: A system meta-analysis. Environ. Res. 2021, 198, 110458. [Google Scholar] [CrossRef]
  33. Hong, Y.; Park, J.; Ha, Y. Trade-offs between water security and energy use: Lifecycle energy of water supply options in Paju, Korea. J. Clean. Prod. 2023, 423, 138601. [Google Scholar] [CrossRef]
  34. Panesar, D.K.; Seto, K.E.; Churchill, C.J. Erratum to: Impact of the selection of functional unit on the life cycle assessment of green concrete. Int. J. Life Cycle Assess. 2017, 22, 1987–1988. [Google Scholar] [CrossRef]
  35. Aleisa, E.; Al-Mutiri, A. Life Cycle Assessment for Tertiary Wastewater Treatment and Reuse versus Seawater Desalination. In Proceedings of the IOP Conference Series: Earth and Environmental Science; IOP Publishing: Bristol, UK, 2022; Volume 1026, p. 12001. [Google Scholar]
  36. Garfí, M.; Cadena, E.; Sanchez-Ramos, D.; Ferrer, I. Life cycle assessment of drinking water: Comparing conventional water treatment, reverse osmosis and mineral water in glass and plastic bottles. J. Clean. Prod. 2016, 137, 997–1003. [Google Scholar] [CrossRef]
  37. McNamara, G.; Fitzsimons, L.; Horrigan, M.; Phelan, T.; Delaure, Y.; Corcoran, B.; Doherty, E.; Clifford, E. Life cycle assessment of wastewater treatment plants in Ireland. J. Sustain. Dev. Energy Water Environ. Syst. 2016, 4, 216–233. [Google Scholar] [CrossRef]
  38. Zijp, M.C.; Van der Laan, H. Life Cycle Assessment of Two Drinking Water Production Schemes. 2015, 38. Available online: https://rivm.openrepository.com/handle/10029/596126 (accessed on 25 April 2021).
  39. Pak-EPA Water Quality Monitoring Report of Rawal Lake. Available online: https://environment.gov.pk/PublicationDetail/NDUwOGJiODYtMzEwOS00YmU1LWI5ZmMtMjdhMzMzNDQ2NTZl (accessed on 3 March 2023).
  40. Pervez, S. Sang-Jani Water Treatment Plant Islamabad, Pakistan. New Tap. 2016, 1–9. [Google Scholar]
  41. Pervez, S. Rawal Lake Water Treatment Plant Rawalpindi, Pakistan. Netw. Water Technol. Asian Pac. 2016, 1–11. [Google Scholar]
  42. United Nations Economic Commission for Europe Carbon Neutrality in the UNECE Region: Integrated Life-Cycle Assessment of Electricity Sources UNITED NATIONS ECONOMIC COMMISSION FOR EUROPE. 2021, 108. Available online: https://unece.org/sites/default/files/2021-10/LCA-2.pdf (accessed on 25 April 2021).
  43. USDA. Federal LCA Commons. Available online: https://www.lcacommons.gov/lca-collaboration/ (accessed on 23 April 2023).
  44. GreenDelta openLCA Nexus. Available online: https://nexus.openlca.org/ (accessed on 24 April 2023).
  45. Rebello, T.A.; Roque, R.P.; Gonçalves, R.F.; Calmon, J.L.; Queiroz, L.M. Life cycle assessment of urban wastewater treatment plants: A critical analysis and guideline proposal. Water Sci. Technol. 2021, 83, 501–514. [Google Scholar] [CrossRef]
  46. Karnaningroem, N.; Anggraeni, D.R. Study of Life Cycle Assessment (LCA) on Water Treatment. In Proceedings of the IOP Conference Series: Earth and Environmental Science; IOP Publishing: Bristol, UK, 2021; Volume 799, p. 12036. [Google Scholar]
  47. Mohapatra, P.K.; Siebel, M.A.; Gijzen, H.J.; Van der Hoek, J.P.; Groot, C.A. Improving eco-efficiency of Amsterdam water supply: A LCA approach. J. Water Supply Res. Technol. AQUA 2002, 51, 217–227. [Google Scholar] [CrossRef]
  48. Durrani, A.A.; Khan, I.A.; Ahmad, M.I. Analysis of Electric Power Generation Growth in Pakistan: Falling into the Vicious Cycle of Coal. Eng 2021, 2, 296–311. [Google Scholar] [CrossRef]
  49. Nahlik, M.J.; Kaehr, A.T.; Chester, M.V.; Horvath, A.; Taptich, M.N. Goods Movement Life Cycle Assessment for Greenhouse Gas Reduction Goals. J. Ind. Ecol. 2016, 20, 317–328. [Google Scholar] [CrossRef]
  50. Raccary, B.; Loubet, P.; Peres, C.; Sonnemann, G. Life cycle assessment of sample preparation in analytical chemistry: A case study on SBSE and SPE techniques. Adv. Sample Prep. 2022, 1, 100009. [Google Scholar] [CrossRef]
  51. ERG. Available online: https://www.erg.com/ (accessed on 27 July 2023).
  52. Amores, M.J.; Meneses, M.; Pasqualino, J.; Antón, A.; Castells, F. Environmental assessment of urban water cycle on Mediterranean conditions by LCA approach. J. Clean. Prod. 2013, 43, 84–92. [Google Scholar] [CrossRef]
  53. Rejane Rigon, M.; Zortea, R.; Alberto Mendes Moraes, C.; Célia Espinosa Modolo, R. Suggestion of Life Cycle Impact Assessment Methodology: Selection Criteria for Environmental Impact Categories. In New Frontiers on Life Cycle Assessment: Theory and Application; IntechOpen: London, UK, 2019. [Google Scholar] [CrossRef]
  54. Guinée, J.B.; de Koning, A.; Heijungs, R. Life cycle assessment-based Absolute Environmental Sustainability Assessment is also relative. J. Ind. Ecol. 2022, 26, 673–682. [Google Scholar] [CrossRef]
  55. Patel, K.; Singh, S.K. A life cycle approach to environmental assessment of wastewater and sludge treatment processes. Water Environ. J. 2022, 36, 412–424. [Google Scholar] [CrossRef]
  56. Thompson, M.; Moussavi, S.; Li, S.; Barutha, P.; Dvorak, B. Environmental Life Cycle Assessment of small water resource recovery facilities: Comparison of mechanical and lagoon systems. Water Res. 2022, 215, 118234. [Google Scholar] [CrossRef]
  57. Mendes, N.C. Characterization Methods and Models for Life Cycle Impact Assessment: Analysis and Subsidies for Application in Brazil; Universidade de São Paulo: São Paulo, Brazil, 2013. [Google Scholar]
  58. Commission, E. Environmental Footprint. Available online: https://eplca.jrc.ec.europa.eu/EnvironmentalFootprint.html (accessed on 24 June 2023).
  59. Saquib, S.; Gupta, A.; Joshi, A. Emerging water crisis: Impact of urbanization on water resources and constructed wetlands as a nature-based solution (NbS). In Current Directions in Water Scarcity Research; Elsevier: Amsterdam, The Netherlands, 2022; Volume 6, pp. 447–468. [Google Scholar]
  60. Martos, A.; Pacheco-Torres, R.; Ordóñez, J.; Jadraque-Gago, E. Towards successful environmental performance of sustainable cities: Intervening sectors. A review. Renew. Sustain. Energy Rev. 2016, 57, 479–495. [Google Scholar] [CrossRef]
  61. Byrne, D.M.; Lohman, H.A.C.; Cook, S.M.; Peters, G.M.; Guest, J.S. Life cycle assessment (LCA) of urban water infrastructure: Emerging approaches to balance objectives and inform comprehensive decision-making. Environ. Sci. Water Res. Technol. 2017, 3, 1002–1014. [Google Scholar] [CrossRef]
  62. Liu, L.; Jensen, M.B. Green infrastructure for sustainable urban water management: Practices of five forerunner cities. Cities 2018, 74, 126–133. [Google Scholar] [CrossRef]
  63. Agyeman, J.; Angus, B. The role of civic environmentalism in the pursuit of sustainable communities. J. Environ. Plan. Manag. 2003, 46, 345–363. [Google Scholar] [CrossRef]
  64. Mensah-Akutteh, H.; Buamah, R.; Wiafe, S.; Nyarko, K.B. Raw water quality variations and its effect on the water treatment processes. Cogent Eng. 2022, 9, 2122152. [Google Scholar] [CrossRef]
  65. Lopes, R.H.; Silva, C.R.D.V.; Salvador, P.T.C. de O.; Silva, Í. de S.; Heller, L.; Uchôa, S.A. da C. Surveillance of Drinking Water Quality Worldwide: Scoping Review Protocol. Int. J. Environ. Res. Public Health 2022, 19, 8989. [Google Scholar] [CrossRef]
  66. Lin, L.; Yang, H.; Xu, X. Effects of Water Pollution on Human Health and Disease Heterogeneity: A Review. Front. Environ. Sci. 2022, 10, 880246. [Google Scholar] [CrossRef]
  67. Bhagwat, V.R. Safety of water used in food production. In Food Safety and Human Health; Elsevier: Amsterdam, The Netherlands, 2019; pp. 219–247. ISBN 9780128163337. [Google Scholar]
  68. Molinos-Senante, M.; Sala-Garrido, R. Energy intensity of treating drinking water: Understanding the influence of factors. Appl. Energy 2017, 202, 275–281. [Google Scholar] [CrossRef]
  69. Schwarzenegger, A. California’s Water—Energy Relationship. California, USA 2005. Available online: http://large.stanford.edu/courses/2012/ph240/spearrin1/docs/CEC-700-2005-011-SF.PDF (accessed on 25 April 2021).
  70. Wen, W.H.; Zhong, L.; Fu, X.; Spooner, S. World Resources Institute Water Energy Nexus in The Urban Water Source Selection: A Case Study from Qingdao; The World Resources Institute: Washington, DC, USA, 2014; pp. 1–124. [Google Scholar]
  71. Bukhary, S.; Batista, J.; Ahmad, S. An analysis of energy consumption and the use of renewables for a small drinkingwater treatment plant. Water 2020, 12, 28. [Google Scholar] [CrossRef]
  72. Ali, K.A.; Ahmad, M.I.; Yusup, Y. Issues, impacts, and mitigations of carbon dioxide emissions in the building sector. Sustainability 2020, 12, 7427. [Google Scholar] [CrossRef]
  73. Mahgoub, M.E.-S.M.; van der Steen, N.P.; Abu-Zeid, K.; Vairavamoorthy, K. Towards sustainability in urban water: A life cycle analysis of the urban water system of Alexandria City, Egypt. J. Clean. Prod. 2010, 18, 1100–1106. [Google Scholar] [CrossRef]
  74. Sathya, R.; Arasu, M.V.; Al-Dhabi, N.A.; Vijayaraghavan, P.; Ilavenil, S.; Rejiniemon, T.S. Towards sustainable wastewater treatment by biological methodsA challenges and advantages of recent technologies. Urban Clim. 2023, 47, 101378. [Google Scholar] [CrossRef]
  75. Zhang, L.; Jiang, L.; Zhang, J.; Li, J.; Peng, Y. Enhancing nitrogen removal through directly integrating anammox into mainstream wastewater treatment: Advantageous, issues and future study. Bioresour. Technol. 2022, 362, 127827. [Google Scholar] [CrossRef]
  76. Waseem, H.; Williams, M.R.; Jameel, S.; Hashsham, S.A. Antimicrobial resistance in the environment. Water Environ. Res. 2018, 90, 865–884. [Google Scholar] [CrossRef]
  77. Waseem, H.; Williams, M.R.; Stedtfeld, T.; Chai, B.; Stedtfeld, R.D.; Cole, J.R.; Tiedje, J.M.; Hashsham, S.A. Virulence factor activity relationships (VFARs): A bioinformatics perspective. Environ. Sci. Process. Impacts 2017, 19, 247–260. [Google Scholar] [CrossRef]
  78. Peng, X.; Jiang, Y.; Chen, Z.; Osman, A.I.; Farghali, M.; Rooney, D.W.; Yap, P.S. Recycling municipal, agricultural and industrial waste into energy, fertilizers, food and construction materials, and economic feasibility: A review. Environ. Chem. Lett. 2023, 21, 765–801. [Google Scholar] [CrossRef]
  79. Lodato, C.; Tonini, D.; Damgaard, A.; Fruergaard Astrup, T. A process-oriented life-cycle assessment (LCA) model for environmental and resource-related technologies (EASETECH). Int. J. Life Cycle Assess. 2020, 25, 73–88. [Google Scholar] [CrossRef]
  80. Haun, P.; Müller, P.; Traverso, M. Improving automated Life Cycle Assessment with Life Cycle Inventory model constructs. J. Clean. Prod. 2022, 370, 133452. [Google Scholar] [CrossRef]
  81. Palazzo, J.; Geyer, R.; Suh, S. A review of methods for characterizing the environmental consequences of actions in life cycle assessment. J. Ind. Ecol. 2020, 24, 815–829. [Google Scholar] [CrossRef]
  82. Tayyebi, F.; Golabi, M.; Jaafarzadeh, N. Life cycle assessment, a decision-making tool in wastewater treatment systems: A case study wastewater treatment plant of Ahvaz, Iran. Appl. Water Sci. 2023, 13, 145. [Google Scholar] [CrossRef]
  83. Hellström, D. Cradle-to-Gate LCA of Water Treatment Alternatives A case study performed for Norrvatten’ s future Cradle-to-Gate LCA of Water Treatment Alternatives A case study performed for Norrvatten’ s future waterwork expansion Siddharth Selvarajan Examiner 2020. Available online: https://www.diva-portal.org/smash/get/diva2:1519618/FULLTEXT01.pdf (accessed on 25 April 2021).
  84. Parravicini, V.; Nielsen, P.H.; Thornberg, D.; Pistocchi, A. Evaluation of greenhouse gas emissions from the European urban wastewater sector, and options for their reduction. Sci. Total Environ. 2022, 838, 156322. [Google Scholar] [CrossRef]
  85. Flores-Alsina, X.; Arnell, M.; Corominas, L.; Sweetapple, C.; Fu, G.; Butler, D.; Vanrolleghem, P.A.; Gernaey, K.V.; Jeppsson, U. Benchmarking strategies to control GHG production and emissions. In Quantification and Modelling of Fugitive Greenhouse Gas Emissions from Urban Water Systems; IWA Publishing: London, UK, 2022; pp. 213–228. [Google Scholar]
  86. Bai, R.L.; Jin, L.; Sun, S.R.; Cheng, Y.; Wei, Y. Quantification of greenhouse gas emission from wastewater treatment plants. Greenh. Gases Sci. Technol. 2022, 12, 587–601. [Google Scholar] [CrossRef]
Figure 1. Geographic locations of the Sang-Jani and Rawal Lake water treatment plants. The inset represents the zoomed aerial view of the plants.
Sustainability 15 16172 g001
Figure 2. Water quality at the RLWTP for the year 2021. Left: Line plot of raw and treated water turbidity variation over 12-month period. Right: Box plot for the raw water turbidity.
Sustainability 15 16172 g002
Figure 3. Life cycle impact results for SJWTP (top) and RLWTP (bottom). Distinct unit treatment processes are represented by color schemes with respect to the life cycle impact categories.
Sustainability 15 16172 g003
Figure 4. Cummulative life cycle impact results for each treatment process. Selected elementary flows are represented with distinct colors. The emission compartments mainly include air and water. The scale represents the emission concentration per functional unit.
Sustainability 15 16172 g004
Figure 5. Life cycle impact results for SJWTP and RLWTP for the selected elementary flows. Each system is presented with a distinct color. The scale represents the cumulative percentage of each elementary flow.
Sustainability 15 16172 g005
Figure 6. Breakdown of impacts contributed by the chemicals and raw material used throughout the treatment process.
Sustainability 15 16172 g006
Figure 7. Lifecycle impact generated from the electricity grid options sourced to power the water treatment systems.
Sustainability 15 16172 g007
Figure 8. Comparative analysis of the life cycle impacts calculated for both the water treatment plants. The impacts are presented with respect to each impact category, with a relative comparison of both systems.
Sustainability 15 16172 g008
Table 1. Unit treatment processes representing the process train and the treatment parameters for RLWTP and SJWTP.
Operating ConditionsAerationFlash MixerCoagulant DosingCoagulant MixingFlocculation
VariablesFlow RateInitial TurbidityFinal TurbidityNumber of blowersBlower ratingAir flow rateNumber of mixersImpeller DiameterVelocity GradientMotor ratingCoagulant typeCoagulant Feed RateNumber of pumpsCoagulant Feed pump ratingSolution ConcentrationHydraulic Retention TimeNumber of motorsMotor ratingShaft paddle flocculatorClari-flocculatorVelocity GradientFlocculator motorClari-flocculator motorHydraulic Retention Time
UNITSm3/dNTUNTUNo#kWm3/minNo#ms-1kWTypemg/LNo#kW%minNo#kWNo#No#s-1kWkWmin
RLWTP79,500100.529.2621.64509.2Alum2030.9151.2211.18633264.51315
SJWTP98,0008.331NA NANA 21.643811Alum1530.75151.5611Zig-Zag FlocculatorNANANANA29
SedimentationFiltrationService PumpsDisinfectionLime DoseStorage & DistributionBackwashingSludge
VariablesRotating full bridge clarifier Rectangular ClarifierSurface Loading RateVelocity GradientRapid Sand FilterMedia SizeFilter DepthFlow RatePump ratingOperating hoursFeed RateChlorine Dosing pump ratingFeed RateDosing pump ratingNumber of pumpsPower Factor APower Factor BPump kVA rating APump kVA rating APipelineAir scour pump ratingBackwashing flowBackwashing periodSludge Volume
UNITSNo#No#m/hm/minNo#mmmm/hkWh/dmg/LkWmg/LkwNo#NANAkVAkVAmkWm3/m2.mincycle/dkg/m3
RLWTP312.550.6160.951.45.45.32420.90.20.9NANANAGravityGravity-93.250.610.01
SJWTP081.30.6200.60.765.3NA10.75NA60.4 (×3)0.8 (×3)970140013,16051.4740.610.0083
Disclaimer/Publisher’s Note: The statements, opinions and data contained in all publications are solely those of the individual author(s) and contributor(s) and not of MDPI and/or the editor(s). MDPI and/or the editor(s) disclaim responsibility for any injury to people or property resulting from any ideas, methods, instructions or products referred to in the content.

