Article

Life Cycle Assessment of Ordinary Portland Cement Production in South Africa: Mid-Point and End-Point Approaches

by
Busola Dorcas Akintayo
1,*,
Oludolapo Akanni Olanrewaju
1 and
Oludolapo Ibrahim Olanrewaju
2,3
1
Department of Industrial Engineering, Faculty of Engineering and the Built Environment, Durban, University of Technology, Durban 4001, South Africa
2
Wellington School of Architecture, Victoria University of Wellington, Wellington 6011, New Zealand
3
Whitireia and Weltec/Te Pūkenga—New Zealand Institute of Skills and Technology, Wellington 6011, New Zealand
*
Author to whom correspondence should be addressed.
Sustainability 2024, 16(7), 3001; https://doi.org/10.3390/su16073001
Submission received: 5 December 2023 / Revised: 1 March 2024 / Accepted: 14 March 2024 / Published: 3 April 2024
(This article belongs to the Special Issue Life Cycle Assessment as an Environmental Sustainability Tool)

Abstract

:
Several environmental impacts are associated with cement production, ranging from high greenhouse gas (GHG) levels to high energy consumption (fossil fuel and electricity) to high resource usage. Due to the growing demand for cement in the industry and limited studies in South Africa, it is essential to evaluate the environmental impact of cement production in the South African context. In this study, an analysis of the production model of South African (SA) cement plants was carried out to quantify its impacts and decipher how they consequently affect lives, resources, and the ecosystem. This study carried out a Life Cycle Assessment (LCA) of cement using both the mid-point and end-point approaches of the Life Cycle Impact Assessment (LCIA). This study carried out a cradle-to-gate analysis of 1 kg of cement produced in a typical SA plant. The result showed that for every 1 kg of cement produced, 0.993 CO2 eq was emitted into the atmosphere; 98.8% was actual CO₂ emission, and its resultant effect was global warming, which causes changes in climatic conditions. Also, 1.6 kg of 1,4-Dichlorobenzene (1,4-DCB) eq was emitted into the air and water, which caused high toxicity in these media, and for every 1 kg of cement produced, 0.139 kg of oil eq was produced, and its effect was seen in fossil resources’ scarcity. The end-point result showed that 55,404 was the potential number of human lives that could be endangered annually; 133 species had the potential to be endangered annually, and the effect of a potential scarcity of resources caused a total marginal price increase of ZAR 6.2 billion due to these damages. In conclusion, this study prescribed mitigation and adaptation strategies to counter these environmental impacts.

1. Introduction

The global landscape is currently undergoing a substantial change in population growth, leading to the increasing migration of individuals to urban areas, and thus, resulting in the growing need for infrastructure and housing, which therefore establishes the construction industry to play a crucial role in influencing the trajectory of global development [1]. In 2019, the global production of cement reached a staggering 4.2 billion tons [2], with projections indicating a possible moderate growth rate of 1.3–1.4% over the next decade, resulting in an estimated production volume of 4.83 billion metric tons by the year 2030. Cement, being an essential construction material, plays a pivotal role in meeting the increasing demands of the construction sector by offering the necessary structural integrity to support the growing population and urban development.
Despite the cement industry’s importance for environmental development sustainability, its manufacture has had various environmental consequences, such as high energy consumption, excessive use of raw materials, and noteworthy global warming. This results in the alteration of climatic conditions due to the significant greenhouse gas (GHG) emissions in the atmosphere that affect lives, including human beings and other species. The cement industry has been reported to be responsible for approximately 12–15% of the overall energy consumption in the global industrial sector [3], with energy costing about 20–40% of the entire production cost [4]. In 2018, cement was reported to account for around 8% of global carbon dioxide (CO₂) emissions, 5% of which can be attributed to emissions generated during the production process, excluding those resulting from energy generation [5]. Given the environmental concerns raised about the cement industry, researchers have engaged in various life cycle assessment (LCA) studies for cement production.
The use of LCA for the assessment of the environmental impacts of the cement manufacturing process has been explored by different scientists in various parts of the world. According to the results of an LCA study, which employed the use of a plant to produce two types of OPC in Brazil [6], transportation, clinker, and fossil fuel production were responsible for more than 70% of CO2 equivalent and 90% of CFC-11 equivalent. In 2014, the LCA conducted by [7] for cement and clinker produced from 11 plants in Italy showed that over 85% of the total CO2 was from clinker production, while over 79% was from the entire production process. Their result further showed that cement production accounted for 793 kg/mg of global warming potential. They also suggested that over 95% of the energy source of a cement plant in Italy was from a non-renewable primary energy source. In another study, [8] observed that the cement production process was the major emitter of about 4.92 GT of CO2 emissions, contributing about 94.7% of the entire emissions caused by the South African (SA) concrete industry for an average of 45.4 MT of concrete produced yearly in SA between 2005 and 2008. In 2019, the world ranking showed South Africa to be among the top eight countries and the first in the continent of Africa in relation to the emission of GHGs, and this could be attributed to the dependence on the use of coal [9]. In South Africa, industries like cement are known to play a crucial role in the achievement of the developmental goals set by the government for the reduction in GHG emissions. Notwithstanding, the cement industry remains one of the highest GHG emitters in the country, accounting for approximately 1% of the total emitted GHGs [10]. Thus, the environmental impact of the cement manufacturing process in South Africa cannot be overemphasized, and this heralds the need for LCA studies that can help reduce these emissions.
Generally, South African cement plants make use of the dry process, and therefore produce only the “Ordinary Portland Cement (OPC) and blended cement Products” [11]. In different parts of the world, LCA studies on OPC have focused on the use of alternative fuels [6,12], the environmental performance of different concrete mixes [13], the use of waste materials in cement production [14], and the assessment of the environmental impacts of the production process of cement in different geographical contexts [15]. However, in South Africa, only a few research works are available on the use of LCA for OPC [10,11], which leaves room for more studies to be carried out. Thus, this study seeks to fill this gap by exploring the environmental impacts of OPC production in SA using a problem- and damage-oriented approach, with the view of providing policymakers with possible pathways to help reduce the impact of cement production on the environment in South Africa.
Additionally, no studies have combined this assessment with an uncertainty analysis and projected annual impacts on human health, ecosystems, and resources based on South Africa’s population and cement demand. This research fills these gaps by providing a comprehensive LCA integrating mid-point categories, end-point damages, uncertainty analysis, and projected nationwide impacts.
This study also discusses difficulties in conducting LCA in Africa, such as the lack of localized life cycle inventory databases. Utilizing the best available secondary data coupled with sensitivity analysis, this research provides valuable insights into environmental hotspots that can inform emissions regulations and sustainability initiatives for the South African cement industry. The findings present potential pathways for enhancing efficiency and adopting cleaner production technologies to mitigate future impacts.

2. Literature Review

2.1. Cement in the Sub-Saharan Africa (SSA) Region

One of the most energy-intensive industries is the cement industry, as the cost of energy is about 20–40% of the entire production cost. This energy is often more frequently utilized as fuel for the calcination process and as electricity for pulverizing the resources and even the cement itself. The energy consumed is about 4–5 GJ/ton which amounts to 8–10 EJ annually [4]. In 2004, about 75 cement plants were in operation, as seen in Table 1. Many of these plants were located in Zimbabwe, Tanzania, SA, Senegal, Nigeria, Kenya, and Ethiopia. Africa’s market growth was about 9.4% in 2006, which gave producers space to increase their market share and expand their plant capacities. Also, the cement industry accounted for about 5–8% of the global anthropogenic CO2 gas annually; while half of this CO2 was from clinker production, the other half was from fossil fuels. Cement production is, therefore, a major emitter of greenhouse gas, making CO2 mitigation important for this industry. According to a US Geological Survey (USGS) [16], data available from 2006 showed that cement plant capacity in SSA (excluding SA) was 41.6 Mtpa and had 45 MTs capacity in 2004 from about 75 plants in the continent, including SA, as shown in Table 2.
West and East Africa had 29 cement plants each, showing that most of the cement workstations were situated in these regions. The central and southern African (mostly South Africa) regions had 11 and 6 plants, respectively. Many of the plants were in the following countries: SA, Kenya, Nigeria, Zimbabwe, Ethiopia, Ghana, Senegal, and Tanzania. The cement industry had its thrust in Nigeria with about nine plant stations and a capacity of 9.75 Mtpa, which was about 51% of the production capacity of West Africa. In East Africa, however, Kenya was taking the lead with about 2.75 Mt capacity, and Cameroon in the central African region was ahead with 1.2 Mt production capacity in the year 2004. In 2004, the total amount of cement produced in Africa, excluding SA, was 17.3 Mt, and West Africa accounted for about 51% of this production, followed by 39% in East Africa, then Central Africa with 10%. The 51% from West Africa, which was about 2.1 MTs, was mainly from Nigeria, Ghana, and Senegal. Excluding SA, the capacity utilization in the rest of SSA cement was low (54%) as of 2004 when compared with that of India and SA, which was around 80–94%. Different regions varied in their consumption; while East Africa had a capacity utilization of about 76%, West Africa had 46%, and Central Africa had 48%.
Nigeria’s utilization capacity was as low as 22%. In East and Central Africa, the specific energy consumption of the plants varied from 105 to 140 kWh/ton and 800 to 1000 kcal/kg of clinker for specific thermal energy. It was distributed mostly in West Africa and East Africa and accounted for about 46% and 42%, respectively. In these regions, the major countries with the potential to cause high CO2 emissions were Tanzania, Nigeria, Ethiopia, Kenya, and Senegal. As one of the most expensive inputs in the cement production process, energy could reduce the entire production cost if used more efficiently. Particular attention should be paid to countries with high production capacity in different regions to improve the plants’ energy consumption efficiency and effectiveness. Such countries are Togo, Nigeria, and Senegal in West Africa, and Tanzania, Kenya, and Ethiopia in East Africa [18]. Increased cement consumption in Africa has been primarily a function of four factors: rising populations, rising infrastructure expenses, economic growth, and increasing urbanization. The International Monetary Fund (IMF) forecasted the economic growth in SSA to be over 5% annually in the next six years from 2014 [19]. Generally, urbanization, acceleration of economic performance for sustainability, and demographic growth have driven Africa’s industrial, residential, and commercial sectors, as well as tourism and structural projects such as dams (for power), roads, and railways, among others. In certain countries, post-conflict reconstruction has equally driven the infrastructure sector.
The cement industry in Africa is primarily operated by five top international companies, which are Lafarge (France), CEMEX (Mexico), Holcim (Switzerland), Italcementi (Italy), and Heidelberg Cement (Germany). However, the CEMEX and Italcementi plants are mostly situated in North Africa. The production capacity of the CEMEX plant in Egypt is 4.9 MTs per year, whereas Italcementi has five plants with 12 MTs per year in Egypt and three plants and one grinding unit in Morocco with about 3.2 MTs capacity. Of the top five companies, only Heidelberg, Holcim, and Lafarge have companies across several countries in the SSA regions, with Lafarge being the largest of them, all in the eastern and southern parts of Africa, while Heidelberg has its operations concentrated in West and Central Africa. However, these companies have had their ups and downs. In 2007 and early 2008, Heidelberg sold all its operating plants in Nigeria and Niger and had plans to sell its plants in other SSA regions. As part of the restructuring of the cement industry in SSA, part of the Dangote group business in Nigeria, Dangote Cement, entered the cement market with only two cement plants and two terminals with a total production capacity of 11 MTs annually (7 MTs from plants and 4 MTs from terminals). However, the order of things changed when Dangote Cement of Nigeria entered the cement market in the 2000s. Dangote became the single largest producer with growth into 14 other countries on the continent and a production capacity of 20.7 MTs, as seen in Table 2. The post-merger Holcim-Lafarge became the largest producer on the continent, with a capacity of 22.5+ MT per annum [20]. These are two potential major rivals with a history of collusive conduct in African countries’ cement sector, but other globally recommended organizations could weaken the competition. Holcim also implemented important restructuring by divesting significant operations in southern and East Africa to a new company, AfriSam.

2.2. Overview of Existing Studies

Table 3 presents a summary of related studies on the environmental impacts of cement. Several studies have applied life cycle assessment (LCA) to quantify the environmental impacts of cement production worldwide. Meshram and Kumar (2022) [21] performed a cradle-to-gate LCA to compare the manufacturing of geopolymer cement and regular Portland cement in India. Geopolymer cement was discovered to decrease impacts such as global warming potential and toxicity indicators by 49–77% as a result of avoiding clinker generation. Nevertheless, their study did not investigate the damage categories at the end-point or conduct any sensitivity analysis. In a study by Morsali (2016), [22] LCA was employed to examine the effects of cement production on human health, ecosystems, and resources in western Europe. The analysis revealed that cement production and coal mining were the primary contributors to environmental harm, while cement and crude oil extraction were the main drivers of resource depletion. One drawback was the exclusion of sensitivity analysis. Nigri et al. (2010) [23] used LCA to examine the environmental implications of cement manufacture in Brazil. The authors employed an LCA methodology based on ISO 14040 principles to quantify the consequences throughout the product life cycle, from raw material extraction to end-of-life disposal. The analysis revealed that the production process has various effects, including greenhouse gas emissions from fuel burning, air pollution from particulate emissions, and solid waste formation. In another study, Li et al. (2015) [24] analyzed cement production in China and Japan. They concluded that China had larger emissions, except for CO₂, due to less advanced technology. Also, like the preceding literature, sensitivity analysis was not performed.
Stafford, Raupp-Pereira et al. (2016) [6] used LCA to investigate the Brazilian cement sector for its environmental impacts. Transportation has the most significant impact, followed by fossil fuel use and clinker production. Only mid-point impact categories were examined. Their study discovered that transportation and fossil fuel use were substantial contributors to environmental damage. The authors argued that substituting fossil fuels with alternative fuels could reduce consequences, but transportation distances must be considered. Using LCA, Stafford, Dias et al. (2016) [15] provided a detailed assessment of a cement plant’s environmental impacts. By utilizing primary data, their study achieved greater precision and accuracy in the conclusions they obtained. It demonstrated the advantages of utilizing alternate fuels to mitigate effects. Nevertheless, the range of damage categories was limited compared to ReCiPe and other more recent methodologies. Furthermore, Bushi and Meil (2014) [25] estimated the advantages of mixed Portland–limestone cement over ordinary Portland cement in Canada. Reducing clinker content with limestone addition reduced effects by 7–12%. Tun et al. (2020) [26] used a life cycle assessment to quantitatively compare the global warming potential of several cement production methods. It identified the potential for reducing cement’s carbon footprint, such as employing mixed cement and carbon sequestration in cement kiln dust. However, the current high demand for cement may limit the adoption of mixed cement in the USA.
The studies, as mentioned above, have provided useful insights on which this present study will be based. However, in contrast to previous work, this study adopts a holistic approach to life cycle impact evaluation by incorporating both mid-point and end-point indicators using the ReCiPe methodology. This comprehensively assesses several damage categories, encompassing human health, ecosystems, and resources. In addition, sensitivity analysis is conducted to evaluate the reliability of outcomes in light of uncertainty in modeling assumptions. Previous research lacked concurrent investigations into mid-point models, end-point models, and sensitivity analysis. Prior research on the cement sector in South Africa has primarily focused on mid-point analysis, with limited scope. This study provides novel insights into this geographical context by measuring the individual impacts and damages experienced.
Table 3. Summary of previous life cycle assessment studies on cement production.
ReferenceAimCountryThemesFindings
LCIA ApproachSensitivity AnalysisDamage to Human Health
(Meshram and Kumar, 2022)To conduct a life cycle assessment (LCA) of two types of geopolymer cement and compare it to traditional Portland cement in an Indian context.IndiaCradle-to-gate life cycle assessment following ISO 14040 principles.Not consideredNot consideredGeopolymer cement based on fly ash and blast furnace slag reduces global warming potential by 70%, abiotic depletion potential fossil by 49%, abiotic depletion potential element by 34%, and terrestrial ecotoxicity potential by 77% compared to ordinary Portland cement.
(Morsali, 2016)To analyze the life cycle impacts of Portland cement production on human health, ecosystem quality, and resource depletion using LCA methodology.Western Europe Life cycle assessment using SimaPro software and Eco-Indicator 99 methodology.Not consideredNot consideredThe cement production process and coal tailings landfilling caused the most damage to human health. Crude oil and coal mining were the biggest contributors to resource depletion. Cement production, uranium mining, and transportation caused the most damage to ecosystem quality. The key emissions contributing to impacts were CO₂, NOx, SOx, CH4, and metals like Ni, Zn, Cr, As, and Cd.
(Nigri et al., 2010)Apply life cycle assessment (LCA) to evaluate environmental impacts of Portland cement manufacturing.Brazil Life cycle assessment based on ISO 14040 principles.Not consideredNot consideredCement production causes environmental impacts, including greenhouse gas emissions, air pollution, and waste generation.
(Li et al., 2015)Evaluate the environmental impacts of cement production in China and identify potential improvements.ChinaLife cycle assessment, comparative analysis.Not consideredNot consideredThe study finds China has higher emissions except for CO₂ compared to Japan due to less advanced technologies.
(Stafford, Raupp-Pereira, et al., 2016)To analyze the environmental impacts of cement production at a Brazilian cement plant through life cycle assessment (LCA).BrazilLife cycle assessment guided by ISO 14040 and ISO 14044.Not consideredNot consideredTransportation had the largest contribution to most environmental impact categories. After transportation, fossil fuel production and the cement kiln were the major contributors.
(Stafford, Dias, et al., 2016)Assess the environmental impacts of using wastes as fuel in cement manufacturing in a plant in southern Europe.PortugalLife cycle assessment based on primary data from the cement plant and secondary data from the Ecoinvent database.Not consideredNot consideredAtmospheric emissions from the kiln were the main contributor to most impact categories except abiotic depletion. Using alternative fuels like refuse-derived fuel and scrap tires reduced impacts compared to studies using only fossil fuels.
(Bushi and Meil, 2014)To quantify the environmental impacts of Portland limestone cement (PLC) compared to ordinary Portland cement (OPC) using life cycle assessment.CanadaCradle-to-gate life cycle assessment of cement and concrete mixes following ISO standards.Not consideredNot consideredPLC has 9–12% lower environmental impacts than OPC across all indicators studied. PLC concrete mixes have 7–9% lower impacts than OPC. Reducing clinker content in cement through PLC reduces energy use and emissions.
(Tun et al., 2020)To evaluate the environmental impacts of cement production in Myanmar using life cycle assessment (LCA) and identify key contributors to impacts.MyanmarLife cycle assessment following ISO standards, using site-specific data from eight cement plants in Myanmar.Not consideredNot consideredMajor impacts, including climate change, photochemical oxidant formation, particulate matter formation, terrestrial acidification, and fossil resource scarcity, were observed. The main contributors to these impacts were CO₂, NOx, SO2, and PM2.5 emissions from clinker production and fossil fuel use. Among the various damage categories, human health emerged as the most affected.
(Huntzinger and Eatmon, 2009)Assess the environmental impacts of four cement manufacturing processes: traditional Portland cement, blended cement with natural pozzolans, cement production with CO₂ sequestration in cement kiln dust (CKD), and cement production with CKD recycling [27].United StatesLife cycle assessment using SimaPro software to model the environmental impacts of different cement production processes. The functional unit of analysis was the production of 1 ton of cement.Not consideredNot consideredBlended cement with natural pozzolans had the lowest global warming potential.
Carbon sequestration in CKD reduced global warming potential by about 5% compared to traditional Portland cement.
Present studyTo conduct a life cycle assessment of the environmental impacts of cement production in a typical South African plant.South AfricaLife cycle assessment using mid-point and end-point approaches on 1 kg of cement produced.ConsideredConsideredTo be presented in the discussion section.
In contrast to other cement manufacturing LCA studies, the primary innovative elements of this research are incorporating a comprehensive damage assessment and sensitivity analysis to address the shortcomings identified in the existing literature. Additionally, this study projects the annual potential number of human lives and endangered species in South Africa, considering the country’s cement demand and population. Furthermore, the monetary value of resource depletion is computed. The findings will give the South African cement industry a comprehensive insight into important environmental sustainability indicators and how they can be enhanced.

2.3. Contributions to Knowledge

This study on the LCA of cement production at a plant in South Africa enhances the regional comprehension of the environmental consequences associated with cement manufacturing. This analysis utilizes South Africa-specific data to measure cement output, in contrast to prior studies that have examined the production in other countries such as India, China, Brazil, Portugal, Canada, Myanmar, and the United States.
The inclusion of sensitivity analysis and assessment of human health impacts in the present study contributes to the existing literature on LCA of cement manufacture. Only a limited number of previous research studies have conducted sensitivity analyses or evaluated the extent of damage to human health. LCA offers an additional understanding of the crucial factors that influence the impacts of cement and their consequent implications for human welfare.
In addition, although the effects of climate change, air pollution, and resource depletion have been well examined, this analysis specifically focuses on South Africa. It quantifies the magnitude of these challenges concerning domestic cement production. Comparing contributions to impacts within the production process and across different damage categories aids in identifying areas to focus on for maximum benefit in future efforts.
Overall, this study provides a comprehensive examination of the life cycle impacts of cement manufacturing, focusing specifically on South Africa. It gives localized insights, evaluates sensitivity, quantifies human health damage, and expands the existing global and domestic knowledge base.

3. Methods

LCA gives a holistic view of the entire production process. Effective application of LCA is a function of the intended goal to be achieved in a study. Thus, there is flexibility in the implementation of LCA from one study to another based on the defined goal [28,29,30]. The four stages of LCA, as recommended by ISO, include the following: (1) Goal and scope definition, (2) Life cycle Inventory Analysis (LCI), (3) Life Cycle Impact Assessment (LCIA), and (4) Interpretation [30,31]
The present study employs the ReCiPe technique [32] to assess the impact of the life cycle, incorporating both mid-point and end-point indicators. The integration of these methods offers a comprehensive outlook on the possible environmental consequences of cement manufacturing in South Africa. The mid-point technique categorizes inventory flows into impact categories, such as climate change and toxicity, based on distinct environmental mechanisms [33]. One significant benefit of using the mid-point method is its ability to offer transparency by providing contributions to different impact categories without any subjective weighting between the categories. Nevertheless, the absence of integration is a drawback, as the impact categories remain distinct. On the other hand, the end-point approach quantifies the harm caused to human health, ecosystems, and resources, allowing for a comprehensive assessment of the total possible consequences. However, end-point modeling depends on assumptions to establish a connection between inventory flows and damage categories. This phenomenon may underestimate the contributions made by specific compounds and increase uncertainties [32,34].
Relying exclusively on mid-point or end-point approaches entails inherent compromises [35]. The mid-point approach quantifies the contributions to environmental impacts but does not account for the overall integrated damages. On the other side, the end-point analysis offers a comprehensive view of the total damage but does not clearly highlight the specific contributions of pollutants. A combined mid-point and end-point method allows for harnessing the benefits of both strategies [33,35]. The mid-point assessment identifies the individual environmental mechanisms that are affected by certain contributions, whereas the end-point analysis indicates the potential overall harm caused. Collectively, they offer a more comprehensive perspective on emissions and the resulting harm than each approach individually.
The ReCiPe methodology was selected because it can ensure uniform calculations from mid-point to end-point inside a single framework [32]. This study offers a full assessment of potential impacts resulting from cement production by including both LCIA methodologies. The aim is to give valuable information for developing effective mitigation solutions. The Life Cycle Assessment (LCA) adheres to the ISO requirements for the aim, inventory, and interpretation stages as outlined in ISO 2006 [36].

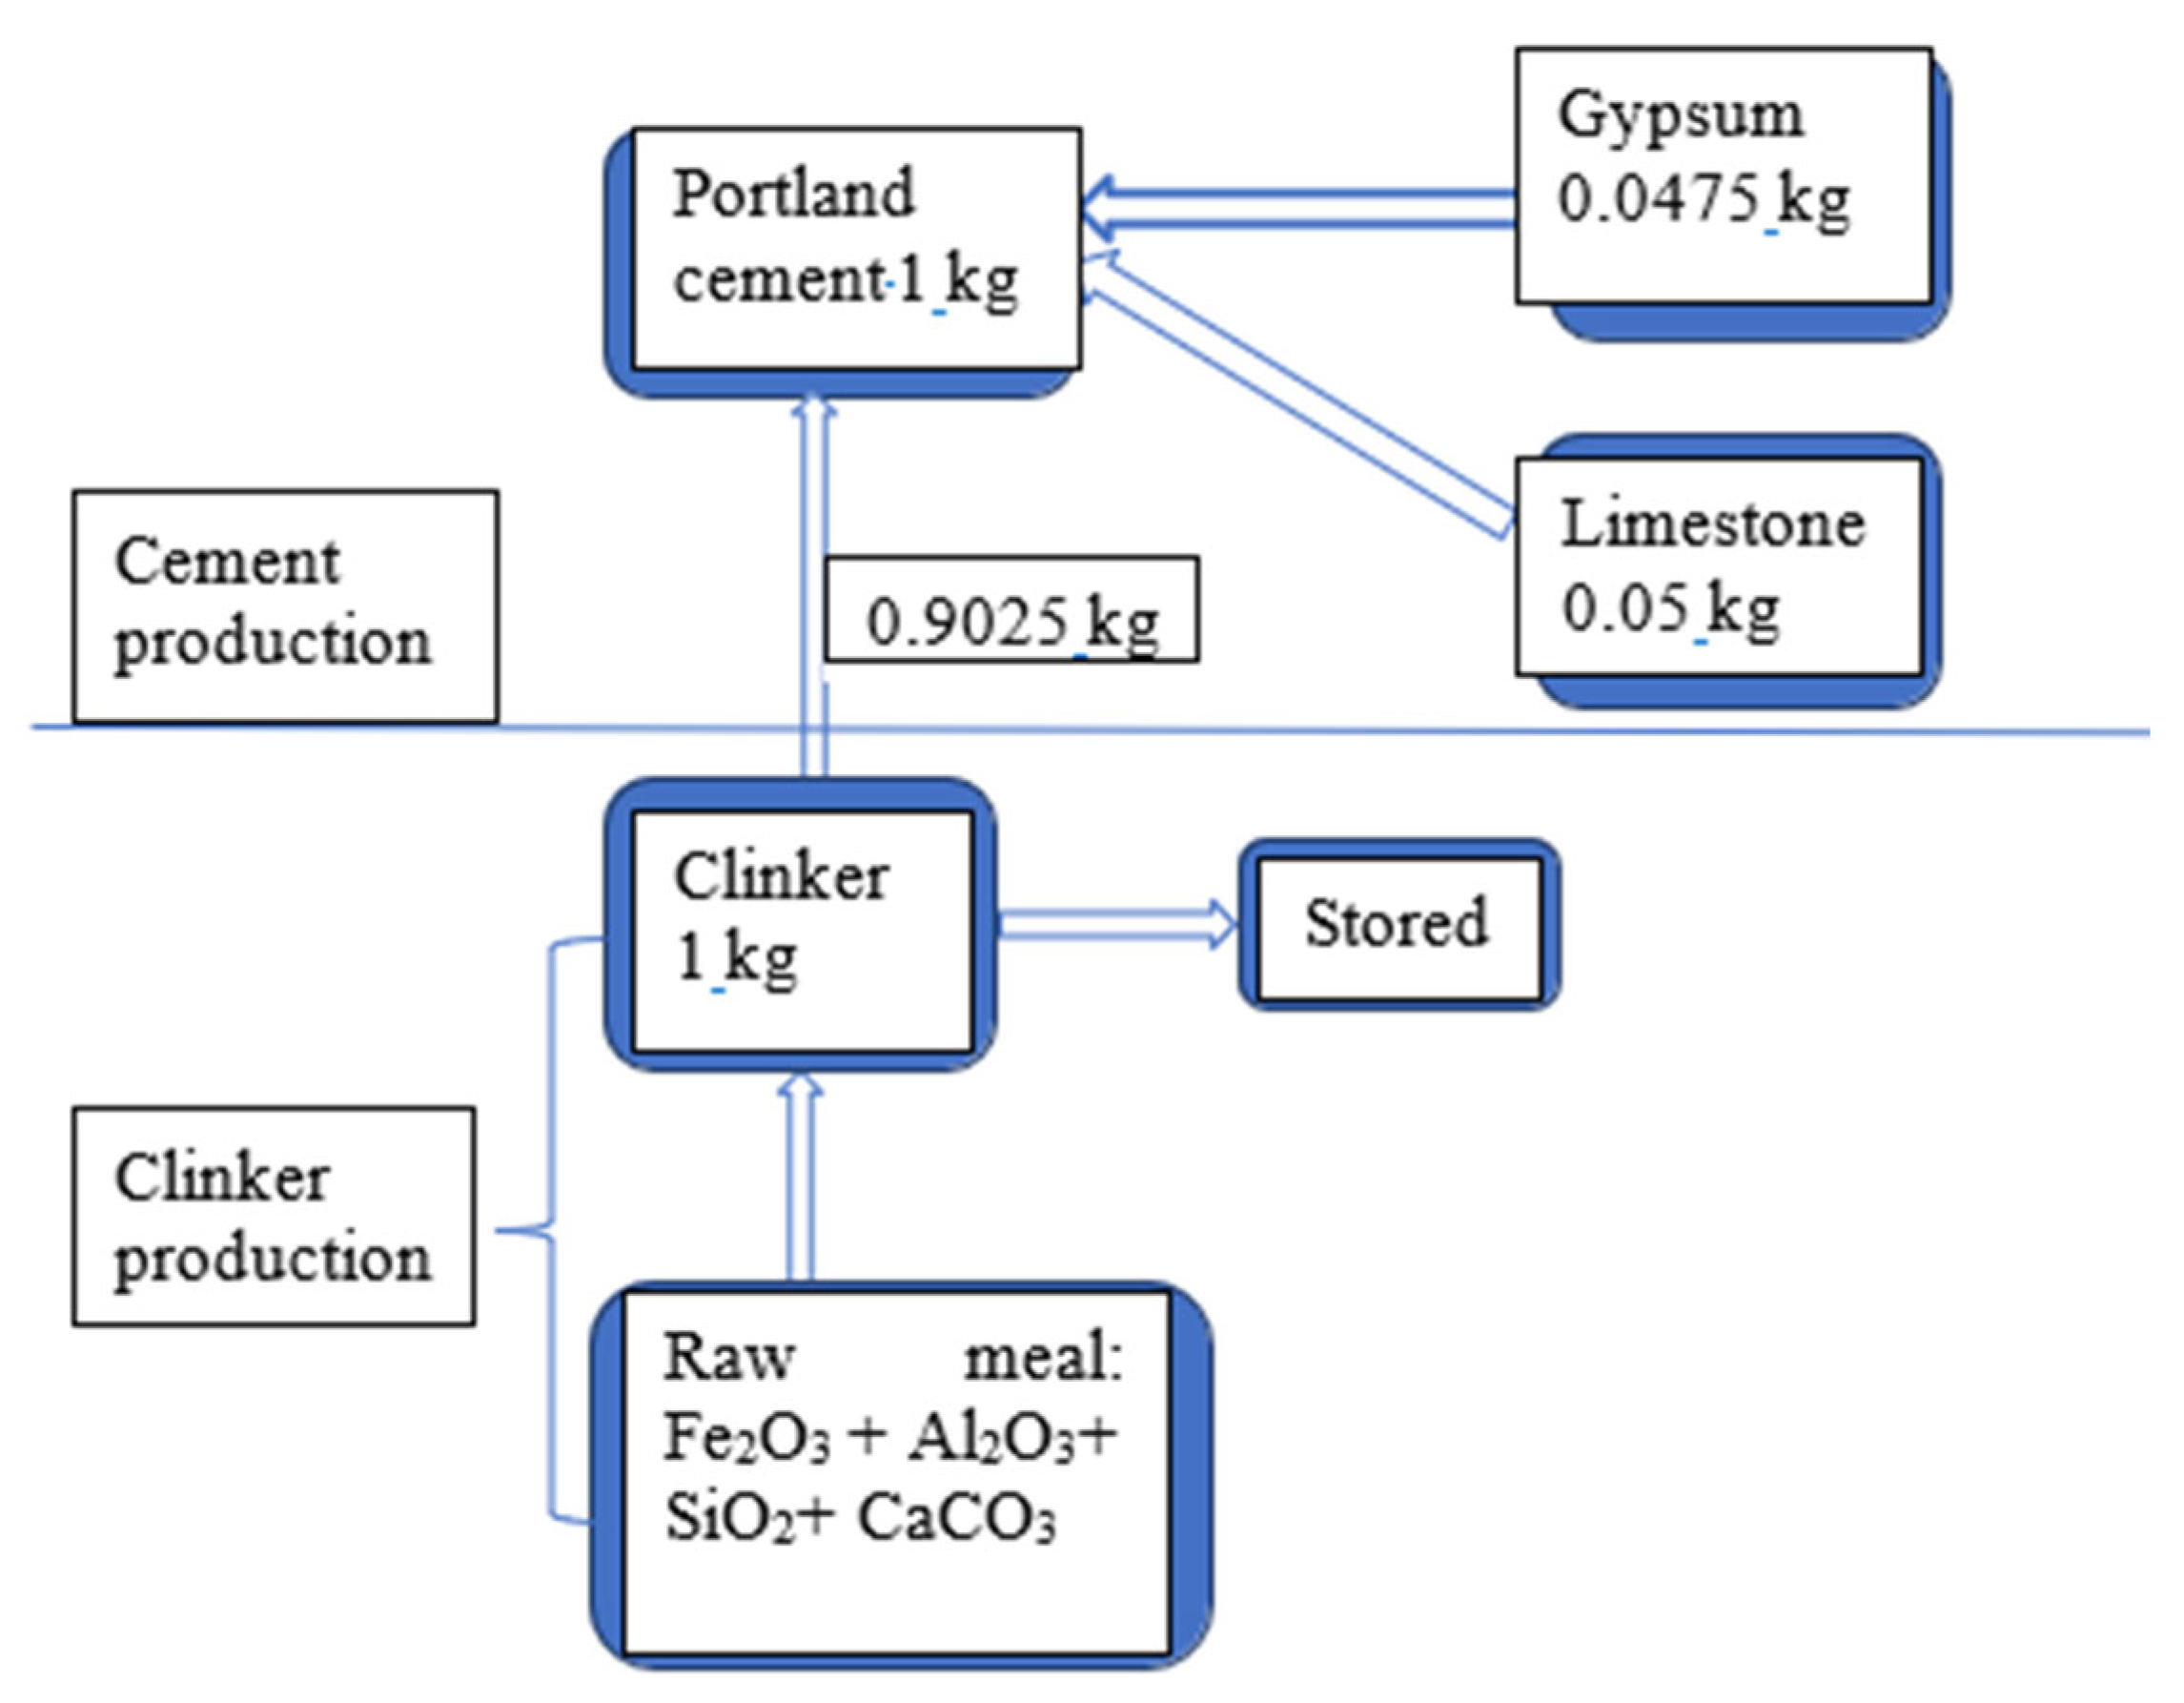
3.1. Goal and Scope Definition

It is very important to clearly define the goal when carrying out a life cycle assessment of a process or product. The scope definition of an LCA study describes the jurisdiction of the assessment. Thus, the following must be clearly explained in the scope definition: the system to be studied and its function, the functional unit, the system boundaries, the types of impact and impact assessment method, data quality requirements, and the assumptions and limitations [37,38]. In this study, the functional unit is the kg of cement, so the results would also be in kg. This study aimed to carry out a life cycle assessment of 1 kg of cement produced in a typical South African cement industry. This study only covered the ‘cradle-to-gate’ assessment of the cement’s production process; the data used for this analysis were from the extraction of raw material to cement production. This study did not consider the packaging, use, disposal/end-of-life, or waste treatment data. The software used for the LCA in this study is SimaPro 9.1.1. Figure 1 gives a summarized material flow diagram for producing 1 kg of Portland cement. The intended audience of this study includes researchers, policymakers, and the cement industry community in South Africa. The intended application of this study is to improve the environmental impacts of the cement industry in South Africa.

3.2. Life Cycle Inventory

LCI analysis involves the compilation of input and output inventory data that are consistent with the product under assessment and have several environmental coverages [39]. For the cement industry, a cradle-to-gate inventory involves all the processes, raw materials, and essential requirements to make cement ready. Secondary data from the Ecoinvent database were used for this study due to lack of localized data. The Ecoinvent 3.6 database documentation of clinker production and Portland cement production in South Africa (ZA) can be seen in Tables S1 and S2 in the Supplementary Materials.

3.3. Life Cycle Impact Assessment

LCIA is a multiple-issue tool used to evaluate potential environmental impacts in line with environmental resources (inputs and outputs) identified in the life cycle inventory. This assessment addresses several environmental issues, such as energy, climate change, and water pollution, thus giving room for a comprehensive evaluation of the impact of the system [31,40]. This attempts to establish the connection between a product and its potential environmental impact [41]. ReCiPe was used as the LCIA method in this study because it provides both mid-point and end-point results. Only a few studies that used both mid-point and end-point analysis of OPC in a typical South African plant have been conducted. Thus, there was a need to carry out more studies in this area.

3.4. Interpretation

Interpretation, the last of the stages, is an efficient method used to evaluate, compute, and categorize the results from the information provided by the LCI and the LCIA, and establish their effective relationships [42].

4. Results and Discussions

This study aimed to prioritize specific impacts (impacts with high value) and discuss remedies to reduce these impacts for the purpose of making meaningful recommendations on the most appropriate mitigation measures. It focused on identifying environmental impacts and hotspots emanating from the South African cement industry. This analysis embraced the cradle-to-gate approach of LCA without providing packaging and dispatching information. The mass-based functional unit used in this study is the kilogram; thus, 1 kg of Portland cement produced in a South African cement plant was used.

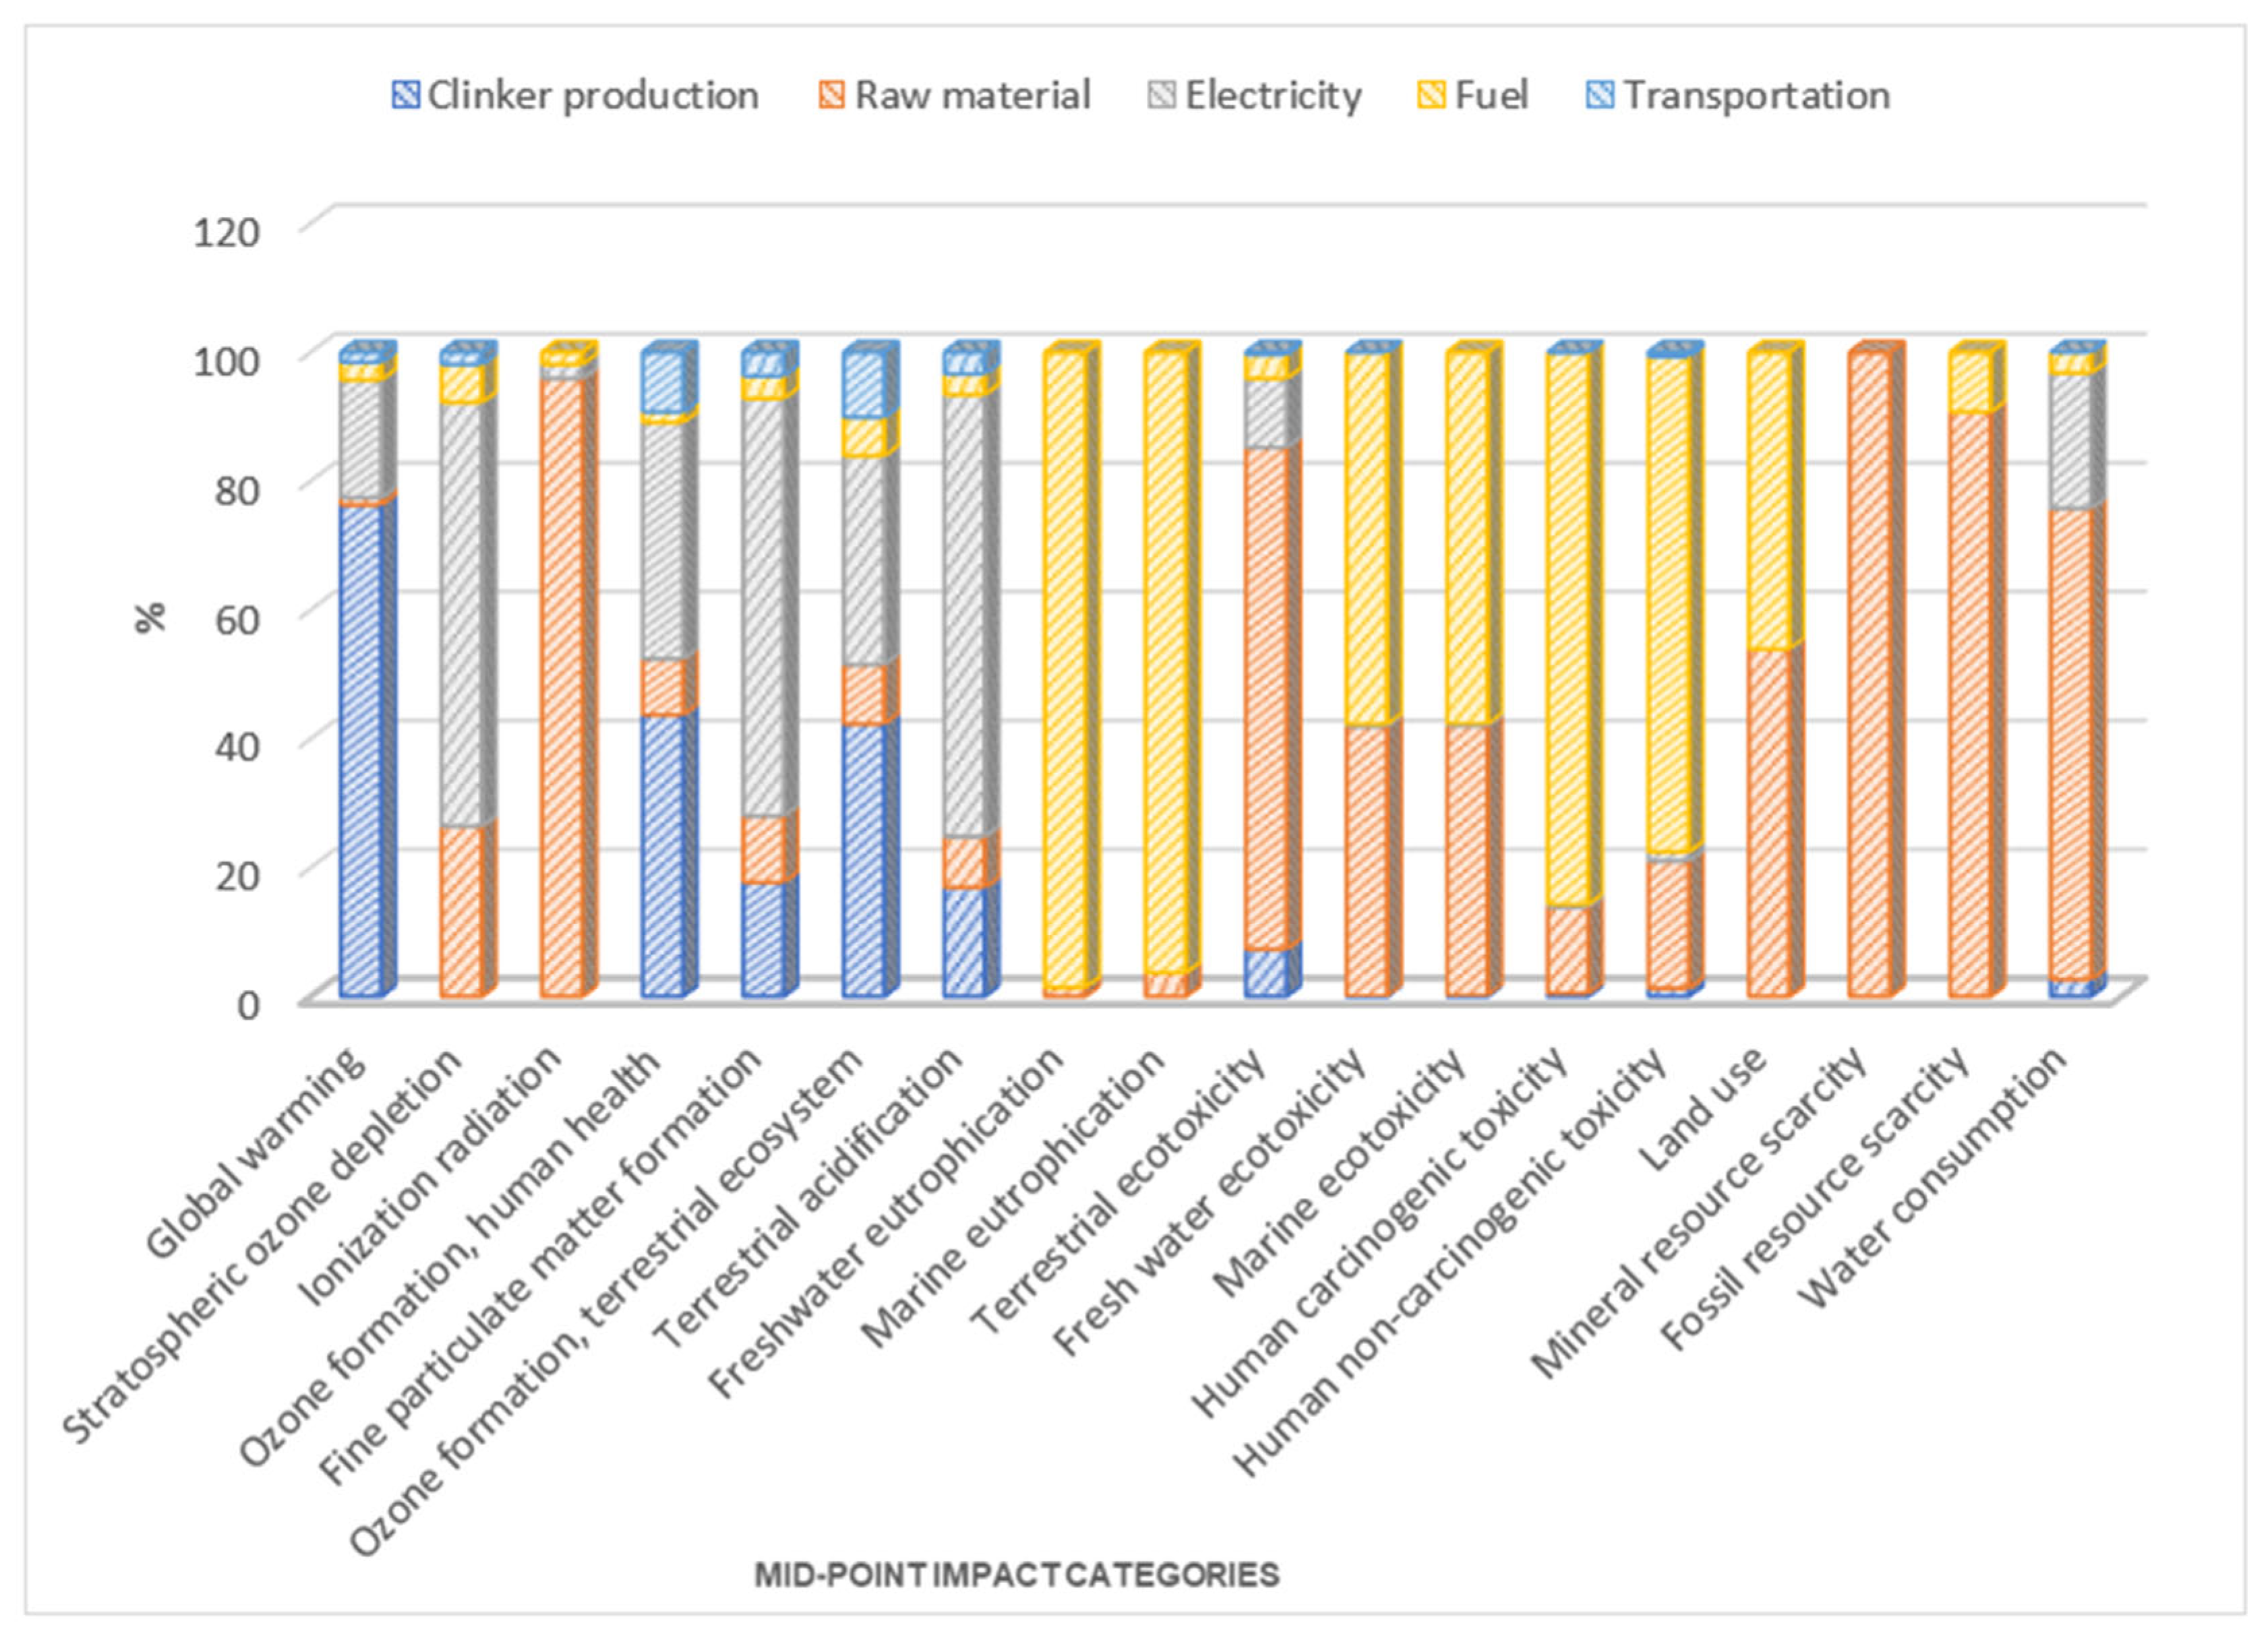
4.1. Mid-Point Analysis (Process-Oriented Approach)

In the mid-point approach, flows were categorized into the environmental impact to which they contribute. This approach presented about 18 impact categories, which covered several impacts. This approach helped to simplify numerous flows by streamlining them into a few prevalent environmental impacts. Figure 2 represents the contribution of five production processes to the impact categories, including (1) Clinker production, (2) Raw material consumption, (3) Electricity usage, (4) Fuel consumption, and (5) Transportation, where clinker production includes calcination and burning of fuel.

4.1.1. Clinker Production

The impact of cement manufacturing processes on climatic change has been the recent focus, with emphasis on the contribution of these emissions to global warming [42]. As presented in Figure 2, the clinker production stage has significantly contributed to global warming. It contributes 76.3% to the global warming impact category. In ozone formation (human health) and ozone formation (terrestrial), clinker production contributes 42.6% to each impact category. This comes with no surprise because the clinker production process is usually the most extensive stage and, thus, is associated with the largest amount of emission of gases into the atmosphere. Interestingly, these results were similar to those obtained by other groups of researchers in different parts of the globe, including Europe [15,43], Peru [44], and Brazil [45]. Fine particulate matter formation, terrestrial acidification, and terrestrial ecotoxicity contribute 17.7%, 16.9%, and 7.3%, respectively. The contribution of clinker production to freshwater ecotoxicity, marine ecotoxicity, human carcinogenic toxicity, human non-carcinogenic toxicity, and water consumption is 0.005%, 0.116%, 0.43%, 1.23%, and 2.6%, respectively: the contribution is minimal. Clinker production did not contribute to the stratospheric ozone depletion, ionization radiation, marine eutrophication, land use, mineral scarcity, and fuel resource scarcity impact categories.

4.1.2. Raw Material Consumption

As seen in Figure 2, raw material consumption contributed to all the impact categories. The largest contribution is seen in mineral scarcity (99.99%), ionization radiation (95.9%), freshwater scarcity (90.7%), terrestrial ecotoxicity (77.9%), and water consumption (73.1%). Other relatively large contributions are made by land use (53.9%), freshwater ecotoxicity (41.9%), and marine ecotoxicity (41.9%). Raw material consumption has made a minimal contribution to stratospheric ozone depletion (26.4%), human non-carcinogenic toxicity (19.8%), fine particulate matter formation (10.3%), ozone formation, terrestrial ecosystem (9.2%), ozone formation, human health (8.7%), and terrestrial acidification (7.9%). These results were better than the results obtained in another study [46]. According to that study, raw material consumption contributed 84%, 34%, 32%, and 13% to terrestrial ecotoxicity, human non-carcinogenic toxicity, ozone layer depletion, and terrestrial acidification, respectively [46]. Also, the results showed that marine eutrophication (3.67%), freshwater eutrophication (1.4%), and global warming (1.2%) have minimal impacts. The highest raw material consumption effect is found in mineral scarcity (99.99%).

4.1.3. Electricity Usage

Electricity usage has also been identified as a major contributor to the depletion of the ozone layers due to the fact that the electricity used is usually generated from fossil fuels, and this results in the emission of gasses that deplete the ozone layers [10]. As seen in Figure 2, electricity usage contributed 68.6% to terrestrial acidification, 65.8% to stratospheric ozone depletion, and 64.8% to fine particulate matter formation. These results were consistent with those obtained by a group of researchers in another study [10], which obtained values within the 65–71% range. However, these results were significantly different from those obtained from a study in Turkey [46], which reported terrestrial acidification due to electricity usage to be 6.5%. Electricity usage had a minimal contribution to ozone formation, human health (36.7%), ozone formation, terrestrial (32.4%), water consumption (21.04%), global warming (18.3%), and terrestrial ecotoxicity (10.7%). The contribution of electricity usage to ionization radiation was 2.2%, followed by human non-carcinogenic toxicity (1.38%), human carcinogenic toxicity (0.38%), freshwater ecotoxicity (0.32%), and marine ecotoxicity (0.26%). The impact categories are minimal. Electricity usage did not contribute to freshwater eutrophication, marine eutrophication, mineral scarcity, or freshwater scarcity.

4.1.4. Fuel Consumption

Fuel consumption significantly contributed to freshwater eutrophication, as seen in Figure 2. Other contributions were seen in human carcinogenic toxicity: 85.7%, human non-carcinogenic toxicity: 76.9%, freshwater scarcity: 57.765%, marine ecotoxicity: 57.7%, and land use: 46.1%. Minimal contributions were made to freshwater ecotoxicity: 9.3%, ozone formation, terrestrial: 6%, stratospheric ozone depletion: 5.9%, terrestrial ecotoxicity: 3.7%, marine eutrophication: 3.67%, fine particulate matter formation: 3.5%, terrestrial acidification: 3.2%, water consumption: 3.2%, global warming: 2.7%, ionization radiation: 1.9%, and ozone formation, human Health: 1.6%.

4.1.5. Transportation

As seen in Figure 2, the contribution of transportation usage to the impact category was minimal. The contributions made were 3.4% to terrestrial acidification, 1.9% to stratospheric ozone depletion, 3.7% to fine particulate matter formation, 9.3% to ozone formation, human health, 9.3% to ozone formation, terrestrial, 0.02% to water consumption, 1.6% to global warming, 0.4% to terrestrial ecotoxicity, 0.69% to human non-carcinogenic toxicity, 0.05% to human carcinogenic toxicity, and 0.005% to freshwater ecotoxicity.
The characterization results of the environmental impacts of 1 kg of cement using a mid-point are shown in Table 4 for every 1 kg of cement produced. Impacts with the same units were further grouped into global warming and fossil resource scarcity and were further analyzed because of their high impact value. Also, ozone formation (terrestrial and ecosystem) and toxicity (all forms of toxicity in the impact category) were further analyzed because of their relatively high value.

4.1.6. Ozone Formation
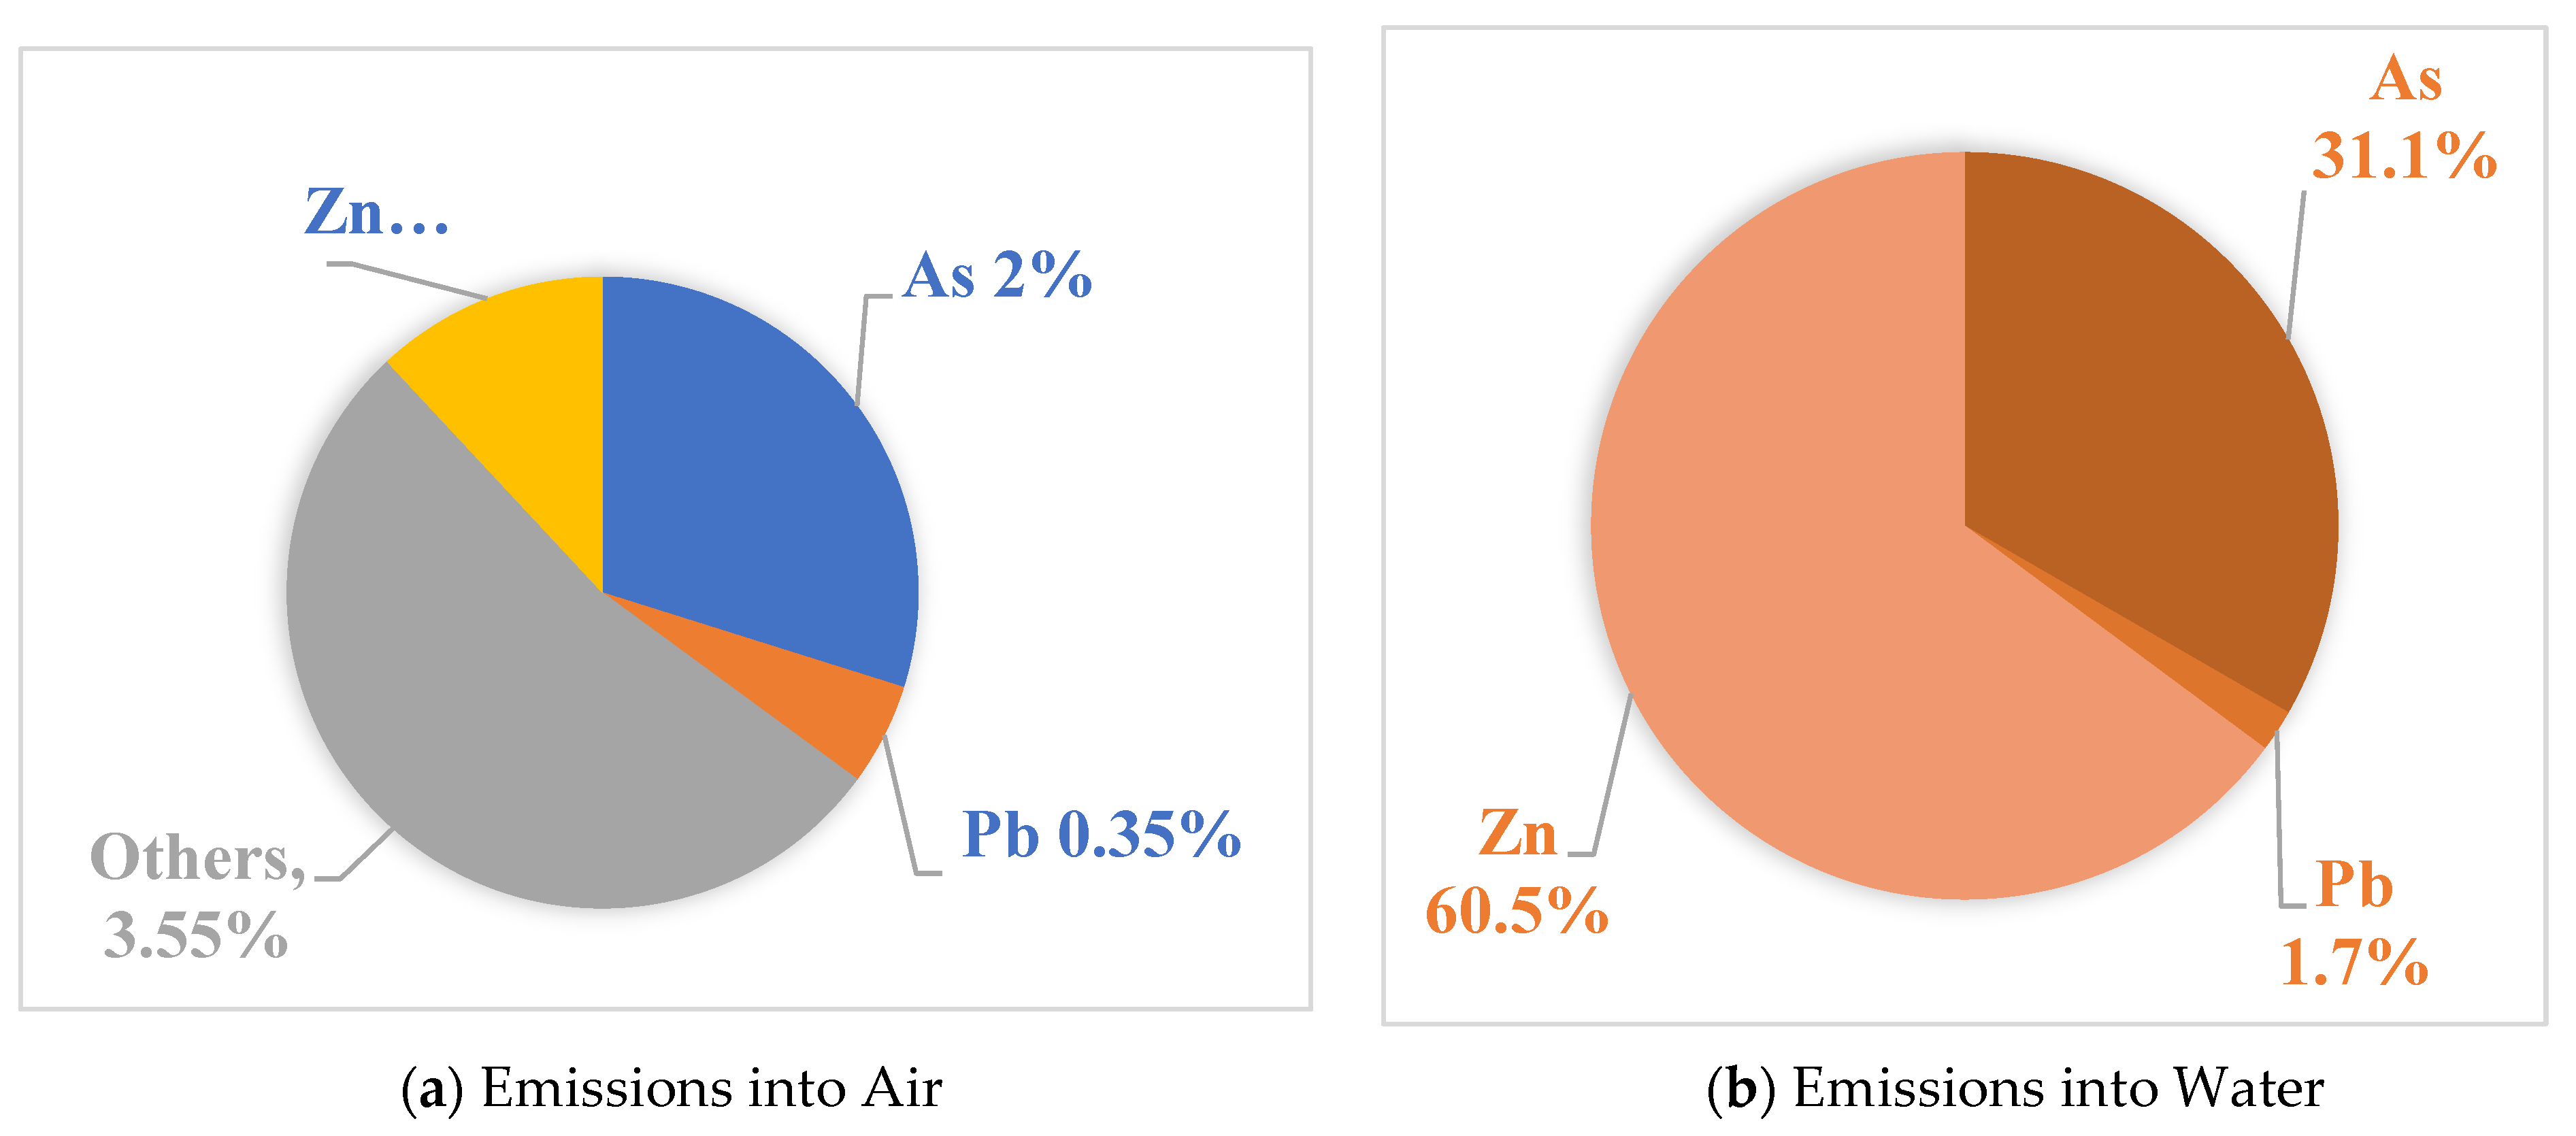
This includes ozone formation, human health (HH) and ozone formation, terrestrial ecosystem (TE). The formation of ozone formation ultraviolet (UV) radiation occurs naturally, which interacts with oxygen. Ozone layer formation is a protective mechanism to prevent the ash effect of UV radiation on the earth. The anthropogenic ozone formation starts with the emission of nitrogen oxides (NOx) and/or the non-methane volatile organic compound (NMVOC) into the atmosphere, and with chemical reactions, the ozone layer is formed. The high concentration of ozone formation in the atmosphere affects both humans and other species (the ecosystem). Its effect is seen in health complications and even the death of species [47]. As seen in Table 1, the environmental impact is seen in two phases with respect to human health and the terrestrial ecosystem. For every 1 kg of cement produced, 0.00421 kg of NOx eq is emitted into the atmosphere, and its effect is seen as ozone formation.
NOx is one of the major air pollutants. Its chemical reaction with oxygen in the atmosphere can produce nitrogen dioxide, and an increased concentration in the human system includes a comprehensive list of possible complications [48,49]. Further analysis was conducted on ozone formation, human health and ozone formation, terrestrial ecosystem to find what percentage of NOx was causing this impact category and to which sub-compartment it was emitted. The result of the analysis is presented in Figure 3. It is clear that this impact category is the result of the emission of 99.7% of NOx into the atmosphere. As presented earlier in Figure 1, in both cases, it was realized that about 42.6% of the NOx emission was from the clinker production stage, and about 37% of the emission was from the electricity consumption stage.

4.1.7. Toxicity

This includes marine ecotoxicity, freshwater toxicity, terrestrial ecotoxicity, human carcinogenic toxicity, and human non-carcinogenic toxicity. Toxicity hazardous stressors have the potential to cause harm to the ecosystem and, consequently, to humans through either physical, chemical, or biological platforms.
In humans, toxicants can be carcinogenic or non-carcinogenic in nature yet still very harmful. As seen in Table 1, for every 1 kg of cement produced, about 1.6 kg of 1,4-Dichlorobenzene (1,4-DCB) eq is produced, and its effect is seen in the toxicity of humans, water bodies, and the ecosystem as a whole. 1,4-DCB is an inorganic compound with high malodor and consists of molecules of benzene and chlorine. Terrestrial ecotoxicity and human non-carcinogenic toxicity were further analyzed, as they have significant value compared to the others, to ascertain the actual substance released into the environment, their percentage, and sub-compartments of emission.
Figure 4 represents the results of the analysis of terrestrial ecotoxicity. Table 1 shows that 1.04 of 1,4-DCB eq was produced, resulting in 63% copper, 12.3% antimony, and 7.1% mercury being emitted into the atmosphere, as shown in Figure 4. Human non-carcinogenic toxicity is mainly emitted into the water but also into the air. In Table 1, it is observed that 0.49 kg of 1,4-DCB eq was produced for every 1 kg of cement produced; this was a result of 60% of zinc, 31% of arsenic, and 1.7% of lead being emitted into the water body and a very minimal amount of this substance being emitted into the air as seen in Figure 5. In high concentrations, zinc presents a severe level of toxicity. As much as organisms for metabolism need it, it is only needed in trace amounts, and a high concentration is deadly to organisms.

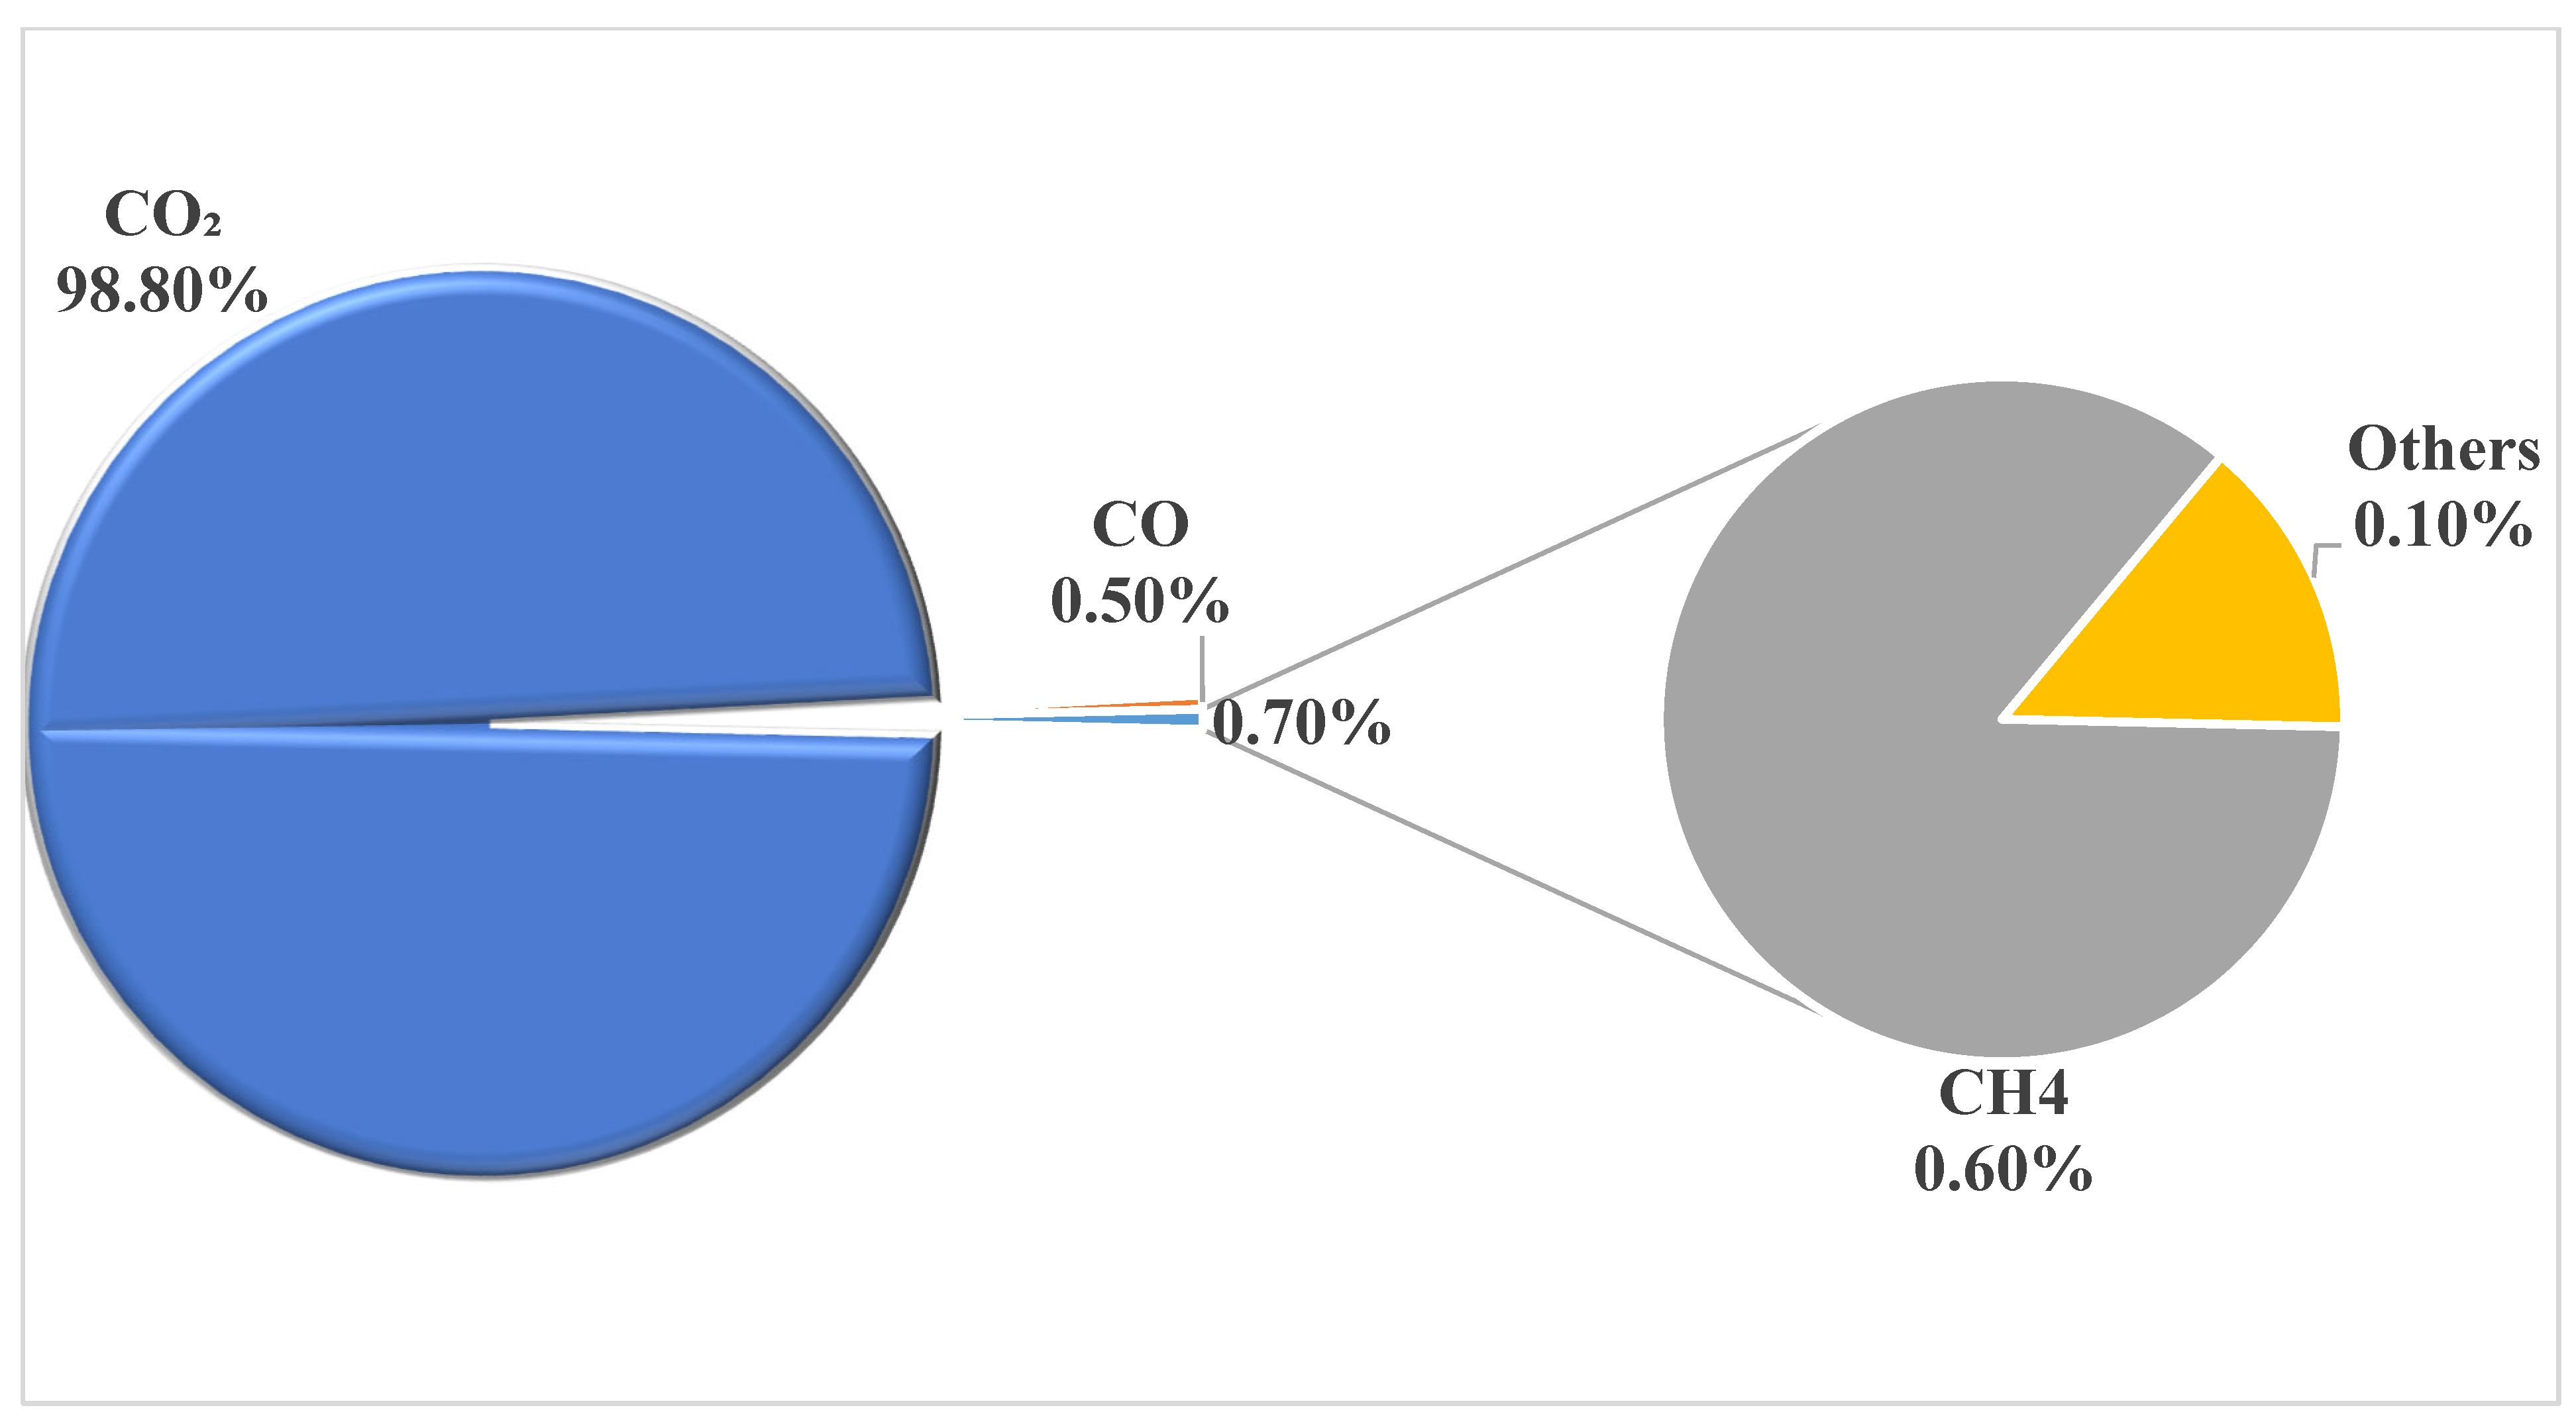
4.1.8. Global Warming

The concept of global warming and its relationship with changes in climatic conditions is fast becoming a highly relevant topic that has created awareness globally. In nature, some gases are present in the atmosphere to serve as an umbrella-like covering for protection from the effects of solar energy experienced on earth. This greenhouse effect causes the energy from the sun to be trapped by these gases and prevented from escaping from the earth, thereby keeping the planet a warm and habitable place for both humans and the ecosystem.
As seen in Table 1, 0.993 kg of CO2 eq was produced for every 1 kg of cement produced, and its effect has been seen in global warming. Of this value, 78.3% was contributed at the clinker production stage, and 18.3% was from electricity. The rest were from raw material consumption, fuel consumption, and transportation. Further analysis of global warming was carried out, and the results are presented in Figure 6. The results showed that CO2, CO, and CH4 were emitted in the following percentages: 98.8%, 0.5%, and 0.6%, respectively, and 98.8% (0.981 kg of CO2) of 99.3 kg of CO2 eq was from the emission of CO2 gas. This implies that for every 1 kg of cement produced, 0.981 kg of CO2 was emitted, and the effect of this emission can be seen in global warming.

4.1.9. Fossil Resource Scarcity

Fossil resources (fuel), typically crude oil, petroleum, and natural gas, are not infinite in nature. They will run out after protracted use globally. About 80% of global energy comes from fossil resources, and over 40% of this energy source comes from oil. Fossil fuels are used by about 90% of the transport sector. These resources are carbon-based substances that react with organic substances in the presence of sunlight. This process is known as the geological process.
As seen in Table 1, for every 1 kg of cement produced, 0.139 kg of oil eq is produced and its effect is seen in fossil resources’ scarcity. A further analysis was carried out on this impact category, and the result of this analysis is shown in Figure 7, where 89.7% of 0.139 kg scarcity is from burning coal. Other percentage sources are crude oil: 8.3%, gas: 1.89%, and peat: 0.02%.
Typically, coal is one of the major sources of energy in South Africa. Over 77% of primary energy in South Africa comes from coal. Coal is mostly made up of carbon but contains other elements such as sulphur, nitrogen, oxygen, and hydrogen. When burnt, coal emits nitrogen oxides, nitrous oxides (N2O), and sulphur dioxide (SO2). SO2 causes respiratory diseases in humans and also contributes largely to acid rain. N2O is about 300 times more potent than CO2 in its ability to cause global warming and also can reduce the ozone layer. The burning of coal has a wide range of impacts on humans and the environment, ranging from various health issues to the greenhouse effect, climate change, acid rain, and air pollution. The need to have a sustainable source of energy is therefore imperative.

4.2. End-Point Analysis (Damage-Oriented Approach)

The end-point approach, on the other hand, categorizes flows into 22 impact categories. These impacts are thereafter classified into their damage categories. Impacts are simplified into the damage to three areas of significance to life (AoSL): human health, the ecosystem, and resources. Figure 8 represents the contribution of the five production processes to the damage categories, including (1) Clinker production, (2) Raw material consumption, (3) Electricity usage, (4) Fuel consumption, and (5) Transportation, where clinker production includes calcination and burning of fuel.
The characterization result of the environmental impacts of 1 kg of cement using the end-point approach is presented in Table 5. The analysis of the impact categories based on the five production processes is presented in Figure 8. The result follows the same trend as that of the mid-point approach but with four other impacts: global warming in freshwater ecosystems, water consumption in terrestrial ecosystems, water consumption in aquatic ecosystems, and freshwater eutrophication. The various impacts presented in Table 5 are classified into their damage categories based on the area of significance to life, as seen in Table 6.

4.2.1. Clinker Production

As presented in Figure 9, the clinker production stage contributed 49.4% to human health and 60% to the ecosystem but did not contribute to resources.

4.2.2. Raw Material Consumption

Figure 9 shows that raw material consumption contributed to all the impact categories: 3.6% to human health, 3.1% to the ecosystem, and 4.2% to resources. Overall, the contribution of raw material consumption to the damage categories was minimal.

4.2.3. Electricity Usage

As seen in Figure 9, electricity usage did not contribute to damage to resources but contributed 31.9% to human health and 23.2% to the ecosystem.

4.2.4. Fuel Consumption

Fuel consumption contributed to the three damage categories but made a significant contribution to damage to the ecosystem. As seen in Figure 9, 13.1% of its contribution to damage was to human health, 11.9% to the ecosystem, and 95% to resources.

4.2.5. Transportation

As seen in Figure 9, transportation usage contributed minimally to the damage categories. The contributions were 2% to human health, 1.8% to the ecosystem, and no contribution to resources. The damage category was further analyzed, and the analysis result is explained below.

4.2.6. Human Health

As seen in Table 6, the damage to human health was 1.62 × 10⁻⁶ DALY. The World Health Organization (WHO) defined DALY as the annual summation of potential life lost due to a pandemic, disease, or another phenomenon. This means that for every 1 kg of cement produced, 1.62 × 10⁻⁶ lives are endangered. This might seem almost negligible until the population of South Africa is considered, as well as the annual amount of cement required per individual. In concrete production, cement, sand, and water are present in the ratio of 1:1.5:3. A medium-grade concrete (M20–M30) would contain a maximum quantity of cement of approximately 19% when cement wastage is also considered [50,51,52]. Currently, concrete is the most produced and consumed material and is second only to water consumption, with about three tons used by every individual annually [53]. Therefore, 0.57 tons of cement is needed by every South African annually. The latest recorded population of South Africa is about 60 million. This means 34.2 MTs of cement are needed in South Africa annually. This translates to about 55,404 DALY; about 55,404 lives are potentially endangered due to damage due to the annual cement production requirement in South Africa.
This has a very significant impact on South African lives. Figure 10 below represents further analysis carried out on the human health damage category of substances that cause these damages and the mediums in which they were expressed, where A represents air, and W represents water. The results showed that 1% of ammonia was emitted into the atmosphere, 10% of NOx was emitted into the atmosphere, less than 2.5 μm of particulate matter was emitted into the air, 2% of arsenic was emitted into the water body, 56% of CO2 was emitted into the air, and 8% of other substances were emitted into both the air and water. The consequence of all these emissions, as explained earlier in the mid-point analysis, is damage to human health.

4.2.7. Ecosystem

As seen in Table 3, the damage to the ecosystem is 3.9 × 10⁻⁹ species/year. This damage was measured based on the number of species endangered per year. This means that for every 1 kg of cement produced, 3.9 × 10⁻⁹ species have the potential to die every year. In SA, where about 34.2 MTs of cement are needed yearly, about 133 species will potentially be endangered.
Figure 11 represents further analysis on the ecosystem damage category on substances that cause this damage and the mediums in which they are expressed, where A represents air, and W represents water. The results showed that 9% of SOx was emitted into the atmosphere, 10% of NOx was emitted into the atmosphere, 5% of phosphorus was emitted into the water body, 71% of CO2 was emitted into the air, and 5% of other substances were emitted into both the air and water. As explained in the mid-point analysis, the consequence of all these emissions is damage to the ecosystem.

4.2.8. Resources

As seen in Table 3, the damage to resources was USD 0.0169 in 2013. This represents the potential marginal increase in the cost of resources as a result of the scarcity of such resources. As of 2013, USD 1 was equal to ZAR 10.5. This means that for every 1 kg of cement produced, there was a potential scarcity of resources, resulting in a potential increase in the marginal cost of ZAR 0.18. In South Africa, where about 34.2 MTs of cement are required every year, there would be a potential scarcity of resources, causing inflation of the price of these resources by ZAR 6.2 billion.
This signifies the potential increase in the cost of resources based on the annual production of cement in South Africa, and consequently, the annual requirement of resources. This is because these resources are finite in nature and can be exhausted, creating a need for a sustainable source of resources. Figure 12 represents further analysis carried out on the resources damage category. The result showed that 60% of the resources in question were for coal, 32% were for crude oil, 6% were for natural gas, and 2% were for aluminium.

4.3. Uncertainty Analysis Result

The uncertainty analysis was carried out with 1000 iterations and a 95% confidence interval. The mid-point, end-point, and damage assessment uncertainties are shown in Tables S3–S5, respectively in Supplementary Materials. In the uncertainty result of the mid-point assessment, water consumption, ecosystems, human carcinogenic toxicity, ionizing radiation, freshwater ecotoxicity, freshwater eutrophication, human non-carcinogenic toxicity, and marine ecotoxicity have a high degree of uncertainty. The same trend is seen in the uncertainty result of the end-point assessment: water consumption for terrestrial ecosystems, water consumption for human health, water consumption for aquatic ecosystems, human carcinogenic toxicity, and ionizing radiation have a high degree of uncertainty, while freshwater ecotoxicity, freshwater eutrophication, human non-carcinogenic toxicity, and marine ecotoxicity have a relatively high degree of uncertainty. All other impact categories in the approaches were relatively low. Also, the uncertainty was low on average in the damage assessment the uncertainty result.

4.4. Discussion of Results

The cement industry in South Africa accounted for 1% of the country’s greenhouse gas emissions. According to the reports issued by the Department of Environmental Affairs (2014), between 2000 and 2010, the annual greenhouse gas emission from cement production increased by 27%, from 3.3 MT CO2e to 4.2 MT CO2e. By this time, Portland cement (which does not allow clinker replacement) was becoming the most prevalent product). Also, the annual emission mitigation potential of the cement industry would be 1.26 MT CO2-eq, 3.65 MT CO2-eq, and 15 MT CO2-eq by 2020, 2030, and 2050, respectively.
In both the mid-point and end-point approaches, the analysis was carried out based on the contribution of five production processes to the impact and end-point damage categories. These production processes were (1) Clinker production, (2) Raw material consumption, (3) Electricity usage, (4) Fuel consumption and (5) Transportation. The results showed that the clinker production stage contributed 76.3% to global warming. raw material consumption contributed 99.9% to mineral scarcity, 95.9% to ionization radiation, 90.7% to fossil resource scarcity, and 77.9% to terrestrial ecotoxicity. Fuel consumption contributed 98.6% to freshwater eutrophication, 96.3% to marine eutrophication, 85.7% to human carcinogenic toxicity, and 76.9% to human non-carcinogenic toxicity. In addition, electricity usage contributed 65.8% and 64.8% to stratospheric ozone depletion and fine particulate matter formation, respectively.
The mid-point analysis explanation is based on specific substances emitted and the consequence of their emission into air and water or their extraction from the ground. On the other hand, the end-point analysis describes why attention should be paid to these impacts by showing how these impacts affect our environment directly. The analysis also showed the damage done to human lives, the environment, and the economy in terms of the value of our resources. From the characterization results of the mid-point analysis, for every 1 kg of cement produced, terrestrial ecotoxicity, global warming, human non-carcinogenic toxicity, and fossil resource scarcity with impact values of 1.09 kg 1,4-DCB, 0.993 kg CO2-eq, 0.497 kg 1,4-DCB, and 0.139 kg oil eq, respectively, were found to have the highest impact values. All the environmental impacts from these analyses were grouped based on their units; the grouped and individual impacts with high value were further analyzed. These impacts are ozone formation, toxicity, global warming, and fossil resource scarcity. Ozone formation includes human health and the terrestrial ecosystem; toxicity includes marine ecotoxicity, freshwater toxicity, terrestrial ecotoxicity, human carcinogenic toxicity, and human non-carcinogenic toxicity. These impacts were further analyzed to find the specific substances causing the impacts and the medium through which these substances were emitted.
From the analysis of ozone formation, it was realized that a high concentration of ozone formation in the atmosphere affects both humans and the ecosystem. For every 1 kg of cement produced, 0.00421 kg of NOx eq is emitted into the atmosphere, and its effect is seen as ozone formation. Though 0.00421 kg seems minimal, concrete is fast becoming the most produced substance on earth, as about 1 ton is produced for every human being annually. There is a continuous emission and accumulation of nitrogen oxides in the atmosphere; thus, reducing it to the barest minimum is necessary. This was later confirmed in the end-point analysis on damage made to the ecosystem, one of which was emission of NOx.
Toxicity can be defined as hazardous stressors that impact both humans and the ecosystem and can lead to a pandemic among humans and even aquatic animals. The analysis showed that for every 1 kg of cement produced, 1.6 kg of toxicity in the form of 1,4-Dichlorobenzene (1,4-DCB) eq was produced. The terrestrial ecotoxicity human non-carcinogenic toxicity impact category was further analyzed. In the case of terrestrial ecotoxicity, 63% of 1.04 kg of 1,4-DCB eq was due to the emission of copper into the air; 12.3% and 7.1% were as a result of the emission of antimony and mercury, respectively, into the air. With human non-carcinogenic toxicity, 60%, 31%, and 1.7% of 0.497 kg of 1,4-DCB eq was the emission result of zinc, arsenic, and lead, respectively, into the water body. A high zinc concentration is deadly for organisms and can cause brain impairment in humans.
One of the major effects of global warming is climate change caused by the greenhouse effect. The result of the analysis showed that for every 1 kg of cement produced, 99.3 kg of CO2-eq was emitted; 78.3% was contributed by clinker production, and the effect was global warming. Further analysis presented that of this 99.3 kg of CO2-eq, 98.8% (0.981 kg) was actually from CO2. Meyer’s report stated that almost 1 ton of CO2 is emitted for every one ton of cement produced [54]. This implies that for every 1 kg of cement produced, 0.981 kg of CO2 is emitted, and this emission’s effect is seen in global warming. In the end-point analysis, CO2 contributed 56% and 71% of damage to human health and the ecosystem, respectively. In both the mid-point and end-point analysis, CO2 had the highest emission value.
Jacobson, Kler et al. 2019 [55] established that exposure to atmospheric CO2 in a poorly ventilated environment has the potential to cause harm to the human body even in low concentrations. The range of effects on human health are limitless. Evidence shows that high concentrations of less than 5000 ppm of CO2 pose a high health risk. Other indications are that CO2 concentration with poor ventilation poses the same risk, and the current concentration in an indoor environment has already exceeded this concentration. Statistics have shown that a typical urban environment with 2100 ppm of CO2 emissions and increased concentration will pose a greater threat. This is the case globally, and nothing like it has been seen in the previous 200 decades: the alarming incidence of rising temperatures is also now more than it has been in the previous 200 decades [56,57].
For every 1 kg of cement produced, 0.139 kg of oil eq is used, and its effect is seen in the scarcity of fossil resources. In the mid-point analysis, 89.7% of the cause of fossil resource impact was the extraction of coal. In contrast, in the end-point analysis, it was realized that coal extraction contributed 60% to the damage to resources. This is because over 77% of energy sources in South Africa come from coal. Combustion of coal emits SO2 and N2O. SO2 contributes largely to acid rain and respiratory disease; N2O, on the other hand, is a greenhouse gas, and its potential to contribute to global warming is 300 times higher than CO2, although it has a shorter lifespan. It is estimated that South Africa’s coal reserves have been reduced to about 53 billion tons. With the current rate of production, coal will likely only be available for the next 20 decades. Moreover, in the end-point analysis of resources, it was discovered that 60% of the damage was caused by coal extracted from fossil resources.
In the end-point analysis, 1 kg of cement was analyzed based on damage to the area of significance to life, damage to human health, the ecosystem, and resources expressed in DALY, species/year, and USD 2013, respectively. The analysis showed that USD 0.0169 in 2013, 3.9 × 10⁻⁹ species/year, and 1.62 × 10⁻⁶ DALY damages resources, the ecosystem and human health, respectively. The latest recorded population of South Africa was about 60 million. Seeing that about three tons of concrete are needed by every individual annually, which contains only about 19% of cement [58], this study was able to estimate the damage caused to human health, the ecosystem, and resources based on the cement production requirements in South Africa. From the analysis, about 55,404 DALY is the potential number of lives that could be endangered based on annual cement production in SA. With respect to the ecosystem, the estimation showed that about 133 species are potentially endangered. At the same time, for resources, the effect of the potential scarcity of resources would cause a total marginal price increase of ZAR 6.2 billion based on the annual cement production requirements in SA.
The various impacts and damage indicators shown in this study represent a need for effective reduction and mitigation. It is important to note that SA relies on clinker and cement importation. Therefore, the empirical values obtained from this analysis might not necessarily translate into real values. Nonetheless, most of the above results align with previous studies [6,7,24,46,59,60,61]. The variations experienced in some of the results result from plant/quarry location, proximity to resources (raw materials and fossil fuels), and electricity sources. There are differences in the transportation systems, type of fuel used, and electricity generation mix, among others; thus, a difference in values can be justified.

4.5. Comparison with Previous Studies

According to this study, 0.993 kg CO2 eq is emitted for every kg of cement produced. Other studies have found higher levels, including 0.83–1.35 kg CO2 eq/kg cement in China (Li et al., 2015) [24], 1.05 kg CO2 eq/kg in Italy (Moretti and Caro, 2017) [7], and 0.8–1.2 kg CO2 eq/kg in western Europe (Morsali, 2016) [22]. The reduced global warming potential reported in this study could be attributed to differences in energy supplies, production technology, and emission regulations between South Africa and the other countries studied. In addition, this study found that raw material use is a significant factor (accounting for more than 90%) in the depletion of mineral resources. In a similar vein, Morsali (2016) [22] identified the utilization of raw materials, particularly the extraction of limestone and clay, as a significant factor in the depletion of resources caused by cement manufacture. The ecotoxicity impacts observed in this study were lower, measuring 1.04 kg 1,4-DCB eq for terrestrial ecotoxicity. Morsali (2016) [22] found a range of 3.2–5.1 kg 1,4-DCB eq. The level of toxicity is significantly impacted by the type of fuel used, the effectiveness of pollution control measures, and the specific technologies employed, all of which might vary. Based on the studies examined in the literature section, it was determined that clinker manufacturing is the most impactful process stage in terms of its contribution to global warming emissions, accounting for 41–76% of the total. This corresponds to the 76.3% contribution observed in this present study. The dominance of clinker demonstrates why lowering the clinker proportion is an approach for impact minimization.

5. Conclusions, Recommendations, and Future Research

This study presented an LCA of the environmental impacts caused by a typical SA cement plant used as the case study. The process-oriented (mid-point) and damage-approach (end-point) of LCIA were adopted in this study to present a comprehensive understanding of these environmental impacts. It was revealed that cement production contributes significantly to environmental emissions in SA, particularly the clinker production phase of cement production. As a result, recommendations were made to help reduce the environmental impacts of cement production in SA.

5.1. Contribution and Practical Implications

This study is one of the most recent studies on the environmental impact of cement production. It combines both mid-point and end-point analyses of OPC production in SA. The findings of this study are useful to the government and key stakeholders of the SA cement industry with the view to formulating policies and knowing areas to concentrate efforts on in reducing the environmental impacts of cement production. For instance, the findings from this study could be applied to develop a practical pathway to reduce the environmental impact of OPC production in South Africa. This can involve an intervention to improve cement production’s material composition and technologies (especially for clinker production) based on best practices in other developed countries.
The South African cement industry has the potential to embrace advanced kiln technology to enhance energy efficiency and minimize fuel use during clinker manufacture. Installation of pollution control equipment such as filters and scrubbers is necessary to limit air emissions from the facility. Another viable solution is to transition to lower-carbon alternative fuels, such as biomass and waste fuels, whenever possible. The industry should enhance process efficiency by implementing computerized controls and automation by employing waste heat recovery technologies to minimize energy requirements. Slag and fly ash are examples of additional cementitious materials that can be used to generate lower clinker cement, which will lessen the clinker content. The goal with these alternative materials should be to maximize the amount of clinker substitution. Reducing carbon emissions can be achieved even further by implementing renewable energy sources such as geothermal, wind, and solar. Enhancements in the efficiency of quarrying, raw material transportation, and sourcing would also be beneficial.
South Africa can enforce emissions regulations for cement plants, which would limit the release of CO₂, NOx, SOx, particulate matter, and other forms of pollution. Implementing incentives to promote the utilization of renewable energy and establishing mandatory requirements for the procurement of a minimum amount of renewable electricity will effectively promote sustainability. It is necessary to implement regulations that encourage the use of alternate cementitious materials to decrease the amount of clinker fractions. Implementing taxes on fossil fuel consumption and exploiting raw materials would provide a more accurate assessment of their environmental impacts. It is also suggested that environmental monitoring and reporting requirements be strengthened.
In addition to developing targets for reducing energy consumption, emissions, and carbon footprint, cement producers can undertake environmental impact assessments for new projects. Sustainability could be institutionalized using ISO 14001 or a comparable environmental management system. Analysis of the life cycle can identify development efforts on “hotspots”.

5.2. Recommendations and Future Research

This study considered the recommendations needed to improve environmental impacts and the damage caused by every 1 kg of cement produced. Several approaches have been suggested in the current literature including using carbon capture technologies [62,63,64], using supplementary materials, and using renewable energy, among others. However, there is a need for SA and other sub-Saharan countries to conduct elaborate research on how these solutions can be implemented with respect to the economic and environmental benefits.
Further research could include strategies to reduce or eliminate the effects of emissions on the population and assess the vulnerability issue to fully understand the potential consequences of continuous and intermittent exposure to indoor air with both high and low CO2 concentrations. Further research could also focus on discovering the best fit of mitigation strategies recommended in this study. Best fit implies high emission–reduction potential, effective applicability and low cost, and it allows the use of existing equipment. In addition, research on sources of sustainable resources could be undertaken.

Supplementary Materials

The following supporting information can be downloaded at: https://www.mdpi.com/article/10.3390/su16073001/s1, Table S1: Ecoinvent 3.6 database documentation of clinker production: South Africa (ZA). Table S2: Ecoinvent 3.6 dataset documentation for Portland cement production: South Africa. Table S3: Uncertainty results for mid-point analysis. Table S4: Uncertainty results for end-point impacts of analysis. Table S5: Uncertainty results for end-point impacts analysis: Damage assessment.

Author Contributions

Conceptualization, B.D.A. and O.I.O.; methodology, B.D.A.; software, O.A.O.; validation, B.D.A., O.I.O. and O.A.O.; formal analysis, B.D.A.; investigation, B.D.A. and O.I.O.; resources, O.A.O.; data curation, B.D.A. and O.I.O.; writing—original draft preparation, B.D.A.; writing—review and editing, B.D.A. and O.I.O.; visualization, B.D.A.; supervision, O.A.O.; project administration, O.A.O.; funding acquisition, O.A.O. All authors have read and agreed to the published version of the manuscript.

Funding

This research was funded by National Research Fund (NRF) Unique grant number [MND200506520310].

Institutional Review Board Statement

Not applicable.

Informed Consent Statement

Not applicable.

Data Availability Statement

The data presented in this study are available in the Supplementary Materials.

Conflicts of Interest

The authors declare no conflict of interest.

References

  1. Franzoni, E. Materials selection for green buildings: Which tools for engineers and architects? Procedia Eng. 2011, 21, 883–890. [Google Scholar] [CrossRef]
  2. Garside, M. Major Countries in Worldwide Cement Production 2015–2019; Datis export group: Tehran, Iran, 2020. [Google Scholar]
  3. Madlool, N.; Saidur, R.; Rahim, N.; Islam, M.; Hossian, M. An exergy analysis for cement industries: An overview. Renew. Sustain. Energy Rev. 2012, 16, 921–932. [Google Scholar] [CrossRef]
  4. Taylor, M.; Tam, C.; Gielen, D. Energy efficiency and CO2 emissions from the global cement industry. Korea 2006, 50, 61–67. [Google Scholar]
  5. Rodgers, L. Climate change: The massive CO2 emitter you may not know about. BBC News 2018, 17, 2018. [Google Scholar]
  6. Stafford, F.N.; Raupp-Pereira, F.; Labrincha, J.A.; Hotza, D. Life cycle assessment of the production of cement: A Brazilian case study. J. Clean. Prod. 2016, 137, 1293–1299. [Google Scholar] [CrossRef]
  7. Moretti, L.; Caro, S. Critical analysis of the life cycle assessment of the Italian cement industry. J. Clean. Prod. 2017, 152, 198–210. [Google Scholar] [CrossRef]
  8. Muigai, R.; Alexander, M.; Moyo, P. Cradle-to-gate environmental impacts of the concrete industry in South Africa. J. S. Afr. Inst. Civ. Eng. J. Van Suid-Afr. Inst. Van Siviele Ingenieurswese 2014, 56, 108. [Google Scholar]
  9. Bekun, F.V.; Emir, F.; Sarkodie, S.A. Another look at the relationship between energy consumption, carbon dioxide emissions, and economic growth in South Africa. Sci. Total Environ. 2019, 655, 759–765. [Google Scholar] [CrossRef] [PubMed]
  10. Ige, O.E.; Olanrewaju, O.A. Comparative Life Cycle Assessment of Different Portland Cement Types in South Africa. Clean Technol. 2023, 5, 901–920. [Google Scholar] [CrossRef]
  11. Ige, O.E.; Duffy, K.J.; Olanrewaju, O.A.; Collins, O.C. An Integrated System Dynamics Model and Life Cycle Assessment for Cement Production in South Africa. Atmosphere 2022, 13, 1788. [Google Scholar] [CrossRef]
  12. Thwe, E.; Khatiwada, D.; Gasparatos, A. Life cycle assessment of a cement plant in Naypyitaw, Myanmar. Clean. Environ. Syst. 2021, 2, 100007. [Google Scholar] [CrossRef]
  13. Asadollahfardi, G.; Katebi, A.; Taherian, P.; Panahandeh, A. Environmental life cycle assessment of concrete with different mixed designs. Int. J. Constr. Manag. 2021, 21, 665–676. [Google Scholar] [CrossRef]
  14. Suárez, S.; Roca, X.; Gasso, S. Product-specific life cycle assessment of recycled gypsum as a replacement for natural gypsum in ordinary Portland cement: Application to the Spanish context. J. Clean. Prod. 2016, 117, 150–159. [Google Scholar] [CrossRef]
  15. Stafford, F.N.; Dias, A.C.; Arroja, L.; Labrincha, J.A.; Hotza, D. Life cycle assessment of the production of Portland cement: A Southern Europe case study. J. Clean. Prod. 2016, 126, 159–165. [Google Scholar] [CrossRef]
  16. Eros, J.; Candelario-Quintana, L. Mineral Facilities of Africa and the Middle East; US Geological Survey Open-File Report; Unites State Geological Survey (USGS): Washington, DC, USA, 2006; Volume 1135. [Google Scholar]
  17. Cement, W. Middle Africa’s Cement Sector: Explosive Growth. Ecobank2014. Available online: https://www.worldcement.com/africa-middle-east/30072014/middle-africa-cement-sector-explosive-growth-205/ (accessed on 10 March 2020).
  18. Bank, T.W. Cement Sectore Program in Sub-Saharan Africa: Barriers Analysis to CDM and Solutions; Final Report; Carbon Finance Assistance: Québec, Canada, 2009. [Google Scholar]
  19. Aecom. The blue book. In Property and Construction Handbook; Aecom—Architecture, Engineering, Construction, Operations, and Management: Dallas, TX, USA, 2014; Available online: https://aecom.com/bh/wp-content/uploads/2019/07/Construction-Handbook-2018_update-1907-LR-2.pdf (accessed on 24 April 2021).
  20. Zengeni, T.; Mondliwa, P. Consolidation and Entry: Changing Dynamics in the Regional Cement; Quarterly review; University of Johannesburg: Johannesburg, South Africa, 2015. [Google Scholar]
  21. Meshram, R.; Kumar, S. Comparative life cycle assessment (LCA) of geopolymer cement manufacturing with Portland cement in Indian context. Int. J. Environ. Sci. Technol. 2022, 19, 4791–4802. [Google Scholar] [CrossRef]
  22. Morsali, S. Emissions from portland cement production using life cycle assessment inventory and method. Environ. Energy Econ. 2016, 1, 1–8. [Google Scholar]
  23. Nigri, E.M.; Rocha, S.D.F.; Filho, E.R. Portland cement: An application of life cycle assessment. Prod. Manag. Dev. 2010, 8, 167–172. [Google Scholar]
  24. Li, C.; Cui, S.; Nie, Z.; Gong, X.; Wang, Z.; Itsubo, N. The LCA of Portland cement production in China. Int. J. Life Cycle Assess. 2015, 20, 117–127. [Google Scholar] [CrossRef]
  25. Bushi, L.; Meil, J. An environmental life cycle assessment of portland-limestone and ordinary portland cements in concrete. Cem. Assoc. Can. 2014, 10, 1–10. [Google Scholar]
  26. Tun, T.Z.; Bonnet, S.; Gheewala, S.H. Life cycle assessment of Portland cement production in Myanmar. Int. J. Life Cycle Assess. 2020, 25, 2106–2121. [Google Scholar] [CrossRef]
  27. Huntzinger, D.N.; Eatmon, T.D. A life-cycle assessment of Portland cement manufacturing: Comparing the traditional process with alternative technologies. J. Clean. Prod. 2009, 17, 668–675. [Google Scholar] [CrossRef]
  28. ISO 14044:2006; Environmental Management—Life Cycle Assessment—Requirements and Guidelines. ISO: Geneva, Switzerland, 2006.
  29. ISO 14040:1997; Environmental Management: Life Cycle Assessment: Principles and Framework. ISO: Geneva, Switzerland, 1997.
  30. ISO 14040:2006; Environmental Management: Life Cycle Assessment; Principles and Framework (no. 2006). ISO: Geneva, Switzerland, 2006.
  31. Young, S.B.; Turnbull, S.; Russell, A. Substudy 6: What LCA Can Tell Us about the Cement Industry; Citeseer: Raleigh, NC, USA, 2002. [Google Scholar]
  32. Goedkoop, M.; Heijungs, R.; Huijbregts, M.; De Schryver, A.; Struijs, J.; Van Zelm, R. ReCiPe 2008. In A Life Cycle Impact Assessment Method which Comprises Harmonised Category Indicators at the Midpoint and the Endpoint Level; Ministry of VROM: The Hague, The Netherlands, 2009; Volume 1, pp. 1–126. [Google Scholar]
  33. Bare, J.C. TRACI: The tool for the reduction and assessment of chemical and other environmental impacts. J. Ind. Ecol. 2002, 6, 49–78. [Google Scholar] [CrossRef]
  34. Filimonau, V.; Dickinson, J.; Robbins, D.; Huijbregts, M.A. Reviewing the carbon footprint analysis of hotels: Life Cycle Energy Analysis (LCEA) as a holistic method for carbon impact appraisal of tourist accommodation. J. Clean. Prod. 2011, 19, 1917–1930. [Google Scholar] [CrossRef]
  35. Bare, J.; Young, D.; Qam, S.; Hopton, M.; Chief, S. Tool for the Reduction and Assessment of Chemical and other Environmental Impacts (TRACI); US Environmental Protection Agency: Washington, DC, USA, 2012. [Google Scholar]
  36. Finkbeiner, M.; Inaba, A.; Tan, R.; Christiansen, K.; Klüppel, H.-J. The new international standards for life cycle assessment: ISO 14040 and ISO 14044. Int. J. Life Cycle Assess. 2006, 11, 80–85. [Google Scholar] [CrossRef]
  37. Hoffman, L.; Schmidt, A. Life Cycle Assessment. A guide to approaches, experiences and information sources. Man. Environ. Qual. Int. J. 1997, 17, 490–507. [Google Scholar]
  38. Marinković, S. Life cycle assessment (LCA) aspects of concrete. In Eco-Efficient Concrete; Elsevier: Amsterdam, The Netherlands, 2013; pp. 45–80. [Google Scholar]
  39. Marinković, S.; Dragaš, J.; Ignjatović, I.; Tošić, N. Environmental assessment of green concretes for structural use. J. Clean. Prod. 2017, 154, 633–649. [Google Scholar] [CrossRef]
  40. Kabir, G.; Abubakar, A.; El-Nafaty, U. Energy audit and conservation opportunities for pyroprocessing unit of a typical dry process cement plant. Energy 2010, 35, 1237–1243. [Google Scholar] [CrossRef]
  41. Ailleret, F. Comparison of Energy Systems Using Life Cycle Assessment; World Energy Council: London, UK, 2004; Volume 2, p. 3.1. [Google Scholar]
  42. Pacheco-Torgal, F.; Cabeza, L.F.; Labrincha, J.; De Magalhaes, A.G. Eco-Efficient Construction and Building Materials: Life Cycle Assessment (LCA), Eco-Labelling and Case Studies; Woodhead Publishing: Cambridge, UK, 2014. [Google Scholar]
  43. García-Gusano, D.; Herrera, I.; Garraín, D.; Lechón, Y.; Cabal, H. Life cycle assessment of the Spanish cement industry: Implementation of environmental-friendly solutions. Clean Technol. Environ. Policy 2015, 17, 59–73. [Google Scholar] [CrossRef]
  44. Vázquez-Rowe, I.; Ziegler-Rodriguez, K.; Laso, J.; Quispe, I.; Aldaco, R.; Kahhat, R. Production of cement in Peru: Understanding carbon-related environmental impacts and their policy implications. Resour. Conserv. Recycl. 2019, 142, 283–292. [Google Scholar] [CrossRef]
  45. Palermo, G.C.; Castelo Branco, D.A.; Fiorini, A.C.O.; De Freitas, M.A.V. Comparative life cycle assessment of three 2030 scenarios of the Brazilian cement industry. Environ. Monit. Assess. 2022, 194, 153. [Google Scholar] [CrossRef]
  46. Çankaya, S.; Pekey, B. A comparative life cycle assessment for sustainable cement production in Turkey. J. Environ. Manag. 2019, 249, 109362. [Google Scholar] [CrossRef] [PubMed]
  47. Nuvolone, D.; Petri, D.; Voller, F. The effects of ozone on human health. Environ. Sci. Pollut. Res. 2018, 25, 8074–8088. [Google Scholar] [CrossRef]
  48. Sharma, S.B.; Jain, S.; Khirwadkar, P.; Kulkarni, S. The effects of air pollution on the environment and human health. Indian J. Res. Pharm. Biotechnol. 2013, 1, 391–396. [Google Scholar]
  49. Theodorakidou, M.; Lambrou, G.I. Public health issues from the exposure to nitrogen oxides: A brief review. ARC J. Public Health Community Med. 2017, 2, 44–56. [Google Scholar]
  50. Nataraja, M.; Das, L. Concrete mix proportioning as per IS 10262: 2009–Comparison with IS 10262: 1982 and ACI 211.1-91. Indian Concr. J. 2010, 84, 64–70. [Google Scholar]
  51. Goel, N. Design Mix Concrete-Economy & Environmental Isuues; Central Vigilance Commission: New Delhi, India, 2011. [Google Scholar]
  52. Kumar, P. M20 Grade Concrete Mix Design–IS10262 Latest Edition. Civil Research and Development. 2021. Available online: https://civilrnd.com/m20-grade-concrete-mix-design-is10262-latest-edition/ (accessed on 24 April 2021).
  53. Gagg, C.R. Cement and concrete as an engineering material: An historic appraisal and case study analysis. Eng. Fail. Anal. 2014, 40, 114–140. [Google Scholar] [CrossRef]
  54. Martínez-Rocamora, A.; Solís-Guzmán, J.; Marrero, M. LCA databases focused on construction materials: A review. Renew. Sustain. Energy Rev. 2016, 58, 565–573. [Google Scholar] [CrossRef]
  55. Jacobson, T.A.; Kler, J.S.; Hernke, M.T.; Braun, R.K.; Meyer, K.C.; Funk, W.E. Direct human health risks of increased atmospheric carbon dioxide. Nat. Sustain. 2019, 2, 691–701. [Google Scholar] [CrossRef]
  56. Mann, M.E.; Bradley, R.S.; Hughes, M.K. Global-scale temperature patterns and climate forcing over the past six centuries. Nature 1998, 392, 779–787. [Google Scholar] [CrossRef]
  57. Alley, R.; Berntsen, T.; Bindoff, N.L.; Chen, Z.; Chidthaisong, A.; Friedlingstein, P.; Gregory, J.; Hegerl, G.; Heimann, M.; Hewitson, B. Climate change 2007: The physical science basis. In Contribution of Working Group I to the Fourth Assessment Report of the Intergovernmental Panel on Climate Change. Summary for Policymakers; IPCC Secretariat: Geneva, Switzerland, 2008; p. 21. [Google Scholar]
  58. Worldometer. South Africa Population 2021. Available online: www.worldometers.info/world-population/south-africa-population/ (accessed on 10 May 2021).
  59. Valderrama, C.; Granados, R.; Cortina, J.L.; Gasol, C.M.; Guillem, M.; Josa, A. Implementation of best available techniques in cement manufacturing: A life-cycle assessment study. J. Clean. Prod. 2012, 25, 60–67. [Google Scholar] [CrossRef]
  60. García-Gusano, D.; Garraín, D.; Herrera, I.; Cabal, H.; Lechón, Y. Life Cycle Assessment of applying CO2 post-combustion capture to the Spanish cement production. J. Clean. Prod. 2015, 104, 328–338. [Google Scholar] [CrossRef]
  61. Georgiopoulou, M.; Lyberatos, G. Life cycle assessment of the use of alternative fuels in cement kilns: A case study. J. Environ. Manag. 2018, 216, 224–234. [Google Scholar] [CrossRef] [PubMed]
  62. Bosoaga, A.; Masek, O.; Oakey, J.E. CO₂ capture technologies for cement industry. Energy Procedia 2009, 1, 133–140. [Google Scholar] [CrossRef]
  63. Bacatelo, M.; Capucha, F.; Ferrao, P.; Margarido, F. Selection of a CO₂ capture technology for the cement industry: An integrated TEA and LCA methodological framework. J. CO₂ Util. 2023, 68, 102375. [Google Scholar] [CrossRef]
  64. Guo, Y.; Luo, L.; Liu, T.; Hao, L.; Li, Y.; Liu, P.; Zhu, T. A review of low-carbon technologies and projects for the global cement industry. J. Environ. Sci. 2023, 136, 682–697. [Google Scholar] [CrossRef]
Figure 1. Material flow diagram for the production of 1 kg of Portland cement (adapted from the Ecoinvent database).
Sustainability 16 03001 g001
Figure 2. Contribution of five production processes to impact categories (mid-point).
Sustainability 16 03001 g002
Figure 3. Substances contributing to the ozone formation impact category.
Sustainability 16 03001 g003
Figure 4. Substances contributing to toxicity—terrestrial ecotoxicity impact category.
Sustainability 16 03001 g004
Figure 5. Substances contributing to toxicity—human non-carcinogenic toxicity impact category.
Sustainability 16 03001 g005
Figure 6. Substances contributing to global warming.
Sustainability 16 03001 g006
Figure 7. Substances contributing to fossil resource scarcity.
Sustainability 16 03001 g007
Figure 8. Contribution of five production processes to impact categories (end-point).
Sustainability 16 03001 g008
Figure 9. Contribution of five production processes to damage categories.
Sustainability 16 03001 g009
Figure 10. Substances contributing to the human health damage category.
Sustainability 16 03001 g010
Figure 11. Substances contributing to the ecosystem damage category.
Sustainability 16 03001 g011
Figure 12. Substances contributing to resource damage category.
Sustainability 16 03001 g012
Table 1. Sub-Saharan Africa’s leading cement producers by 2013 capacity [17].
CompanyProduction Capacity
(MTs)
Countries of Operation in SSA
Dangote cement20.7Nigeria, Benin, Cameroon, Senegal, Cote d’Ivoire, Sierra Leon, Liberia, Ghana, Congo- Brazzaville, Ethiopia, Kenya, Tanzania, Zambia, South Africa
Lafarge19.5Nigeria, Benin, Cameroon, Kenya, Tanzania, Zambia, South Africa, Uganda, Malawi, Mozambique, Botswana, Zimbabwe
PPC18.0South Africa, Zimbabwe, Botswana
Heigelberg6.7Sierra Leon, Liberia, Ghana, Tanzania, Benin, Gabon, Togo
AfriSam5.8South Africa, Lesotho, Botswana, Tanzania, Swaziland
ARM cement5.5Tanzania, South Africa, Kenya, Rwanda
Sococim4.2Senegal
Holcim3.0Nigeria, Cote d’Ivoire, Morocco, Tanzania, South Africa, Guinea
Derba Midroc Cement2.5Ethiopia
WACEM2.0Ghana, Togo
Table 2. Breakdown of cement plants and installed capacity in SSA [16].
RegionNo. of PlantsProduction Capacity (tons)Actual Production (tons)Capacity
Utilization
West Africa2919,241,0008,779,13046%
Central Africa113,613,0001,720,00048%
East Africa298,954,0006,768,11076%
Southern Africa613,145,00012,348,00094%
Total7544,953,00029,615,24066%
Table 4. Characterization results of the environmental impacts of 1 kg cement (mid-point).
S/NImpact CategoryUnitValue
1Global warmingkg CO₂ eq0.993
2Stratospheric ozone depletionkg CFC11 eq1.94 × 10−7
3Ionization radiationkBq Co-60 eq0.00997
4Ozone formation, human healthkg NOx eq0.0021
5Fine particulate matter formationkg PM2.5 eq0.000793
6Ozone formation, terrestrial ecosystemkg NOx eq0.00212
7Terrestrial acidificationkg SO2 eq0.00244
8Freshwater eutrophicationkg P eq0.000316
9Marine eutrophicationkg N eq1.93 × 10−5
10Terrestrial ecotoxicitykg 1,4-DCB eq1.04
11Freshwater ecotoxicitykg 1,4-DCB eq0.0158
12Marine ecotoxicitykg 1,4-DCB eq0.0214
13Human carcinogenic toxicitykg 1,4-DCB eq0.0244
14Human non-carcinogenic toxicitykg 1,4-DCB eq0.497
15Land usem2a crop eq0.00783
16Mineral resource scarcitykg Cu eq0.00216
17Fossil resource scarcitykg oil eq0.139
18Water consumptionm30.00136
Table 5. Characterization results of the environmental impacts of 1 kg cement (end-point).
S/NImpact CategoryUnitValue
1Global warming, human healthDALY9.21 × 10−7
2Stratospheric ozone depletionDALY1.03 × 10−10
3Ionizing radiationDALY8.46 × 10−11
4Water consumption, human healthDALY1.50 × 10−9
5Ozone formation, human healthDALY1.91 × 10−9
6Fine particulate formationDALY4.98 × 10−7
7Human carcinogenic toxicityDALY8.10 × 10−8
8Human non-carcinogenic toxicityDALY1.13 × 10−7
9Global warming, terrestrial ecosystemsSpecies/yr2.78 × 10−9
10Global warming, freshwater ecosystemsSpecies/yr7.60 × 10−14
11Ozone formation, terrestrial ecosystemsSpecies/yr2.73 × 10−10
12Terrestrial acidificationSpecies/yr5.18 × 10−10
13Freshwater eutrophicationSpecies/yr2.12 × 10−10
14Marine eutrophicationSpecies/yr3.29 × 10−14
15Terrestrial ecotoxicitySpecies/yr1.19 × 10−11
16Freshwater ecotoxicitySpecies/yr1.09 × 10−11
17Marine ecotoxicitySpecies/yr2.25 × 10−12
18Land useSpecies/yr6.95 × 10−11
19Water consumption, terrestrial ecosystemsSpecies/yr2.01 × 10−10
20Water consumption, aquatic ecosystemsSpecies/yr2.14 × 10−15
21Mineral resource scarcityUSD20135.00 × 10−4
22Fossil resource scarcityUSD20131.64 × 10−2
Table 6. Classification of impacts into damage categories.
S/NDamage CategoryUnitValue
1Human healthDALY1.62 × 10−6
2EcosystemsSpecies/yr3.90 × 10−9
3ResourcesUSD20130.0169
Disclaimer/Publisher’s Note: The statements, opinions and data contained in all publications are solely those of the individual author(s) and contributor(s) and not of MDPI and/or the editor(s). MDPI and/or the editor(s) disclaim responsibility for any injury to people or property resulting from any ideas, methods, instructions or products referred to in the content.

