Article

Association between Dynamic Agrivoltaic System and Cultivation: Viability, Yields and Qualitative Assessment of Medical Plants

Department of Agriculture, Food, Natural Resources and Engineering (DAFNE), University of Foggia, Via Napoli 25, 71122 Foggia, Italy
*
Author to whom correspondence should be addressed.
Sustainability 2023, 15(23), 16252; https://doi.org/10.3390/su152316252
Submission received: 14 September 2023 / Revised: 15 November 2023 / Accepted: 16 November 2023 / Published: 23 November 2023
(This article belongs to the Section Energy Sustainability)

Abstract

:
This study investigated the comparative cultivation of six medicinal plant species (sage, oregano, rosemary, lavender, thyme, and mint) in a dynamic agrivoltaic (AV) system and a neighboring control plot exposed to full sun (referred to as “T”). Specifically, within the dynamic AV system, two distinct plot areas on the ground were identified due to the rotation of the panels: one consistently in the shade of the solar panels (UP), and another alternately in shade and sunlight (BP). The study involved the measurement of solar radiation, air temperature, and infrared leaf temperature during crop growth in these designated plots. Additionally, a weed survey was conducted at harvest time. The findings revealed that solar radiation, air temperature, infrared leaf temperature, and weed coverage were notably lower in the UP plot compared to both the BP and T plots. Furthermore, the yield of essential oils in sage, thyme, mint, and rosemary plants was higher in both the UP and BP plots than in the T plot. Hence, these factors seemingly positively impacted the performance of specific medicinal crops within the dynamic AV system. This information holds significance for producers and processors concerning crop quality.

1. Introduction

The increasing global demand for energy is primarily driven by a rising population and a more energy-intensive industrial sector. The depletion of fossil fuel resources and the adverse effects of their combustion, notably contributing to climate change [1], have spurred the exploration of alternative, renewable, and cleaner energy sources. One such solution involves harnessing solar energy through the installation of solar panels on both existing buildings and agricultural land [2,3].
The concept of agrivoltaics (AV), first introduced by Goetzberger and Zastrow in 1982 [4], has more recently been put into practice. This approach involves installing solar collectors at a height of 2–5 m above the ground, allowing for the dual utilization of agricultural areas for both crop cultivation and the generation of photovoltaic electricity [5,6].
Moreover, novel approaches in agrivoltaics are emerging to underscore the advantages of the food–energy relationship [7,8,9]. Additionally, a study [10] investigating the use of tilt-angle solar panels on agricultural land indicates that understanding stomatal behavior and the changes in gas exchange in plants due to shading, fluctuations in solar radiation, and variations in plant water status can significantly enhance both the management of solar panels and irrigation practices. Several studies [11,12,13,14,15] suggest that the presence of photovoltaic panels creates a microclimate (impacting temperature and humidity) that is particularly beneficial for plant growth, especially in semi-arid and arid regions. This climate adjustment can potentially enhance the performance of crops that commonly face challenges from intense solar radiation and concurrent water loss. Agrivoltaic (AV) systems offer various synergistic effects, such as reducing overall radiation on crops, thereby boosting production, and facilitating water conservation by decreasing evapotranspiration and mitigating the impact of excessive radiation [16]. However, research on the effects of AV has predominantly concentrated on fruit and annual crops, with limited available information [17] on other crop types.
When considering herbaceous crops, a domain that includes the species studied in this trial, prior research has revealed that artificial shading conditions can diminish yields in certain crops like maize and potatoes [18,19,20]. In a field experiment [21], the yields of various lettuce varieties grown under an agrivoltaic (AV) system ranged from 81% to 99% of control values in full sun, with some varieties even surpassing control values. Findings from other studies [22] examining the impact of different levels of shading from photovoltaic panels on crop yields showed minor to limited reductions (less than 25%) in crops with high light requirements, such as tomatoes, cucumbers, and sweet peppers. However, no discernible impact was observed on moderately light-demanding species like asparagus or on those with lower light requirements, such as certain flowers like poinsettia, kalanchoe, and dracaena. Another study [23] demonstrated that the AV system applied to corn, a crop sensitive to shade, resulted in increased biomass compared to the control. Moreover, broccoli cultivated under an AV system exhibited improved visual quality, with a greener appearance and higher consumer preference compared to broccoli grown in open fields [24]. Nevertheless, the yield of potato tubers decreased by 38.2% in crops grown under an AV system compared to conventional yields of potato tubers [25]. Another field experiment [26] investigating four crops (celeriac, winter wheat, potatoes, and clover) indicated yield reductions beneath the AV system compared to outside it. However, in hot and dry weather conditions, the growing conditions can become more favorable. Therefore, it is essential to consider the effects of shading when exploring potential agrivoltaic conditions. Cultivating agricultural species under photovoltaic panels is feasible using species that can tolerate partial shading or even benefit from it. For instance, strong lighting fosters the accumulation of reserve substances, encourages flowering, and suits crops like potatoes, beets, cereals, and fruit plants. Conversely, moderate light availability is advantageous for elongating the vegetative parts of plants, making it suitable for crops cultivated primarily for their leaves and stems [27]. This scenario could be applicable to medicinal plants, making them highly suitable for cultivation under a partially shaded agrivoltaic system. Within the realm of medicinal plants, the Lamiaceae family stands out as an exceptionally intriguing group offering valuable natural substances and high-quality raw materials. Most of these plants are utilized in their fresh or dried form (including stems, leaves, and flowers) known as “drug” sources from which essential oils can be derived. These oils typically comprise intricate combinations of volatile terpenes and phenylpropanes, occasionally containing small amounts of hydrocarbons or sulfur compounds [28]. It is worth emphasizing that medicinal species, specifically in terms of their production and concentrations of essential oils, have never been explored or studied in the context of their growth under an agrivoltaic system. Hence, the selection of medicinal herbs for this study encompasses sage (Salvia officinalis var. latifolia L.), oregano (Origanum vulgare, var. Aureum L.), rosemary (Rosmarinus officinalis var. Severn seas L.), lavender (Lavandula angustifolia var. Royal purple L.), thyme (Thymus citriodorus var. Aureus (Pers.) Schreb.), and mint (Mentha spicata var. Moroccan L.). In recent years, these herbs have assumed increasingly diverse roles, aligning with emerging needs and opportunities that have fostered their development across various sectors and novel agricultural ventures within this industry [29].
Italy, hosting 6000 active companies and cultivating over 24,000 hectares of land, holds the fourth position in the EU regarding surfaces dedicated to PAMC (medicinal aromatic plants and condiments). This places Italy behind Poland, Bulgaria, and France [30]. The cultivation of medicinal aromatic plants and condiments is of substantial interest in Italy, yielding over 25 million kilograms across 6000 participating companies and over 24,000 cultivated hectares. Notably, this reflects a growth of 110% within three years, covering only 70% of the entire national demand [31].
It is estimated that the wholesale value of medicinal products amounts to approximately 115 million euros. The potential utilization volume for Italian production is projected to reach nearly 18 thousand tons, accounting for 73% of the total. This sector is experiencing robust double-digit growth rates, adeptly responding to new demands arising from both consumers—such as heightened focus on well-being—and community policies that stress the preservation of biodiversity, sustainability, and multifunctionality [32]. This situation presents a highly promising market opportunity for farmers.
The best-selling products encompass parsley, basil, sage, rosemary, mint, and wild fennel [33]. Conversely, those showing the most intriguing market dynamics include coriander, chives, thyme, and chili pepper [34]. In Italian retail, aromatic herbs are perceived as complementary service products for the fruit and vegetable department, offering a more restricted range compared to extensive foreign distribution chains.
Regardless, the market seeks high-quality medicinal plant extracts boasting elevated concentrations of essential oils. It is recognized that essential oil content fluctuates with the seasons and climatic conditions [35]. Given the partial shading by agrivoltaics (AV) systems, we posit that medicinal crops might display varying levels of essential oils and yields compared to conventional agronomic practices. However, studies on this subject are currently insufficient. Hence, the objective of this study is to assess the yield and essential oil concentrations of six medicinal crops (sage, oregano, rosemary, lavender, thyme, and mint) cultivated under a dynamic AV system, contrasting their growth under full-sun conditions.

2. Materials and Methods

The research was structured as shown in Figure 1.

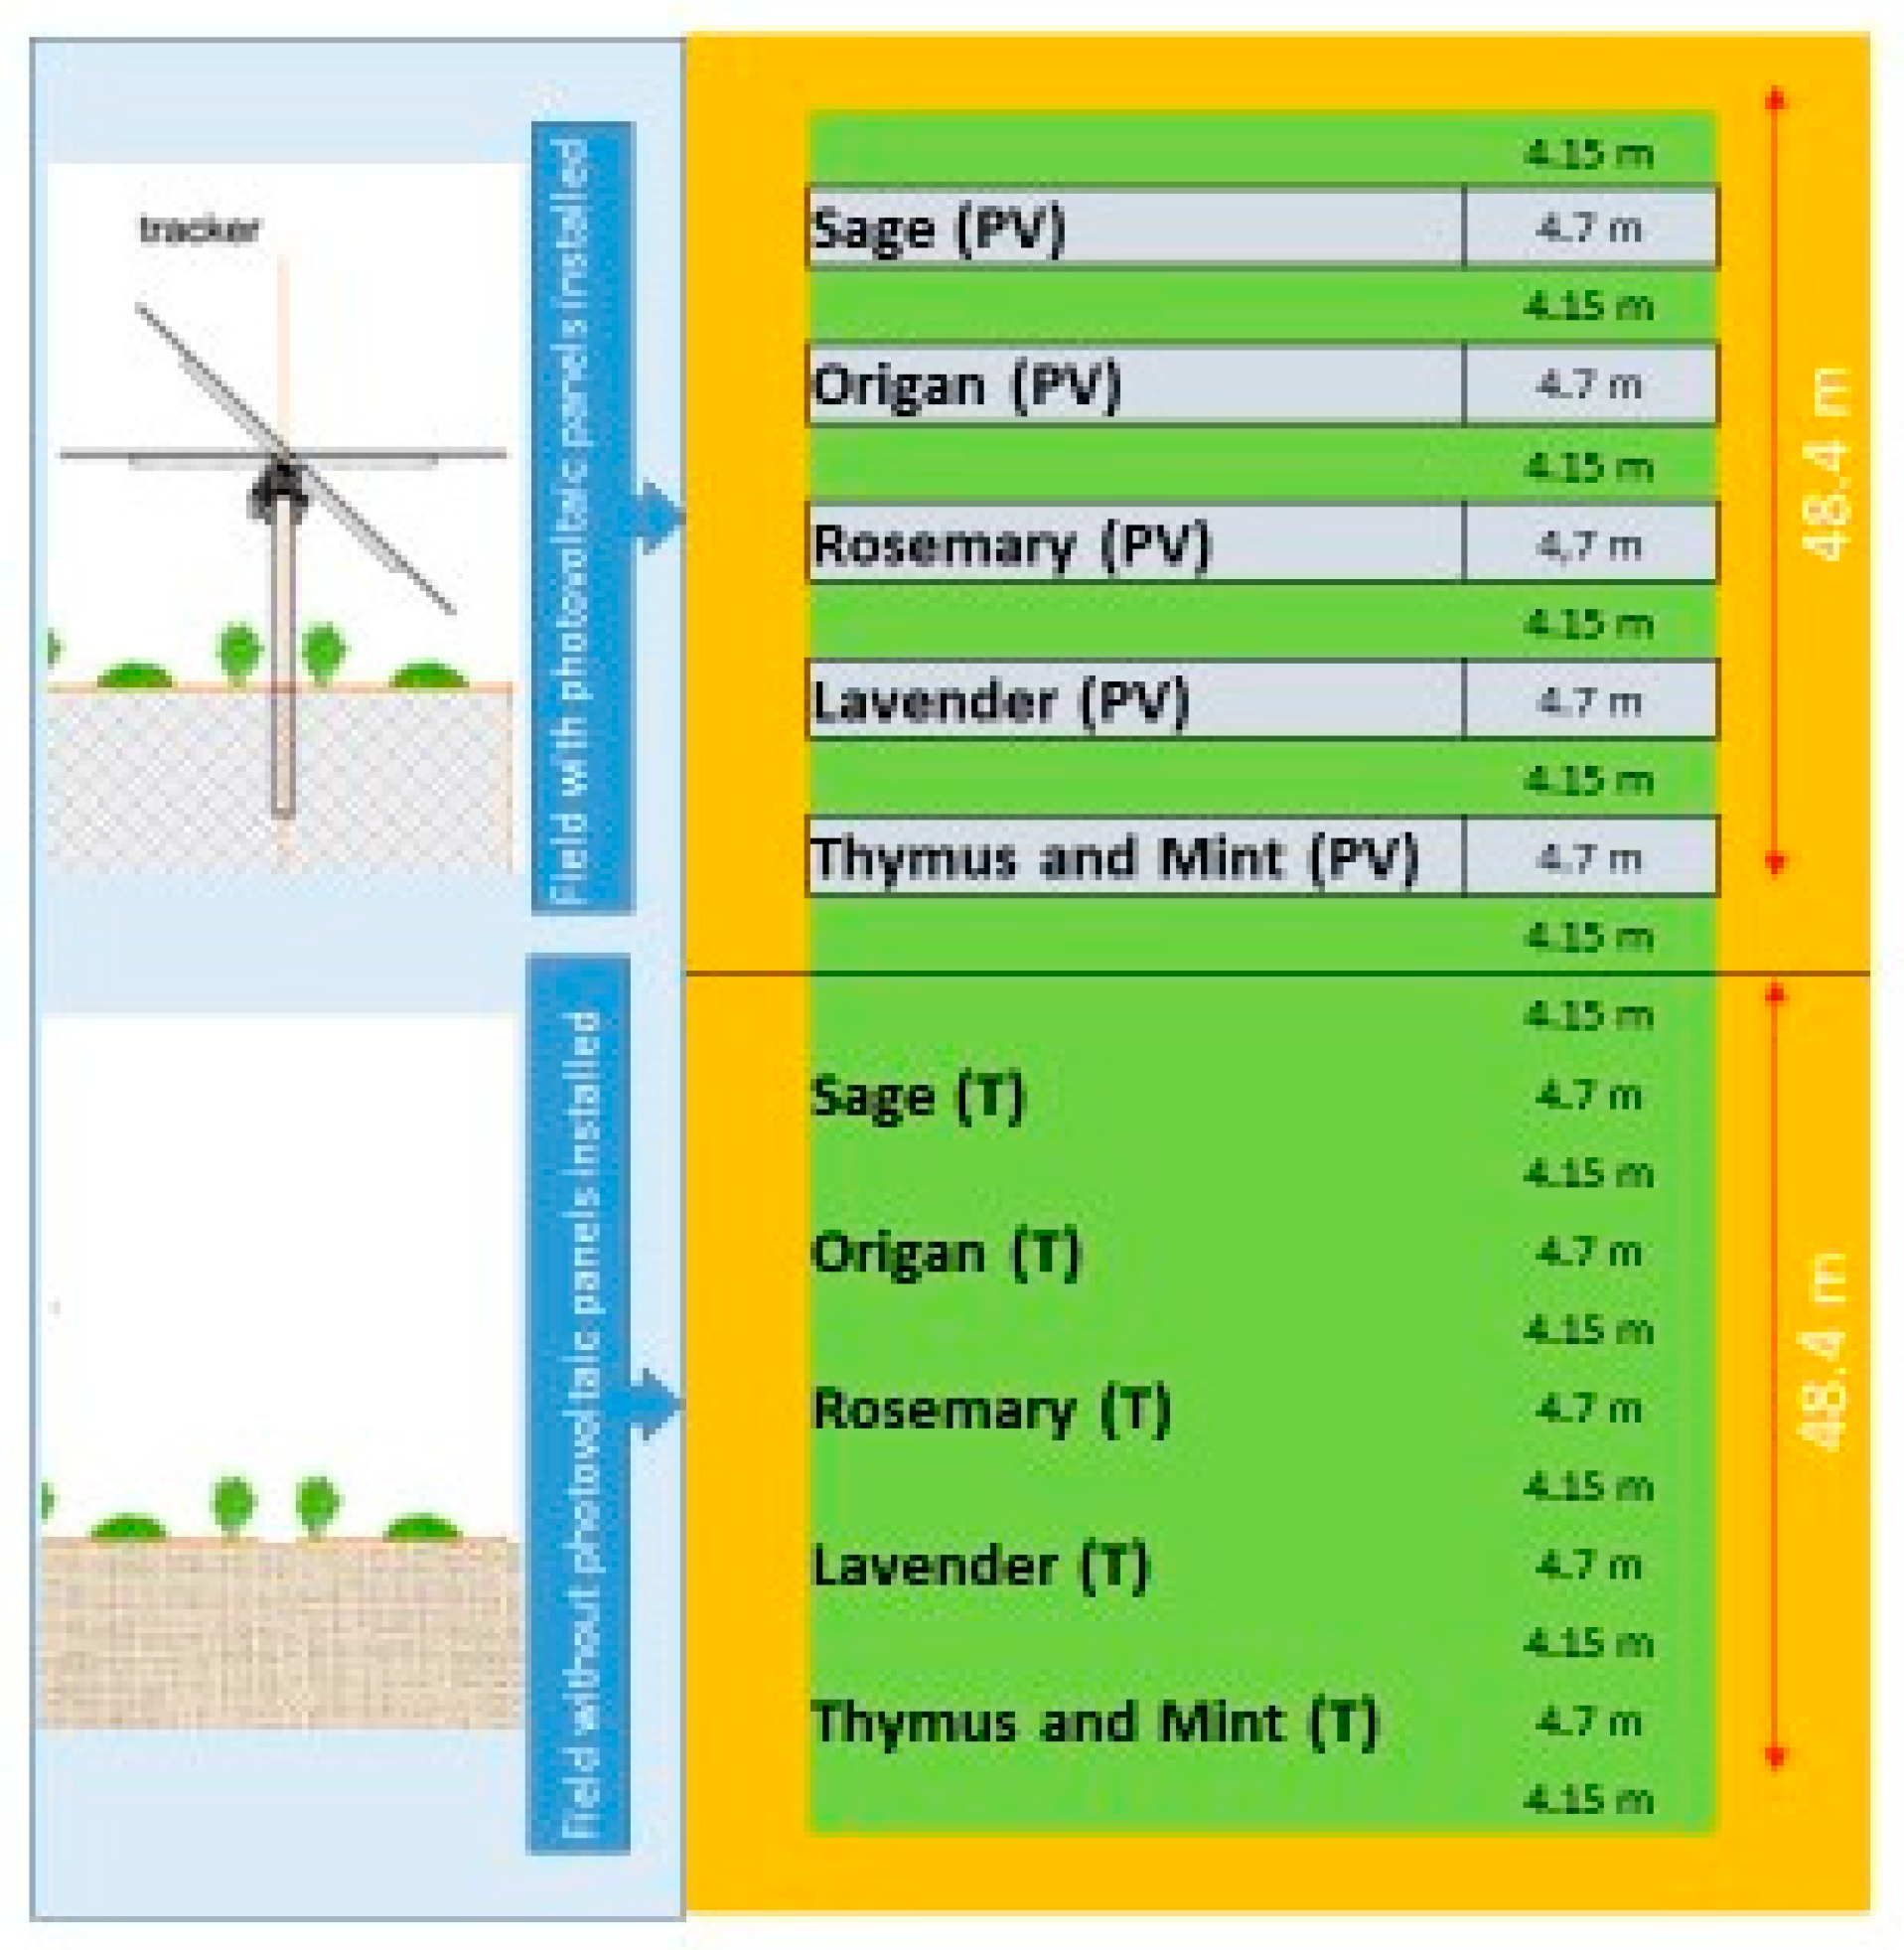
2.1. The Dynamic Agrivoltaic System

The agrivoltaic system utilized in this study is a single-axis tracking photovoltaic system erected on raised structures (stilts). Horizontal main axes are fixed onto these stilts, with the solar panels affixed to secondary axes that pivot on the main axes.
The dynamic agrivoltaic system (refer to Figure 2) comprises photovoltaic solar panels positioned 2.50 m above the crops. These panels have the ability to rotate within an angle of +/− 50°, allowing for adjustment of shading levels. An electronic unit governs the solar-tracking system, ensuring that the panels consistently align with the Sun and avoid shading one another. This setup is designed to optimize photovoltaic output and enhance light accessibility.
The support structures, made of metallic materials, were arranged in parallel rows running in a north–south direction with appropriate spacing (8.85 m). These panels rotate on an axis from east to west, aligning with the Sun’s daily trajectory. The axis of rotation is set at a height of 2.50 m above the ground. The panels can rotate up to approximately 45°, with a minimum height of 0.80 m. The narrowest shaded space (spaced 4.166 m apart) between the trackers occurs when they are parallel to the ground, particularly at noon. As the panels rotate to an inclination of about 45°, the remaining space (at the same distance of 4.166 m) undergoes alternating shading.
Consequently, beneath the dynamic AV system, distinct zones are identified on the ground surface as the solar panels rotate. One area consistently remains in the shade (referred to as UP), while the other, positioned between the panels, experiences intermittent shading (referred to as BP). The aromatic crops grown in these designated zones were compared with those cultivated in full sun in an adjacent area (referred to as T).

2.2. Field Experiment

The field experiment took place during the 2022 season in the rural area of San Severo, located in the Foggia Province of the Apulia region in Southern Italy. This area represents a typical semi-arid environment characterized by a Mediterranean climate, specifically classified as “accentuated thermo-mediterranean” [36]. The climate exhibits winter temperatures below 0 °C and summer temperatures exceeding 40 °C, with most rainfall occurring in winter, averaging 559 mm annually [37].
This study, conducted jointly by the Department of Agriculture, Food, Natural Resources and Engineering (DAFNE) at the University of Foggia and M2 Energia S.r.l., aimed to compare the quality and yields of six medicinal and aromatic crops: sage, oregano, rosemary, lavender, thyme, and mint (refer to Figure 3).
The soil underwent plowing to a depth of 40 cm and received two treatments with a disc harrow before the transplanting of the aromatic plants. The field trial covered an area of 30 × 115 m (3450 square meters), with half under the AV system (1725 square meters) and the other half under full-sun conditions in the T zone (1725 square meters). The region under the AV system was further divided into UP and BP zones (each measuring 862 square meters).
Each medicinal crop was transplanted into continuous rows spaced 1 × 1 m apart in May 2022 in every designated area. The experimental design employed a randomized block structure with three replications (plots) for each species. Each plot spanned 40 square meters (4 m by 10 m) and contained four rows. The two central rows within each plot were dedicated to data collection.
The soil texture was identified as clay loam [38], offering an effective depth of over 120 cm and characterized as a vertisol of alluvial origin. The soil’s composition included sand (38.6%), loam (22.4%), and clay (39.0%), with various essential parameters such as total N (Kjeldahl) = 2.7‰, assimilable P2O5 (Olsen) = 58 ppm, exchangeable K2O (Schollemberger) = 539 ppm, exchangeable Ca = 2928 ppm, exchangeable Mg = 317 ppm, exchangeable Na = 34 ppm, C/N ratio = 5:2, electrical conductivity (ECe) = 0.63 dS cm−1, pH (in water) = 8.1, and organic matter (Walkley and Black) = 2.5%. The tillage system employed a plowing depth of 40 cm along with two treatments using a disk harrow.
Throughout the growing season, drip irrigation and standard agronomic practices were implemented. At the balsamic phase in July 2022, all the crops were manually harvested. Fresh leaves from each aromatic plant were collected during harvest, dried, homogenized, and used for essential oil (EO) extraction.
The drying process was carried out using an oven set at 30 °C, while the essential oil extraction involved a 2 h distillation in a current stream. The EOs’ yield, measured as a percentage of the dry matter yield, was determined using a 62 L steel extractor apparatus (Albrigi Luigi EO 131, Verona, Italy) following the method described by Frabboni et al. in 2019 [39].

2.3. Microclimatic Condition, Plant Growth, and Floristic Surveys

Solar radiation (W m2), air temperature (°C), and infrared leaf temperature (°C) in the UP, BP, and T plots were measured during the hottest hours of the day (between 12:00 and 14:00) at 15-day intervals throughout the crop cycles. These measurements were manually recorded using a solar power meter (TES, Taiwan, model TES 1333), a thermometer (TorAnn S.A.S Strumenti, Italy, model HD 2328.0), and an infrared thermometer (Lafayette, model TRI-88), respectively. The data collection for microclimatic conditions, including solar radiation and air temperature, was performed at a height of 2 m above the ground. The infrared thermometer was manually positioned at a 30-degree angle towards the area with the densest canopy, and measurements were taken at every meter distance.
During the measurements (around midday), the UP experimental plot was completely shaded, while the other ones (BP and T, which underwent alternating shading between the panels as the panels rotated) were not shaded. Moreover, please note that the microclimatic measurements on individual days did not last 2 h, but were carried out quickly, in no more than 10–15 min for all treatments, as they were carried out simultaneously by 4 operators, each measuring only one microclimatic parameter.
Growth measurements were specifically conducted for sage. Height was measured from ground level considered as 0, and the width was measured in an east–west direction. These measurements were taken 10 days after transplantation (on May 20) and again before harvesting (on July 30) using a tape measure and recorded in centimeters. Growth was calculated based on the difference between the May and July measurements in each experimental plot (UP, BP, and T).
Additionally, at harvest time, the percentage of ground cover by weeds (WGC%) was evaluated following the method described by Frabboni et al. in 2019 [39].
Each measurement of microclimatic parameters and the floristic survey were replicated three times, specifically in the two central rows in the middle of each plot.

2.4. Statistical Analysis

The obtained results underwent evaluation through one-way analysis of variance (ANOVA) utilizing the JMP software package, version 14.3 (SAS Institute Inc., Cary, NC, USA). Average values were compared using Tukey’s test. Significance was established for p values < 0.05. Percentage values were converted to arcsine prior to the analysis of variance.

3. Results

3.1. Microclimatic Measurements

Primarily, it is important to note that the measurements of solar radiation, air temperature, infrared leaf temperature, and the weed survey did not reveal any significant differences among the aromatic species across the UP, BP, and T plots. As a result, the data presented represent the average values of various species under comparison.

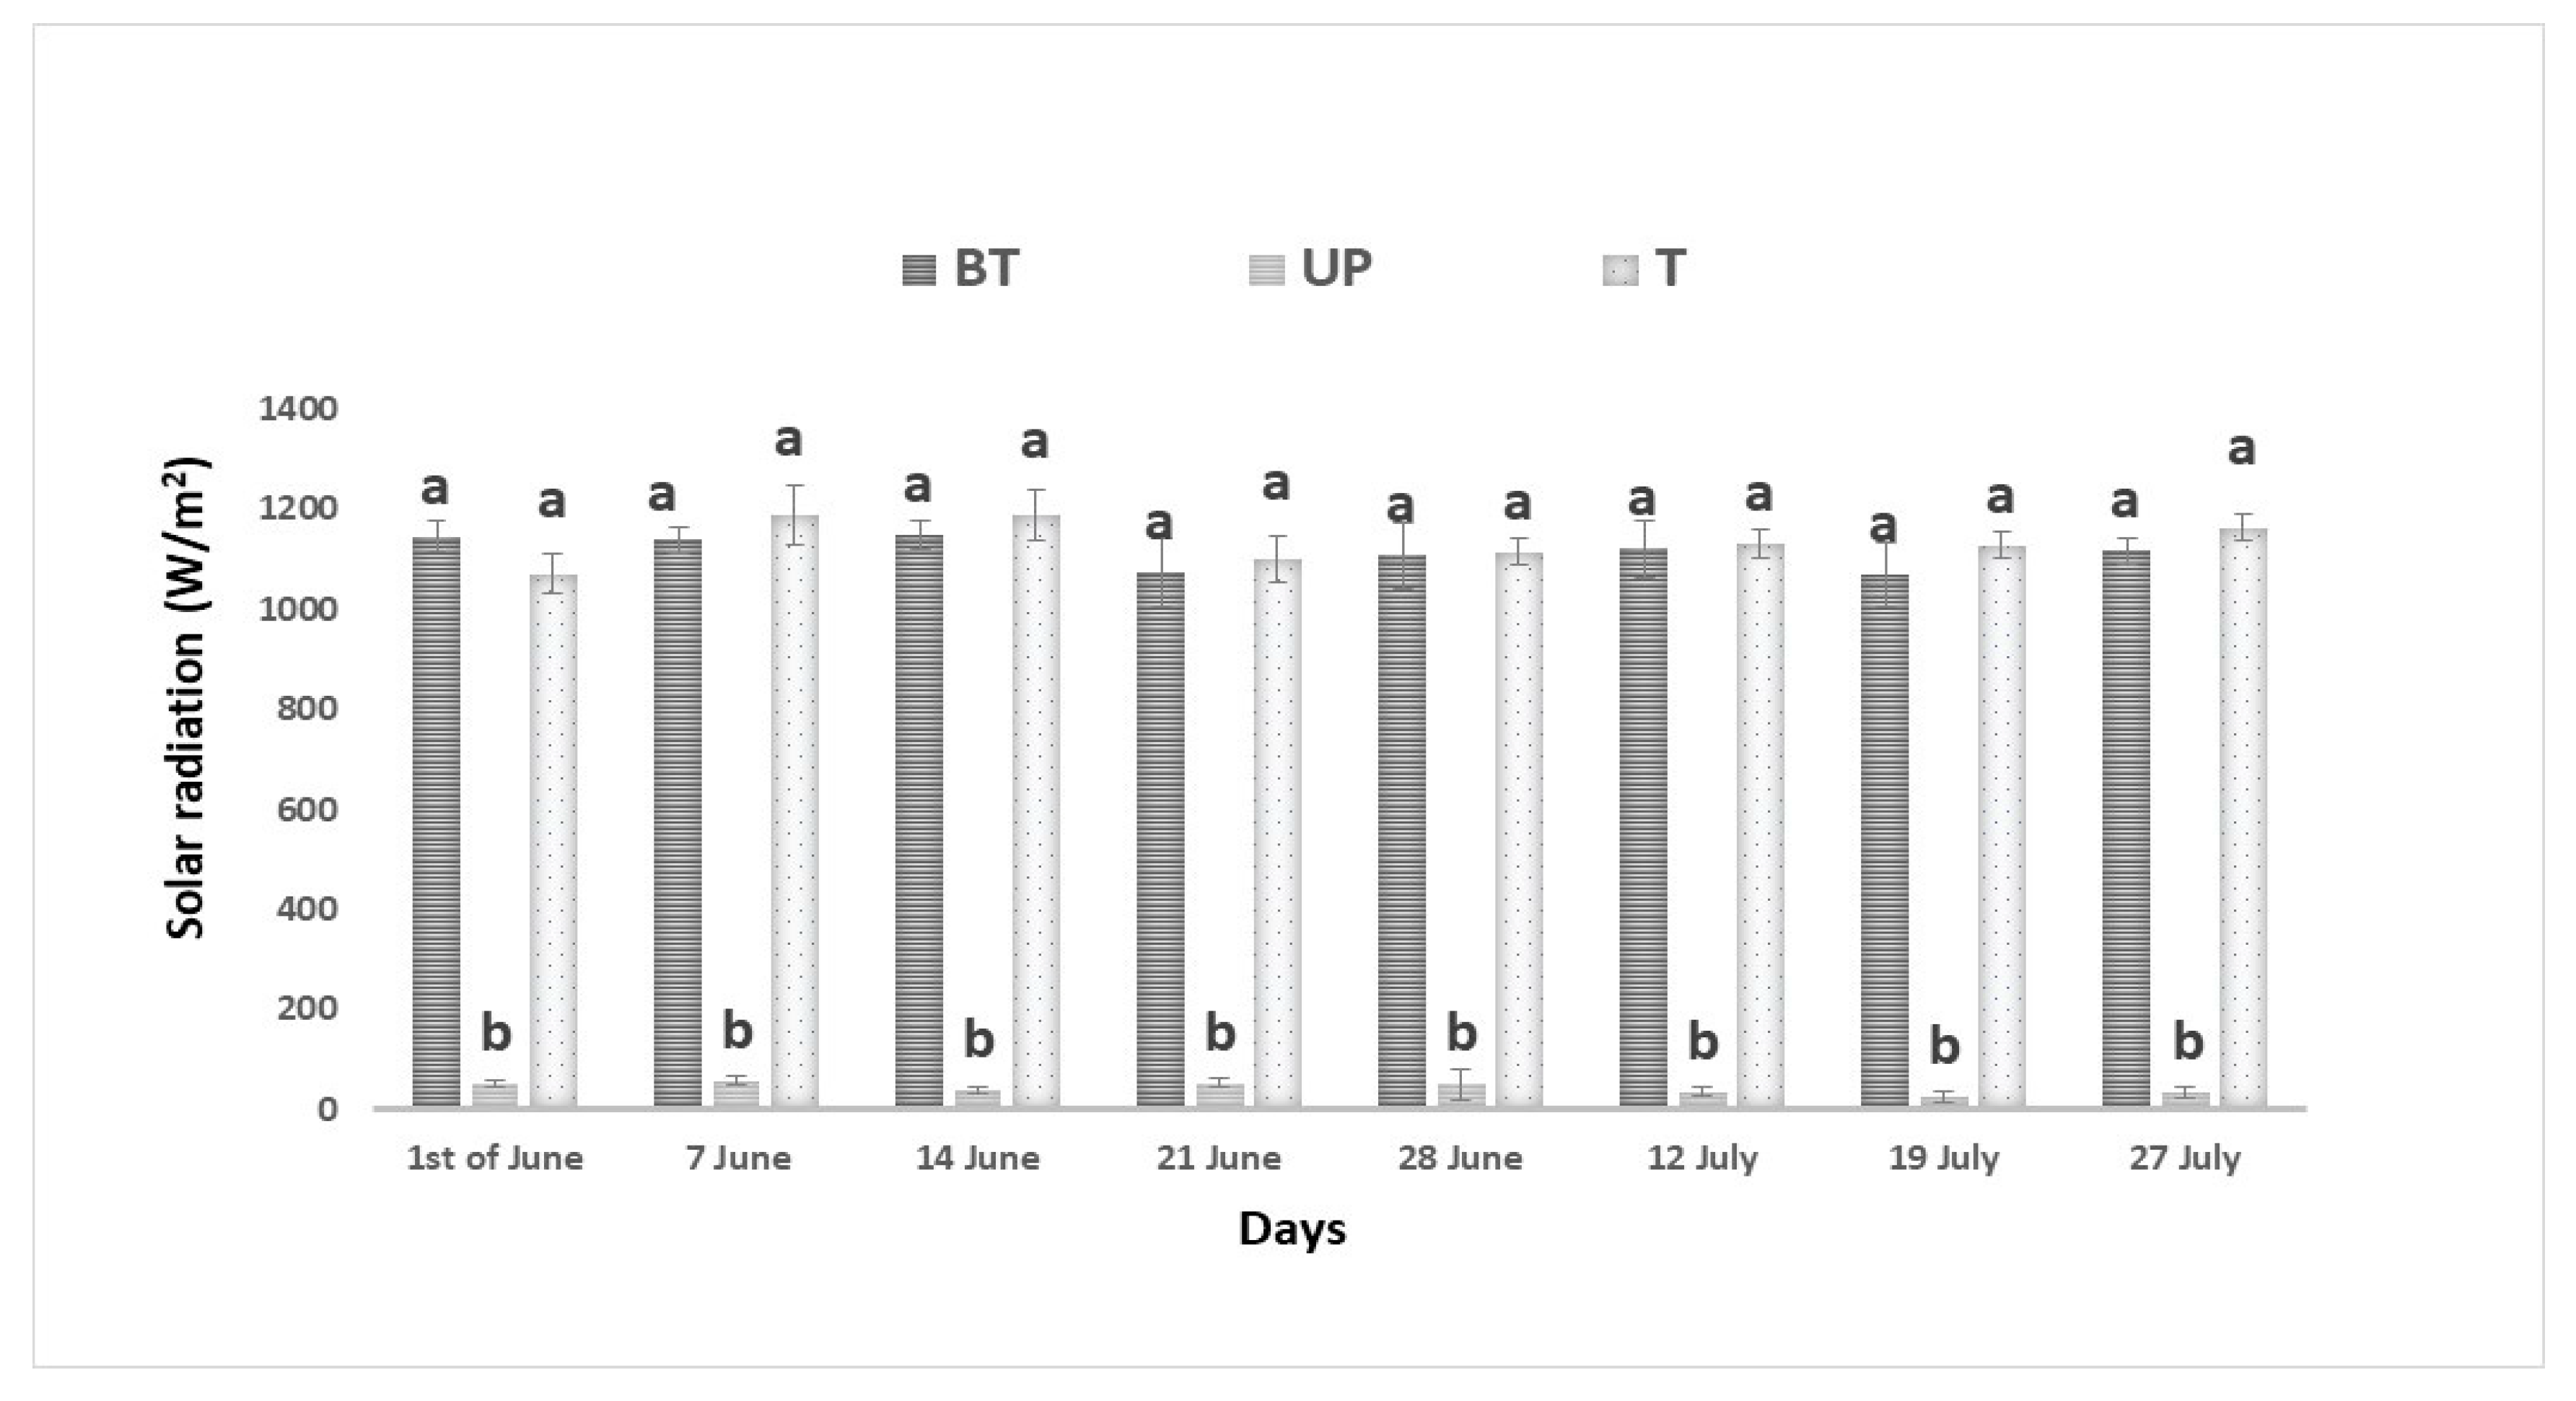
3.1.1. Solar Radiation

The average peak solar radiation observed at noon in the UP, BP, and T plots is depicted in Figure 4. As anticipated, on each date, the values in the UP plot were notably lower, varying between 25 and 50 Wm−2, compared to both the BP and T plots, where the readings ranged from 1025 to 1228 Wm−2. There were no statistically significant differences between the latter two.

3.1.2. Air Temperature

A microclimate factor directly impacted by solar radiation is air temperature [34].
Observations of daytime air temperatures between 12:00 and 14:00 (see Table 1), when solar radiation is typically high, consistently displayed significantly lower values in the UP plot compared to both the BP and T plots. On average, temperatures in the UP plot were 1.2 and 1.4 °C lower than those in the BP and T plots, respectively.

3.1.3. Infrared Foliar Temperature
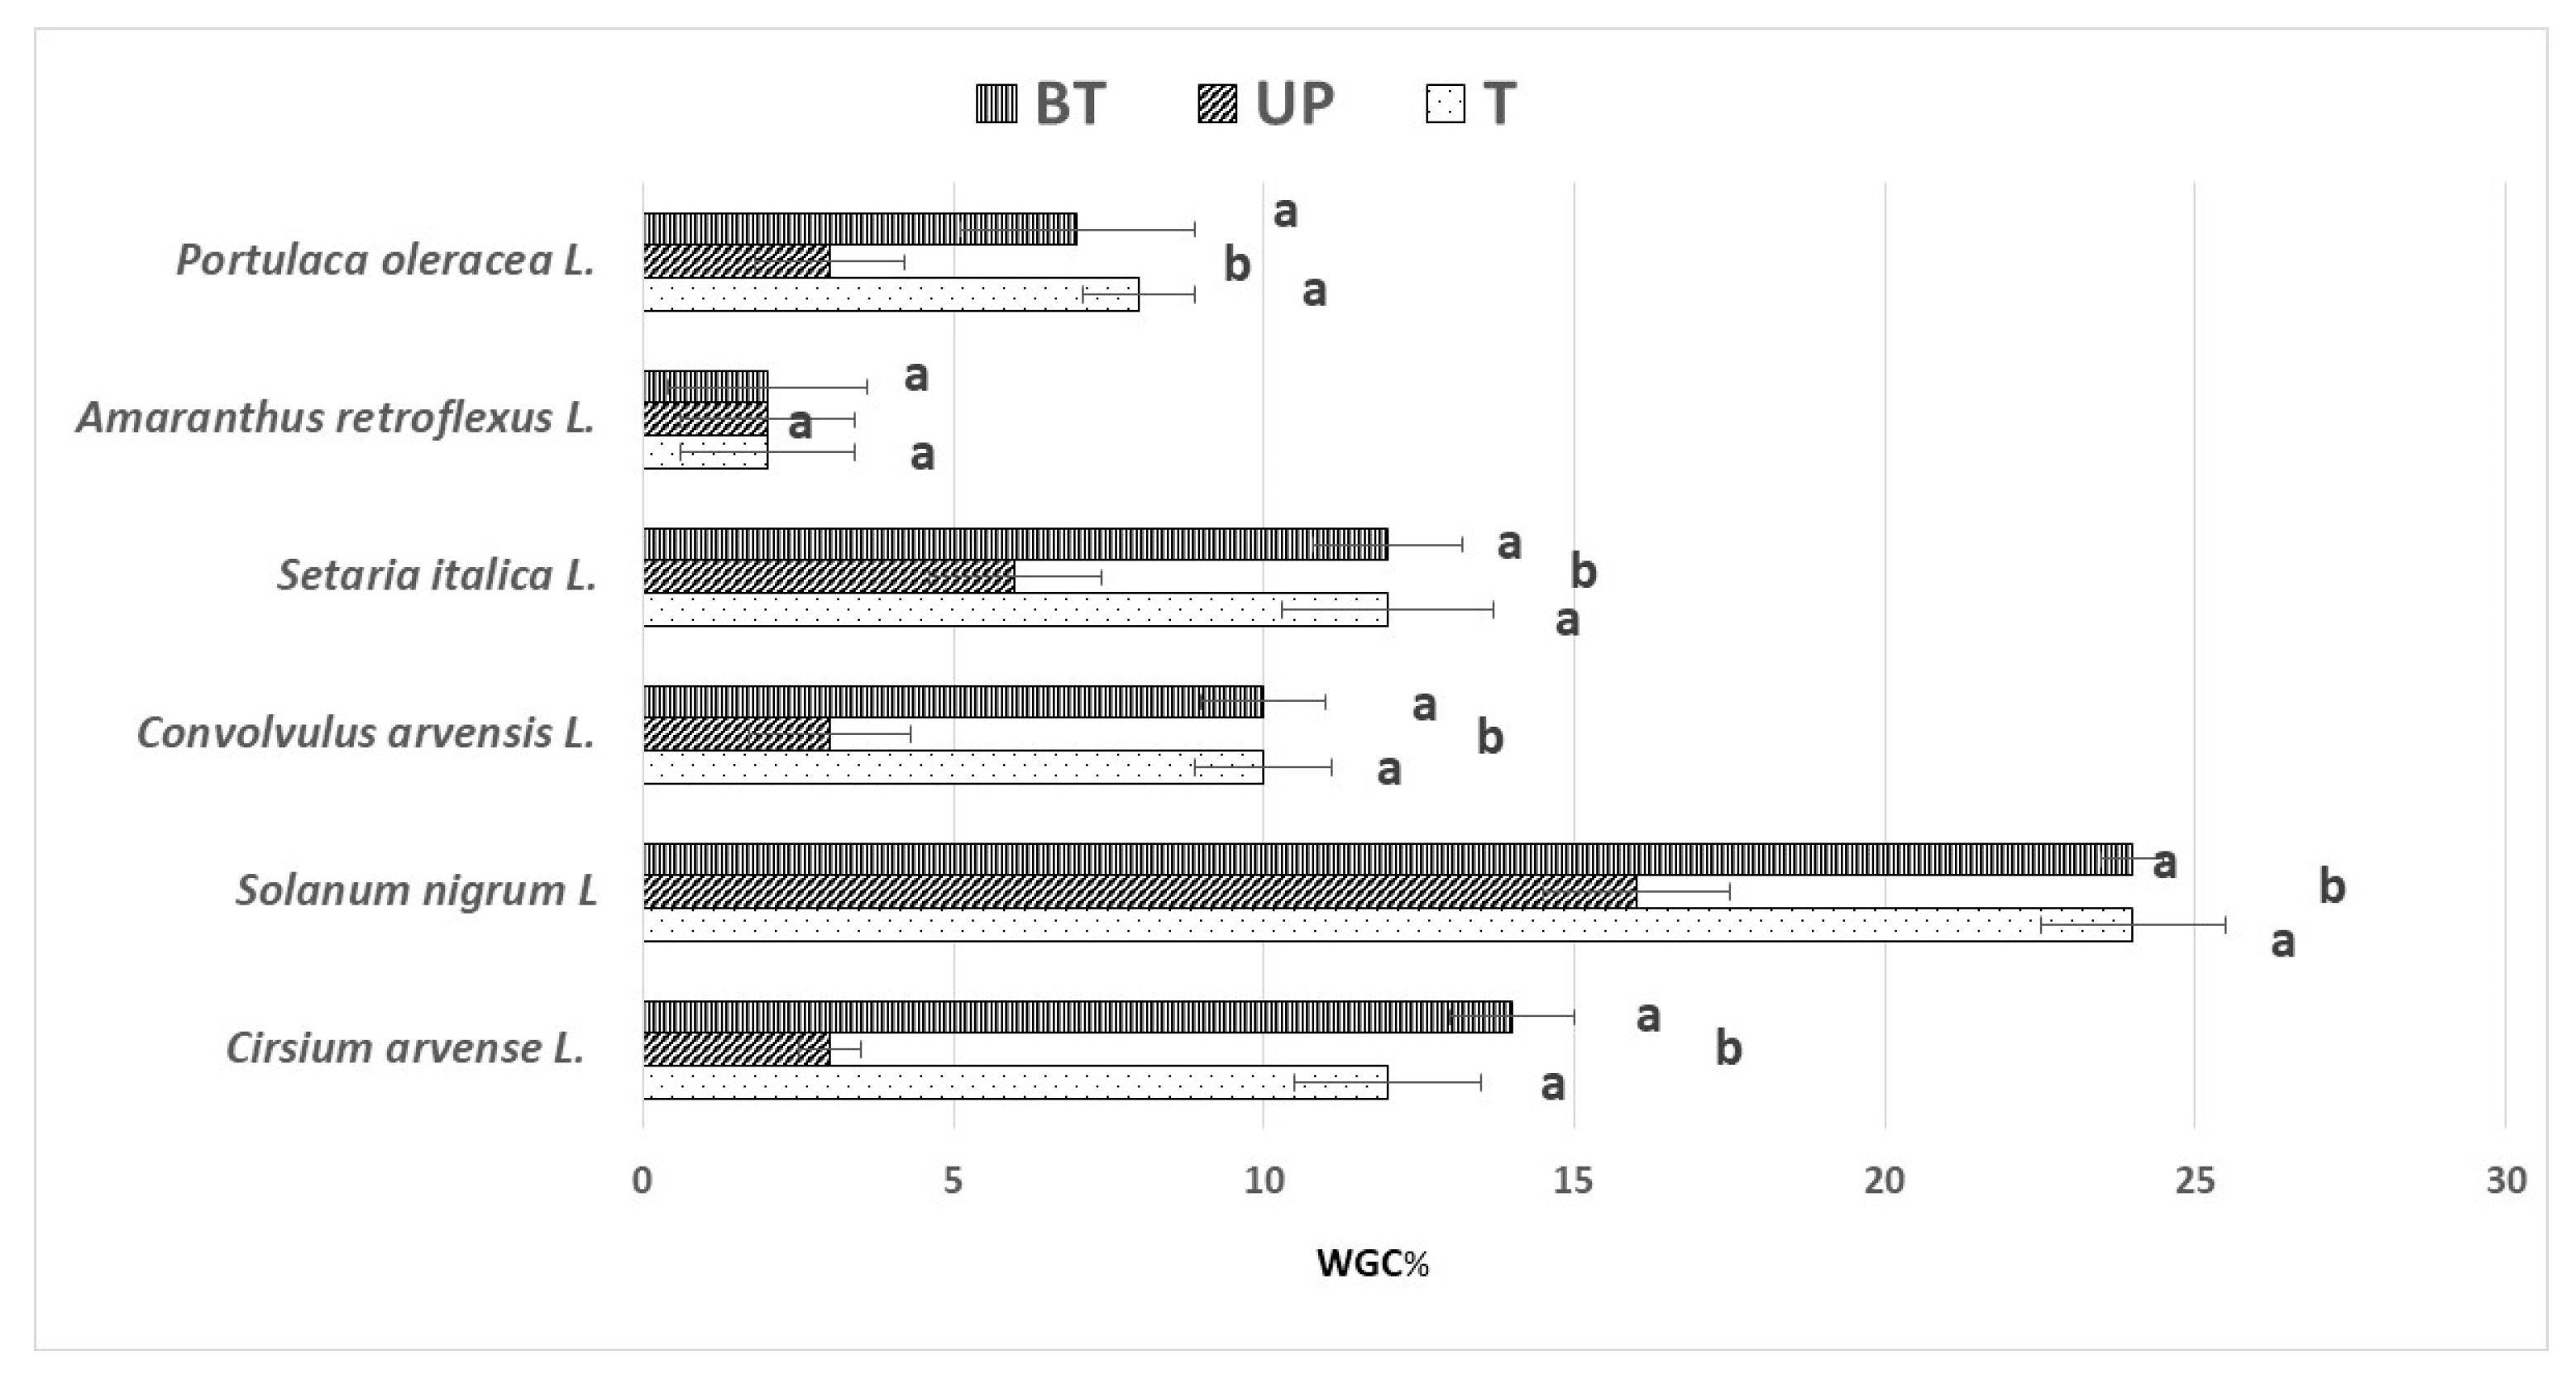
The average infrared leaf temperatures, recorded at noon on various dates throughout the crop cycle in the UP, BP, and T plots, are displayed in Figure 5. On each date, the UP plot exhibited the lowest values (ranging between 28.1 and 32.2 °C), which, while not significantly different from those of the BP plot (ranging between 30.0 and 35.1 °C), were notably lower than the temperatures in the T plots (ranging between 30.1 and 38.9 °C) on different dates.

3.2. Weeds Survey

From the floristic surveys, carried out in the trials, the most represented weeds were the following six species: Portulaca oleracea L., Amaranthus retroflexus L., Setaria italica L., Convolvulus arvensis L., Solanum nigrum L., and Cirsium arvense L.
In Figure 6, the average WGC % values observed in different plots for each weed are presented. There were significant variations among weed species and among the plots.
Across all weed species, S. nigrum L. displayed the highest relative values (ranging between 15.8 and 24.2%), while the lowest values were documented for A. retroflexus L. (ranging between 1.8 and 2.1%). Intermediate WGC % values were identified for other weed species (ranging between 2.6 and 14.1%).
When comparing the three plots, except for the A. retroflexus species, all other weeds demonstrated significantly lower values in the UP plot (ranging between 2.5 and 15.7%) compared to both the BP and T plots (ranging between 7.5 and 24.2%).

3.3. Plant Growth Observation on Sage Crop

The biometric observations of sage, particularly the plant height and width (east–west growth), exhibited significant increases in both the UP and BP areas in comparison to full-sun conditions (T) (refer to Table 2). The notably higher percentage increases in plant height (42.8%) and width (58.9%) beneath the solar panels might be attributed to the shading effect. Comparable results have been documented in other studies on lettuces [21].

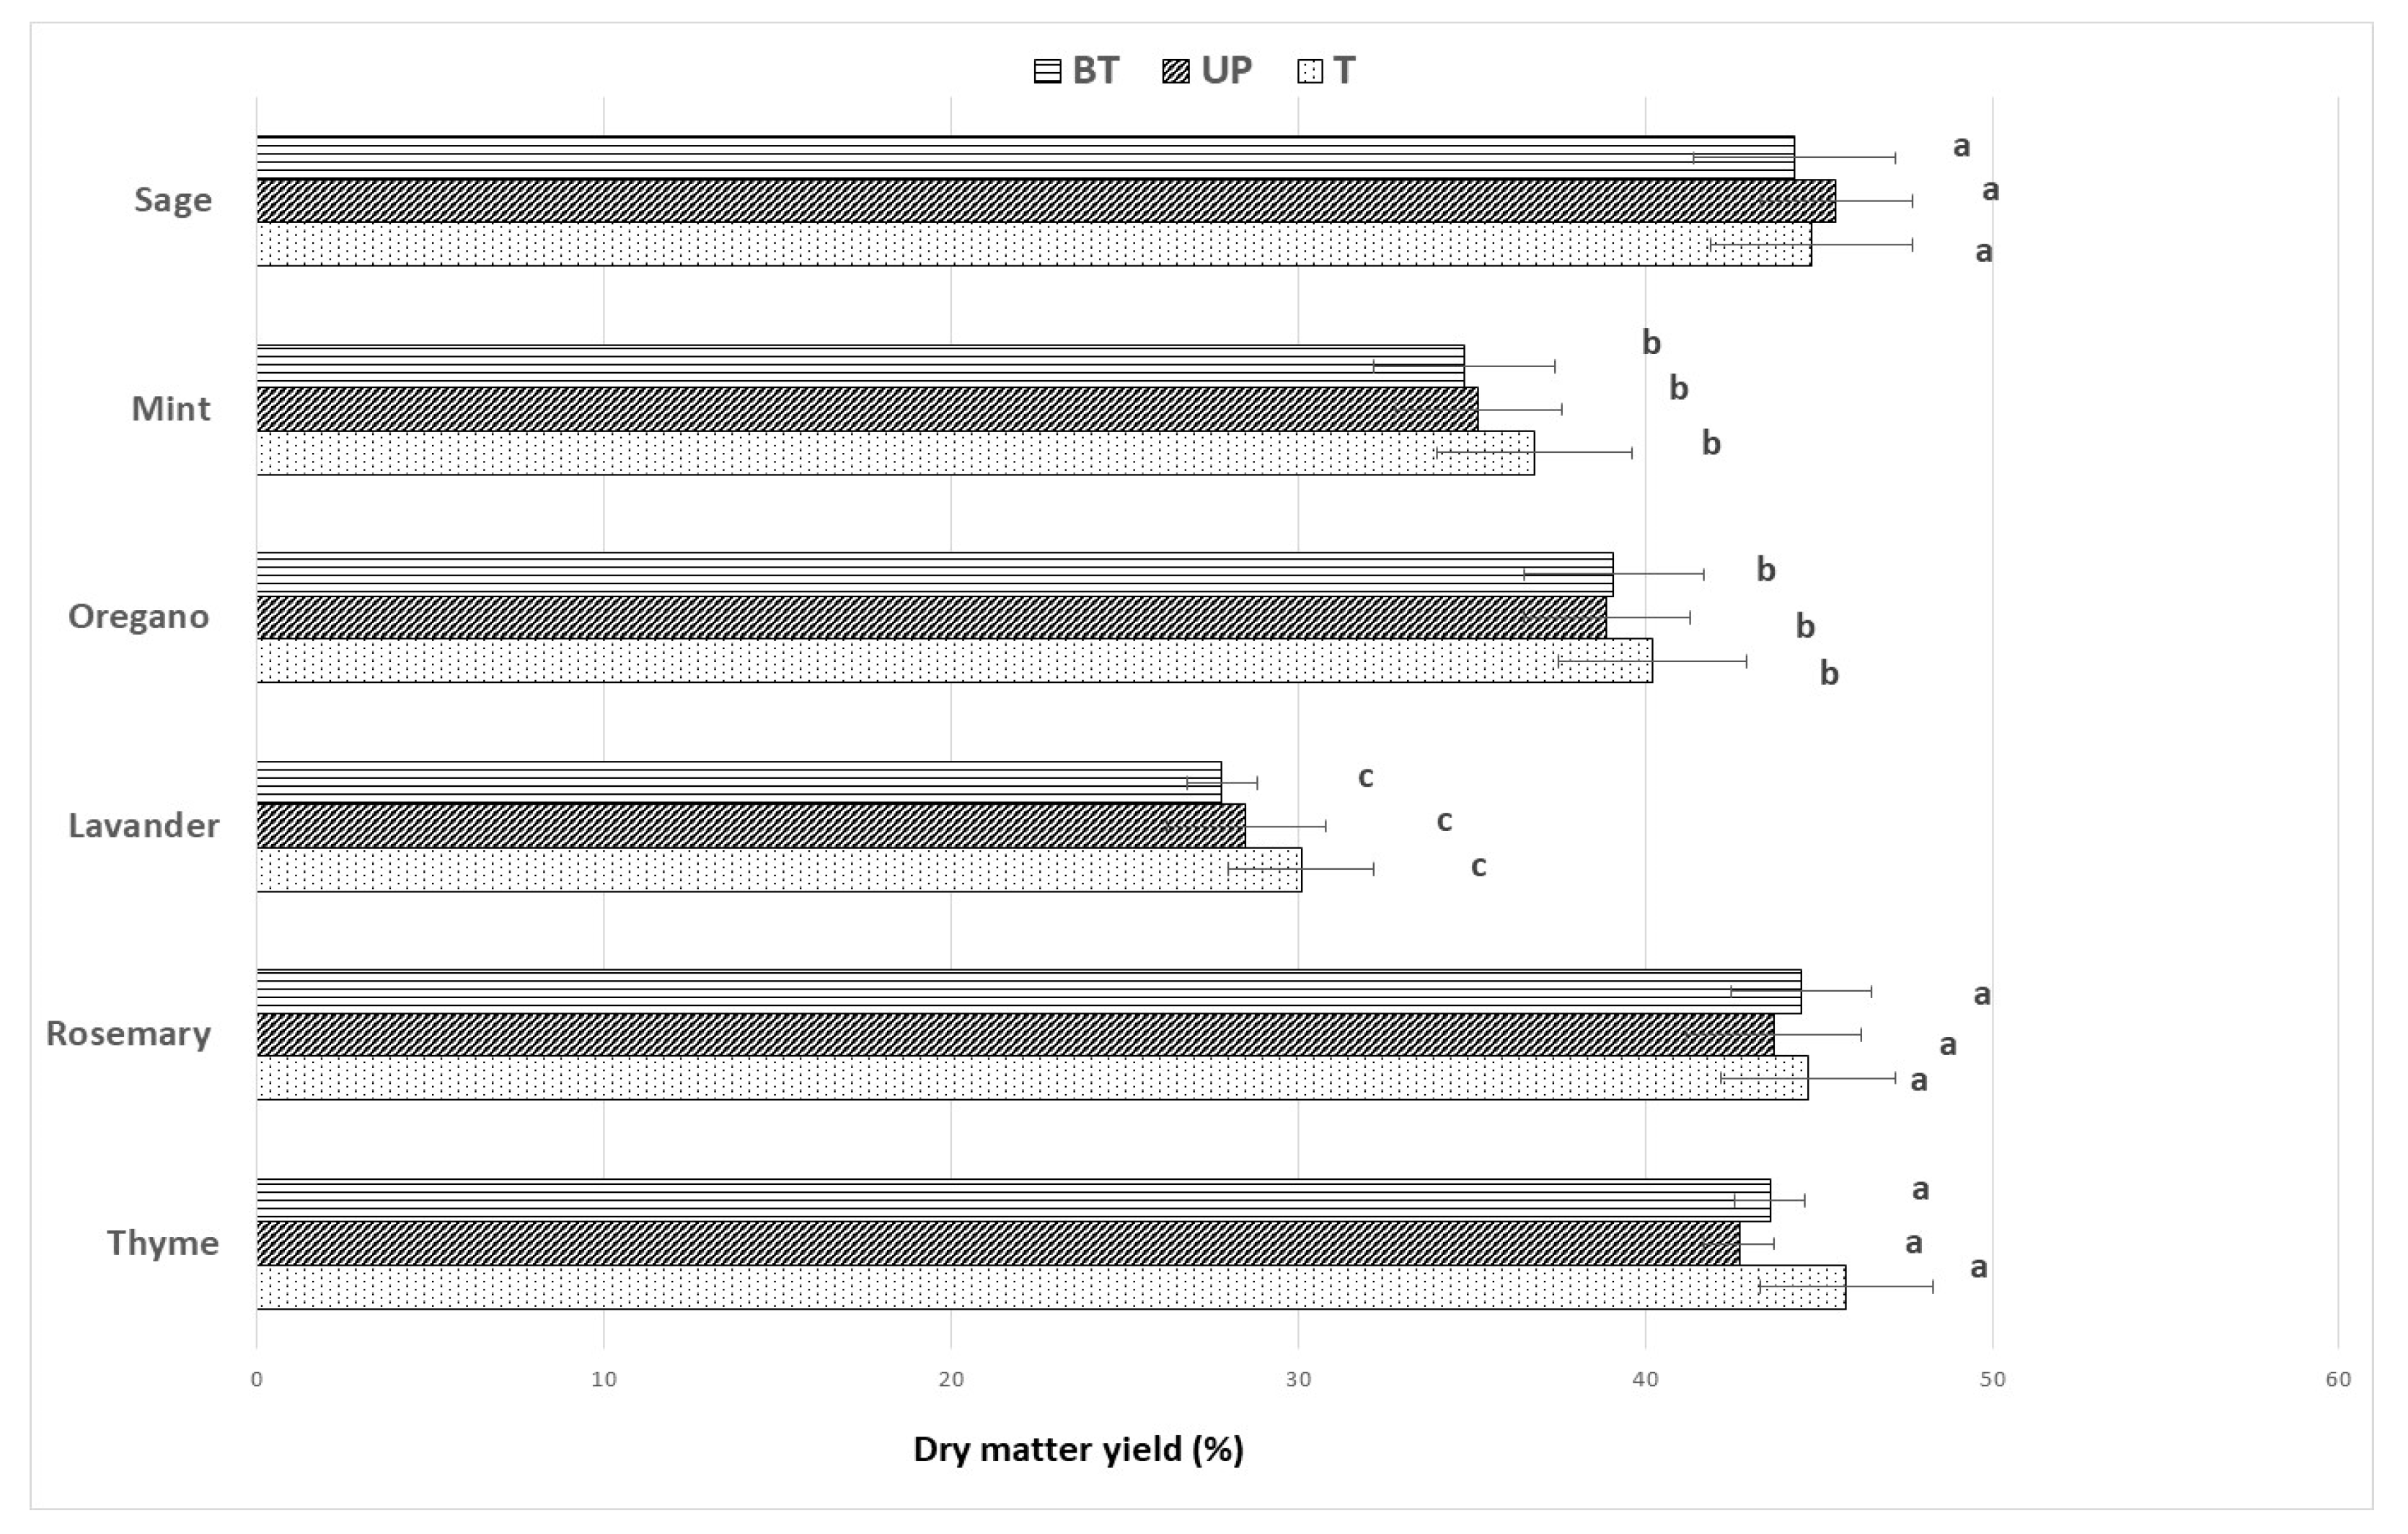
3.4. Dry Matter Content

The average dry matter values observed in each crop (see Figure 7) did not display significant differences among the UP, BP, and T plots. However, these values were notably higher in three crops, sage, rosemary, and thyme (averaging 45.9%), compared to oregano and mint crops (averaging 38.1%). Moreover, the values observed for oregano and mint were statistically higher than those for lavender (29.8%).

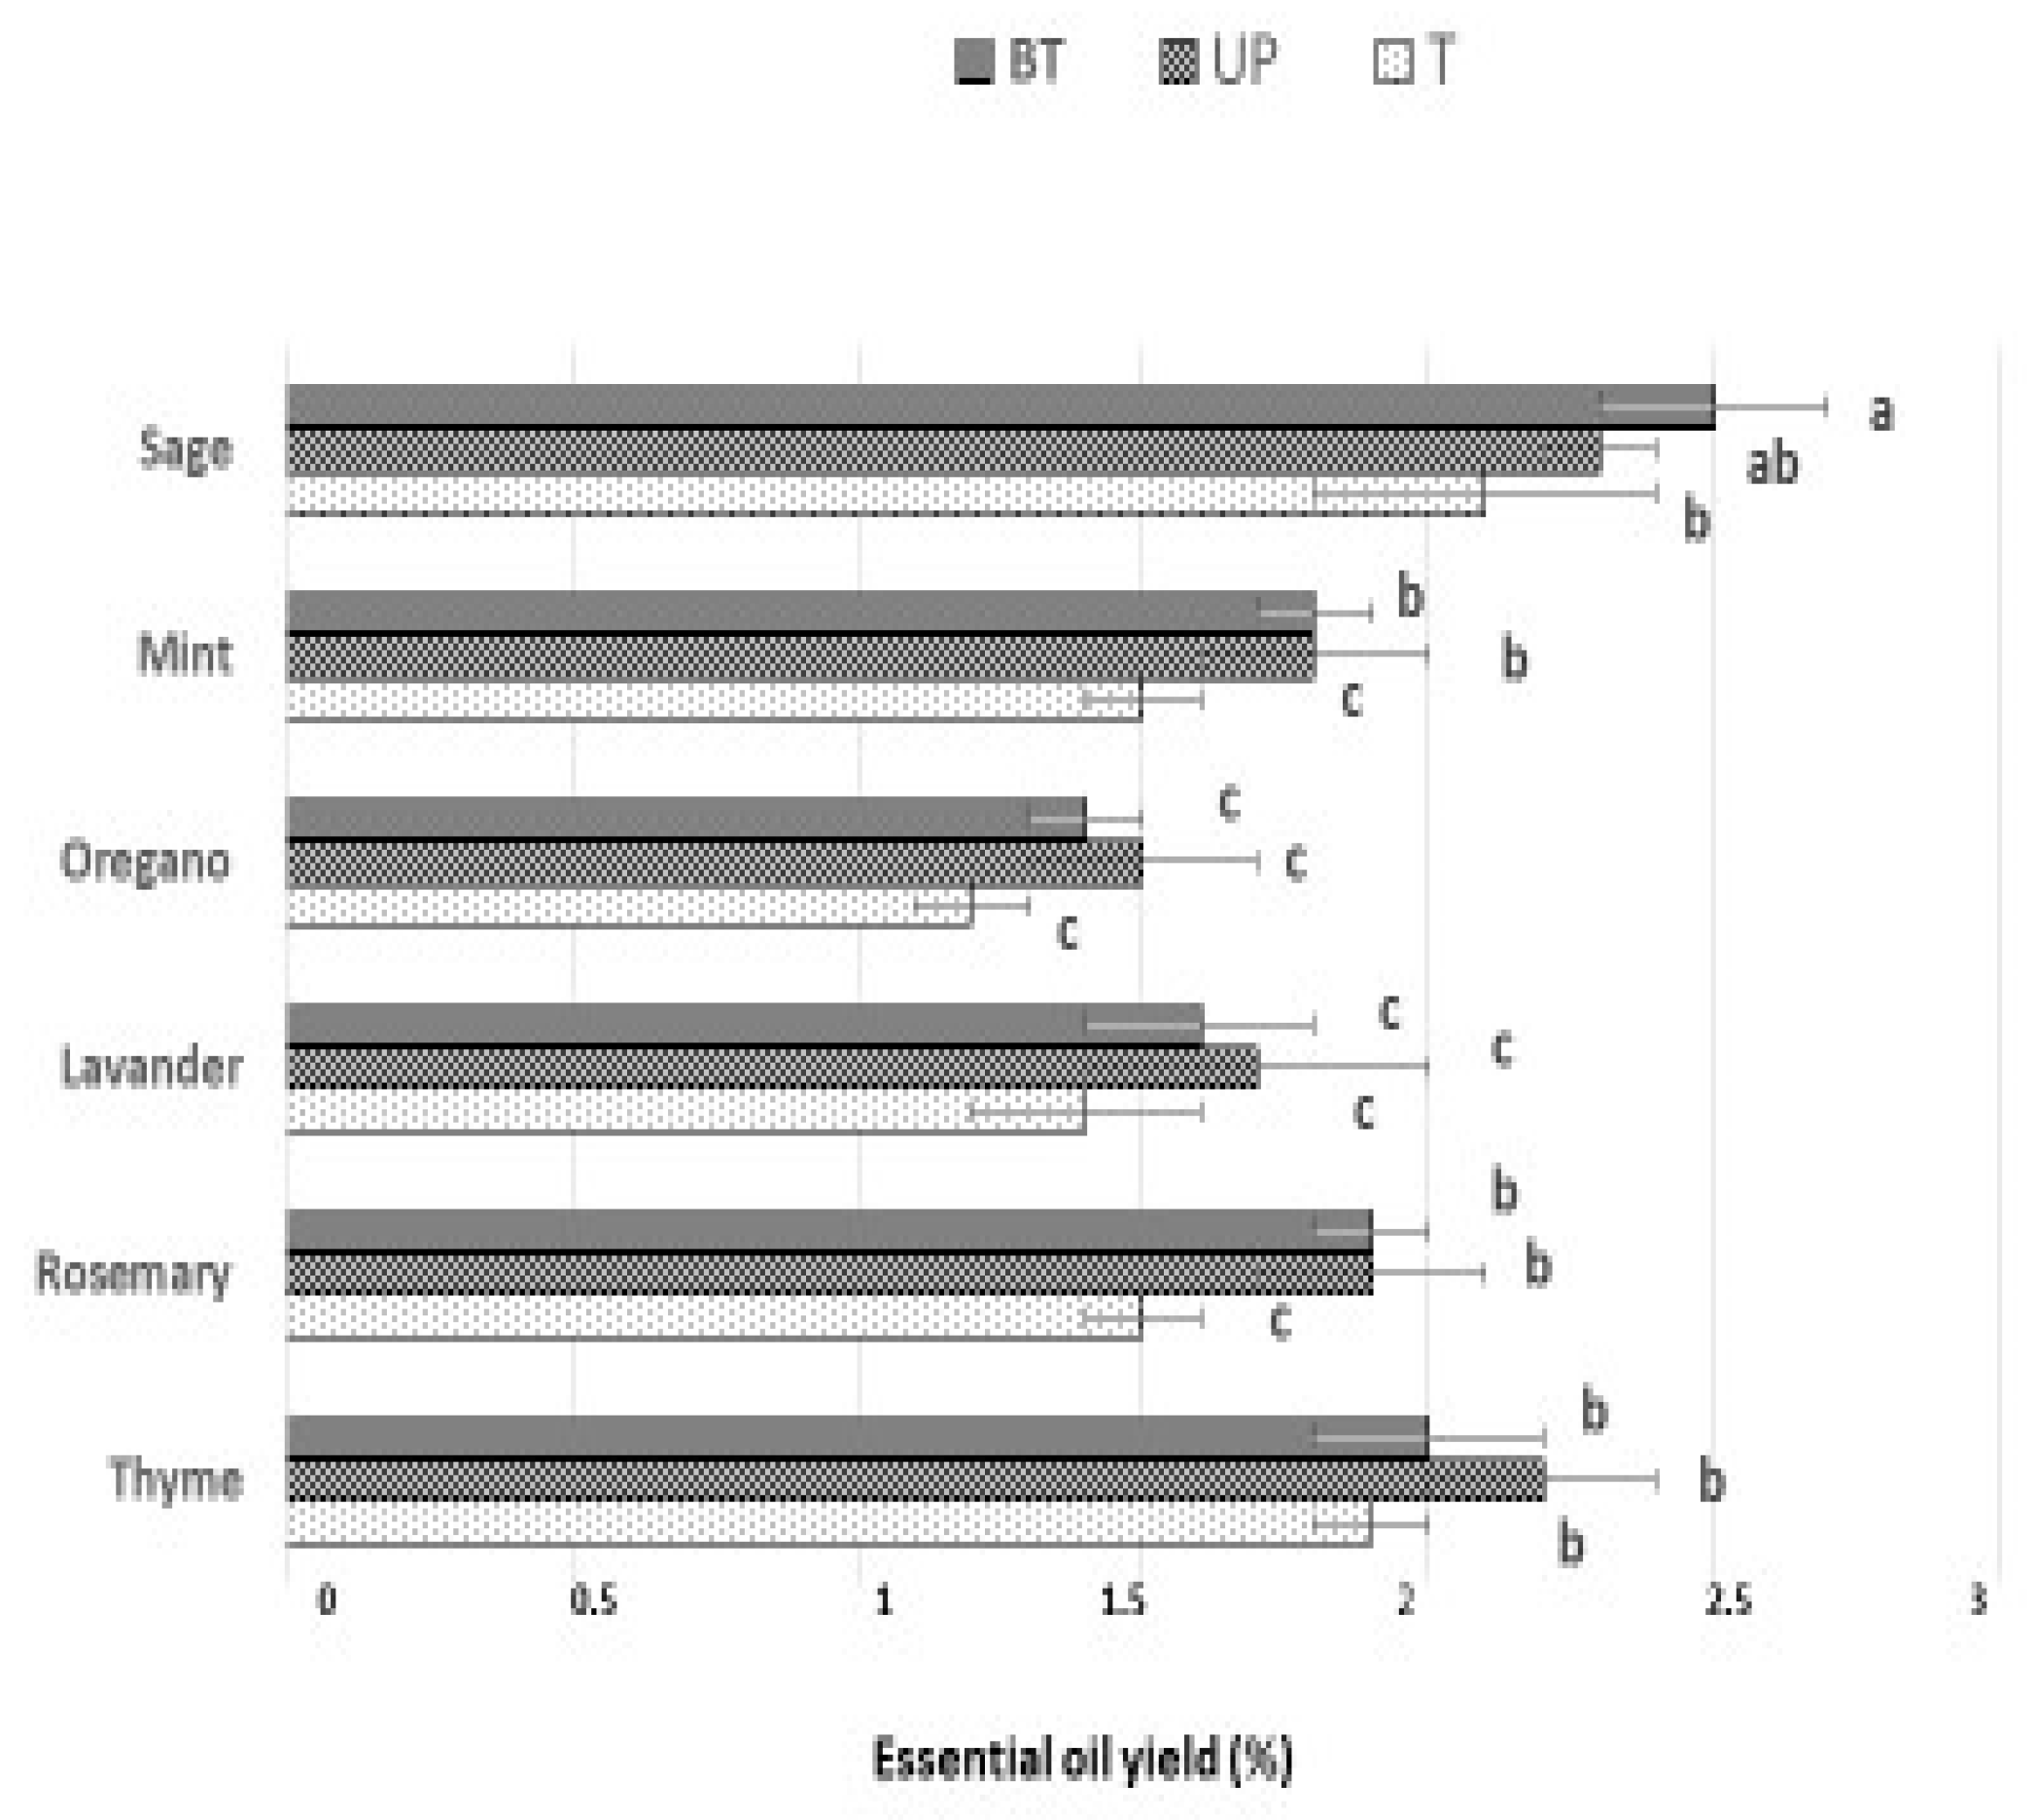
3.5. Essential Oil (EO) Yield Content

In terms of the yield of essential oils (EOs) (refer to Figure 8), notable differences were evident among the compared medicinal crops. Oregano and lavender displayed comparatively lower average values (ranging from 1.2 to 1.7%) in contrast to the remaining crops (ranging from 1.5 to 2.5%).
Both the UP and BP plots, for sage, mint, lavender, and rosemary, exhibited significantly higher average EO values (ranging between 1.8 and 2.5%) compared to the T plot (ranging between 1.2 and 2.1%). While the remaining compared crops (oregano and thyme) did not show significant differences among the plots, they generally demonstrated higher values (ranging from 1.4 to 2.3%) in the UP and BP plots than in the T plot (ranging between 1.2 and 1.8%).
Additionally, a lower EO content was observed in the T plot, where air temperatures were relatively higher (ranging from 31.0 to 38.8 °C) compared to the BP (ranging from 30.7 to 38.4 °C) and UP plots (ranging from 29.8 to 37.5 °C).

4. Discussion

The lower maximum solar radiation values recorded in the UP and BP plots can be beneficial, particularly in semi-arid regions like the studied locality, where crop cultivation often suffers from the adverse effects of high solar radiation and subsequent water losses, as highlighted in other research studies [14,15,21,40]. Moreover, our findings on the reduction in air temperature under the panels align with other studies on legumes and grasses [41,42,43] that observed decreased maximum air temperatures in shaded compared to full-sun conditions. The infrared leaf temperature (Tc) was also lower under the panels than in the open, though with relatively smaller differences than the air temperature (Ta). The temperature difference (∆T) between canopy temperature and the surrounding air temperature serves as an indicator of water stress, a crucial factor to analyze in agrivoltaic conditions, especially for the long-term impact regarding the effect on pluriannual plant transpiration [44].
In particular, the difference between Ta and Tc, significantly associated with vapor pressure deficit (VPD) [45], is utilized to compute the crop water stress index (CWSI), which measures the relative transpiration rate occurring at the time of measurement for a plant [46]. Considering that in this study the medicinal plants under the panels displayed lower ∆T compared to plants in full sun, this may indicate lower CWSI values and, therefore, a reduced relative transpiration rate compared to plants in full sun.
The slower growth of weeds under the solar panels, typical species of the spring–summer period, may be attributed to the effect of the reduced brightness and lower air temperature observed in those conditions.
The better outcomes achieved by crops in the UP and BP plots could be due to the shading effect of the solar panels, and/or the lower air temperature, or the decreased presence of weeds in these plots compared to T, which might have had a negative impact on crops. Similar findings have been supported by various earlier studies [47,48,49], demonstrating that medicinal plant species under shading nets exhibited higher growth and had increased essential oil content. Furthermore, the increased proliferation of weeds in the T plot might have led to a qualitative and quantitative reduction in the yield of several medicinal crops, as reported in prior research [50,51]. Conversely, the lower essential oil content observed in the T plot may be due to the loss of volatile compounds from the aerial parts of plants, as noted in a research study [35] conducted for sage and rosemary.

5. Conclusions

Agrivoltaics is a system that harmonizes energy production with plant cultivation and food yield. It represents a novel approach likely to advance in the forthcoming years.
While many studies have investigated its impact on crop production, various aspects, particularly those pertaining to product quality, remain unexplored.
This initial year of experimentation on the cultivation of six aromatic species (sage, thyme, rosemary, lavender, and mint) beneath a dynamic agrivoltaic system (AV), in comparison to cultivation in full sun, has yielded intriguing results. In hot climates, such as the one in this study, the shading provided by this system appears to be a beneficial solution, preventing excessive temperatures that result in high evapotranspiration rates in the crops [46]. This study indicates that reduced solar radiation is the primary factor affected in plots under AV systems. Higher air temperatures were observed in the unshaded areas compared to the shaded plots where plants exhibited greater height and width growth. Various factors, such as shading, lower air temperatures, and decreased weed presence under the AV, either individually or collectively, in comparison to the external area, led to an increase in the essential oil yield of medicinal herb species like sage, mint, lavender, and rosemary. These findings on the favorable impact of the AV system on product quality require further confirmation.
However, to the best of the authors’ knowledge, there is no existing body of literature on the influence of shading on the chemical composition of essential oils present in medicinal plants, including bioactive substances (polyphenols, terpenoids, flavonoids, etc.). These substances are extensively used in pharmaceuticals, cosmetics, and the food industry, thus warranting exploration.
Hence, given that all the aromatic plants studied here are perennial, ongoing qualitative and quantitative analyses of their production beneath a dynamic AV system versus full sun will continue in the future. Additionally, future research should include the variations in microclimatic parameters throughout the day and economic analysis of the cost–benefit relationship of the AV system.

Author Contributions

Conceptualization, G.D., L.F. and A.S.; methodology, G.D., L.F., A.T. and A.S.; software, G.D., L.F., A.T. and A.S.; validation, G.D., L.F. and A.S.; formal analysis, G.D., L.F., A.T. and A.S.; investigation, G.D., L.F. and A.S.; resources, G.D., L.F. and A.S.; data curation, G.D., L.F. and A.S.; writing—original draft preparation, G.D., L.F. and A.S.; writing—review and editing, G.D., L.F. and A.S.; visualization, G.D., L.F. and A.S.; supervision, G.D. and A.S. All authors have read and agreed to the published version of the manuscript.

Funding

Research contract between the company M2 Energia Srl and the Department of Agricultural, Food and Environmental Sciences of the University of Foggia. Project “M2 for the research and experimentation in agriculture”.

Institutional Review Board Statement

Not applicable.

Informed Consent Statement

Not applicable.

Data Availability Statement

Data are contained within the article.

Conflicts of Interest

The authors declare that there are no conflict of interest regarding the publication of this article.

References

  1. United Nations—Climate Action. Causes and Effects of Climate Change 2020. Available online: https://www.un.org/en/climatechange/science/causes-effects-climate-change (accessed on 7 November 2023).
  2. Nonhebel, S. Renewable energy and food supply: Will there be enough land? Renew. Sustain. Energy Rev. 2005, 9, 191–201. [Google Scholar] [CrossRef]
  3. Agostini, A.; Colauzzi, M.; Amaducci, S. Innovative agrivoltaic systems to produce sustainable energy: An economic and environmental assessment. Appl. Energy 2021, 281, 116102. [Google Scholar] [CrossRef]
  4. Goetzberger, A.; Zastrow, A. On the coexistence of solar-energy conversion and plant cultivation. Int. J. Sol. Energy 1982, 1, 55–69. [Google Scholar] [CrossRef]
  5. Weselek, A.; Ehmann, A.; Zikeli, S.; Lewandowski, I.; Schindele, S.; Högy, P. Agrophotovoltaic systems: Applications, challenges, and opportunities. A review. Agron. Sustain. Dev. 2019, 39, 35. [Google Scholar] [CrossRef]
  6. Valle, B.; Simonneau, T.; Sourd, F.; Pechier, P.; Hamard, P.; Frisson, T.; Ryckewaert, M.; Christophe, A. Increasing the total productivity of a land by combining mobile photovoltaic panels and food crops. Appl. Energy 2017, 206, 1495–1507. [Google Scholar] [CrossRef]
  7. Campana, P.E.; Stridh, B.; Amaducci, S.; Colauzzi, M. Optimisation of Vertically Mounted Agrivoltaic Systems. J. Clean. Prod. 2021, 325, 129091. [Google Scholar] [CrossRef]
  8. Toledo, C.; Scognamiglio, A. Agrivoltaic Systems Design and Assessment: A Critical Review, and a Descriptive Model towards a Sustainable Landscape Vision (Three-Dimensional Agrivoltaic Patterns). Sustainability 2021, 13, 6871. [Google Scholar] [CrossRef]
  9. Mouhib, E.; Micheli, L.; Almonacid, F.M.; Fernández, E.F. Overview of the Fundamentals and Applications of Bifacial Photovoltaic Technology: Agrivoltaics and Aquavoltaics. Energies 2022, 15, 8777. [Google Scholar] [CrossRef]
  10. Elamri, Y.; Cheviron, B.; Lopez, J.M.; Dejean, C.; Belaud, G. Water Budget and Crop Modelling for Agrivoltaic Systems: Application to Irrigated Lettuces. Agric. Water Manag. 2018, 208, 440–453. [Google Scholar] [CrossRef]
  11. Lee, H.J.; Park, H.H.; Kim, Y.O.; Kuk, Y.I. Crop Cultivation Underneath Agro-Photovoltaic Systems and Its Effects on Crop Growth, Yield, and Photosynthetic Efficiency. Agronomy 2022, 12, 1842. [Google Scholar] [CrossRef]
  12. Marrou, H.; Dufour, L.; Wery, J. How does a shelter of solar panels influence water flows in a soil–crop system? Eur. J. Agron. 2013, 50, 38–51. [Google Scholar] [CrossRef]
  13. Marrou, H.; Guilioni, L.; Dufour, L.; Dupraz, C.; Wery, J. Microclimate under agrivoltaic systems: Is crop growth rate affected in the partial shade of solar panels? Agric. Meteorol. 2013, 177, 117–132. [Google Scholar] [CrossRef]
  14. Ravi, S.; Macknick, J.; Lobell, D.; Field, C.; Ganesan, K.; Jain, R.; Elchinger, M.; Stoltenberg, B. Colocation opportunities for large solar infrastructures and agriculture in drylands. Appl. Energy 2016, 165, 383–392. [Google Scholar] [CrossRef]
  15. Amaducci, S.; Yin, X.; Colauzzi, M. Agrivoltaic systems to optimise land use for electric energy production. Appl. Energy 2018, 220, 545–561. [Google Scholar] [CrossRef]
  16. Vervloesem, J.; Marcheggiani, E.; Choudhury, M.A.M.; Muys, B. Effects of Photovoltaic Solar Farms on Microclimate and Vegetation Diversity. Sustainability 2022, 14, 7493. [Google Scholar] [CrossRef]
  17. Chalgynbayeva, A.; Gabnai, Z.; Lengyel, P.; Pestisha, A.; Bai, A. Worldwide Research Trends in Agrivoltaic Systems—A Bibliometric Review. Energies 2023, 16, 611. [Google Scholar] [CrossRef]
  18. Midmore, D.J.; Berrios, D.; Roca, J. Potato, (Solanum spp.) in the hot tropics V. intercropping with maize and the influence of shade on tuber yields. Field Crop Res. 1988, 18, 159–176. [Google Scholar] [CrossRef]
  19. Kuruppuarachchi, D.S.P. Intercropped potato (Solanum spp.): Effect of shade on growth and tuber yield in the northwestern regosol belt of Sri Lanka. Field Crop Res. 1990, 25, 61–72. [Google Scholar] [CrossRef]
  20. Ferrante, A.; Marian, L. Agronomic management for enhancing plant tolerance to abiotic stresses: High and low values of temperature, light intensity, and relative humidity. Horticulturae 2018, 4, 21. [Google Scholar] [CrossRef]
  21. Marrou, H.; Wery, J.; Dufour, L.; Dupraz, C. Productivity and radiation use efficiency of lettuces grown in the partial shade of photovoltaic panels. Eur. J. Agron. 2013, 44, 54–66. [Google Scholar] [CrossRef]
  22. Cossu, M.; Yano, A.; Solinas, S.; Deligios, P.A.; Tiloca, M.T.; Cossu, A.; Ledda, L. Agricultural Sustainability Estimation of the European Photovoltaic Greenhouses. Eur. J. Agron. 2020, 118, 126074. [Google Scholar] [CrossRef]
  23. Sekiyama, T.; Nagashima, A. Solar sharing for both food and clean energy production: Performance of agrivoltaic systems for corn, a typical shade-intolerant crop. Environments 2019, 6, 65. [Google Scholar] [CrossRef]
  24. Chae, S.H.; Kim, H.J.; Moon, H.W.; Kim, Y.H.; Ku, K.-M. Agrivoltaic Systems Enhance Farmers’ Profits through Broccoli Visual Quality and Electricity Production without Dramatic Changes in Yield, Antioxidant Capacity, and Glucosinolates. Agronomy 2022, 12, 1415. [Google Scholar] [CrossRef]
  25. Schindelea, S.; Trommsdorff, M.; Schlaaka, A.; Obergfell, T.; Bopp, G.; Reise, C.; Braun, C.; Weselek, A.; Bauerle, A.; Högy, P. Implementation of agrophotovoltaics: Techno-economic analysis of the price-performance ratio and its policy implications. Appl. Energy 2020, 265, 114737. [Google Scholar] [CrossRef]
  26. Weselek, A.; Bauerle, A.; Zikeli, S.; Lewandowski, I.; Högy, P. Effects on crop development, yields and chemical composition of celeriac (Apium Graveolens L. Var. Rapaceum) Cultivated Underneath an Agrivoltaic System. Agronomy 2021, 11, 733. [Google Scholar] [CrossRef]
  27. Giardini, L. Agronomia Generale, Ambientale e Aziendale; Pàtron Editore: Bologne, Italy, 1992; p. 600. [Google Scholar]
  28. Uritu, C.M.; Mihai, C.T.; Stanciu, G.D.; Dodi, G.; Stratulat, T.A.; Luca, A.; Leon-Constantin, M.C.; Stefanescu, R.; VBild, V.; Melnic, S.; et al. Medicinal Plants of the Family Lamiaceae in Pain Therapy: A Review. Pain Res. Manag. 2018, 44, 7801543. [Google Scholar] [CrossRef] [PubMed]
  29. Sofowora, A.; Ogunbodede, E.; Onayade, A. The Role and Place of Medicinal Plants in the Strategies for Disease Prevention. Afr J. Tradit. Complement. Altern. Med. 2013, 10, 210–229. [Google Scholar] [CrossRef] [PubMed]
  30. Manuelli, M.T. Cresce il Consumo di Erbe Aromatiche e il Settore Rilancia con l’Osservatorio e Nuovi Investimenti. IlSole24Ore. August 3 2020. Available online: https://www.ilsole24ore.com/art/cresce-consumo-erbe-aromatiche-e-settore-rilancia-l-osservatorio-e-nuovi-investimenti-ADe6hjg (accessed on 7 November 2023).
  31. Spina, D.; Barbieri, C.; Carbone, R.; Hamam, M.; D’Amico, M.; Di Vita, G. Market Trends of Medicinal and Aromatic Plants in Italy: Future Scenarios Based on the Delphi Method. Agronomy 2023, 13, 1703. [Google Scholar] [CrossRef]
  32. Commission Staff Working Document 2023. Country Report—Italy. Brussels, 24.5.2023 SWD 2023. Available online: https://commission.europa.eu/system/files/2023-05 (accessed on 7 November 2023).
  33. Stefanaki, A.; van Andel, T. Mediterranean aromatic herbs and their culinary use. In Aromatic Herbs in Food Bioactive Compounds, Processing and Applications; Elsevier: Amsterdam, The Netherlands, 2021; pp. 93–121. [Google Scholar] [CrossRef]
  34. The European Market Potential for Fresh Herbs 2020. Available online: https://www.cbi.eu/market-information/fresh-fruit-vegetables/fresh-herbs/market-potential_ (accessed on 7 November 2023).
  35. Baydar, H.; Ozkan, G.; Erbas, S.; Altindal, D. Yield, chemical composition and antioxidant properties of extracts and essential oils of sage and rosemary depending on seasonal variations. Acta Hortic. 2009, 826, 383–389. [Google Scholar] [CrossRef]
  36. UNESCO/FAO. Bioclimatic Map of the Mediterranean Zone. In Explanatory Notes, Arid Zone Research; UNESCO/FAO: Rome, Italy, 1963; p. 2217. [Google Scholar]
  37. Ventrella, D.; Charfeddine, M.; Moriondo, M.; Rinaldi, M.; Bindi, M. Agronomic adaptation strategies under climate change for winter durum wheat and tomato in southern Italy: Irrigation and nitrogen fertilization. Reg. Environ. Chang. 2012, 12, 407–412. [Google Scholar] [CrossRef]
  38. USDA. Textural soil classification. In Study Guide Revised; United States Department of Agriculture, Soil Conservation Service: Washington, DC, USA, 1987; p. 48. [Google Scholar]
  39. Frabboni, L.; Tarantino, A.; Petruzzi, F.; Disciglio, G. Bio-herbicidal effects of Oregano and Rosemary essential oils on Chamomile (Matricaria chamomilla L.) crop in organic farming system. Agronomy 2019, 9, 475. [Google Scholar] [CrossRef]
  40. Dupraz, C.; Talbot, G.; Marrou, H.; Wery, J.; Roux, S.; Fabien, L.; Ferard, Y.; Nogier, A. To mix or not to mix: Evidences for the unexpected high productivity of new complex agrivoltaic and agroforestry systems. In Proceedings of the 5th World Congress of Conservation Agriculture Incorporating 3rd Farming Sistem Design Conference, Brisbane, Australia, 26–29 September 2011. [Google Scholar]
  41. Pang, K.; van Sambeek, J.W.; Navarrete-Tindall, N.E.; Lin, C.-H.; Jose, S.; Garrett, H.E. Responses of legumes and grasses to non-, moderate, and dense shade in Missouri, USA. I. Forage yield and its species-level plasticity. Agrofor. Syst. 2017, 88, 287. [Google Scholar] [CrossRef]
  42. Armstrong, A.; Ostle, N.J.; Whitaker, J. Solar Park microclimate and vegetation management effects on grassland carbon cycling. Environ. Res. Lett. 2016, 11, 074016. [Google Scholar] [CrossRef]
  43. Yue, S.; Guo, M.; Zou, P.; Wu, W.; Zhou, X. Effects of photovoltaic panels on soil temperature and moisture in desert areas. Environ. Sci. Pollut. Res. 2021, 28, 17506–17518. [Google Scholar] [CrossRef] [PubMed]
  44. Othman, N.F.; Yaacob, M.E.; Mat Su, A.S.; Jaafar, J.N.; Hizam, H.; Shahidan, M.F.; Jamaluddin, A.H.; Chen, G.; Jalaludin, A. Modeling of stochastic temperature and heat stress directly underneath agrivoltaic conditions with Orthosiphon Stamineus Crop Cultivation. Agronomy 2020, 10, 1472. [Google Scholar] [CrossRef]
  45. Jackson, R.D.; Idso, S.B.; Reginato, R.J.; Printer, P.J. Canopy temperature as a crop water stress indicator. Water Res. 1981, 17, 1133–1138. [Google Scholar] [CrossRef]
  46. Romero-Trigueros, C.; Bayona Gambín, J.M.; Nortes Tortosa, P.A.; Alarcón Cabañero, J.J.; Nicolàs, E.N. Determination of crop water stress index by infrared thermometry in grapefruit trees irrigated with saline reclaimed water combined with deficit irrigation. Remote Sens. 2019, 11, 757. [Google Scholar] [CrossRef]
  47. Milenković, L.; Ilić, Z.L.; Šunić, L.; Tmušić, N.; Stanojević, L.J.; Cvetković, D. Modification of light intensity influence essential oils content, composition and antioxidant activity of thyme, marjoram and oregano. Saudi J. Biol. Sci. 2021, 28, 6532–6543. [Google Scholar] [CrossRef]
  48. Rathore, S.; Mukhia, S.; Kapoor, S.; Bhatt, V.; Kumar, R.; Kumar, R. Seasonal variability in essential oil composition and biological activity of Rosmarinus officinalis L. accessions in the western Himalaya. Sci. Rep. 2022, 12, 3305. [Google Scholar] [CrossRef]
  49. Lalević, D.; Ilić, Z.S.; Stanojević, L.L.; Kovač, R.; Milenković, A. Shade-Induced Effects on Essential Oil Yield, Chemical Profiling, and Biological Activity in Some Lamiaceae Plants Cultivated in Serbia. Horticulturae 2023, 9, 84. [Google Scholar] [CrossRef]
  50. Hendawy, S.F.; Abouziena, H.F.; Abd El-Razik, T.M.; Amer, H.M.; Hussein, M.S. Winter weeds and its control in the medicinal plants in Egypt: A survey study. Egypt Pharm. J. 2019, 18, 16–26. [Google Scholar]
  51. Vouzounis, N.A.; Dararas, V.E.; Georghiou, G. Chemical Control of Weeds in the Aromatic Crops Lavender, Oregano and Sage; Technical Bulletin 218; Agricultural Research Institute. Ministry of Agriculture, Natural Resources and the Environment: 2003. Available online: https://scholar.googleusercontent.com/scholar?q=cache:SKDg1XLnAPsJ:scholar.google.com/&hl=it&as_sdt=0,5 (accessed on 7 November 2023).
Figure 1. Research process diagram employed in this study.
Sustainability 15 16252 g001
Figure 2. Scheme of the agrivoltaic system.
Sustainability 15 16252 g002
Figure 3. Dynamic agrivoltaic system in San Severo (FG).
Sustainability 15 16252 g003
Figure 4. Average solar radiation for under panel (UP), between panel (BP), and open field (T) plots at different dates during the crop cycle. Means with different letters in each date are significantly different according to Tukey’s test (p = 0.05).
Sustainability 15 16252 g004
Figure 5. Average infrared foliar temperature measured in under panel (UP), between panel (BP), and open field (T) plots at different dates during the crop cycle. Means ± SD with different letters in each date are significantly different according to Tukey’s test (p = 0.05).
Sustainability 15 16252 g005
Figure 6. Weed ground cover (WGC) measured in under panel (UP), between panel (BP), and open field (T) plots, detected on 19 July. Means ± SD with different letters are significantly different according to Tukey’s test (p = 0.05).
Sustainability 15 16252 g006
Figure 7. Dry matter content (%) in the compared aromatic crops from under panel (UP), between panel (BP), and open field (T) plots. Means ± SD with different letters are significantly different according to Tukey’s test (p = 0.05).
Sustainability 15 16252 g007
Figure 8. Essential oil yield (%) of the compared aromatic crops from under panel (UP), between panel (BP) and open field (T) plots. Means ± SD with different letters are significantly different according to Tukey’s test (p = 0.05).
Sustainability 15 16252 g008
Table 1. Average air temperature measured in the hottest hours of the day in under panel (UP), between panel (BP), and open field (T) plots at different dates during the crop cycle.
DateBetween PanelUnder PanelOpen Field
BPUPT
1 June31.4 ± 0.2 a29.9± 0.2 b31.7 ± 0.2 a
7 June34.3 ± 0.3 a33.2 ± 0.2 b34.6 ± 0.3 a
14 June32.1 ± 0.3 a30.9 ± 0.3 b32.5 ± 0.2 a
21 June35.4 ± 0.2 a34.0 ±0.2 b35.6 ± 0.3 a
28 June36.9 ± 0.1 a36.5 ± 0.2 b37.3 ± 0.3 a
12 July31.4 ± 0.1 a30.1± 0.1 b31.6 ± 0.2 a
19 July30.7 ± 0.3 a29.8 ± 0.3 b31.0 ± 0.3 a
27 July38.4 ± 0.2 a37.5 ± 0.3 b38.8 ± 0.3 a
26 August 30.7 ± 0.2 a29.8 ± 0.1 b31.0 ± 0.2 a
Mean33.5 ± 0.2 A32.4 ± 0.2 B33.8 ± 0.3 A
Means ± SD with different lowercase letters between plots in each date and capital letters for the means are significantly different according to Tukey’s test (p = 0.05).
Table 2. Seasonal growth of Salvia officinalis L. in under panel (UP), between panel (BP), and open field (T) plots.
Plant GrowthBPUPT
Height9.7±1.0a10.3±1.3a7.0±1.5b
Width (E-W)11.1±1.3a12.3±1.3a7.8±1.1b
Average values ± SD with different letters between plots indicate significant differences according to Tukey’s test (p < 0.05).
Disclaimer/Publisher’s Note: The statements, opinions and data contained in all publications are solely those of the individual author(s) and contributor(s) and not of MDPI and/or the editor(s). MDPI and/or the editor(s) disclaim responsibility for any injury to people or property resulting from any ideas, methods, instructions or products referred to in the content.

