Abstract
As the global clean energy transition accelerates, China’s mining industry faces pressing challenges concerning the sustainable consumption of clean energy minerals. This study employed the EE-MRIO model to investigate the consumption trends of clean energy minerals across various provinces and industries in China from 2012 to 2017, specifically focusing on the resource footprints of copper, nickel, molybdenum, zinc, and cobalt. Using the random forest model, we identified the driving factors, with the goal of offering a solid scientific foundation for strategic decision making. Our findings reveal marked disparities in resource footprints among provinces, which are correlated with regional industrialization, urbanization trends, and resource reserves. Beyond the traditional resource-intensive sectors, industries like finance and real estate have significantly impacted the resource footprint. Monte Carlo simulations further validated the reliability of our model. The random forest analysis indicates that population size and energy consumption mainly determine the footprints of copper and zinc. In contrast, the footprints of nickel and cobalt are primarily influenced by technology market turnover, while molybdenum’s footprint is largely driven by population size and total carbon emissions. Drawing from these insights, we suggest several policy recommendations for clean energy mineral extraction. These include fostering inter-provincial resource collaboration, bolstering geological exploration and assessment, promoting technological innovation, advancing environmentally friendly mineral extraction techniques, and enhancing collaboration between urban planning and pivotal industries.
1. Introduction
The world is undergoing a profound transformation towards sustainable energy solutions, with clean energy minerals such as lithium, cobalt, and nickel consequently becoming the focus of international attention [1]. These key minerals play an indispensable role in a series of innovative technologies, ranging from solar photovoltaic panels and wind turbines to electric vehicles, serving as the cornerstone for the global shift from fossil fuel dependence to cleaner, greener energy solutions [2,3]. The World Bank’s 2018 report projects that, by 2050, with changes in the global energy landscape, mineral production could increase by up to 500% [4]. This prediction aligns with the views in the International Energy Agency’s 2022 World Energy Outlook, which envisions a future market dominated by renewable energies to meet the world’s growing energy demands [5]. These indicators clearly show that the global energy transformation is accelerating, and simultaneously, the demand for clean energy minerals is expected to surge.
In the face of the global clean energy transition, China has established an unshakable position in the world clean energy mineral market, thanks to its abundant resource reserves and leading processing technologies. China not only handles 68% of the world’s nickel, 40% of copper, 59% of lithium, and 73% of cobalt but also possesses 78% of the global electric vehicle battery production capacity [6]. However, this dominant position comes at a cost. Large-scale operations from mining to refining have profound impacts on the environment at every stage [7,8]. Recognizing this, the Communist Party of China proposed an ambitious blueprint for sustainable development at its 20th National Congress, emphasizing the need for harmony between economic growth and ecological well-being [9].
With the deepening of the global transition to clean energy and under the guidance of national macro policies, China’s mining industry is facing the pressing challenge of sustainable consumption of clean energy minerals. The key question is: in the consumption of clean energy minerals, which regions and sectors impose a particularly significant burden on the environment? Moreover, what are the driving factors behind this consumption behavior? In order to address these questions accurately and provide substantial policy recommendations for decisionmakers, in-depth and precise analyses are crucial.
To address the challenges of sustainable consumption of clean energy minerals, this study proposes an innovative analytical framework that combines the high-precision calculations of the environmentally extended multi-regional input–output (EE-MRIO) model with the in-depth analytical capabilities of random forest regression. We employ the EE-MRIO model to calculate the resource footprint, accurately quantifying the total consumption of clean energy minerals and their environmental pressure. At the same time, we introduce a non-parametric Monte Carlo analysis, offering an innovative perspective on the research methods for the consumption of clean energy minerals. This approach enables us to finely discern the differences in resource footprint growth patterns across regions and sectors in China, providing stakeholders with in-depth strategic insights. Furthermore, by integrating Bayesian optimization with five-fold cross-validation of random forest regression, this study successfully uncovers the core socio-economic and technological factors influencing the footprint of various mineral resources. This not only deepens the understanding of the environmental impacts of clean energy minerals but also presents cutting-edge policy recommendations regarding China’s specific challenges and opportunities in this domain.
2. Literature Review
With the ongoing global push for energy transition, clean energy sources such as solar and wind power, emblematic of renewable energies, are increasingly becoming pivotal alternatives to traditional fossil fuels. In this transition, the significance of critical mineral resources [10,11] required for clean energy, including lithium, cobalt, and rare earth elements, has been growing steadily, emerging as a focal point for academics and policymakers alike. While current research has delved deeply into topics like mineral import demands related to sustainable energy [12], risks within the supply chain [13,14], and the potential impact of governmental policies on future mineral resource demands [15], there remains a relative paucity of studies on the sustainable consumption of clean energy minerals. In light of this, this paper aims to offer preliminary yet crucial insights into this domain.
To ensure the realization of sustainable consumption, it is paramount to precisely identify the environmental impacts of clean energy minerals. Among various identification methods, life cycle assessment (LCA), economy-wide material flow accounts (EW-MFA) [16], and footprint analysis based on input–output (IO) models are considered primary quantification tools. LCA offers a comprehensive environmental stress analysis across all production stages of a product [17]. EW-MFA, in contrast, is more concerned with the total material consumption of the socioeconomic system under specified spatiotemporal conditions [18,19]. Distinct from LCA and EW-MFA, the uniqueness of footprint analysis lies in its ability to capture comprehensively the environmental impacts of human activities and translate them into intuitive indicators [20]. The initial concept of “ecological footprint” has further evolved [21,22], giving rise to several subdomains such as energy footprint [23], water footprint [24], carbon footprint [25,26], and material footprint [27]. This method has proven its efficacy in calculating overall material resource consumption [28], identifying the characteristics of material flows [29], and analyzing trade shifts [30]. Notably, the research by Wiedmann et al. [31] showcased a multi-regional input–output analysis of the global material footprint, garnering extensive attention. The “resource footprint” [32] further extends this concept, specifically pointing to the consumption of mineral resources included in the material footprint calculation.
In this study, the resource footprint is adopted as the core method because it allows us to delve deeply into the footprint differences between nations, regions, and sectors [33]. To precisely analyze the impact mechanisms and driving factors of resource sector industrial structures, researchers often combine the EE-MRIO method to trace material consumption or value flow [34]. While such in-depth analysis requires higher-resolution input–output tables, this issue has been properly addressed by nesting or expanding various input–output table structures. Taking the work of Jiang et al. [35] as an example, they successfully integrated China’s regional input–output tables with EXIOBASE3, analyzing the mobility of various resource material footprints in China. The greatest advantage of this analytical approach is its integration of domestic and international market data, offering a more insightful perspective on resource supply and consumption. Therefore, inspired by this methodology, our study calculates the resource footprint of clean energy minerals and further employs the non-parametric Monte Carlo method to assess the uncertainty of the footprint.
In addition to the precise identification of the environmental impacts of clean energy minerals, it is equally crucial to deeply explore the driving factors behind their consumption behavior for sustainable consumption [36]. Traditional statistical and econometric methods have achieved numerous results in the study of causal relationships among mineral consumption, CO2 emissions [37], and economic growth [38], but still face challenges when dealing with high-dimensional, non-linear, and complex data. Compared to traditional methods, machine learning methods in recent years [39], such as support vector machines, artificial neural networks, and random forest regression [40], have shown greater potential. These methods, which do not need to meet specific assumptions, can enhance model performance through repeated iteration and optimization, and are therefore gaining increasing favor among resource and environmental researchers [41].
Among them, random forest, as an ensemble learning method based on decision trees, has outstanding performance in handling complex data, prediction accuracy, and assessing variable importance. It relies on numerous decision trees and enhances prediction accuracy through majority voting or mean predictions, effectively reducing the risk of overfitting [42]. Simultaneously, its variable importance assessment feature offers a powerful tool for deeply exploring and understanding driving factors. Although random forest has been widely applied in environmental science [43], energy system optimization [44], and other fields, its potential in clean energy mineral consumption research still awaits further exploration [45]. Based on this, our study chose to use random forest to explore the driving factors behind the consumption of clean energy minerals, aiming to further reveal its application value in this field.
In summary, while research on clean energy minerals has been increasingly enriched, discussions on their sustainable consumption remain relatively sparse. This study hopes to provide some preliminary but crucial insights in this domain. Using the resource footprint, EE-MRIO methods, and non-parametric Monte Carlo methods, we gain deeper insight, revealing the differences in resource footprints between countries, regions, and sectors. Furthermore, through our use of the random forest method, we explored the deep-seated driving mechanisms of clean energy mineral consumption from a new dimension. We anticipate that this research approach will not only enrich academic discussions on clean energy minerals and environmental stress but also offer valuable references for decisionmakers in formulating relevant strategies.
3. Methodology
A resource footprint is an environmental impact assessment tool that measures the overall consumption of natural resources by human activities. This quantitative approach helps us to understand the extent to which various industries or activities depend on the use of clean energy minerals, and thus to effectively manage and allocate limited resources [46]. As illustrated in Figure 1, our innovative analytical framework commences with the computation of the resource footprint. Within this framework, the EE-MRIO model integrates the CEADs database and EXIOBASE3 database, yielding a more detailed input–output table. This process encompasses both domestic extraction and the estimation of raw mining capacity. Built upon this, we employ a non-parametric Monte Carlo analysis for uncertainty assessment. Concurrently, we utilize random forest regression to evaluate the importance of various socioeconomic and technological features, unveiling the influence of factors like GDP, carbon emissions, technology market turnover, total population, energy consumption, and high-tech sales revenue on the resource footprint.
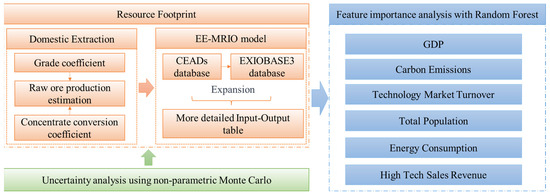
Figure 1.
Research framework.
The minerals selected for this study are predicated on the 11 critical minerals highlighted in The Role of Critical Minerals in Clean Energy Transitions [47]. These minerals encompass copper, lithium, nickel, manganese, cobalt, graphite, chromium, molybdenum, zinc, rare earths, and silicon. However, due to the constraints of data accessibility, our in-depth analysis primarily focused on five of these minerals: copper, nickel, cobalt, molybdenum, and zinc. To provide a more accurate measure of clean energy mineral consumption, we employed exit grades and concentrate grades to approximate the volume of raw ore extracted. Using this data, we calculated the resource footprints of these five minerals and further investigated their spatiotemporal dynamics along with the factors influencing these patterns.
3.1. Estimation of Raw Mining Capacity of Clean Energy Minerals
We assume that no clean energy minerals are lost throughout the mining, production, and distribution process, i.e., all clean energy minerals are efficiently converted to concentrates. Therefore, the mathematical expression for the number of raw ore mined is as follows:
where calculates the raw ore mined for clean energy mineral in province . is the concentrate production of mineral in province . denotes the grade of the mineral produced, while signifies the valuable content extractable from the ore in that province.
3.2. EE-MRIO Model
The EE-MRIO model integrates environmental elements to articulate the interaction between economic and environmental systems, building upon the foundation of traditional input–output theory [48], The fundamental mathematical representation of the input–output model is as follows:
Here, denotes the output vector, signifies the technology coefficient matrix, and represents the final demand vector. A transformation of Equation (2) yields the Leontief inverse matrix, given by:
In this equation, is the unit matrix and is the Leontief inverse matrix. Within EE-MRIO model, we introduce the environmental matrix , encompassing the consumption of clean energy minerals, forming the subsequent structure:
Here, is the resource footprint, denoting the consumption of clean energy minerals attributable to economic activities.
Utilizing the EE-MRIO model, we discern both direct and indirect resource footprints of each production sector regionally, stemming from the consumption of clean energy minerals. The 20th National Congress of the Communist Party of China emphasizes a dual domestic–international developmental pattern. This approach seeks to fortify China’s industrial and supply chains, ensuring economic fluidity, while also bolstering domestic resilience and global competitiveness. In alignment with this strategy, our study zeroes in on domestic flows, exploring the environmental strain of China’s indigenous clean energy minerals, excluding import and export data. Such an investigative focus resonates with national priorities, aiding in comprehending and mitigating the environmental challenges posed by clean energy minerals.
To mitigate uncertainties associated with the homogeneity assumption, we decided to enhance the granularity of sectors. Given that sectors 1–5 in CEADs and sectors 1–34 in EXIOBASE 3 are both considered upstream industries, our objective was to expand these 5 sectors in CEADs based on the 34 sectors in EXIOBASE 3. During the expansion process, we noticed that certain sectors in the EXIOBASE 3 input–output table had final demand and output data equal to zero, which could lead to computational errors. To address this issue, we undertook a series of sectoral consolidations: firstly, sectors S16 and S17 in EXIOBASE 3 were merged to form the revised sector S15, and sectors S23 and S21 were combined into the new sector S19. As a result, the original 34 sectors were consolidated into 31.
The provided Table 1 and Table 2 illustrates the classifications of various sectors between 2012 and 2015 and 2017. Notably, in 2017, CEADs combined “Other manufacturing” with “Comprehensive use of waste resources” resulting in “Other manufacturing and waste resources” for sector S48. Additionally, what was earlier consolidated as “Scientific research and polytechnic services” in 2012 and 2015 has, in 2017, been split into separate sectors: “Scientific research” (S62) and “Polytechnic services” (S63). This caused subsequent sectors, beginning with “Production and distribution of tap water”, to move down one position, reflecting changes in the sector classifications for 2017.

Table 1.
Allocation of Sector 1 to 5 of the CEADs multi-regional input–output table.
Table 2.
Allocation of Sector 32 to 68 in 2012 and 2015 and 2017.
In this process, Figure 2 displays the pre-expansion input–output table, which is the original multi-regional input–output (MRIO) table of CEADs. In this table, sectors S1 to S5 represent the intermediate input parts of the upstream sectors, while sectors S6 to S42 represent the intermediate input parts of other sectors, denoted as . Here, and each represent different provinces, with and indicating the departments within CEADs. They depict the inflowing province and the outflowing province , from sector to sector . We aim to expand the sectors S1 to S5 into 31 more detailed sectors within CEADs’ Chinese MRIO table.
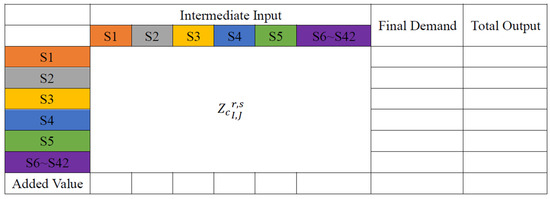
Figure 2.
Structure of China’s multi-regional input–output table before expansion.
For this purpose, we introduced data from EXIOBASE 3. The intermediate consumption segment of its input–output matrix, articulated by , captures the intricate intersectoral flows within China, stemming from sector to sector . Based on the data, Figure 3 provides a detailed depiction of this expansion strategy. The table employs four equations to outline how to combine the original data from CEADs and the flow proportions from EXIOBASE 3 to obtain the expanded sector flows. For instance, sectors S1 to S17 in Figure 3 are expansions of sector S1 in Figure 2. This results in the original sectors S1 to S5 being expanded into 31 sectors. The remaining sectors, S6 to S42, are subsequently renumbered to sectors S32 to S68. The expanded mathematical expression [49] is as follows:
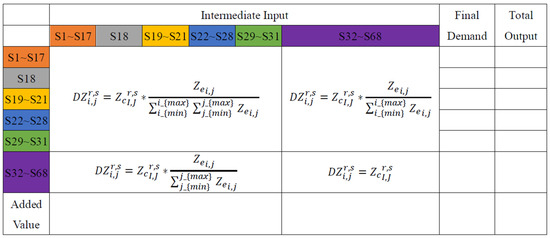
Figure 3.
Structure of China’s multi-regional input–output table after expansion.
denotes the expanded input–output table, signifying the flow from the first sector in the province to the sector in the province.
Equations (5)–(8) outline the inter-sectoral flows across provinces. Specifically, Equation (5) explains the flows between upstream sectors S1–S31 using both CEADs data and flow proportions from EXIOBASE 3. Equations (6) and (7) illustrate the interaction between upstream sectors S1–S31 and other sectors S32–S68, while Equation (8) details flows between non-upstream sectors S32–S68 using only the original CEADs data without expansion.
Figure 4 shows the results of . From 2012 to 2017, there was a marked increase in the overall flow, with the 2017 flow nearly doubling that of 2012, highlighting China’s growing demand for clean energy minerals during this timeframe. Consistently across these years, the eastern region exhibited the highest flow, suggesting more robust resource demand and utilization, while the northwest region displayed the least, indicating comparatively subdued activities and demand.
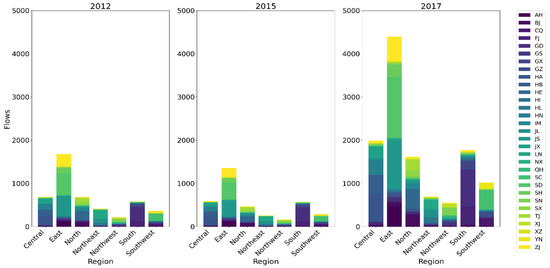
Figure 4.
Domestic resource flows of clean energy minerals from 2012 to 2017.
3.3. Non-Parametric Monte Carlo Methods
In this study, we estimated the raw ore extraction quantity based on exit grade and concentrate grade, incorporating this data into the EE-MRIO model to determine the resource footprint of clean energy minerals. However, the established methodology presumes an ideal scenario, where there are no losses of clean energy minerals throughout the extraction, production, and distribution stages. Such an assumption overlooks the intricacies inherent to real-world operations, particularly the heterogeneity of ore compositions and the variance in mining and processing technologies, all of which can introduce uncertainties into the calculated resource footprint.
The core working principle of the Monte Carlo simulation is to use random sampling to simulate or predict possible outcomes. Through numerous repeated simulations, a distribution of results is obtained. To gain a nuanced understanding of these uncertainties and to provide decisionmakers with more comprehensive insights, we employed a non-parametric Monte Carlo simulation approach. This approach assesses the resource footprints under varying exit and concentrate grades and compares these findings with our preliminary estimates. Unlike traditional parametric methods, the non-parametric Monte Carlo simulation does not base its computations on any predefined distribution. Instead, it extracts insights directly from observed empirical data. This technique is particularly valuable when the potential distribution of data is ambiguous or when the real distribution cannot be succinctly represented by a parametric curve.
The quantile matching technique we adopted is a proficient non-parametric statistical method [50]. It enables the generation of random samples mirroring the distribution of the original data without committing to any specific distribution assumptions. By aligning values at individual quantiles, we can produce a new random variable that authentically replicates the distribution spectrum of the original dataset.
For output grade and concentrate grade of each sample the position of the quantile can be calculated by Equation (9)
where is the number of samples. Equation (9) can help us determine the relative position of each sample in the distribution in which it is located. Then, we can generate random samples that match their distributions at these quantile positions by interpolation, and combined with Equation (1), we can obtain the simulated distribution of raw ore production.
3.4. Random Forest Regression
3.4.1. Random Forest Regression Method
The random Forest is an ensemble learning method that constructs multiple decision trees and aggregates their results for prediction. The random forest model is selected due to its capability in handling high-dimensional data, aptitude for accurately fitting non-linear relationships, and suitability for the sparse nature of the resource footprint data within this research context. The random forest regression model distinctly differs from traditional linear regression in its approach to predictive tasks. A key characteristic of this model is that it does not rely on an explicitly defined error term for making predictions. Instead, it manages predictive errors intrinsically by constructing and combining the predictive outcomes of multiple decision trees. The strength of this method lies in its ability to distribute and reduce the predictive errors that might be introduced by a single model. Each tree is trained on different subsets of the data and contributes independently to the overall prediction. This diversity in the ensemble, where multiple trees balance out the errors in their predictions, enhances the overall accuracy and stability of the model’s predictions [51].
To address scale disparities and non-normal distribution among the data, we initially apply the data to a logarithmic transformation. Subsequently, the dataset is partitioned into a training set and a testing set, with a random allocation of 70% of the data to the former, and the remaining 30% to the latter. This division ensures that the model’s predictive accuracy is validated on an independent subset of the data.
To bolster the model’s generalization capability and mitigate overfitting, we employ Bayesian optimization to determine the model’s optimal hyperparameters. Recognized for its efficiency, Bayesian optimization is a powerful global optimization algorithm adept at handling high-dimensional feature spaces and noisy objective functions. Its primary objective is to locate a set of hyperparameters that enhances the model’s validation performance [52]. The random forest regression model was formulated as:
where designates the resource footprint, represents the features, and is the prediction for input vector under hyperparameter set . represents the number of decision trees. is the prediction of the decision tree . denotes the number of trees, minimum leaf size, maximum number of splits, number of variables to sample.
Hyperparameter tuning was performed using Bayesian optimization [53], targeting an objective function representing the validation error:
The primary aim of the Bayesian optimization was to find:
To ensure robustness in the selected hyperparameters, 5-fold cross-validation was utilized. Here, the dataset was split into five subsets . During each fold, four subsets were used for training while one subset was retained for validation. This procedure ensured that each data point was evaluated multiple times under different training and validation splits.
For each feature, the significance of its impact on the model’s performance is assessed by observing the degradation in performance when its values are randomly permuted in the out-of-bag (OOB) samples. In the random forest model, assessing feature importance diverges substantially from deriving regression coefficients in linear models. Feature importance in a random forest is calculated based on each feature’s contribution to the trees’ splitting criteria. This approach does not derive direct effect sizes from coefficients, but rather quantifies the relative contribution of each feature to the model’s prediction accuracy. The importance of each feature is determined by observing changes in the model’s predictive accuracy when that feature’s values are altered or permuted, providing insights into the impact of each feature on the outcome [54]. The mathematical expression representing the importance of feature is given by:
where denotes the importance of the feature. is the number of iterations. represents the prediction error obtained using the original OOB samples during the iteration. is the prediction error achieved after randomly permuting the values of the feature in the OOB samples during the iteration.
To ensure robust model performance and address potential uncertainties inherent in Bayesian optimization due to its stochastic nature, we employed a strategy of multiple hyperparameter searches. This approach not only bolsters the stability of our results but also aids in pinpointing a model that excels in real-world applications rather than being exclusively fixated on locating the global optimum.
3.4.2. Feature Selection
In analyzing the factors influencing the footprint of clean energy mineral resources, feature selection plays a crucial role in the performance of the model. To provide a comprehensive and detailed perspective, after referring to the studies of related scholars [55] and theoretical frameworks, we selected features that include not only traditional economic and demographic factors, but also consider environmental, technological, and industrial structure, and other factors of concern to modern society, aiming to reflect the various aspects that affect the footprint of clean energy mineral resources, the selected characteristics include the following six:
- (1)
- Economic Development: represented by a region’s GDP, indicating its economic strength and the potential demand for clean energy resources;
- (2)
- Industrial Structure: captured by the revenue from new product sales in high-tech industries, reflecting a shift towards knowledge and technology-intensive industries;
- (3)
- Environmental Quality: measured by total carbon emissions, suggesting how environmental conditions might impact resource use efficiency;
- (4)
- Population Size: indicated by the total population, representing basic resource demand;
- (5)
- Energy Consumption: denoted by a region’s total energy consumption, reflecting demand for clean energy resources;
- (6)
- Technological Innovation: represented by a region’s technology market turnover, showcasing the impact of innovation on resource efficiency.
3.5. Data Source
Our data sources include the CEADs input–output database for China’s multi-regional input–output tables across 42 sectors for 2012, 2015, and 2017 [56], and the EXIOBASE3 input–output database for China’s input–output tables across 163 sectors [57].
Data regarding concentrate production for copper, nickel, molybdenum, zinc, and cobalt across 31 provinces in China (excluding Hong Kong, Macau, and Taiwan) for the years 2012, 2015, and 2017, as well as data concerning the grade of extracted ore and the grade of concentrate, were procured from the China Nonferrous Metals Industry Association. For the analysis of cobalt ore, we encounter certain complexities due to the unavailability of specific information regarding the output grade and concentrate grade, coupled with the relatively diminutive quantity of concentrate production. Drawing insights from the China Mineral Resources Report 2022 and with an objective of fostering unified statistical interpretation, we have postulated the following: we presume that the grade of cobalt ore output is 50%, implying that half of the extracted raw ore is entirely converted into an output state. Simultaneously, the concentrate grade is defined as 100%, signifying that all processed ore manifests as concentrate.
The variables selected for feature analysis are primarily sourced from a collection of reputable publications, namely the China Statistical Yearbook, China Mining Statistical Yearbook, China Land and Resources Statistical Yearbook, China Industrial Economic Statistical Yearbook, China Environmental Statistical Yearbook, and China High-Tech Industry Statistical Yearbook. To ensure the consistency of our dataset, missing values were addressed using linear interpolation techniques. All calculations in this paper were performed using MATLAB R2022a.
4. Results
4.1. Interpretation of Resource Footprint Results
Utilizing the derived flow matrix, we computed the resource footprints of copper, nickel, molybdenum, zinc, and cobalt across 31 Chinese provinces for the years 2012, 2015, and 2017 via the EE-MRIO model. The results are displayed in Figure 5.
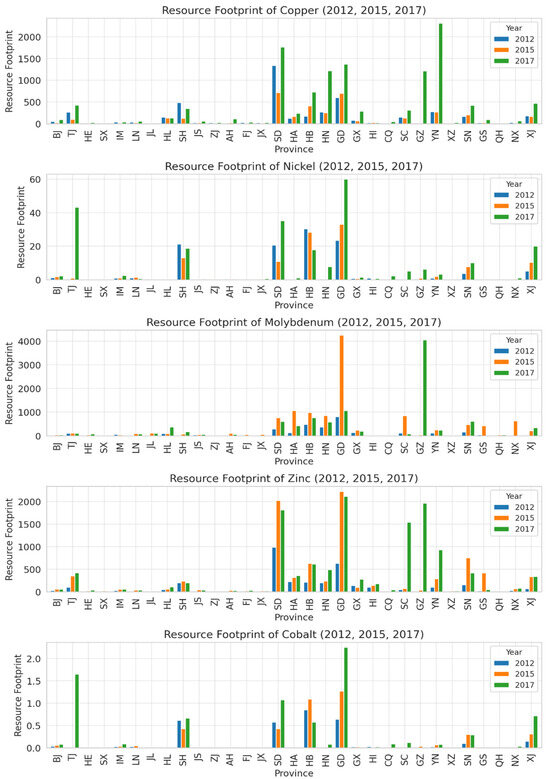
Figure 5.
Regional resource footprint of clean energy minerals in China (2012, 2015, and 2017).
The combined footprint of all assessed mineral resources exhibited a significant surge over the five-year period from 2012 to 2017. This increase underscores China’s economic development, industrial upgradation, and urbanization during this period, resulting in amplified demand for various clean energy minerals. However, this growth also insinuates that China faces heightened pressure and challenges concerning environmental conservation and resource sustainability. Notably, the copper resource footprint swelled from 46,545,520 tons in 2012 to 120,655,120 tons in 2017, marking a 159.47% increase; the nickel resource footprint climbed from 1,145,800 tons in 2012 to 2,424,900 tons in 2017, a 111.68% rise; the molybdenum resource footprint expanded from 32,684,500 tons to 103,253,100 tons, a substantial 215.86% increase; the zinc resource footprint ascended from 35,093,600 tons to 123,609,100 tons, a hefty increase of 252.08%; finally, the cobalt resource footprint grew from 31,700 tons to 79,100 tons, representing a 149.7% surge.
Of note is the fact that, despite the overarching upward trajectory of the resource footprints of the five mineral resources, significant variations persist amongst the different resources. Specifically, copper and molybdenum displayed minor declines during certain intervals. The resource footprint of copper exhibited a decrease of 20.10%, declining from 46,545,500 tons to 37,190,000 tons between 2012 and 2015. Concurrently, the resource footprint of molybdenum underwent a decrease of 14.90%, from 121,335,800 tons to 103,253,100 tons between 2015 and 2017. This trend potentially correlates with China’s industrial restructuring efforts during this period and the introduction of key policies, such as the Guidance on Accelerating Energy Conservation and Emission Reduction from 2015 issued by the Chinese State Council.
The resource footprints of nickel and cobalt experienced modest growth from 2012 to 2015, with increases of 23,200 tons for nickel, representing a 2.03% growth, and 10,400 tons for cobalt, marking a 32.83% rise. Yet, from 2015 to 2017, their growth rates surged noticeably. Nickel’s footprint expanded by 1,255,800 tons, a growth of 107.41%, while cobalt’s footprint grew by 37,000 tons, an increase of 88.01%. This pronounced acceleration can be linked to the evolution of China’s new energy automobile industry, advancements in high-end manufacturing, and other emerging sectors, coupled with a rising demand for batteries, stainless steel, and various other products [58,59].
Examining geographical distribution, we observe significant disparities across different regions in terms of distinct mineral resource footprints, and a discernible shift in related industries. Primarily, the resource footprints of copper, molybdenum, and zinc are progressively migrating towards the western region. For instance, between 2012 and 2017, Guizhou Province’s copper resource footprint soared from 98,500 tons to 12,162,300 tons, Hunan Province’s increased from 2,695,900 tons to 12,188,600 tons, and Yunnan’s escalated from 2,748,100 tons to 23,142,600 tons. This shift is possibly due to the industrialization and urbanization processes [60] in the western region fueling the demand for these resources. Additionally, the region’s abundant resource reserves contribute to lower production and operational costs [61]. Secondarily, the resource footprint of nickel and cobalt is transitioning towards economically advanced regions, such as Tianjin, which observed an increase in its nickel resource footprint from 4700 tons to 430,000 tons. This transition suggests that the ongoing upgrade of the industrial structure in the economically affluent eastern and coastal regions is catalyzing the demand for nickel, cobalt, and other metals in sectors such as new energy and high-end manufacturing.
Between 2012 and 2017, a discernible growth in the resource footprints across various sectors in China is evident. Notably, the construction sector (S54 in 2012 and S53 in 2017) displayed a remarkable escalation in its footprint, surpassing all other sectors. Given the multitude of sectors, this analysis prioritizes the downstream sectors’ footprints, as illustrated in Figure 6. During this period, significant growth was also observed in sectors such as finance (S58), real estate (S59), manufacture of transport equipment (S44), public administration, social insurance, and social organizations (S68), as well as the manufacture of leather, fur, feather, and related products (S34).
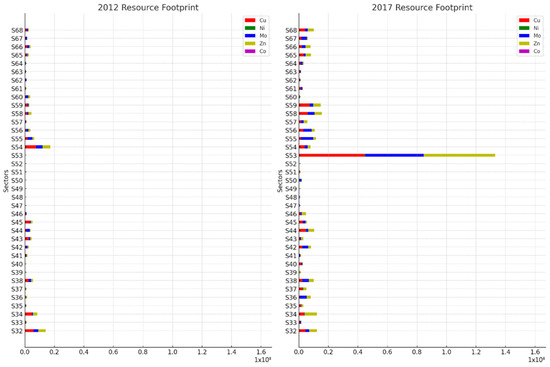
Figure 6.
Total resource footprint across downstream sectors in China for 2012 and 2017.
Figure 7 delineates the distribution of resource footprints for copper, nickel, molybdenum, zinc, and cobalt across various downstream sectors in 2012 and 2017. Beyond the construction sector, cobalt’s footprint exhibited pronounced growth in sectors like manufacture of transport equipment, processing of petroleum, coking, processing of nuclear fuel, and education. Nickel predominantly displayed an upward trend in the manufacture of transport equipment, education, and processing of petroleum, coking, processing of nuclear fuel sectors. The footprint of copper was amplified within the real estate, finance, and manufacture of transport equipment sectors. Zinc manifested considerable growth in the finance, real estate, and manufacture of leather, fur, feather, and related products sectors. Concurrently, molybdenum’s footprint saw conspicuous growth across transport, storage, and postal services, finance, and real estate sectors.
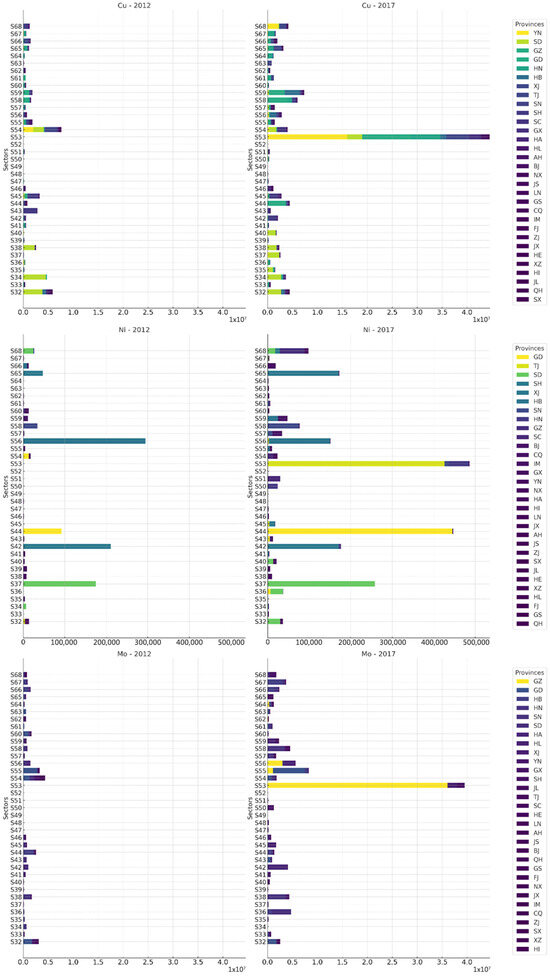
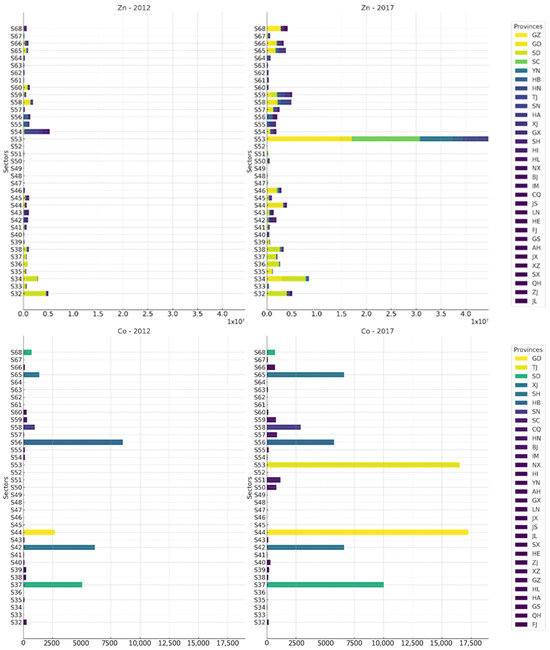
Figure 7.
Different resource footprints in downstream sectors of China for 2012 and 2017.
The rapid growth in the construction sector’s resource footprint underscores China’s accelerated urbanization and infrastructure development during this period. As urbanization deepened and populations converged, there was a surge in demand for apartments, roads, bridges, and other fundamental infrastructures, exerting profound environmental pressures. In the non-manufacturing domain, particularly in the finance (S58) and real estate (S59) sectors, there was a notable footprint expansion. The prosperity of the finance sector, active capital movements, and the associated demand for technology and electronic devices are potential drivers for this surge. Concurrently, the boom in real estate not only emanates from rising residential needs but more from commercial properties and large-scale infrastructure projects, intensifying mineral resource consumption and subsequent environmental strains. In manufacturing, the manufacture of transport equipment sector (S44) witnessed a significant footprint rise, aligned with China’s hefty investments in innovative technologies like electric vehicles and high-speed railways, which heavily rely on specific minerals. Additionally, the growth in the manufacture of leather, fur, feather, and related products (S34) could be tethered to evolving consumer demands, fashion trends, and lifestyle shifts. As for supply and service sectors like transport, storage, and postal services (S56), education (S65), and public administration, social insurance, and social organizations (S68), their footprints also expanded. While these sectors might not be directly tied to resource production or consumption, they indeed impart indirect environmental impacts by spurring economic activities in other sectors.
4.2. Uncertainty Analysis Using the Non-Parametric Monte Carlo
In this study, we employed a non-parametric Monte Carlo simulation approach to delve into the uncertainties of the resource footprint. Drawing on historical data of ore grades and concentrate grades of clean energy minerals from 2012 to 2021, we utilized the quantile matching technique for random sampling, thereby generating the required random variable inputs for our simulation. For each set of such randomly generated inputs, the EE-MRIO model was applied to evaluate the potential resource footprint of clean energy minerals across different provinces. After completing 10,000 iterative random samplings and simulations, we accumulated a range of simulation results. Based on these, we further derived the average values, standard deviations, and the associated confidence intervals. It is worth noting that due to the absence of historical data regarding the ore grades and concentrated grades of cobalt, our uncertainty analysis solely encompasses the resource footprints of copper, nickel, molybdenum, and zinc.
Figure 8 visualizes the Monte Carlo simulation results for copper, nickel, molybdenum, and zinc resource footprints for 2012, 2015, and 2017 across all Chinese provinces. In addition to extracting the mean and standard deviation from the Monte Carlo simulation, we also computed the coefficient of variances (CV), a measure of relative volatility, derived from the ratio of the standard deviation to the mean. A small CV indicates a concentrated set of results, while a larger CV denotes a more scattered outcome.
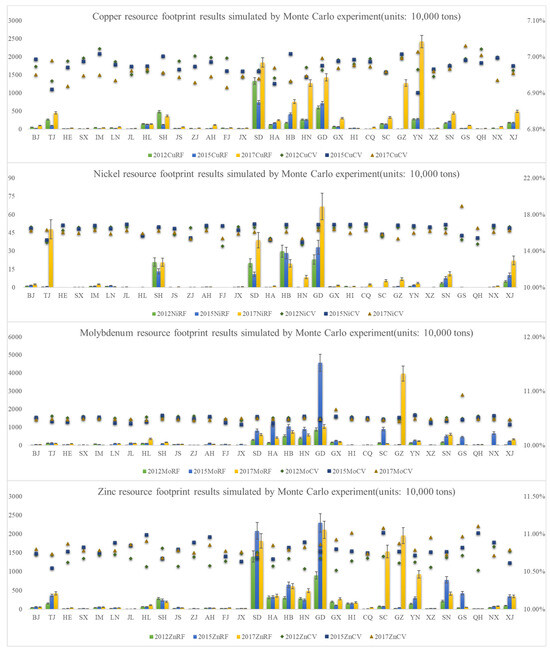
Figure 8.
Provincial resource footprints in China: Monte Carlo estimates (2012, 2015, 2017).
Considering the overall relative standard deviation results, the CV for the resource footprints of copper, nickel, molybdenum, and zinc is relatively low. This low variability suggests that the EE-MRIO-derived resource footprints of clean energy minerals are both stable and reasonable. For instance, the CV for the copper resource footprint across all Chinese provinces falls within the 6% to 7% range, suggesting that variations in copper mining and production processes, although present, are not overly dramatic.
Similarly, the coefficients of variation for the molybdenum and zinc footprints are 10–11% and 10–13%, respectively. These values are slightly higher than those of copper but are still relatively low. This indicates general stability in the molybdenum and zinc resource footprints, despite minor fluctuations. In contrast, the CV for the nickel resource footprint spans a wider range, from 14% to 17%, which exceeds those of copper, molybdenum, and zinc. This suggests a relatively higher volatility in the nickel resource footprint, possibly due to the multiplicity of influences impacting nickel production processes and the considerable range of variability for these factors.
In the context of standard deviation, the inherent uncertainty in the resource footprint of the four investigated minerals exhibits significant variation across mineral types and temporal dynamics. Regardless of the specific mineral, it is observed that provinces with extensive resource footprints consistently demonstrate larger standard deviations. This correlation suggests that an expansion in production scale could potentially induce an increase in the complexity of the associated production processes. Such complexity could originate from a multitude of factors, including but not limited to, the multiplicity of extraction sites, disparities in extraction and processing technologies, and an increased number of supply chain participants. These elements are likely to introduce greater variability into the production process, leading to an increase in the standard deviation.
Furthermore, we employed Monte Carlo simulations to ascertain the median and confidence intervals of our dataset, as depicted in Table 3. At a national level, the mean values derived from the simulations closely approximate the median for the period 2012 to 2017, irrespective of the mineral species under consideration. Concurrently, the lower confidence interval for the copper resource footprint exhibits a reduction from the mean of −9.27% to −9.30%, while the upper limit escalates by 16.26% to 16.27%. Comparable trends are observed for the nickel, molybdenum, and zinc resource footprints. The extremes of the confidence interval consistently lie below 25% of the mean, indicative of a relatively confined confidence interval.
Table 3.
Monte Carlo medians and intervals for Copper, Nickel, Molybdenum, and Zinc.
In addition, we undertook a differential analysis juxtaposing the resource footprint calculated by the EE-MRIO model, and the mean resource footprint derived from the Monte Carlo simulations, as illustrated in Figure 9. It is evident that usually, the calculated results bear a strong resemblance to the simulated outcomes, suggesting that the EE-MRIO model is proficient at generating estimates that closely align with the results from Monte Carlo simulations. The divergence in the resource footprints of copper, nickel and molybdenum was relatively modest and within acceptable bounds. However, a substantial deviation was noted in the zinc resource footprint for 2012, accounting for 29.6% of the simulated results.
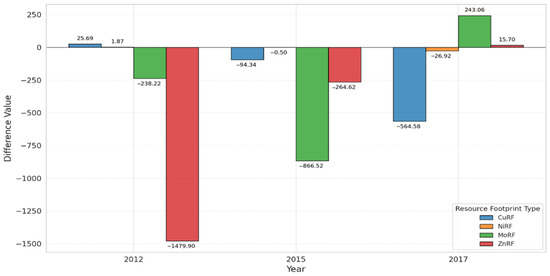
Figure 9.
Difference in resource footprints between calculated values and Monte Carlo estimates for 2012, 2015, and 2017.
This significant discrepancy primarily stems from the differences in core methodologies and data sources between the two models. The EE-MRIO model relies on economic activity and trade data from specific years, thereby precisely reflecting the market dynamics of that year. In contrast, the Monte Carlo model leans heavily on historical data, aiming to forecast long-term trends and associated uncertainties. The close alignment between the simulated and calculated results of the Monte Carlo model for the years 2015 and 2017 suggests that it successfully captures the overall market trend. Given that ore grade and concentrate grade are key parameters, the data deviation in 2012 might imply that high-quality zinc ore was extensively mined that year. This further indicates that, with the rapid extraction of high-quality zinc ore, the mining industry is gradually shifting towards lower-grade sources. This shift might be associated with the depth, scale, and type of the ore deposit as well as its grade fluctuations, suggesting that the primary source of uncertainty in the Monte Carlo model is geological factors.
4.3. Random Forest Regression Results
4.3.1. Model Results
To ensure the robustness of our model and to address the inherent uncertainties in Bayesian optimization, we implemented a strategy of multiple hyperparameter searches. Specifically, we conducted 10 independent Bayesian optimization processes, each aimed at discovering the optimal combination of hyperparameters. In each optimization, we evaluated the objective function up to 100 times, allowing the algorithm to search for the best solution across a broad parameter space. The result of each optimization was a specific set of hyperparameters, which were then used to train and evaluate the random forest model. Table 4 lists these optimal hyperparameter combinations.
Table 4.
Optimal hyperparameter combinations for all resource footprint models.
To determine the best model, we compared the performance of models under different hyperparameter combinations using a series of key performance indicators, including root mean square error (RMSE), mean absolute error (MAE), mean squared error (MSE), and the coefficient of determination (R2). Lower values of RMSE, MAE, and MSE typically indicate smaller prediction errors and higher predictive accuracy, while a R2 value close to one suggests a strong capability of the model in explaining data variability. Figure 10 provides a detailed revelation of the performance metrics and the relative importance of features of the selected best model. We thoroughly considered these indicators in the specific context of our data and research to ensure a deep and accurate understanding of the model’s accuracy. Further analysis of these results revealed that the footprints of different clean energy mineral resources are influenced by various factors. In particular, the total population significantly affects the resource footprints of copper, molybdenum, and zinc, while technology market turnover has a greater impact on the resource footprints of nickel and cobalt.
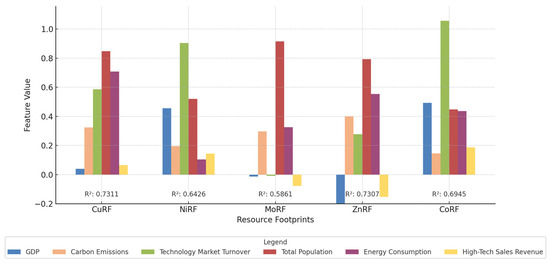
Figure 10.
Best random forest regression results for all resource footprint models.
The resource footprint of copper is notably shaped by total population and energy consumption, which carry characteristic importance values of 0.8472 and 0.7076, respectively. This could be attributable to the prevalent use of copper in electrical and electronic products, where copper demand is escalating in line with population growth and rising energy needs. Study [49] highlights the potential interplay of population migration on copper’s resource dynamics, further affirming our observations. The model returned an R2 value of 0.7311, a MSE of 0.5702, a MAE of 0.5739, and a RMSE of 0.7551. These metrics indicate that the model effectively encapsulates the relationship between these variables and the copper resource footprint. For sustainable resource management, due consideration should be given to the implications of population growth and energy policies.
When considering the resource footprint of nickel, the primary influencing factors appear to be technology market turnover and total population, with respective characteristic importance values of 0.9043 and 0.5198. This is likely due to nickel’s widespread application in high-tech industries, such as battery manufacturing. The burgeoning technology markets, coupled with an increasing population utilizing these products, may have spurred nickel demand. However, the model’s R2 value of 0.6426, an MSE of 1.5173, MAE of 1.0249, and RMSE of 1.2318 suggest that additional, unexplored factors might also be influential, necessitating further research.
The resource footprint of molybdenum is primarily driven by the total population, followed by total carbon emissions, exhibiting characteristic importance values of 0.9155 and 0.4565, respectively. With its prevalent use in the steel and chemical industries, the demand for molybdenum is poised to escalate as population growth spurs industrial activity. Nonetheless, the model’s R2 value of 0.5861, an MSE of 0.8347, MAE of 0.7711, and RMSE of 0.9136, suggest that the resource footprint of molybdenum may be shaped by an intricate interplay of several factors.
For zinc, mirroring copper, the pivotal factors are the total population and energy consumption, with respective characteristic importance values of 0.7934 and 0.5544. Given Zinc’s extensive utilization in construction and infrastructure, it exhibits a strong correlation with population growth and energy demand. The model reports an R2 value of 0.7307, an MSE of 0.7083, MAE of 0.6783, and RMSE of 0.8416, which, like copper, signify that the model adequately captures the essence of these relationships.
Lastly, the resource footprint of cobalt is largely dictated by technology market turnover, with an importance of 1.0568, likely tied to cobalt’s role in advanced technologies like lithium-ion batteries. The study [62] reinforces this viewpoint, suggesting that technological and industrial advancements are reshaping the demand for nickel and cobalt. GDP also emerges as a significant determinant, with an importance of 0.4928, potentially reflecting the influence of economic activities on cobalt demand. The model yields an R2 value of 0.6945, an MSE of 1.8703, MAE of 1.1748, and RMSE of 1.3676, indicating that, while the model has some degree of predictive power concerning the cobalt resource footprint, there remains room for improvement.
4.3.2. Robustness Testing
To further evaluate the generalization ability and stability of our model, we adopted a random seed-based data partitioning method. This technique effectively mirrored various real-world data scenarios, ensuring consistent performance of our model across diverse datasets. In our robustness testing, we utilized the ten sets of hyperparameters previously identified through Bayesian optimization, conducting 50 iterative training and evaluation cycles. Each cycle employed a distinct random seed to generate new splits of the data, ensuring the representativeness and diversity of each training and testing scenario. This approach differs from data shuffling; in every iteration, it produces an entirely new combination of data, thereby ensuring the representativeness and diversity of the training and testing sets. Table 5 presents the average results for key performance metrics such as R2, MAE, MSE, and RMSE under various hyperparameter combinations, affirming the model’s adaptability and generalization across different data partitioning scenarios.
Table 5.
Mean of model results for various hyperparameter combinations.
Significantly, the performance parameters for the five resource footprints exhibited relatively marginal changes across the ten modeling iterations. Specifically, these performance parameters remained largely stable, save for the R2 value of the cobalt resource footprint, which depreciated from 0.6945 to 0.5964, and its corresponding MSE, which escalated from 1.8703 to 2.7038. Despite these shifts, the average R2 value for the cobalt resource footprint hovers near 0.6, suggesting that the model retains a certain degree of explanatory power. Even though hyperparameter modifications may influence model performance, the overarching trend and the significance of key features maintain their relative constancy across different hyperparameter combinations. Total population persists as the most salient factor influencing the resource footprints of copper, molybdenum, and zinc, while the technology market turnover chiefly impacts the resource footprints of nickel and cobalt. This consistency indicates that our chosen optimal model is reliable, with its findings demonstrating robustness. While individual models may be swayed by the selection of specific hyperparameters, the general trends and conclusions remain steadfast across a spectrum of configurations.
5. Conclusions and Discussion
In light of the imperative for sustainable consumption in today’s global landscape, the responsible extraction and stewardship of clean energy-associated mineral resources have never been more critical. Our study delved into the consumption patterns and driving factors of clean energy minerals such as copper, nickel, molybdenum, zinc, and cobalt across various Chinese provinces and sectors. Utilizing the EE-MRIO model and incorporating 42 sectoral input–output tables from CEADs, refined in accordance with EXIOBASE 3’s 163 sectoral criteria, we computed the resource footprints of these minerals. Recognizing the inherent uncertainties in parameters, we further assessed the variations surrounding the exit grade and concentrate grade using a non-parametric Monte Carlo analysis. The study culminates by discerning the distinctive characteristics influencing the footprints of these five minerals, facilitated by the insights drawn from a random forest regression model.
The EE-MRIO analysis shows an upward trend in the resource footprint of five major minerals across Chinese provinces between 2012 and 2017. Copper, molybdenum, and zinc are predominantly concentrated in the western provinces, while nickel and cobalt show a significant presence in the more affluent eastern and coastal areas. This distribution highlights the intricate ties between regional growth plans and environmental repercussions, underscoring the need for tailored sustainable strategies for each region. Beyond the usual resource-heavy sectors, non-manufacturing domains such as finance and real estate have emerged as significant contributors to the resource footprint. Moreover, the heightened footprint in areas like construction and certain manufacturing sectors accentuates the relationship between China’s developmental aspirations in infrastructure and its patterns of resource consumption.
The Monte Carlo simulations affirm the reliability of the EE-MRIO model, with its accuracy particularly highlighted in the 2015 and 2017 predictions. This positions the model as a reliable method for estimating resource footprints across Chinese provinces. There’s a clear connection between provinces showcasing larger resource footprints and heightened standard deviations, signaling that mineral production growth introduces greater complexities. The pronounced reliance of the Monte Carlo model on historical data, as evident with the zinc analysis for 2012, reflects the industry’s transition towards mining practices that prioritize lower-grade ores. Moreover, the uncertainties rooted in geological factors underline the changing nature of mineral deposits and the anticipated prominence of geological shifts in shaping future resource footprints.
Through our utilization of the random forest regression model, we identified a significant relationship between population growth and the demand for minerals like copper, molybdenum, and zinc. These minerals appear essential for sectors such as construction, infrastructure, and electronics. Concurrently, the evolving technological domain, especially advancements in battery manufacturing, seems to be shaping the demand for nickel and cobalt. While our model has provided consistent insights across various configurations, we recognize the need for continuous refinement, illustrated by nuances like cobalt’s footprint. Thus, our findings, bolstered by the external literature, offer a preliminary yet valuable framework for understanding mineral resource demand dynamics.
Considering these insights, we propose the following policy recommendations pertaining to clean energy mineral extraction:
Firstly, to promote sustainable mineral resource collaboration among regions, provinces should establish interlinking mechanisms, especially between the resource-rich western areas and the high-demand eastern and coastal regions. Collaboratively, they should research and formulate strategies for rational development and utilization of mineral resources. The financial and real estate sectors, among other non-manufacturing industries, are encouraged to adopt and practice green strategies. Additionally, relevant environmental impact assessment standards should be established and enforced to ensure the sustainability of resource usage in these sectors.
Secondly, to ensure the continuous supply of mineral resources, thorough geological exploration and assessment should be conducted, especially in provinces with rich mineral resources and noticeable footprint disparities. Given the trend towards exploiting low-grade ores, national efforts should support and encourage technological innovation, focusing on the development and promotion of more efficient and environmentally friendly mineral extraction methods and techniques.
Lastly, there should be enhanced synergy between urban planning and key sectors such as construction, infrastructure, and electronics. To ensure efficient use of minerals, the development and utilization of alternative materials should be widely promoted, coupled with strengthening mineral recycling within cities. In response to the high demand for nickel and cobalt in the battery manufacturing industry, the state should place significant emphasis on R&D, particularly on researching new battery technologies that reduce the dependence on these two minerals.
Author Contributions
Conceptualization, J.C. (Jinhua Cheng); Methodology, C.F. and Z.Y. (Zhe You); Software, J.C. (Jiahao Chen) and J.P.; Validation, J.C. (Jiahao Chen); Formal analysis, J.C. (Jiahao Chen); Investigation, C.F.; Resources, Z.Y.; Data curation, J.P.; Writing—original draft, C.F.; Writing—review & editing, C.F. and Z.Y.; Visualization, J.P.; Supervision, Z.Y.; Project administration, J.C. (Jinhua Cheng); Funding acquisition, J.C. (Jinhua Cheng). All authors have read and agreed to the published version of the manuscript.
Funding
This research was funded by the National Natural Science Foundation of China, grant numbers 71991482, 72104189, and 72204235. This information is consistent with what has been provided in the system.
Institutional Review Board Statement
Not applicable.
Informed Consent Statement
Not applicable.
Data Availability Statement
No new data were created or analyzed in this study. Data sharing is not applicable to this article.
Conflicts of Interest
The authors declare no conflict of interest.
Abbreviations
| Abbreviation | Full Name | Abbreviation | Full Name |
| EE-MRIO | Environmentally Extended Multi-Regional Input–Output | HL | Heilongjiang |
| RF | Resource Footprint | SH | Shanghai |
| CEADS | China Emission Accounts and Datasets | JS | Jiangsu |
| GDP | Gross Domestic Product | ZJ | Zhejiang |
| Cu | Copper | AH | Anhui |
| Ni | Nickel | FJ | Fujian |
| Mo | Molybdenum | JX | Jiangxi |
| Zn | Zinc | SD | Shandong |
| Co | Cobalt | HA | Henan |
| CV | Coefficient of Variation | HB | Hubei |
| NT | Number of Trees | HN | Hunan |
| MLS | Minimum Leaf Size | GD | Guangdong |
| MNS | Maximum Number of Splits | GX | Guangxi |
| NVS | Number of Variables to Sample | HI | Hannan |
| MSE | Mean Squared Error | CQ | Chongqing |
| MAE | Mean Absolute Error | SC | Sichuan |
| RMSE | Root Mean Squared Error | GZ | Guizhou |
| R2 | Coefficient of Determination | YN | Yunnan |
| BJ | Beijing | XZ | Tibet |
| TJ | Tianjin | SN | Shanxi |
| HE | Hebei | GS | Gansu |
| SX | Shanxi | QH | Qinghai |
| IM | Inner Mongolia | NX | Ningxia |
| LN | Liaoning | XJ | Xinjiang |
References
- Islam, M.M.; Irfan, M.; Shahbaz, M.; Vo, X.V. Renewable and Non-Renewable Energy Consumption in Bangladesh: The Relative Influencing Profiles of Economic Factors, Urbanization, Physical Infrastructure and Institutional Quality. Renew. Energy 2022, 184, 1130–1149. [Google Scholar] [CrossRef]
- Dou, S.; Xu, D.; Zhu, Y.; Keenan, R. Critical Mineral Sustainable Supply: Challenges and Governance. Futures 2023, 146, 103101. [Google Scholar] [CrossRef]
- Vivoda, V. Friend-Shoring and Critical Minerals: Exploring the Role of the Minerals Security Partnership. Energy Res. Soc. Sci. 2023, 100, 103085. [Google Scholar] [CrossRef]
- World Bank. Climate-Smart Mining: Minerals for Climate Action. 2018. Available online: https://www.worldbank.org/en/topic/extractiveindustries/brief/climate-smart-mining-minerals-for-climate-action (accessed on 10 March 2023).
- Raimi, D.; Campbell, E.; Newell, R.; Prest, B.; Villanueva, S.; Wingenroth, J. Global Energy Outlook 2022: Turning Points and Tension in the Energy Transition; Resources for the Future: Washington, DC, USA, 2022. [Google Scholar]
- Purdy, C.; Castillo, R. China’s Role in Supplying Critical Minerals for the Global Energy Transition. 2022. Available online: https://www.brookings.edu/wp-content/uploads/2022/08/LTRC_ChinaSupplyChain.pdf (accessed on 15 June 2023).
- Franks, D.M.; Keenan, J.; Hailu, D. Mineral Security Essential to Achieving the Sustainable Development Goals. Nat. Sustain. 2023, 6, 21–27. [Google Scholar] [CrossRef]
- Calvo, G.; Valero, A. Strategic Mineral Resources: Availability and Future Estimations for the Renewable Energy Sector. Environ. Dev. 2022, 41, 100640. [Google Scholar] [CrossRef]
- Fang, C.; Cheng, J.; Zhu, Y.; Chen, J.; Peng, X. Green Total Factor Productivity of Extractive Industries in China: An Explanation from Technology Heterogeneity. Resour. Policy 2021, 70, 101933. [Google Scholar] [CrossRef]
- Hayes, S.M.; McCullough, E.A. Critical Minerals: A Review of Elemental Trends in Comprehensive Criticality Studies. Resour. Policy 2018, 59, 192–199. [Google Scholar] [CrossRef]
- Watari, T.; Nansai, K.; Nakajima, K. Review of Critical Metal Dynamics to 2050 for 48 Elements. Resour. Conserv. Recycl. 2020, 155, 104669. [Google Scholar] [CrossRef]
- Islam, M.M.; Sohag, K.; Alam, M.M. Mineral Import Demand and Clean Energy Transitions in the Top Mineral-Importing Countries. Resour. Policy 2022, 78, 102893. [Google Scholar] [CrossRef]
- Yi, J.; Dai, S.; Cheng, J.; Wu, Q.; Liu, K. Production Quota Policy in China: Implications for Sustainable Supply Capacity of Critical Minerals. Resour. Policy 2021, 72, 102046. [Google Scholar] [CrossRef]
- Ladislaw, S.; Zindler, E.; Tsafos, N.; Goldie-Scot, L.; Carey, L.; Lezcano, P.; Nakano, J.; Chase, J. Industrial Policy, Trade, and Clean Energy Supply Chains; Center for Strategic and International Studies (CSIS): Washington, DC, USA; BloombergNEF: New York, NY, USA, 2021. [Google Scholar]
- Cox, B.; Innis, S.; Kunz, N.C.; Steen, J. The Mining Industry as a Net Beneficiary of a Global Tax on Carbon Emissions. Commun. Earth Environ. 2022, 3, 17. [Google Scholar] [CrossRef]
- Economy-Wide Material Flow Accounts and Derived Indicators—A Methodological Guide (PDF). 2001. Available online: https://ec.europa.eu/eurostat/web/products-manuals-and-guidelines/-/ks-34-00-536 (accessed on 15 November 2022).
- Zhang, Y.; Ji, Y.; Xu, H.; Yang, Y.; Tian, L. Life Cycle Assessment of Valuable Metal Extraction from Copper Pyrometallurgical Solid Waste. Resour. Conserv. Recycl. 2023, 191, 106875. [Google Scholar] [CrossRef]
- Wang, H.; Hashimoto, S.; Moriguchi, Y.; Yue, Q.; Lu, Z. Resource Use in Growing China. J. Ind. Ecol. 2012, 16, 481–492. [Google Scholar] [CrossRef]
- Zeng, X.; Ali, S.H.; Tian, J.; Li, J. Mapping Anthropogenic Mineral Generation in China and Its Implications for a Circular Economy. Nat. Commun. 2020, 11, 1544. [Google Scholar] [CrossRef] [PubMed]
- Wood, R.; Stadler, K.; Simas, M.; Bulavskaya, T.; Giljum, S.; Lutter, S.; Tukker, A. Growth in Environmental Footprints and Environmental Impacts Embodied in Trade: Resource Efficiency Indicators from EXIOBASE3. J. Ind. Ecol. 2018, 22, 553–564. [Google Scholar] [CrossRef]
- Ahmed, Z.; Asghar, M.M.; Malik, M.N.; Nawaz, K. Moving towards a Sustainable Environment: The Dynamic Linkage between Natural Resources, Human Capital, Urbanization, Economic Growth, and Ecological Footprint in China. Resour. Policy 2020, 67, 101677. [Google Scholar] [CrossRef]
- Yilanci, V.; Pata, U.K. Investigating the EKC Hypothesis for China: The Role of Economic Complexity on Ecological Footprint. Environ. Sci. Pollut. Res. 2020, 27, 32683–32694. [Google Scholar] [CrossRef]
- Akalin, G.; Erdogan, S.; Sarkodie, S.A. Do Dependence on Fossil Fuels and Corruption Spur Ecological Footprint? Environ. Impact Assess. Rev. 2021, 90, 106641. [Google Scholar] [CrossRef]
- Abbood, K.; Meszaros, F. Carbon Footprint Analysis of the Freight Transport Sector Using a Multi-Region Input–Output Model (MRIO) from 2000 to 2014: Evidence from Industrial Countries. Sustainability 2023, 15, 7787. [Google Scholar] [CrossRef]
- Huang, Y.; Huang, D. Decoupling Economic Growth from Embodied Water–Energy–Food Consumption Based on a Modified MRIO Model: A Case Study of the Yangtze River Delta Region in China. Sustainability 2023, 15, 10779. [Google Scholar] [CrossRef]
- Long, Y.; Chen, G.; Wang, Y. Carbon Footprint of Residents’ Online Consumption in China. Environ. Impact Assess. Rev. 2023, 103, 107228. [Google Scholar] [CrossRef]
- Lenzen, M.; Geschke, A.; West, J.; Fry, J.; Malik, A.; Giljum, S.; Milà i Canals, L.; Piñero, P.; Lutter, S.; Wiedmann, T.; et al. Implementing the Material Footprint to Measure Progress towards Sustainable Development Goals 8 and 12. Nat. Sustain. 2022, 5, 157–166. [Google Scholar] [CrossRef]
- Tukker, A.; de Koning, A.; Owen, A.; Lutter, S.; Bruckner, M.; Giljum, S.; Stadler, K.; Wood, R.; Hoekstra, R. Towards Robust, Authoritative Assessments of Environmental Impacts Embodied in Trade: Current State and Recommendations. J. Ind. Ecol. 2018, 22, 585–598. [Google Scholar] [CrossRef]
- Jiang, M.; Behrens, P.; Wang, T.; Tang, Z.; Yu, Y.; Chen, D.; Liu, L.; Ren, Z.; Zhou, W.; Zhu, S.; et al. Provincial and Sector-Level Material Footprints in China. Proc. Natl. Acad. Sci. USA 2019, 116, 26484–26490. [Google Scholar] [CrossRef] [PubMed]
- Wang, H.; Tian, X.; Tanikawa, H.; Chang, M.; Hashimoto, S.; Moriguchi, Y.; Lu, Z. Exploring China’s Materialization Process with Economic Transition: Analysis of Raw Material Consumption and Its Socioeconomic Drivers. Environ. Sci. Technol. 2014, 48, 5025–5032. [Google Scholar] [CrossRef]
- Wiedmann, T.O.; Schandl, H.; Lenzen, M.; Moran, D.; Suh, S.; West, J.; Kanemoto, K. The Material Footprint of Nations. Proc. Natl. Acad. Sci. USA 2015, 112, 6271–6276. [Google Scholar] [CrossRef] [PubMed]
- Tukker, A.; Bulavskaya, T.; Giljum, S.; Koning, A.; Lutter, F.S.; Simas, M.; Stadler, K.; Wood, R. The Global Resource Footprint of Nations: Carbon, Water, Land and Materials Embodied in Trade and Final Consumption Calculated with EXIOBASE 2.1; TNO: Delft, The Netherlands, 2014. [Google Scholar]
- Li, M.; Meng, B.; Gao, Y.; Guilhoto, J.J.M.; Wang, K.; Geng, Y. Material Footprints in Global Value Chains with Consideration of Multinational Enterprises. Resour. Conserv. Recycl. 2023, 190, 106828. [Google Scholar] [CrossRef]
- Platon, V.; Pavelescu, F.M.; Surugiu, M.; Frone, S.; Mazilescu, R.; Constantinescu, A.; Popa, F. Influence of Eco-Innovation and Recycling on Raw Material Consumption; Econometric Approach in the Case of the European Union. Sustainability 2023, 15, 3996. [Google Scholar] [CrossRef]
- Jiang, M.; Liu, L.; Behrens, P.; Wang, T.; Tang, Z.; Chen, D.; Yu, Y.; Ren, Z.; Zhu, S.; Tukker, A.; et al. Improving Subnational Input–Output Analyses Using Regional Trade Data: A Case-Study and Comparison. Environ. Sci. Technol. 2020, 54, 12732–12741. [Google Scholar] [CrossRef]
- Zhou, Y.; Li, J.; Wang, G.; Chen, S.; Xing, W.; Li, T. Assessing the Short-to Medium-Term Supply Risks of Clean Energy Minerals for China. J. Clean. Prod. 2019, 215, 217–225. [Google Scholar] [CrossRef]
- Baz, K.; Cheng, J.; Xu, D.; Abbas, K.; Ali, I.; Ali, H.; Fang, C. Asymmetric Impact of Fossil Fuel and Renewable Energy Consumption on Economic Growth: A Nonlinear Technique. Energy 2021, 226, 120357. [Google Scholar] [CrossRef]
- Koçak, E.; Şarkgüneşi, A. The Renewable Energy and Economic Growth Nexus in Black Sea and Balkan Countries. Energy Policy 2017, 100, 51–57. [Google Scholar] [CrossRef]
- Guliyev, H.; Mustafayev, E. Predicting the Changes in the WTI Crude Oil Price Dynamics Using Machine Learning Models. Resour. Policy 2022, 77, 102664. [Google Scholar] [CrossRef]
- Ahmad, T.; Chen, H. Nonlinear Autoregressive and Random Forest Approaches to Forecasting Electricity Load for Utility Energy Management Systems. Sustain. Cities Soc. 2019, 45, 460–473. [Google Scholar] [CrossRef]
- Tang, Z.; Mei, Z.; Liu, W.; Xia, Y. Identification of the Key Factors Affecting Chinese Carbon Intensity and Their Historical Trends Using Random Forest Algorithm. J. Geogr. Sci. 2020, 30, 743–756. [Google Scholar] [CrossRef]
- Tao, M.; Zhang, T.; Xie, X.; Liang, X. Water Footprint Modeling and Forecasting of Cassava Based on Different Artificial Intelligence Algorithms in Guangxi, China. J. Clean. Prod. 2023, 382, 135238. [Google Scholar] [CrossRef]
- Cutler, D.R.; Edwards, T.C., Jr.; Beard, K.H.; Cutler, A.; Hess, K.T.; Gibson, J.; Lawler, J.J. Random Forests for Classification in Ecology. Ecology 2007, 88, 2783–2792. [Google Scholar] [CrossRef]
- Ma, J.; Cheng, J.C.P. Identifying the Influential Features on the Regional Energy Use Intensity of Residential Buildings Based on Random Forests. Appl. Energy 2016, 183, 193–201. [Google Scholar] [CrossRef]
- Ahmad, M.W.; Reynolds, J.; Rezgui, Y. Predictive Modelling for Solar Thermal Energy Systems: A Comparison of Support Vector Regression, Random Forest, Extra Trees and Regression Trees. J. Clean. Prod. 2018, 203, 810–821. [Google Scholar] [CrossRef]
- Croft, S.; West, C.; Green, J. Capturing the Heterogeneity of Sub-National Production in Global Trade Flows. J. Clean. Prod. 2018, 203, 1106–1118. [Google Scholar] [CrossRef]
- Michaels, K.C. The Role of Critical Minerals in Clean Energy Transitions. Available online: https://www.iea.org/reports/the-role-of-critical-minerals-in-clean-energy-transitions (accessed on 10 December 2022).
- Södersten, C.-J.; Wood, R.; Wiedmann, T. The Capital Load of Global Material Footprints. Resour. Conserv. Recycl. 2020, 158, 104811. [Google Scholar] [CrossRef]
- Liu, L.; Schandl, H.; West, J.; Jiang, M.; Ren, Z.; Chen, D.; Zhu, B. Copper Ore Material Footprints and Transfers Embodied in Domestic and International Trade of Provinces in China. J. Ind. Ecol. 2022, 26, 1423–1436. [Google Scholar] [CrossRef]
- Dominicy, Y.; Veredas, D. The Method of Simulated Quantiles. J. Econom. 2013, 172, 235–247. [Google Scholar] [CrossRef][Green Version]
- Li, Y.; Zou, C.; Berecibar, M.; Nanini-Maury, E.; Chan, J.C.-W.; van den Bossche, P.; Van Mierlo, J.; Omar, N. Random Forest Regression for Online Capacity Estimation of Lithium-Ion Batteries. Appl. Energy 2018, 232, 197–210. [Google Scholar] [CrossRef]
- Breiman, L. Random Forests. Mach. Learn. 2001, 45, 5–32. [Google Scholar] [CrossRef]
- Snoek, J.; Larochelle, H.; Adams, R.P. Practical Bayesian Optimization of Machine Learning Algorithms. In Advances in Neural Information Processing Systems; Curran Associates, Inc.: New York, NY, USA, 2012; Volume 25. [Google Scholar]
- Mullainathan, S.; Spiess, J. Machine Learning: An Applied Econometric Approach. J. Econ. Perspect. 2017, 31, 87–106. [Google Scholar] [CrossRef]
- Jiang, W.; Sun, Y. Which Is the More Important Factor of Carbon Emission, Coal Consumption or Industrial Structure? Energy Policy 2023, 176, 113508. [Google Scholar] [CrossRef]
- Zheng, H.; Bai, Y.; Wei, W.; Meng, J.; Zhang, Z.; Song, M.; Guan, D. Chinese Provincial Multi-Regional Input-Output Database for 2012, 2015, and 2017. Sci. Data 2021, 8, 244. [Google Scholar] [CrossRef]
- Stadler, K.; Wood, R.; Bulavskaya, T.; Södersten, C.-J.; Simas, M.; Schmidt, S.; Usubiaga, A.; Acosta-Fernández, J.; Kuenen, J.; Bruckner, M.; et al. EXIOBASE 3, Version 3.8.2; Zenodo. 2021. Available online: https://zenodo.org/records/5589597#.ZAX2yD1By3A (accessed on 13 November 2022).
- Zeng, X.; Zheng, H.; Gong, R.; Eheliyagoda, D.; Zeng, X. Uncovering the Evolution of Substance Flow Analysis of Nickel in China. Resour. Conserv. Recycl. 2018, 135, 210–215. [Google Scholar] [CrossRef]
- Bai, Y.; Zhang, T.; Zhai, Y.; Jia, Y.; Ren, K.; Hong, J. Strategies for Improving the Environmental Performance of Nickel Production in China: Insight into a Life Cycle Assessment. J. Environ. Manag. 2022, 312, 114949. [Google Scholar] [CrossRef]
- Xu, G.; Geng, M.; Schwarz, P.; Dong, H.; Gong, Y.; Yang, H.; Thomas, M. The Effect of Industrial Relocations to Central and Western China on Urban Construction Land Expansion. J. Land Use Sci. 2021, 16, 339–357. [Google Scholar] [CrossRef]
- Li, Q.; Zeng, F.; Liu, S.; Yang, M.; Xu, F. The Effects of China’s Sustainable Development Policy for Resource-Based Cities on Local Industrial Transformation. Resour. Policy 2021, 71, 101940. [Google Scholar] [CrossRef]
- Jia, H.; Li, T.; Wang, A.; Liu, G.; Guo, X. Decoupling Analysis of Economic Growth and Mineral Resources Consumption in China from 1992 to 2017: A Comparison between Tonnage and Exergy Perspective. Resour. Policy 2021, 74, 102448. [Google Scholar] [CrossRef]


Disclaimer/Publisher’s Note: The statements, opinions and data contained in all publications are solely those of the individual author(s) and contributor(s) and not of MDPI and/or the editor(s). MDPI and/or the editor(s) disclaim responsibility for any injury to people or property resulting from any ideas, methods, instructions or products referred to in the content. |
© 2023 by the authors. Licensee MDPI, Basel, Switzerland. This article is an open access article distributed under the terms and conditions of the Creative Commons Attribution (CC BY) license (https://creativecommons.org/licenses/by/4.0/).