Abstract
The floodplain savannah is a tropical ecosystem that sustains grazing livestock, mainly by its grass’s diversity, of which scarce knowledge regarding the chemical composition and influencing factors. The aim was to evaluate the chemical composition variability of some native and introduced grasses grown in different physiographic positions of the floodplain savannah at transition periods and different cutting intervals. Five grasses from the “bank” (native species: Paspalum plicatulum, Axonopus compressus, Panicum versicolor, and Paspalum sp.; introduced species: Mulato I) and four from the “low” (native species: Leersia hexandra, Acroceras zizanioides, and Hymenachne amplexicaulis; introduced species: Urochloa humidicola) were sampled at 30, 40, and 50 cutting interval days during the “dry–rainy” and “rainy–dry” transition periods. The cuts were made with a 1 m2 frame to estimate forage biomass. The chemical compositions were analyzed by near-infrared spectroscopy. The influences of the cutting intervals and transition periods on chemical composition variables were evaluated through principal component analysis (PCA). Grass chemical variability was explained by eleven variables, including a digestible fraction, namely crude protein (CP), ash, ether extract (EE), total digestible nutrients (TDN), dry matter digestibility (DMD), metabolic energy (ME), phosphorus (P), and sulfur (S); and a partial digestible or undigestible fraction, namely neutral detergent fiber (NDF), lignin, and hemicellulose (HC). Grasses from the “low” position or with 30 cutting interval days in the rainy–dry transition period presented the highest proportion of the digestible fraction. Introduced grasses showed reduced nutritional value from 40 days onwards, whereas the L. hexandra, H. amplexicaulis, A. zizanioides, and P. versicolor native grasses were the least affected by the studied cutting intervals and transition periods. These native grasses constitute an important sustainable food resource for livestock in the flooded savanna ecosystem.
1. Introduction
Grasslands cover 80% of agricultural land and are a globally representative ecosystem (~26% of the total land area). In this ecosystem, livestock activity with grazing herbivorous animals is developed, which contributes about 29 and 10–15% of the world’s meat (including beef, sheep, and goat) and milk production, respectively [1,2]. The representativeness of the grasslands constitutes the main alternative to satisfy the growing demand for food required by the 10.7 billion people projected to constitute the population by 2067 [1,3]. It is reported that 68% of the grasslands are found in arid and semi-arid areas of tropical developing countries, where they are used mainly to produce meat and milk with grazing livestock and support the livelihood of nearly 800 million low-income people [3]. Despite the grasslands’ importance, their management must be improved to maximize several functions in terms of forage production, livestock performance, and ecosystem services such as water and air purification, soil recovery, and carbon sequestration [3,4,5].
In Colombia, part of the livestock activity is developed in tropical floodplain savannahs belonging to the Orinoquia ecosystem, which spans more than 5 million hectares, located across the Casanare and Arauca departments [6] and where 12.1% of the total cattle herd in Colombia (29,642,539 animals by the year 2023) is managed [7]. In the area, livestock activity is performed under a traditionally extensive grazing condition to breed and raise cattle, mainly with native grasses, and some introduce pastures [6,8].
Tropical flooded savannas are composed of different physiographic positions, the “banks” and “low” being the most important to sustain livestock activity during the year. Forage biomass for grazing varies according to the precipitation regime (dry period from December to March; rainy period from April to November) and water dynamics in the physiographic position [6]. Transition periods constitute the beginning of the rainy to dry or dry to rainy periods and influence forage availability. Usually, the start of the rainy period promotes forage production and improves nutritional value, whereas the beginning of the dry period reduces forage growth, quality, and persistence, with phenotypic variations according to the forage genetic characteristics [9]. In flooded savannahs, the “banks” are the higher and drier areas that sustain livestock during the rainy period, whereas the “low” areas constitute the basal part of the “bank” that remain flooded during the rainy season and sustain the grazing animals in the dry period. Each physiographic position includes its own vegetation cover, with a diversity of native and introduced grasses [6,10]. In the “low” physiographic position, native pastures like Acroceras zizanioides (Kunth) Dandy (1931) (blackwater straw); Hymenachne amplexicaulis (Rudge) Nees (1829) (water straw); and Leersia hexandra Sw. (1788) (Lambedora grass) are commonly used to feed grazing animals, whereas grasses of the genera Paspalum sp. and Axonopus sp. can be found in the physiographic positions of “banks”. Introduced grasses of the Urochloa genus are also commonly found in both physiographic positions [11,12].
A major concern faced by floodplain savannah producers is the scarce knowledge about the yield and quality of the forage resources used to feed grazing animals in different physiographic positions, growth phases, and periods of the year. Some studies have evaluated the temporal variability of the nutritional characteristics of some grasses grown in the “bank” and “low” positions independently, showing that native grasses performed similarly or even better than some introduced grasses under the studied ecosystem [11,12]. Similarly, it has been found that “low” soils tend to present greater nutrient concentrations than “bank” soils [10], which should influence the nutritional statuses and forage availability of floodplain savannah grasses, according to age and growth periods. As forage species from the “bank” and “low” positions are different, it would not be possible to make a direct comparison between them; however, it would be useful to perform a joint analysis to establish a general overview about the chemical composition variability of pastures during the year and to identify the best alternatives to be used in each scenario at different cutting intervals and climatic periods. The joint analysis of chemical composition variables among flooded savannah pastures belonging to different physiographic positions is scarce, so this study’s approach can generate valuable information for decision making by livestock producers in the region. In order to improve the productive figures of the livestock sector in floodplain savannah conditions, it is first required to address the feed scarcity and quality problem. The identification of forage options and their yield and chemical composition variability over time and at different periods could provide a fundamental set of information for the design of grazing programs with the most productive and sustainable grasses [4]. Therefore, the present study aims to evaluate the chemical composition variability of some native and introduced grasses from the floodplain ecosystem of the Colombian Orinoquia, at different cutting intervals and transition periods.
2. Materials and Methods
2.1. Study Region
The current study was carried out in the municipality of Arauca, Eastern Colombia (Figure 1). It is a floodplain region with a flat topography [10,13] (latitude: 7°08′17′′ N; longitude: 70°59′59′′ W; and altitude: 125 m). In the study region, the soils are acidic and have a clay loam and sandy loam texture, and they are classified as Ultisols and Oxisols. The levels of Fe, Mn, Zn, and B are high, while the levels of Ca, P, K, Cu, and CEC are low [10,14,15]. For a detailed description of the soil characteristics in the experimental area, see [10]. The life zone is subhumid tropical forest [16].
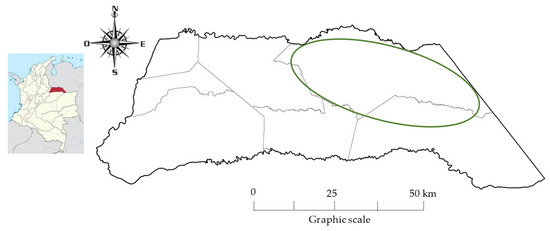
Figure 1.
Department of Arauca, Eastern Colombia (red color). Floodplain savannah region, department of Arauca (circle).
2.2. Evaluated Grass Species
Nine native and introduced grasses adapted or used on the Arauca floodplain savannah region were evaluated (Table 1). These plants were selected as part of a project that aimed to identify forage alternatives for the livestock activity in the region, considering its representativeness, animals’ acceptability, and the opinions of farmers belonging to the livestock committee of the region.

Table 1.
Native and introduced grasses included in the study (the scientific names of the grasses were taken from Plants of the World Online).
The selected grasses were triplicate established in their respective “bank” (n = 15) and “low” (n = 12) physiographic positions, in plots of 3 m × 3 m (9 m2) and with a 1 m distance between plots, during the rainy period (June–July 2021), and cuts were made during two transition periods. The dry–rainy transition period spans from April to May with rainfall of 181 mm, relative humidity of 87.9%, and an average environmental temperature of 26.5 °C. The rainy–dry transition period spans from November to December with rainfall of 165 mm, relative humidity of 90.5%, and an environmental temperature of 26.7 °C. The climatic variables were recorded by a portable weather station located near the experimental site.
In each plot, soil samples were collected following the standard procedures [17] and were analyzed at the National University of Colombia [18] to determine the texture and chemical characteristics, following the Colombian Technical Standards [19]. The preparation and establishment of the experimental plots was done manually. At the time of sowing, 500 g of diammonium phosphate (16% N and 40% P2O5) was added to each plot for optimal grass establishment [11,20]. Ninety days after the forage plots were sown, leveling cuts were made at 10 cm from the ground, marking the beginning of the experiments during the studied transition periods (rainy–dry and dry–rainy periods).
2.3. Forage Sampling Process
During the grass’s germination, three measurement points were randomly selected within each plot, and each defined measurement point was randomly assigned a 30-, 40-, or 50-day cutting interval. In each plot, the green forage was cut with a 1 m2 frame and weighed on a ranger precision balance. The green forage samples were dried for 72 h at 60 °C in a Caloric brand electric oven. The samples were stored in kraft paper bags and transported to the Laboratory of the Colombian Agricultural Research Corporation (AGROSAVIA) for the analysis of forage chemical compositions by near-infrared reflectance spectroscopy (NIRS) [21]. The spectra were obtained using FOSS NIR Systems DS6500 model equipment (Foss, Hilleroed, Denmark) by scanning in the range of 400–2498 nm. Spectra data were handled with WinISI 4.7.0.0 (Foss, Hilleroed, Denmark) [21]. The following chemical variables were estimated: dry matter yield per hectare (DMY/ha), dry matter (DM), crude protein (CP), neutral detergent fiber (NDF), acid detergent fiber (ADF), hemicellulose (HC), lignin, ether extract (EE), ash, total digestible nutrients (TDN), dry matter digestibility (DMD), metabolizable energy (ME), Ca2+, P, Mg2+, K, Na, and S.
2.4. Statistical Analysis
In the first step, descriptive statistics of nutritional composition variables were estimated. Subsequently, to evaluate the period and cutting interval’s effect on the nutritional and mineral characteristics of grasses cultivated under the “low” and “bank” physiographic positions, a multivariate approach was used.
The studied variables (DMY/ha, DM, CP, NDF, ADF, HC, lignin, EE, ash, TDN, DMD and ME, Ca2+, P, Mg2+, K, Na, and S) were standardized and submitted to two principal component analysis (PCA). The first and second analyses included the species–transition period and species–cutting interval synthetic variables as the classification criteria, respectively, in order to evaluate their influences on chemical composition variables. Both PCA analyses also allowed us to evaluate possible associations between the grass species of the same physiographic position and to identify useful, representative variables to characterize the nutritional and mineral properties of the studied grasses. Standardized eigenvectors and Pearson correlations between the variables and the principal components were used to identify the most representative variables useful to explain the observed variations. Moreover, biplot graphs were used to represent the relationships between the principal components explaining most of the data variability (> 60%). The analyses were carried out with InfoStat [22].
3. Results
The mean values of the chemical composition variables obtained in the studied grasses from the “bank” and “low” physiographic positions are presented in Table 2.
Table 2.
Average and standard deviations of nutritional and mineral composition variables of the studied grasses from the “bank” and “low” physiographic positions, obtained from 30 to 50 days.
A preliminary analysis of Table 2 indicates that, on average, higher DM (30.7 vs. 29.4%), CP (10.8 vs. 8.6%), ash (12.2 vs. 10.4%), EE (1.9 vs. 1.6%), TDN (52 vs. 50.3%), DMD (57 vs. 55.2%), P (0.23 vs. 0.19%), K (2.16 vs. 1.79%), Na (0.04 vs. 0.03%), and S (0.26 vs. 0.23%) were found in the “low” physiographic position grasses. Conversely, the DMY/ha (1416 vs. 1243 kg), NDF (68.3 vs. 64.3%), lignin (8.5 vs. 8.1%), HC (32.8 vs. 28.8%), Ca2+ (0.44 vs. 0.33%), and Mg2+ (0.23 vs. 0.21%) were higher in the “bank” species. The ADF (35.5%) and ME (1.8 Mcal/kg) levels were the same between the “bank” and “low” grasses.
Influence of Transition Periods and Cutting Intervals on Chemical Composition Variables
The eigenvalues and eigenvectors resulting from the PCAs performed on the chemical composition data by transition period and cutting interval are shown in Table 3 and Table 4, respectively. The data variability explained by the first two principal components was 69% and 70% for the PCA of the transition period and cutting interval, respectively.
Table 3.
PCA eigenvalues of the chemical composition variables of native and introduced grasses grown in different transition periods and cutting intervals.
Table 4.
PCA eigenvectors of the chemical composition variables of native and introduced grasses grown in different transition periods and cutting intervals.
The biplot representation showed the relationships between the first two PCs of the chemical composition variables in different transition periods (Figure 2) and cutting intervals (Figure 3). Both charts showed that PC1 accounted for most of the data variability (54 and 59% for PCA by transition period and cutting interval, respectively). Moreover, both charts showed that the CP, ash, EE, TDN, DMD, ME, and P variables were located to the right of CP1 and received the highest positive eigenvectors (0.23 to 0.31). In the PCA of the cutting intervals, the S variable also presented a significant contribution (0.22). The mentioned variables also showed the strongest correlation with PC1, with positive values ranging from 0.52 to 0.88 and 0.42 to 0.83 for the PCA by transition period and cutting interval, respectively. On the other hand, variables like NDF, lignin, and HC presented the highest negative values (−0.24 to −0.30) and were located to the left of PC1. The correlations between these variables and PC1 ranged between −0.56 and −0.82 and between −58 and 0.84 for the PCA by transition period and cutting interval, respectively.
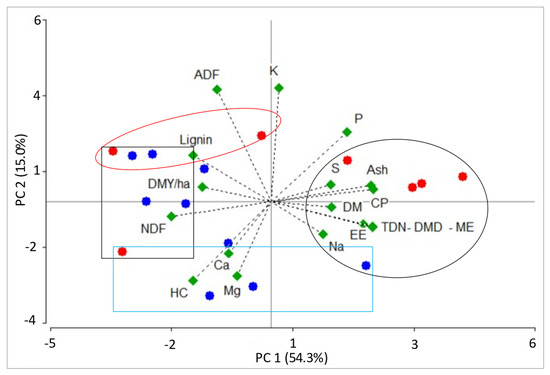
Figure 2.
Biplots obtained by the PCA of chemical composition variables of flooded savannah pastures cultivated in the “low” (red dots) and “bank” (blue dots) physiographic positions, during different transition periods. Black circle: samples with the highest PC1 eigenvectors (A. zizanioides, L. hexandra, H. amplexicaulis, and P. versicolor); black rectangle: samples with the lowest PC1 eigenvectors (Mulato, P. plicatulum, Paspalum sp., A.compressus, and U. humidicola); red circle: samples with the highest PC2 eigenvectors (A. zizanioides, U. humidicola, P. plicatulum, Mulato, and Paspalum sp.); blue rectangle: samples with the lowest PC2 eigenvectors (P. plicatulum, P. versicolor, Mulato, U. humidicola, A. compressus). DMY/ha: dry matter yield per hectare, DM: dry matter, CP: crude protein, NDF: neutral detergent fiber, ADF: acid detergent fiber, HC: hemicellulose, EE: ether extract, TDN: total digestible nutrients, DMD: dry matter digestibility, ME: metabolizable energy.
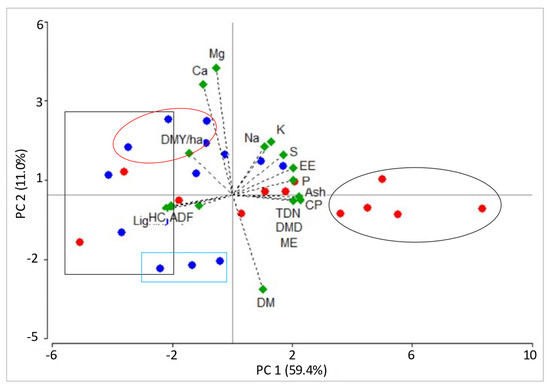
Figure 3.
Biplots obtained by the PCA of chemical composition variables of flooded savannah pastures cultivated in the “low” (red dots) and “bank” (blue dots) physiographic positions, according to grass cutting intervals. Black circle: samples with the highest PC1 eigenvectors (A. zizanioides, L. hexandra, H. amplexicaulis, and P. versicolor); black rectangle: samples with the lowest PC1 eigenvectors (Mulato, P. plicatulum, Paspalum sp., A. compressus, and U. humidicola); red circle: samples with the highest PC2 eigenvectors (A. zizanioides, U. humidicola, P. plicatulum, Mulato, and Paspalum sp.); blue rectangle: samples with the lowest PC2 eigenvectors (P. plicatulum, P. versicolor, Mulato, U. humidicola, A. compressus). DMY/ha: dry matter yield per hectare, DM: dry matter, CP: crude protein, NDF: neutral detergent fiber, ADF: acid detergent fiber, HC: hemicellulose, EE: ether extract, TDN: total digestible nutrients, DMD: dry matter digestibility, ME: metabolizable energy.
The biplots of the transition period and cutting interval PCA showed that PC1 allowed us to separate grass species from the “low” and “bank” physiographic positions, in terms of chemical composition. Most of the “low” grasses sampled at different cutting intervals and transition periods presented a projection to the right of PC1, suggesting greater CP, ash, EE, TDN, DMD, ME, and P concentrations than the “bank” species. Similarly, most of the “bank” grasses and some from the “low” physiographic position were located to the left of PC1 and were characterized by high NDF, lignin, and HC content.
In the PCA by the transition period (Figure 2), three grasses from the “low” physiographic position (A. zizanioides in the rainy–dry period, and L. hexandra and H. amplexicaulis in both transition periods) and one belonging to the “bank” position (P. versicolor in the rainy–dry period) presented the highest positive PC1 values, ranging from 1.8 to 7.0 (samples enclosed in a black circle in Figure 2). These grasses were on average characterized by greater CP (12.2 vs. 8.3%), ash (13.5 vs. 10.0%), EE (2.1 vs. 1.5%), TDN (53.3 vs. 49.9%), DMD (58.4 vs. 54.7%), ME (1.9 vs. 1.7 Mcal/kg), and P (0.23 vs. 0.20%) values than the other pastures evaluated at different transition periods. On the other hand, three “bank” grasses (Mulato and P. plicatulum in the dry–rainy period, and Paspalum sp. in both transition periods) and one belonging to the “low” physiographic position (U. humidicola in both transition periods) showed the highest negative PC1 values, ranging from −1.9 to −3.6 (samples enclosed in a black rectangle in Figure 2). These grasses showed, on average, greater NDF (70.8 vs. 64.0%), lignin (8.8 vs. 8.0%), and HC (33.6 vs. 29.3%) levels, compared to the rest of the pastures evaluated at different transition periods.
Exploring PC2 of the transition period PCA, it was observed that 15.0% of the data variability was explained, and the highest positive eigenvectors were associated with the ADF and K variables (0.49 to 0.50), which was in opposition to the HC and Mg levels (eigenvectors between −0.32 and −0.35). These variables also presented the strongest correlations with PC2. The ADF and K variables showed a positive correlation ranging from 0.67 to 0.71, while the HC and Mg variables correlated from −0.42 to −0.52. According to PC2, the highest positive values were observed in two “low” physiographic position grasses (A. zizanioides and U. humidicola) and two “bank” (P. plicatulum and Paspalum sp.) grasses during the dry–rainy period (1.5 to 2.2), suggesting greater ADF (38.2 vs. 34.8%) and K (2.4 vs. 1.9%) concentrations than the other grasses evaluated at different transition periods (samples enclosed in a red circle in Figure 2). Conversely, the highest negative PC2 values were obtained in three “bank” species (P. plicatulum, P. versicolor, and Mulato in the rainy–dry period) and one “low” grass (U. humidicola in the rainy–dry period), with values between −1.7 and −3.1, indicating greater HC (35.0 vs. 29.5%) and Mg2+ (0.26 vs. 0.21) content compared to the other species studied at different transition periods (samples enclosed in a blue rectangle in Figure 2).
In the PCA by the cutting interval (Figure 3), “low” physiographic position species like A. zizanioides and H. amplexicaulis at 30 days of age and L. hexandra with cutting intervals from 30 to 50 days obtained the greatest positive PC1 values (3.6 to 8.3), which indicates that these plants were characterized by higher CP (13.7 vs. 8.7%), ash (14.0 vs. 10.6%), EE (2.2 vs. 1.6%), TDN (54.4 vs. 50.3%), DMD (59.6 vs. 55.1%), ME (2.9 vs. 1.8 Mcal/kg), P (0.26 vs. 0.20%), and S (0.27 vs. 0.24%) content than the other studied grasses at different cutting intervals (samples enclosed in a black circle in Figure 3). On the other hand, four “bank” grasses (50-day-old P. plicatulum, A. compressus, and Paspalum sp., and 40- to 50-day-old Mulato) and one “low” physiographic position grass (40- and 50-day-old U. humidicola) showed the highest negative PC1 values (2.2 to 5.1), suggesting that these grasses contained higher NDF (71.7 vs. 64.6%), lignin (8.8 vs. 8.1%), and HC (35.0 vs. 29.4%) than the other studied species at different cutting intervals (samples enclosed in a black rectangle in Figure 3).
In PC2 of the cutting interval PCA, 11.0% of the data variability was explained. The highest positive eigenvectors were associated with the Ca2+ and Mg2+ variables (0.51 to 0.58), whereas the greatest negative eigenvector was related to the DM variable (−0.44). Ca2+ and Mg2+ correlated with PC2, with values ranging between 0.51 and 0.61, while DM did so with a value of −0.43. Species with the highest PC2 values included the 40-day-old P. plicatulum “bank” grass and the 30- to 50-day-old Mulato (1.6 to 2.6), suggesting greater Ca2+ (0.53 vs. 0.37%) and Mg2+ (0.27 vs. 0.21%) concentrations than the rest of the studied grasses during different cutting intervals (samples enclosed in a red circle in Figure 3). Similarly, the highest negative PC2 value was obtained in the 30- to 50-day-old A. compressus “bank” grass (2.3 to 2.6), indicating a greater DM (33.7 vs. 29.5%) concentration compared to the other evaluated grasses at different cutting intervals (samples enclosed in a blue rectangle in Figure 3).
4. Discussion
4.1. Grasses’ Productive and Chemical Composition Characteristics
Grass species from “low” and “bank” physiographic positions are adapted to different edaphoclimatic conditions, determined mainly by the rainfall regime of the area and its effect on flood dynamics. In this sense, the flooded savannahs constitute a productive scenario with adverse environmental conditions that influence the agronomic and nutritional parameters of forages used in animal production [23]. In the native species, the results were as follows: DMY (1207 kg/ha), DM (31.2%), CP (10.3%), Ash (11.8%), EE (1.7%), NDF (65.4%), ADF (35.6%), Lignin (8.2%), HC (29.8%), TDN (51.5%), DMD (56.5%), ME (1.8 Mcal/kg), Ca2+ (0.38%), P (0.21%), Mg2+ (0.21%), K (1.96%), Na (0.04%), S (0.25%). These values are within the ranges reported in several improved pastures, like Urochloa hybrid cv. Cayman, Urochloa decumbens, Urochloa ruziziensis, Urochloa brizantha, Urochola hybrid cv. Mulato, and other Megathyrsus maximus cultivars (Tanzania, Tobiata) grown under tropical conditions and with ages between 21 and 63 days [24,25,26,27].
The studied introduced grasses (Mulato and U. humidicola) showed greater values of DMY (1801 kg/ha), NDF (70.3%), lignin (8.6%), HC (35.1%), Ca2+ (0.42%), and Mg2+ (0.25%) than the native species. The DMY obtained with the introduced grasses was similar to the values observed during the dry periods in tropical regions; however, it was lower than the forage yield obtained during rainy periods (2500 to 6700 and 4000 to 6150 kg/ha in Mulato and U. humidicola, respectively) [28,29,30]. The higher forage biomass production observed in the introduced pastures was accompanied by a higher concentration of the fibrous fractions (cellulose, hemicellulose, and lignin), with NDF values above 55%, a critical point where grass’s digestibility and intake potential could be restricted [31,32]. Cell wall thickening occurs mainly in plants not adapted to the edaphoclimatic conditions in which they are being cultivated. Adverse environmental conditions induce phenological and physiological changes in plants to prevent water loss and improve the adaptation to the environment through the formation of support and defense structures. High temperatures accelerate cell metabolism and promote the utilization of nutrients from photosynthesis, mainly for cell wall component formation [11,33].
4.2. Chemical Composition Tendencies among “Bank” and “Low” Physiographic Position Grasses
The PCAs of the grasses’ chemical compositions at different cutting intervals and transition periods indicated that the first two PCs explained most of the data variability (70 and 69%, respectively) with a significant contribution of eleven variables (CP, ash, EE, TDN, DMD, ME, P, S, NDF, lignin, and HC). Similarly, both biplots showed that PC1 allowed us to separate the digestible fraction (CP, ash, EE, TDN, DMD, ME, P, and S) from the partial digestible or undigestible fraction (NDF, lignin, and HC). This separation indicates a positive association between the variables within each fraction and a negative correlation among the variables belonging to different fractions. Among the digestible components, DMD is positively correlated with potentially digestible chemical components such as CP, EE, TDN, and minerals present in the ash and corresponds to the proportion of plant material that can be digested by herbivores [11,34]. CP is rapidly degraded by ruminal microorganisms to increase the ammonia concentrations to favor microbial cell synthesis, while EE is degraded to produce energy due its caloric concentrations [12]. Likewise, TDN represents the utilizable energy content of a feedstuff, and its estimation relies on fractions like CP and EE, among others [35,36]. Regarding the indigestible fraction, the NDF, lignin, and HC variables correlate positively as these are components of the plant’s fibrous fraction that accumulate as it reaches maturity [24,37]. The inverse association between the variables belonging to the digestible and undigestible fractions occurs because the accumulation of the cell wall fibrous components reduces the ruminal digestibility of potentially digestible chemical components [33,37].
The biplots of the cutting interval and transition period PCAs (Figure 2 and Figure 3) showed that PC1 allowed us to differentiate the grass samples from the “low” and “bank” physiographic positions, in terms of biomass production and chemical composition. Although it was not possible to make a direct comparison between the studied pastures, since they were not the same species in both physiographic positions, a trend could be observed in which most of the “low” grasses (red dots) sampled at different ages and periods were associated with higher CP, ash, EE, TDN, DMD, ME, and P concentrations, whereas most of the “bank” grasses (blue dots) were characterized by high NDF, lignin, and HC content. The chemical composition variability observed between “bank” and “low” species can be attributed to the soil characteristics in each physiographic position. The “banks” are high and dry areas, with soils characterized by a sandy texture and low fertility; on the other hand, “low” soils present higher silt and clay content [10,13]. The “low” soils tend to flood and dry quickly after the rains, which leads to organic matter accumulation and greater nutrient availability to be assimilated by plants [23]. A study showed higher exchangeable bases (Ca2+, Mg2+, K), cation exchange capacity, phosphorus, copper, potassium, zinc, total nitrogen, and organic carbon content in lowland than “bank” soils [10]. The greater nutrient and water availability in the “low” physiographic position allowed the native flora to use them for their metabolism and development, which was reflected in a better chemical composition compared to species from the “bank” physiographic position [23].
4.3. Influence of Transition Periods on Grasses’ Chemical Compositions
In the PCA by transition period, better nutrient composition trends were observed in pastures growing during the rainy–dry transition period. A. zizanioides and P. versicolor contained higher CP, ash, EE, TDN, DMD, ME, and P concentrations. Some species, mainly from “low” physiographic positions (L. hexandra and H. amplexicaulis), also showed these characteristics, without any significant changes during both studied periods. Similarly, P. plicatulum, P. versicolor, Mulato, and U. humidicola were characterized by higher HC and Mg2+ content. Grasslands are highly sensitive to environmental conditions such as rainfall [35,38]. During the rainy–dry transition period, rains decline to a moderate level, which stimulates the grasses’ ecophysiological responses [39]. Moderate rainfall moistens the soil’s top layer, which allow the relatively shallow root systems of grasses to absorb water and improves the plants’ aerial tissue production and nutritional characteristics [9,40]. It was reported that tropical pastures like Megathyrsus maximus and several Urochloas spp. cultivars growing in the wet–dry transition period or in rainy periods presented higher crude protein and total digestible nutrient content and in vitro dry mass digestibility [9], as well as better performance in terms of plant height, total dry matter yields, leaf dry matter yields, and leaf area index [41].
The PCA by transition period also showed that pastures growing during the dry–rainy transition period were characterized by higher NDF, HC, ADF, and lignin content (Mulato, P. plicatulum, and A. zizanioides). Species like Paspalum sp. and U. humidicola presented high fiber concentrations in both periods. In the flooded savannah ecosystem, temperatures can reach above 40 °C during the dry periods [42], and, as mentioned before, plants subjected to these conditions for a long time accelerate their metabolism and display faster maturation and cell wall thickening to construct support structures that ensure their longevity [33,43].
4.4. Influence of Cutting Intervals on Grasses’ Chemical Compositions
In the PCA by cutting interval, better nutritional quality in young pastures was found. “Low” physiographic position grasses like A. zizanioides and H. amplexicaulis at 30 days produced the highest CP, ash, EE, TDN, DMD, ME, P, and S content, while L. hexandra did so steadily from 30 to 50 days, without drastic changes. High nutrient availability can be found in young pastures since they present a greater number of leaves and tender stems, whose tissues are made up of easily lysed cells with cytoplasmic content rich in highly digestible soluble constituents such as sugars, starches, protein, fat, pectins, etc., which can be used by ruminal microorganisms quickly [24]. L. hexandra presents further advantages since it can be used from 30 to 50 days, without major effects on its nutrient availability. These results agree with the optimal grazing ages recommended under tropical conditions for different Urochloa and Megathyrsus lines, which range between 21 and 42 days [44,45].
On the other hand, the PCA by cutting interval also showed that the 50-day-old P. plicatulum, A. compressus, and Paspalum sp. grasses presented the highest NDF, HC, and lignin levels. This behavior was also observed in Mulato and U. humidicola from an earlier age (40 days onwards). The forage cell wall (NDF) comprises several polysaccharides, including cellulose, hemicellulose, and pectins, as well as protein residues and a complex matrix of lignin. These fractions increase their concentrations in the cell wall as plants age. In the initial stage, the forage cell wall is made up of a primary wall where cellulose predominates. Over time, secondary cell wall thickening emerges, where more cellulose and hemicellulose are deposited. The final formation of the secondary thickening encourages the primary wall’s lignification, and the process continues over time until the secondary layer is reached [37]. The aforementioned process is accelerated under high-temperature conditions, where plants speed up their metabolic processes and make use of soluble carbohydrates for cell wall component formation. In this way, advanced-age grasses are characterized by low soluble cell content concentrations and high proportions of lignified fibrous components. The limiting factor is that lignin is undigestible, and its cross-linked association with potential degradable polysaccharides (cellulose, hemicellulose, and pectin) reduces their digestibility, affecting energy synthesis [24]. Old grasses also present higher proportions of stems, which are characterized by the presence of lignified tissues, which also contributes to reducing the grasses’ digestibility [37]. An important fact observed in the results is that introduced species presented faster fiber accumulation rates than native grasses under the studied ecosystem. This implies faster maturation rates and the fact that they should be used at earlier ages (<40 day) in animal nutrition, to avoid important losses in their chemical compositions.
In the PCA by cutting interval, it was also found that the A. compressus grass presented high DM throughout its growth; however, this grass was included within the samples with greater fibrous content, which is undesirable since its digestibility is affected [32]. Moreover, pastures such as Mulato showed high Ca2+ and Mg2+ concentrations during the experimental period, whereas the P. plicatulum grass did so only at 40 days. Mineral requirements vary frequently according to the animal’s growth phase and production levels. In these plants, the observed Ca2+ and Mg2+ concentrations (0.52 to 0.53 and 0.23 to 0.28%, respectively) are within the values required in growing and lactating cattle [46]. Proper Ca2+ levels maintain osmotic equilibrium, protein synthesis, muscle contraction, and other physiological activities [47], while adequate Mg2+ concentrations improve growth and reduce the risk of grass tetany and milk fever [48].
In general terms, this study showed that under floodplain savannah ecosystems, the productive performance and chemical composition of native grasses were similar to or even better than those of some introduced species. Likewise, it was observed that grasses from the “low” positions or growing during the rainy–dry transition periods and at 30-day cutting intervals were characterized by higher concentrations of easily digestible nutrients. Conversely, those grasses from the bank positions, growing during the dry–rainy transition period and with 50-day cutting intervals, accumulated greater fiber content, which compromised their digestibility. Native grasses like L. hexandra, H. amplexicaulis, A. zizanioides, and P. versicolor constitute promising feed alternatives for grazing animals as they performed well in terms of chemical composition and were the least affected by the studied transition periods and cutting intervals.
5. Conclusions
The nutritional and mineral composition variability of introduced and native grasses adapted to the floodplain ecosystem can be explained by eleven variables, including a digestible (CP, ash, EE, TDN, DMD, ME, P and S) and a partial digestible or undigestible fraction (NDF, lignin, and HC). “Low” physiographic position grasses presented a higher proportion of the digestible fraction, whereas “bank” species presented a higher concentration of the partial digestible or undigestible fraction.
Grasses growing in the rainy–dry transition period (L. hexandra, H. amplexicaulis, A. zizanioides, and P. versicolor) and those with a 30-day cutting interval (A. zizanioides, H. amplexicaulis, and L. hexandra) presented a greater digestible fraction. Meanwhile, grasses growing during the dry–rainy transition period (P. plicatulum, Mulato, A. zizanioides, Paspalum sp., U. humidicola) and with a 50-day cutting interval (P. plicatulum, A. compressus, Paspalum sp., Mulato, and U. humidicola) were characterized by the partial digestible or undigestible fraction.
The L. hexandra, H. amplexicaule, A. zizanioides, and P. versicolor native species present potential to feed grazing animals since they showed optimal chemical compositions and were the least affected by the studied cutting intervals and transition periods. Remarkable performance was found in L. hexandra, since it was not affected by any variable, suggesting that it can be used in any transition period and between 30 and 50 days without negative changes in its chemical composition. In the case of the introduced grasses (Mulato and U. humidicola), fiber accumulated in both transition periods after 40 days. This implies that under the studied ecosystem, these pastures need to be used between 30 and 40 days and under a technical management scheme to reduce the adverse environmental effect on its chemical composition.
This study is one of the first current reports that compares the chemical composition variability of grasses grown in different physiographic positions of the Colombian floodplain savannah, and it allows us to identify native grasses that constitute an important sustainable food resource for grazing livestock under the studied ecosystem. It is recommended to reinforce this type of study, including a greater number of forage species exposed to different technical management schemes (fertilization and irrigation), including animal trials, in order to evaluate animal consumption and performance.
Author Contributions
Conceptualization, writing—original draft, and writing—proofreading and editing, M.V.-T. and A.S.-C.; formal analysis, methodology, and research, M.V.-T. and A.S.-C.; writing—review and conceptualization, A.S.-C., O.M.V.-C., O.P.-L. and P.M.P.-C. All authors have read and agreed to the published version of the manuscript.
Funding
This research was funded by the Research Committee—CONADI (ID3156; ID3354)—of the Universidad Cooperativa de Colombia.
Institutional Review Board Statement
Not applicable, as the study did not involve humans or animals.
Informed Consent Statement
Not applicable.
Data Availability Statement
Data are available upon reasonable request to the first author.
Acknowledgments
The authors thank the auxiliary students who collaborated in the collection of field data, as well as the owner of the Villa Cristina farm. All persons included in this section have consented to the acknowledgements.
Conflicts of Interest
Author Otoniel Pérez-López was employed by the company Corporación Colombiana de Investigación Agropecuaria Villavicencio. The remaining authors declare that the research was conducted in the absence of any commercial or financial relationships that could be construed as a potential conflict of interest.
References
- Moscovici Joubran, A.; Pierce, K.M.; Garvey, N.; Shalloo, L.; O’Callaghan, T.F. Invited review: A 2020 perspective on pasture-based dairy systems and products. J. Dairy Sci. 2021, 104, 7364–7382. [Google Scholar] [CrossRef]
- Wróbel, B.; Zielewicz, W.; Staniak, M. Challenges of Pasture Feeding Systems—Opportunities and Constraints. Agriculture 2023, 13, 974. [Google Scholar] [CrossRef]
- Boval, M.; Dixon, R.M. The importance of grasslands for animal production and other functions: A review on management and methodological progress in the tropics. Animal 2012, 6, 748–762. [Google Scholar] [CrossRef]
- Paul, K.P.; Koge, J.; Maass, B.L.; Notenbaert, A.; Peters, M.; Groot, J.C.J.; Tittonell, P. Tropical forage technologies can deliver multiple benefits in Sub-Saharan Africa. A meta-analysis. Agron. Sustain. Devel. 2020, 40, 22. [Google Scholar] [CrossRef]
- Oosting, S.; van der Lee, J.; Verdegem, M.; De Vries, M.; Vernooij, A.; Bonilla-Cedrez, C.; Kabir, K. Farmed animal production in tropical circular food systems. Food Secur. 2022, 14, 273–292. [Google Scholar] [CrossRef]
- Peñuela, L.; Fernández, A.P.; Castro, F.; Ocampo, A. Uso y Manejo de Forrajes Nativos en la Sabana Inundable de la Orinoquia; Convenio de Cooperación Interinstitucional; The Nature Conservancy; Fundación Horizonte Verde; Fundación Biodiversidad de España & Corporación Autónoma Regional de la Orinoquia; Universidad de los Llanos: Villavicencio, Colombia, 2011. [Google Scholar]
- ICA. Instituto Colombiano Agropecuario. Censos Pecuarios Nacional. 2023. Available online: https://www.ica.gov.co/areas/pecuaria/servicios/epidemiologia-veterinaria/censos-2016/censo-2018 (accessed on 13 September 2023).
- Mora-Fernández, C.; Peñuela-Recio, L.; Castro-Lima, F. Estado del conocimiento de los ecosistemas de las sabanas inundables en la Orinoquia Colombiana. Rev. Orinoquia 2015, 19, 253–271. [Google Scholar] [CrossRef]
- Sousa Feitosa, O.; Costa Leite, R.; Alexandrino, E.; Saboia Pires, T.J.; Taverny de Oliveira, L.B.; Paula Neto, J.J.; Dos Santos, A.C. Forage performance and cattle production as a function of the seasonality of a Brazilian tropical region. Acta Scient. Anim. Sci. 2022, 44, e53779. [Google Scholar] [CrossRef]
- Salamanca-Carreño, A.; Vélez-Terranova, M.; Vargas-Corzo, O.M.; Pérez-López, O.; Castillo-Pérez, A.F.; Parés-Casanova, P.M. Relationship of Physiographic Position to Physicochemical Characteristics of Soils of the Flooded-Savannah Agroecosystem, Colombia. Agriculture 2023, 13, 220. [Google Scholar] [CrossRef]
- Salamanca-Carreño, A.; Vélez-Terranova, M.; Vargas-Corzo, O.M.; Parés-Casanova, P.M.; Bentez-Molano, J. Productive and Nutritional Characteristics of Native Grasses from the Floodplain Banks Ecosystem in the Colombian Orinoquia. Sustainability 2022, 14, 15151. [Google Scholar] [CrossRef]
- Vélez-Terranova, M.; Salamanca-Carreño, A.; Vargas-Corzo, O.M.; Parés-Casanova, P.M.; Arias-Landazábal, J.N. Chemical Composition and In Vitro Ruminal Fermentation Characteristics of Native Grasses from the Floodplain Lowlands Ecosystem in the Colombian Orinoquia. Animals 2023, 13, 2760. [Google Scholar] [CrossRef]
- Pérez Bona, R.A.; Vargas Corzo, O.M. Características de la Sabana Nativa y su Potencial de Producción Bovina en la Llanura Inundable de Arauca; Boleín Técnico N° 25; Programa Regional de Investigación Pecuaria, Corpoica: Arauca, Arauca, 2001. [Google Scholar]
- USDA. United States Department of Agriculture. Oxisols. In Soil Taxonomy. A Basic System of Soil Classification for Making and Interpreting Soil Surveys, 2nd ed.; Soil Survey Staff: Washington, DC, USA, 1999; Chapter 17; pp. 655–695. [Google Scholar]
- Rangel-Ch, J.O.; Celis, V. Suelos del territorio sabanas y humedales de Arauca, Colombia. In Col. Div. Biótica XX: Suelos Sabanas y Humedales de Arauca; Instituto de Ciencias Naturales, Universidad Nacional de Colombia: Bogotá, Colombia, 2019; pp. 171–197. [Google Scholar]
- Holdridge, L.R. Ecología Basada en Zonas de Vida; IICA Biblioteca Venezuela: San Jose de Costa Rica, Costa Rica, 1987; p. 216. [Google Scholar]
- Schweizer Lassaga, S. Muestreo y Análisis de Suelos Para Diagnóstico de Fertilidad; Instituto Nacional de Innovación y Transferencia en Tecnología Agropecuaria: San José, Costa Rica, 2011. [Google Scholar]
- UN. Universidad Nacional de Colombia, Orinoquía. Guía para el Usuario de los Servicios del Laboratorio de Suelos, Aguas y Foliares; Arauca, Colombia. 2021. Available online: https://bit.ly/3HiscdG (accessed on 14 September 2021).
- ICONTEC. Instituto Colombiano de Normas Técnicas y Certificación. Sistema Nacional de la Calidad. 2021. Available online: https://bit.ly/3P8u8ax (accessed on 14 September 2021).
- Cerdas, R. Programa de fertilización de forrajes. Desarrollo de un módulo práctico para técnicos y estudiantes de ganadería de Guanacaste, Costa Rica. InterSedes 2011, 12, 109–128. [Google Scholar]
- Ariza-Nieto, C.M.O.L.; Mojica, B.; Parra, D.; Afanador-Tellez, G. Use of LOCAL algorithm with near infrared spectroscopy in forage resources for grazing systems in Colombia. J. Near Infrared Spectr. 2018, 26, 44–52. [Google Scholar] [CrossRef]
- InfoStat. Software Estadistico, Versión 30/04/2020; Grupo InfoStat, FCA. Universidad Nacional de Córdoba: Córdoba, Argentina, 2020.
- Ocampo, A.; Peñuela, L. Manejo y nutrición en sabana inundable como eje de la producción y reproducción de la ganadería de cría. In Fortalecimiento Institucional y de Política Para Incrementar la Conservación de la Biodiversidad en Predios Privados en Colombia; Red Colombiana de Reservas Naturales de la Sociedad; Fundación Natura; World Wildlife Fund; The Nature Conservancy; Parques Nacionales Naturales de Colombia: Bogotá, Colombia, 2014. [Google Scholar]
- Reyes-Pérez, J.J.; Méndez-Martínez, Y.; Verdecia, D.M.; Luna-Murillo, R.A.; Hernández Montiel, L.G.; Herrera, R.S. Components of the yield and bromatological composition of three Brachiaria varieties in El Empalme area, Ecuador. Cuban J. Agricult. Sc. 2018, 52, 435–445. [Google Scholar]
- Meale, S.J.; Chaves, A.V.; Baah, J.; McAllister, T.A. Methane Production of Different Forages in In vitro Ruminal Fermentation. Asian-Aust. J. Anim. Sci. 2012, 25, 86–91. [Google Scholar] [CrossRef]
- Méndez-Martínez, Y.; Verdecia, D.M.; Reyes-Pérez, J.J.; Luna-Murillo, R.A.; Rivero-Herrada, M.; Montenegro-Vivas, L.B.; Herrera, R.S. Quality of three Megathyrsus maximus cultivars in the Empalme area, Ecuador. Cuban J. Agricult. Sci. 2018, 52, 423–433. [Google Scholar]
- Gaviria-Uribe, X.; Bolívar-Vergara, D.M.; Chirinda, N.; Molina-Botero, I.C.; Mazabel, J.; Barahona-Rosales, R.; Arango, J. In vitro methane production and ruminal fermentation parameters of tropical grasses and grass-legume associations commonly used for cattle feeding in the tropics. Livest. Res. Rural Devel. 2022, 34, 1–17. [Google Scholar]
- Cruz-Hernández, A.; Hernández-Garay, A.; Aranda-Ibañez, E.; Chay-Canul, A.; Márquez-Quiroz, C.; Rojas-Garcia, A.L.; Gómez-Vázquez, A. Nutritive value of Mulato grass under dierent grazing strategies. Esosist. Recur. Agropec. 2017, 4, 65–72. [Google Scholar] [CrossRef][Green Version]
- Cuadrado, H.; Torregroza, L.; Garcés, J. Producción de Carne con Machos de Ceba en Pastoreo de Pasto Híbrido Mulato y Brachiaria decumbens en el Valle del Sinú. MVZ-Córdoba 2005, 10, 573–580. [Google Scholar]
- Cruz Hernández, A.; Hernández Garay, A.; Chay Canul, A.J.; Mendoza Pedroza, S.I.; Ramírez Vera, S.; Rojas García, A.R.; Ventura Ríos, J. Components of the yield and nutritional value of Brachiaria humidicola cv Chetumal to different grazing strategies. Rev. Mex. Cienc. Agríc. 2017, 8, 599–610. [Google Scholar]
- Van Soest, P.J. Development of comprehensive system of feed analysis and its application to forages. J. Anim. Sc. 1967, 26, 119–128. [Google Scholar] [CrossRef]
- Leng, R.A. Evaluation of Tropical Feed Resources for Ruminant Livestock; Tropical Feeds and Feeding Systems; FAO: Rome, Italy, 1995; Available online: https://www.fao.org/ag/aga/agap/frg/econf95/pdf/evalu.pdf (accessed on 20 September 2022).
- Lee, M.A. A global comparison of the nutritive values of forage plants grown in contrasting environments. J. Plant Res. 2018, 131, 641–654. [Google Scholar] [CrossRef] [PubMed]
- Mlay, P.S.; Pereka, A.; Phiri, E.; Balthazary, S.; Igusti, J.; Hvelplund, T.; Weisbjerg, M.R.; Madsen, J. Feed value of selected tropical grasses, legumes and concentrates. Veterinarski Arhiv 2006, 76, 53–63. [Google Scholar]
- Jayanegara, A.; Ridla, M.; Nahrowi; Laconi, E.B. Estimation and validation of total digestible nutrient values of forage and concentrate feedstuffs. IOP Conf. Series: Mater. Sci. Engin. 2019, 546, 1–5. [Google Scholar] [CrossRef]
- Horne da Cruz, C.; Alvarenga Santos, S.; Pinto de Carvalho, G.G.; Gomes Azevedo, J.A.; Detmann, E.; Valadares Filho, S.C.; Silva Mariz, L.D.; Sales Pereira, E.; Carvalho Nicory, I.M.; Libânio Tosto, M.S.; et al. Estimating digestible nutrients in diets for small rumiants fed with tropical forages. Livest. Sci. 2021, 249, 104532. [Google Scholar] [CrossRef]
- Harper, K.J.; McNeill, D.M. The Role iNDF in the Regulation of Feed Intake and the Importance of Its Assessment in Subtropical Ruminant Systems (the Role of iNDF in the Regulation of Forage Intake). Agriculture 2015, 5, 778–790. [Google Scholar] [CrossRef]
- Jayasinghe, P.; Ramilan, T.; Donaghy, D.J.; Pembleton, K.G.; Barber, D.G. Comparison of Nutritive Values of Tropical Pasture Species Grown in Different Environments, and Implications for Livestock Methane Production: A Meta-Analysis. Animals 2022, 12, 1806. [Google Scholar] [CrossRef]
- Bogale, S.; Melaku, S.; Yami, A. Influence of rainfall pattern on grass/legume composition and nutritive value of natural pasture in Bale Highlands of Ethiopia. Livest. Res. Rural Develop 2008, 20. Available online: http://www.lrrd.org/lrrd20/3/boga20038.htm (accessed on 20 September 2022).
- Gherardia, L.A.; Sala, O.E. Enhanced precipitation variability decreases grass- and increases shrub-productivity. Proc. Nat. Acad. Sci. USA 2015, 112, 12735–12740. [Google Scholar] [CrossRef]
- Garay, J.R.; Joaquin-Cancino, S.; Zárate-Fortuna, P.; Ibarra-Hinojosa, M.A.; Martínez-González, J.C.; González-Dávila, R.P.; Cienfuegos-Rivas, E.G. Dry matter accumulation and crude protein concentration in Brachiaria spp. cultivars in the humid tropics of Ecuador. Trop. Grasslands-Forrajes Tropicales 2017, 5, 66–76. [Google Scholar] [CrossRef]
- Ramos-Montaño, C.; García-Conde, M.R. Características Ecosistémicas asociadas a la actividad ganadera en Arauca (Colombia): Desafíos frente al cambio climático. Orinoquia 2016, 20, 28–38. [Google Scholar] [CrossRef]
- Melo, C.D.; Maduro Dias, C.S.A.M.; Wallon, S.; Borba, A.E.S.; Madruga, J.; Borges, P.A.V.; Ferreira, M.T.; Elias, R.B. Influence of Climate Variability and Soil Fertility on the Forage Quality and Productivity in Azorean Pastures. Agriculture 2022, 12, 358. [Google Scholar] [CrossRef]
- Fonseca-Pereira, G.; Emerenciano-Neto, J.V.; dos Santos-Difante, G.; Cortes-Assis, L.C.S.L.; de Oliveira- Lima, P. Morphogenic and structural characteristics of tropical forage grasses managed under different regrowth periods in the Brazilian semi-arid region. Semina: Ciênc. Agrá. 2019, 40, 283–292. [Google Scholar]
- Mwendia, S.W.; Ohmstedt, U.; Nyakundi, F.; Notenbaert, A.; Peters, P. Does harvesting Urochloa and Megathyrsus forages at short intervals confer an advantage on cumulative dry matter yields and quality? J. Sci. Food Agric. 2022, 102, 750–756. [Google Scholar] [CrossRef] [PubMed]
- Suttle, N.F. Mineral Nutrition of Livestock, 4th Edition. 2010. Available online: http://www.ucv.ve/fileadmin/user_upload/facultad_agronomia/Producion_Animal/Minerals_in_Animal_Nutrition.pdf (accessed on 3 September 2023).
- Liu, J.; Duan, C.; Zhang, X.; Zhu, Y.; Lu, X. Potential of Leersia hexandra Swartz for phytoextraction of Cr from soil. J. Hazard. Mater. 2011, 188, 85–91. [Google Scholar] [CrossRef] [PubMed]
- Pinotti, L.; Manoni, M.; Ferrari, L.; Tretola, M.; Cazzola, R.; Givens, I. The Contribution of Dietary Magnesium in Farm Animals and Human Nutrition. Nutrients 2021, 13, 509. [Google Scholar] [CrossRef]


Disclaimer/Publisher’s Note: The statements, opinions and data contained in all publications are solely those of the individual author(s) and contributor(s) and not of MDPI and/or the editor(s). MDPI and/or the editor(s) disclaim responsibility for any injury to people or property resulting from any ideas, methods, instructions or products referred to in the content. |
© 2023 by the authors. Licensee MDPI, Basel, Switzerland. This article is an open access article distributed under the terms and conditions of the Creative Commons Attribution (CC BY) license (https://creativecommons.org/licenses/by/4.0/).