Data Management for Environmentally Sustainable and Profitable Business: Evidence from the Food Retail Industry
Abstract
:1. Introduction
2. Literature Review
3. Methods
4. Data Management
4.1. Data Management Framework
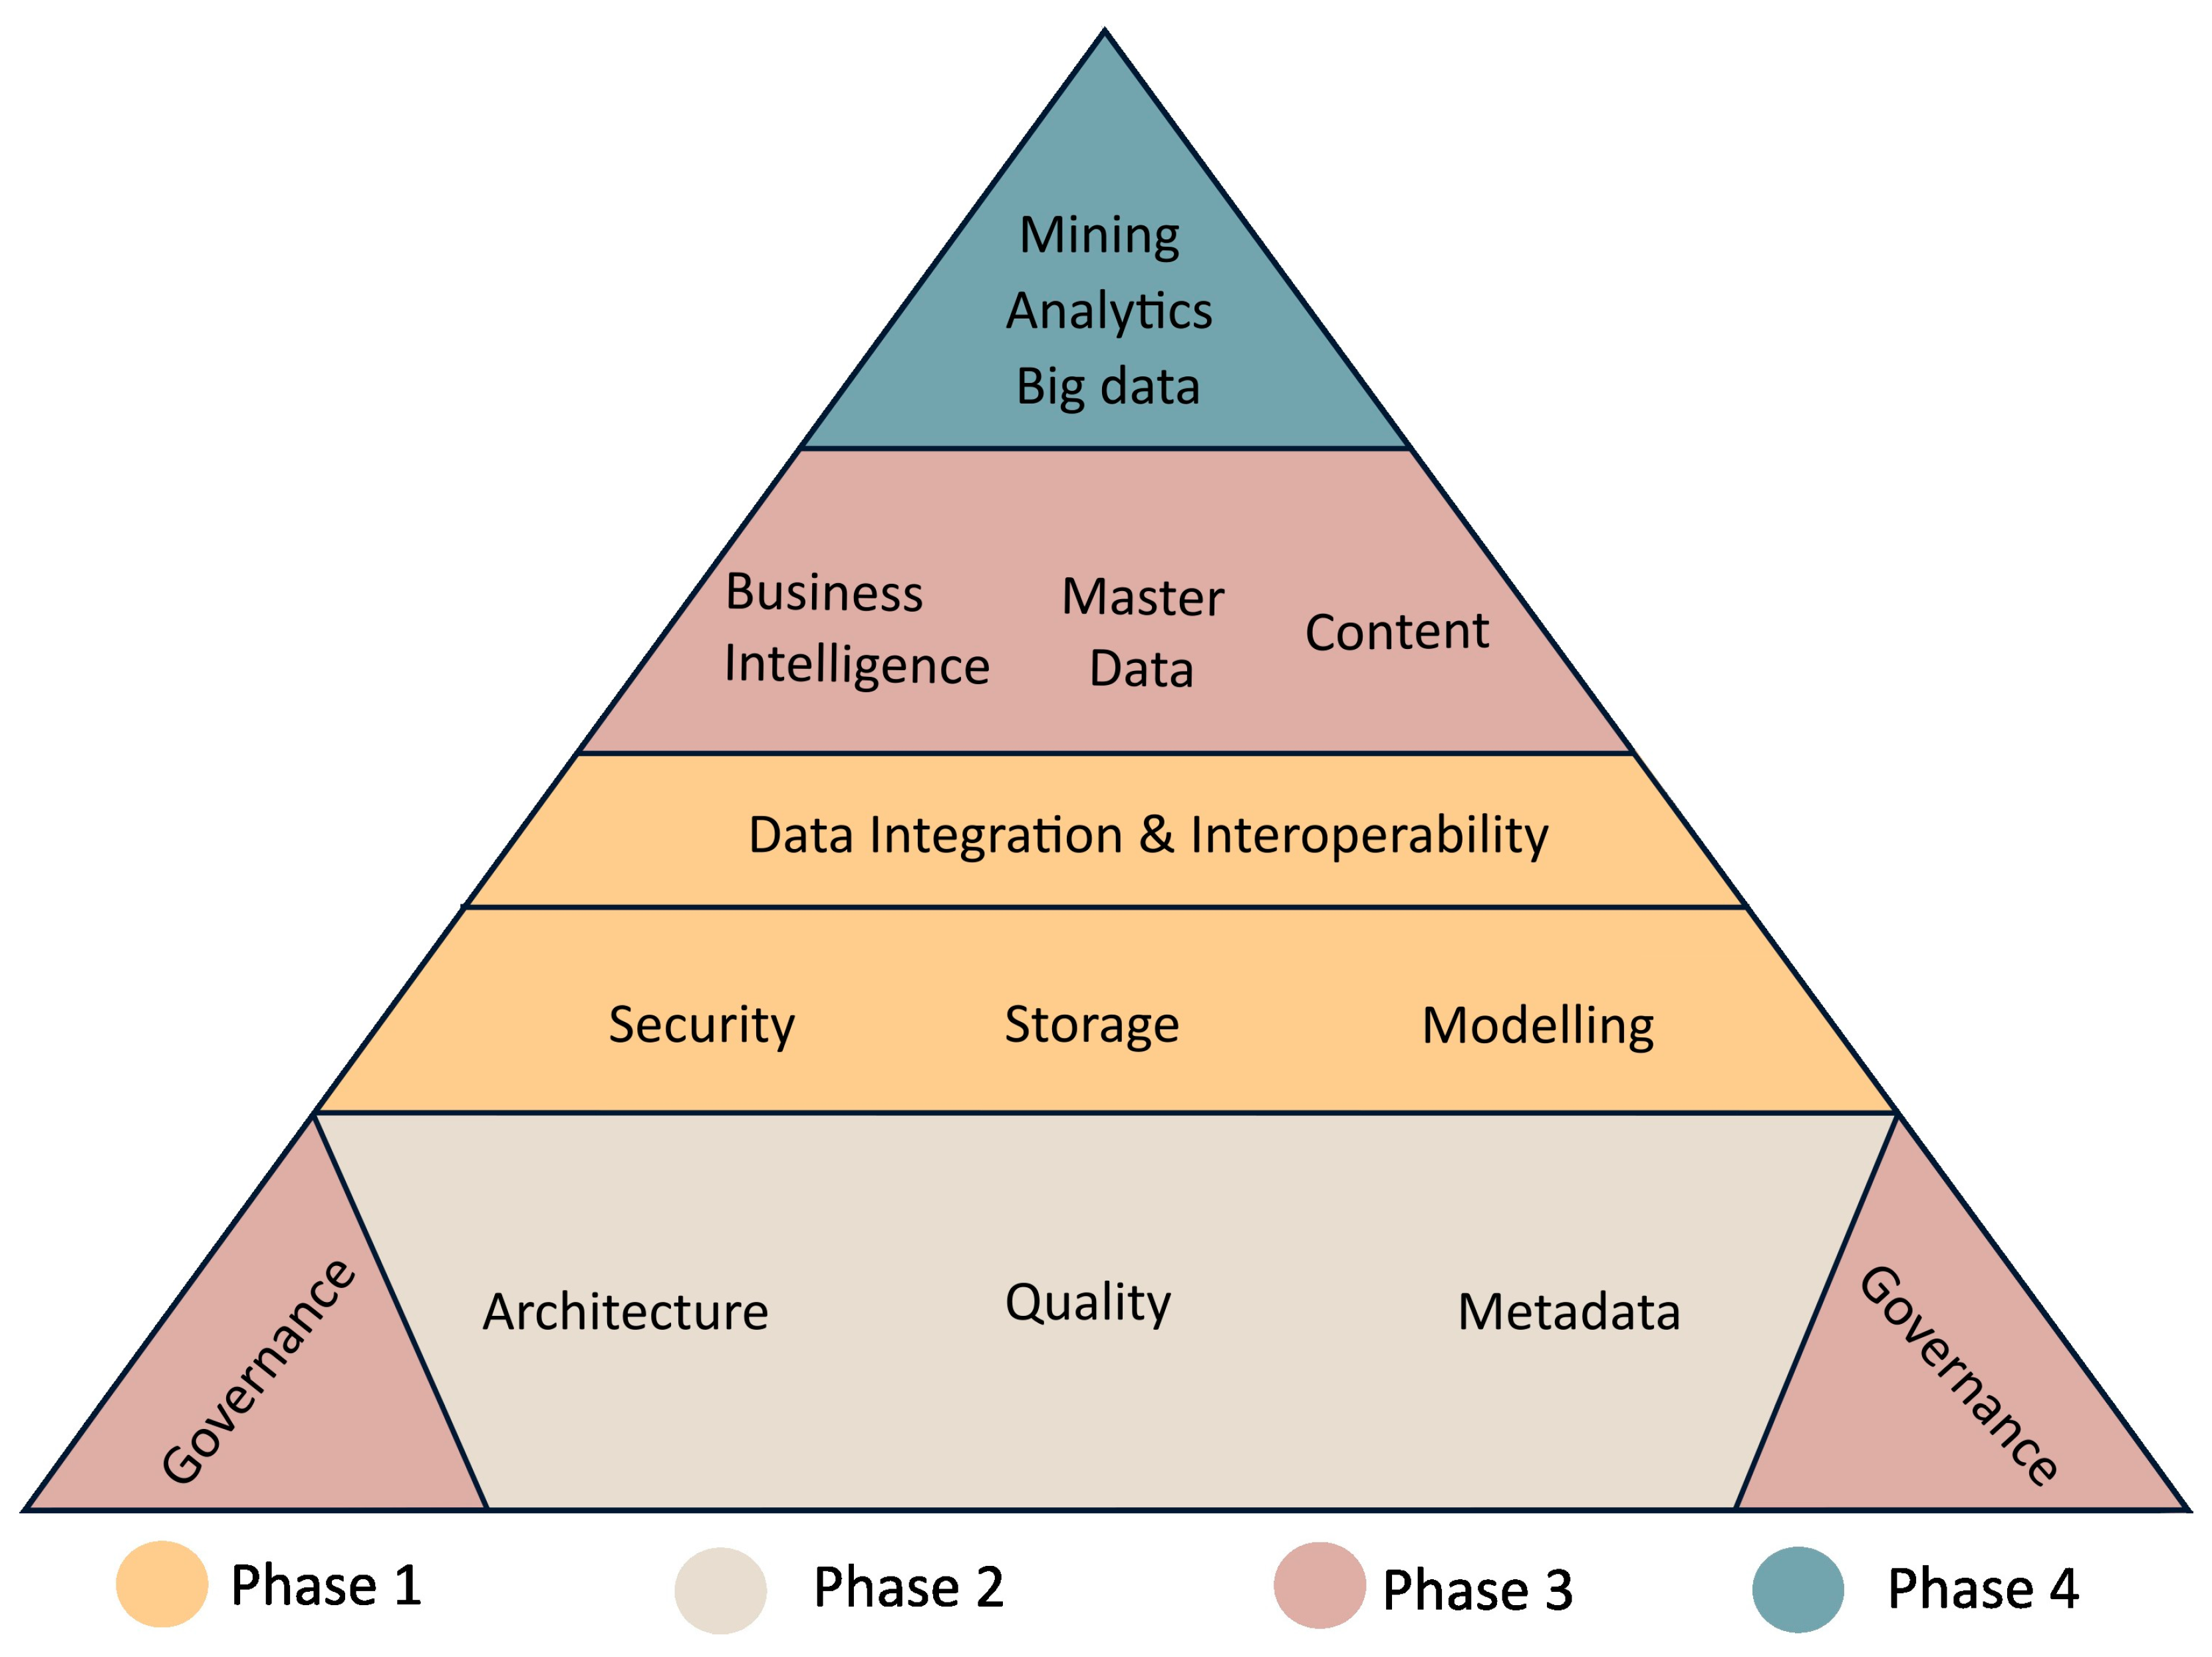
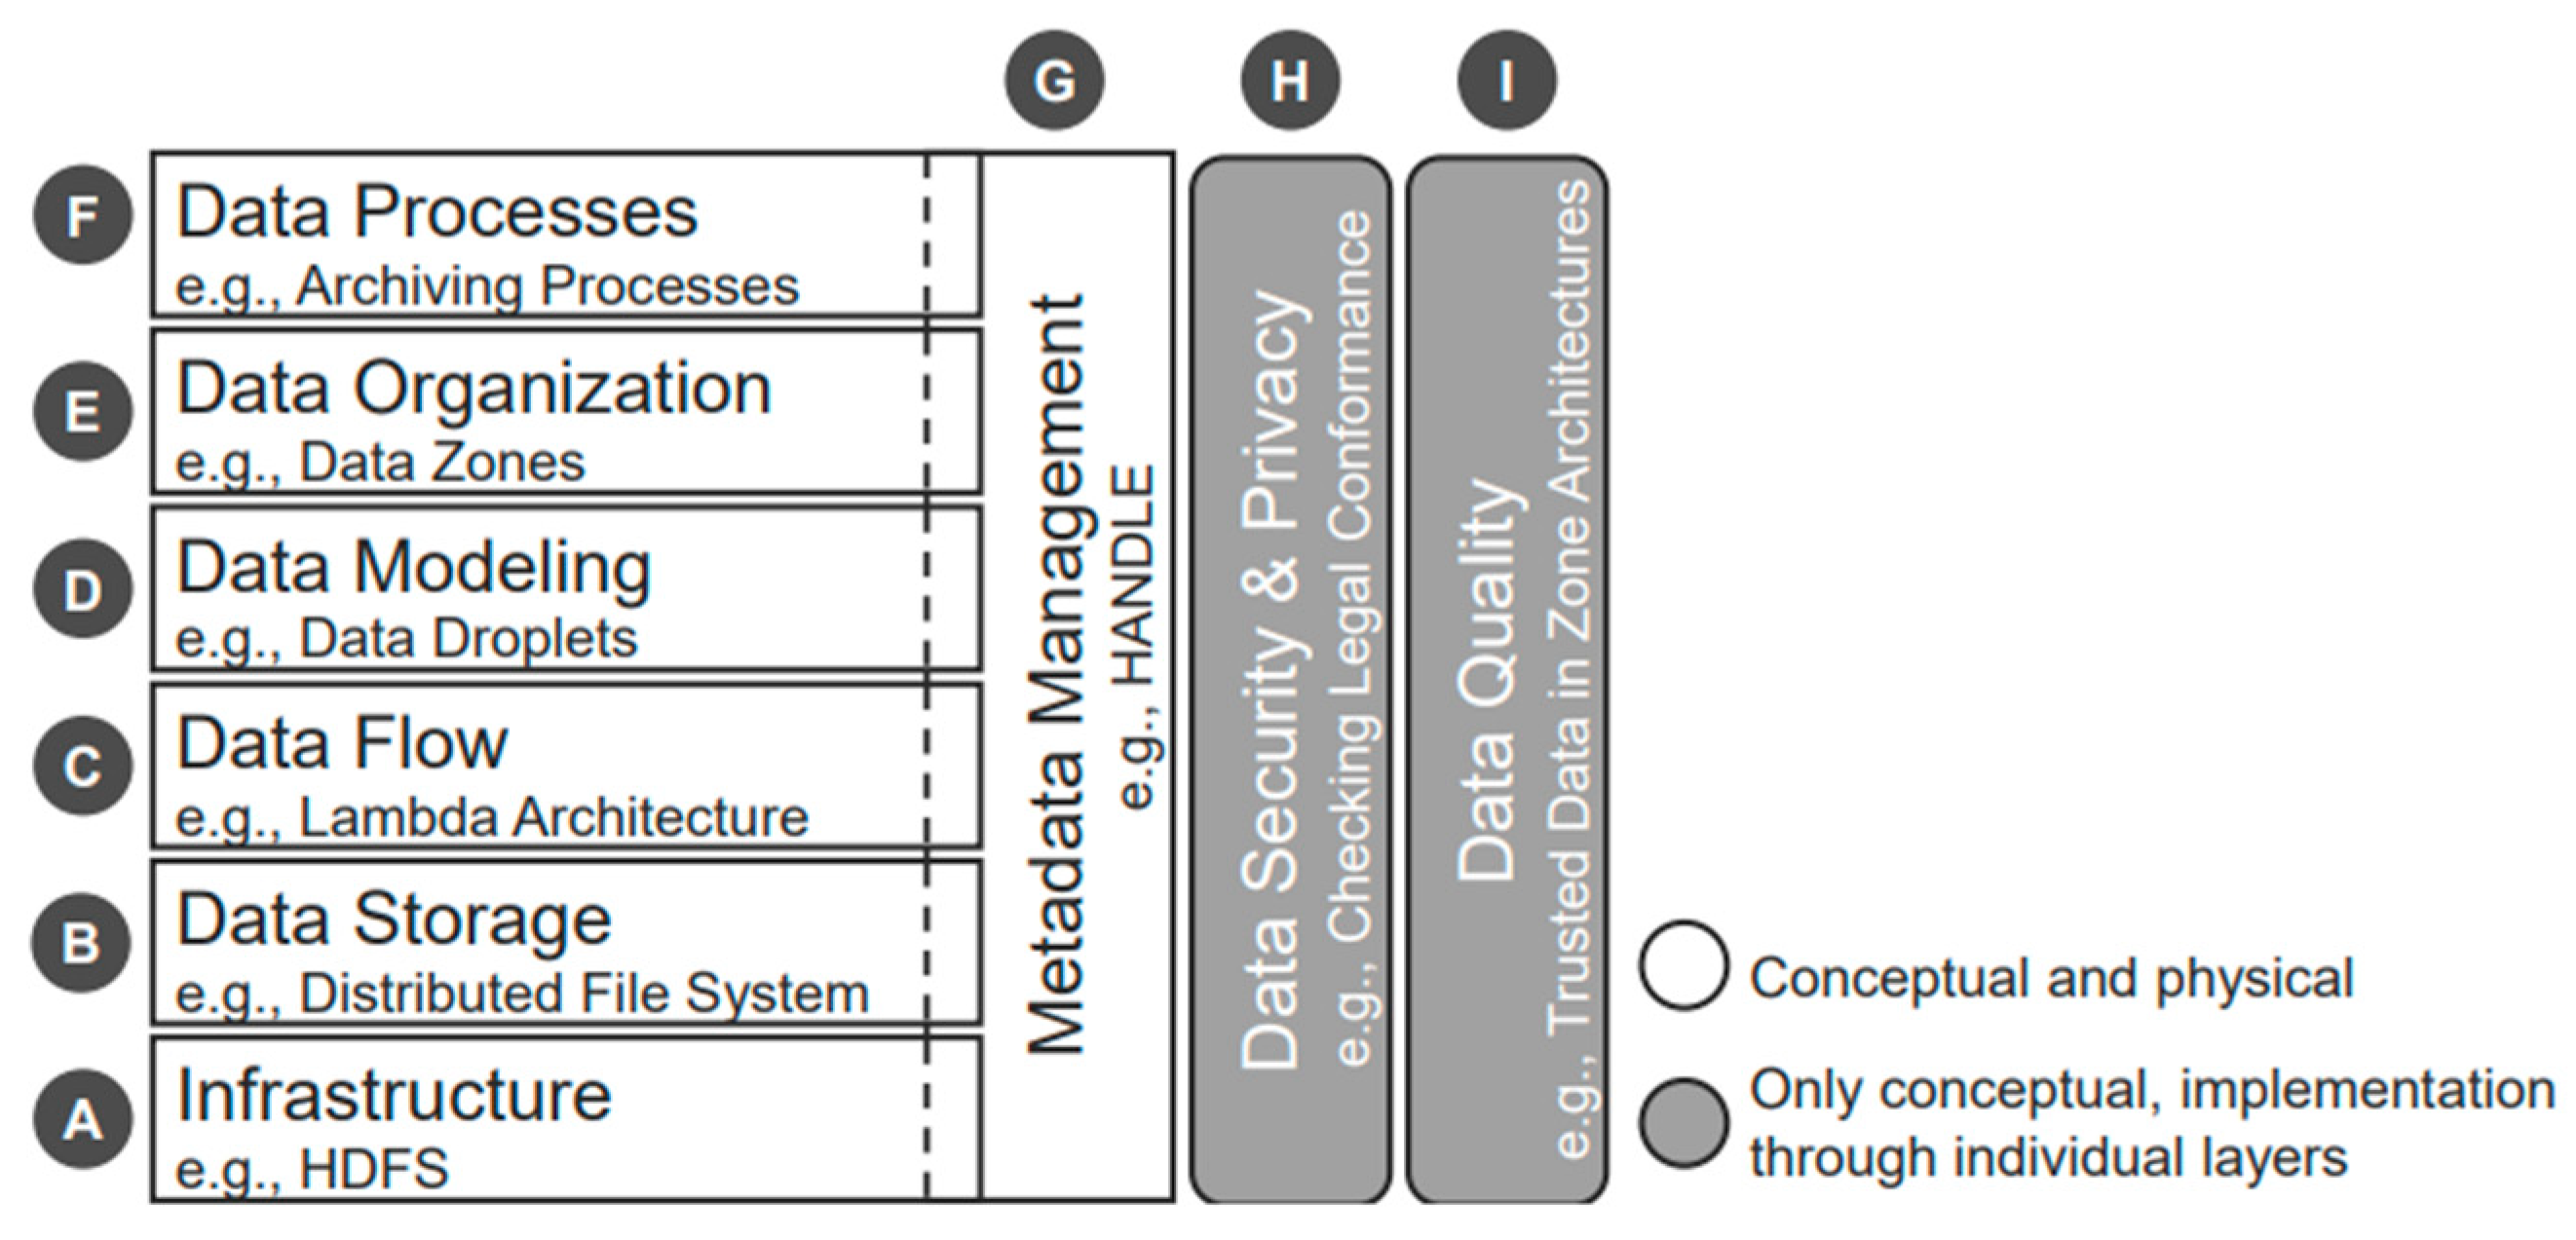
- Data Governance: It administers data management and gives instructions by creating a system that includes decision rights over data that is defined by the enterprise.
- Data Architecture: It determines the plan and maintains data assets by aligning with the company’s overall strategy to establish strategic data details and designs that satisfy these details.
- Data Modeling and Design is the process of identifying, reviewing, describing, and conveying data details in a specific form called the data model.
- Data Storage and Operations: It includes the design, implementation, and direction of stored data to maximize its value. Moreover, the operations reinforce the data lifecycle from planning to disposal.
- Data Security: It guarantees that data security and confidentiality are correctly maintained, and that data can only be accessed by authorized people.
- Data Integration and Interoperability: It consists of the processes related to the direction and mixture of data within and between data stores, organizations, and applications.
- Document and Content Management: It involves managing different kinds of files and documentation that are important to the company, especially the legal and compliance documents.
- Reference: It involves the continuous reconciliation and maintenance of crucial and imperative shared data to make certain that data are consistent, accurate, relevant, and timely across the system of all business entities.
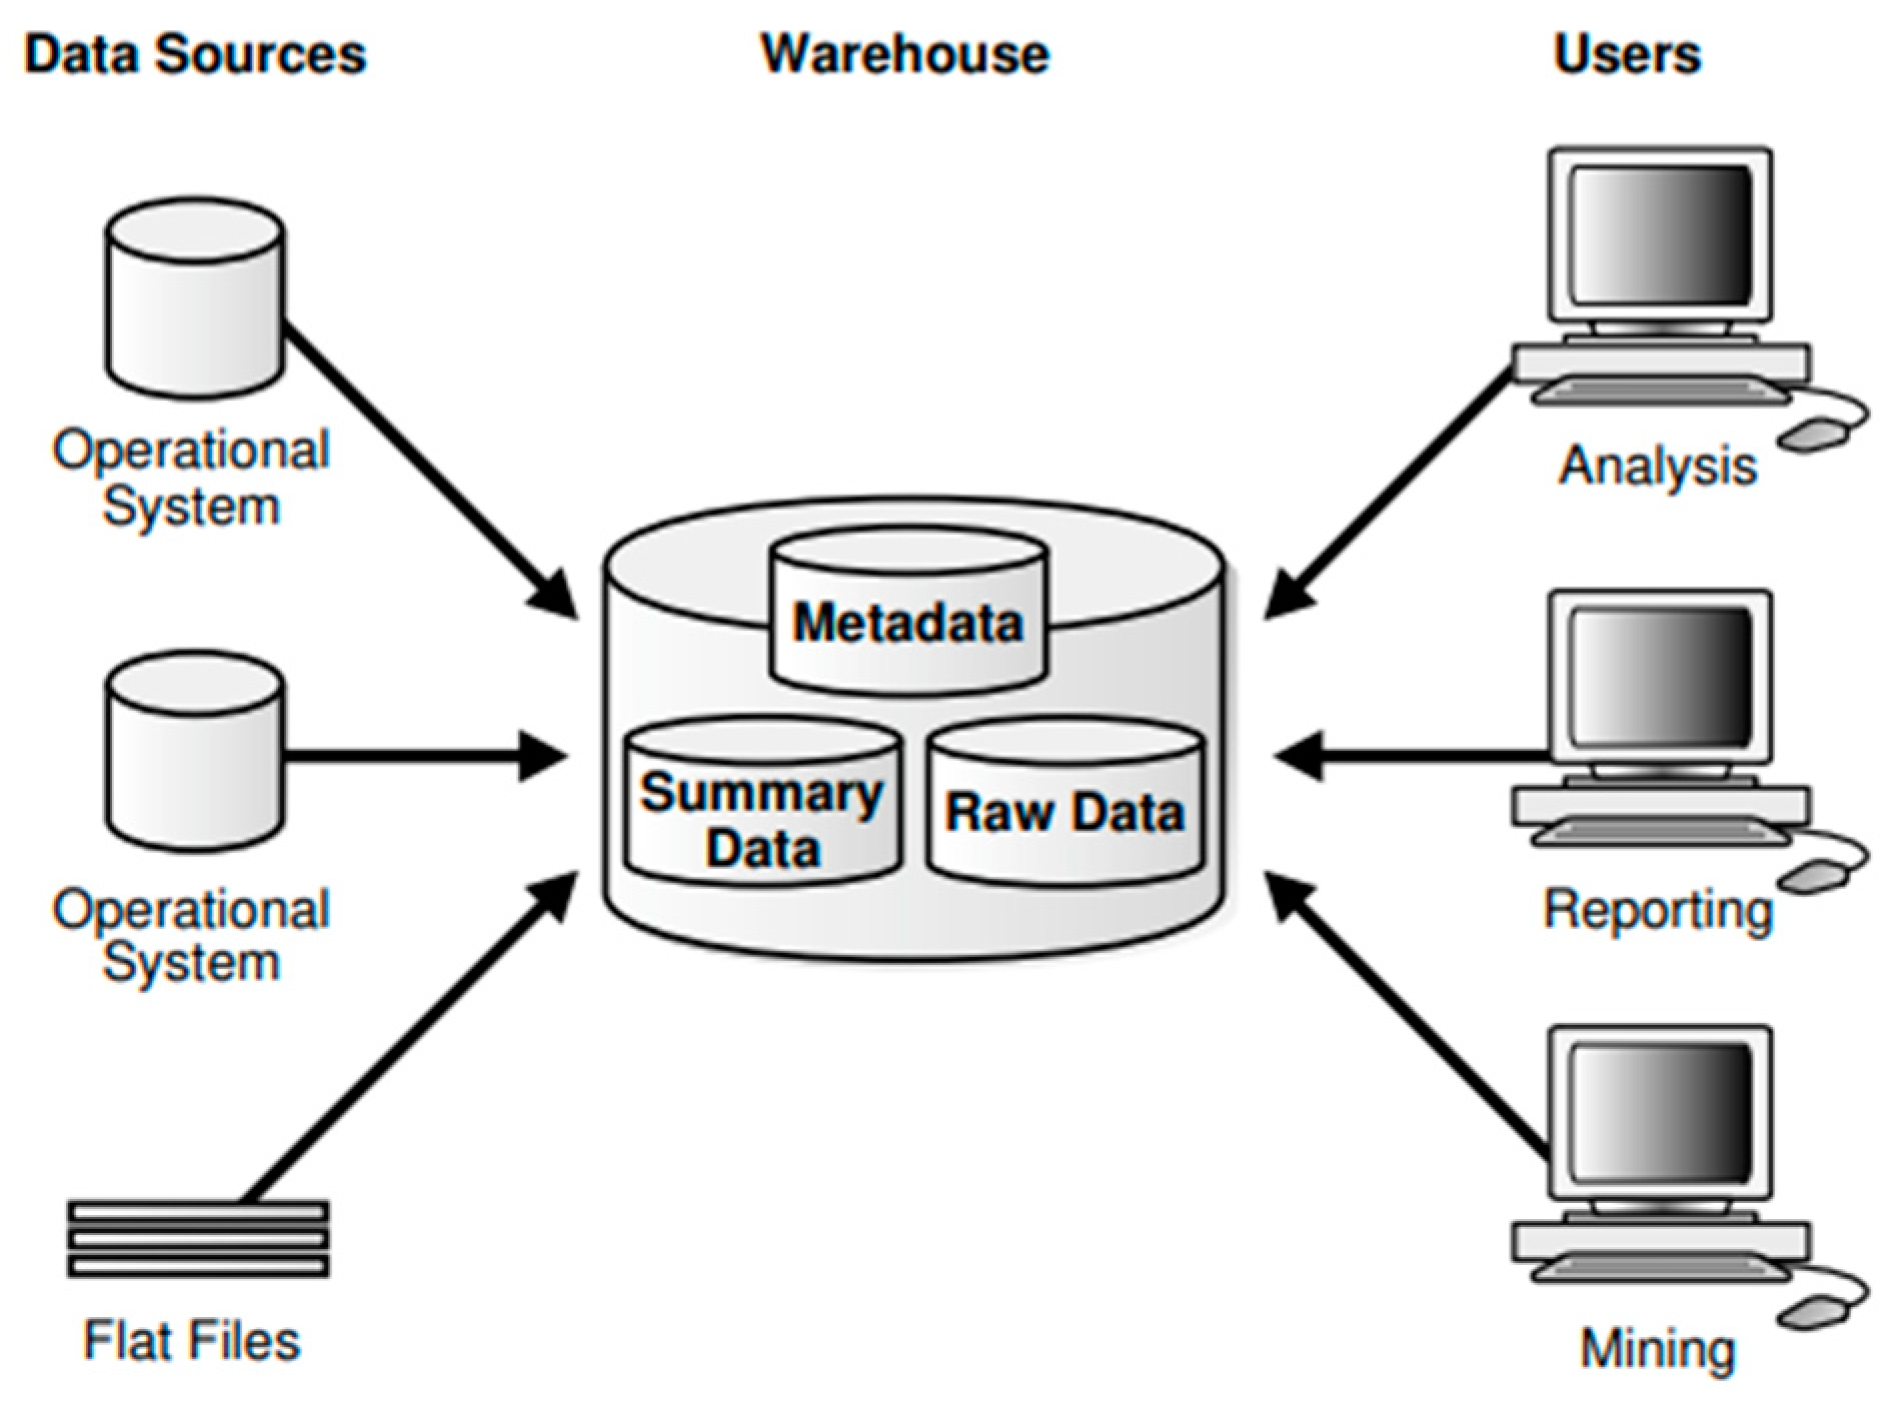
- Data Warehousing and Business Intelligence: It involves planning, implementing, and controlling processes of data that enforce decisions and make sure stakeholders are given value from data by reporting and interpreting.
- Metadata: It includes planning, implementing, and controlling activities to permit the attainability of integrated and high-quality metadata that involves description, models, data flows, and any other essential details to recognize systems and data.
- Data Quality: It consists of planning and implementing quality management techniques to assess, measure, and improve the appropriateness of required data within the organization.
4.2. Data Management Tools and Roles
4.2.1. Data Mart
4.2.2. Data Warehouse
4.2.3. Data Lake
4.2.4. The Future of Delta Lake
4.3. Data Strategy and Culture
4.4. Data Analysis
5. Results
5.1. How Can We Strategically Use Customers’ Demand Data to Identify Ways to Reduce the Causes of Emission?
- CHAID: https://pypi.org/project/CHAID/ (accessed on 1 March 2023)
- Orca: https://pypi.org/project/orca/ (accessed on 1 March 2023)
- Graphviz: https://pypi.org/project/graphviz/ (accessed on 1 March 2023)
- Plotly: https://pypi.org/project/plotly/ (accessed on 1 March 2023)
- Pandas: https://pypi.org/project/pandas/ (accessed on 1 March 2023)
- Statsmodels: https://pypi.org/project/statsmodels/ (accessed on 1 March 2023)
- Import libraries and the data source;
- Data preparation with pandas;
- Transform and visualize numeric variables;
- Implement CHAID for each attribute (e.g., organic or plastic bag);
- Visualize and generate the decision-tree images.
- Only 3.5% is organic meat and poultry, and if it is not in the meat and poultry category, then it is likely to use plastic bags, though it accounts for around 5%. This means that only a small percentage of customers buy organic food, and if they do not choose organic food, then it is likely that customers buy products that have plastic. Therefore, business leaders can prioritize promoting organic food (Figure A1).
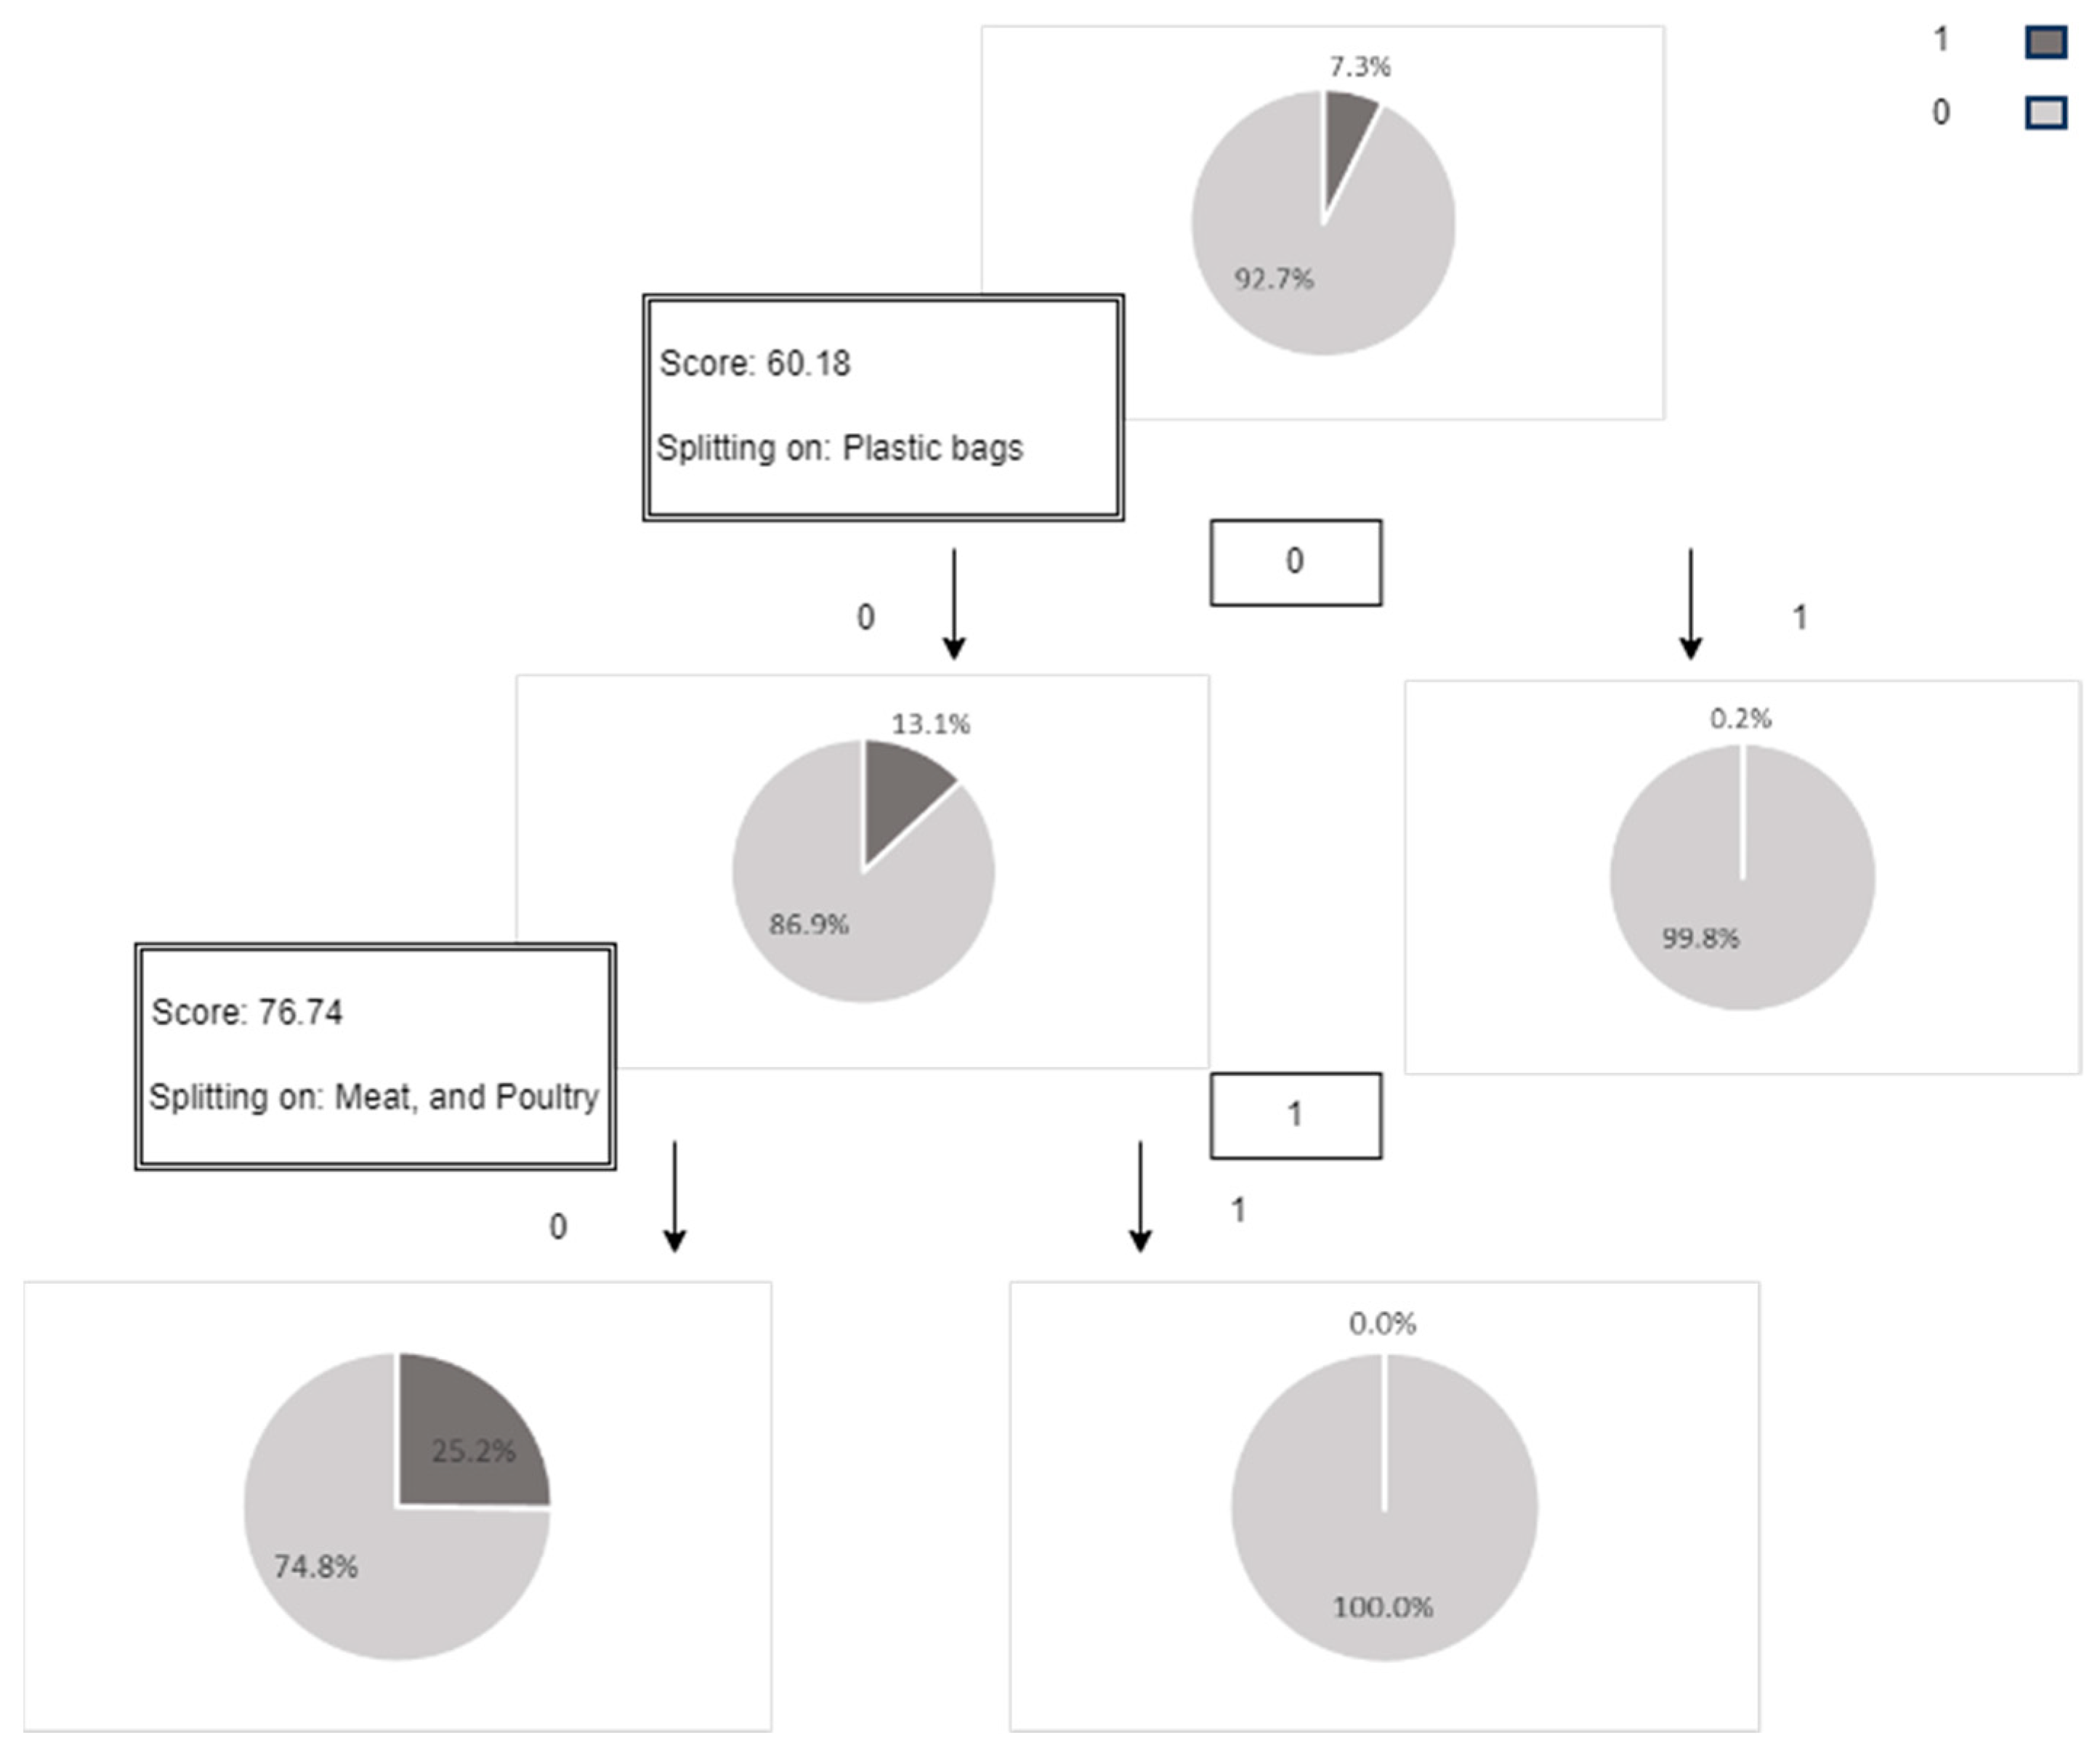
- Only around 7% of purchased plant-based foods need plastic bags, and around 25% of purchases are not of meat and poultry products. This implies that business leaders can prioritize innovation to replace plastic used for plant-based food so that customers buy plant-based food that is completely environmentally friendly (Figure A2).
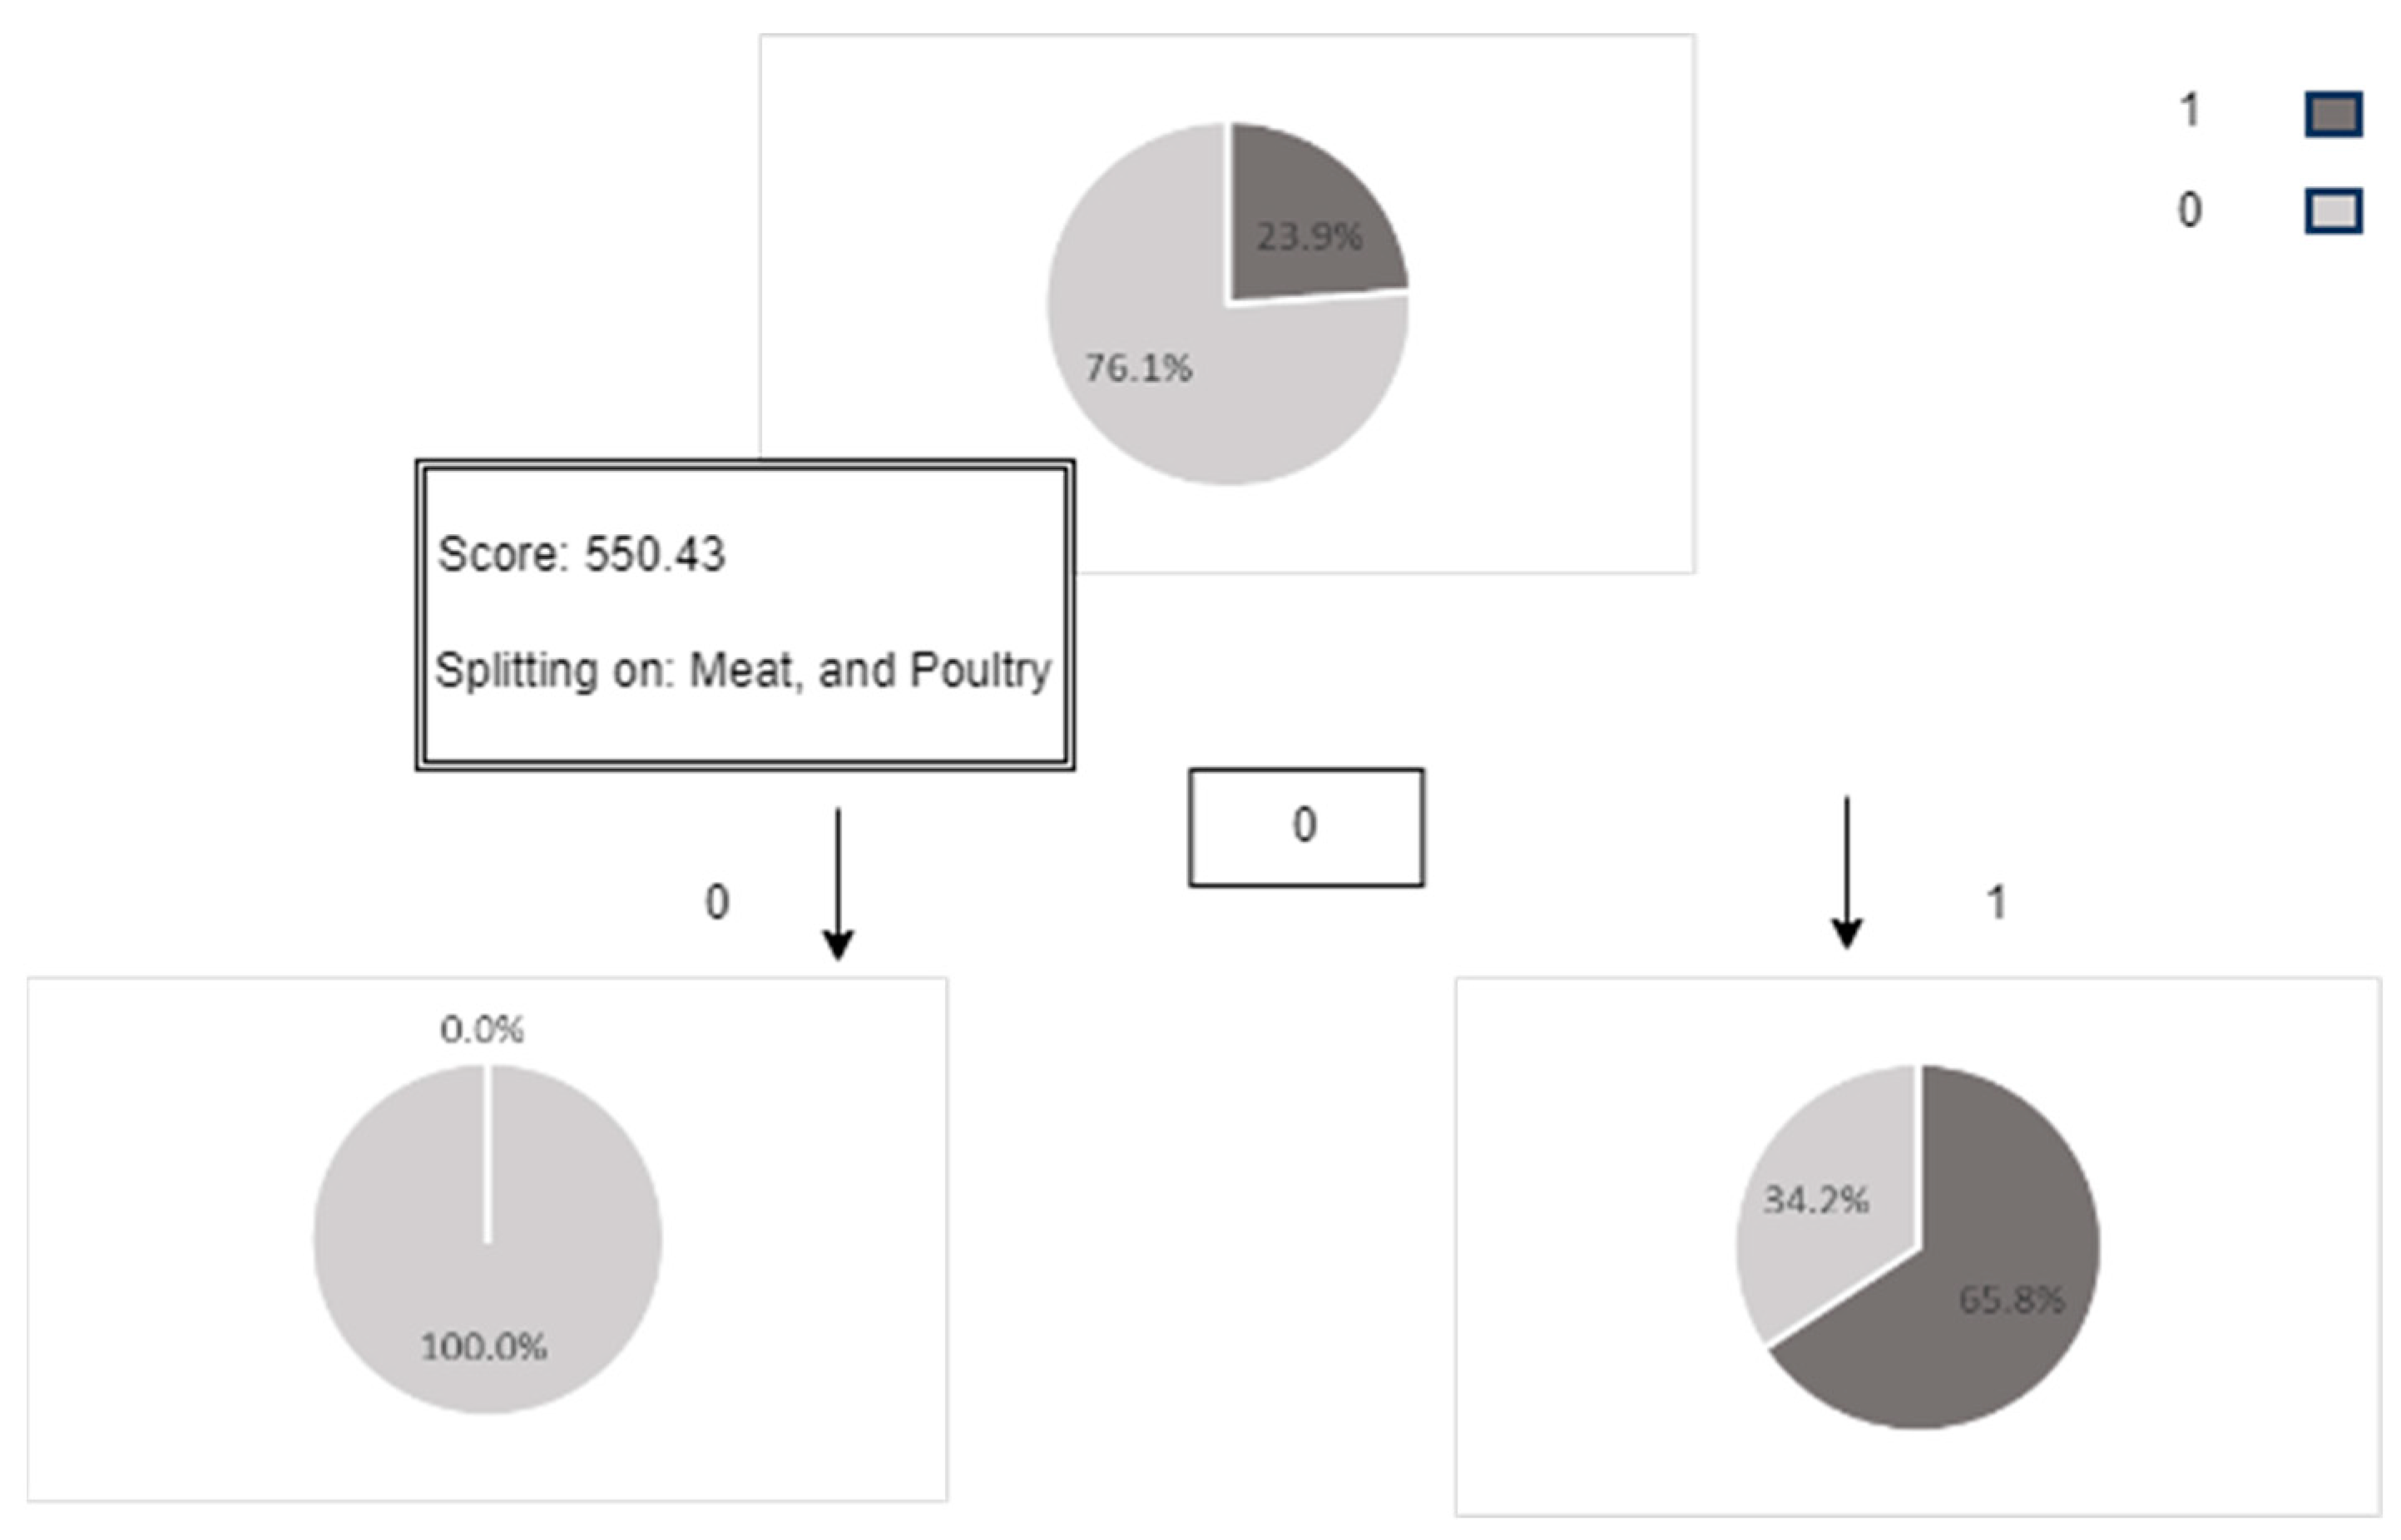
- More than 65% of the canned food purchased is meat or poultry products. This suggests that most purchased meat and poultry products are not fresh or sustainable. Hence, business leaders can explore means to innovate and replace the use of cans for meat and poultry products or start promoting fresh meat and poultry products (Figure A3).
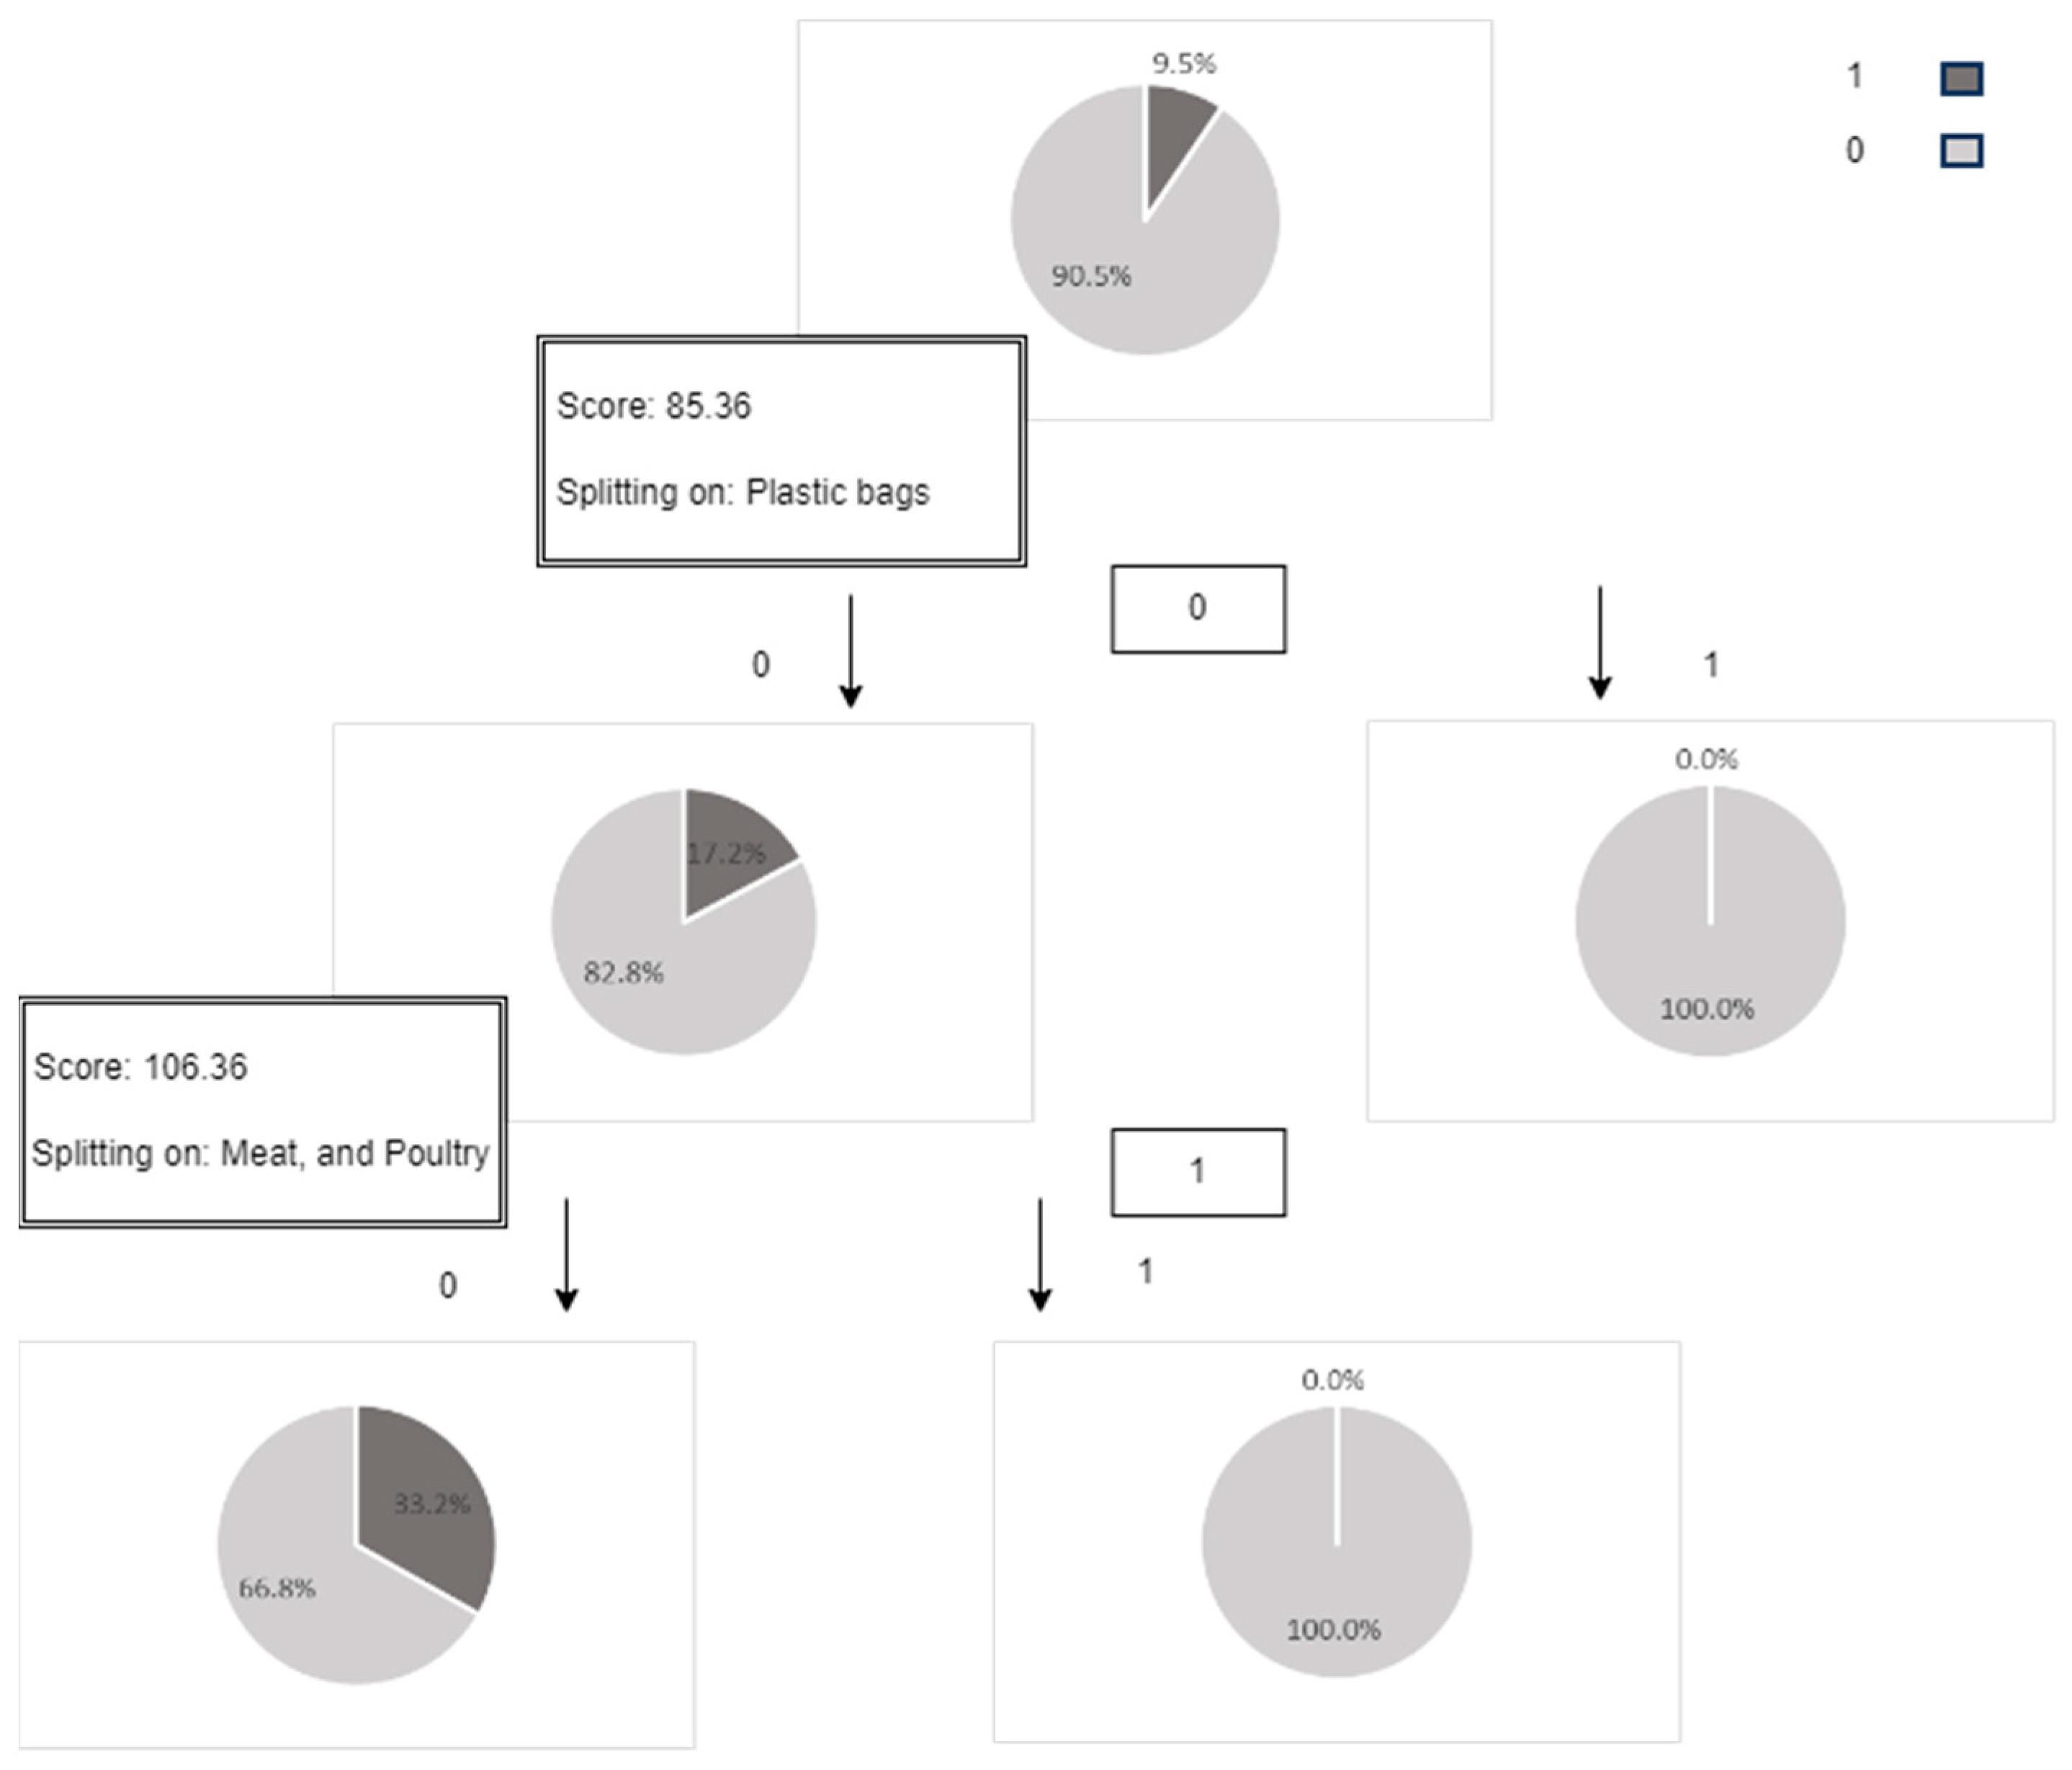
- Products that use jars do not need plastic. However, around 33% of products purchased in jars are not meat and poultry products. This indicates that business leaders can concentrate on innovating substitutes for jars that are suitable for products other than meats, which could lessen the complexity of innovation and uncover possible ways to reduce costs (Figure A4).
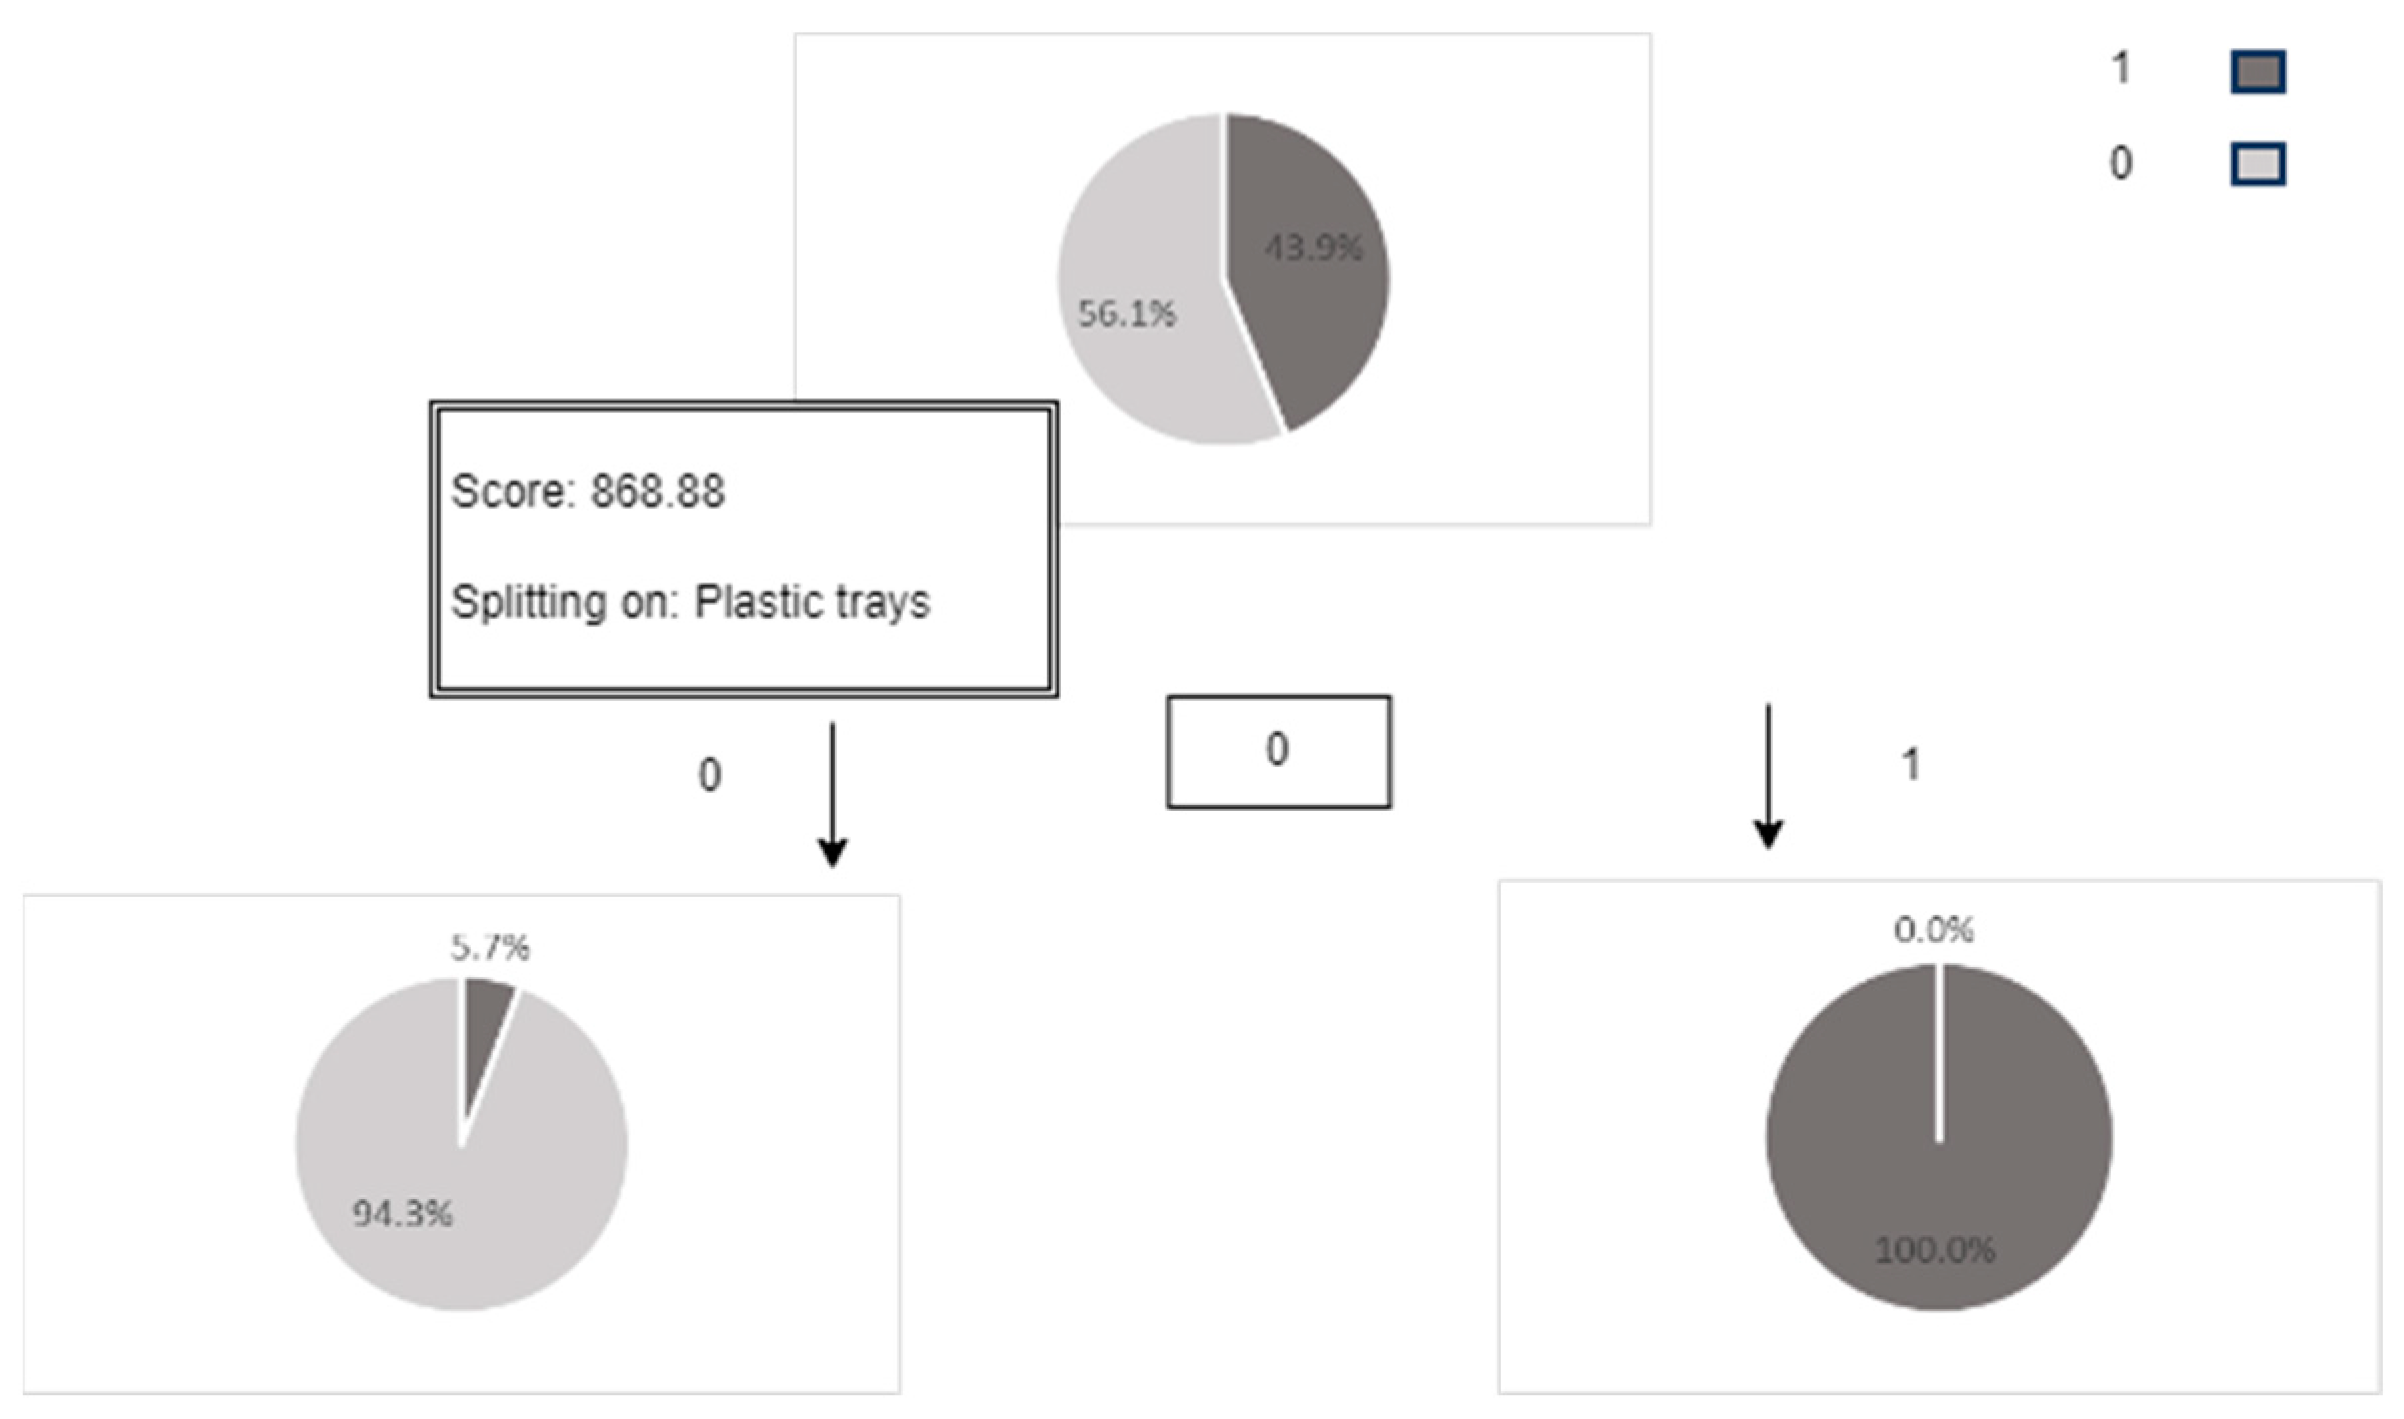
- Around 92% of purchased products that use plastic trays (e.g., fresh chicken trays) also need plastic covers. Obviously, the percentage of products bought that use plastic surpasses other materials. Therefore, business leaders can prioritize innovating materials that substitute plastic, which is cheaper and environmentally sustainable, while promoting fresh products that use plastic such as vegetables, fruits, and chicken, which are the most frequently purchased (Figure A5).
- Only 5% of purchased products that use plastic covers do not need plastic trays. This denotes that while the percentage of purchased products that need plastic is high, business leaders can prioritize exactly the type of plastic that needs to be replaced by more environmentally sustainable and cost-effective materials that would make the most impact sooner (Figure A6).
- Purchases that need plastic bags are likely to be fresh vegetables and fruits, and more than 97% of them also need plastic trays. However, if the purchase does not need plastic trays, then the quantity of the products is the reason for needing plastic bags. This re-emphasizes the previous interpretation that there is a correlation between buying fresh products and using lots of plastic bags, which again clarifies investing in research and innovation is valuable since it yields better sustainable solutions and more profits (Figure A7).
- Pandas: https://pypi.org/project/pandas/ (accessed on 9 March 2023)
- SKlearn: https://pypi.org/project/sklearn3/ (accessed on 9 March 2023)
- Import libraries and the data source;
- Data preparation (removing transaction ID, or NAN) and transforming string variables;
- Isolate dependent and independent variables;
- Split data into testing and training sets;
- Implement the random forest;
- Test and train predictions and compare the means;
- Implement the confusion matrix;
- Visualize the last result with feature importance.
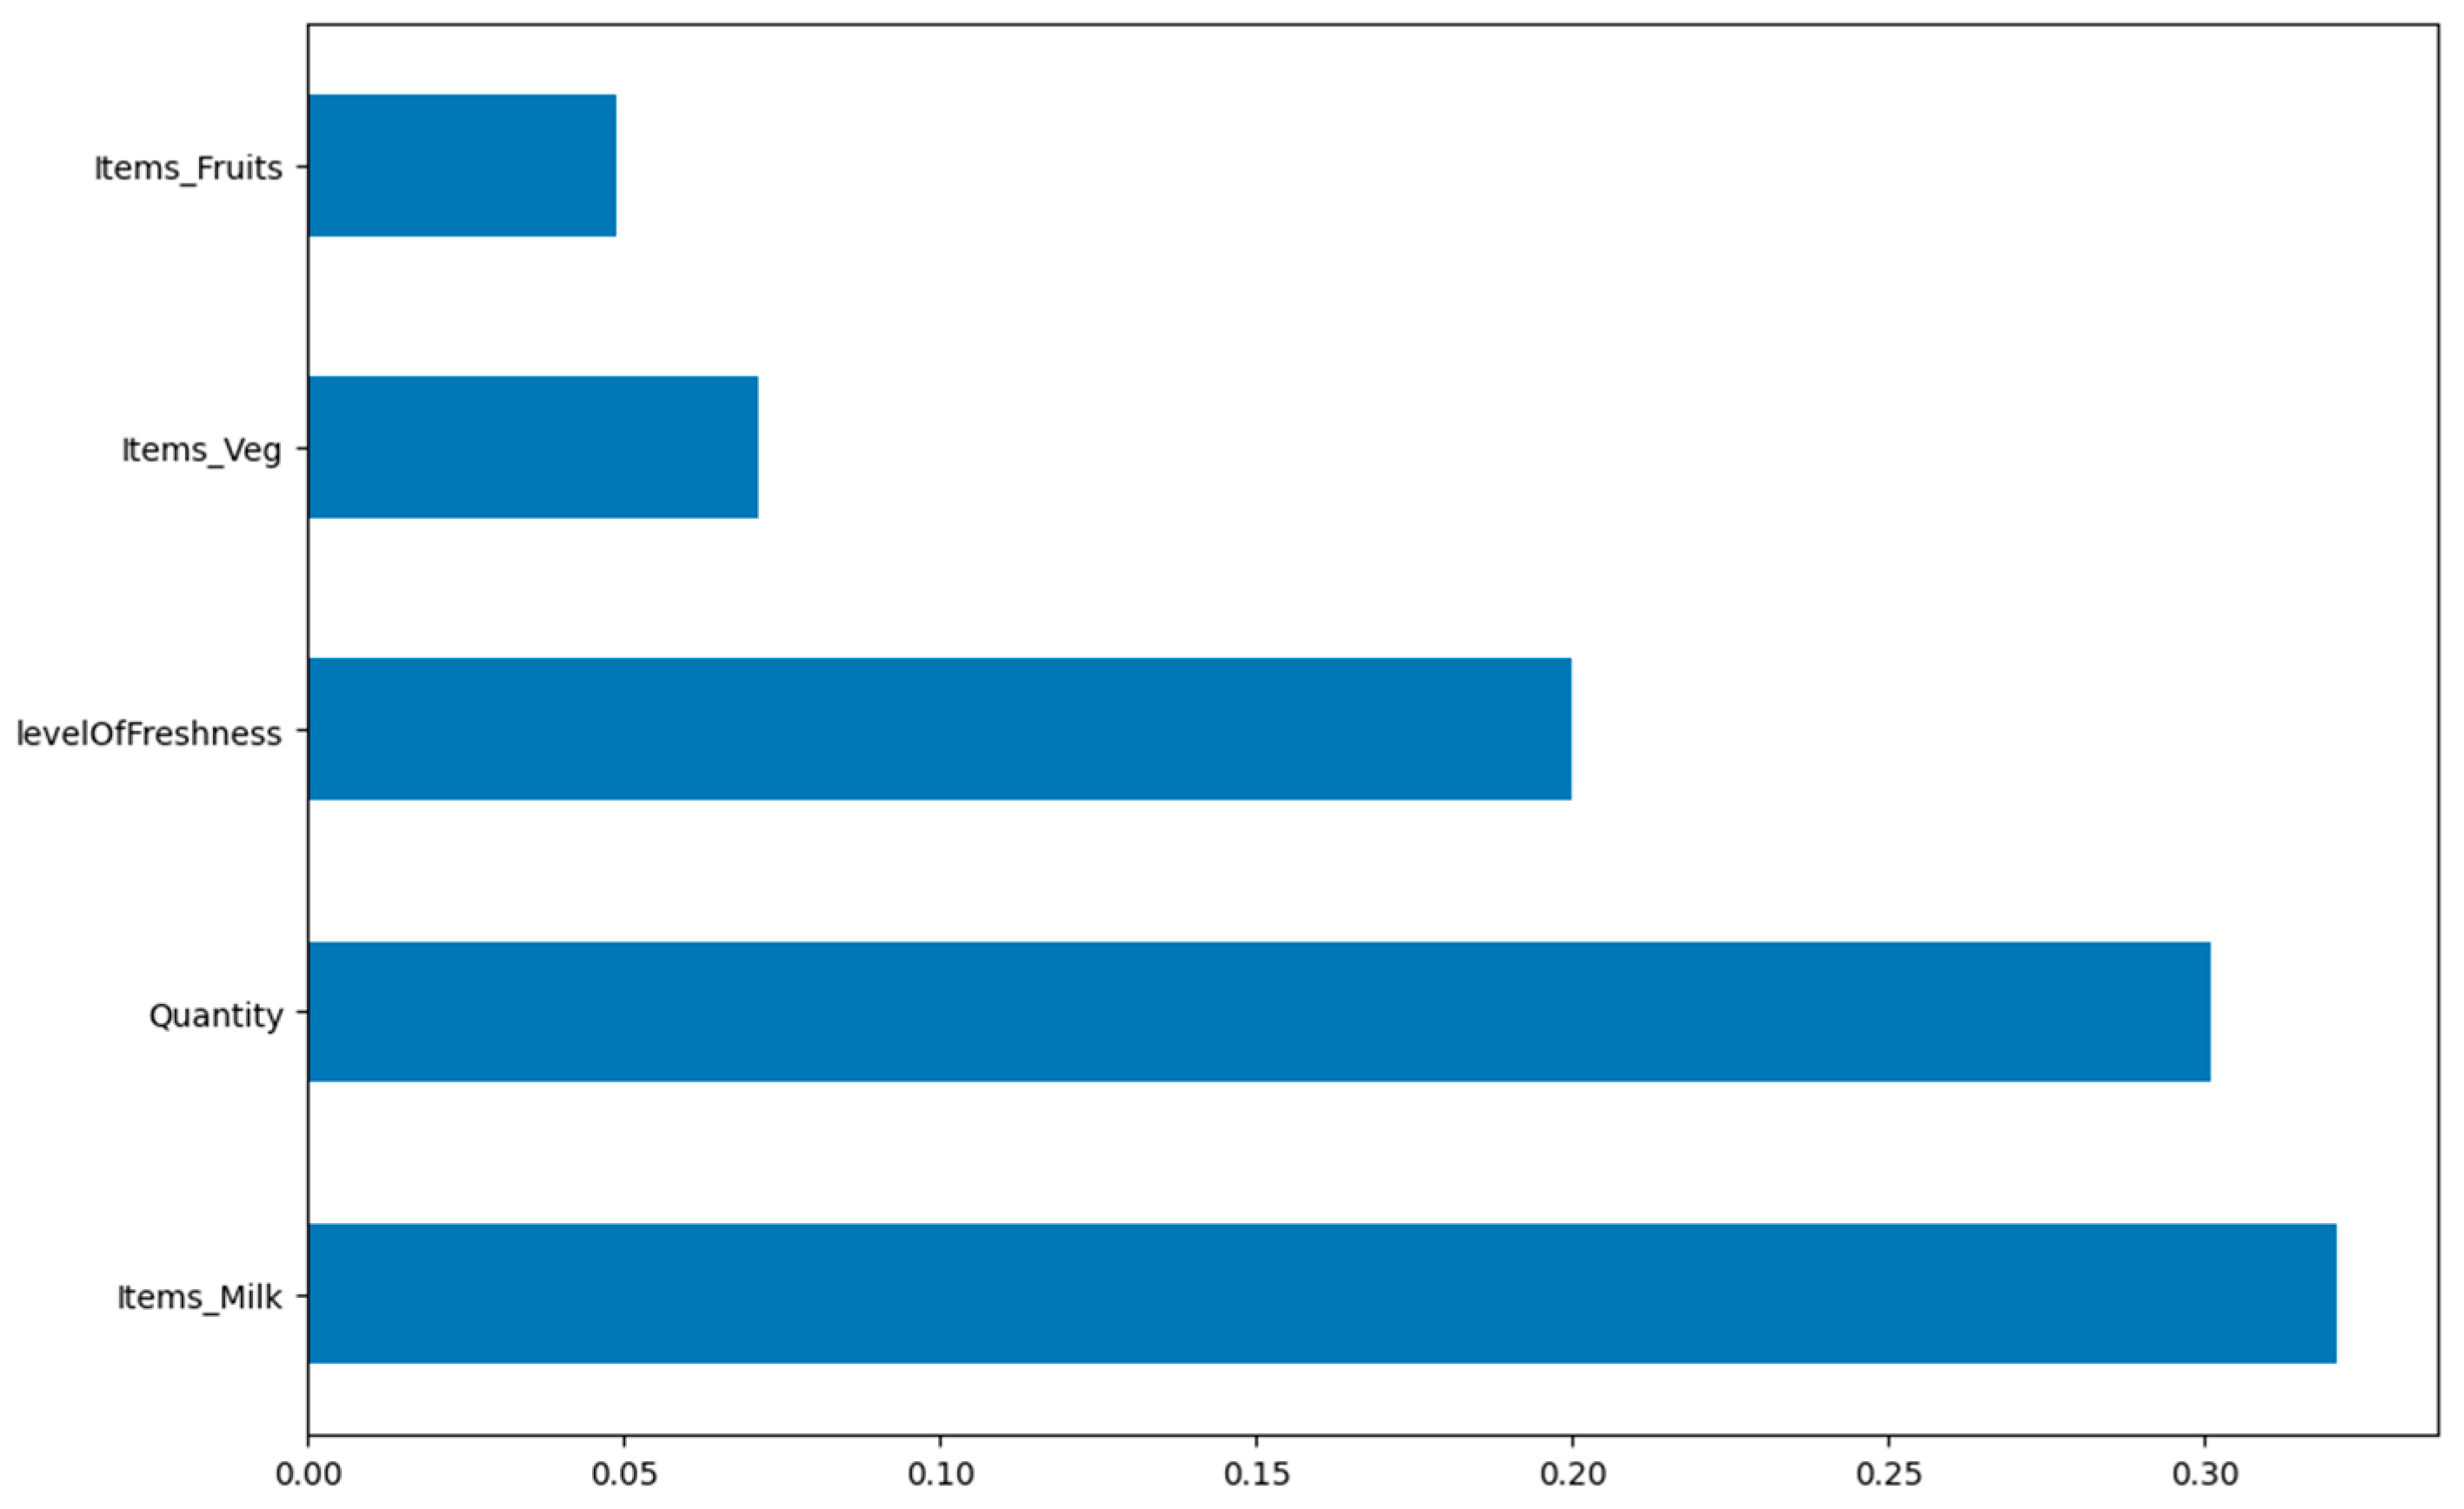
- Most of the organic food purchased is milk, and that quantity and level of freshness affect the purchases. This means that business leaders could concentrate on improving the freshness of milk (Figure A8).
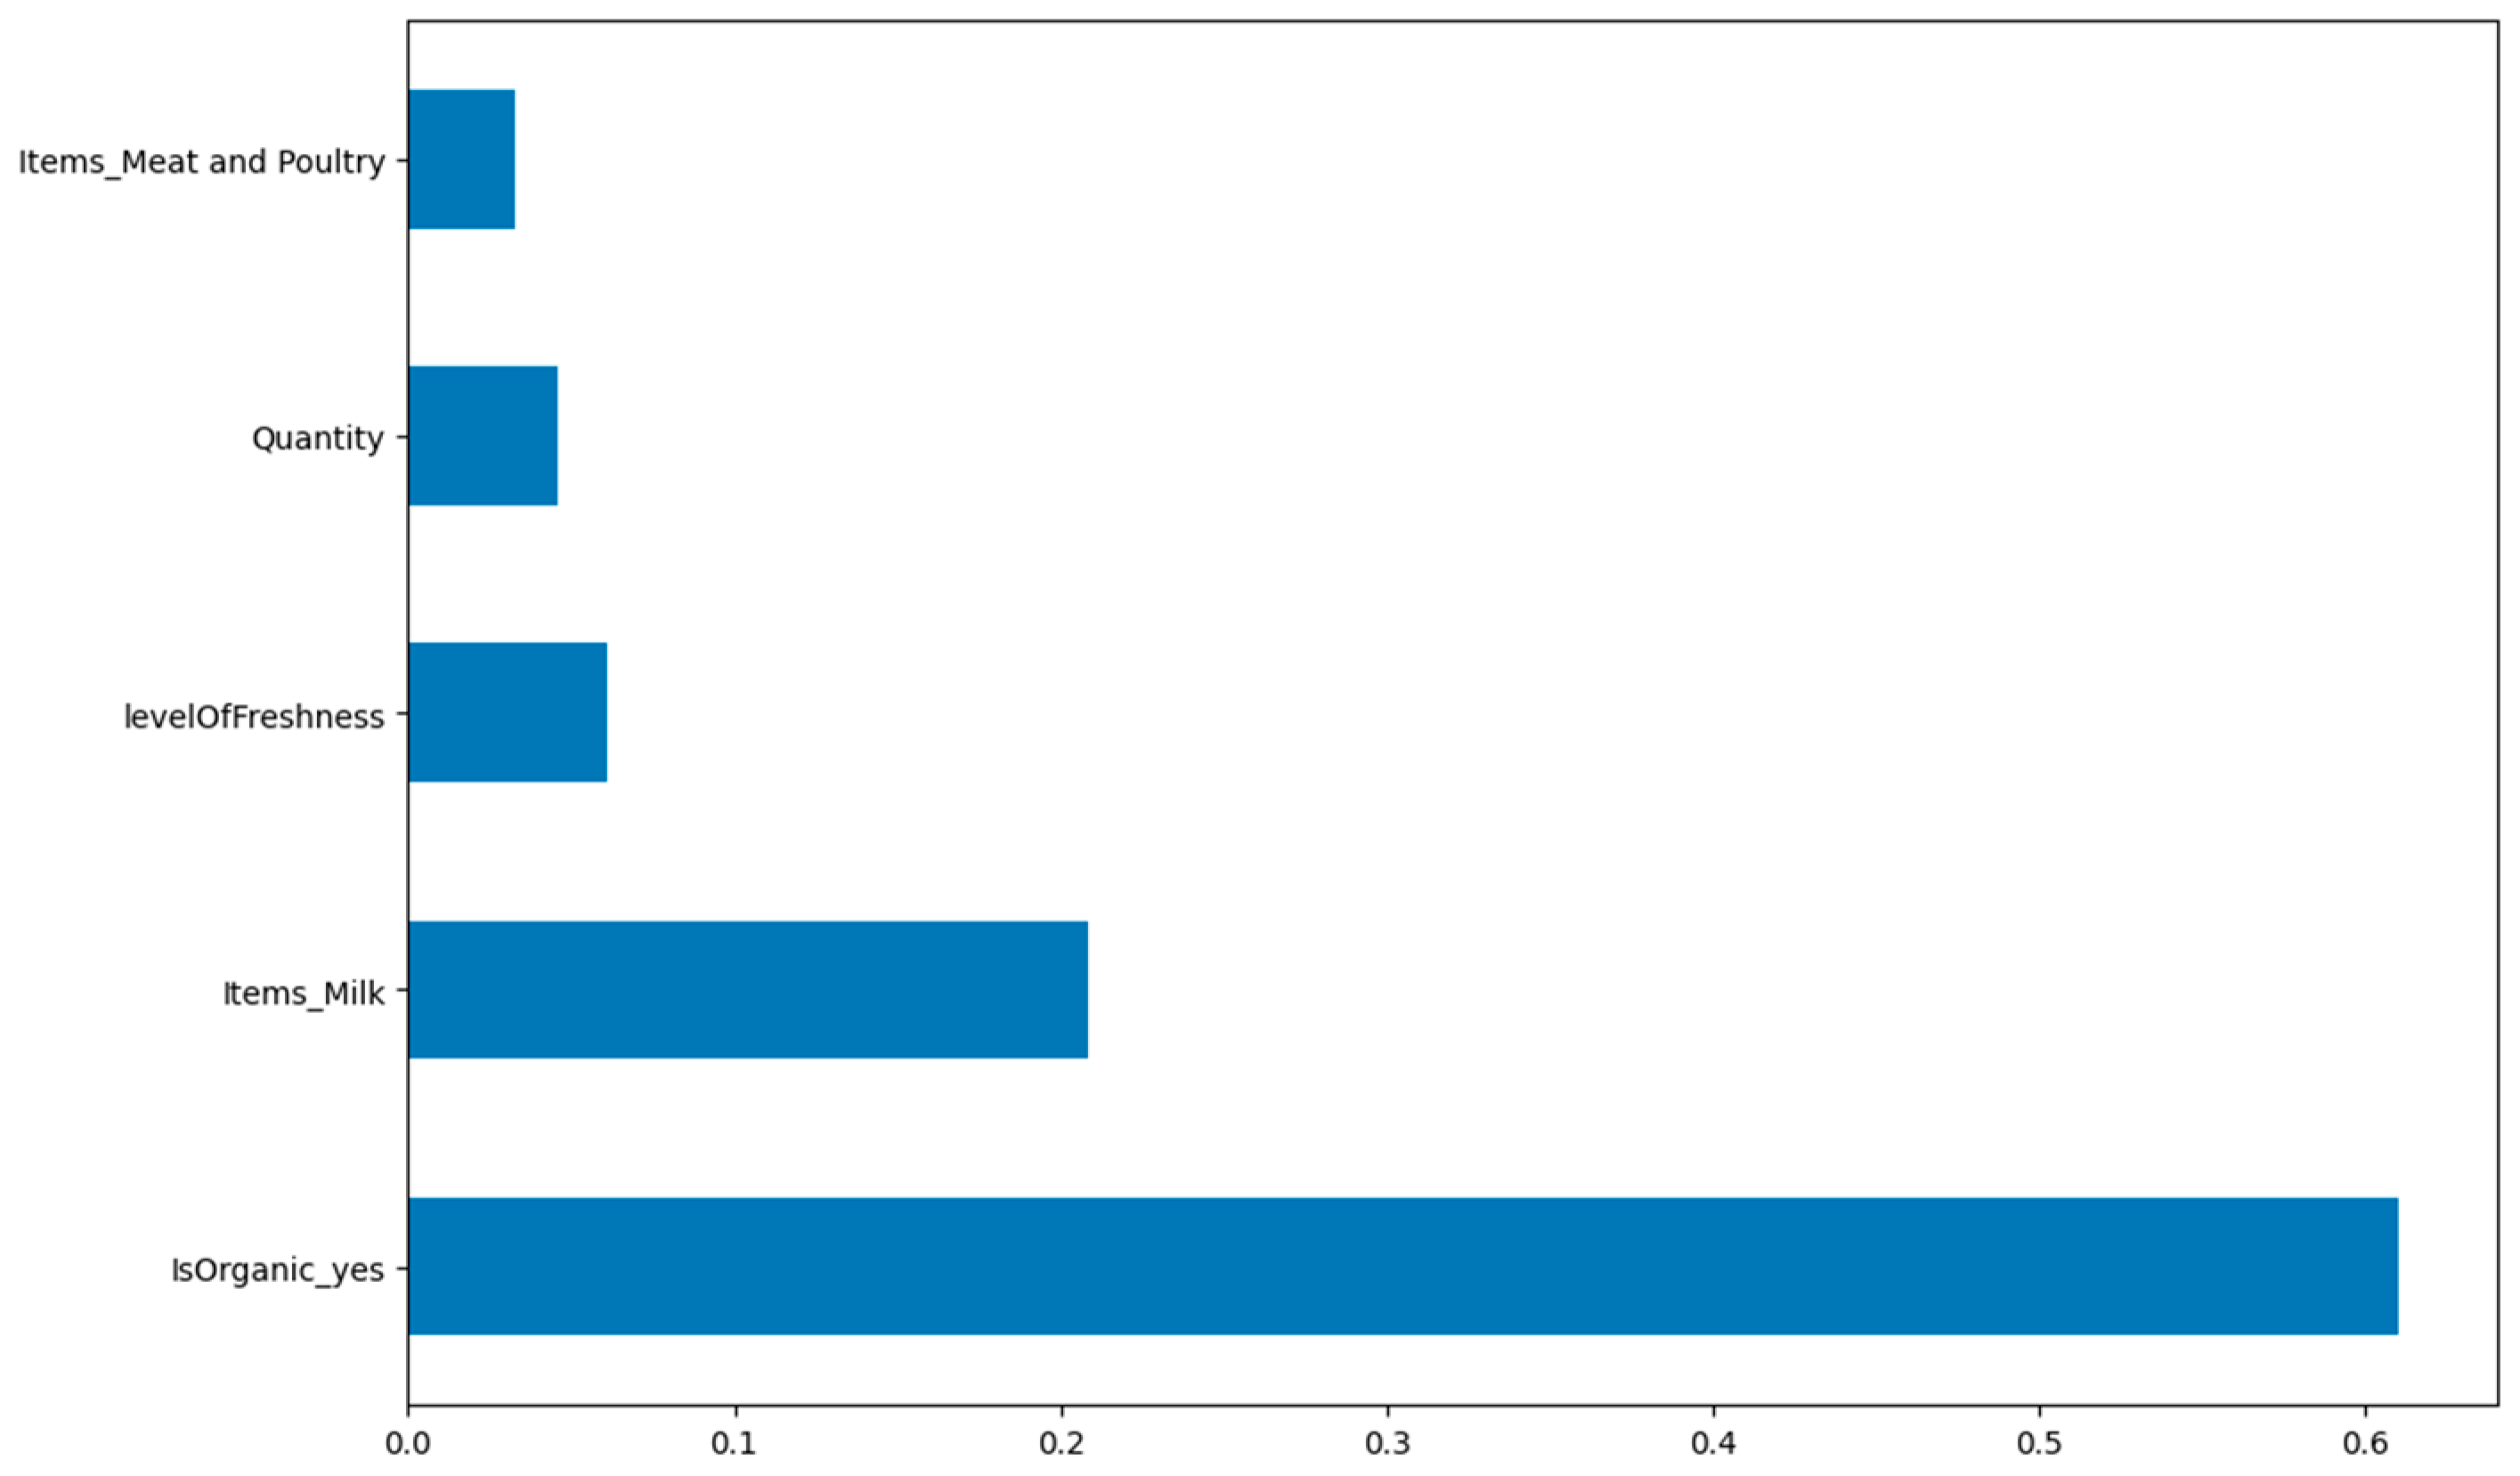
- Most purchased plant-based products are also organic and milk products; the level of freshness can also affect purchases. Also, this points to the importance of improving the freshness of plant-based products when they are likely to be purchased (Figure A9).
- Most products that use cans are types of meat products; however, the level of freshness and quantity are drivers for purchasing such products. This implies that among products that use cans, meat is the most purchased, and hence business leaders can prioritize investing and reinventing sustainable and cost-effective cans for meat (Figure A10).
- Among the products that use jars, cheese is the most-purchased product, and that level of freshness and quantity are drivers of purchase decisions. This signifies that business leaders can first concentrate on reinventing jars of cheese among other products and improving its freshness since it is frequently purchased (Figure A11).
- Fruits and vegetables are the most common products that use plastic bags, covers, and trays. Again, this reassures us that innovating a new recyclable or reusable bag for fruits and vegetables that is also cost-effective can still yield abundant profits (Figure A12).
5.2. How Can We Use Data to Implement an Environmentally Sustainable Solution to Reduce Emissions and Sustain Our Competitive Advantage?
- Pandas: https://pypi.org/project/pandas/ (accessed on 12 March 2023)
- Mlxtend: https://pypi.org/project/mlxtend/ (accessed on 12 March 2023)
- Matplotlib: https://pypi.org/project/matplotlib/ (accessed on 12 March 2023)
- Import libraries and the data source;
- Iterate through the transactions list;
- Encode the transactions;
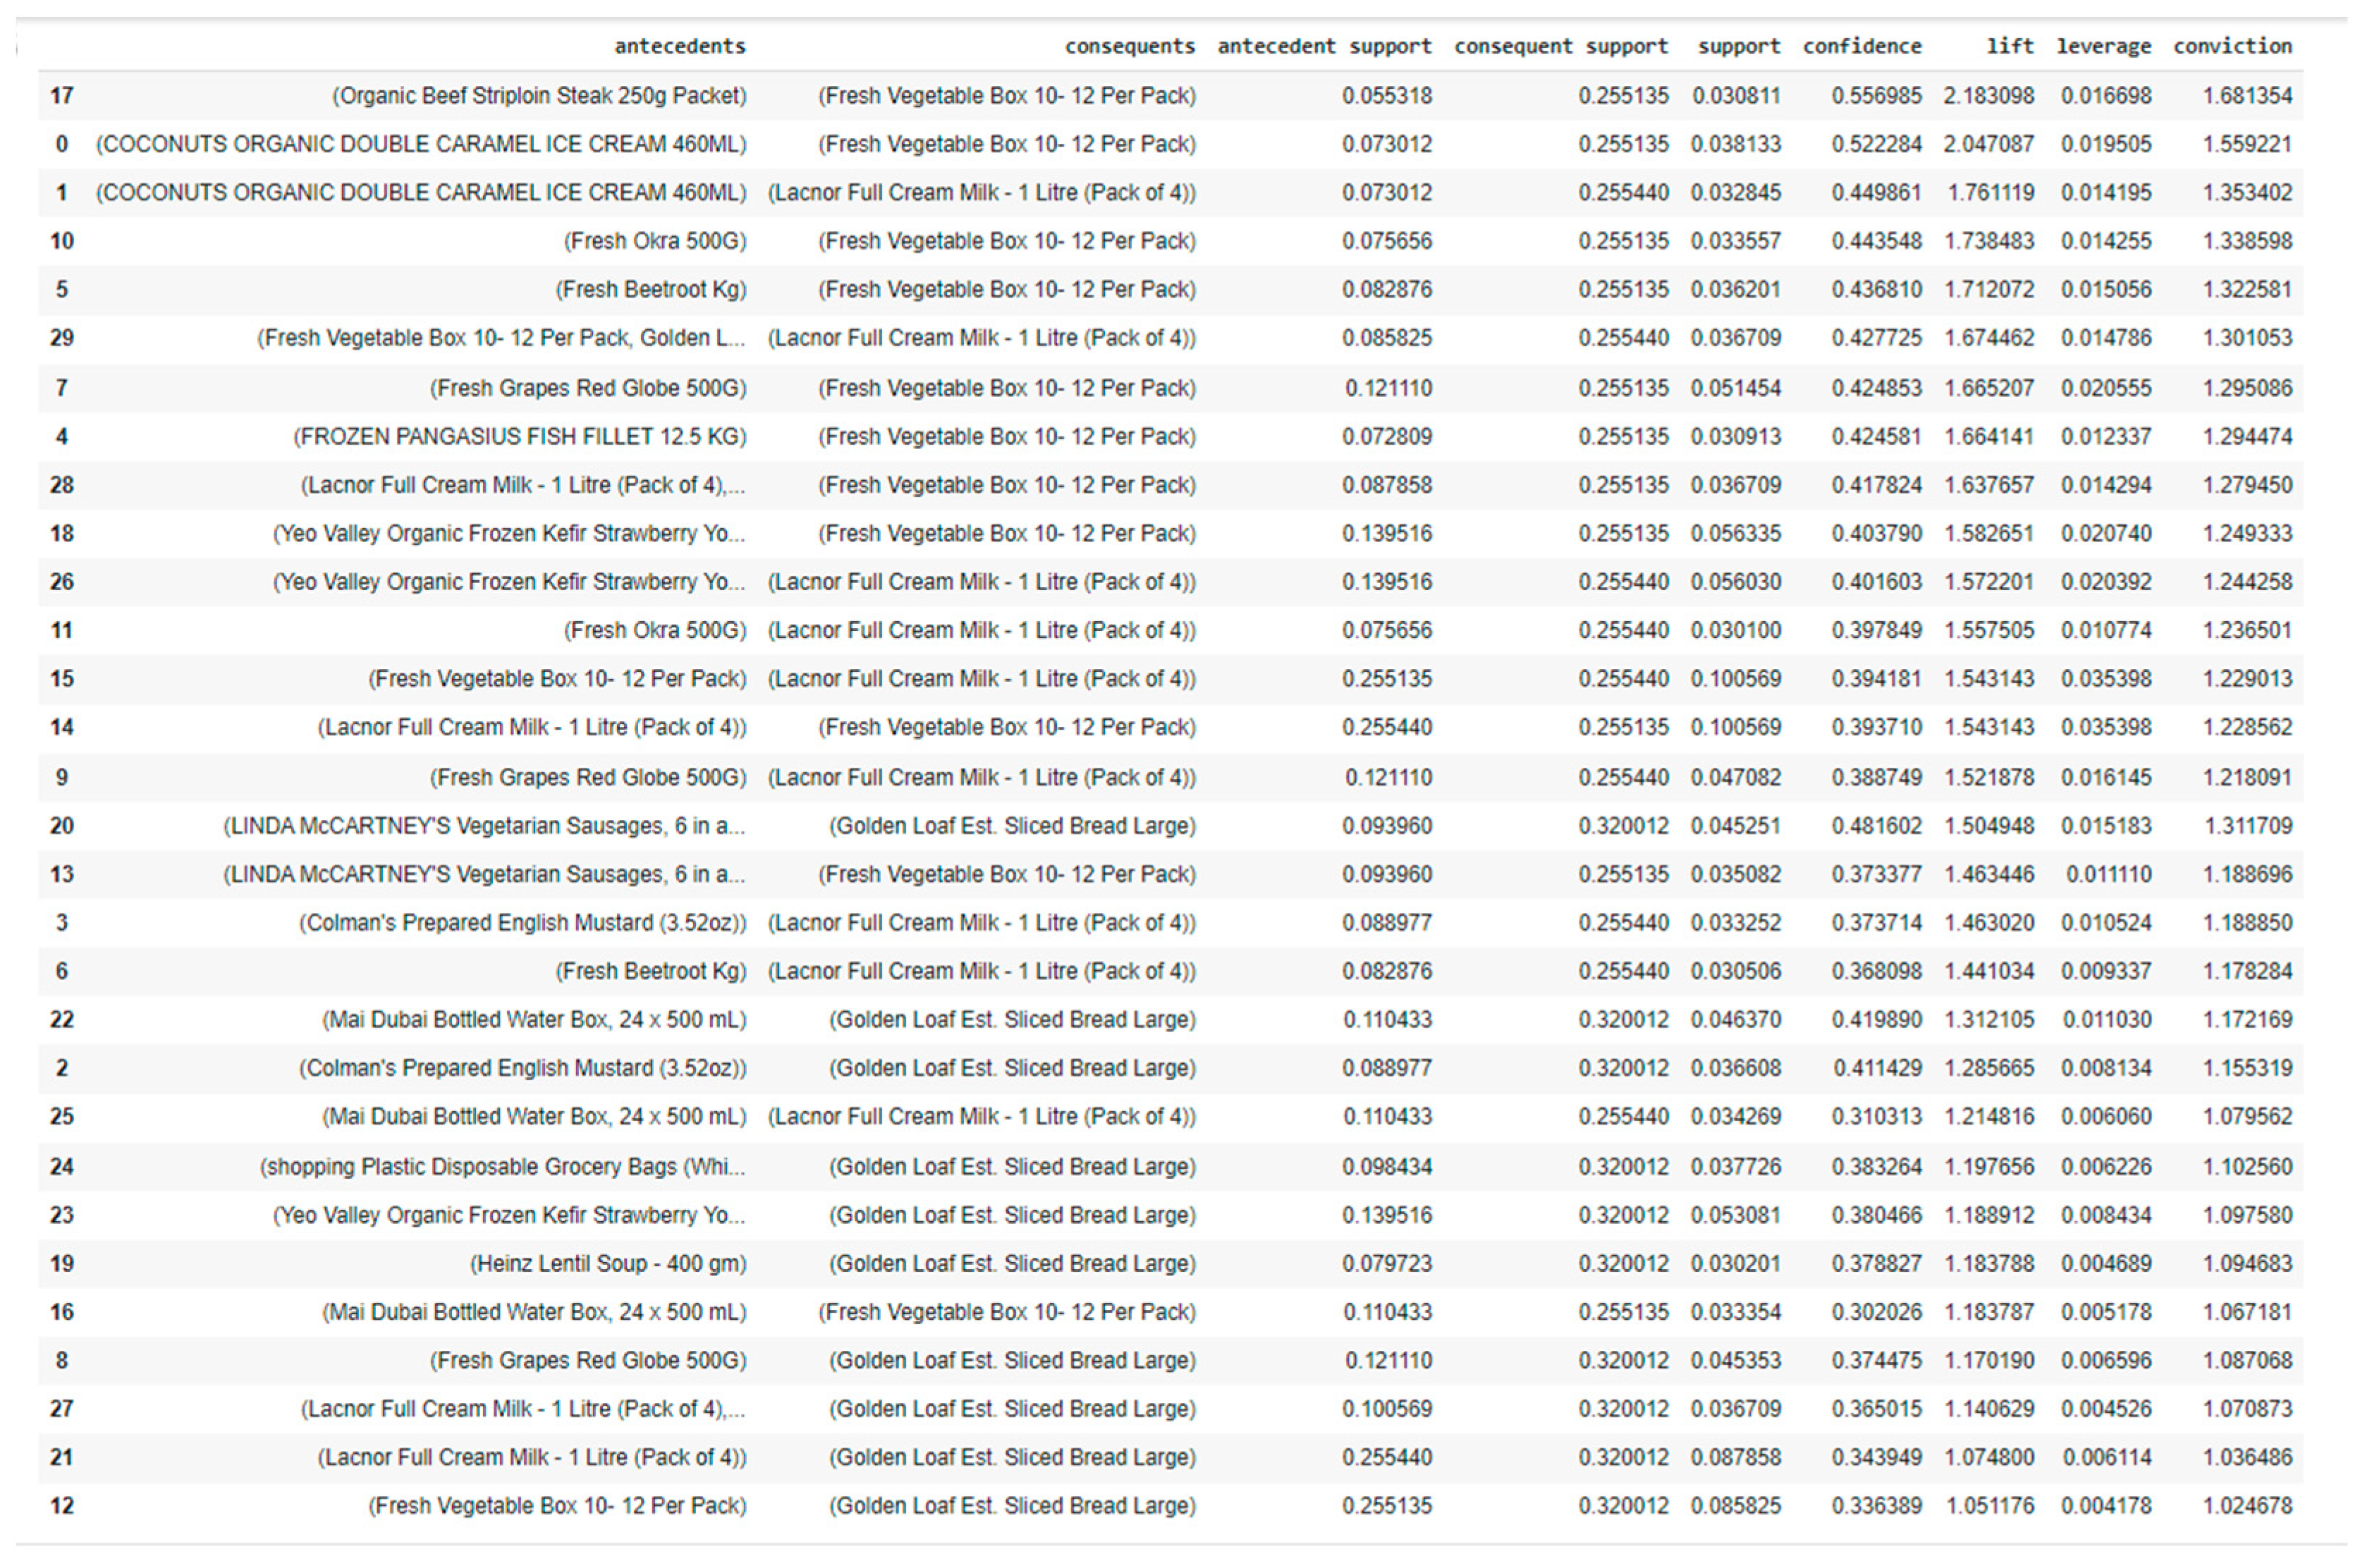
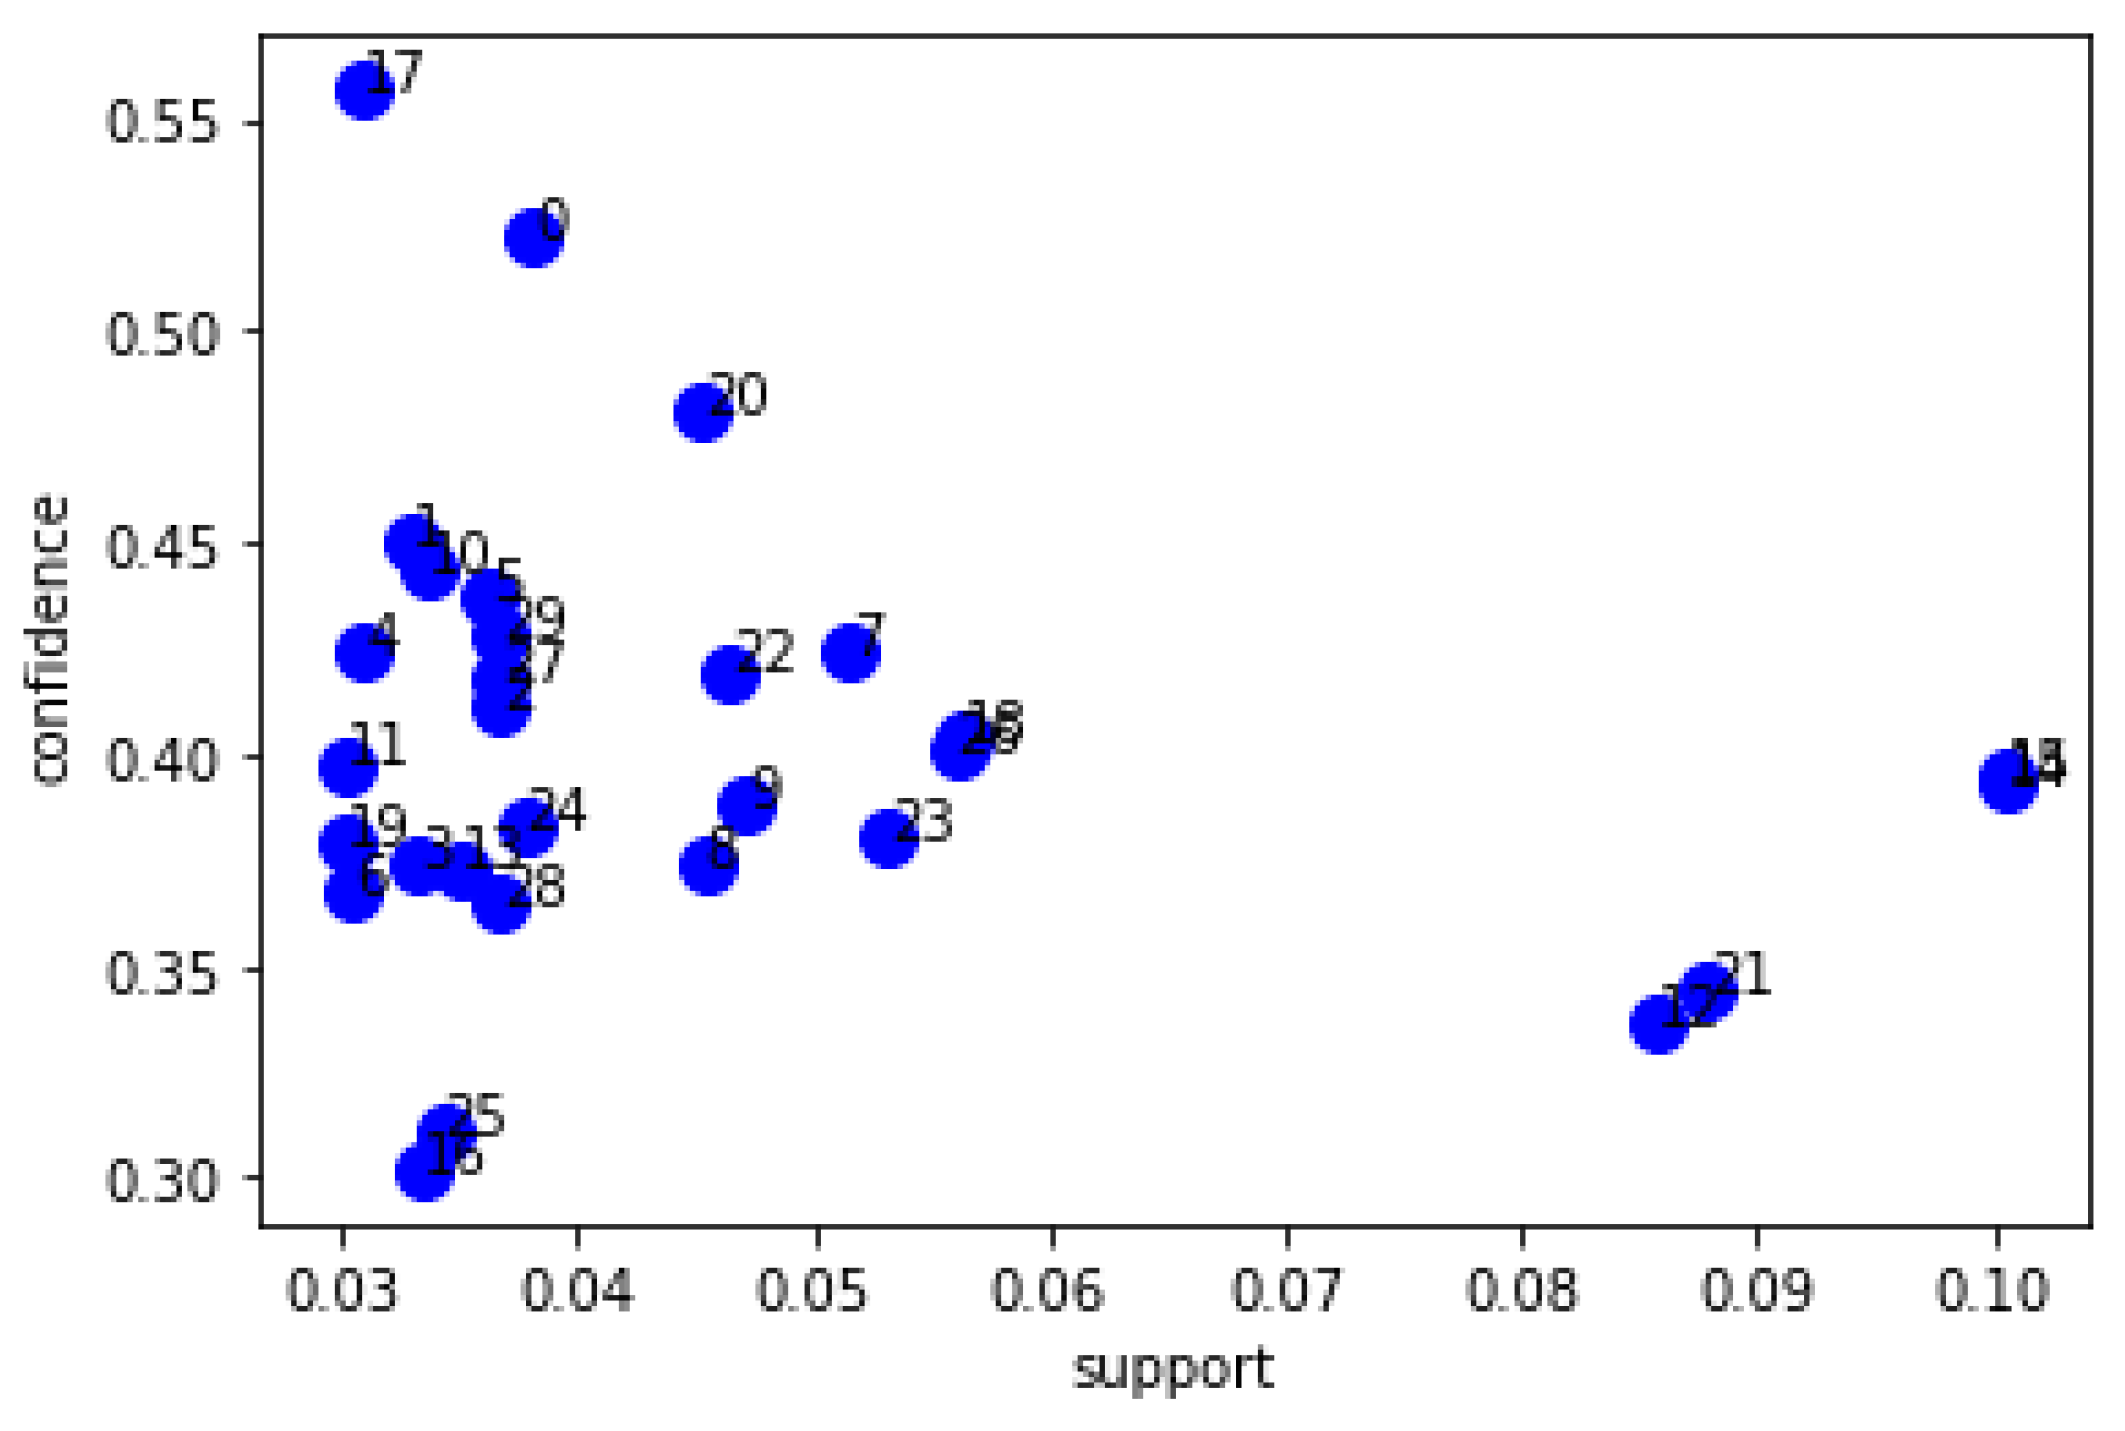
- Implement apriori and association rules;
- Visualize graphs.
- Support formula, where X is a product, and we calculate the relevance and support of each type of product among all transactions, and the formula is written as:
- 2.
- Confidence formula, where X and Y are both considered two different types of products and the formula is used to specify the relationship strength between two different products; the formula is written as:
- 3.
- Lift formula, which uses both the support and confidence formulas. It calculates the likelihood of purchasing products X and Y at once versus purchasing product X alone, and if the result is more than 1, then the probability increases, the formula is
5.3. Based on Our Data, How Can We Use Machine Learning to Create More Accurate and Insightful Reports to Help Decision-Makers?
- Prophet: https://pypi.org/project/prophet/ (accessed on 23 March 2023)
- Pystan (2.14): https://pypi.org/project/pystan/ (accessed on 23 March 2023)
- Fbprophet: https://pypi.org/project/fbprophet/ (accessed on 23 March 2023)
- Itertools: https://pypi.org/project/aioitertools/ (accessed on 23 March 2023)
- Numpy: https://pypi.org/project/numpy/ (accessed on 23 March 2023)
- Pandas: https://pypi.org/project/pandas/ (accessed on 23 March 2023)
- Import libraries and the data source;
- Select variables;
- Data transformation;
- Split training and test sets;
- Implement Facebook Prophet;
- Forecast final results;
- Visualize forecast results;
- Perform model assessment with MAE (mean absolute error), and MAPE functions;
- Carry out diagnosis and cross-validation (ex: days horizon: 31 days);
- Perform an assessment with MAE and RMSE (mean squared error);
- Perform hyperparameter tuning;
- Execute the final Prophet model;
- Forecast final results;
- Export final forecast results.
- Prophet: https://pypi.org/project/prophet/ (accessed on 24 March 2023)
- Pystan (2.14): https://pypi.org/project/pystan/ (accessed on 24 March 2023)
- Fbprophet: https://pypi.org/project/fbprophet/ (accessed on 24 March 2023)
- XGBoost: https://pypi.org/project/xgboost/ (accessed on 24 March 2023)
- Itertools: https://pypi.org/project/aioitertools/ (accessed on 24 March 2023)
- Pandas: https://pypi.org/project/pandas/ (accessed on 24 March 2023)
- Numpy: https://pypi.org/project/numpy/ (accessed on 24 March 2023)
- Import libraries and the data source;
- Select variables;
- Data transformation;
- Split training and test sets;
- Implement Facebook Prophet;
- Prepare and run XGBoost;
- Perform forecast and final visualization;
- Carry out the model assessment;
- Export forecast results.
5.4. Business Intelligence Report Dashboards
5.4.1. Dashboard 1 Interpretation
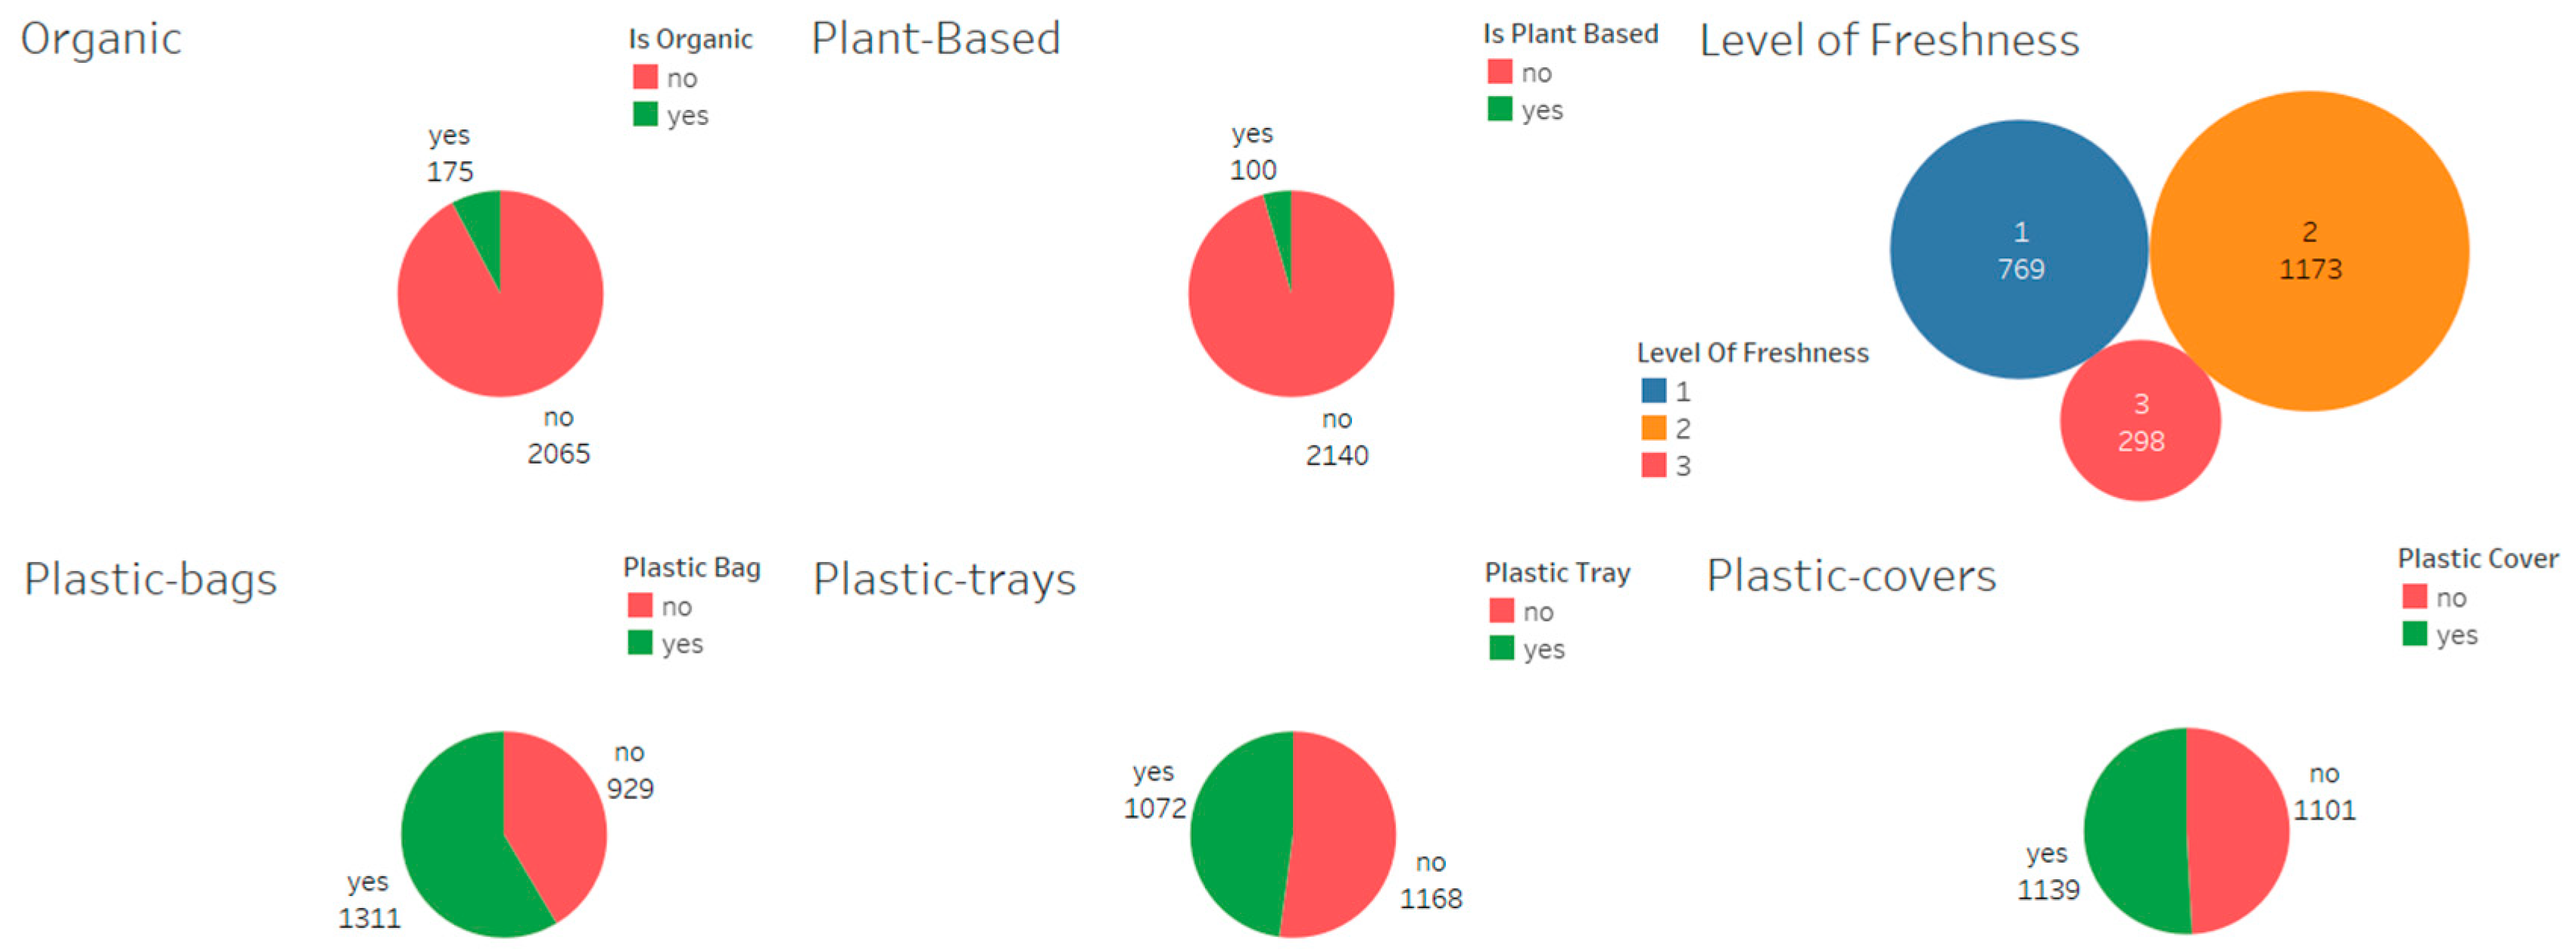
- Generally, environmentally sustainable products such as organic and plant-based are not being promoted enough, which could result in less demand due to high costs. Thus, business leaders should innovate to reduce the costs associated with creating these products and improve their visibility so that they create more demand and balance their costs to become affordable to customers, compared to nonsustainable products.
- It seems that frequently purchased products use plastic bags and covers, which means that business leaders must prioritize reinventing plastic used with these products over other products, because of their high demand.
- Finally, it seems that most of the purchased products are not the freshest since they are in the level 2 category, which could lead to a shorter time to consume these products, or the food will be wasted. Hence, business leaders should improve customer experience by organizing their operations to provide fresh food based on the customer’s time of purchase, which can be achieved by merging or acquiring companies that complement and improve this part of the business.
5.4.2. Dashboard 2 Interpretation
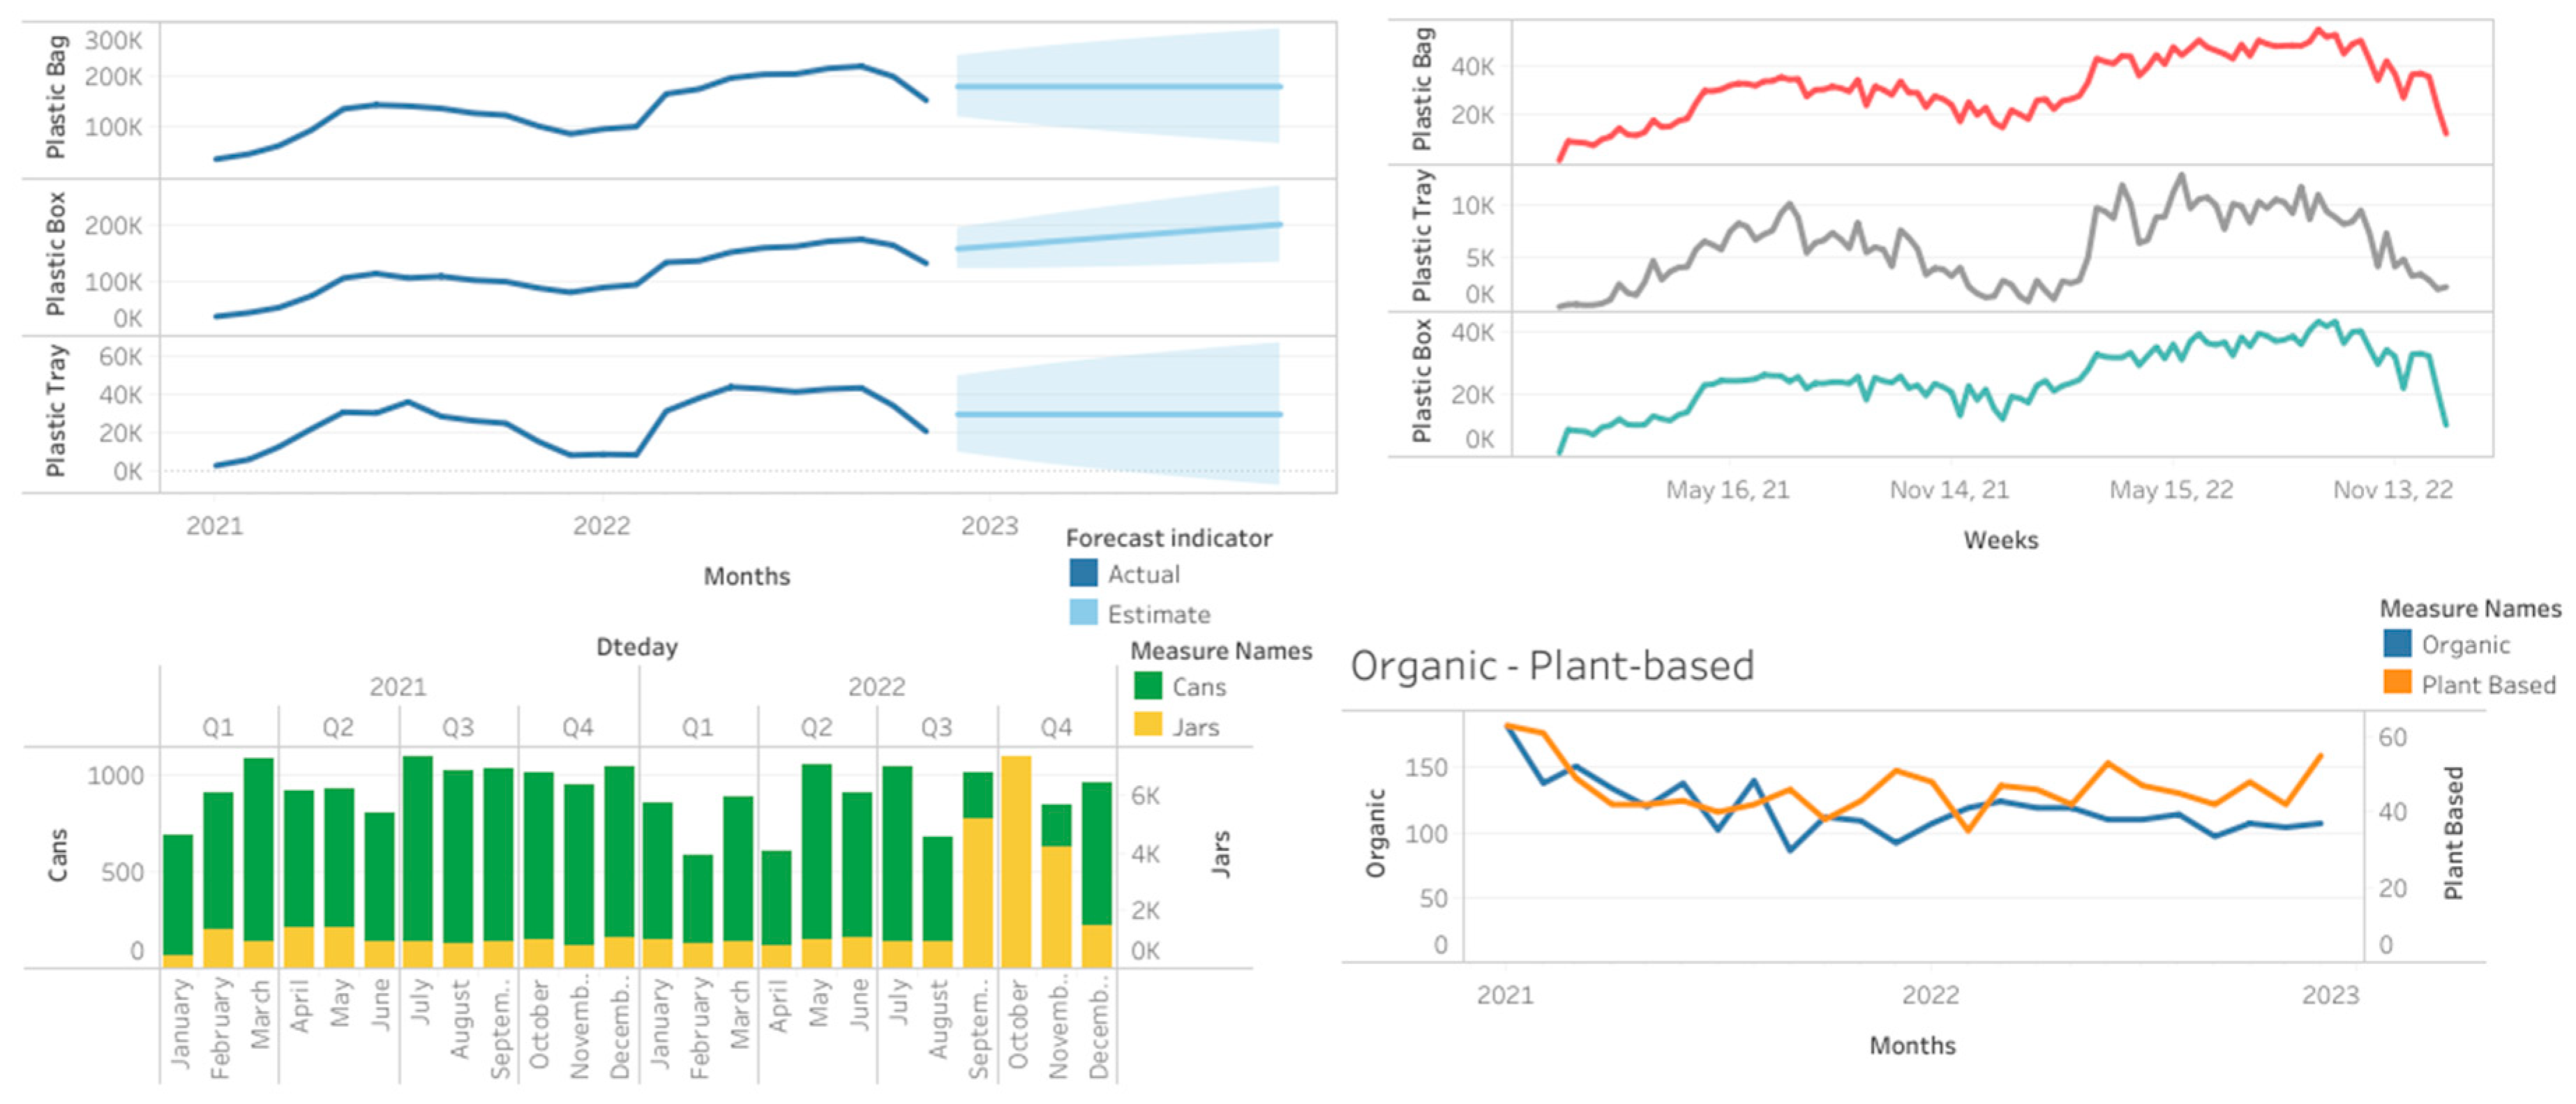
- Since the prediction clarifies that customers will continue to buy products that use this type of plastic in large quantities, business leaders can be more confident to invest in innovative solution research to replace the use of plastic with sustainable materials,.
- Next, business leaders can prioritize innovating to replace cans rather than jars now, because of the high demand that means the positive impact will be higher and faster.
- Finally, business leaders should investigate further why customers favor plant-based over organic food and improve the quality, costs, and promotion for both types of products.
6. Discussion and Conclusions
Author Contributions
Funding
Institutional Review Board Statement
Informed Consent Statement
Data Availability Statement
Conflicts of Interest
Appendix A. CHAID Algorithm Decision-Tree Results



| Items | Score | 0 (Negative) | 1 (Positive) |
|---|---|---|---|
| Organic food | 27.92 | 89.7% | 10.3% |
| Organic meat or poultry | 0 | 96.4% | 3.6% |
| Not meat or poultry and organic product | 51.99 | 85.8% | 14.2% |
| Organic food that needs plastic bags | 0 | 94.9% | 5.1% |
| Organic food that does not need plastic bags | 0 | 74.8% | 25.2% |
| Items | Score | 0 (Negative) | 1 (Positive) |
|---|---|---|---|
| Plant-based food | 60.18 | 92.7% | 7.3% |
| Plant-based food that needs plastic bags | 0 | 99.8% | 0.2% |
| Plant-based food that does not need plastic bags | 76.74 | 86.9% | 13.1% |
| Plant-based food, and is meat or poultry | 0 | 100% | 0% |
| Plant-based, and is not meat, or poultry | 0 | 74.8% | 25.2% |
| Items | Score | 0 (Negative) | 1 (Positive) |
|---|---|---|---|
| Food that needs cans | 550.43 | 76.1% | 23.9% |
| Food that needs cans, and could be meat, or poultry | 0 | 34.2% | 65.8% |
| Food that needs cans, and is not meat, or poultry | 0 | 100% | 0% |
| Items | Score | 0 (Negative) | 1 (Positive) |
|---|---|---|---|
| Food that needs jars | 85.36 | 90.5% | 9.5% |
| Food that needs jars and uses plastic bags | 0 | 100% | 0% |
| Food that needs jars, and does not need plastic bags | 106.36 | 82.8% | 17.2% |
| Food that needs jars, and is meat or poultry | 0 | 100% | 0% |
| Food that needs jars, and is not meat or poultry | 0 | 66.8% | 33.2% |
| Items | Score | 0 (Negative) | 1 (Positive) |
|---|---|---|---|
| Food that needs plastic covers | 868.88 | 56.1% | 43.9% |
| Food that needs plastic covers and trays | 0 | 0% | 100% |
| Food that needs plastic covers and does not need plastic trays | 0 | 94.3% | 5.7% |
| Items | Score | 0 (Negative) | 1 (Positive) |
|---|---|---|---|
| Food that needs plastic trays | 868.88 | 59.5% | 40.5% |
| Food that needs plastic covers and trays | 0 | 92.3% | 7.7% |
| Food that needs plastic trays and does not need plastic covers | 0 | 100% | 0% |
| Items | Score | 0 (Negative) | 1 (Positive) |
|---|---|---|---|
| Products that need plastic bags | 764.41 | 55.2% | 44.8% |
| Products that need plastic bags and plastic trays | 0 | 97.5% | 2.5% |
| Products that need plastic bags, and does not need plastic trays | 77.36 | 91.1% | 8.9% |
| Products that need plastic because of the quantity | 0 | 79.2% | 20.8% |
| Products that do not need plastic because of the quantity | 0 | 100% | 0% |
Appendix B. Random Forest Algorithm Results


| Product or Attribute | Likelihood | Explanation |
|---|---|---|
| Milk | 0.32 | Most of the organic food purchased is milk, and that quantity and level of freshness affect the purchases. |
| Quantity | 0.3 | |
| Level of freshness | 0.2 |
| Product or Attribute | Likelihood | Explanation |
|---|---|---|
| Organic | 0.61 | Most purchased plant-based products are also organic and milk products, and the level of freshness can also affect purchases. |
| Milk | 0.2 | |
| Level of freshness | 0.05 |
| Product or Attribute | Likelihood | Explanation |
|---|---|---|
| Meat or poultry | 0.55 | Most products that use cans are types of meat products; however, the level of freshness and quantity are drivers for purchasing such products. |
| Level of freshness | 0.25 | |
| Quantity | 0.02 |
| Product or Attribute | Likelihood | Explanation |
|---|---|---|
| Cheese | 0.72 | Among the products that use jars, cheese is the most purchased product, and that level of freshness and quantity are drivers of purchase decisions. |
| Level of freshness | 0.08 | |
| Quantity | 0.03 |
| Product or Attribute | Likelihood | Explanation |
|---|---|---|
| Plastic trays | 0.38 | Fruits and vegetables are the most common products that use plastic bags, covers, and trays. |
| Plastic cover | 0.23 | |
| Vegetables | 0.09 |
References
- The United Nations Environmental Program. Emission Gap Report 2022: The Closing Window. Available online: https://www.unep.org/resources/emissions-gap-report-2022 (accessed on 30 September 2023).
- Nunes, B.; Batista, L.; Masi, D.; Bennett, D. Sustainable Operations Management: Key Practices and Cases; Taylor & Francis Group: Abingdon, UK, 2022; Available online: https://ebookcentral.proquest.com/lib/uow/detail.action?docID=7133084 (accessed on 25 October 2023).
- Moore, S. How to Create a Business Case for Data Quality Improvement. Gartner, 2018. Available online: https://www.gartner.com/smarterwithgartner/how-to-create-a-business-case-for-data-quality-improvement (accessed on 20 February 2023).
- Johansson, L.; Jonasson, I.; Reim, W. Sustainable expansion: Capabilities for “New food source”—Companies. Futur. Foods 2023, 8, 100259. [Google Scholar] [CrossRef]
- Mo, A.; Zhang, Y.; Gao, W.; Jiang, J.; He, D. Environmental fate and impacts of biodegradable plastics in agricultural soil ecosystems. Appl. Soil Ecol. 2023, 181, 104667. [Google Scholar] [CrossRef]
- Hobrash, J. Determinants of environmental innovation—New evidence from German panel data sources. Res. Policy 2008, 37, 163–173. [Google Scholar] [CrossRef]
- Liang, H.; Cheah, S.M. Alibaba Cainiao’s Smart Green Logistics Strategy: Good for the Earth, Good for the Business; Harvard Business Publishing Education: Boston, MA, USA, 2021. [Google Scholar]
- Denne, L.; Sadler, G.; Common, D. Why Buying Plastic-Free Groceries Is so Hard (Marketplace). Youtube. Uploaded by CBC News, 12 January 2019. Available online: https://www.youtube.com/watch?v=n5Qbi_dB3Qo (accessed on 5 February 2023).
- Weidner, K.; Nakata, C.; Zhu, Z. Sustainable innovation and the triple bottom-line: A market-based capabilities and stakeholder perspective. J. Mark. Theory Pr. 2021, 29, 141–161. [Google Scholar] [CrossRef]
- Kostakis, P.; Kargas, A. Big-Data Management: A Driver for Digital Transformation? Information 2021, 12, 411. [Google Scholar] [CrossRef]
- Geyer, R.; Jambeck, J.R.; Law, K.L. Production, use, and the fate of all plastics ever made. Sci. Adv. 2017, 3, e1700782. [Google Scholar] [CrossRef]
- Gibbens, S. What You Need to Know about Plant-Based Plastics. National Geographic. 2018. Available online: https://www.nationalgeographic.com/environment/article/are-bioplastics-made-from-plants-better-for-environment-ocean-plastic (accessed on 20 February 2023).
- Germer, L.A.; van Middelaar, C.E.; Oosting, S.J.; Gerber, P.J. When and where are livestock climate-smart? A spatial-temporal framework for comparing the climate change and food security synergies and tradeoffs of Sub-Saharan African livestock systems. Agric. Syst. 2023, 210, 103717. [Google Scholar] [CrossRef]
- Seele, P. What Makes a Business Ethicist? A Reflection on the Transition from Applied Philosophy to Critical Thinking. J. Bus. Ethics 2018, 150, 647–656. [Google Scholar] [CrossRef]
- Barney, J.B.; Hansen, M.H. Trustworthiness as a Source of Competitive Advantage. Strat. Manag. J. 1994, 15, 175–190. [Google Scholar] [CrossRef]
- Orlitzky, M.; Schmidt, F.L.; Rynes, S.L. Corporate social and financial performance: A meta-analysis. Organ. Stud. 2003, 24, 403–441. [Google Scholar] [CrossRef]
- Michalos, A.C. The Business Case for Asserting the Business Case for Business Ethics. J. Bus. Ethics 2013, 114, 599–606. [Google Scholar] [CrossRef]
- Saurabh, K.; Arora, R.; Rani, N.; Mishra, D.; Ramkumar, M. AI led ethical digital transformation: Framework, research and managerial implications. J. Inf. Commun. Ethics Soc. 2022, 20, 229–256. [Google Scholar] [CrossRef]
- Duncan, A.D. Roadmap for Data Literacy and Data-Driven Business Transformation: A Gartner Trend Insight Report. Gartner, 2020. Available online: https://www.gartner.com/en/documents/3991368 (accessed on 2 February 2023).
- Davenport, T.H.; DalleMule, L. What Is Your Data Strategy. Harvard Business Review. The 2 Types of Data Strategies Every Company Needs (hbr.org). 2017. Available online: https://hbr.org/2017/05/whats-your-data-strategy (accessed on 20 February 2023).
- Young, A.; Rogers, P. A Review of Digital Transformation in Mining. Min. Met. Explor. 2019, 36, 683–699. [Google Scholar] [CrossRef]
- Ladley, J.; Redman, T.C. Use Data to Accelerate Your Business Strategy. Available online: https://hbr.org/2020/03/use-data-to-accelerate-your-business-strategy (accessed on 25 February 2023).
- Kayikci, Y.; Demir, S.; Mangla, S.K.; Subramanian, N.; Koc, B. Data-driven optimal dynamic pricing strategy for reducing perishable food waste at retailers. J. Clean. Prod. 2022, 344, 131068. [Google Scholar] [CrossRef]
- Buytendijk, F. Complete Your Data and Analytics Strategy with a Clear Value Proposition; Gartner: Stamford, CT, USA, 2020. [Google Scholar]
- Fleckenstein, M.; Fellows, L. Overview of Data Management Frameworks. In Modern Data Strategy; Springer: Cham, Switzerland, 2018. [Google Scholar] [CrossRef]
- Vendraminelli, L.; Macchion, L.; Nosella, A.; Vinelli, A. Design thinking: Strategy for digital transformation. J. Bus. Strat. 2023, 44, 200–210. [Google Scholar] [CrossRef]
- Dama International. DAMA-DMBOK: Data Management Body of Knowledge, 2nd ed.; Technics Publications, LLC: Denville, NJ, USA, 2017; p. 39. [Google Scholar]
- Munoz, J.M. (Ed.) Global Business Intelligence; Taylor & Francis Group: Abingdon, UK, 2017. [Google Scholar]
- IBM. What Is a Data Mart? 2020. Available online: https://www.ibm.com/topics/data-mart (accessed on 25 February 2023).
- Chang, E.; Rahayu, W.; Diallo, M.; Machizaud, M. Dynamic Data Mart for Business Intelligence. In Artificial Intelligence in Theory and Practice IV, IFIP AI 2015; IFIP Advances in Information and Communication Technology; Dillon, T., Ed.; Springer: Cham, Switzerland, 2015; Volume 465. [Google Scholar] [CrossRef]
- Oracle® Database. Introduction to Data Warehousing. In Data Warehousing Guide; Oracle: Austin, TX, USA, 2021; p. 36. [Google Scholar]
- Bouaziz, S.; Nabli, A.; Gargouri, F. From Traditional Data Warehouse to Real-Time Data Warehouse. In Intelligent Systems Design and Applications; ISDA 2016. Advances in Intelligent Systems and Computing; Madureira, A., Abraham, A., Gamboa, D., Novais, P., Eds.; Springer: Cham, Switzerland, 2017; Volume 557. [Google Scholar] [CrossRef]
- Amazon AWS. What Is a Data Lake? 2023. Available online: https://aws.amazon.com/big-data/datalakes-and-analytics/what-is-a-data-lake/ (accessed on 7 September 2023).
- Giebler, C.; Gröger, C.; Hoos, E.; Eichler, R.; Schwarz, H.; Mitschang, B. The Data Lake Architecture Framework: A Foundation for Building a Comprehensive Data Lake Architecture. In Proceedings of the Conference for Database Systems for Business, Technology and Web (BTW), Dresden, Germany, 6–10 March 2021. [Google Scholar] [CrossRef]
- Delta Lake 2.4.0. Delta Lake—Introduction. 2023. Available online: https://docs.delta.io/latest/delta-intro.html (accessed on 25 February 2023).
- Armbrust, M.; Ghodsi, A.; Xin, R.; Zaharia, M. Lakehouse: A New Generation of Open Platforms that Unify Data Warehousing and Advanced Analytics. Databricks, 2021. Available online: https://people.eecs.berkeley.edu/~matei/papers/2021/cidr_lakehouse.pdf (accessed on 12 November 2023).
- Armbrust, M.; Das, T.; Sun, L.; Yavuz, B.; Zhu, S.; Murthy, M.; Torres, J.; van Hovell, H.; Ionescu, A.; Łuszczak, A.; et al. Delta lake: High-performance ACID table storage over cloud object stores. Proc. Vldb Endow. 2020, 13, 3411–3424. [Google Scholar] [CrossRef]
- Littler, S. CHAID (Chi-Square Automatic Interaction Detector). 2017. Available online: https://select-statistics.co.uk/blog/chaid-chi-square-automatic-interaction-detector/ (accessed on 10 February 2023).
- Niladri Syam, R.K. Chapter 5, Random Forest, Bagging, and Boosting of Decision trees. In Machine Learning and Artificial Intelligence in Marketing and Sales: Essential Reference for Practitioners and Data Scientists; Emerald Publishing Limited: Leeds, UK, 2021; pp. 139–140. [Google Scholar]
- Guo, Y.; Wang, M.; Li, X. Application of an improved Apriori algorithm in a mobile e-commerce recommendation system. Ind. Manag. Data Syst. 2017, 117, 287–303. [Google Scholar] [CrossRef]
- Taylor, B.L.S.J. Prophet: Forecasting at Scale—Facebook Meta Research. 2017. Available online: https://research.facebook.com/blog/2017/02/prophet-forecasting-at-scale/ (accessed on 15 March 2023).
- Brownlee, J. A Gentle Introduction to XGBoost for Applied Machine Learning. 2016. Available online: https://machinelearningmastery.com/gentle-introduction-xgboost-applied-machine-learning/ (accessed on 10 February 2023).
- Kodama, M. Managing IT for Innovation: Dynamic Capabilities and Competitive Advantage; Taylor & Francis Group: Abingdon, UK, 2023; Available online: https://ebookcentral.proquest.com/lib/uow/detail.action?docID=6646924 (accessed on 12 February 2023).
- Kodama, M. Management System for Strategic Innovation: Building Dynamic Capabilities View of the Firm; Taylor & Francis Group: Abingdon, UK, 2023; Available online: https://ebookcentral.proquest.com/lib/uow/detail.action?docID=7263865 (accessed on 12 February 2023).
- Heider, A.; Gerken, M.; van Dinther, N.; Hülsbeck, M. Business model innovation through dynamic capabilities in small and medium enterprise—Evidence from the German Mittelstand. J. Bus. Res. 2021, 130, 635–645. [Google Scholar] [CrossRef]
- Cho, J.; Bian, Y.; Lee, J. Leading digital business model transformation in the K-pop industry: The case of SM Entertainment. Asia Pac. Bus. Rev. 2023, 1–31. Available online: https://www.tandfonline.com/doi/abs/10.1080/13602381.2023.2229761 (accessed on 30 October 2023). [CrossRef]
- Cho, J. Thriving in the global competitive landscape: Competitive dynamics and longevity of emerging market firms. Asian Bus. Manag. 2023, 1–28. [Google Scholar] [CrossRef]
- Cho, J.; Lee, J. How IDIS Survived after Internationalization? A Dynamic Capabilities Perspective. Korea Bus. Rev. 2018, 22, 79–98. [Google Scholar] [CrossRef]
- Zwingmann, T. Chapter 10, Demystifying BI with AI. Make Insights Actionable with AI and BI, At Scale, p. 86. Available online: https://www.atscale.com/resource/make-insights-actionable-with-ai-and-bi/ (accessed on 1 March 2023).
- Cho, J.; Garg, S.; Lee, J. Opening the Black Box: Boards of Directors, Competitive Aggressiveness, and Firm Performance. Acad. Manag. Proc. 2021, 2021, 12953. Available online: https://journals.aom.org/doi/abs/10.5465/AMBPP.2021.12953abstract (accessed on 30 October 2023). [CrossRef]
- Li, Z.; Liang, F.; Hu, H. Blockchain-Based and Value-Driven Enterprise Data Governance: A Collaborative Framework. Sustainability 2023, 15, 8578. [Google Scholar] [CrossRef]
- Wei, J.; Yi, X.; Yang, X.; Liu, Y. Blockchain-Based Design of a Government Incentive Mechanism for Manufacturing Supply Chain Data Governance. Sustainability 2023, 15, 6968. [Google Scholar] [CrossRef]
- Fan, Z.; Yan, Z.; Wen, S. Deep Learning and Artificial Intelligence in Sustainability: A Review of SDGs, Renewable Energy, and Environmental Health. Sustainability 2023, 15, 13493. [Google Scholar] [CrossRef]






Disclaimer/Publisher’s Note: The statements, opinions and data contained in all publications are solely those of the individual author(s) and contributor(s) and not of MDPI and/or the editor(s). MDPI and/or the editor(s) disclaim responsibility for any injury to people or property resulting from any ideas, methods, instructions or products referred to in the content. |
© 2023 by the authors. Licensee MDPI, Basel, Switzerland. This article is an open access article distributed under the terms and conditions of the Creative Commons Attribution (CC BY) license (https://creativecommons.org/licenses/by/4.0/).
Share and Cite
Dibsi, J.; Cho, J. Data Management for Environmentally Sustainable and Profitable Business: Evidence from the Food Retail Industry. Sustainability 2023, 15, 16298. https://doi.org/10.3390/su152316298
Dibsi J, Cho J. Data Management for Environmentally Sustainable and Profitable Business: Evidence from the Food Retail Industry. Sustainability. 2023; 15(23):16298. https://doi.org/10.3390/su152316298
Chicago/Turabian StyleDibsi, Joudi, and Jaeyoung Cho. 2023. "Data Management for Environmentally Sustainable and Profitable Business: Evidence from the Food Retail Industry" Sustainability 15, no. 23: 16298. https://doi.org/10.3390/su152316298
APA StyleDibsi, J., & Cho, J. (2023). Data Management for Environmentally Sustainable and Profitable Business: Evidence from the Food Retail Industry. Sustainability, 15(23), 16298. https://doi.org/10.3390/su152316298


