Article

Life Cycle-Based Carbon Emission Reduction Benefit Assessment of Centralized Photovoltaic Power Plants in China

1
Department of Environmental Economics and Information, Changsha Environmental Protection College, Changsha 410004, China
2
Shaoxing Ecological Environment Monitoring Center of Zhejiang Province, Shaoxing 312030, China
3
College of Environmental and Resource Sciences, Zhejiang University, Hangzhou 310058, China
4
Zhejiang Ecological Civilization Academy, Huzhou 313300, China
5
Zhejiang Forest Resources Monitoring Center, Hangzhou 310020, China
*
Authors to whom correspondence should be addressed.
Sustainability 2023, 15(23), 16323; https://doi.org/10.3390/su152316323
Submission received: 23 September 2023 / Revised: 31 October 2023 / Accepted: 21 November 2023 / Published: 27 November 2023

Abstract

:
Developing clean energy is the key to reducing greenhouse gas (GHG) emissions and addressing global climate change. Photovoltaic energy systems are considered to be clean and sustainable energy resources due to their wide distribution and easy deployment. However, the environment can still be impacted during the processes from the production to recycling of such systems. Therefore, this study was conducted based on the whole life-cycle analysis to establish a mathematical model for carbon emissions during the processes of production, transportation, and waste disposal of photovoltaic power systems. The main conclusions are as follows. (1) The carbon emissions of a centralized photovoltaic power station with a unit installed capacity of 1 kWp during its entire life cycle would be 2094.40 kg, while the carbon recycling period would last 1.89 years, which would be shorter than the expected life cycle of a photovoltaic system of 25 years, indicating significant environmental benefits. (2) The calculated results from 2022 showed that the newly constructed centralized photovoltaic power stations in China could reduce carbon dioxide emissions by 31,524.26 tons during their life cycles, and their carbon emissions from 1 kWh are approx. 1/10 of those of thermal power generation, which is significantly lower than that of thermal power generation. (3) From the perspective of the soil carbon sequestration capacity and opportunity cost, the economic cost of carbon emissions from the new centralized photovoltaic power stations in China in 2022 was 1.083 billion yuan. (4) The analysis of the relationship using the Granger causality test revealed that, with a lag of one period and a significance level of 5%, the carbon emissions from the new centralized PV power stations from 2013–2022 were the Granger cause of the added value from the secondary industry in China, while the added value from the secondary industry was not the Granger cause of the carbon emissions from the new PV power stations. The findings of the performed study could increase the utilization rate of photovoltaic energy by ensuring it is a secure sustainable low-carbon emission resource, while also reducing the impact of climate change on the planet and promoting individual well-being and social development.

1. Introduction

Since the 1970s, climate change has become one of the greatest global challenges as a result of the third technological revolution [1,2,3,4]. It has been continuously realized by global society that the main causes of global warming are the increasing emissions of GHGs caused by burning fossil fuels, which was discovered as the development in research regarding climate change and atmospheric science took place [5,6,7]. In China, the rapid development of the economy has led to a great demand for fossil fuel energy. Since 2000, carbon emissions in China have been tremendously increasing, and China became the largest energy-consuming nation in the world in 2010 [8,9,10,11,12]. In 2014, carbon emissions in China occupied 28% of the global carbon emissions, which was more than the total emissions of Europe and the United States, and China became the nation with the highest carbon emissions [13,14,15]. Rapid energy consumption and an increase in GHG emissions have caused significant threats to the safety of energy sources as well as the environment [16,17,18,19]. At the same time, this will make it difficult to achieve China’s goal of peaking carbon emissions by 2030 and becoming carbon neutral by 2060, as proposed at the 75th session of the UN General Assembly [20,21]. Therefore, in order to prevent such a circumstance from happening and to reach the goals above, various mechanisms regarding development based on reduced emissions and energy saving are highly necessary, such as a low-carbon strategy and new energy strategy, which would mitigate further increases in carbon dioxide emissions.
Yusuf. N. Chanchangi et al., through their data study, found that photovoltaic (PV) equipment can be used as an alternative to clean energy generation to help Nigeria solve its energy dilemma and achieve its sustainable development goals [22]. Muhammad Hafiizh Imaaduddiin et al., through the use of environmental methods and hydrological analysis, found that the implementation of a micro-hydro power plant in the Batang Regency could be the first step in the transition from fossil fuels to renewable energy in Indonesia [23]. Furthermore, using wind energy to generate electricity can reduce the impact on the environment and support sustainable development, such as eliminating energy poverty, increasing energy penetration, and ensuring long-term energy security [24,25]. These studies showed that renewable energy, including water energy, wind energy, and solar energy, are clean energy sources with relatively low pollution and great development prospects. Among these types, solar energy has advantages in terms of resources, distribution, as well as impacts on the environment as a power generation method, which is expected to play a crucial role in the transformation to low-carbon electricity system. Therefore, photovoltaic (PV) power generation has been widely supported during recent years. In 2016, 71.2 GW (capacity) of new PV power generators were installed globally, 34.2 GW of which were installed in China (48%). During the first three quarters of 2017, the newly installed PV power generators accounted for 43 GW and the cumulative installation accounted for 120 GW, which increased by 2.6% compared to the previous year [26,27]. In 2022, the newly installed and grid-connected PV power generators accounted for 87.4 GW, including 36.29 GW from centralized PV power plants and 51.11 GW from distributed PV systems [28]. By the end of 2022, the cumulative grid-connected capacity of PV power generation in China had reached 392.04 GW, including 234.42 GW from centralized PV power plants and 157.62 GW from distributed PV systems, which could indicate great potential for the photovoltaic industry in China as well as a corresponding benefit for carbon emission reduction [29,30,31].
In order to deeply understand the benefit of carbon emission reduction promoted by photovoltaic power generation, the concept of a carbon footprint has been widely introduced in tracking and accounting for carbon emissions. For example, He Bin et al. introduced the concept of a carbon footprint into the production process and established a carbon emission model for the manufacturing process of wind turbine gearboxes to provide guidance for carbon emission reduction in related manufacturing enterprises [32]. Zhou et al. (2017), based on the concepts of the carbon footprint, designed a c-PBOM (carbon emissions-process bill of material) method based on part machining features. This method decomposed the parts into the aggregation of machining features to support the carbon emission strategy [33]. Specifically, a carbon footprint refers to the cumulatively quantified volume of carbon dioxide emissions directly and indirectly caused by some specific activities during the entire life cycle of a product, which is usually represented by CO2 (tons) or CO2 (-eq) [34]. Among the prior research conducted regarding carbon footprints, Barthelmie et al. proposed that the carbon footprint refers to the total amount of carbon dioxide emitted from products or activities during their entire life cycles. However, Larse and Hertwich proposed the concept of the core carbon footprint of a product and believed that the carbon footprint refers to the total amount of GHGs emitted during their entire life cycles [35,36]. As a result, the evaluation of carbon footprints has been widely recognized as one of the methods for quantifying GHG emissions.
The predominant methodologies employed in the research regarding carbon footprints are the input–output analysis, life-cycle assessment [37,38,39], and the methodology stipulated by the Intergovernmental Panel on Climate Change (IPCC), etc. [40,41]. For example, Dong and Geng (2012) conducted a study regarding the characteristics of the direct and indirect carbon footprints of residents in Beijing City using the input–output analysis in 2007 [42]. In other research, Maja et al. assessed the various configurations of power systems using the life-cycle assessment, which aimed to reduce the carbon footprint caused by the Croatian short-ranged ocean shipping department [43]. In addition, Jagmohan Sharma et al. introduced the IPCC methodology to conduct an assessment of the natural hazards under climate change, which explained the new concepts of “the selection of hazard-related vulnerability indicators” and “the evaluation of hazard-specific vulnerability”. Such an approach has improved the contextualization of the assessment and the acceptance of the results [44]. Farhad Farzaneh et al. analyzed the carbon footprint of two size-equivalent automobiles from the raw material production to the manufacturing, transportation, operation, and decommissioning of the automobiles using the life cycle approach. It was found that the use of renewable energy to generate electricity would reduce CO2 emissions [45].
Although numerous proposals regarding the calculation and evaluation of carbon footprints have been introduced by previous scholars, the differences in the calculations of carbon footprints still exist, especially for borders, ranges, units of GHGs, and methodologies [46,47]. Some researchers have focused on the calculations of carbon footprints with specific materials, systems, or processes [48]. Such research has only provided the situation of GHG emissions from macro perspectives, while the carbon evaluation of the objectives during their entire life cycles have been simplified, and the emission of light materials and short-distance transportation have been ignored [49]. Additionally, each accounting program would exhibit specific characteristics, such as climate zones, types of construction, local laws and regulations, etc. Any absence could cause direct impacts on the cumulative carbon emission of the objectives [47]. Consequently, the factors above could lead to inaccuracies in the evaluation of GHG emissions [50].
Given the burgeoning preference for solar energy among policymakers and urban planners as a pivotal means to mitigate their carbon footprint [51], the amount of carbon emissions caused by the production, operation, and recycling of photovoltaic devices would need to be comprehensively realized to improve the effectiveness of carbon reduction by using photovoltaic energy. In this case, a life-cycle assessment has been introduced to conduct a carbon footprint analysis as well as carbon emission accounting. Then, according to the results of the calculation, the economic and environmental benefits caused by the construction of a centralized photovoltaic power station would be analyzed. Such an approach could reflect the potential of carbon reduction from photovoltaic power stations, enhance the research regarding the carbon emissions of photovoltaic power stations in China, and improve the application of life-cycle assessments in accounting for carbon emissions. The results from the performed study would help reduce the carbon emissions of photovoltaic generation devices, improve the use of clean photovoltaic energy, and ensure such energy is sustainable with low carbon emissions, eventually benefiting the development of society.

2. Materials and Methods

Photovoltaic power plants mainly include two types: distributed photovoltaic power plants and centralized photovoltaic power plants. Compared to distributed PV power plants, centralized PV power plants hold certain advantages, such as more freedom in site selection, more flexible operating modes, and more convenient voltage control, etc. According to the statistical data from the National Energy Administration, the cumulative capacity of the installed distributed PV power plants reached 157.62 GW, and the cumulative capacity of the installed centralized PV power plants reached 234.44 GW (60% of the total) by the end of 2022. Thus, centralized PV power plants comprised the main force of the PV industry. (http://www.nea.gov.cn/2023-02/17/c_1310698128.htm, accessed on 1 December 2022) As a result, the centralized PV power plants were selected as the research objectives in this study.

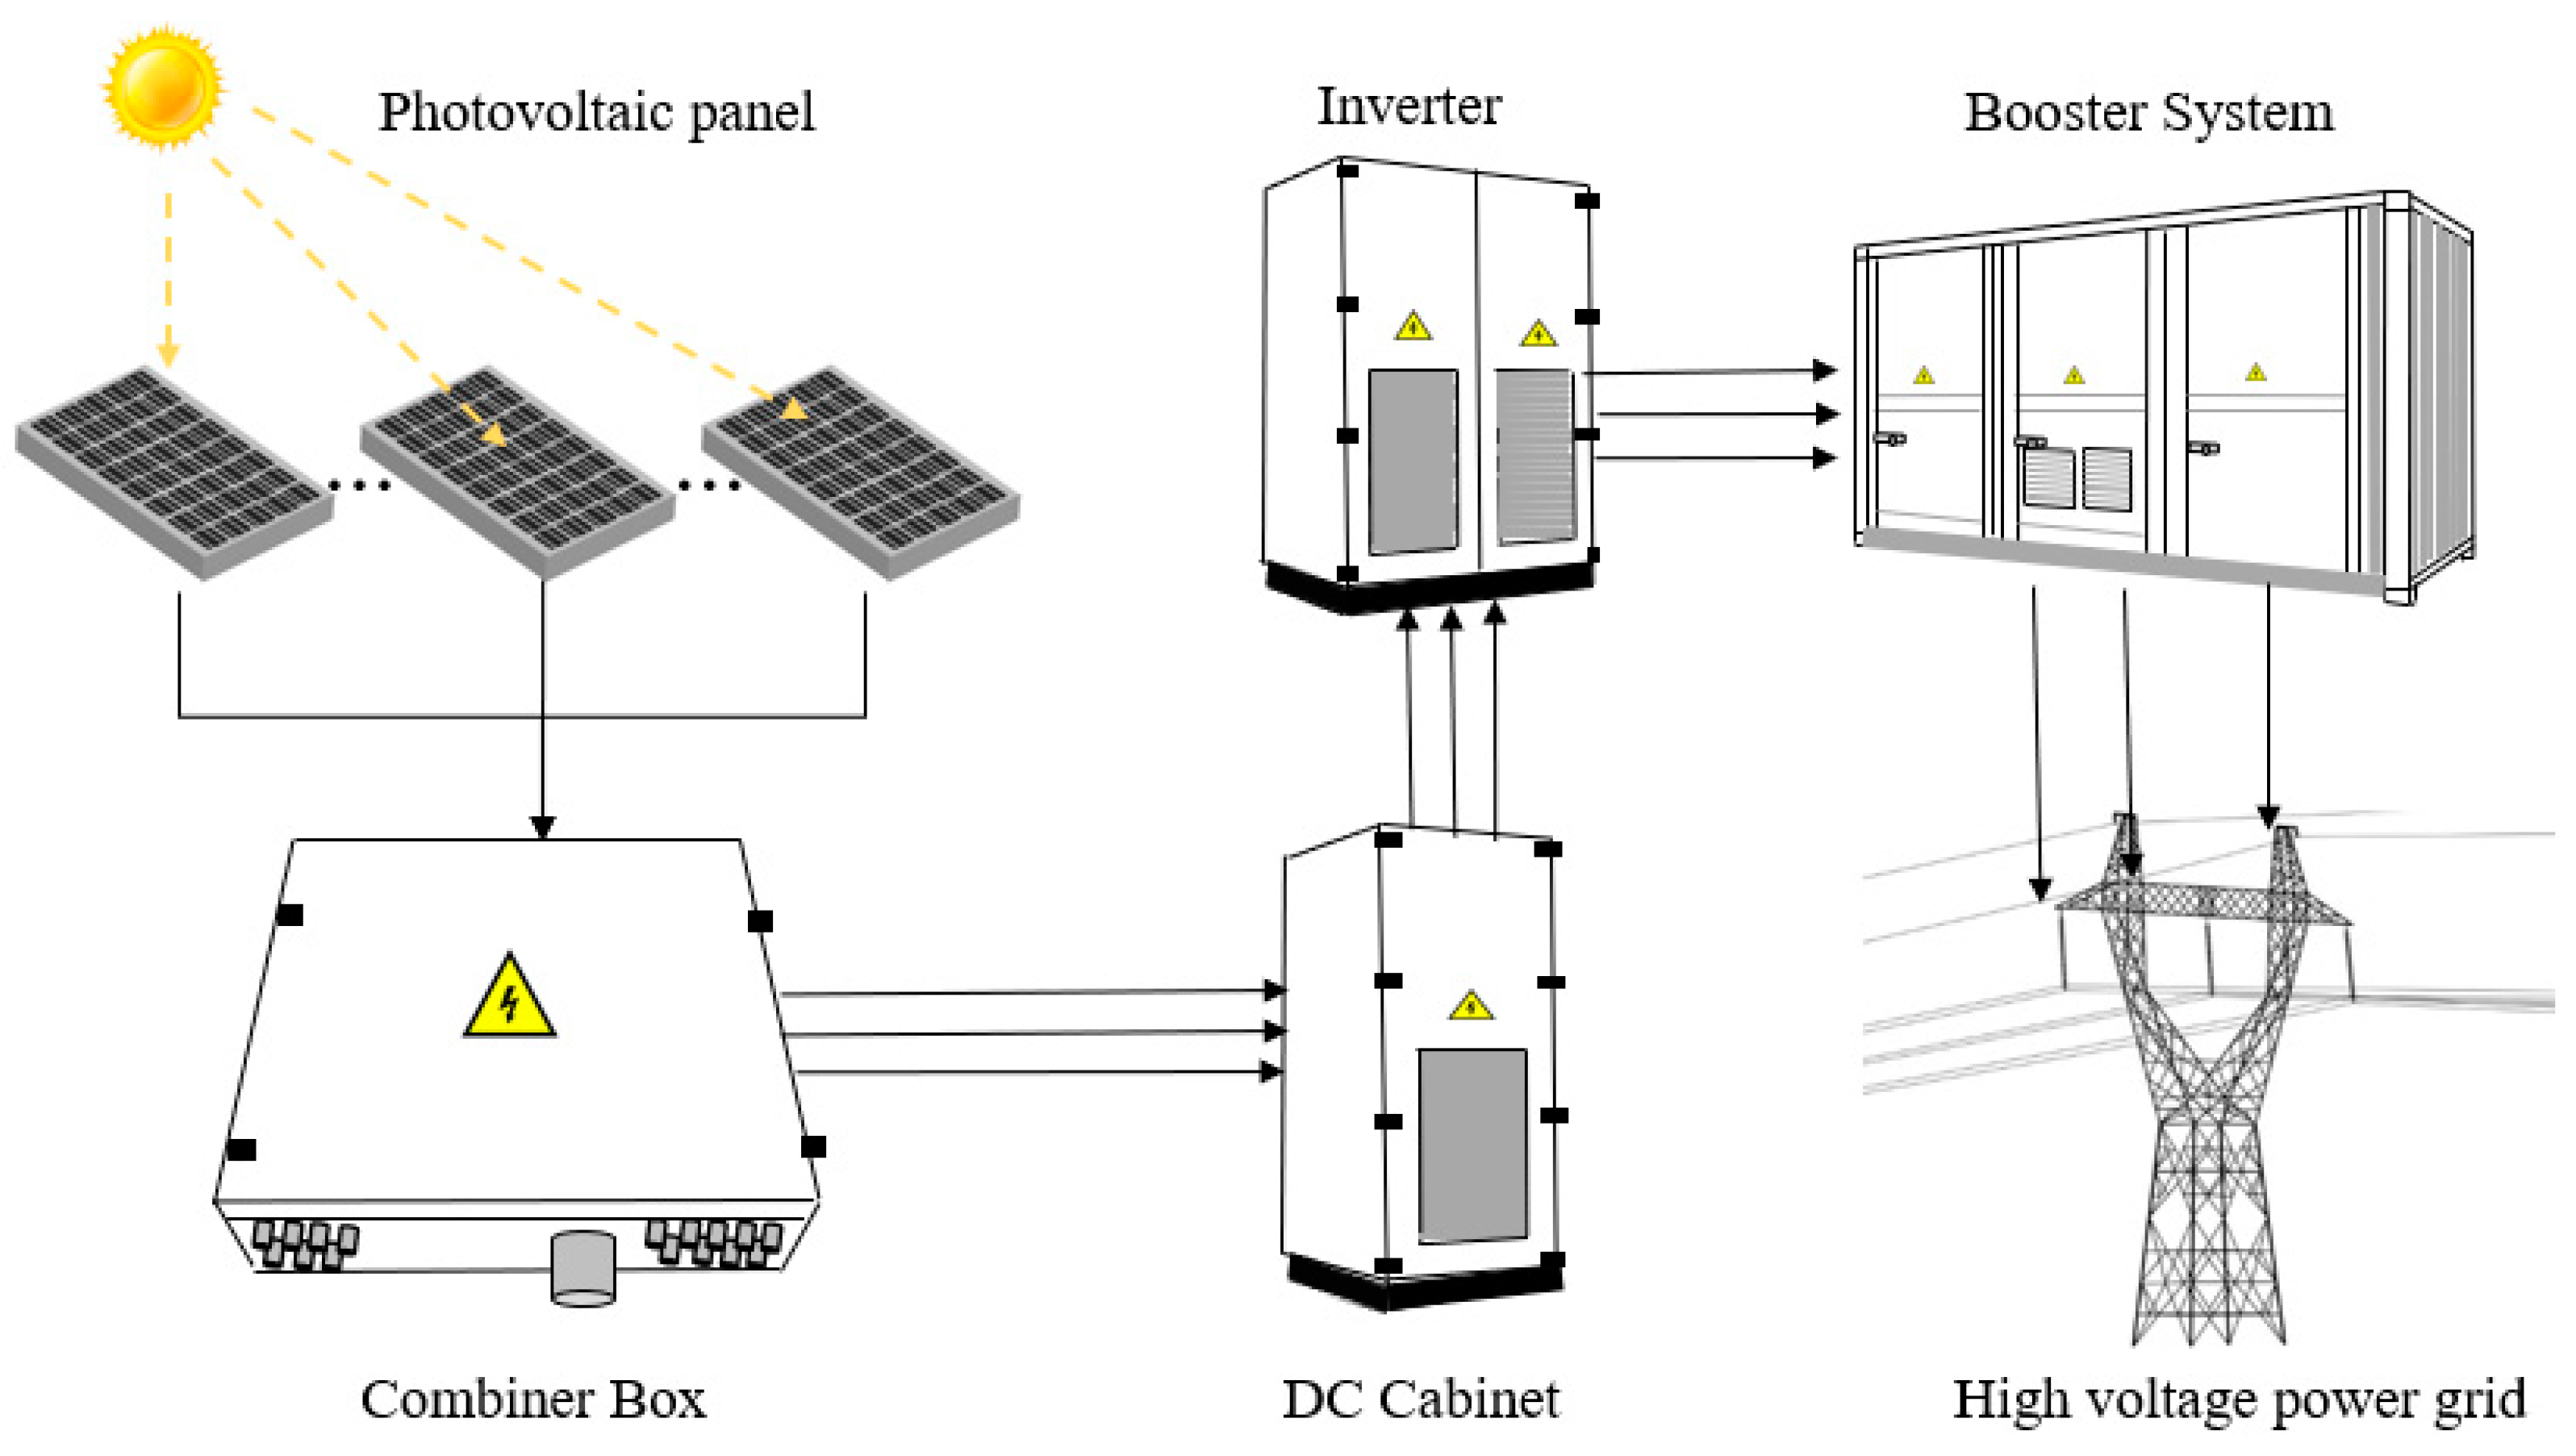
2.1. Scope of Carbon Emission Accounting for the Whole Life Cycle of Centralized PV Power Plants

The equipment required by centralized PV power plants includes solar panels, battery modules, balancing components, junction boxes, DC distribution cabinets, inverters, boosting systems, etc. As depicted in Figure 1, the process of power generation is as follows. Firstly, solar energy is transformed into electric energy through the solar panels, battery modules, and balancing components. Secondly, the produced circuits travel to the DC distribution cabinets through the junction boxes. Lastly, the electricity generated by the PV power plants join the high-voltage grid through the converters and boosting systems, followed by electricity transport [52].

2.2. Carbon Emission Accounting Methods for Centralized Photovoltaic Power Plants

The carbon emission accounting method for the centralized PV power plants should include comprehensive approaches to accurately quantify the advantages of carbon reduction since the processes from the purchases of raw materials to the recycling of materials would cause carbon emissions for the centralized PV power plants. As a result, a life-cycle assessment (LCA) was introduced to conduct an accounting model of the carbon emissions in this study (Figure 2). According to the definition from the International Organization for Standardization (ISO 14040), a LCA is defined as a systematic method which aims to evaluate the impacts that products might have on the environment during their life cycles [53]. Based on such method and concepts, the operations of the centralized PV power plants have been divided into certain categories, as shown in Figure 3, including raw material production, module production, transportation and maintenance, and photovoltaic power plant waste disposal. Such phases would serve as the basis for the calculation of the carbon emission reduction benefits during the operation of the centralized PV power plants.
The production of raw materials includes four major steps, which are the production of industrial silicon, polysilicon, silicon wafer, and cells. Using the production of industrial silicon as an example, the process employs the carbothermal reduction method to utilize the primary material, which is silica ore, while the carbon materials serve as the reducing agent. Such a process involves industrial smelting in an electric furnace container, and the chemical formula is as follows SiO2 + C → Si + CO2. As shown in the formula, carbon dioxide could be produced.
The module production stage mainly includes the production of the battery modules and balancing components. During this stage, various processes would directly and indirectly cause carbon dioxide emissions, including welding, stacking lamination, edge cutting, curing, framing, glue injection, etc. The existing research has shown that indirect carbon dioxide emissions account for more than 90% of the total emissions [55].
Since the distribution of PV companies is dispersed all over the nation with an uneven distribution in industrial chains, carbon emissions during the transportation stage have been difficult to calculate. Therefore, a scenario assumption analysis was introduced in this study to fulfill the calculation of carbon emissions during the entire life cycles of the PV power plants. In detailed assumption, if a company was located in Hangzhou, Zhejiang as the PV components supplier, while a PV power plant was installed in Jiaxing, Zhejiang, the distance between the two locations would be approx. 84.3 km, if the 1 kWp PV components were weighted to 4 metric tons and the fuel consumed by delivering vehicles was 0.2 L diesel per kilometer. Such a scenario was introduced as the standard in this study to account for carbon emissions.
The routine maintenance of centralized PV power plants includes the surface cleaning of the components, stability checking of the fixed parts, and operation checking of the devices in the power plants, etc. Since the personnel, workloads, and required parts are considerably low during the maintenance, the carbon emissions of this process were less than 1% compared to the production stages. Therefore, the carbon emissions of the maintenance stage were not included in the accounting.
Since the late inception of PV power generation in China, the first-generation centralized power plants are still operating. Therefore, the maximum life cycles have not yet been reached and the key component panels have not yet needed to be recycled, resulting in a lack of theories and techniques in the disposal phase. Consequently, the disposal of polycrystalline silicon solar panels was chosen to account for carbon emissions during the disposal phase while considering multiple influencing factors, such as the energy consumed, cost of materials, recycling proportion of the materials, etc. The guideline of the accounting was set according to the pyrolysis recycling process proposed by the China Research Institute of Environmental Sciences (CRIES).
The pyrolysis recycling process can be broken down as follows. Firstly, the aluminum alloy frames of the solar panels should be dismantled manually. After that, the glass and wafers should be separated from the remaining components using high-temperature pyrolysis followed by further recycling the aluminum from the back panels and the silver from the front panels along with the crystalline silicon wafers. Such a process could help obtain more recycled materials. Recycled silicon wafers could be directly used for the production of new silicon wafers since the quality of the recycled ones would have no difference from the new ones. On the other hand, the quality of other recycled materials (steel, glass, aluminum alloy, and silver) would not be suitable for direct reuse due to their inherent losses; the depreciation rate was considered to be 10%.
In the performed study, a carbon emission measurement model was conducted, aiming to quantitively assess the benefit of carbon emission reduction caused by centralized PV power plants. The detailed calculation formulas are as follows.
C = N × C P
In Equation (1), C refers to the national cumulative carbon emissions caused by centralized PV power plants (kg); C P refers to the comprehensive carbon emissions caused by the installed individual PV power generation systems during their corresponding entire life cycles (kg); and N refers to the scale of construction of the centralized PV power plants in China (kWp). In addition, the accurate value of N was retrieved from the official website of the National Energy Administration (http://www.nea.gov.cn/, accessed on 1 December 2022).
C p = M + P + T + W
In Equation (2), M refers to the total carbon emissions during the process of the materials production kg); P refers to the total carbon emissions during the process of the components production (kg); T refers to the total carbon emissions during transportation (kg); and W refers to the total carbon emissions during the disposal period (kg).
(1)
Accounting model of the carbon emissions during the raw materials production stage.
M = i 4 D E i + c × i 4 B i
In Equation (3), D E i refers to the direct amount of carbon emissions caused by the raw materials production (kg); B i refers to the electricity cost during the production of the individual product (kWh); c refers to the carbon emission coefficient of the electricity (kg CO2/kWh). In this equation, i = 1 refers to the production of industrial silicon; i = 2 refers to the production of polysilicon; i = 3 refers to the production of silicon wafers; and i = 4 refers to the production of PV battery cells.
(2)
Accounting model of the carbon emissions during the components production stage.
P = P 1 + P 2
In Equation (4), P 1 refers to the total carbon emissions during the production of the battery modules (kg); P 2 refers to the total carbon emission during the production of the balancing components (kg).
P 1 = c × E p + i n ( R i × R R i )
In Equation (5), Ep refers to the electricity cost during the production of the battery modules (kWh); c refers to the carbon emission coefficient of electricity (kg CO2/kWh); R i refers to the cumulative amount of i material consumed during the current stage; and R R i refers to the carbon emission coefficient of i material consumed during the current stage. In addition, the calculation of P 2 is the same as P 1 .
(3)
Accounting model of the carbon emissions during the transportation phase.
T = D × V × i 3 G W P i × n i
In Equation (6), D refers to the transporting distance of diesel trucks (km); V refers to the amount of diesel consumed per kilometer by the diesel trucks (L/km); G W P i refers to the greenhouse effect potential of CO2, CH4, and N2O; and n i refers to the GHG emission factor for diesel (kg/L).
(4)
Accounting model of the carbon emissions during the PV power plant waste disposal phase.
W = W 1 + W 2 W 3
In Equation (7), W 1 refers to the total carbon emissions caused by the energy consumption during this phase (kg); W 2 refers to the total carbon emissions caused by the disposal of various wastes during this phase (kg); and W 3 refers to the total carbon emission deducted by the recycled materials during this phase (kg).
W 1 = c × E
In Equation (8), E refers to the electricity consumption during this phase (kWh) and c refers to the carbon emission coefficient of electricity (kg CO2/kWh).
W 2 = i n ( S i × R S i )
In Equation (9), S i refers to the amount of i resource consumed during this phase (kg) and R S i refers to the carbon emission coefficient of i resource (kg).
W 3 = i n t i × R t i × 1 δ i
In Equation (10), t i refers to the amount of i resource that could be reused after recycling (kg); R t i refers to the carbon emission coefficient of i resource; and δ i refers to the depreciation rate of i resource.

2.3. Data Collection

The data included in the performed study were collected through the following ways: (1) technical reports from relevant PV companies; (2) relative scholars, reports from international organizations, and databases, including Eco-invent (http://ecoinvent.org/, accessed on 1 December 2022), the CLCD (http://ghgprotocol.org/Third-Party-Databases/CLCD, accessed on 1 December 2022), CPCD (http://lca.cityghg.com/, accessed on 1 December 2022); and (3) the “China Statistic Yearbook” and other relative governmental websites and documentations. The required parameters for the comprehensive calculation of carbon emissions are listed in Table 1, Table 2, Table 3 and Table 4.

3. Calculation Results of the Carbon Emissions of PV Power Generation

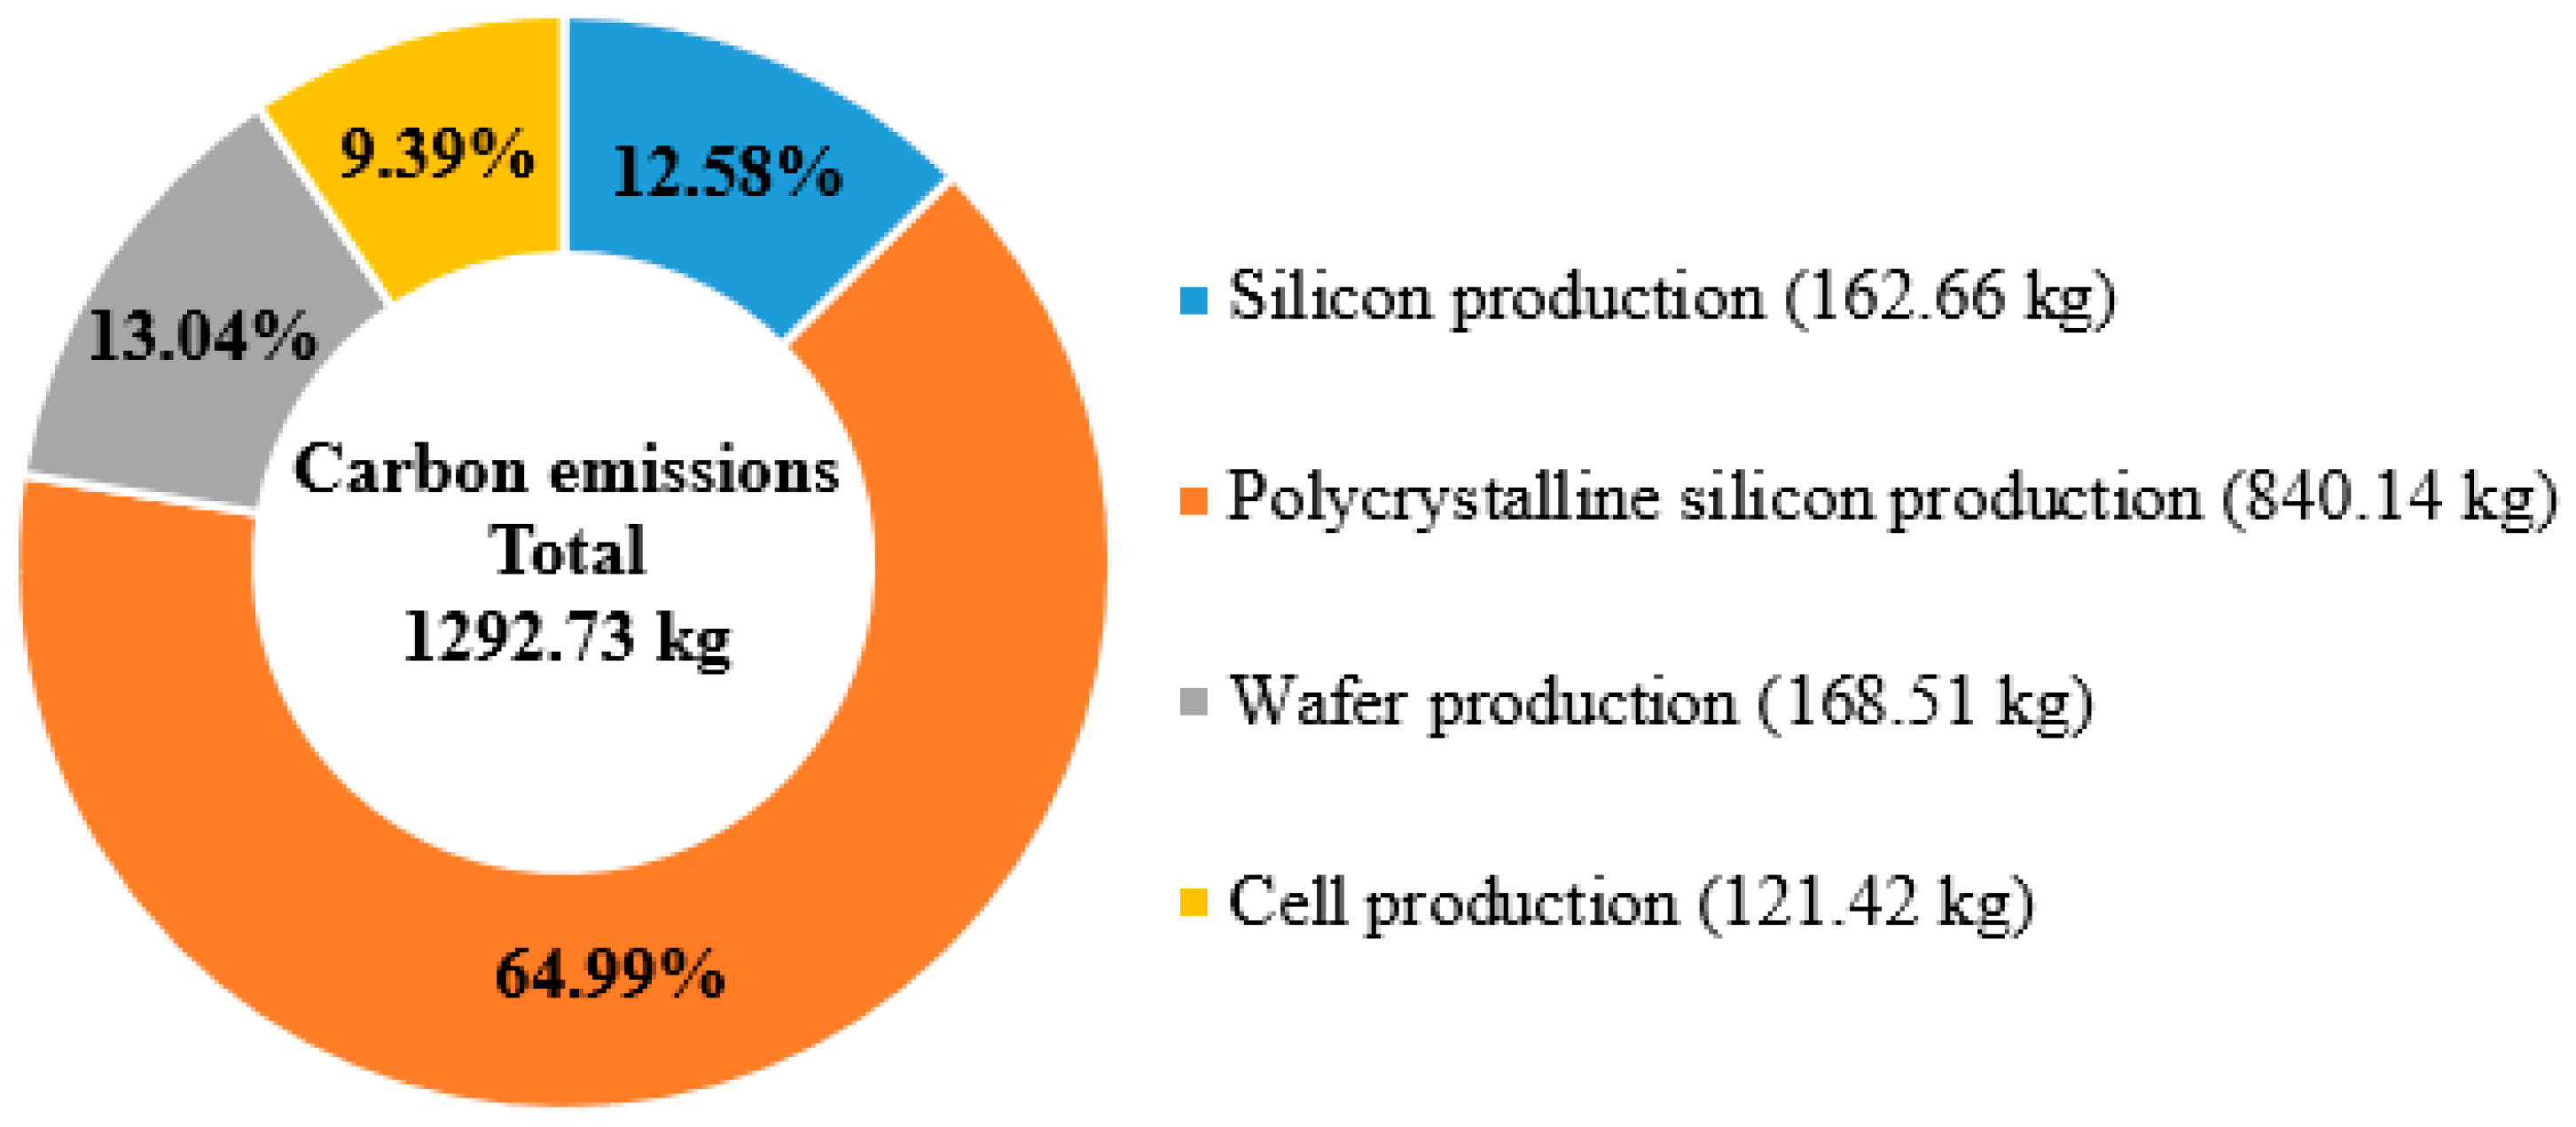
3.1. Carbon Emissions during the Raw Materials Production Stage

The carbon emission coefficient c was retrieved from the China Life Cycle Database of Basic Data (CLCD, 2023), where c was set as 0.96 kg CO2/kWh. The results of the calculation are shown in Figure 4.
As shown in Figure 4, the total carbon emissions during the raw materials production stage for the 1 kWp centralized PV power plants were calculated as 1292.73 kg. The production of polysilicon contributed the most among all the materials, which occupied 64.99%. This was followed by the production of silicon wafers and industrial silicon, which contributed 13.04% and 12.58%, respectively. The lowest contribution of carbon emissions during this stage was for the production of battery cells, which accounted for 9.39%.

3.2. Carbon Emissions during the Modules Production Stage

The data required to calculate the carbon emissions during the production of the battery modules are listed in Table 2. The research of Mi et al. was introduced in this study since an inventory of the data from the balancing components is currently lacking in China [56]. The individual consumption of electricity was set to 310 kWh/kWp for the converters and frames installation, and the calculation results are shown in Table 5.
As shown in Table 5, the total carbon emissions during the modules production stage for the 1 kWp centralized PV power plants were calculated as 1001.02 kg. The production of the balancing components contributed the most to the carbon emissions, which occupied 59.46% of the total amount, while the production of the battery modules only contributed 40.54% to the total amount.

3.3. Carbon Emissions during the Transportation Phase

The carbon emissions during the transportation phase were analyzed through scenario assumptions, and the required data are shown in Table 3. The greenhouse effect potentials and the emission factors of CO2, CH4, and N2O are listed in Table 6 and Table 7. These data were retrieved from the relative files from the IPCC.
The total carbon emissions during the transportation phase for the 1 kWp centralized PV power plants were calculated as 46.80 kg.

3.4. Carbon Emissions during the Waste Disposal Phase

The data required for the calculation of carbon emissions during the waste disposal phase are listed in Table 4, and the results of the calculation are shown in Table 8.
As shown in Table 8, the total carbon emissions during the waste disposal phase for the centralized PV power plants was calculated as −246.15 kg. The energy and resources consumption caused carbon emissions, with the energy consumption occupying 79.99% and the resources consumption occupying 20.01%. Since some of the waste and their accessional materials could be recycled during this phase, the carbon emissions could be reduced by 400.06 kg for the 1 kWp centralized PV power plants.
To sum up, the total CO2 emissions of the 1 kWp centralized PV power plants during their entire life cycles were calculated as 2094.40 kg. Within the total amount, the contributions from the life cycle stages are listed in Table 9. The ranking was determined as the raw material production stage followed by the module production stage, transportation and maintenance phase, and waste disposal phase.

4. Discussion and Evaluation of the Carbon Emissions Reduction Effects of Centralized PV Power Generation

The construction and operation of centralized PV power plants could significantly help China achieve the goal of “double carbon”. In order to accurately quantify and evaluate the advantages of carbon emissions reduction caused by centralized PV power plants, relative formulas were introduced to calculate the amount of power generated and the carbon recycle term of the 1 kWp centralized PV power plants in the first place. After that, the amount of carbon emissions caused by the newly constructed centralized PV power plants were compared between 2013 and 2022, which aimed to analyze the benefits of the development of techniques for carbon emissions reduction. Lastly, the economic effects were assessed based on the opportunity cost and the relationship between the installed PV power generation and the surpassing value of the secondary industry of China using Granger causality tests.

4.1. Calculation of Carbon Benefits of Photovoltaic Systems

4.1.1. Calculation of the Carbon Payback Period for Centralized PV Power Generation

The term payback period can be defined as the time consumed to retrieve all the investment profits during the operation of certain programs [47]. The carbon payback period could be understood as an extension of the investment payback period, which would specifically constitute the recycling time of the direct and indirect carbon emissions during the life cycles of the PV power generation systems. Such an indicator is important to evaluate the carbon emission reduction effects of the PV power generation systems. Before calculating the carbon payback period, the amount of power generated by the PV power generation systems during their entire life cycles should be determined [57,58].
The formula for the amount of power generated by the PV power plants in the first year is shown as follows.
E p = H A × K × P A Z
In Equation (11), Ep refers to the total amount of power generated during the first year at the centralized power plants (kWh); H A refers to the annual amount of solar radiation received by the horizontal planes (kWh/m2); K refers to the system efficiency coefficient; and P A Z refers to the installed capacity of the system.
According to the “China Wind and Solar Energy Resources Annual Bulletin 2022”, the average annual solar radiation received by the horizontal planes for power generation reached 1563.4 kWh/m2, while the average annual solar radiation received by the planes with optimal slanting reached 1815.8 kWh/m2. Considering that solar panels should be arranged in lines with tilted angles during installation to receive the greatest amount of incoming solar radiation, the H A value was calculated as 1815.8 kWh/m2. The existing research has proved that the efficiency of grid-connected PV power plants would usually be 80%, thus the value of K was calculated as 0.8. Lastly, the amount of power generated by the centralized power plants with an installed system capacity of 1 kWp ( P A Z ) in the first year was calculated as 1452.64 kWh ( E p ).
The formula for the amount of power generated by the centralized PV power plants is shown as follows.
E T = E p × i = 1 m 1 ε m i 1
In Equation (12), E T refers to the total amount of power generated by the centralized PV power plants during their entire life cycles (kWh); E p refers to the amount of power generated by the centralized PV power plants in the first year (kWh); m refers to the service life of the PV power generation systems (year); and ε m refers to the annual average depreciation rate of the PV power generation systems (%).
The formula for the annual average amount of power generated by the PV power plants during its life cycle is shown as follows.
E m = E T ÷ m
In Equation (13), E m refers to the annual average amount of power generated by the centralized PV power plants (kWh/year); E T refers to the total amount of power generated by the centralized PV power plants during their entire life cycles (kWh); and m refers to the service life of the PV power generation systems (year).
Relative research has shown that the service life of the PV power generation systems was 25 years (m = 25) and the annual average depreciation rate of the PV power generation systems was 2% ( ε m = 2%). Therefore, the total amount of power generated by the centralized PV power plants of 1 kWp during their entire life cycles ( E T ) was 28,801.15 kWh, while the annual average amount of power generated ( E m ) was 1152.02 kWh/year.
The formula for the calculation of the carbon recycling period of the centralized PV power plants is shown as follows.
N p = C ÷ E m × c
In Equation (14), N p refers to the carbon recycling period of the centralized PV power plants (year); C refers to the total amount of carbon emissions from the centralized PV power plants during their entire life cycles (kg); E m refers to the result from Equation (13); and c refers to the carbon emission coefficient of electricity (kg/kWh).
Among the variants above, the value of C was calculated in the previous part (Part 3) as 2094.40 kg/kWp, while the value of Em was 1152.05 kWh and the value of c was 0.96 kg/kWh. As a result, the value of N p was calculated as 1.89 years, indicating that the carbon recycling period of the centralized PV power plants was 1.89 years. The result showed that the carbon recycling period (1.89 years) was much less than the service life (25 years) of the centralized PV power plants, indicating outstanding environmental benefits since the carbon emissions could be recycled in a short period of time.

4.1.2. Calculation of the Carbon Dioxide Reduction by the Centralized PV Power Plants

The total amount of carbon emissions from the 1 kWp centralized PV power plants during their entire life cycles was calculated as 2094.40 kg, thus the emission intensity of the centralized PV power plants was calculated as 72.72 g/kWh. Compared to the carbon emission intensity of the East China Region Grid, according to the “Baseline Emission Factors for China Regional Grids in the Emission Reduction Project 2019” (792.1 g/kWh), the benefits of carbon reduction caused by the centralized PV power plants could be calculated as the amount of carbon emissions caused by the centralized PV power plants when generating 1 kWh, which would only be 10% of the carbon emissions caused by the coal-fired power plant when generating same amount of electricity. Under such circumstances, the continuous calculation of the amount of carbon dioxide emission reduction caused by the newly constructed centralized PV power plants was conducted in the following contents. Specifically, the “amount of carbon emissions reduction” refers to the amount of carbon dioxide emission reduction caused by replacing traditional energy resource (coal-fired)-driven power plants with centralized PV power plants during their entire life cycles.
The formula for the calculation of the total carbon emission reduction in the centralized PV power plants during their entire life cycles is shown as follows.
C r = c m C p ÷ E T × n × 10 3
In Equation (15), Cr refers to the total amount of carbon emission reduction in the centralized PV power plants during their entire life cycles (t); cm refers to the intensity of carbon emissions in the grids in China (kg/kWh); C p refers to the total amount of carbon emissions caused by the production of the 1 kWp PV power generation systems (kg); E T refers to the total amount of power generated by the centralized PV power plants during the entire life cycles (kWh); and n refers to the scale of the newly constructed centralized PV power plants in China in 2022 (kW).
Due to the differences in the intensity of carbon emissions between the different regions in China, Cm was calculated using the average intensity of the grids in different regions, according to the “Baseline Emission Factors of China’s Regional Power Grids 2016”, which resulted in c m = 0.9413 kg/kWh. Based on the relative documentation published by the National Energy Administration, the scale of the newly constructed centralized PV power plants in China in 2022 has accounted for 36.294 million kW, resulting in C r = 31,524.26 t CO2. The results of the calculation demonstrate that the newly constructed centralized PV power plants could reduce approx. 31,524.26 t of CO2 emissions during their life cycles compared to coal-fired power plants generating the same amount of power.

4.1.3. Comparison between the Carbon Emissions Caused by the Newly Constructed Centralized PV Power Plants in 2013 and 2022

The previous calculations clearly proved that the centralized PV power plants have outstanding advantages for reducing carbon emissions compared to traditional coal-fired power plants. Since China started the PV industry in 2002, development has lasted more than 20 years [59,60]. During this period, the techniques required for the production stages of PV power generation have been significantly improved, which have also developed the goal of a better reduction in carbon emissions. Therefore, the benefits of carbon emission reduction caused by the centralized PV power plants have not only been shown in comparison with the coal-fired power plants but have also been shown in the evolution of the techniques itself.
The related data of the carbon emissions from the centralized PV power plants with a unit installed capacity were calculated. The results are shown in Table 10. The magnitude of change refers to the changes compared to the carbon emissions of each stage in 2022.
As shown in Table 10, the amount of carbon emissions from the 1 kWp centralized PV power plants during their entire life cycles experienced a significant decrease compared to 2013. The stage with the greatest carbon emissions decrease was the production of silicon wafers (−49.91%), followed by the production of battery cells (−44.75%). However, each stage/phase experienced a significant decrease except for the production of industrial silicon, transportation, maintenance, and waste disposal. The data above demonstrated that the improvement of the benefits of carbon emissions reduction caused by the centralized PV power plants was driven by the development of the techniques.

4.2. Assumption of the Economic Cost of Centralized PV Power Generation

The concept of “carbon” in soil science and the concept of “opportunity cost” have been introduced to assume the economic cost of the construction of the centralized PV power plants using a scenario assumption analysis [61,62].
The soil itself has been assumed to absorb and store the carbon dioxide emissions caused by PV power generation, thus the formula to calculate the area of land required to store carbon dioxide is shown as follows.
h = C p ÷ ρ
In Equation (16), C p refers to the total carbon emissions of the 1 kWp centralized PV power plants during their entire life cycles (kg); ρ refers to the density of the carbon, which was determined as 12.33 kg/m2, according to the Forest Bureau; and h refers to the area of land required to perform the “carbon sequestration capacity” (m2). Based on the result of C p that was calculated previously, h was calculated as 169.86 m2, which meant that the “carbon sequestration capacity” would require an area of 169.86 m2 for the carbon dioxide emissions caused by the 1 kWp centralized PV power plants. If such land was further assumed as agricultural land where the main crops of China would be planted, the profit gained after harvesting these crops would be the economic cost of carbon reduction. The main crops of China include paddy, wheat, and corn. If they could be planted on such land, the formula for the calculation of the economic cost would be as follows.
f = 1 3 × R 1 + R 2 + R 3
In Equation (17), f refers to the total profit gained after harvesting the three types of crops listed above, which is also the economic cost of the carbon reduction. R 1 , R 2 , and R 3 refer to the profit gained after harvesting the paddy, wheat, and corn. According to the “China Rural Statistic Yearbook 2022”, the profits gained after harvesting these three types of crops in 2021 is listed in Table 11.
Finally, the profit gained from the three types of crops was calculated as f = 29.839 Yuan/kWp, while the scale of the newly constructed centralized PV power plants reached 36.294 million kw in 2022. Therefore, the economic cost of carbon reduction in 2022 reached 1.083 billion Yuan.

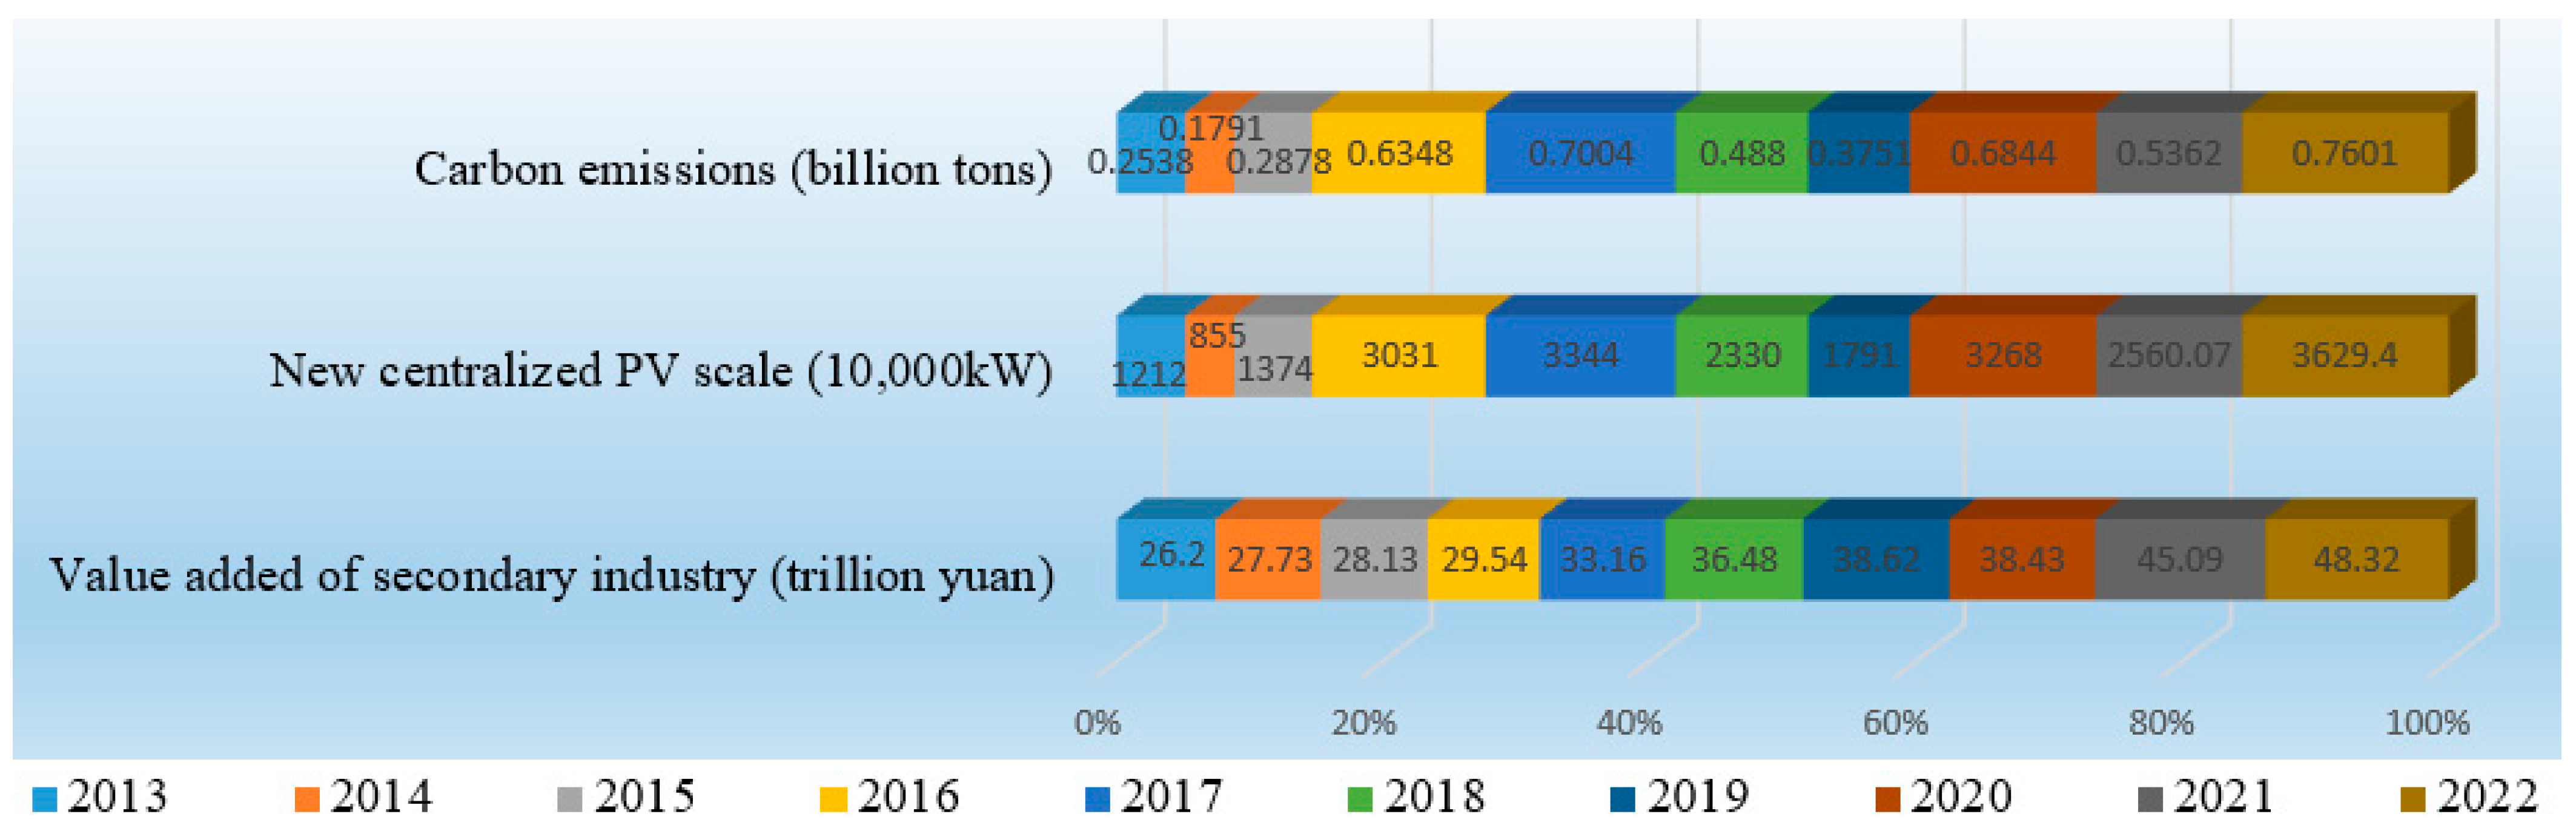
4.3. Evaluation of the Relationship between the Carbon Emissions of PV Power Generation and the Development of the Economy

It was previously shown that the centralized PV power plants could significantly reduce carbon emissions during their entire life cycles. However, the listed analysis conducted in the previous parts demonstrated that certain stages of operation for the centralized PV power plants would result in solid waste, nitrogen oxide, and other pollutants during their entire life cycles. Therefore, the centralized PV power plants would have both positive and negative impacts on the environment, and the corresponding impacts on the development of the economy should require detailed investigation.
The following part will consider the surpassing value in the secondary industry of China and the newly constructed centralized PV power plants in each year from 2013 to 2022. According to the amount of total carbon emissions C p from the 1 kWp centralized PV power plants that were previously calculated, the amount of carbon emissions caused by the newly constructed centralized PV power plants were calculated for each year, which could help establish a single-factor model between the carbon emissions of the PV industry and the surpassing value of the secondary industry. The results were tested using the Granger causality test to analyze the relationship between these two factors [63,64]. The detailed data are shown in Figure 5.
The results of the Granger causality test are shown in Table 12. With a lag period of one period and a significance level of 5%, the carbon emissions from the new centralized PV power stations were the Granger cause of the added value of the secondary industry in China, while the added value of the secondary industry was not the Granger cause of the carbon emissions from the new PV power stations. It can be preliminarily judged that the increase in the construction scale of centralized PV power plants can promote the development of China’s secondary industry and enhance the development speed of the secondary industry.

4.4. Policy Recommendations

Compared to thermal power generation, the construction and application of centralized photovoltaic (PV) power plants reduces a large amount of carbon emissions, but the carbon emissions generated during its life cycle cannot be ignored. The difference in carbon emissions from China’s centralized PV power plants in 2013 and 2022 shows that technical process improvement can help centralized PV power plants further enhance their carbon emission reduction benefits. Therefore, relevant enterprises should further improve solar PV cell production and module manufacturing technology, reduce energy consumption in the production process, and improve the use of raw materials. The state should further improve the requirements for production licenses, quality certifications, and technical energy consumption in PV production to promote technological innovation and eliminate backward production capacity. In addition, state subsidies should be provided to support the PV industry and encourage the construction of centralized PV power plants to further promote the gradual replacement of traditional fossil energy with clean energy.
In view of the current situation that the waste disposal scheme of the centralized PV power plants is unknown and the economic cost is relatively high, relevant research institutions and enterprises should actively explore and optimize the recycling and disposal reuse technology of the centralized PV power plants to control the relevant cost, reduce the negative impact on the environment, and realize the recycling of resources. At the same time, the state should gradually replace traditional transportation vehicles with electric vehicles to reduce the carbon emissions of the centralized PV power plants in the transportation and maintenance phases.

4.5. Limitations and Future Work

Despite our progress, this study still had some limitations that could be improved upon in the future. In this study, some specific processes were simplified due to conditional reasons when conducting a carbon footprint model of a PV power plant, while the scenario assumption might have also caused overall inaccuracy. For example, for the type of batteries involved in the PV system, we assumed that all the electricity generated was fed into the grid. The study only considered the part of the battery module that worked together with the PV panels form the PV system. The battery used to store electricity was not taken into account, and the carbon emissions of the PV system may not have been accurate enough. For future research, more typical study areas and more detailed conditions should be added to conduct more comprehensive processes regarding the operation of the PV power plants, which would also make the model more accurate for analysis. During the data analysis process of the performed study, the data introduced were collected from the existing scholars and database since some of the data were difficult to retrieve. If the data, in reality, could be used in the future, some mismatch might exist from the calculated results in the performed study. Therefore, the development and application of a local database in the future could help establish an evaluation database which would be suitable for the current industrial development in China.

5. Conclusions

The performed study conducted a carbon footprint model to calculate the benefit of carbon reduction and advantages in the economy of centralized PV power plants in order to demonstrate the carbon emissions related to the equipment of centralized PV power stations and quantify the benefits of carbon reduction caused by PV energy. The main conclusions are listed as follows. (1) The research was conducted based on centralized PV power plants in China using the life-cycle assessment and scenario assumption to conduct a carbon footprint accounting model, in which the total amount of carbon emissions caused by 1 kWp centralized PV power plants was calculated as 2094.40 kg during their entire life cycles. (2) The carbon recycling period of a 1 kWp centralized PV power plant was determined to be 1.89 years, which was much shorter than the service life of 25 years, while the carbon emissions reduction model showed that newly constructed centralized PV power plants reduced 31524.26 metric tons of carbon dioxide emissions in 2022 during their entire life cycles, showing outstanding benefits for the environment. (3) Advancements in techniques caused significant impacts on the benefits of carbon reduction based on the calculation results of carbon emissions caused by the centralized PV power plants installed from 2013 to 2020. On the other hand, the economic cost of the centralized PV power plants in 2022 was estimated to be 1.083 billion Yuan from the perspectives of the “carbon sequestration capacity” and “opportunity cost”. (4) Lastly, the relationship between the carbon emissions of the newly constructed centralized PV power plants and the surpassing value of the secondary industry of China was analyzed by the Granger causality test. The results showed that at a lag of one period and a significance level of 5%, the carbon emissions from the new centralized PV power plants were the Granger cause of the added value from the secondary industry in China, while the added value from the secondary industry was not the Granger cause of carbon emissions from new PV power plants. The findings of the performed study could increase the utilization rate of photovoltaic energy by ensuring it is a secure sustainable low-carbon emission resource, while reducing the impact of climate change on the planet and promoting individual well-being and social development.

Author Contributions

Conceptualization, Y.D., B.J. and L.X.; methodology, W.C. and J.W.; software, P.L. and L.X.; validation, C.H., J.D. and Q.Y.; formal analysis, J.D.; investigation, Q.Y. and J.W.; resources, J.D.; data curation, L.X.; writing—original draft preparation, Y.D., B.J. and L.X.; writing—review and editing, L.X.; visualization, L.X.; supervision, L.X.; project administration, B.J.; funding acquisition, J.D. All authors have read and agreed to the published version of the manuscript.

Funding

This research was funded by the National Natural Science Foundation of China (22376179), science and technology fundamental resources investigation programme (2023FY100100), and the ZJU-ZCCC Institute of Collaborative Innovation (ZDJG2021005).

Institutional Review Board Statement

Not applicable.

Informed Consent Statement

Not applicable.

Data Availability Statement

Data are contained within the article.

Conflicts of Interest

The authors declare no conflict of interest.

References

  1. Du, L.; Li, X.; Zhao, H.; Ma, W.; Jiang, P. System dynamic modeling of urban carbon emissions based on the regional National Economy and Social Development Plan: A case study of Shanghai city. J. Clean. Prod. 2018, 172, 1501–1513. [Google Scholar] [CrossRef]
  2. Filippov, S. New Technological Revolution and Energy Requirements. Foresight STI Gov. 2018, 12, 20–33. [Google Scholar] [CrossRef]
  3. Yan, Z.; Ding, Y.; Zhai, P.; Song, L.; Cao, L.; Li, Z. Re-Assessing Climatic Warming in China since 1900. J. Meteorol. Res. 2020, 34, 243–251. [Google Scholar] [CrossRef]
  4. Pacifici, M.; Foden, W.B.; Visconti, P.; Watson, J.E.M.; Butchart, S.H.M.; Kovacs, K.M.; Scheffers, B.R.; Hole, D.G.; Martin, T.G.; Akçakaya, H.R.; et al. Assessing species vulnerability to climate change. Nat. Clim. Change 2015, 5, 215–224. [Google Scholar] [CrossRef]
  5. Manabe, S. Role of greenhouse gas in climate change. Tellus A Dyn. Meteorol. Oceanogr. 2019, 71, 1620078. [Google Scholar] [CrossRef]
  6. Gillingham, K.; Stock, J.H. The Cost of Reducing Greenhouse Gas Emissions. J. Econ. Perspect. 2018, 32, 53–72. [Google Scholar] [CrossRef]
  7. Oertel, C.; Matschullat, J.; Zurba, K.; Zimmermann, F.; Erasmi, S. Greenhouse gas emissions from soils—A review. Geochemistry 2016, 76, 327–352. [Google Scholar] [CrossRef]
  8. Lv, W.; Hong, X.; Fang, K. Chinese regional energy efficiency change and its determinants analysis: Malmquist index and Tobit model. Ann. Oper. Res. 2012, 228, 9–22. [Google Scholar] [CrossRef]
  9. Liu, Z.; Guan, D.; Wei, W.; Davis, S.J.; Ciais, P.; Bai, J.; Peng, S.; Zhang, Q.; Hubacek, K.; Marland, G.; et al. Reduced carbon emission estimates from fossil fuel combustion and cement production in China. Nature 2015, 524, 335–338. [Google Scholar] [CrossRef]
  10. Zheng, J.; Mi, Z.; Coffman, D.M.; Milcheva, S.; Shan, Y.; Guan, D.; Wang, S. Regional development and carbon emissions in China. Energy Econ. 2019, 81, 25–36. [Google Scholar] [CrossRef]
  11. Tang, R.; Zhao, J.; Liu, Y.; Huang, X.; Zhang, Y.; Zhou, D.; Ding, A.; Nielsen, C.P.; Wang, H. Air quality and health co-benefits of China’s carbon dioxide emissions peaking before 2030. Nat. Commun. 2022, 13, 1008. [Google Scholar] [CrossRef] [PubMed]
  12. Du, D.; Lu, Y.; Li, Q.; Zhou, Y.; Cao, T.; Cui, H.; Han, G. Estimating industrial process emission and assessing carbon dioxide equivalent of perfluorooctanoic acid (PFOA) and its salts in China. Sci Total Environ. 2023, 867, 161507. [Google Scholar] [CrossRef] [PubMed]
  13. Wang, Z.; Geng, L. Carbon emissions calculation from municipal solid waste and the influencing factors analysis in China. J. Clean. Prod. 2015, 104, 177–184. [Google Scholar] [CrossRef]
  14. Lai, S.; Lu, J.; Luo, X.; Ge, J. Carbon emission evaluation model and carbon reduction strategies for newly urbanized areas. Sustain. Prod. Consum. 2022, 31, 13–25. [Google Scholar] [CrossRef]
  15. Dudley, B.; Pureprint Group Limited, UK. BP Statistical Review of World Energy 2016. 2019. Available online: https://www.bp.com/content/dam/bp/business-sites/en/global/corporate/pdfs/news-and-insights/speeches/bp-statistical-review-of-world-energy-2016-bob-dudley-speech.pdf (accessed on 1 December 2022).
  16. Wu, J.; Tang, G.; Wang, R.; Yanwei, S. Multi-Objective Optimization for China’s Power Carbon Emission Reduction by 2035. J. Therm. Sci. 2019, 28, 184–194. [Google Scholar] [CrossRef]
  17. Wen, L.; Diao, P. Simulation study on carbon emission of China’s electricity supply and demand under the dual-carbon target. J. Clean. Prod. 2022, 379, 134654. [Google Scholar] [CrossRef]
  18. Lin, B.; Wang, Y. Does energy poverty really exist in China? From the perspective of residential electricity consumption. Energy Policy 2020, 143, 111557. [Google Scholar] [CrossRef]
  19. National Bureau of Statistics of China. National Data. 2020. Available online: http://www.stats.gov.cn/english/ (accessed on 1 December 2022).
  20. Jinping, X.J.; Ministry of Foreign Affairs of the People’s Republic of China. Statement by HE Xi Jinping President of the People’s Republic of China at the General Debate of the 75th Session of The United Nations General Assembly. 2020. Available online: https://www.gov.cn/xinwen/2020-09/22/content_5546168.htm (accessed on 1 December 2022).
  21. Wu, Y.; Xu, B. When will China’s carbon emissions peak? Evidence from judgment criteria and emissions reduction paths. Energy Rep. 2022, 8, 8722–8735. [Google Scholar] [CrossRef]
  22. Chanchangi, Y.N.; Adu, F.; Ghosh, A.; Sundaram, S.; Mallick, T.K. Nigeria’s energy review: Focusing on solar energy potential and penetration. Environ. Dev. Sustain. 2022, 25, 5755–5796. [Google Scholar] [CrossRef]
  23. Imaaduddiin, M.H.; Utama, W.; Jasikur, C.; Lestari, W.; Aini, A.N. Potential for Renewable Energy Generation from Water Sources in the Batang River Area. Environ. Res. Eng. Manag. 2023, 79, 80–89. [Google Scholar] [CrossRef]
  24. Zhou, X.; Lin, J.; Wang, L.; Huang, H.; Zhao, X. Wind power resources and China’s sustainable development roadmap: Evidence from China. Resour. Policy 2022, 79, 103015. [Google Scholar] [CrossRef]
  25. Yu, G.; Liu, C.; Tang, B.; Chen, R.; Lu, L.; Cui, C.; Hu, Y.; Shen, L.; Muyeen, S.M. Short term wind power prediction for regional wind farms based on spatial-temporal characteristic distribution. Renew. Energy 2022, 199, 599–612. [Google Scholar] [CrossRef]
  26. Kabir, E.; Kumar, P.; Kumar, S.; Adelodun, A.A.; Kim, K.-H. Solar energy: Potential and future prospects. Renew. Sustain. Energy Rev. 2018, 82, 894–900. [Google Scholar] [CrossRef]
  27. Guo, X.; Dong, Y.; Ren, D.J.E. CO2 emission reduction effect of photovoltaic industry through 2060 in China. Energy 2023, 269, 126692. [Google Scholar] [CrossRef]
  28. Qiu, T.; Wang, L.; Lu, Y.; Zhang, M.; Qin, W.; Wang, S.; Wang, L. Potential assessment of photovoltaic power generation in China. Renew. Sustain. Energy Rev. 2022, 154, 111900. [Google Scholar] [CrossRef]
  29. Song, D.; Pei, H.; Liu, Y.; Wei, H.; Yang, S.; Hu, S. Review on Legislative System of Photovoltaic Industry Development in China. Energies 2022, 15, 306. [Google Scholar] [CrossRef]
  30. Hou, Y.; Wang, Q.; Tan, T. An ensemble learning framework for rooftop photovoltaic project site selection. Energy 2023, 285, 128919. [Google Scholar] [CrossRef]
  31. Morey, M.; Gupta, N.; Garg, M.M.; Kumar, A. A comprehensive review of grid-connected solar photovoltaic system: Architecture, control, and ancillary services. Renew. Energy Focus 2023, 45, 307–330. [Google Scholar] [CrossRef]
  32. He, B.; Qian, S.; Li, T. Modeling product carbon footprint for manufacturing process. J. Clean. Prod. 2023, 402, 136805. [Google Scholar] [CrossRef]
  33. Zhou, G.; Zhou, C.; Lu, Q.; Tian, C.; Xiao, Z. Feature-based carbon emission quantitation strategy for the part machining process. Int. J. Comput. Integr. Manuf. 2017, 31, 406–425. [Google Scholar] [CrossRef]
  34. Wiedmann, T.; Minx, J. A Definition of ‘Carbon Footprint’. In Ecological Economics Research Trends; Nova Science Publishers: Hauppauge, NY, USA, 2008; pp. 1–11. [Google Scholar]
  35. Barthelmie, R.J.; Morris, S.D.; Schechter, P. Carbon neutral Biggar: Calculating the community carbon footprint and renewable energy options for footprint reduction. Sustain. Sci. 2008, 3, 267–282. [Google Scholar] [CrossRef]
  36. Larsen, H.N.; Hertwich, E.G. The case for consumption-based accounting of greenhouse gas emissions to promote local climate action. Environ. Sci. Policy 2009, 12, 791–798. [Google Scholar] [CrossRef]
  37. Zheng, L.; Li, Y.; Qian, C.; Du, Y. Carbon Emission Evaluation of Roadway Construction at Contaminated Sites Based on Life Cycle Assessment Method. Sustainability 2023, 15, 2642. [Google Scholar] [CrossRef]
  38. Lei, B.; Yu, L.; Chen, Z.; Yang, W.; Deng, C.; Tang, Z. Carbon Emission Evaluation of Recycled Fine Aggregate Concrete Based on Life Cycle Assessment. Sustainability 2022, 14, 4448. [Google Scholar] [CrossRef]
  39. Jia, H.; Liang, L.; Xie, J.; Zhang, J. Environmental Effects of Technological Improvements in Polysilicon Photovoltaic Systems in China—A Life Cycle Assessment. Sustainability 2022, 14, 8670. [Google Scholar] [CrossRef]
  40. Wang, Y.; Zhou, Y.; Zhang, R.J.E.E. A review of the research methods on influencing factors of carbon emissions and carbon footprint. Environ. Eng. 2017, 35, 155–159. [Google Scholar]
  41. Hernández, H.; Ossio, F.; Silva, M. Assessment of Sustainability and Efficiency Metrics in Modern Methods of Construction: A Case Study Using a Life Cycle Assessment Approach. Sustainability 2023, 15, 6267. [Google Scholar] [CrossRef]
  42. Dong, H.; Geng, Y.J.R.S. Study on carbon footprint of the household consumption in Beijing based on input-output analysis. Resour. Sci. 2012, 34, 494–501. [Google Scholar]
  43. Perčić, M.; Ančić, I.; Vladimir, N. Life-cycle cost assessments of different power system configurations to reduce the carbon footprint in the Croatian short-sea shipping sector. Renew. Sustain. Energy Rev. 2020, 131, 110028. [Google Scholar] [CrossRef]
  44. Sharma, J.; Ravindranath, N.H. Applying IPCC 2014 framework for hazard-specific vulnerability assessment under climate change. Environ. Res. Commun. 2019, 1, 051004. [Google Scholar] [CrossRef]
  45. Farzaneh, F.; Jung, S. Lifecycle carbon footprint comparison between internal combustion engine versus electric transit vehicle: A case study in the U.S. J. Clean. Prod. 2023, 390, 136111. [Google Scholar] [CrossRef]
  46. Sharma, A.; Saxena, A.; Sethi, M.; Shree, V. Life cycle assessment of buildings: A review. Renew. Sustain. Energy Rev. 2011, 15, 871–875. [Google Scholar] [CrossRef]
  47. Chau, C.K.; Leung, T.M.; Ng, W.Y. A review on Life Cycle Assessment, Life Cycle Energy Assessment and Life Cycle Carbon Emissions Assessment on buildings. Appl. Energy 2015, 143, 395–413. [Google Scholar] [CrossRef]
  48. Taborianski, V.M.; Prado, R.T.A. Methodology of CO2 emission evaluation in the life cycle of office building façades. Environ. Impact Assess. Rev. 2012, 33, 41–47. [Google Scholar] [CrossRef]
  49. Kellenberger, D.; Althaus, H.-J. Relevance of simplifications in LCA of building components. Build. Environ. 2009, 44, 818–825. [Google Scholar] [CrossRef]
  50. Onat, N.C.; Kucukvar, M.; Tatari, O. Scope-based carbon footprint analysis of U.S. residential and commercial buildings: An input–output hybrid life cycle assessment approach. Build. Environ. 2014, 72, 53–62. [Google Scholar] [CrossRef]
  51. Mahmoud, M.; Ramadan, M.; Naher, S.; Pullen, K.; Olabi, A.G. The impacts of different heating systems on the environment: A review. Sci Total Environ. 2021, 766, 142625. [Google Scholar] [CrossRef]
  52. Hanfang, L.; Lin, H.; Tan, Q.; Wu, P.; Wang, C.; Gejirifu, D.; Huang, L. Research on the policy route of China’s distributed photovoltaic power generation. Energy Rep. 2020, 6, 254–263. [Google Scholar] [CrossRef]
  53. ISO 14040; Life Cycle Assessment (LCA)–Principles And Guidelines; Waste Management for the Food Industries. Academic Press: Cambridge, MA, USA, 2008; pp. 97–132.
  54. ISO 14040:2006; Environmental Management: Life Cycle Assessment; Principles and Framework. International Organization for Standardization: Cham, Switzerland, 2006.
  55. van Sark, W.; Reich, N.; Alsema, E.; Nieuwlaar, E.; Willeke, G.; Ossenbrink, H.; Helm, P. CO2 Emissions of PV in the perspective of a Renewable Energy Economy. In Proceedings of the 22nd European Photovoltaic Solar Energy Conference, Milan, Italy, 3–7 September 2007; pp. 3538–3542. [Google Scholar]
  56. Mi, Y.; Liu, C.; Yang, J.; Zhang, H.; Wu, Q. Low-carbon generation expansion planning considering uncertainty of renewable energy at multi-time scales. Glob. Energy Interconnect. 2021, 4, 261–272. [Google Scholar] [CrossRef]
  57. Pinto, M.A.; Frate, C.A.; Rodrigues, T.O.; Caldeira-Pires, A. Sensitivity analysis of the carbon payback time for a Brazilian photovoltaic power plant. Util. Policy 2020, 63, 101014. [Google Scholar] [CrossRef]
  58. Zhang, C.; Hu, M.; Laclau, B.; Garnesson, T.; Yang, X.; Tukker, A. Energy-carbon-investment payback analysis of prefabricated envelope-cladding system for building energy renovation: Cases in Spain, the Netherlands, and Sweden. Renew. Sustain. Energy Rev. 2021, 145, 111077. [Google Scholar] [CrossRef]
  59. Li, J.; Chen, S.; Wu, Y.; Wang, Q.; Liu, X.; Qi, L.; Lu, X.; Gao, L. How to make better use of intermittent and variable energy? A review of wind and photovoltaic power consumption in China. Renew. Sustain. Energy Rev. 2021, 137, 110626. [Google Scholar] [CrossRef]
  60. Shubbak, M.H. The technological system of production and innovation: The case of photovoltaic technology in China. Res. Policy 2019, 48, 993–1015. [Google Scholar] [CrossRef]
  61. Haghpour, B.; Sahabeh, E.; Halvari, H. Opportunity cost in consumer behavior: Definitions, operationalizations, and ambiguities. Int. J. Consum. Stud. 2022, 46, 1942–1959. [Google Scholar] [CrossRef]
  62. de Figueiredo Silva, F.; Fulginiti, L.E.; Perrin, R.K.; Braga, M.J. The increasing opportunity cost of sequestering CO2 in the Brazilian Amazon forest. Empir. Econ. 2021, 62, 439–460. [Google Scholar] [CrossRef]
  63. Emirmahmutoglu, F.; Kose, N. Testing for Granger causality in heterogeneous mixed panels. Econ. Model. 2011, 28, 870–876. [Google Scholar] [CrossRef]
  64. Troster, V. Testing for Granger-causality in quantiles. Econom. Rev. 2016, 37, 850–866. [Google Scholar] [CrossRef]
Figure 1. Workflow diagram of a centralized photovoltaic power station.
Sustainability 15 16323 g001
Figure 2. Different phases for the LCA [54].
Sustainability 15 16323 g002
Figure 3. Calculation of the whole life cycle of carbon emissions from centralized photovoltaic power plants.
Sustainability 15 16323 g003
Figure 4. Carbon emissions and proportions during the production stage of the raw materials.
Sustainability 15 16323 g004
Figure 5. Added value of China’s secondary industry, the size of the new centralized PV power plants, and carbon emissions from 2013 to 2022.
Sustainability 15 16323 g005
Table 1. Energy consumption and carbon emissions during the production stage of the raw materials.
Production StageDirect Carbon EmissionsElectricity Consumption
Silicon production4.721 kg CO2/kg11.69 kWh/kg
Polycrystalline silicon production/95 kWh/kg
Wafer production/0.73 kWh/pieces
Cell production/124 kWh/kWp
Table 2. Energy consumption, inputs, and outputs during the production stage of the battery components.
Power ConsumptionImportsExports
MaterialEnergyMaterialQuantitiesMaterialQuantities
Power consumption58.5 kWhPhotovoltaic cell1.02 kWpBattery component1 kWp
Reinforced glass62.22 kgSolid waste132 g
Aluminum frame13.12 kgTVOC3.24 g
EVA film7.06 kgWelding fume1.04 g
Organic Silicone Gel40 kg
Table 3. Relevant parameters and parameter values during the transportation stage.
ParametersParameter Value
Transportation distance84.3 km
Total transport mass4 t
Fuel consumption0.20 L/km
Origin and destination of transportationHangzhou-Jiaxing
Installed photovoltaic capacity1 kWp
Table 4. Energy consumption, inputs, and outputs during the waste disposal stage.
Power ConsumptionImportExport
MaterialEnergyMaterialEnergyMaterialEnergy
Electricity consumption128.24 kWhWaste battery pack1 kWpSilicon chip217 pieces
Toluene26.66 kgSteel0.229 kg
HNO315.00 kgSilver0.328 kg
HF10.35 kgAluminum13.55 kg
CH3COOH9.00 kgPlastics0.776 kg
EVA4.26 kg
Glass48.98 kg
TPT3.26 kg
Sealing silicone0.265 kg
Table 5. Carbon emissions and proportions during the production stage of the components.
Production StageEmissionProportion
Battery assembly production405.82 kg40.54%
Balanced component production595.20 kg59.46%
Total: 1001.02 kg
Table 6. Global warming potential values (IPCC, 2001).
Type of Greenhouse GasGWP Value
CO21
CH423
N2O296
Table 7. CO2 emission factors of gasoline and diesel.
Type of Greenhouse GasEmission Factors (kg/L)
CO22.73
CH41.44 × 10−4
N2O1.44 × 10−4
Table 8. Carbon emissions and proportions during the waste disposal stage.
Type of EmissionEmissionProportion
Energy consumption123.11 kg79.99%
Depletion of resources30.796 kg20.01%
Resource recycle−400.06 kg/
Total: −246.15 kg
Table 9. Full life-cycle carbon emissions of the 1 kWp centralized photovoltaic power stations.
Life Cycle StageEmissionProportion
Raw material production stage1292.73 kg61.72%
Module production stage1001.02 kg47.79%
Transportation and maintenance phase46.80 kg2.23%
Waste disposal phase−246.15 kg−11.75%
Total: 2094.40 kg
Table 10. Full life-cycle carbon emissions from the 1 kWp centralized photovoltaic power stations in 2013.
Life Cycle StageEmissionProportionMagnitude of Change
Raw material production stageSilicon production162.285.16%+0.23%
Polycrystalline silicon production1110.7235.35%−24.36%
Wafer production336.4210.71%−49.91%
Well production219.796.99%−44.75%
module production stageBattery assembly production684.9421.80%−40.75%
Balanced component production827.7026.34%−28.09%
Transportation and Maintenance phase/46.81.49%0%
Waste disposal phase/−246.151−7.83%0%
Total: 3142.51 kgMagnitude of change: −33.35%
Table 11. Net profits and planting income per unit area for major crops in China in 2021.
Crop TypeUnit Net Profit (yuan/m2)Acreage (m2)Profitability of Planting (yuan/kWp)
Paddy0.090169.86R1 = 15.287
Maize0.194R2 = 32.953
Corn0.243R3 = 41.276
Table 12. Granger causality test results.
Variable RelationshipHysteresisp-ValueConclusions
Carbon emissions → secondary sectorPhase 10.021Granger
Secondary sector → carbon emissions0.277Not Granger
Disclaimer/Publisher’s Note: The statements, opinions and data contained in all publications are solely those of the individual author(s) and contributor(s) and not of MDPI and/or the editor(s). MDPI and/or the editor(s) disclaim responsibility for any injury to people or property resulting from any ideas, methods, instructions or products referred to in the content.

