Abstract
The use of solar heating and cooling systems has evolved from being limited to heating and hot water systems in the past to an increasing application in cooling systems. Furthermore, the efficiency optimization of solar heating and cooling systems is crucial in their design and control. This study aimed to enhance the overall efficiency of a solar heating and cooling system through simulations based on optimal design parameters. Additionally, simulations were conducted to optimize the control system to improve the efficiency of the entire solar heating and cooling system. The framework for control optimization can be summarized as follows: (1) modeling the components of the solar heating and cooling system using the Modelica language; (2) establishing baseline efficiencies for the solar heating and cooling system throughout the year; and (3) implementing a control logic, such as Fuzzy or proportional-integral-derivative (PID), within the system components. The resulting optimal control strategy for the solar heating and cooling system led to a maximum increase in the overall system efficiency of approximately 12% during a week of summer design days, reducing the energy consumption from 696.89 kWh to 556.12 kWh. This demonstrates that the developed parameters and control logic improved the overall system performance and achieved efficiency optimization.
1. Introduction
Countries all throughout the world are very concerned about global warming. Fossil fuels should be replaced with renewable energy sources to reduce greenhouse gas (GHG) emissions in order to combat climate change. Many nations have set goals for the development of their energy infrastructure in accordance with the Paris Agreement in order to keep the global temperature increase to 1.5 °C above pre-industrial levels [1]. Particularly, the European Union has set a goal for its GHG emissions reduction by 2030 of at least 55% below 1990 levels, and other nations like India have also established significant emission reduction targets [2,3]. In order to accomplish these objectives and create an energy infrastructure with net-zero emissions, renewable energy technologies are essential [4]. Overall, 38% of the world’s final energy consumption in 2021 came from industrial activities, and this percentage is predicted to rise in the years to come [5].
Two thirds of the energy used in industry is used to generate heat [6]. One of the most promising sources of renewable energy is solar energy [4]. Solar conversion systems have been used for power generation, seawater desalination, cooling procedures, urban heating, and industrial heating. They can convert solar energy into thermal energy, electrical energy, or both [7,8,9,10,11,12,13,14,15,16,17,18]. Thermal energy for a range of temperature requirements, including low, medium, and high temperatures, can be obtained from solar heat for industrial process (SHIP) systems [18,19,20]. In response to the growing need for renewable energy solutions, SHIP systems have emerged as a highly promising option for fulfilling a part of the industrial heat demand [21]. Solar heating technologies have shown notable economic competitiveness, especially in regions with high solar irradiation levels, when compared to fossil fuel alternatives [22,23,24,25]. Notably, in 2021, the number of SHIP plants experienced a significant increase of approximately 9% [21]. Although photovoltaic (PV) systems are widely used in electricity generation, it is important to note that their energy conversion efficiency is lower than that of solar thermal technologies. Additionally, depending on various factors, such as operating conditions and technology, PV systems might need more than three times the area occupied by solar thermal (ST) systems to generate an equivalent amount of energy [24,25,26,27]. These specific factors pose challenges, limiting the widespread application of PV systems in industrial heating contexts.
Recently, innovative solutions for industrial heating have arisen in the form of photovoltaic (PV) and solar thermal (ST) technologies. The building sector, accounting for 35.3% of global energy demand, heavily relies on the intricate functioning of heating, ventilating, and air-conditioning (HVAC) systems. These systems are pivotal in maintaining indoor comfort by regulating humidity, temperature, and air quality. The energy consumption of HVAC systems, whether for heating or cooling, intricately depends on the specific climate conditions of the region. Heating systems effectively capture and store solar heat to circulate warmth within buildings, whereas cooling systems play a vital role in creating a refreshing indoor atmosphere, enhancing air circulation and shielding occupants from direct solar radiation. In colder regions, heating serves as the predominant energy source for HVAC systems, while in tropical countries or during the summer, air conditioning takes precedence in energy consumption. Renewable energy sources, particularly solar power, are indispensable in the realm of heating and cooling due to their cost-effectiveness. The implementation of solar heating and cooling technologies can be achieved through thermal or photovoltaic means. Solar-thermal-energy-based heating technologies utilize both passive and active solar techniques to capture solar radiation and transform it into usable heat [28].
The use of concentrating solar collectors for power absorption and adsorption cooling cycles has been studied in the past. According to their firing technique, working fluid pair, and number of effects, absorption chillers, for instance, were categorized and characterized in a prior study [29]. In a different study [30], a novel cooling system with two main parts—a two-stage vapor absorption cooling sub-system and a vapor-compression cooling sub-system—was introduced. The findings showed that the unique system may generate a cooling output while lowering the temperature of the accessible heat source. They also determined the best temperatures for generators to optimize COP. By shifting the locations of the adsorption and absorption subsystems, Nikbakhti et al. [31] theoretically evaluated a novel integrated adsorption–absorption cooling system and examined two potential topologies. The outcomes verify the absorption system’s COP and cooling capacity. A solar cooling system using PVT collectors and adsorption cooling units that is adapted to the diverse climatic conditions in the Middle East was theoretically explored by Hassan et al. [32]. They discovered that the suggested method generated the most power and had the greatest cooling capacity.
The Transient System Simulation Tool (TRNSYS) program was used by Xu and Wang [33] to simulate and examine the performance of a solar system with a variable effect lithium bromide absorption chiller. For the numerical modeling and integration of dynamic systems, particularly those driven by variable renewable energy sources, TRNSYS 18 is a graphic-based software environment that uses FORTRAN 90 as its source code [34]. TRNSYS was used by Khan et al. [35] to analyze a single-effect solar absorption cooling system. A flat plate or an evacuated tube solar collector was used in the system, which was installed in an educational facility in Islamabad, Pakistan, to extract heat. In a different study, Ibrahim et al. [36] performed a parametric analysis of a double-effect solar absorption chiller reference system in Kuala Lumpur, Malaysia, which included a solar collector and a cooling capacity. They offered a tool for the design that needed a certain incident radiation level.
Most previous studies were conducted based on simple system implementation and validation using specific languages and software. However, when examining the structure and functionality of solar heating and cooling systems, there are many hyperparameters that need to be optimized in existing systems. In practice, controlling solar heating and cooling systems often involves the use of traditional low-level PID control logic for straightforward control. Based on this observation, this study aimed to achieve the following objectives that have not been previously addressed: the optimization of design parameters for solar heating and cooling systems and the PID optimization for low-level control based on versatility. The goal of this study was to develop a more cost-effective and efficient system. Therefore, the sustainable heating and cooling system minimizes energy consumption from fossil fuels and reduces carbon dioxide emissions into the atmosphere, thereby mitigating the impact of climate change. Additionally, by harnessing renewable energy sources like solar power, it enhances energy sustainability and strengthens energy independence. These systems have a positive impact on environmental protection and resource conservation, contributing to maintaining a sustainable global environment.
In this study, we focused on implementing a solar heating and cooling (SHC) system with an absorption chiller in a particular area of a small office building located in South Korea. The base model of the SHC system was developed using Modelica, an object-oriented language. The objective of this research was to enhance the overall performance efficiency (COP) of the entire SHC model by employing optimal control methods. The primary goal was to improve the COP of the SHC system by applying advanced control techniques.
2. SHC System Description
2.1. Targeted Area of the SHC system
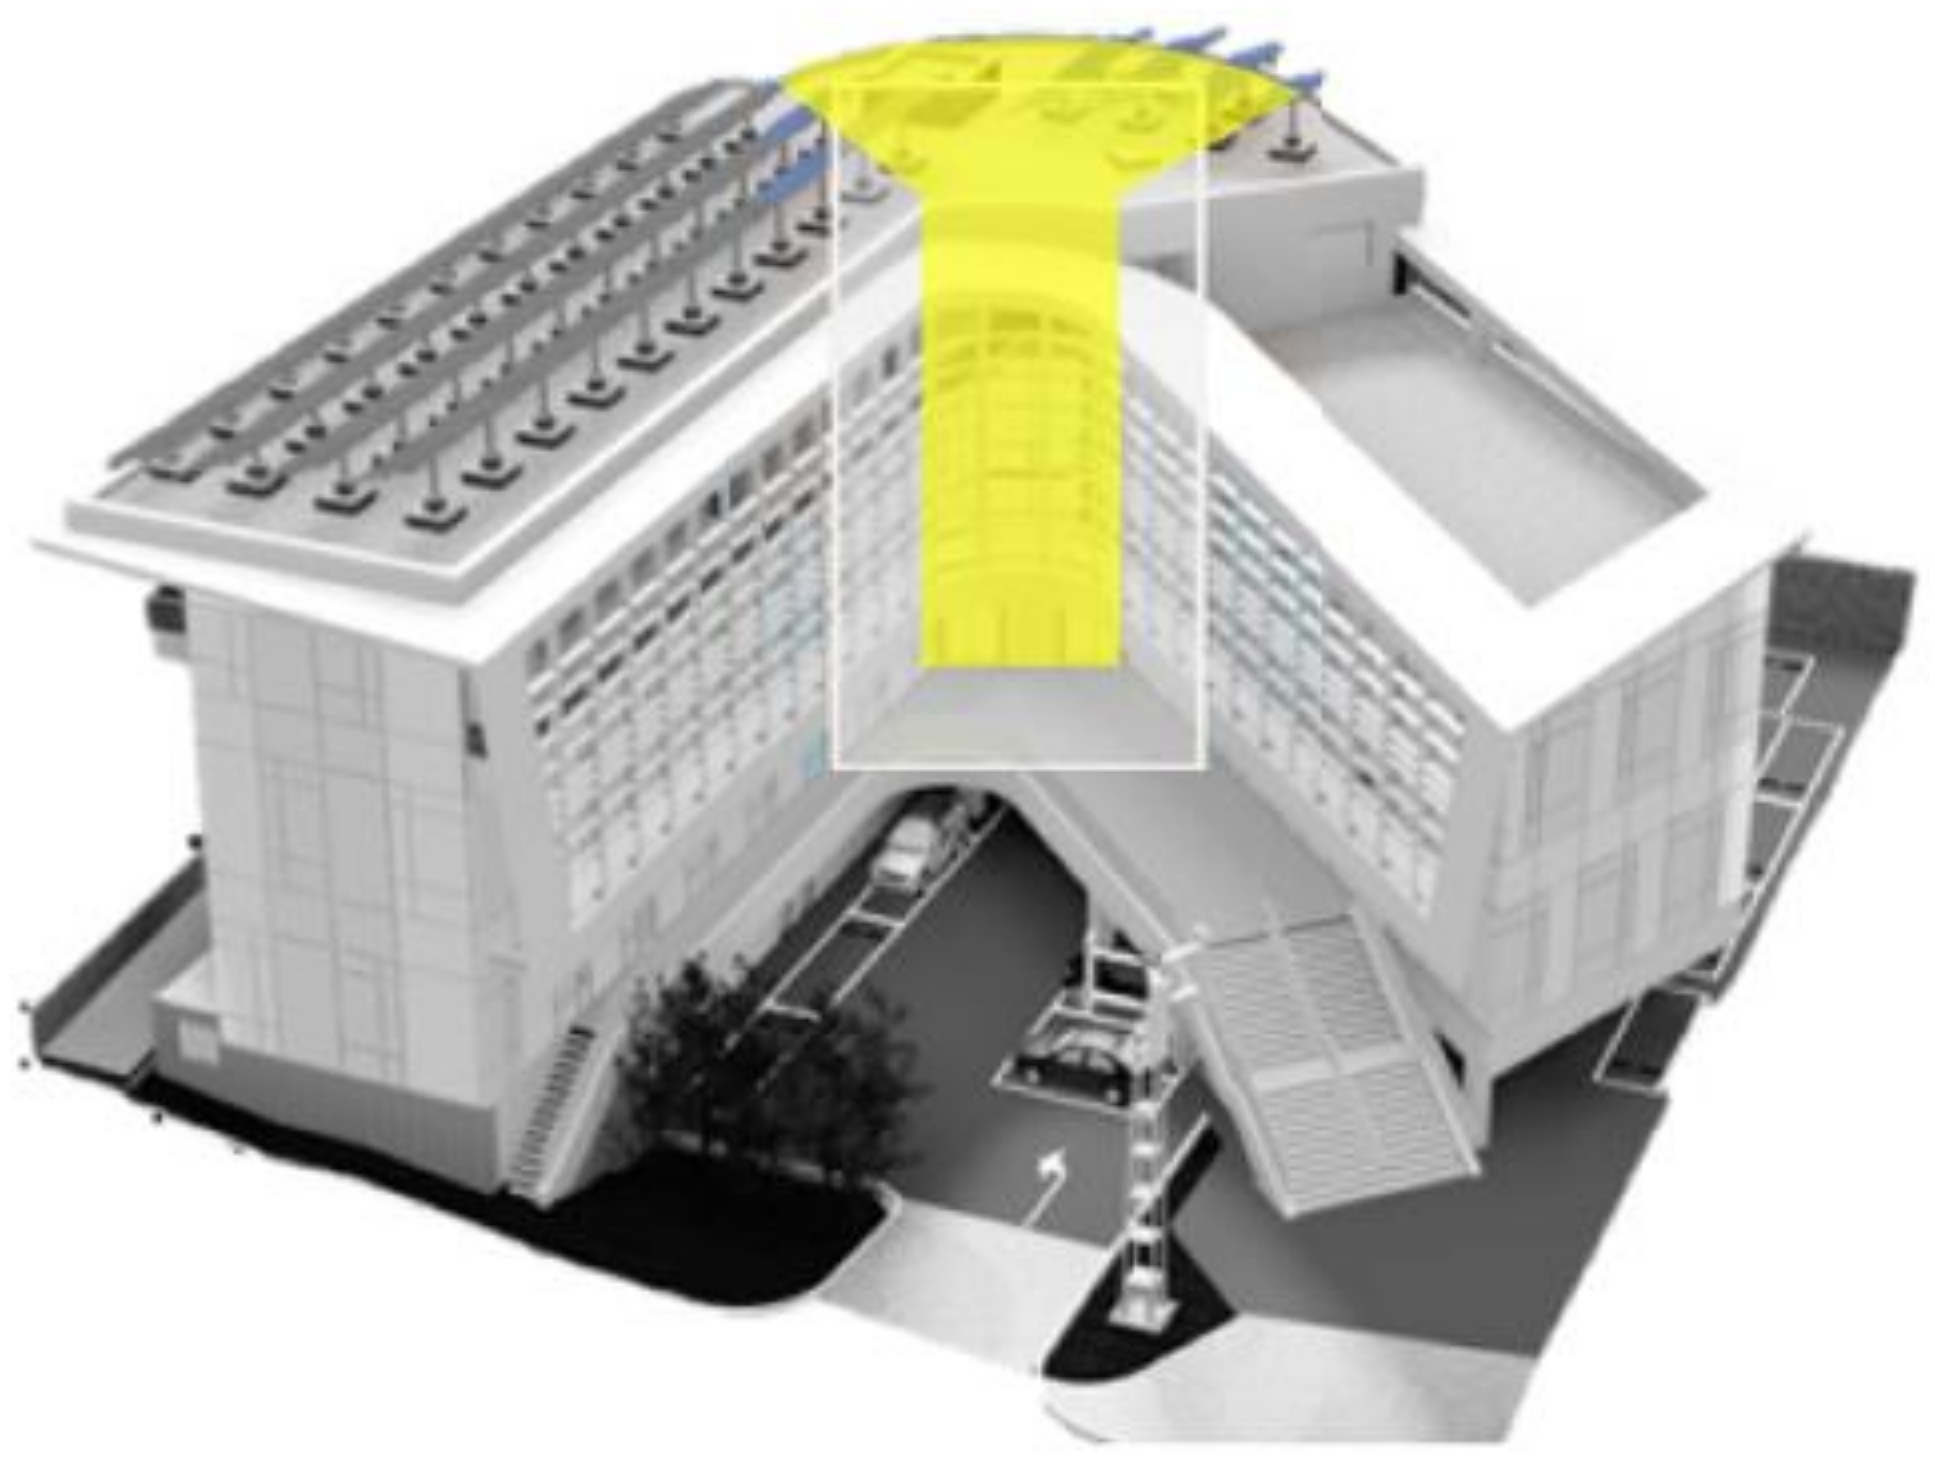
The specific area of focus of the SHC system is the lobby of a small building. The lobby encompasses the second to fourth floors, as illustrated in Figure 1. This particular zone is suitable for utilizing a small-capacity absorption chiller that can adequately cater to the overall cooling demands of this area.

Figure 1.
The heating, ventilating, and air-conditioning (HVAC) system zone of the target building.
2.2. Solar Irradiance and System Loads of SHC
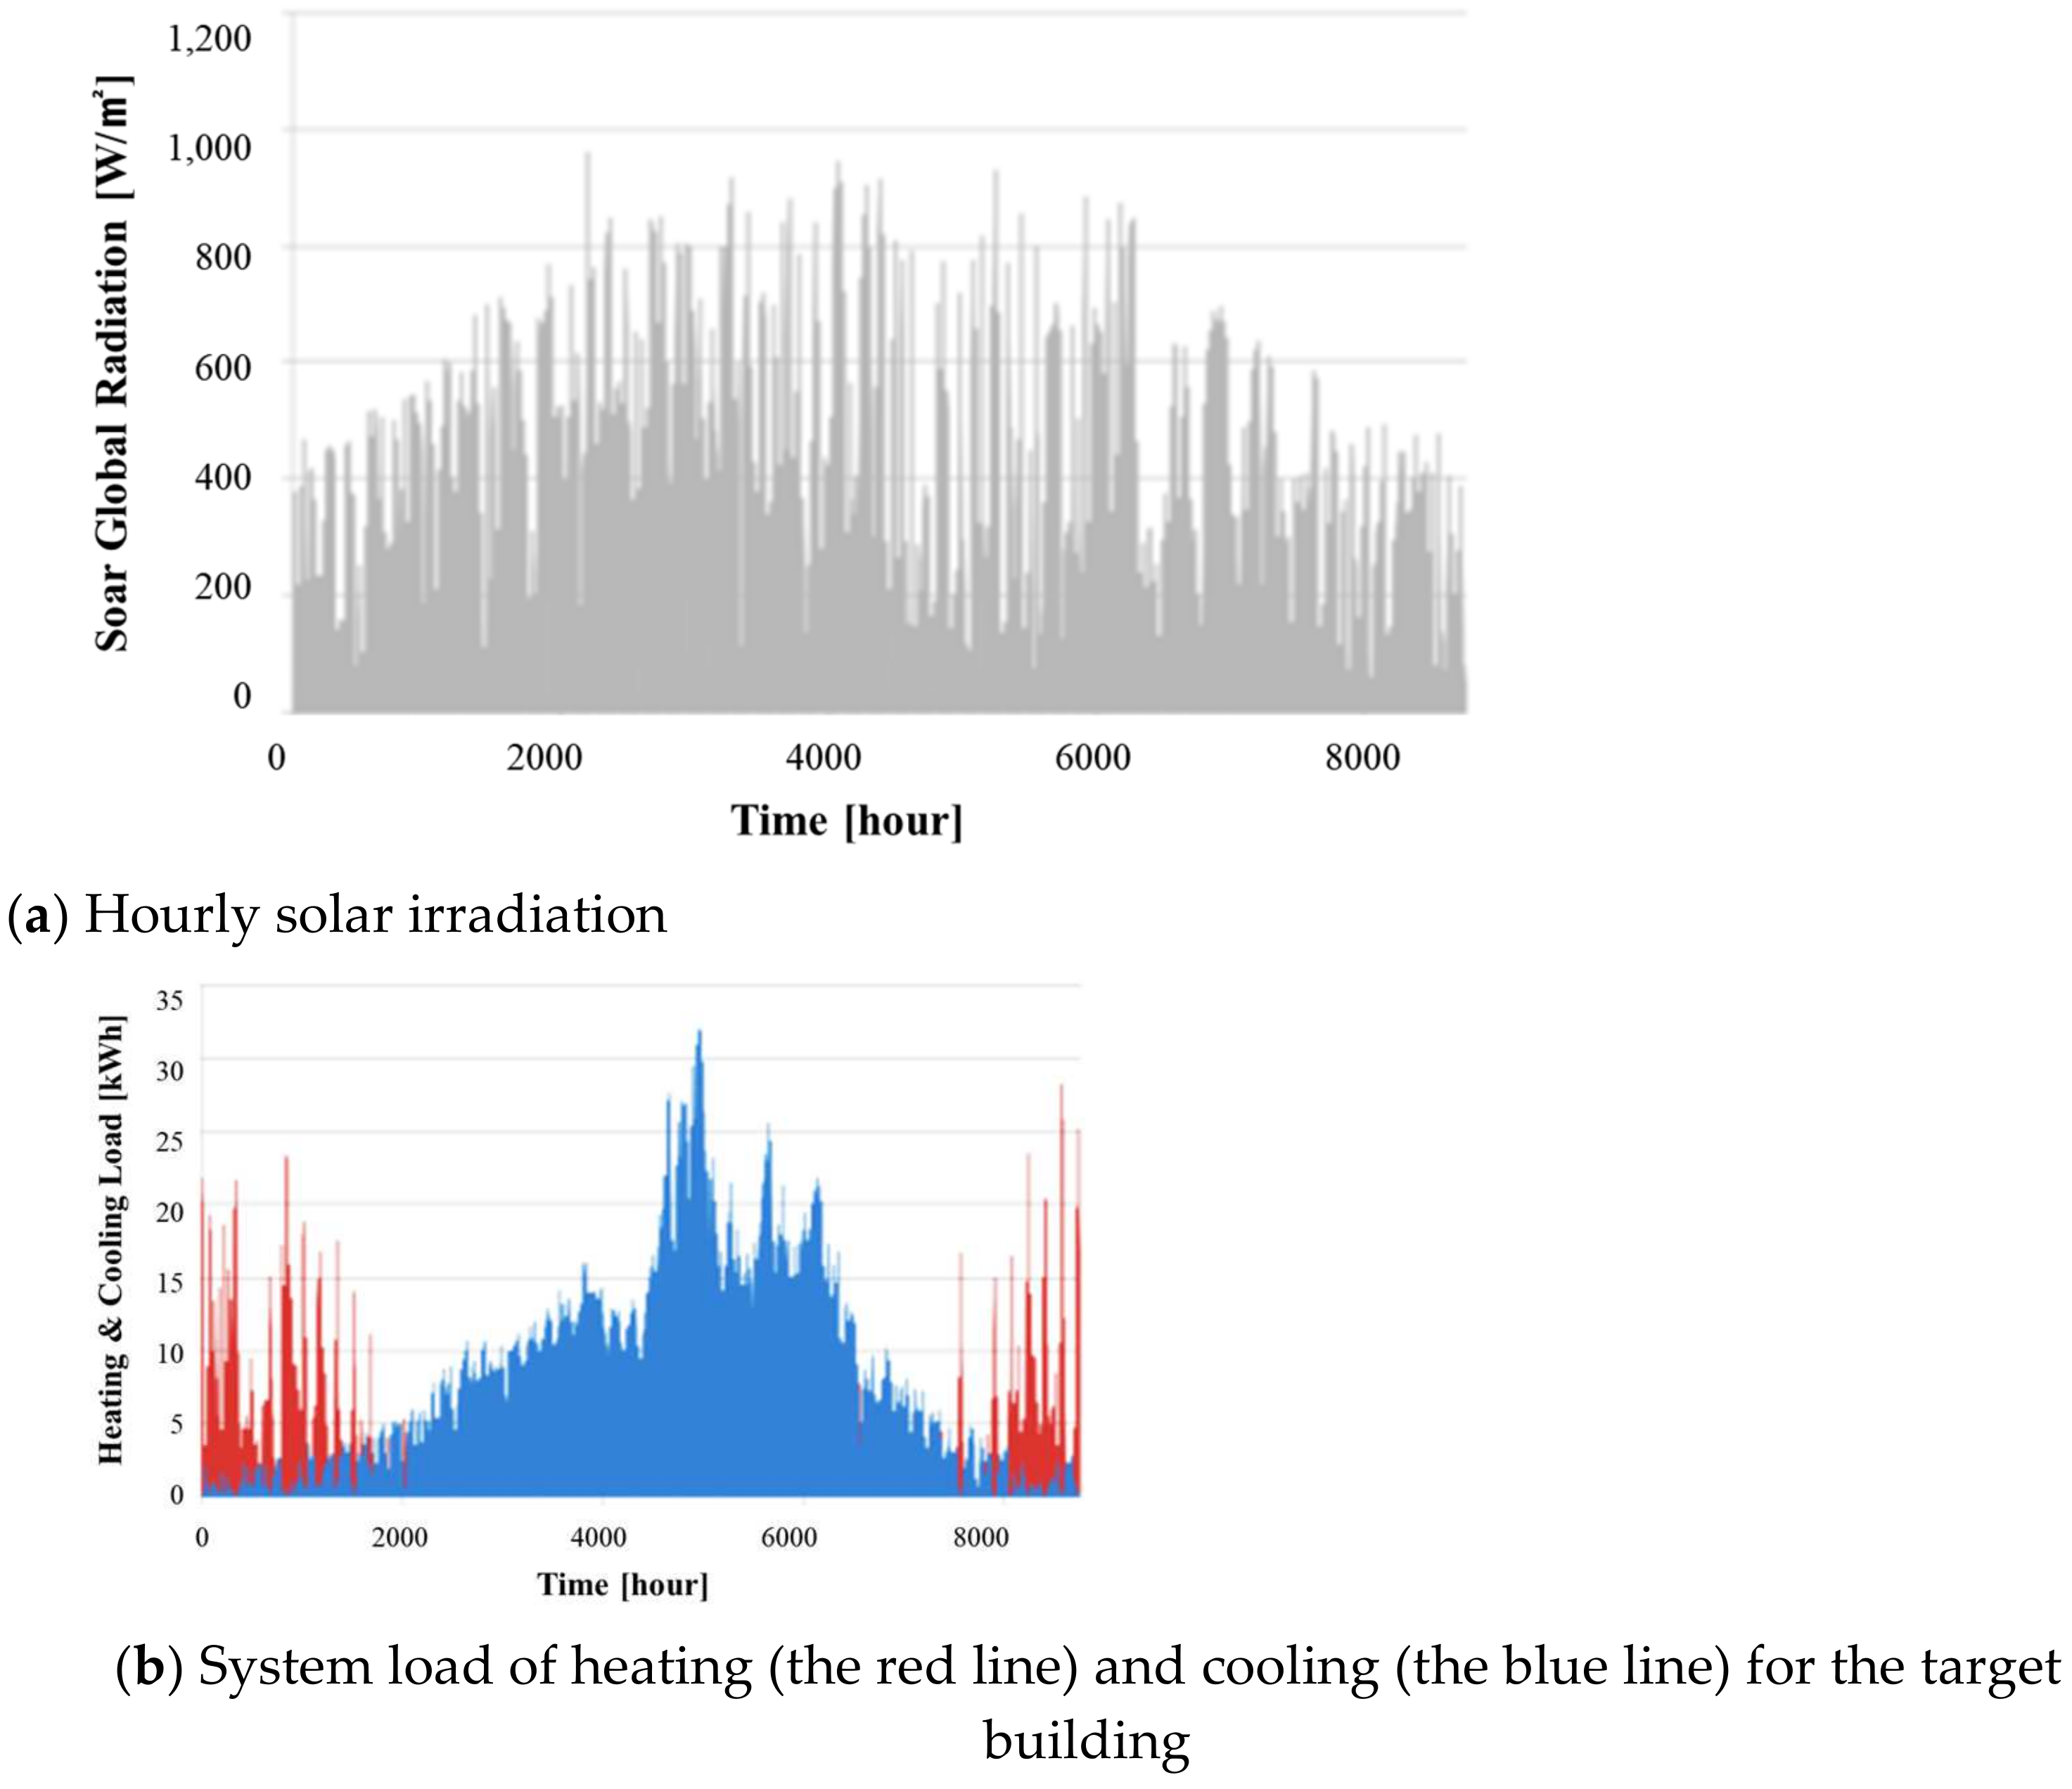
Accurate data on the heating and cooling loads play a vital role in designing a complete solar heating and cooling (SHC) system, including aspects like the area of solar collectors and chiller capacity. The heating and cooling loads for the specific targeted zone, estimated to reach maximum values of approximately 30 kW, were obtained using EnergyPlus 23.1 software. Additionally, the hourly solar irradiation for a year on the site, which was acquired from the onsite weather station (latitude: 37.309985 and longitude: 127.135114), is presented in Figure 2.

Figure 2.
Solar radiation is obtained from the weather data and heating/cooling loads for a year.
2.3. SHC System Specification
A solar thermal system utilizes solar energy and converts it into thermal energy, which can serve various purposes, such as producing domestic hot water (DHW), heating and cooling spaces, or .heating swimming pool water. These systems are classified based on the type of thermal fluid (such as air, pure water, refrigerants, and water–glycol mixtures) used to transport heat from the collector.
A solar thermal system consists of a collector, storage unit, utilization system, and control device. The collector is a device that gathers energy from the sun and converts it into heat, making it a fundamental component of the solar thermal system. The storage unit, or storage tank, stores the accumulated heat for later use when needed. The utilization system efficiently supplies solar heat and, if insufficient, is supplemented by auxiliary heat sources. The final component, the control device, serves as an adjustment mechanism to effectively regulate the aforementioned processes.
The solar thermal cooling and heating system is composed of a solar collector panel that captures solar heat to heat the heat transfer fluid, an accumulation tank where the heat transfer fluid is stored, a cooling system that exchanges heat with the accumulation tank to provide air conditioning, a domestic hot water (DHW) system that supplies hot water by exchanging heat with the accumulation tank, and an auxiliary heating system that supplements the deficient heat capacity of the accumulation tank when its temperature falls below the set temperature. This system maximizes efficiency by utilizing an auxiliary heat source only to compensate for the insufficient heat capacity of the accumulation tank when solar energy is insufficient to raise its temperature above the set threshold.
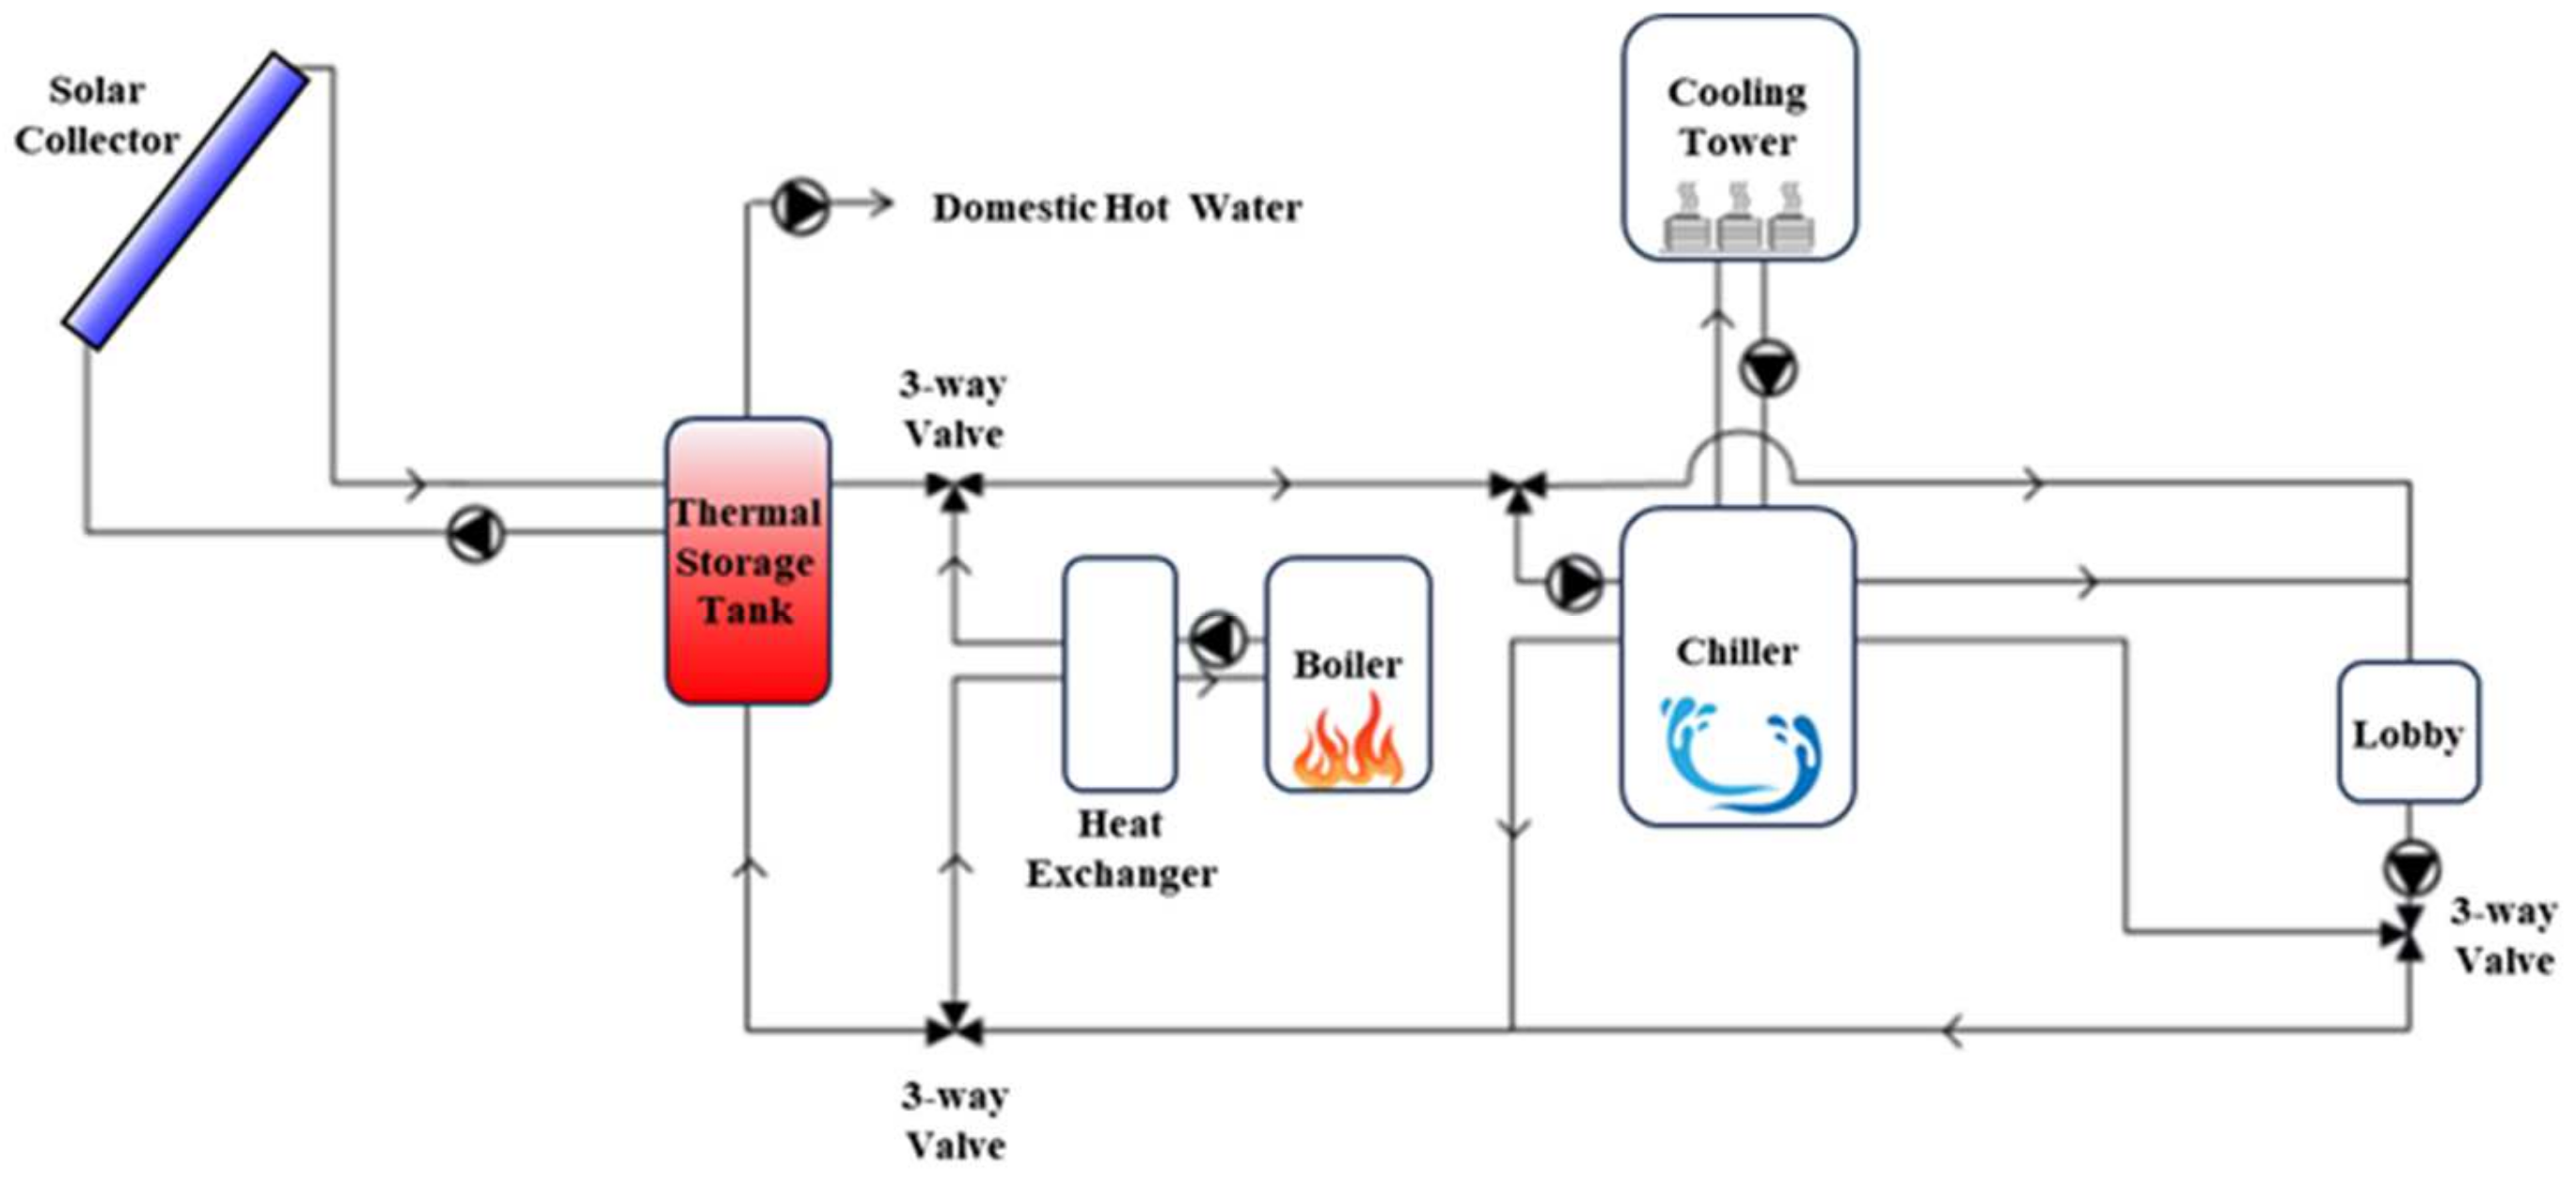
The SHC system harnesses solar radiation for heating, cooling, and DHW. In instances where the solar radiation alone is insufficient, a boiler is utilized to compensate for the heat. The SHC system comprises solar collectors, heat exchangers, a thermal storage tank, a boiler, an absorption chiller, and a cooling tower. These components, along with the lobby of the building, are depicted in Figure 3.

Figure 3.
System configuration of actual solar heating and cooling (SHC) system.
3. Methodologies
3.1. Modelica System Constitution
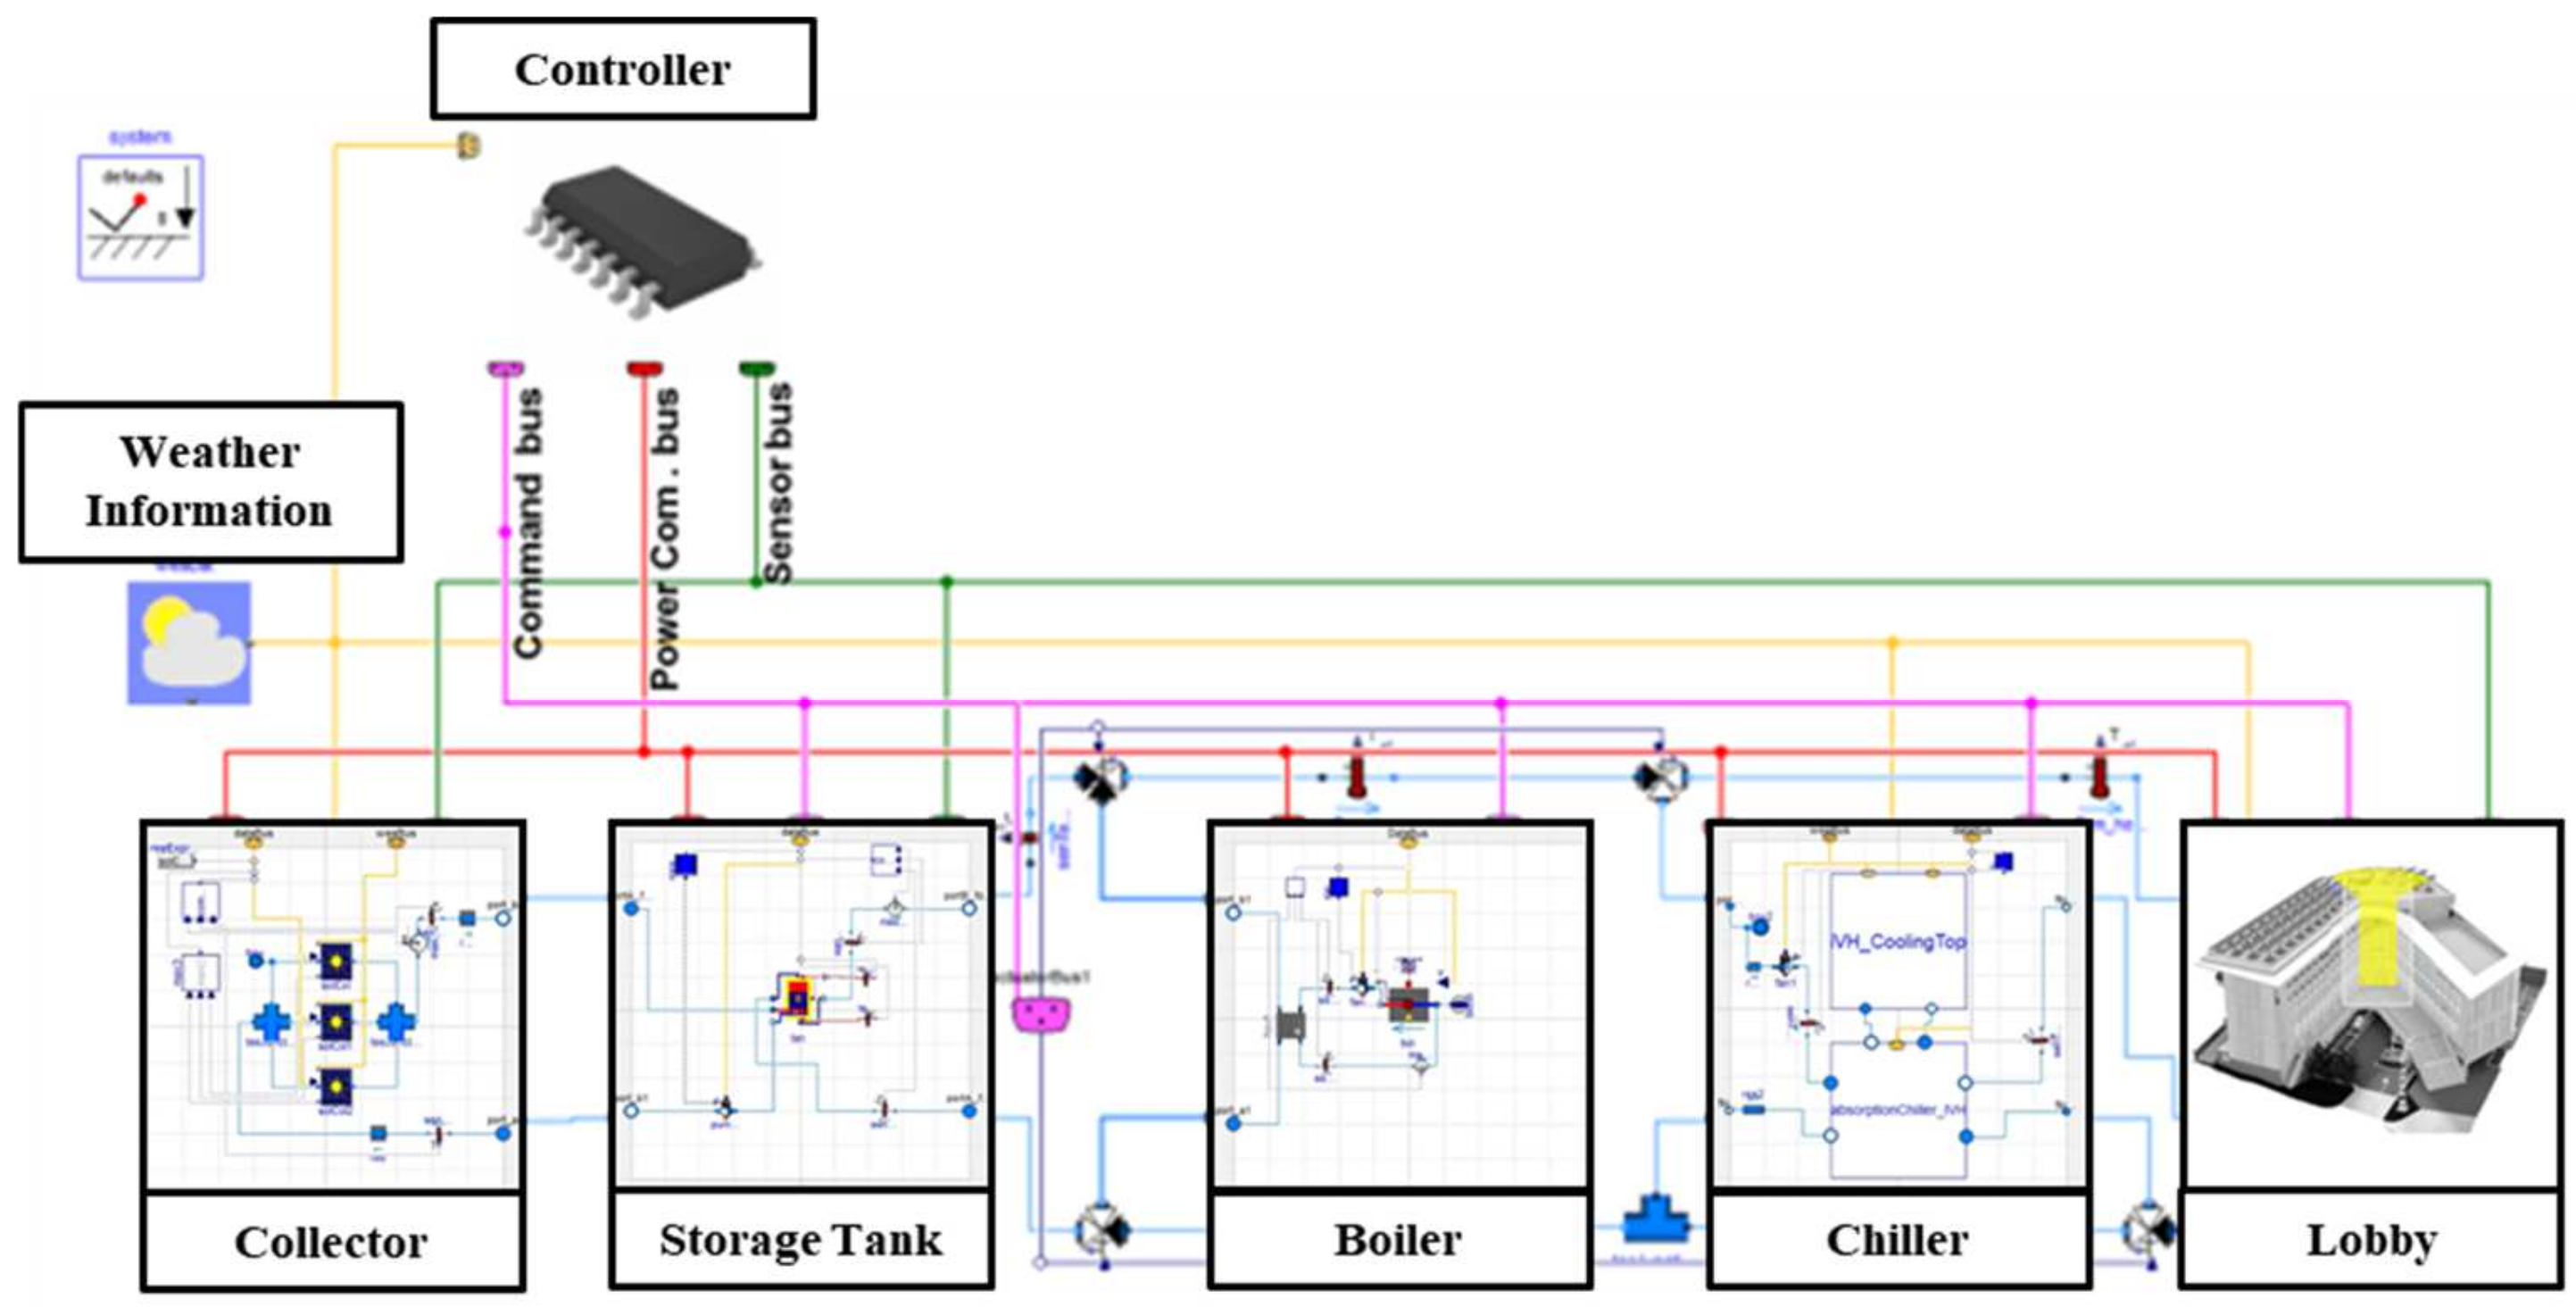
The physical model of the SHC system is developed as shown in Figure 4, using the Modelica language and incorporating certain components from Buildings Library 1.5, developed by Lawrence Berkeley National Laboratory. For components not available in Buildings Library 1.5, this research developed and validated them. The developed components include an absorption chiller based on Yazaki Corporation’s product reference and vacuum tubes for solar collectors.
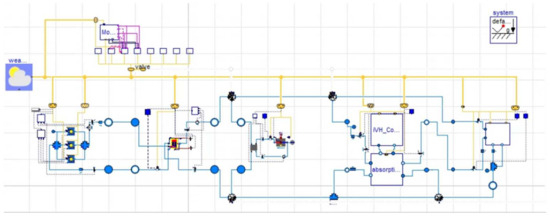
Figure 4.
A model of the SHC system constructed using with Modelica.
The solar collector was based on a tubular design using vacuum tubes manufactured by Sunda Company, evaluated according to the ENI 12975 and ASHRAE93 standards [37]. The detailed parameters of the solar collector are provided by the solar rating and certification corporation (SRCC). This research also verifies the performance of a 10 USRT absorption chiller from Yazaki Corporation of the solar collector certified by the SRCC, ensuring their equivalence.
This Modelica model consists of a total of six components as follows: firstly, a vacuum-tube-based solar collector, a storage tank, an auxiliary heater (boiler), a chiller, a consumption part, including indoor air terminals, pumps, and fans, and an external weather data processing module along with control modules for each component. Each module was developed by combining custom-made modules based on Modelica’s fundamental equations with existing components such as pumps, fans, and valves that have been calibrated to work seamlessly with the existing system. The existing five components are essential components found in an actual solar heating and cooling system, and the control module provides flexibility to operate according to future control signals.
3.2. PISTACHE System Constitution
The PISTACHE model is also composed of components similar to Modelica. It was developed for the purpose of validating the Modelica simulator and is structured with a total of six components as follows: a vacuum-tube-based solar collector, a storage tank, an auxiliary heater (boiler), a chiller, a consumption part, including indoor air terminals, pumps, and fans, along with an external weather data processing module and control modules for each component. Each module was developed by combining custom-made modules based on PISTACHE’s fundamental equations with existing components such as pumps, fans, and valves that have been calibrated to work seamlessly with the existing system. The existing five components are essential components found in an actual solar heating and cooling system, and the control module provides flexibility to operate according to future control signals.
The COP of the entire SHC system was calculated by dividing the energy consumption of the targeted zone (excluding pumps, chiller, boiler, and energy losses) by the energy gained from solar power. Using the Modelica language, the COP of the SHC system was approximately 0.164.
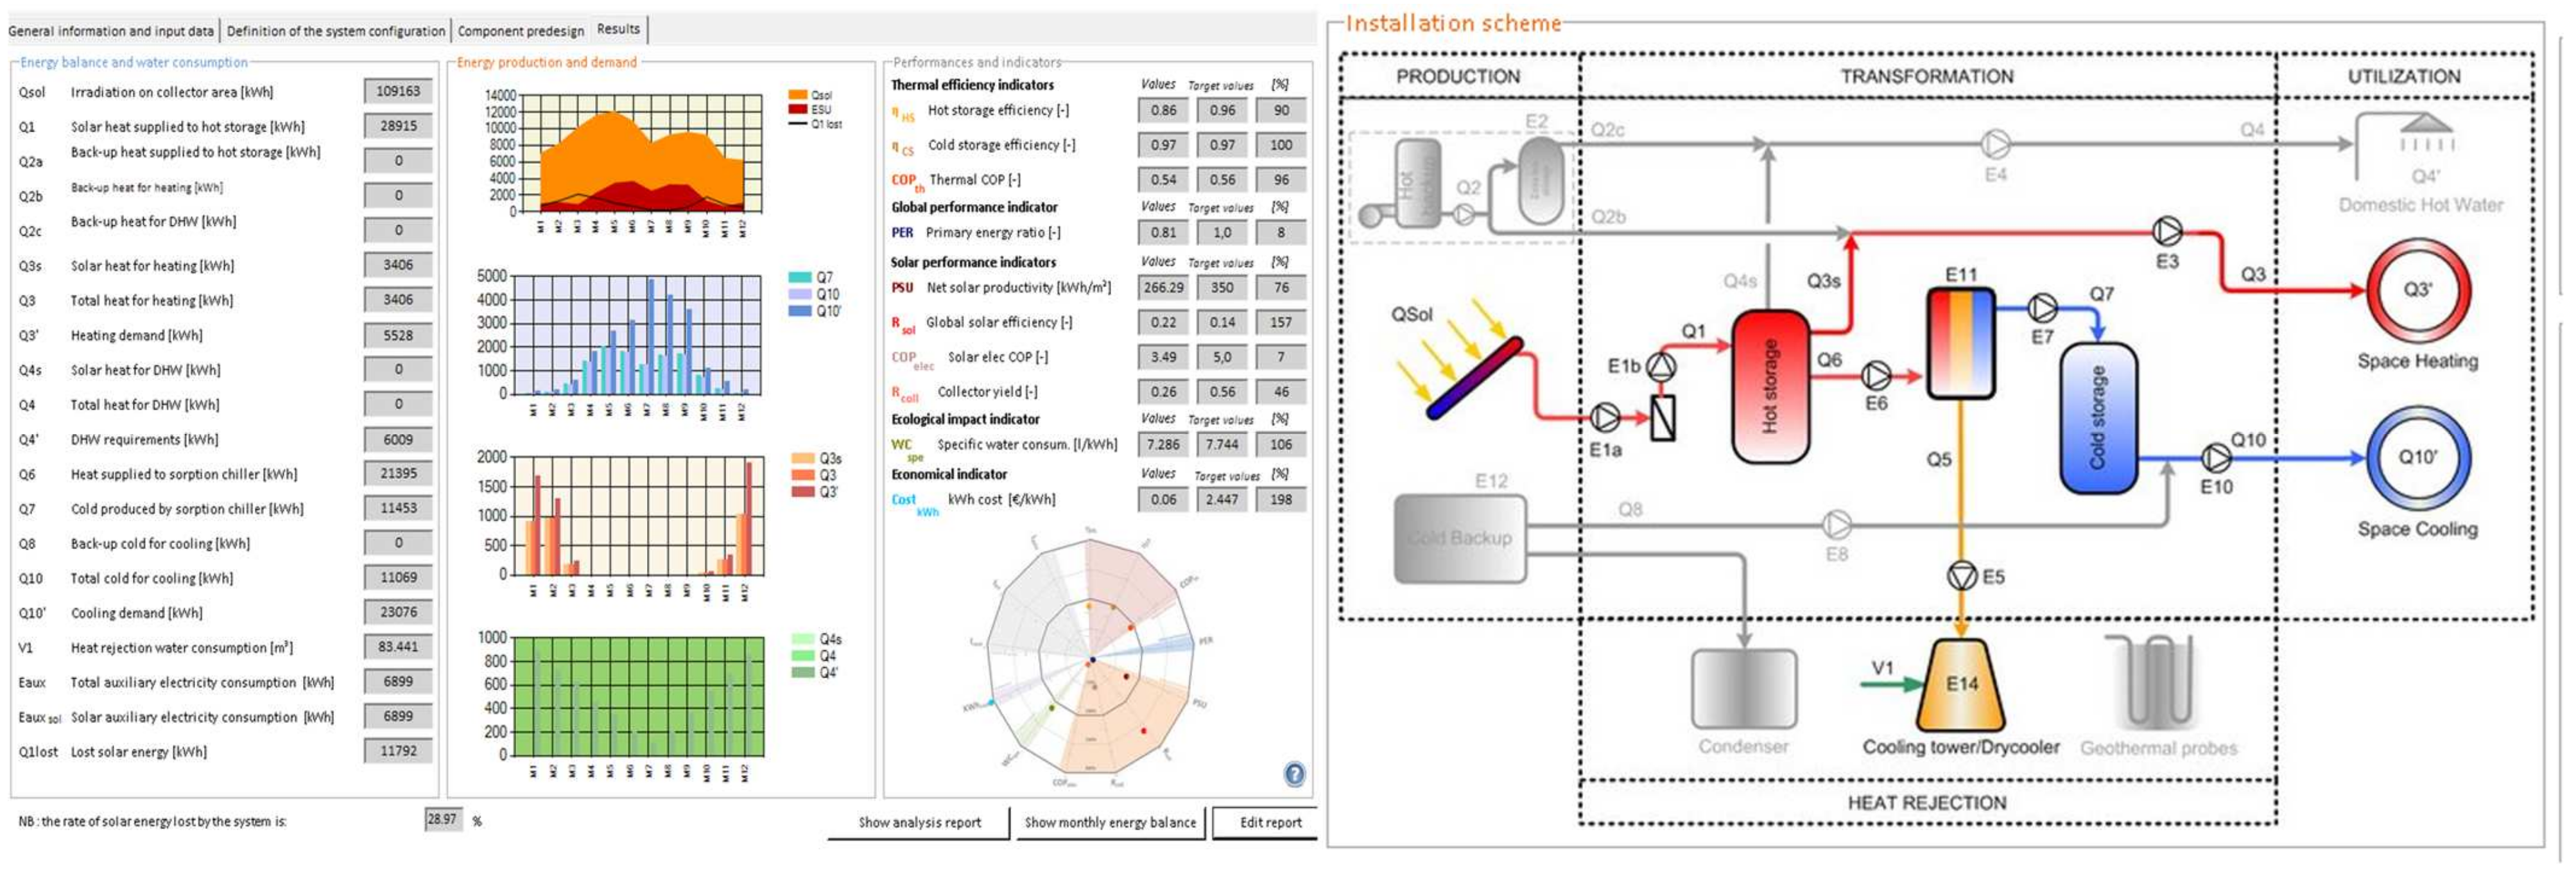
The verification of the base model of the SHC system was performed using the PISTACHE tool, which was developed based on the findings of the International Energy Agency’s (IEA) SHC Task 40. The PISTACHE tool simplifies the design and simulation of SHC and DHW systems. In addition, it can calculate monthly and annual energy loads for heating, cooling, and DHW production. Figure 5 illustrates a schematic of the SHC system implemented using the PISTACHE tool. The components and configuration of the SHC system implemented using the PISTACHE tool. The components and configuration of the SHC system in the PISTACHE tool are determined by the Modelica language. After simulation with the PISTACHE tool, the base model created with the Modelica language produces reasonable simulation results; the values of TCOP are 0.157 and 0.164 with PISTACHE and the base model with Modelica. The values are almost the same by approximately 96% between both simulators.

Figure 5.
Schematic diagram of PISTACHE.
3.3. Searching Optimal Design Parameters
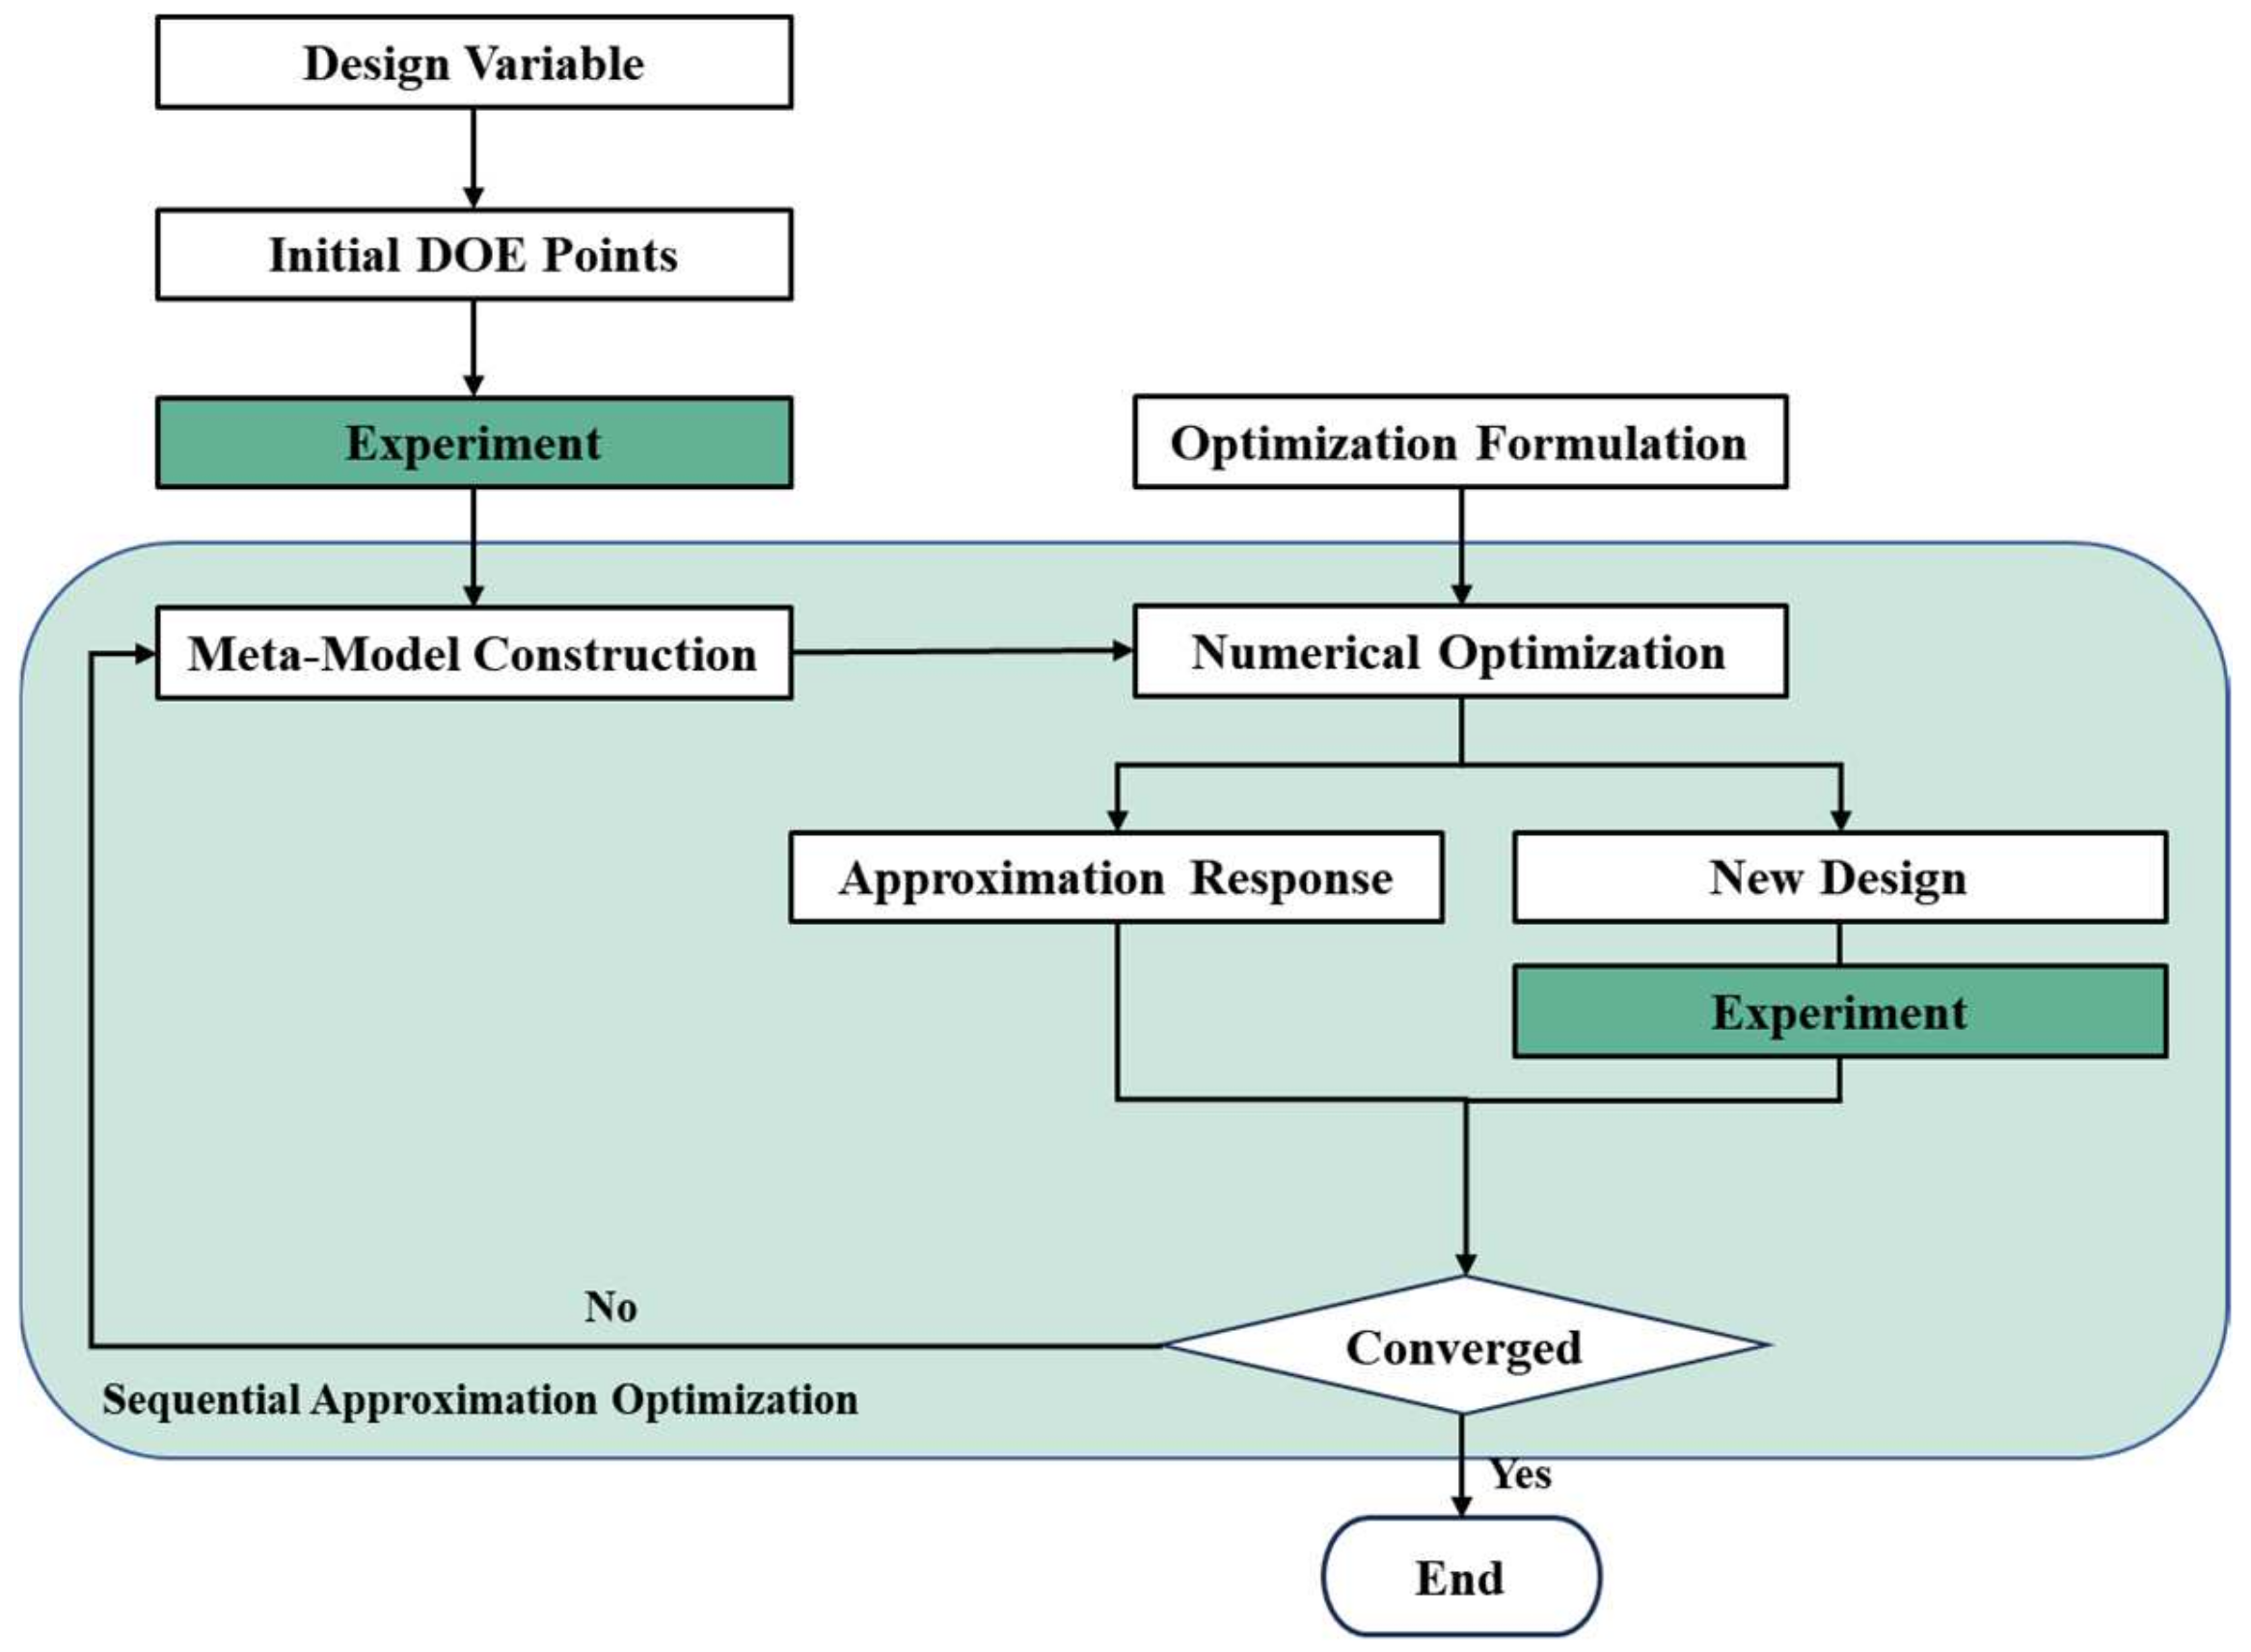
To conduct experiments on the selected design variables of the SHC system, a design of experiment (DOE) was established, as depicted in Figure 6. The objective function for optimization is presented below. Following the DOE method experiment, a meta model was generated based on the performance objective of the total coefficient of performance (TCOP) of the SHC system. This study consisted of 17 experiments based on 15 design parameters. The meta model employed is a radial distribution function, which is suitable for handling nonlinear design variables.
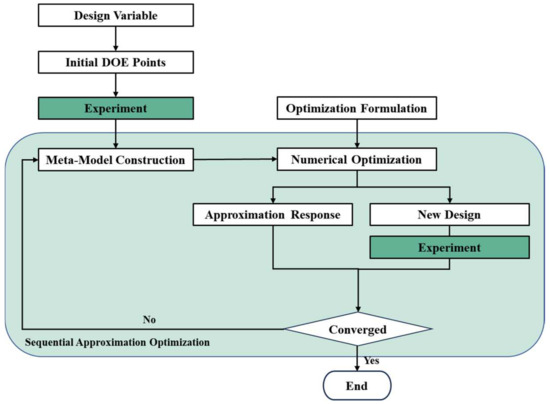
Figure 6.
Process for the design of experiment (DOE).
Following the experimentation using the DOE method, a meta model was created based on the maximization of the performance objective of the TCOP of the SHC system. The TCOP can be expressed as Equation (1). This study includes 17 experiments determined by 15 design parameters. The meta model utilized is a radial distribution function, which is deemed suitable for handling a set of nonlinear design variables.
3.4. Establishment of Optimal Control Logics
A solar system controller consists of two layers: a fuzzy controller and a proportional integral derivative (PID) controller. The fuzzy controller serves as the supervisory controller for the entire system, whereas the PID controller is further divided into sub-controllers responsible for specific components, such as valves, collectors, boilers, absorption chillers, and the targeted zone. The upper level of the controller, which is the fuzzy controller, establishes control targets and operational instructions for the subsystems based on sensor readings and predicted values derived from the Modelica model. The lower level consisted of feedback controllers, which execute precise control commands determined by the upper level of the controller. The complete configuration of the solar system controllers is shown in Figure 7.
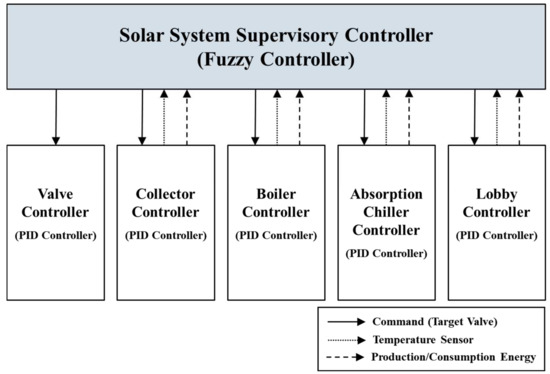
Figure 7.
Diagram of the structure of the solar system controller.
The higher tier of the controller employs fuzzy logic, which involves input and output values. The input values consist of various parameters, such as lobby temperature, thermal storage tank temperature, boiler outlet temperature, occupancy duration, time information, solar radiation levels, cooling tower outlet temperature, solar collector temperature, and the COP of the absorption chiller. In contrast, the output values include the control signals for four valves, the solar collector pump, solar collector shading, boiler operation, and absorption chiller operation. The lower tier of the controller employs PID logic, which can be defined using the function expressed below, to regulate the subsystems using predetermined target values derived from the higher tier of the controller.
u(t): the targeted control values;
e(t): the differences between setting values and real values;
Kp: the proportional factor;
TI: the integration factor;
TD: the differentiation factor;
The common tuning challenge involves the determination of the appropriate values for these three parameters, and numerous methods have been proposed in the literature to address various control requirements, such as set-point tracking, minimizing load disturbances, handling uncertainties in the system model, and mitigating measurement noise. Employing the Ziegler–Nichols formula typically leads to effective load disturbance reduction; however, it often results in a substantial overshoot and settling time in the step response, which may not be suitable for certain processes. Amplifying the analog gain, K, typically accentuates these two characteristics, and the incorporation of set-point weighting typically leads to an increase in the rise time as the effectiveness of the proportional action is somewhat diminished. However, this significant drawback can be circumvented by employing a fuzzy inference system to determine the weight value based on the current system error and its rate of change.
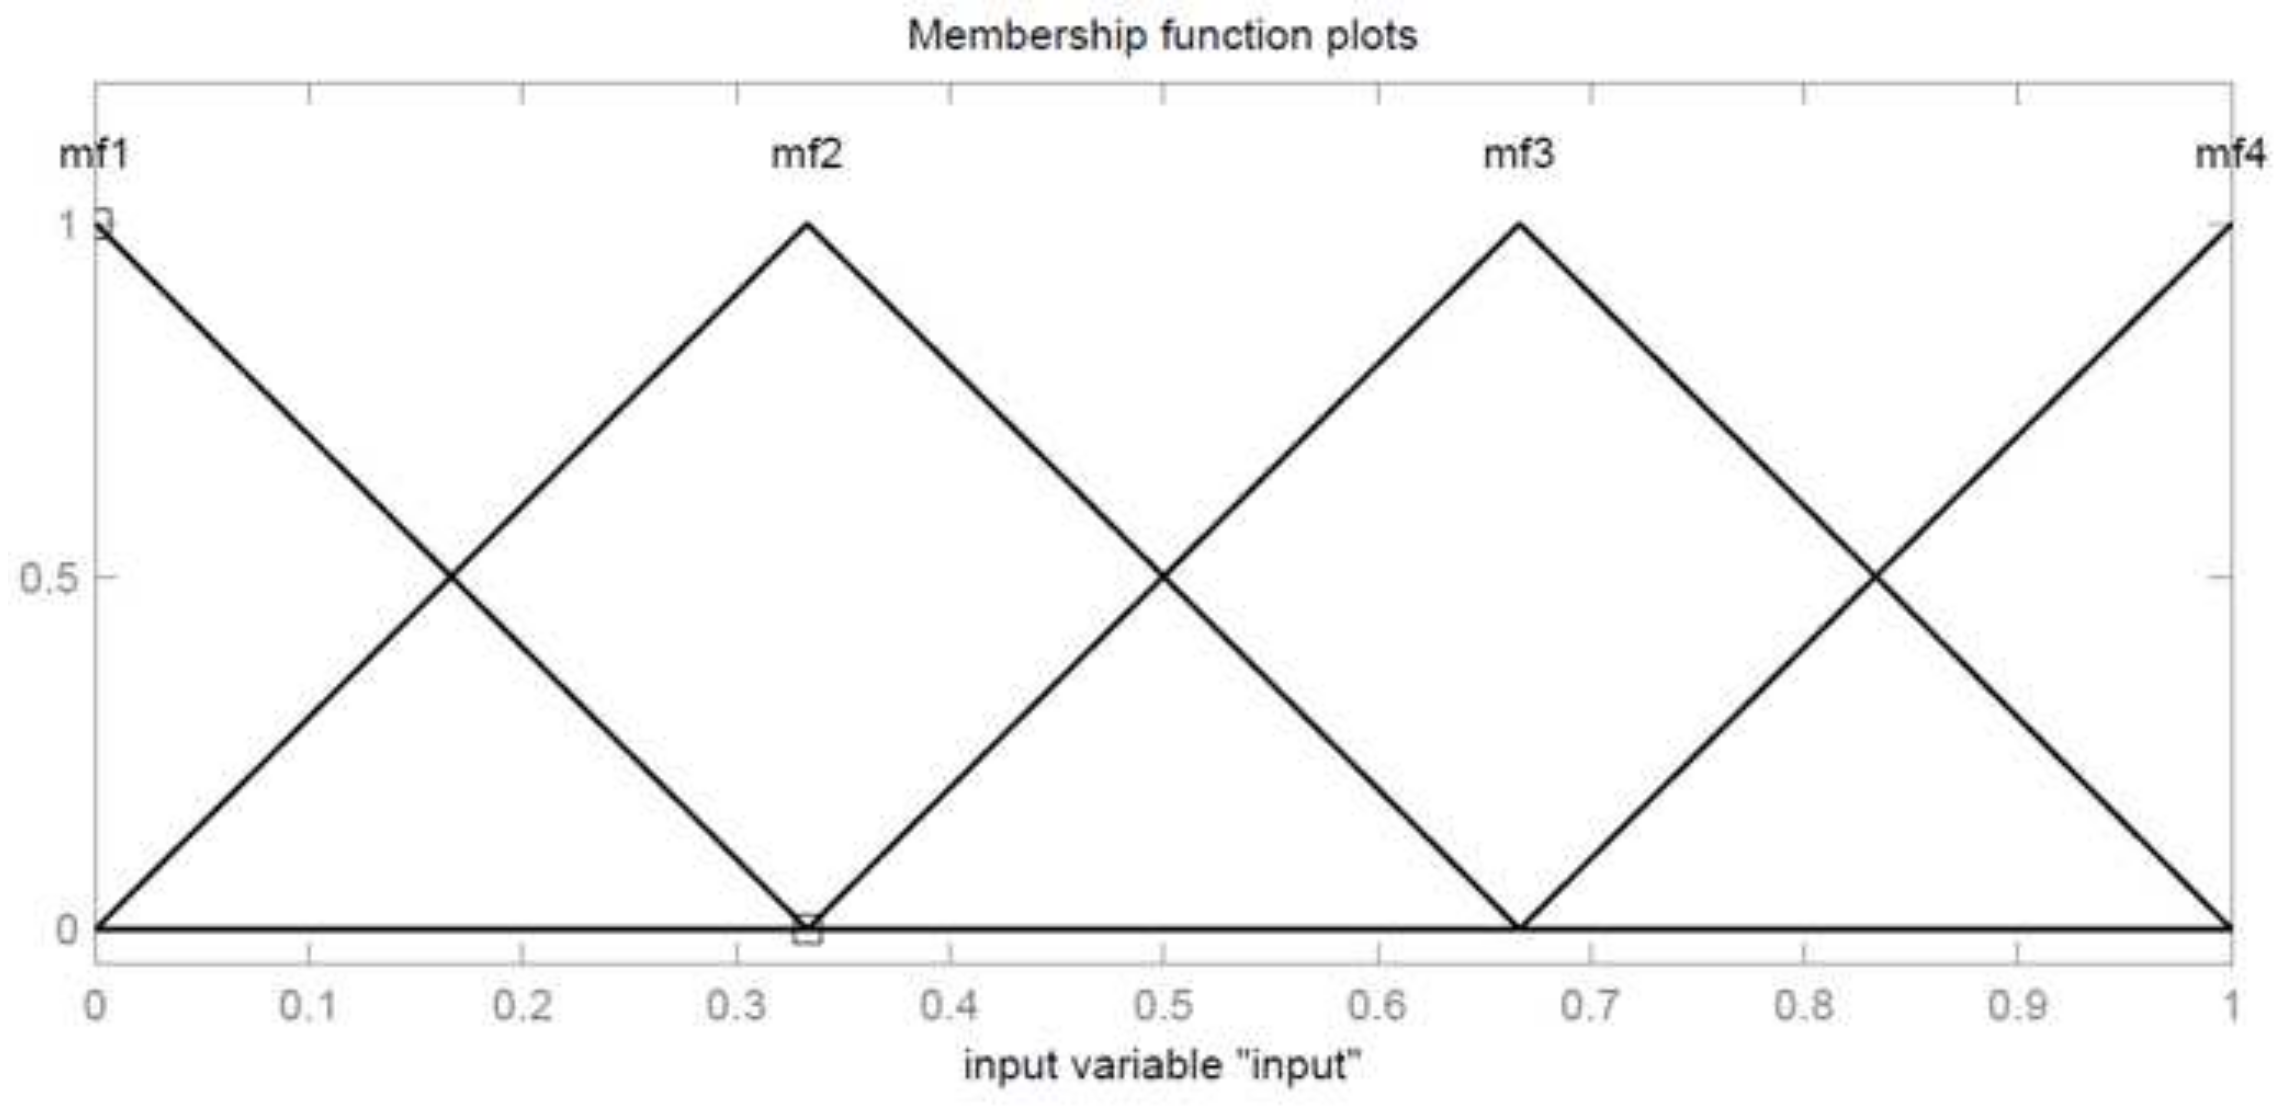
In essence, the concept is straightforward: the weight should be increased when expediting the convergence of the process output towards the setpoint is desired and decreased when slowing down the divergence trend of the output from the setpoint is necessary. For simplicity, the methodology was implemented by adding the output of the fuzzy module to a constant parameter, resulting in a coefficient that scales the set-point value. Each input value was assigned to a membership function, as depicted in Figure 8. In mathematical terms, a membership function in fuzzy logic is an extension of the indicator function used in classical sets. It represents the degree of truth, expanding the concept of valuation.
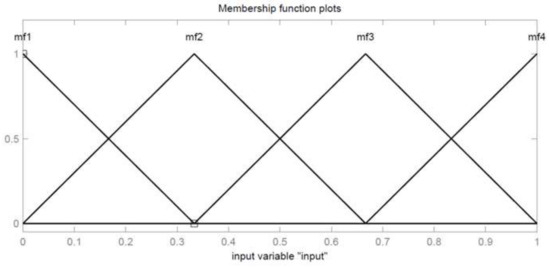
Figure 8.
Membership function type.
It is important to note that degrees of truth should not be mistaken for probabilities, as they differ conceptually. Fuzzy truth relates to membership in vaguely defined sets rather than the likelihood of an event or condition.
In the fuzzy inference system, the two inputs (system error (e) and its derivative (è)) are scaled using two coefficients, I and J. Particularly, when fuzzifying the set-point weight, I is determined as the inverse of the step size of the setpoint, whereas J aims to minimize the integrated absolute error. The output values are obtained through a rule-based approach, as presented in Table 1. As illustrated in the table, the outputs are determined based on the degrees of the relationship between each I and J (positive, zero, or negative). After of the implementation of Fuzzy to search for PID gain values, the values are inputted into the Modelica simulation, as shown as Figure 9.

Table 1.
Rule-based system for output variables.
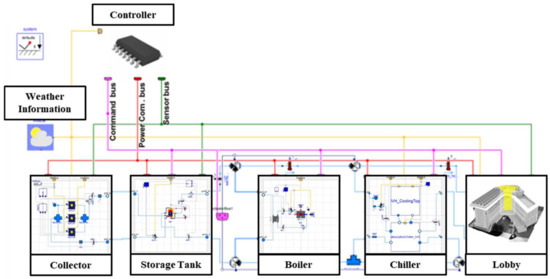
Figure 9.
SHC system with the controller simulated using Modelica.
4. Results
4.1. Optimal Design Parameters
The optimal design parameter values obtained using the method presented in Section 3.2 are shown in Table 2.
Table 2.
Parameters of the base model and optimal model.
The mass flow rate of the solar thermal collector was originally 1.38 kg/s but was reduced to 1.15 kg/s for the optimal model.
Additionally, the tilt angle of the collector of the optimal model was reduced from 26.7 to 15°, and the temperature difference shifted from 3.03 to 4.74°.
Further, the capacity of the thermal storage tank of the optimal model was increased from 1.46 to 1.5 m3. For the boiler, the optimal parameters were set for the heating set temperature, cooling set temperature, mass flow rates, and ranges of heating and cooling temperatures, as shown in Table 3. Similarly, the optimal parameters for the cooling tower were set for the mass flow rate, temperature range, and reference set temperature, as indicated in the table. The mass flow rates for the heating pump and cooling pump were both set to 1 kg/s for the optimal model.
Table 3.
Dynamic electricity cost by time for summer season in Korea.
4.1.1. Heat Generation of the Solar Collector
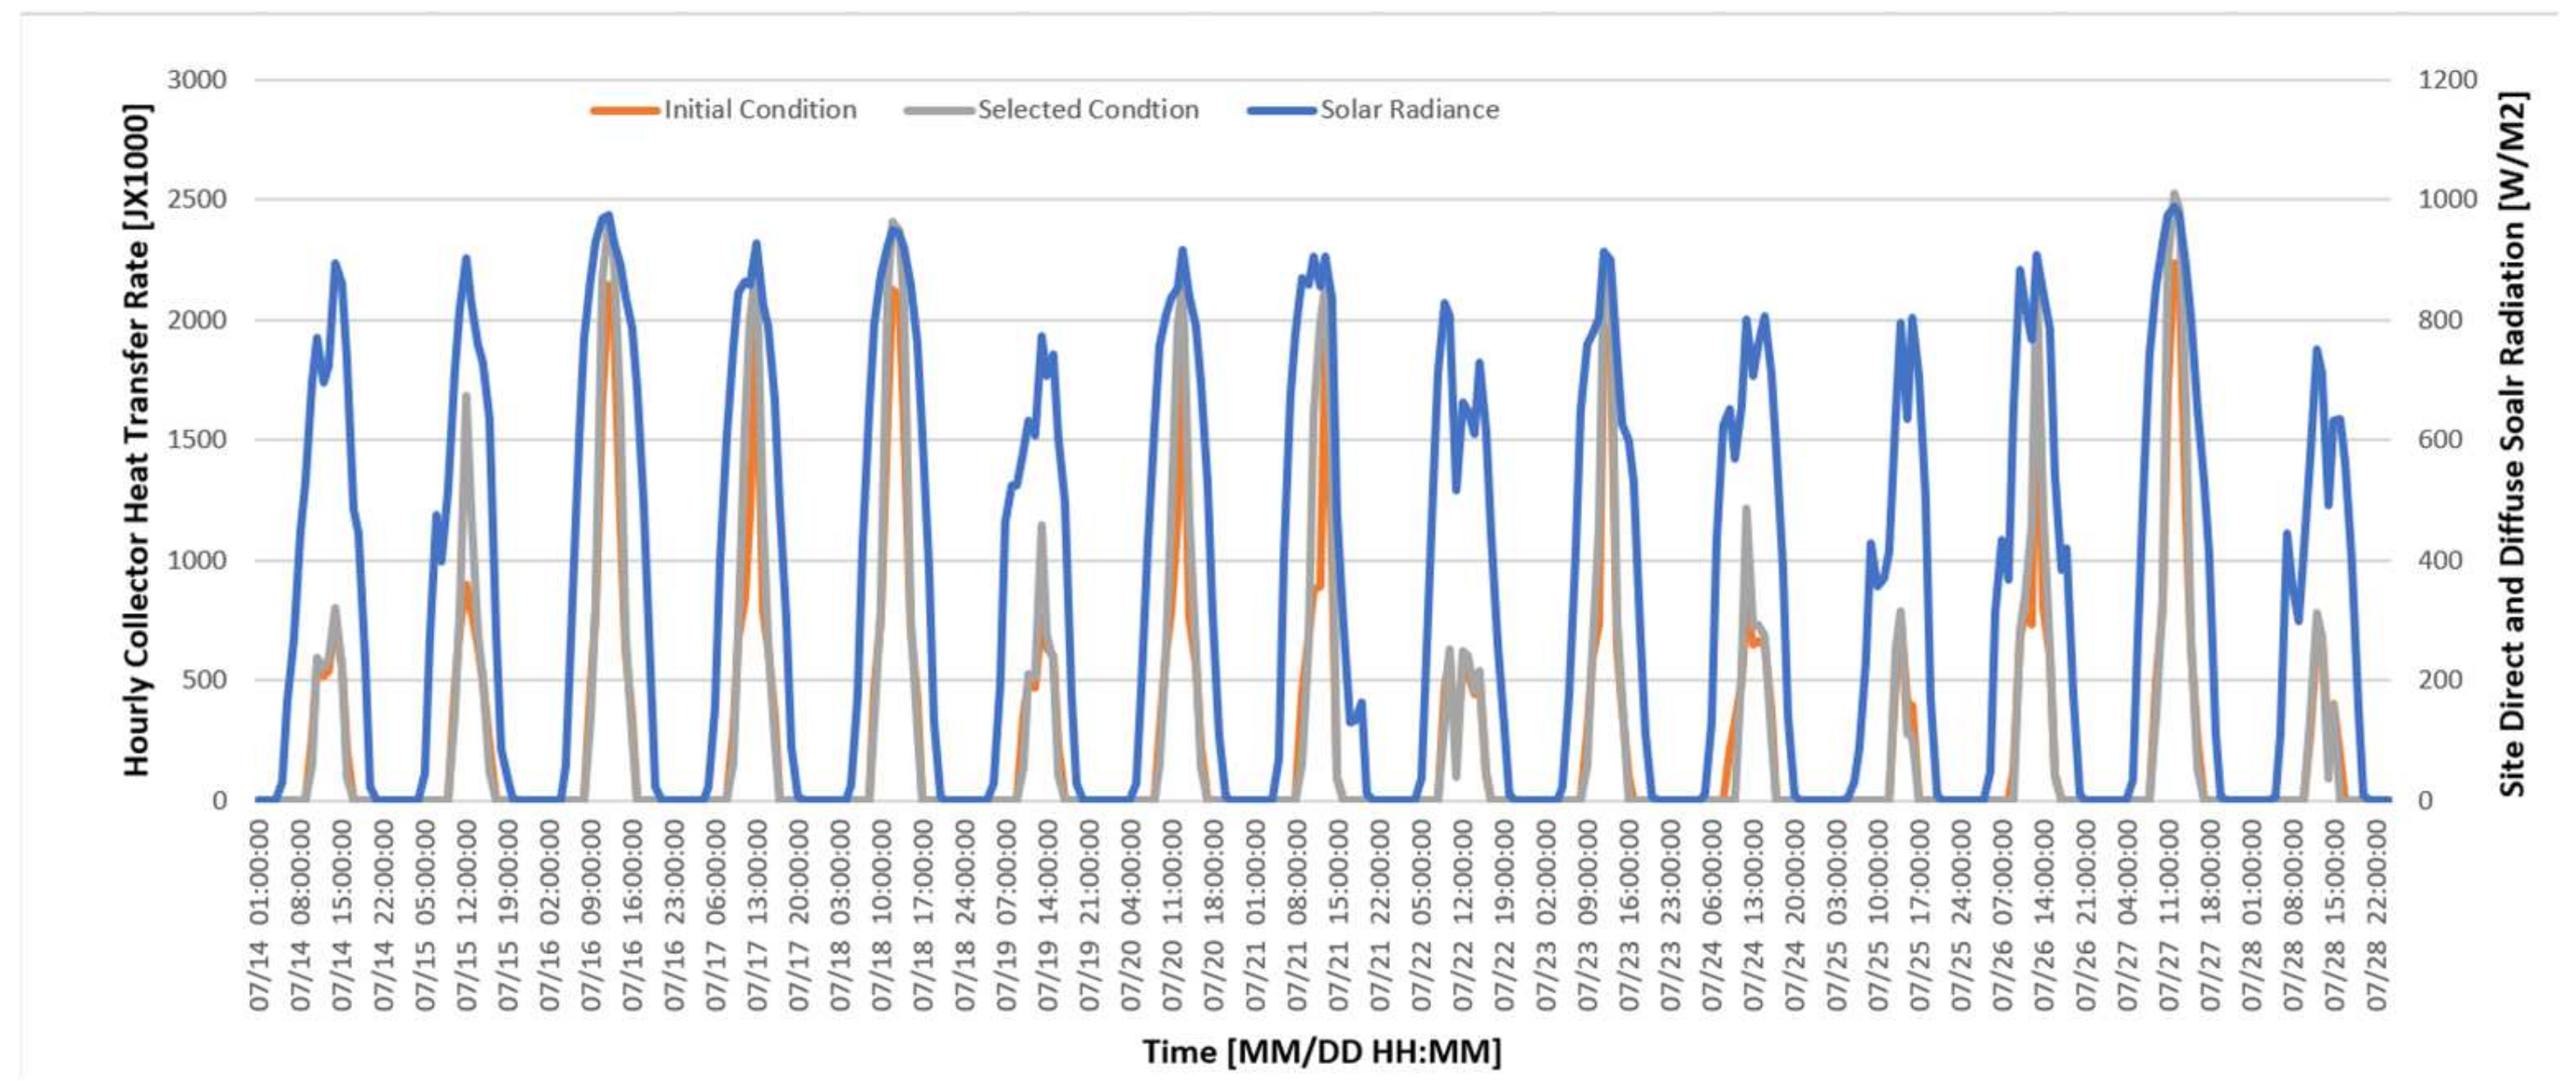
Figure 10 shows the heat generation rate in joules (J) of the solar collector based on the solar collector installation conditions a week before and after the design day (07/21) for system sizing. The peak solar insolation value on the solar panels was 989.3 W/m2 at 13:00 on 7/16 and 7/28.
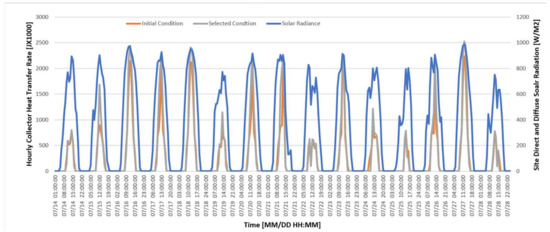
Figure 10.
Hourly heat generation rates under different installation conditions.
The hourly thermal energy that can be generated by the solar collector increased from 22.3 MJ under the initial condition to 25.2 MJ under the selected condition, indicating that the selected system can improve the maximum heat generation by 12% compared to the initial condition. The total heat generation rate for two weeks was 961.16 GJ and 833. 14 GJ under the initial and selected conditions, respectively, indicating that the selected condition can improve the total heat generation rate by 14.3% compared to the initial condition.
4.1.2. Hot Water Flow Rate
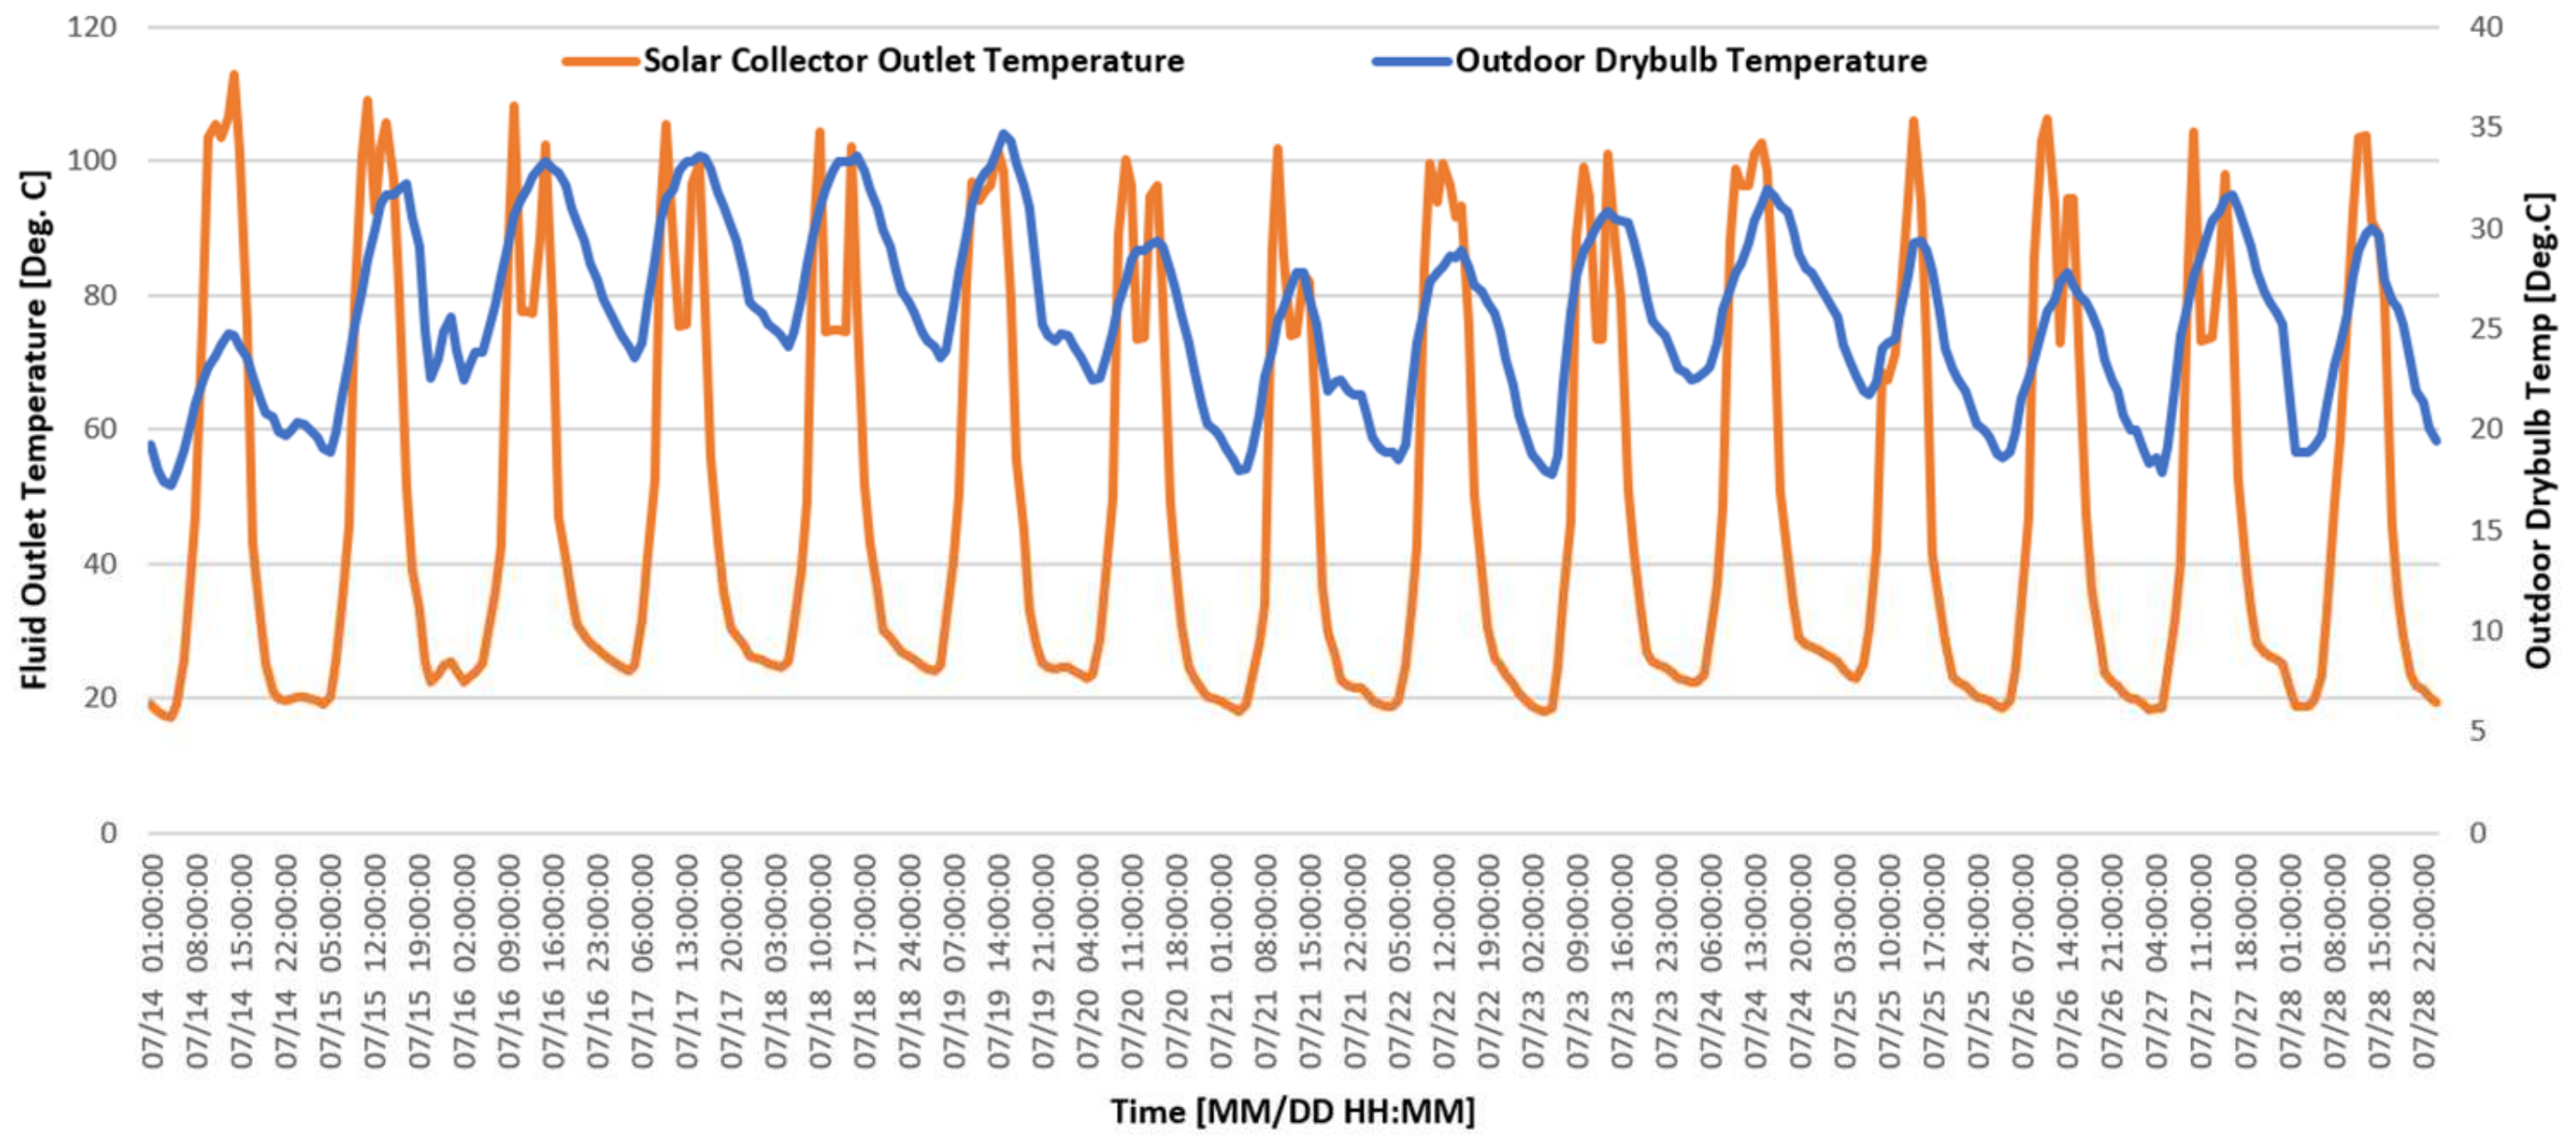
Hot water flows from the absorption chiller to the hot fluid storage tank, and the size of the tank and flow rate impact the heat transfer medium condition at the solar collector outlet. It is necessary to investigate the system outlet temperature of the solar collector that can satisfy the minimum inlet temperature of the absorption chiller. When the selected condition was applied to the actual installation, the fluid outlet temperatures of the solar collector ranged from 75 to 110 °C under the chiller operation time for the two weeks, as shown in Figure 11. The outlet fluid temperature was close to the outdoor air temperature at night but started to increase at 8:00 AM. The hourly average fluid temperature during the cooling operation (07:00–17:00) was above 87.45 °C, which satisfies the minimum temperature for the chiller operation. The fluid temperature was below 85 °C at 12:00 for 6 days (7/16, 7/17, 7/18, 7/20, 7/23, and 7/27) as the circulation pump was halted to avoid exceeding the fluid temperature.

Figure 11.
Hourly fluid outlet temperature under different solar collector ranges.
4.1.3. Heat Generation of Solar Collector
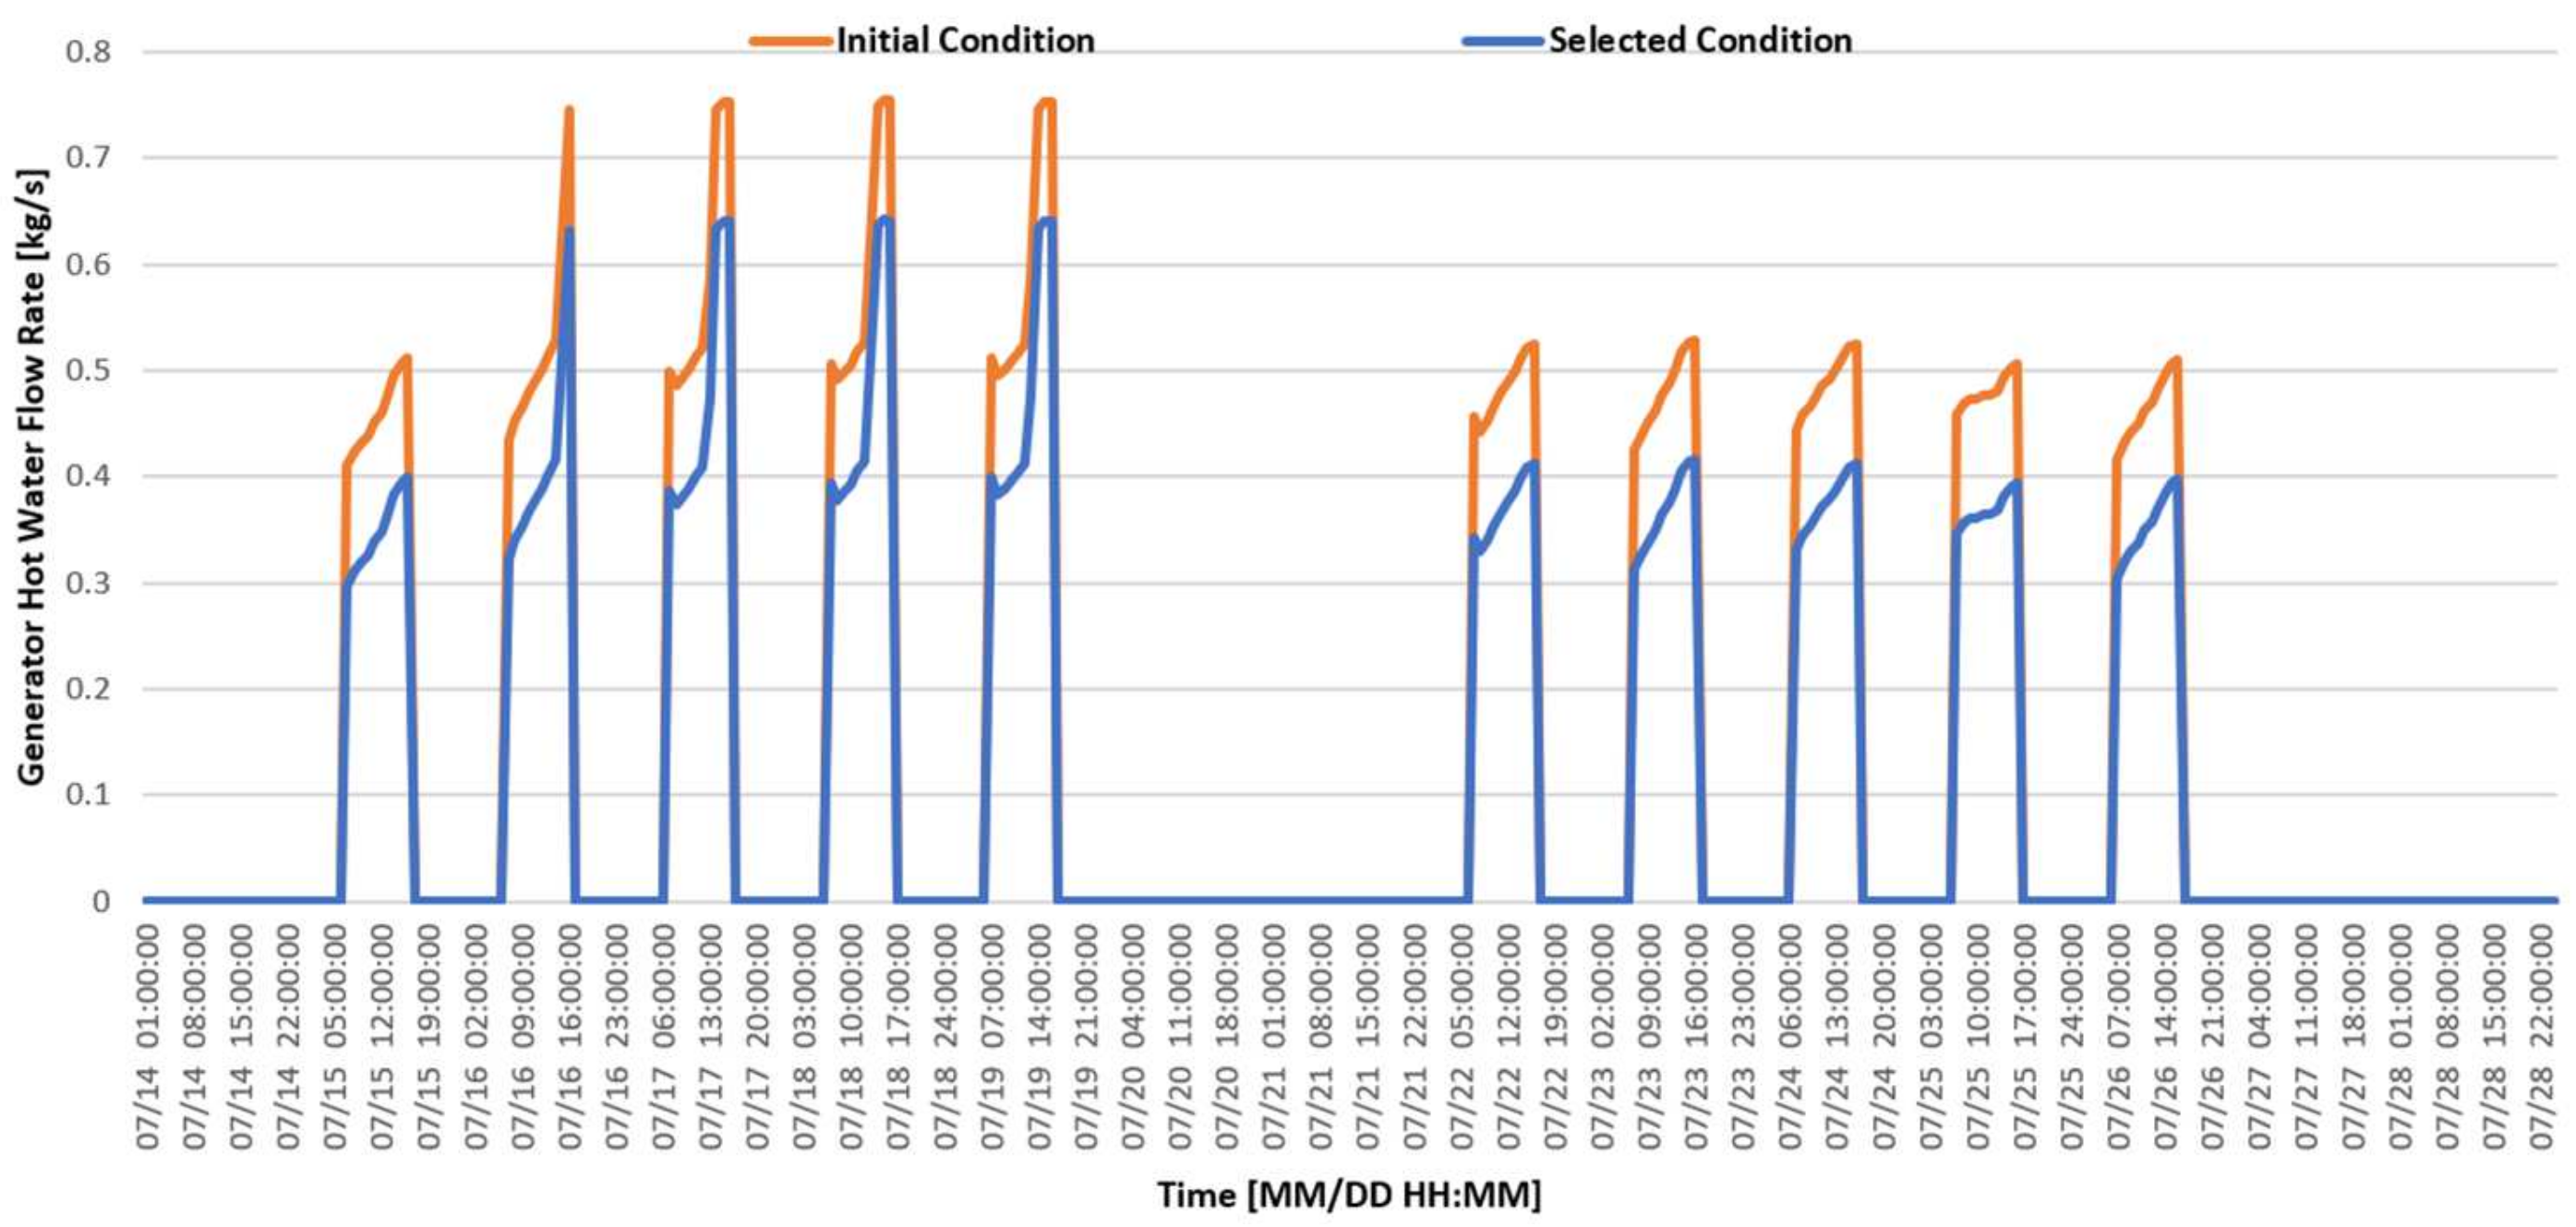
The initial condition defined the maximum average hot water flow at 1.8 kg/s to operate the absorption chiller. For the optimized design condition, the maximum flow rate can be reduced to 0.8 kg/s with the solar collector and storage tank size. In terms of the cooling operation, the flow rate can be changed by the cooling demand and the heat generation of solar collectors. Figure 12 illustrates the hourly averaged hot water flow rate of the chiller for the two weeks. For the initial design, the flow rates ranged from 0.4 to 0.75 kg/s but reduced to 0.3 to 0.64 kg/s under the selected condition. This indicates that the design optimization not only reduced the circulation pump size by 54% but also reduced the pump energy consumption by 25% compared the initial condition.
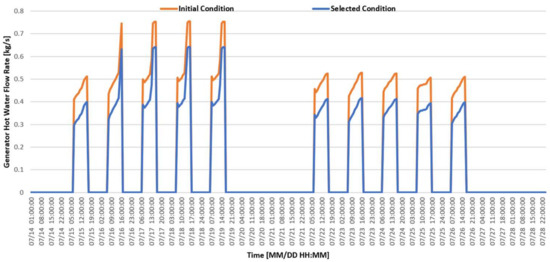
Figure 12.
Averaged hourly hot water flow rates for of the absorption chiller.
4.1.4. Auxiliary Boiler Operations
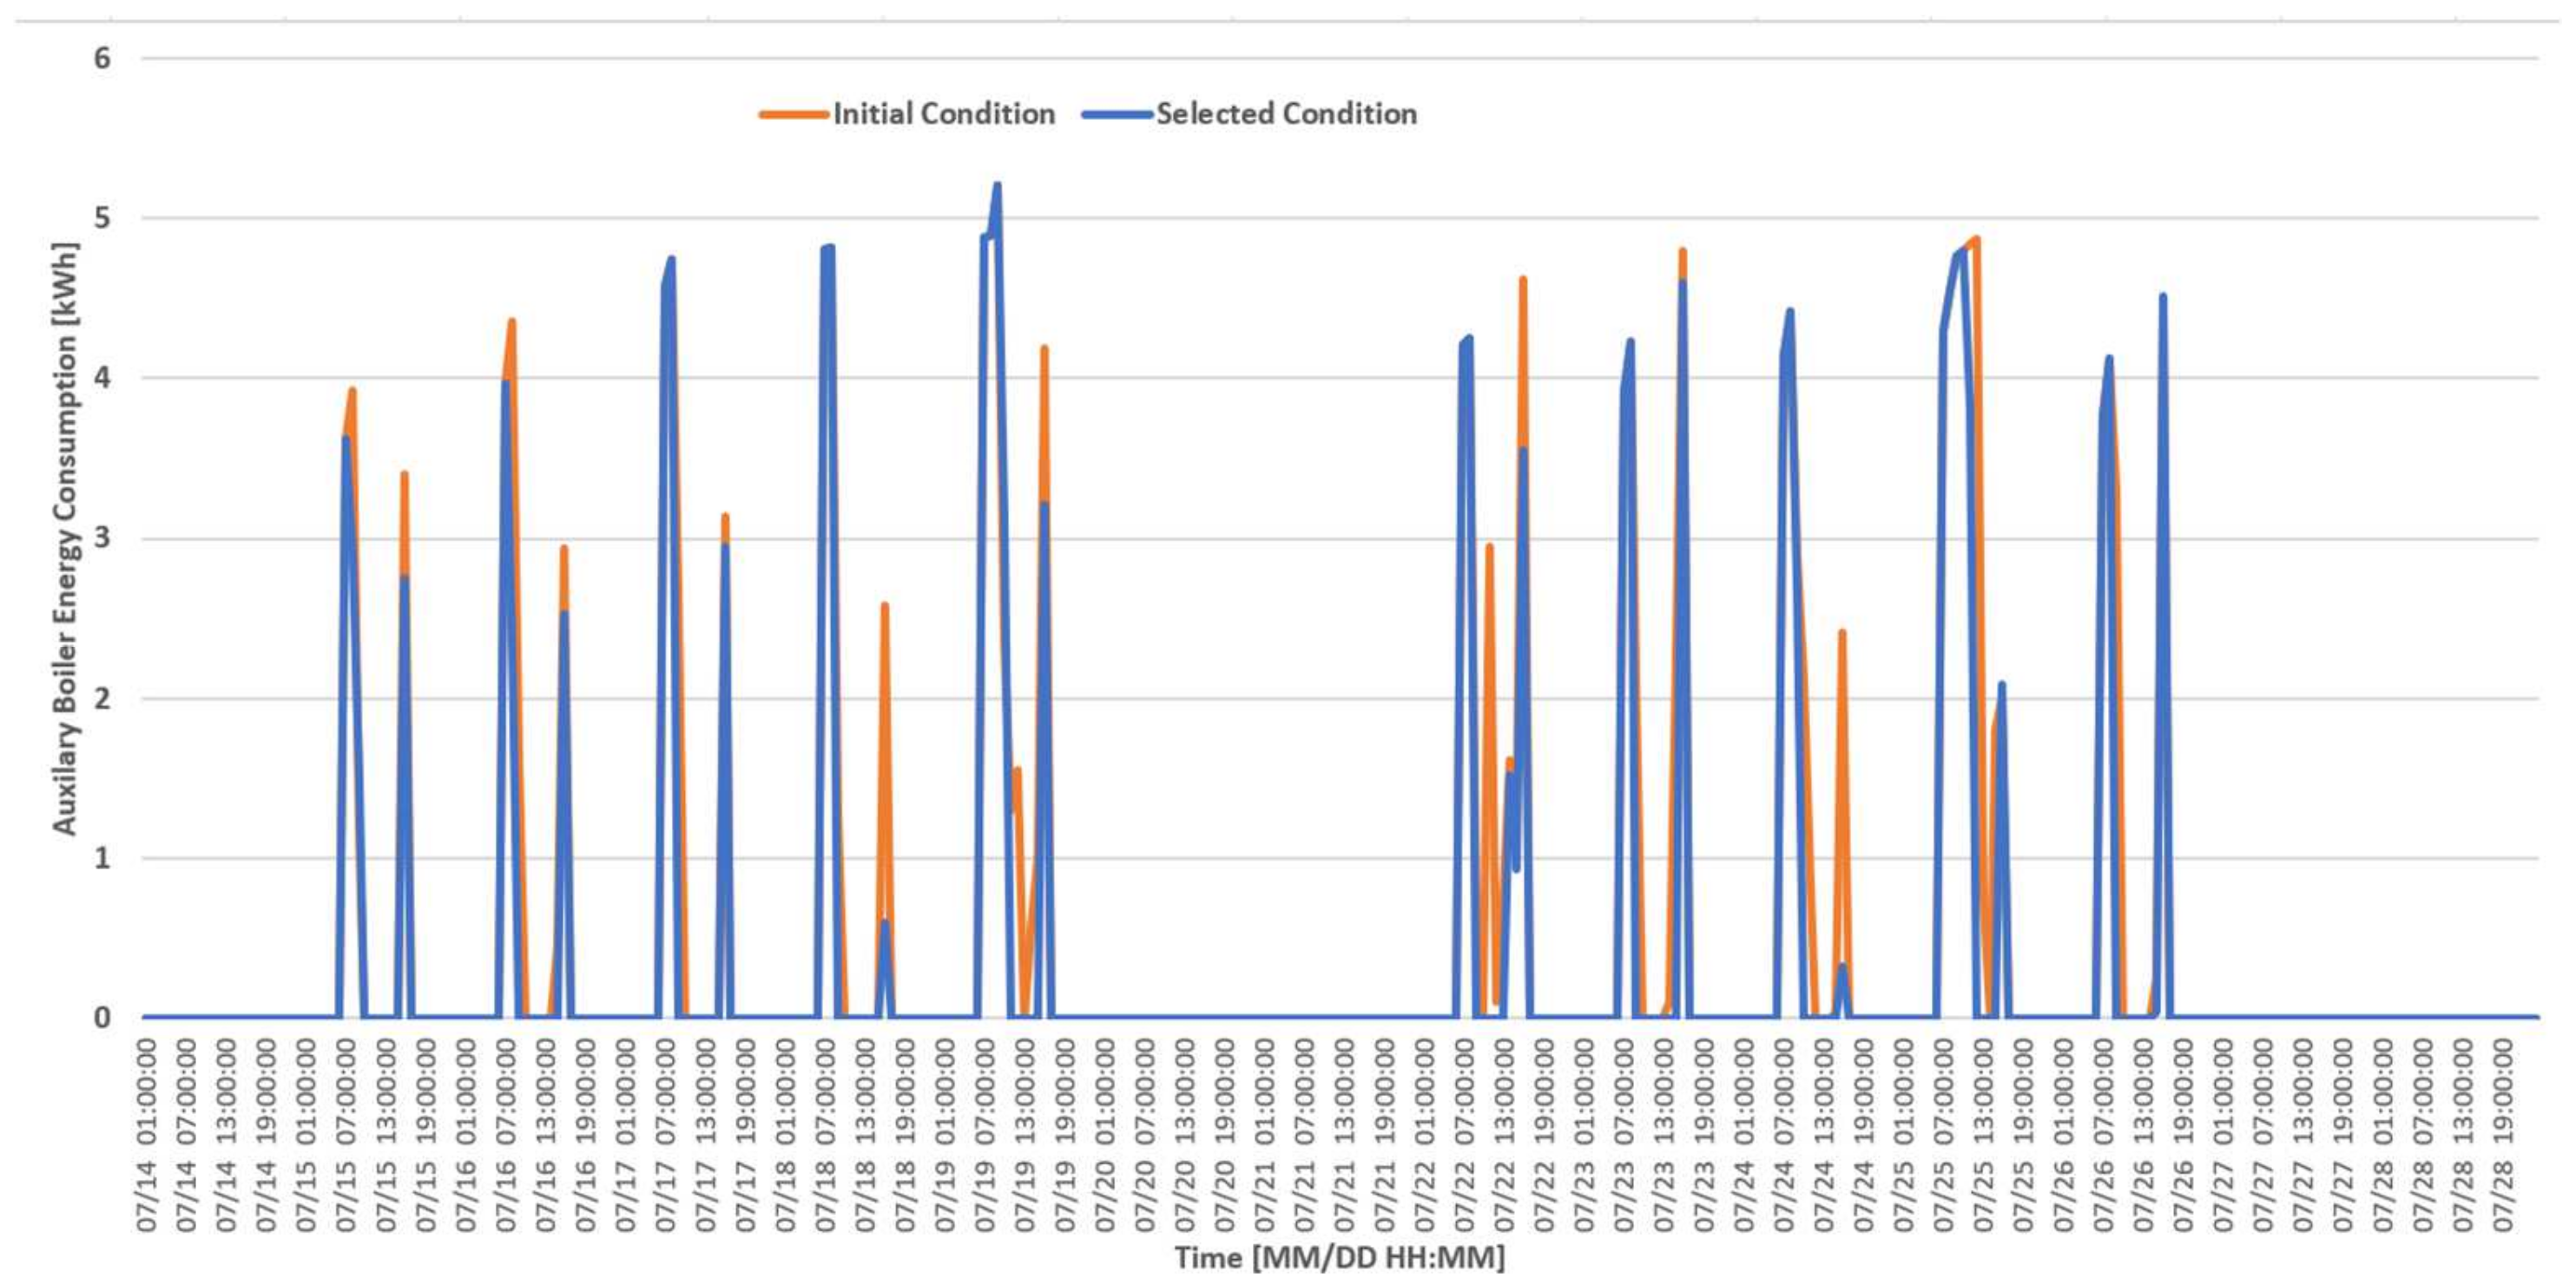
Figure 13 illustrates the average hourly natural gas energy consumption of the auxiliary gas boiler of the absorption chiller. The early morning (07–09) operation of the auxiliary boiler was required under both the initial design condition and the selected condition owing to insufficient heat generation. The peak natural gas energy consumption for both the design conditions was 5.4 kWh at 9 AM on 7/19. The hourly average natural gas consumption under the cooling mode for the period was 1.8 and 1.39 kWh for the initial and selected conditions, respectively. The selected condition reduced the boiler operation time owing to the solar collector tilt angle and storage tank size.
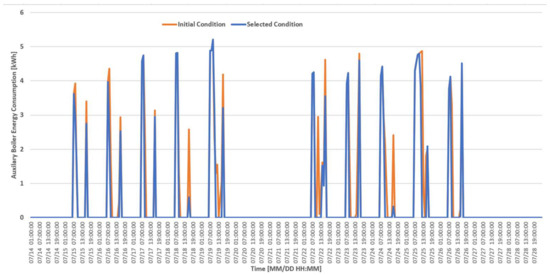
Figure 13.
Hourly natural gas energy consumption for of the auxiliary boiler.
For the two weeks, the natural gas consumption under the initial condition was 183.39 kWh, which reduced to 139.02 kWh under the selected condition, indicating that the system optimization process reduced the energy consumption of the boiler during this period by 24.2%.
4.2. Evaluation of the Control Optimization under Actual Operations
We conducted a 10-day experiment to validate the results by applying the performance of the simulator directly to the system. An experimental period of 10 days was selected to achieve similar solar radiation and ambient temperature conditions to the conditions used for the comparative analysis.
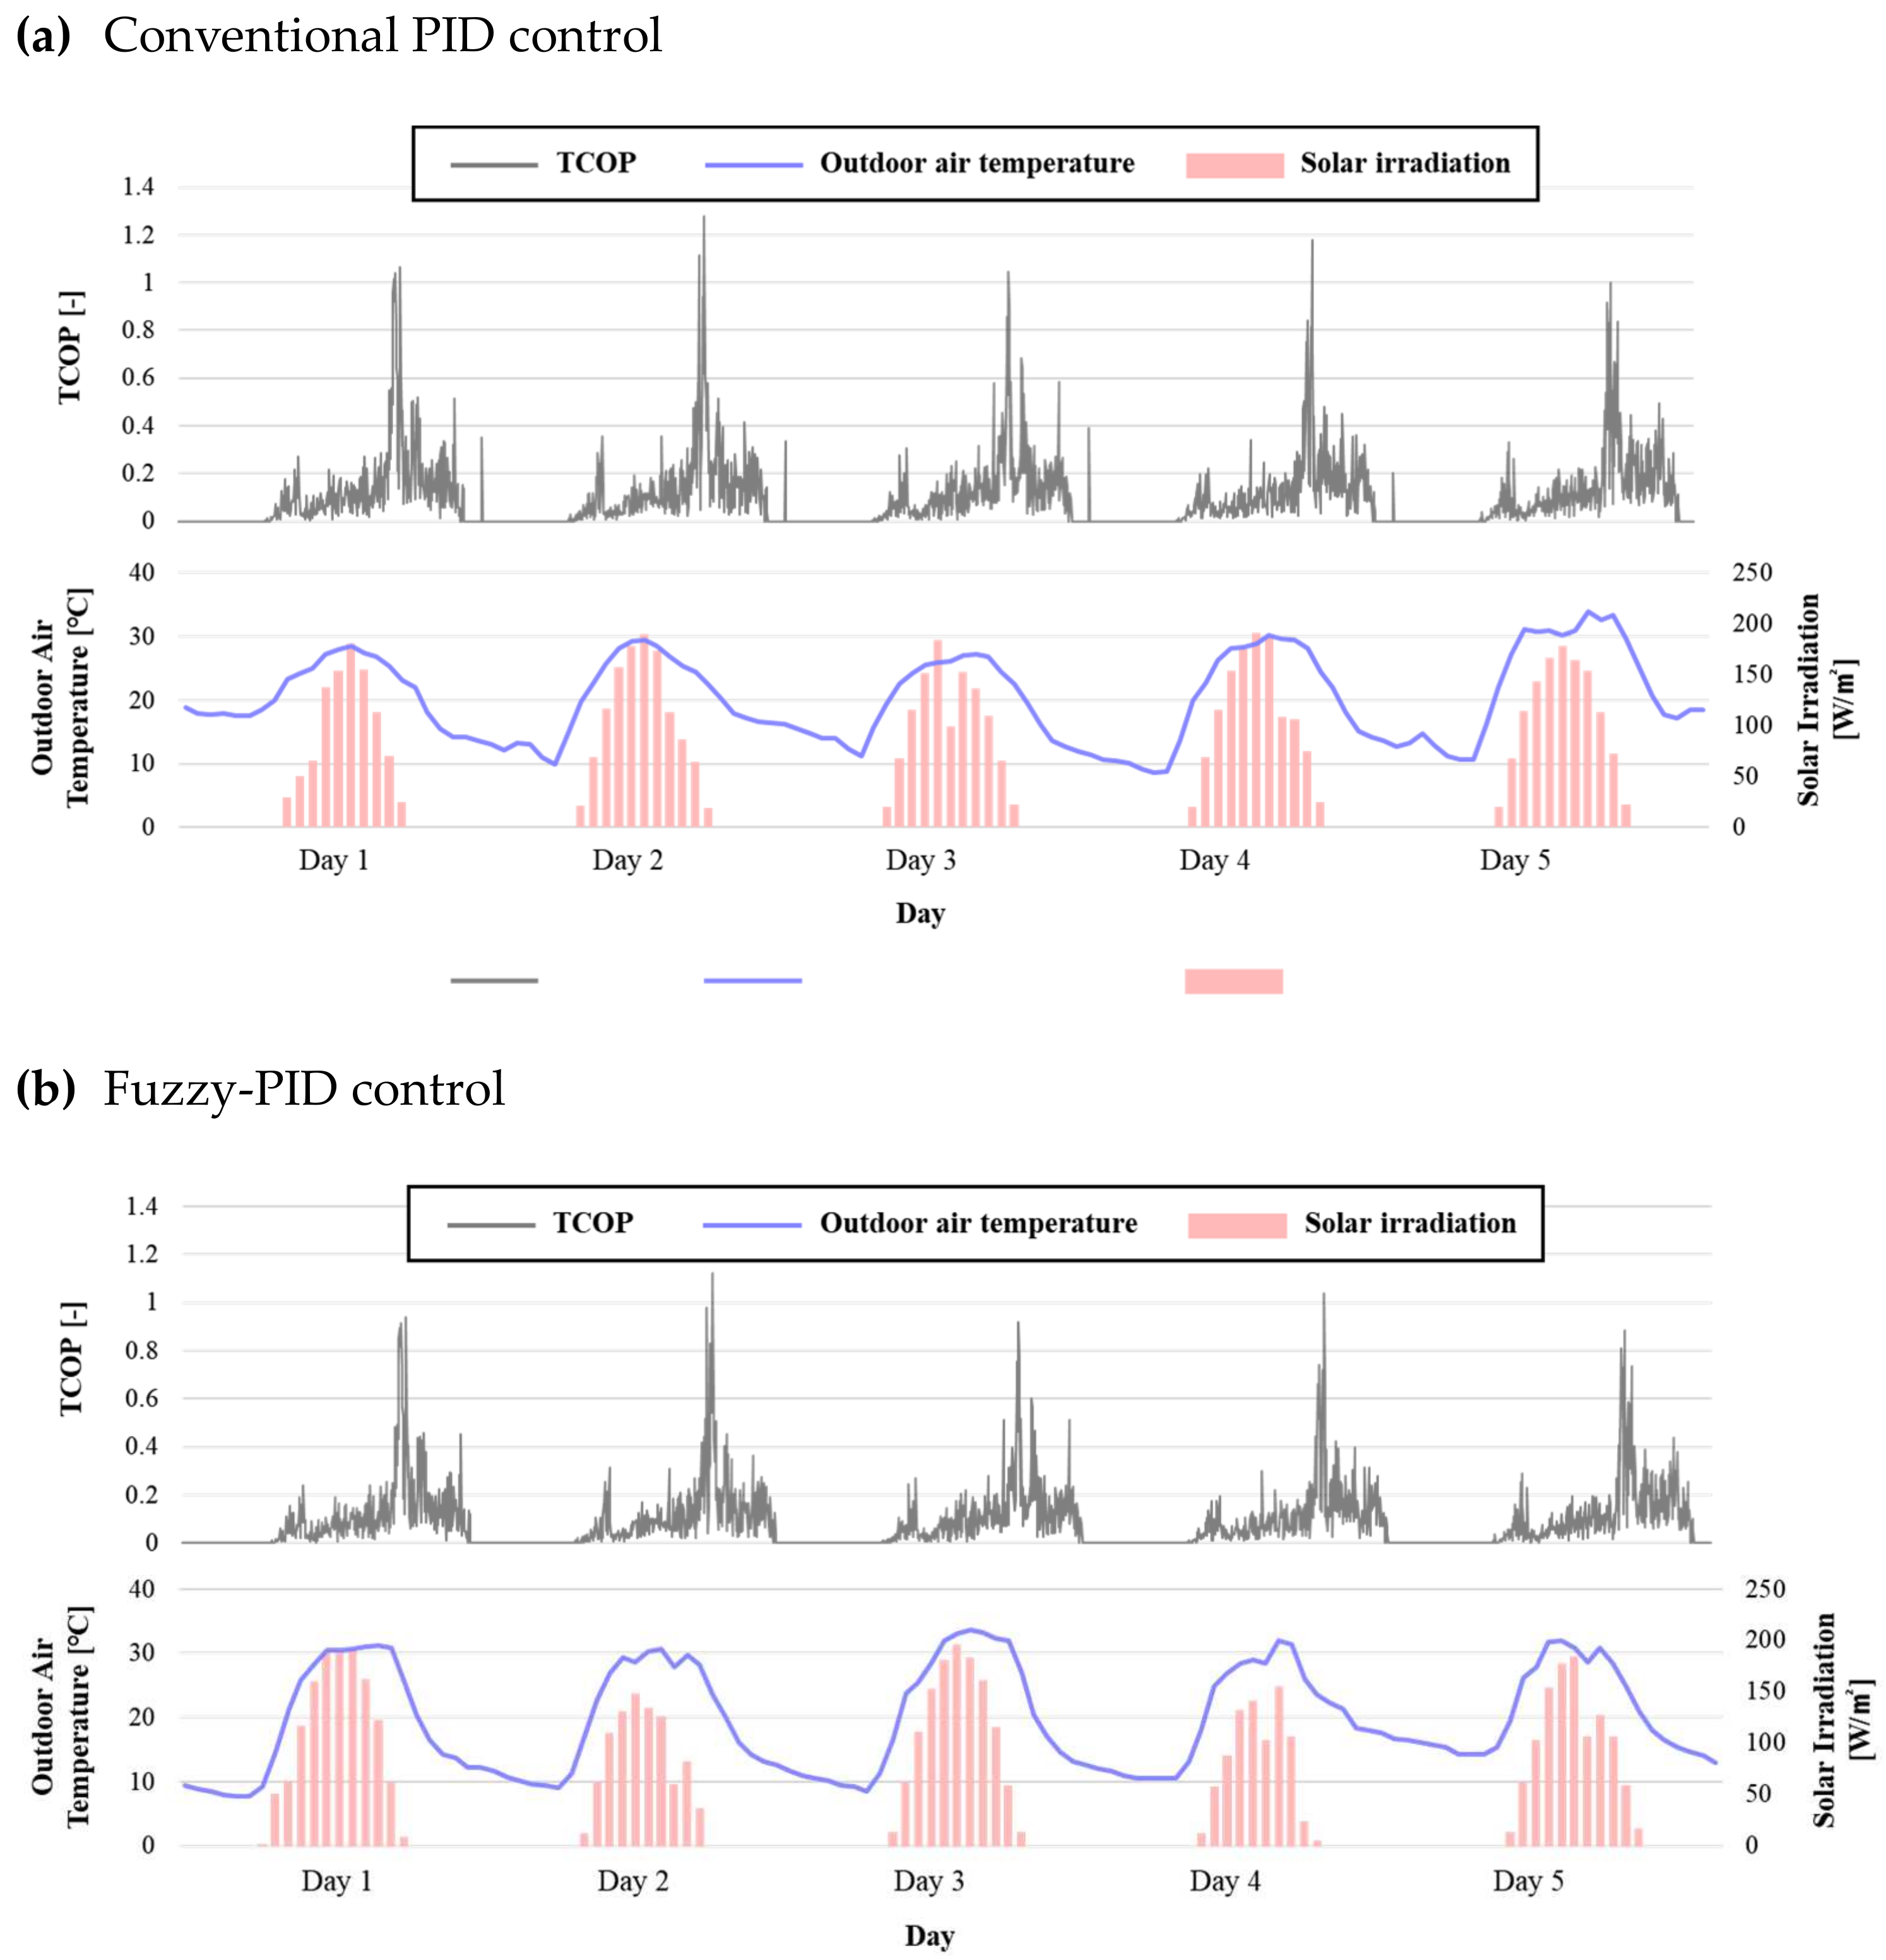
As shown in Figure 14, the system utilizing the existing parameters and PID logic operated during a period with an average solar radiation of approximately 47.85 W/m3 and an average ambient temperature of 20.32 °C. According to Equation [1], the performance during the five-day period was 0.086, 0.082, 0.080, 0.077, and 0.085, respectively. In contrast, the system in which the optimal parameters were applied and fuzzy-based PID logic operated during a period with an average solar radiation of 45.13 W/m3 and an average ambient temperature of 19.65 °C achieved performance values of 0.098, 0.094, 0.091, 0.088, and 0.096, respectively.
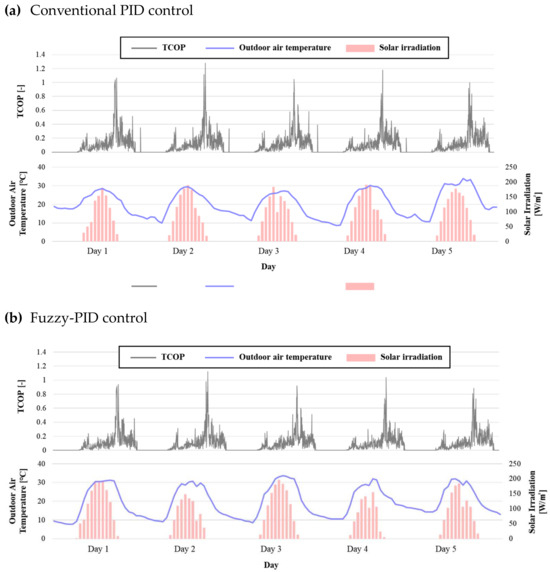
Figure 14.
Comparison of conventional (a) proportional integral derivative (PID) control (a) and (b) fuzzy PID control (b).
Furthermore, during each empirical period, the peak performance of the existing system was 1.124, whereas it was 1.278 when the optimal parameters and fuzzy-based algorithm were applied, indicating a 13.7% improvement in the performance.
Additionally, a comparison of the average values throughout the entire period revealed that the performance of the existing system was 0.03167 but increased to an average of 0.09336 when the optimal parameters and control values were used, indicating an improvement of approximately 12% in the performance. Based on the actual results from the 10-day period, the energy consumption by the conventional PID control, including the heat exchanger, auxiliary boiler, absorption chiller, and pump, was 696.89 kWh, whereas the optimized design and control can reduce the total energy consumption for the period to 556.12 kWh.
The utility cost for the operation period was calculated with the dynamic prices of electricity for the target building, as shown in Table 3. The operation cost of the conventional PID control was USD 80.4 for 5 days, but the cost was down to USD 62.2 for the same period using the developed system. This means the developed system operation can produce a cost savings of 23% compared to the conventional operation due to higher utility prices during peak demand (11–12, 13–18). This indicates that the improvement in system control can be applied to building energy management with seasonal and time-based utility price changes in energy sources.
5. Conclusions
Solar heating and cooling systems have been in existence for a long time; however, their optimal design and operational evaluations have not been extensively investigated. In this study, rather than analyzing individual components, we performed a comprehensive design and operational optimization study of a solar heating system, which combines a vacuum solar collector with an absorption chiller and utilizes auxiliary heating sources. We validated the feasibility of the approach by installing and operating the system in a real building.
When the optimal design based on the overall operational characteristics of the system was implemented and compared to the initial conditions provided by each manufacturer, a maximum energy savings potential of 26% was achieved over a two-week period using the design criteria. Furthermore, the implementation of the fuzzy-based PID control, in addition to the conventional PID control for the system installed based on the optimal design, resulted in an overall performance coefficient improvement of 12%, leading to an additional 16% energy savings effect. This indicates a significant enhancement in the efficiency of the solar heating system through improved design and operation. These operational conditions influence the energy consumption of both the conventional and improved operating modes, resulting in approximately a 15% reduction in energy costs. Despite the relatively large conditioned space where the system operates, it can run with minimal thermal energy input, providing insights for the design and operational techniques of SHC systems for future zero-energy buildings.
In the future, it will be essential to compare heating performance characteristics during the winter season and explore the optimal operational strategies for the transition season. Additionally, the development of optimal design guidelines that consider the cooling load of buildings, outdoor solar radiation, and outdoor temperature characteristics should be planned. This will enhance the feasibility of low-carbon heating and cooling systems, thus effectively responding to the increasing demand for zero-energy buildings. Also, based on the recent research on exploring PID constant values through reinforcement learning methodologies in deep learning, future research aims to develop an optimal PID control algorithm using reinforcement learning with Modelica as the environment. Furthermore, the study will extend to the development of optimal parameters and control algorithms for renewable energy systems as a whole.
Funding
This research was supported by a Korea Agency for Infrastructure Technology Advancement (KAIA) grant funded by the Korean government (MOLIT) (RS-2023-00250434).
Institutional Review Board Statement
Not applicable.
Informed Consent Statement
Not applicable.
Data Availability Statement
Data are contained within the article.
Conflicts of Interest
The authors declare no conflict of interest.
Nomenclature
| SHC | solar heating and cooling |
| COP | coefficient of performance |
| SRCC | solar rating and certification corporation |
| SAO | sequential approximate optimization |
| DOE | design of experiment |
| P | positive |
| N | negative |
| PB | positive big |
| PM | positive medium |
| ZO | zero |
| NB | negative big |
| NM | negative medium |
| Qrad | solar radiation received on the collector area [kWh] |
| Acoll | area of solar collector [m2] |
| Esol | electricity usage for solar auxiliary systems [kWh] |
| COPabs | COP of absorption chiller [-] |
| TCOP | total performance efficiency of SHC system [-] |
| H load | heating load [kWh] |
| C load | cooling load [kWh] |
| Boiler.H | boiler energy consumption for heating [kWh] |
| Boiler.C | boiler energy consumption for cooling [kWh] |
| Room.E | energy usage in targeted zone [kWh] |
References
- United Nations. Framework Convention on Climate Change. Paris Agreement. Available online: https://unfccc.int/sites/default/files/english_paris_agreement.pdf (accessed on 2 July 2023).
- European Commission. Proposal for a Regulation of the European Parliament and of the Council Establishing the Framework for Achieving Climate Neutrality and Amending Regulation (EU) 2018/1999 (European Climate Law). Available online: https://eur-lex.europa.eu/legal-content/EN/TXT/PDF/?uri=CELEX:52020PC0080&from=EN (accessed on 2 July 2023).
- Government of India. India’s Updated First Nationally Determined Contribution under Paris Agreement. Available online: https://unfccc.int/sites/default/files/NDC/2022-08/India%20Updated%20First%20Nationally%20Determined%20Contrib.pdf (accessed on 2 July 2023).
- Praveenkumar, S.; Agyekum, E.B.; Kumar, A.; Velkin, V.I. Thermo-enviro-economic analysis of solar photovoltaic/thermal system incorporated with u-shaped grid copper pipe, thermal electric generators and nanofluids: An experimental investigation. J. Energy Storage 2023, 60, 106611. [Google Scholar] [CrossRef]
- Hodgson, D.; Vass, T.; Levi, P.; Hugues, P. Industry; Technical Report; IEA: Paris, France, 2022; Available online: https://www.iea.org/reports/industry# (accessed on 2 July 2023).
- Bellevrat, E.; West, K. Clean and Efficient Heat for Industry; Technical Report; IEA: Paris, France, 2018; Available online: https://www.iea.org/commentaries/clean-and-efficient-heat-for-industry (accessed on 2 July 2023).
- Zurita, A.; Mata-Torres, C.; Cardemil, J.M.; Guédez, R.; Escobar, R.A. Multi-objective optimal design of solar power plants with storage systems according to dispatch strategy. Energy 2021, 237, 121627. [Google Scholar] [CrossRef]
- Zurita, A.; Mata-Torres, C.; Cardemil, J.M.; Escobar, R.A. Assessment of time resolution impact on the modeling of a hybrid CSP-PV plant: A case of study in Chile. Sol. Energy 2020, 202, 553–570. [Google Scholar] [CrossRef]
- Qin, J.; Hu, E.; Li, X. Solar aided power generation: A review. Energy Built Environ. 2020, 1, 11–26. [Google Scholar] [CrossRef]
- Mata-Torres, C.; Palenzuela, P.; Alarcón-Padilla, D.C.; Zurita, A.; Cardemil, J.M.; Escobar, R.A. Multi-objective optimization of a Concentrating Solar Power+Photovoltaic+Multi-Effect Distillation plant: Understanding the impact of the solar irradiation and the plant location. Energy Convers. Manag. 2021, 11, 100088. [Google Scholar] [CrossRef]
- Mata-Torres, C.; Palenzuela, P.; Zurita, A.; Cardemil, J.M.; Alarcón-Padilla, D.C.; Escobar, R.A. Annual thermoeconomic analysis of a Concentrating Solar Power + Photovoltaic + Multi-Effect Distillation plant in northern Chile. Energy Convers. Manag. 2020, 213, 112852. [Google Scholar] [CrossRef]
- Ahmed, F.; Sharizal Abdul Aziz, M.; Palaniandy, P.; Shaik, F. A review on application of renewable energy for desalination technologies with emphasis on concentrated solar power. Sustain. Energy Technol. Assess. 2022, 53, 102772. [Google Scholar] [CrossRef]
- Villarruel-Jaramillo, A.; Pérez-García, M.; Cardemil, J.M.; Escobar, R.A. Review of Polygeneration Schemes with Solar Cooling Technologies and Potential Industrial Applications. Energies 2021, 14, 6450. [Google Scholar] [CrossRef]
- Pauschinger, T. 5-Solar thermal energy for district heating. In Advanced District Heating and Cooling (DHC) Systems; Wiltshire, R., Ed.; Woodhead Publishing Series in Energy; Woodhead Publishing: Oxford, UK, 2016; pp. 99–120. [Google Scholar]
- Nielsen, J.E.; Sørensen, P.A. 9-Renewable district heating and cooling technologies with and without seasonal storage. In Renewable Heating and Cooling; Stryi-Hipp, G., Ed.; Woodhead Publishing: Oxford, UK, 2016; pp. 197–220. [Google Scholar]
- Valenzuela, C.; Felbol, C.; Quiñones, G.; Valenzuela, L.; Moya, S.L.; Escobar, R.A. Modeling of a small parabolic trough plant based in direct steam generation for cogeneration in the Chilean industrial sector. Energy Convers. Manag. 2018, 174, 88–100. [Google Scholar] [CrossRef]
- Ravi Kumar, K.; Krishna Chaitanya, N.; Sendhil Kumar, N. Solar thermal energy technologies and its applications for process heating and power generation—A review. J. Clean. Prod. 2021, 282, 125296. [Google Scholar] [CrossRef]
- Farjana, S.H.; Huda, N.; Mahmud, M.P.; Saidur, R. Solar process heat in industrial systems—A global review. Renew. Sustain. Energy Rev. 2018, 82, 2270–2286. [Google Scholar] [CrossRef]
- Ismail, M.I.; Yunus, N.A.; Hashim, H. Integration of solar heating systems for low-temperature heat demand in food processing industry—A review. Renew. Sustain. Energy Rev. 2021, 147, 111192. [Google Scholar] [CrossRef]
- Schoeneberger, C.A.; McMillan, C.A.; Kurup, P.; Akar, S.; Margolis, R.; Masanet, E. Solar for industrial process heat: A review of technologies, analysis approaches, and potential applications in the United States. Energy 2020, 206, 118083. [Google Scholar] [CrossRef]
- Weiss, W.; Spörk-Dür, M. Solar Heat World Wide Edition 2022; Technical Report; AEE—Institute for Sustainable Technologies: Gleisdorf, Austria, 2022; Available online: https://www.iea-shc.org/Data/Sites/1/publications/Solar-Heat-Worldwide-2022.pdf (accessed on 2 July 2023).
- Quiñones, G.; Felbol, C.; Valenzuela, C.; Cardemil, J.M.; Escobar, R.A. Analyzing the potential for solar thermal energy utilization in the Chilean copper mining industry. Sol. Energy 2020, 197, 292–310. [Google Scholar] [CrossRef]
- Filali Baba, Y.; Ajdad, H.; Al Mers, A.; Bouatem, A.; Bououlid Idrissi, B.; El Alj, S. Preliminary cost-effectiveness assessment of a Linear Fresnel Concentrator: Case studies. Case Stud. Therm. Eng. 2020, 22, 100730. [Google Scholar] [CrossRef]
- Meyers, S.; Schmitt, B.; Vajen, K. Renewable process heat from solar thermal and photovoltaics: The development and application of a universal methodology to determine the more economical technology. Appl. Energy 2018, 212, 1537–1552. [Google Scholar] [CrossRef]
- Holler, S.; Winkelmann, A.; Pelda, J.; Salaymeh, A. Feasibility study on solar thermal process heat in the beverage industry. Energy 2021, 233, 121153. [Google Scholar] [CrossRef]
- IRENA. Renewable Energy Statistics 2022; Technical Report; International Renewable Energy Agency: Abu Dhabi, United Arab Emirates, 2022; Available online: https://www.irena.org/-/media/Files/IRENA/Agency/Publication/2022/Apr/IRENA_RE_Capacity_Statistics_2022.pdf?rev=460f190dea15442eba8373d9625341ae (accessed on 2 July 2023).
- Matuska, T.; Sourek, B. Performance Analysis of Photovoltaic Water Heating System. Int. J. Photoenergy 2017, 2017, 7540250. [Google Scholar] [CrossRef]
- Ramdani, H.; Ould-Lahoucine, C. Study on the overall energy and exergy performances of a novel water-based hybrid photovoltaic–thermal solar collector. Energy Convers. Manag. 2020, 222, 113238. [Google Scholar] [CrossRef]
- Shirazi, A.; Taylor, R.A.; Morrison, G.L.; White, S.D. Solar-Powered Absorption Chillers: A Comprehensive and Critical Review. Energy Convers. Manag. 2018, 171, 59–81. [Google Scholar] [CrossRef]
- He, Y.; Jiang, Y.; Fan, Y.; Chen, G.; Tang, L. Utilization of ultra-low temperature heat by a novel cascade refrigeration system with environmentally-friendly refrigerants. Renew. Energy 2020, 157, 204–213. [Google Scholar]
- Nikbakhti, R.; Wang, X.; Chan, A. Performance optimization of an integrated adsorption-absorption cooling system driven by low-grade thermal energy. Appl. Therm. Eng. 2021, 193, 117035. [Google Scholar] [CrossRef]
- Hassan, A.A.; Elwardany, A.E.; Ookawara, S.; El-Sharkawy, I.I. Performance investigation of integrated PVT/adsorption cooling system under the climate conditions of Middle East. Energy Rep. 2020, 6, 168–173. [Google Scholar] [CrossRef]
- Xu, Z.Y.; Wang, R.Z. Simulation of Solar Cooling System Based on Variable Effect LiBr-Water Absorption Chiller. Renew. Energy 2017, 113, 907–914. [Google Scholar] [CrossRef]
- Klein, S.A.; Cooper, P.I.; Freeman, T.L.; Beekman, D.M.; Beckman, W.A.; Duffie, J.A. A Method of Simulation of Solar Processes and Its Application. Sol. Energy 1975, 17, 29–37. [Google Scholar] [CrossRef]
- Klein, S.A. TRNSYS Users Manual; Version 14.1; University of Wisconsin Solar Energy Lab: Madison, WI, USA, 1994. [Google Scholar]
- Khan, M.S.A.; Badar, A.W.; Talha, T.; Khan, M.W.; Butt, F.S. Configuration Based Modeling and Performance Analysis of Single Effect Solar Absorption Cooling System in TRNSYS. Energy Convers. Manag. 2018, 157, 351–363. [Google Scholar] [CrossRef]
- American Society of Heating, Refrigerating and Air-Conditioning Engineers. Methods of Testing to Determine the Thermal Performance of Solar Collectors; ASHRAE: Peachtree Corners, GA, USA, 2010. [Google Scholar]


Disclaimer/Publisher’s Note: The statements, opinions and data contained in all publications are solely those of the individual author(s) and contributor(s) and not of MDPI and/or the editor(s). MDPI and/or the editor(s) disclaim responsibility for any injury to people or property resulting from any ideas, methods, instructions or products referred to in the content. |
© 2023 by the author. Licensee MDPI, Basel, Switzerland. This article is an open access article distributed under the terms and conditions of the Creative Commons Attribution (CC BY) license (https://creativecommons.org/licenses/by/4.0/).