Article

Economic Evaluation and Technoeconomic Resilience Analysis of Two Routes for Hydrogen Production via Indirect Gasification in North Colombia

by
Ángel Darío González-Delgado
*,
Alexander Vargas-Mira
and
Carlos Zuluaga-García
Nanomaterials and Computer Aided Process Engineering Research Group (NIPAC), Chemical Engineering Department, Universidad de Cartagena, Cartagena de Indias 130015, Colombia
*
Author to whom correspondence should be addressed.
Sustainability 2023, 15(23), 16371; https://doi.org/10.3390/su152316371
Submission received: 1 September 2023 / Revised: 24 November 2023 / Accepted: 25 November 2023 / Published: 28 November 2023
(This article belongs to the Special Issue Sustainability of Bioenergy: From the Field to the Plant Production)

Abstract

:
Hydrogen has become a prospective energy carrier for a cleaner, more sustainable economy, offering carbon-free energy to reduce reliance on fossil fuels and address climate change challenges. However, hydrogen production faces significant technological and economic hurdles that must be overcome to reveal its highest potential. This study focused on evaluating the economics and technoeconomic resilience of two large-scale hydrogen production routes from African palm empty fruit bunches (EFB) by indirect gasification. Computer-aided process engineering (CAPE) assessed multiple scenarios to identify bottlenecks and optimize economic performance indicators like gross profits, including depreciation, after-tax profitability, payback period, and net present value. Resilience for each route was also assessed, considering raw material costs and the market price of hydrogen in relation to gross profits and after-tax profitability. Route 1 achieved a gross profit (DGP) of USD 47.12 million and a profit after taxes (PAT) of USD 28.74 million, while Route 2 achieved a DGP of USD 46.53 million and a PAT of USD 28.38 million. The results indicated that Route 2, involving hydrogen production through an indirect gasification reactor with a Selexol solvent unit for carbon dioxide removal, demonstrated greater resilience in terms of raw material costs and product selling price.

1. Introduction

Currently, we face significant challenges in terms of sustainability and the environment due to our reliance on fossil fuels. Rapid population growth has led to an increased demand for energy and food, resulting in a higher consumption of fossil fuels as the predominant energy source [1]. Additionally, the growing need for agricultural products to meet this demand, coupled with greenhouse gas emissions and the scarcity of natural resources, poses an urgent issue that requires innovative solutions [2]. In this context, biofuels and hydrogen have emerged as promising alternatives to address these challenges and move towards a cleaner and more sustainable future [3]. Hydrogen, in particular, stands out as a highly attractive energy transfer agent due to its ability to generate carbon-free energy [4]. When burned to produce electricity, it only produces water as a byproduct, avoiding the emission of harmful gases into the climate. This characteristic makes hydrogen an appealing option to reduce our dependence on fossil fuels and mitigate climate change. To fully harness the potential of hydrogen as an energy carrier, it is crucial to improve the processes of production, storage, and distribution [5]. For this reason, this study focuses on utilizing computer-aided process engineering (CAPE) to optimize hydrogen production, making use of agroindustrial waste from food crops to generate biofuels [6]. Specifically, it investigates the indirect gasification of biomass from empty fruit bunches of the African oil palm to obtain hydrogen, which presents an attractive alternative for energy generation [7].
In Colombia, hydrogen production is still in its early stages, but there is projected significant growth potential in the coming years. It is proposed that by 2030, the country could achieve a production of 50,000 tons of blue hydrogen and have between 1 and 3 gigawatts of installed electrolysis capacity for producing green hydrogen [8]. Additionally, it is estimated that Colombia will have the fourth-lowest price of green hydrogen in the world by 2050 and has the potential to become the main hydrogen exporter in Latin America starting in 2030, providing a significant competitive advantage in the fuel market [9]. Therefore, it is of utmost importance to consider the economic component in the process configuration, as many of the technical and environmental decisions in this study can be heavily influenced by this aspect [10]. An accurate economic evaluation will allow us to analyze the financial viability and profitability of the chosen hydrogen production route [11], as well as take measures to effectively optimize resource allocation. It will also enable us to determine investment costs, operating expenses, expected revenues, and potential long-term economic benefits, aiming to identify potential risks and opportunities and establish the best strategy to achieve maximum economic performance in the indirect gasification route [12].
Furthermore, it is essential to employ the analysis of technoeconomic resilience, as it will enable projecting long-term financial stability and adapting to future changes and challenges [13]. Moreover, it will facilitate the development of a robust strategy to mitigate risks and uncertainties through the analysis of different scenarios and the planning of effective responses, identifying the best technological and logistical options to maximize efficiency and minimize costs [14]. All of this will optimize strategic decision-making, taking into account the planning, projection, and industrial scaling of each route and identifying areas for improvement and investment opportunities [15].

2. Materials and Methods

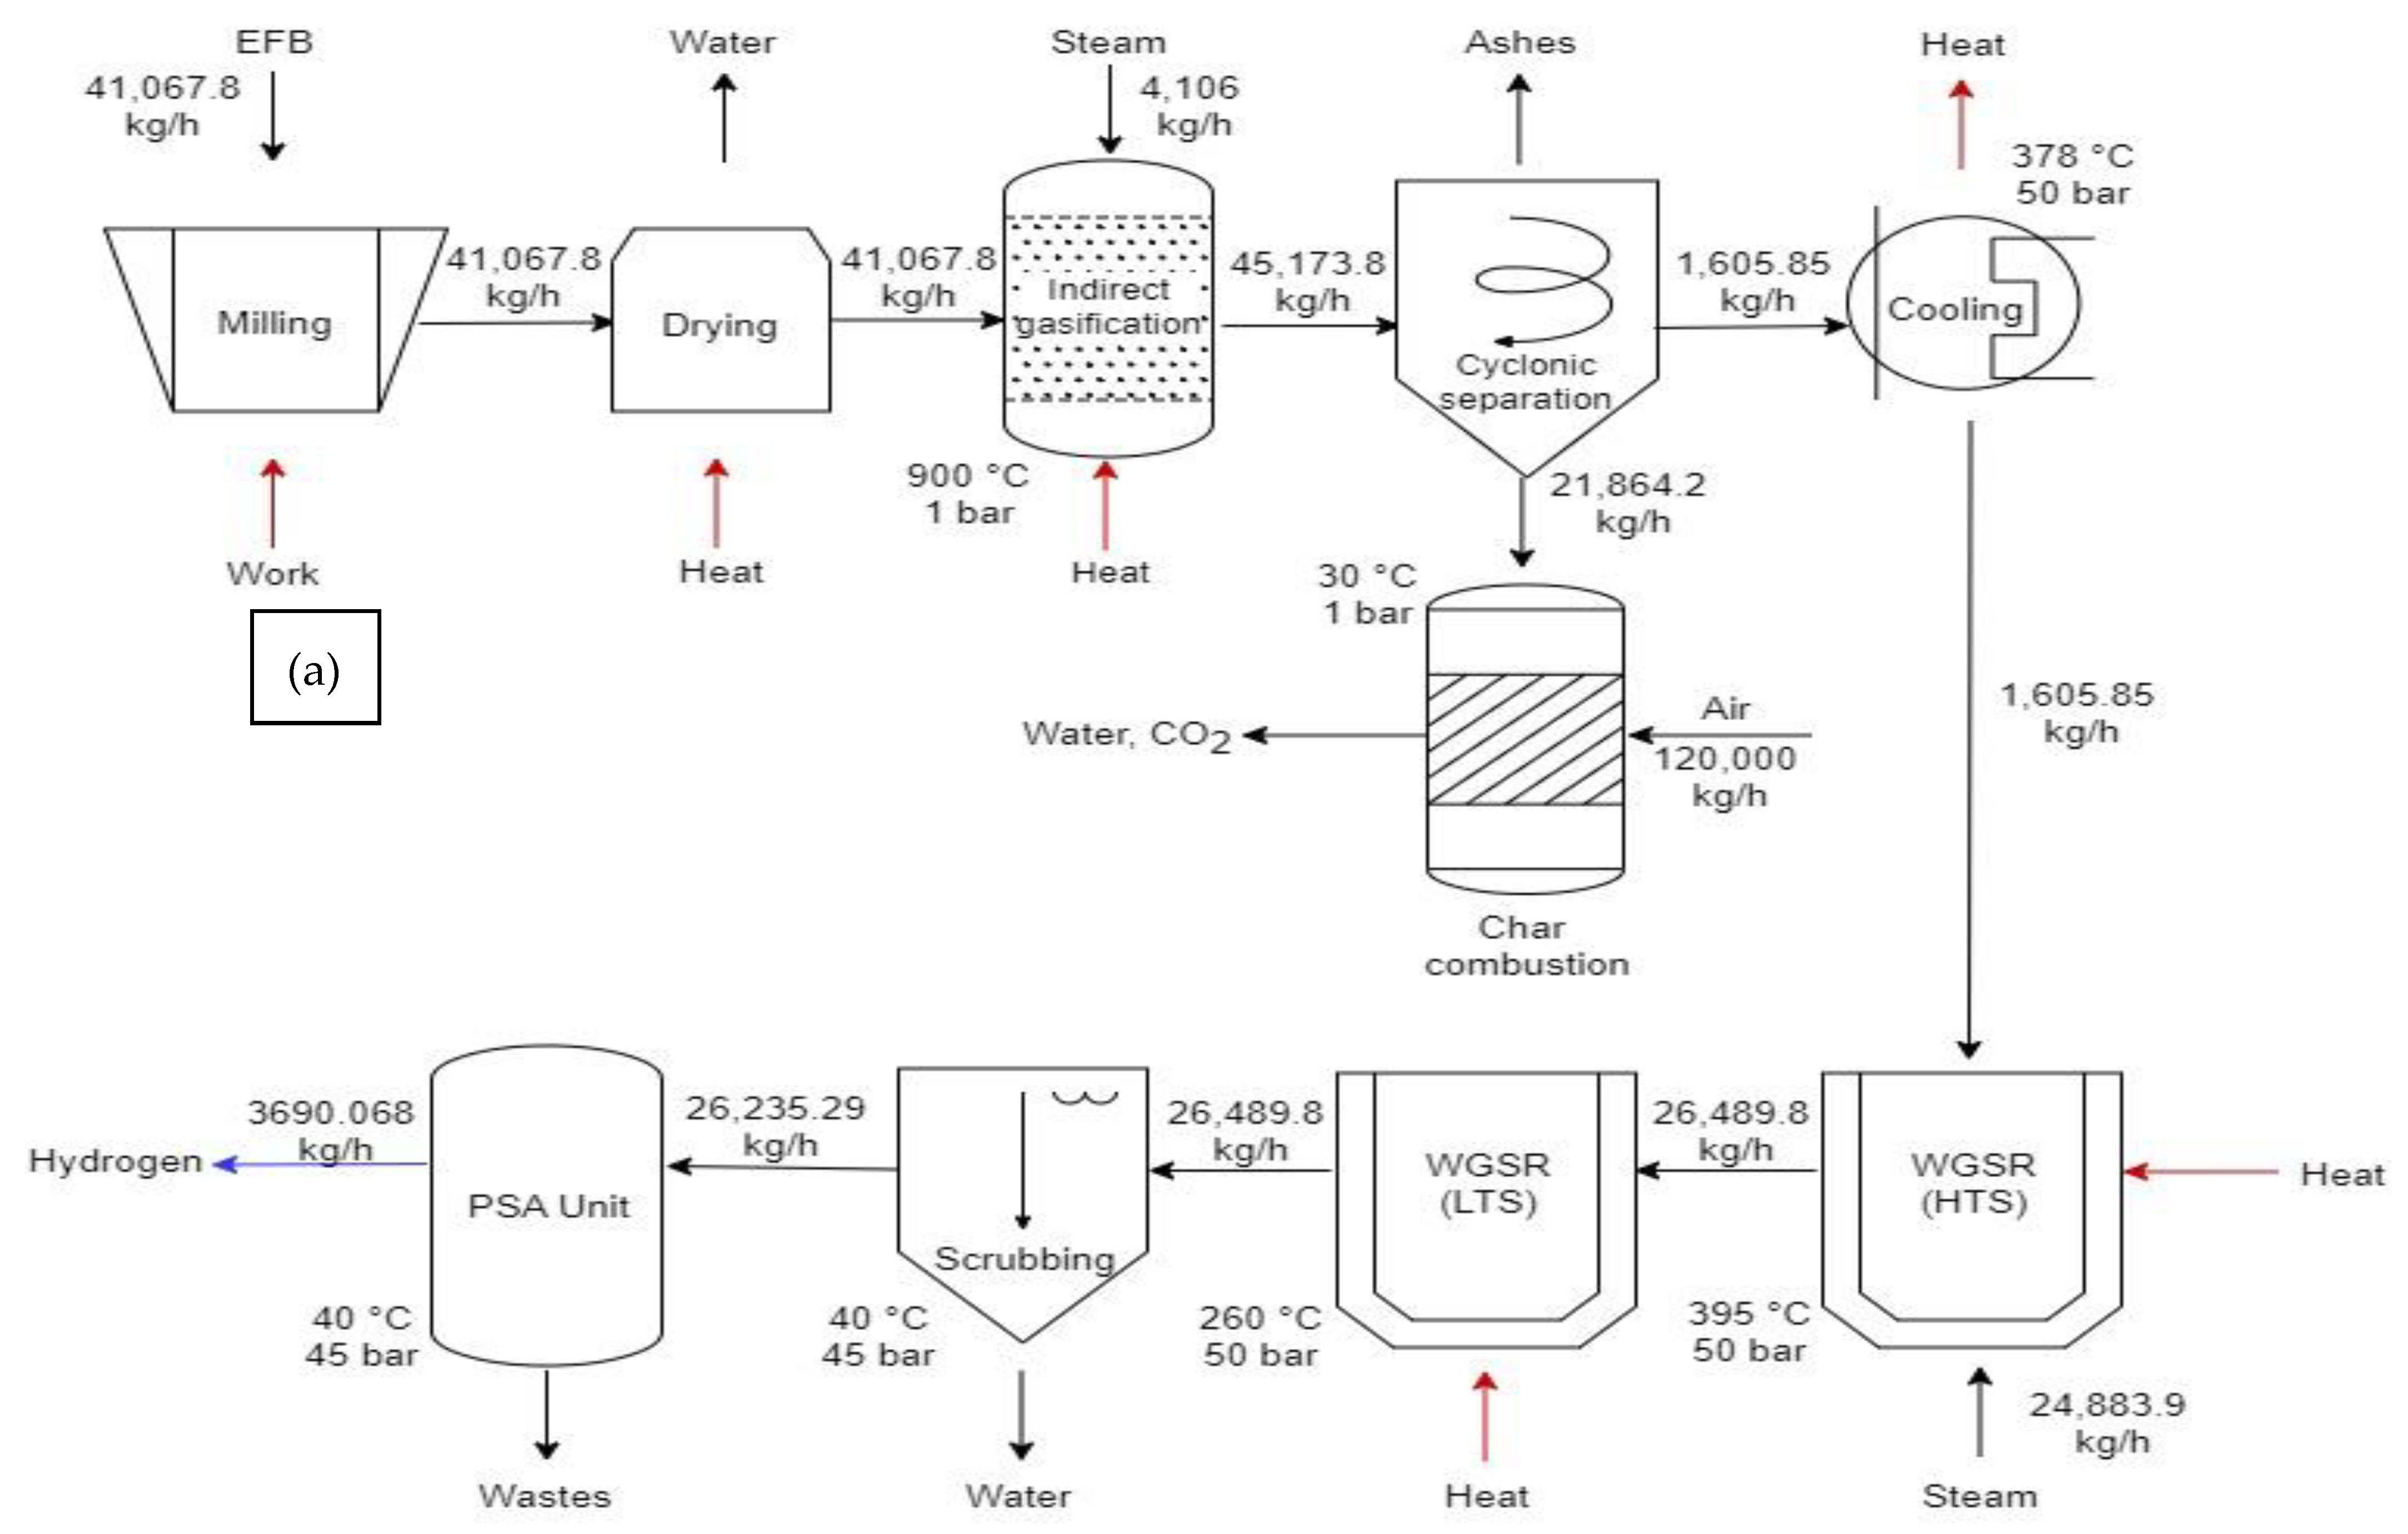
2.1. Description of the Processes

Biomass gasification is a thermochemical process conducted at high temperatures that transforms biomass into minimal amounts of char and ash [16], as well as a gaseous or liquid fuel with a great conversion yield [17]. The process is described by Equation (1), where the terms “other GH” and “other LH” are used to refer to other gaseous and liquid hydrocarbons, respectively [18]. Char is the biocarbon obtained during the gasification process of biomass.
b i o m a s s + h e a t H 2 + C O + C O 2 + C H 4 + o t h e r G H + o t h e r L H + c h a r
Gasification is a highly temperature-sensitive process [19] in which chemical reactions occur that transform a feedstock, such as biomass or coal, into a combustible gas in the presence of catalysts at temperatures close to 700 °C [20]. The result of this reaction is known as syngas [21]. This product gas stream contains mainly CO (carbon monoxide), H2 (hydrogen), CH4 (methane), CO2 (carbon dioxide), and traces of steam. To separate the hydrogen from this gas mixture [22], technologies like pressure swing adsorption (PSA) and absorption with Selexol are used [23]. Hydrogen production from empty fruit waste was evaluated using economic criteria and technoeconomic resilience analysis for the indirect gasification route using Aspen Plus software V.12 [24].

Hydrogen Production by Direct Gasification Combined with Pressure Swing Adsorption (Route 1) or Selexol-Based Adsorption (Route 2)

For routes 1 and 2, a stream of empty palm fruit bunches weighing 41,067.8 kg/h is fed. In direct gasification technology, air or oxygen is used as the gasification agent. In Route 1, an oxygen stream of 4106.7 kg/h is used, while in Route 2, the supplied oxygen stream is 1000 kg/h. A portion of the energy source is used to supply the heat required for the endothermic gasification reactions [25]. A fluidized bed reactor was chosen because of its feed flexibility, superior mixing capacity, high conversions, and scalability [26]. The operating conditions used in the gasification reactors for Route 1 were 900 °C and 1 bar; for Route 2, they were 900 °C and 60 bar. During biomass gasification, carbon is generated, which must be separated from the resulting gas to retain these materials [27]. The temperature of the syngas is lowered and subjected to a water scrubbing process for further treatment at approximately 10 °C and 50–60 bar. Subsequently, a process known as water gas shift (WGS) is carried out to convert CO and water into CO2 and H2 in the presence of steam. This process can be carried out in two stages: a high-temperature stage (HTS) at 320–360 °C and a low-temperature stage (LTS) at 190–50 °C [28], which allows for a higher amount of H2 [29]. During the WGS process, a reversible and exothermic reaction takes place, which is given by Equation (2).
C O + H 2 O C O 2 + H 2
Wastewater is extracted from the syngas, and the hydrogen is refined using a PSA (Route 1) or adsorption with Selexol (Route 2) [30]. In Route 1, the purification of the gas is made using a PSA unit by an adsorption process on the surface of porous materials such as activated carbon or zeolites at 40 °C and 50 bar. In Route 2, gas separation is carried out at 35 °C and 1 bar, involving the gas contact with a liquid solvent, like Selexol, in a scrubbing column. Selexol is an absorbent composed of a blend of ether and dimethyl ether of poly (ethylene glycol) [31]. A schematic diagram depicting direct gasification with hydrogen purification methods for Route 1 and Route 2 is shown in Figure 1.

2.2. Economic Evaluation

To determine the most important variables in the hydrogen production process, an economic evaluation and a technoeconomic resilience analysis were carried out. The operating conditions, such as pressure, temperature, and palm rachis composition, were established. In addition, the equipment needed to implement the proposed routes was identified through simulations in Aspen Plus and Aspen HYSYS. For the calculation of the process, a palm rachis processing capacity of 41,067.8 kg/h was considered.
For the establishment of a hydrogen production plant, it was necessary to gather information about equipment prices, process utilities, labor, taxes, and land, as well as apply expressions that allow evaluating the process performance from an economic standpoint [10]. The total capital investment (TCI) is calculated using Equation (3), where FCI represents the money required for equipment payments, civil structures, land preparation, control systems, and facilities, among others. WCI corresponds to working capital investment, and SUC accounts for start-up costs, such as legal expenses, advertising, and employee training, which were estimated at 10% of the fixed capital investment (FCI), according to the rules developed by Peters et al. [15]. The costs directly associated with production, such as buildings, piping, and purchased equipment (FOB), were calculated using Equation (4). On the other hand, the associated costs to keep the plant in operation were divided into direct production costs (DPC), fixed charges (FCH), plant overhead (POH), and general expenses (GE), using Equation (5). Annualized fixed costs (AFC) are determined through Equation (6). The operating costs (OC) are given per unit of product. Likewise, the total value of operating costs during a year of operation (TAC) is reflected in Equation (7) and is calculated through the annualized fixed cost (AFC) and annualized operating cost (AOC). In order to express the operating costs in a more comparative way, the annualized operating costs per unit of raw material (NOC) are represented by Equation (8).
T C I = F C I + W C I + S U C
F O B B = F O B A C a p a c i t y B C a p a c i t y A 0.6
O C = D P C + F H C + P O H + G E
A F C = F C I 0 F C I s N
T A C = A F C + A O C
N O C = A O C m R M

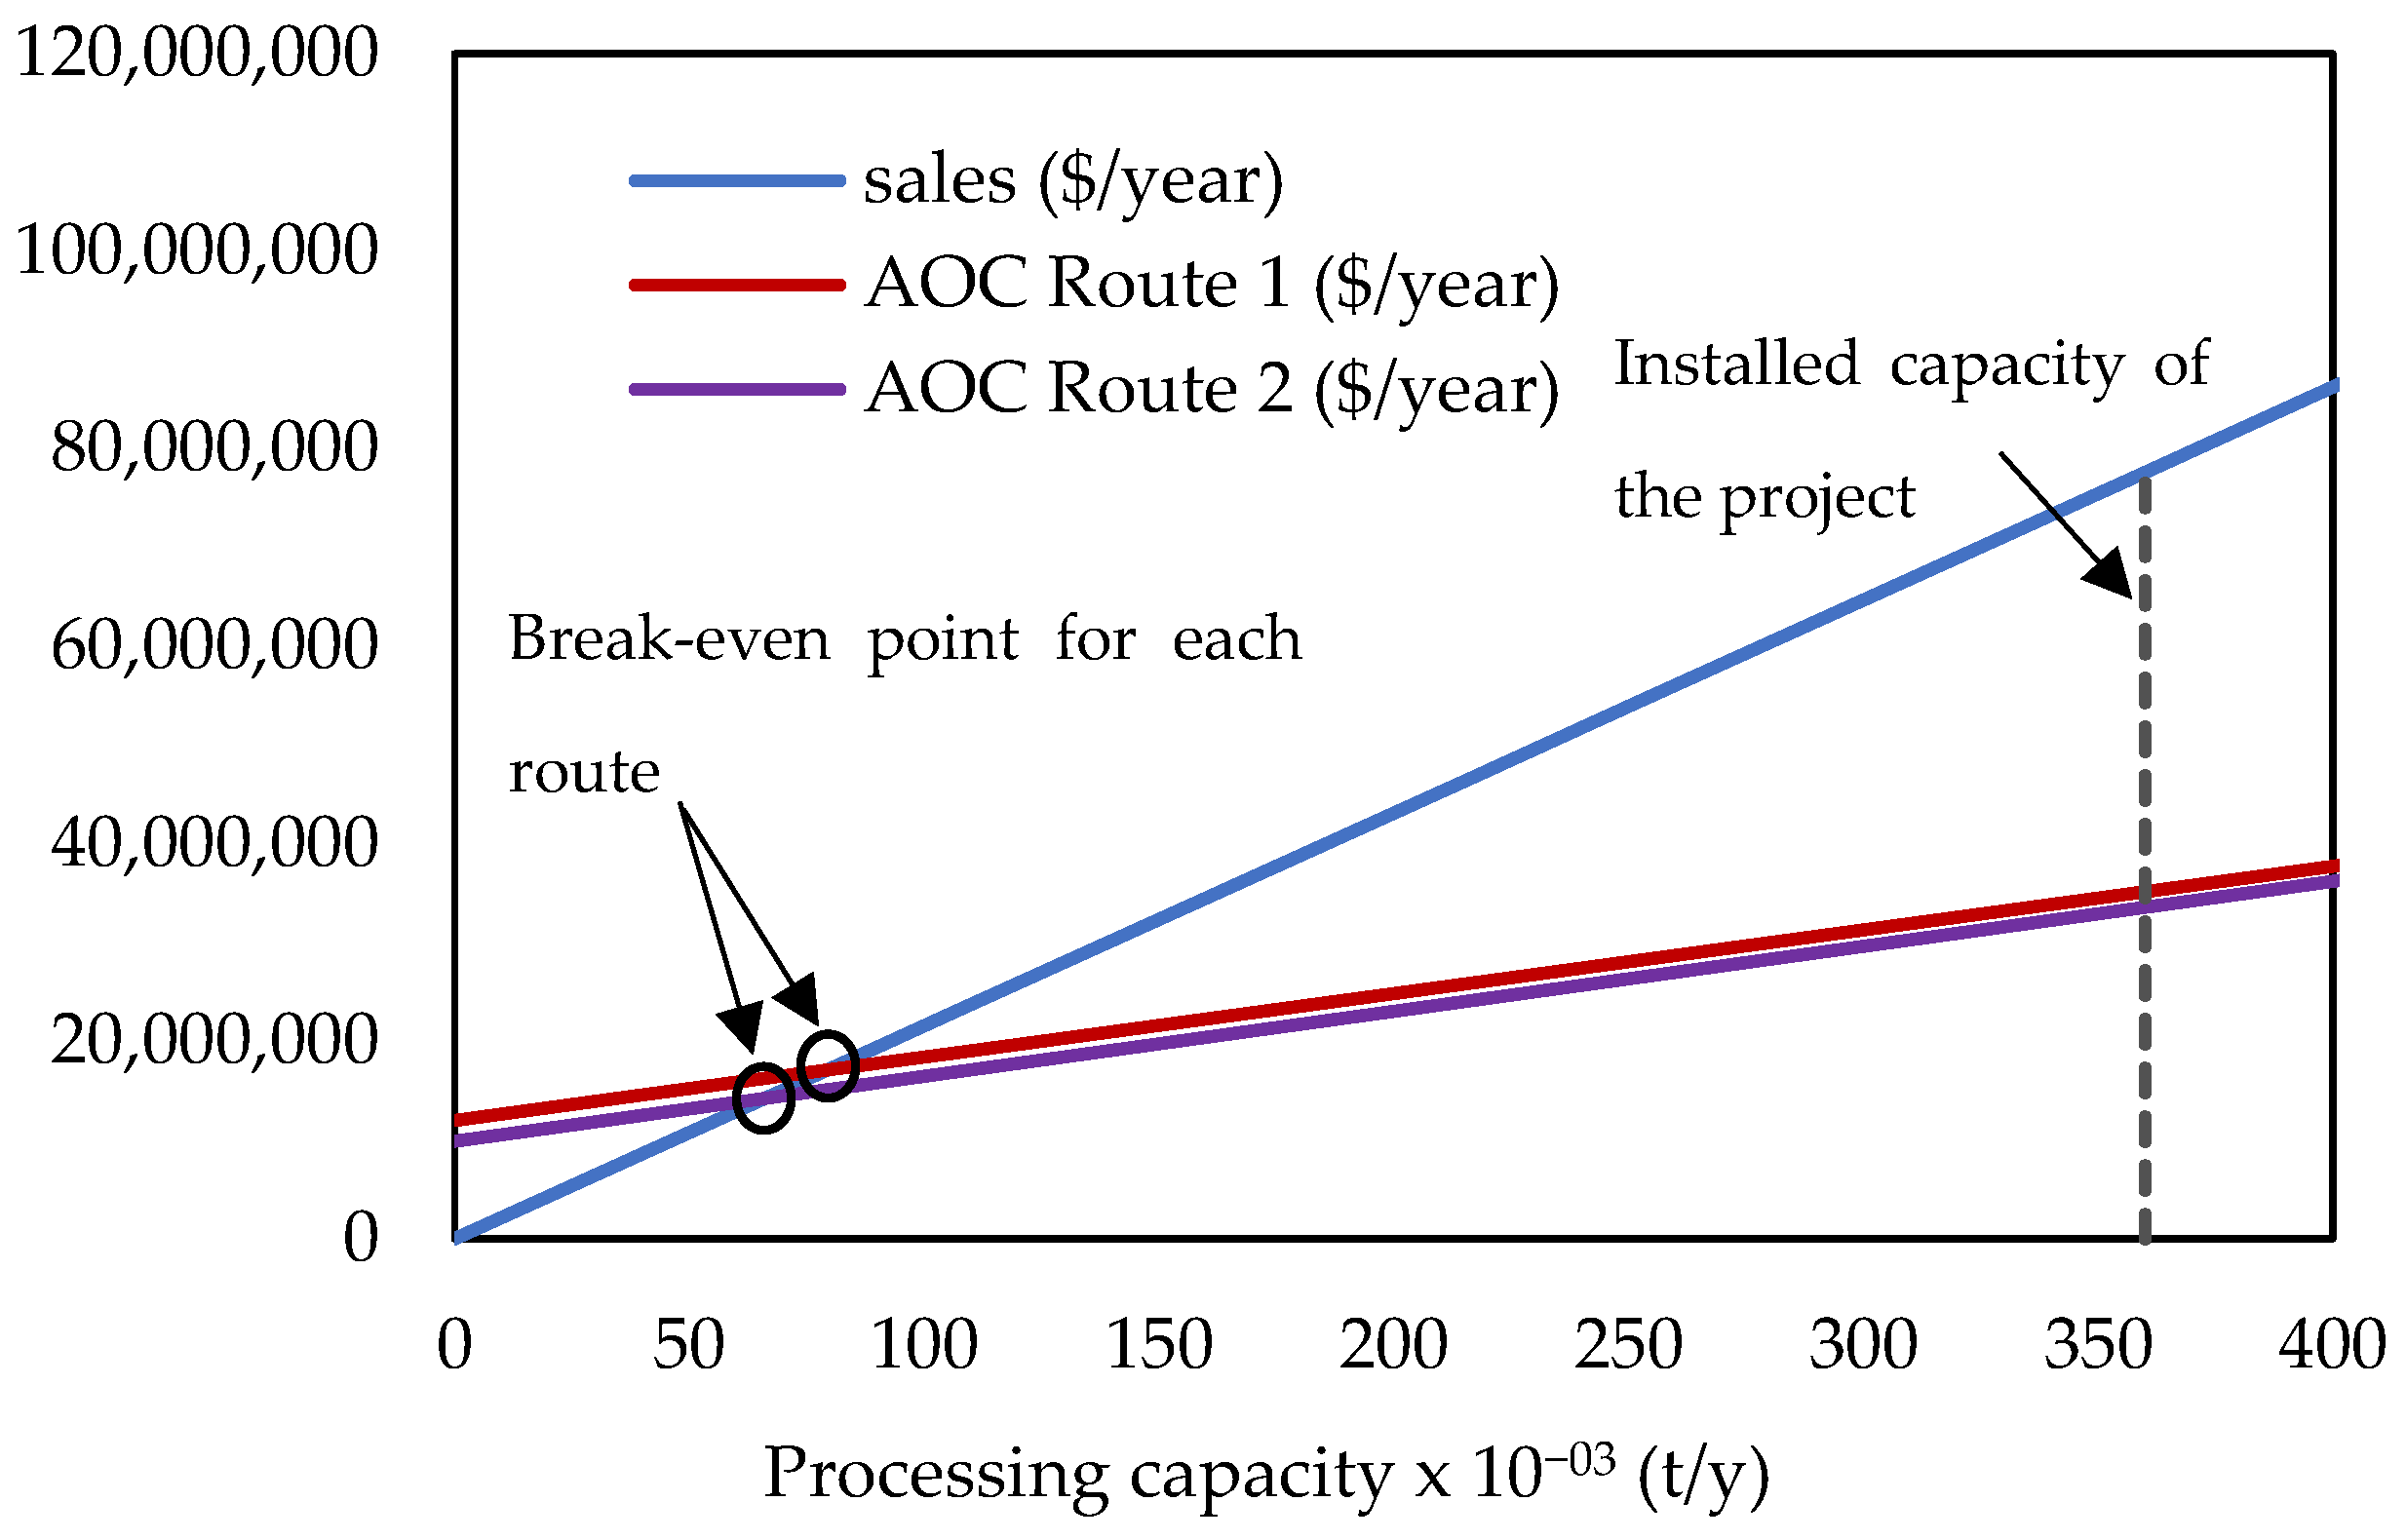
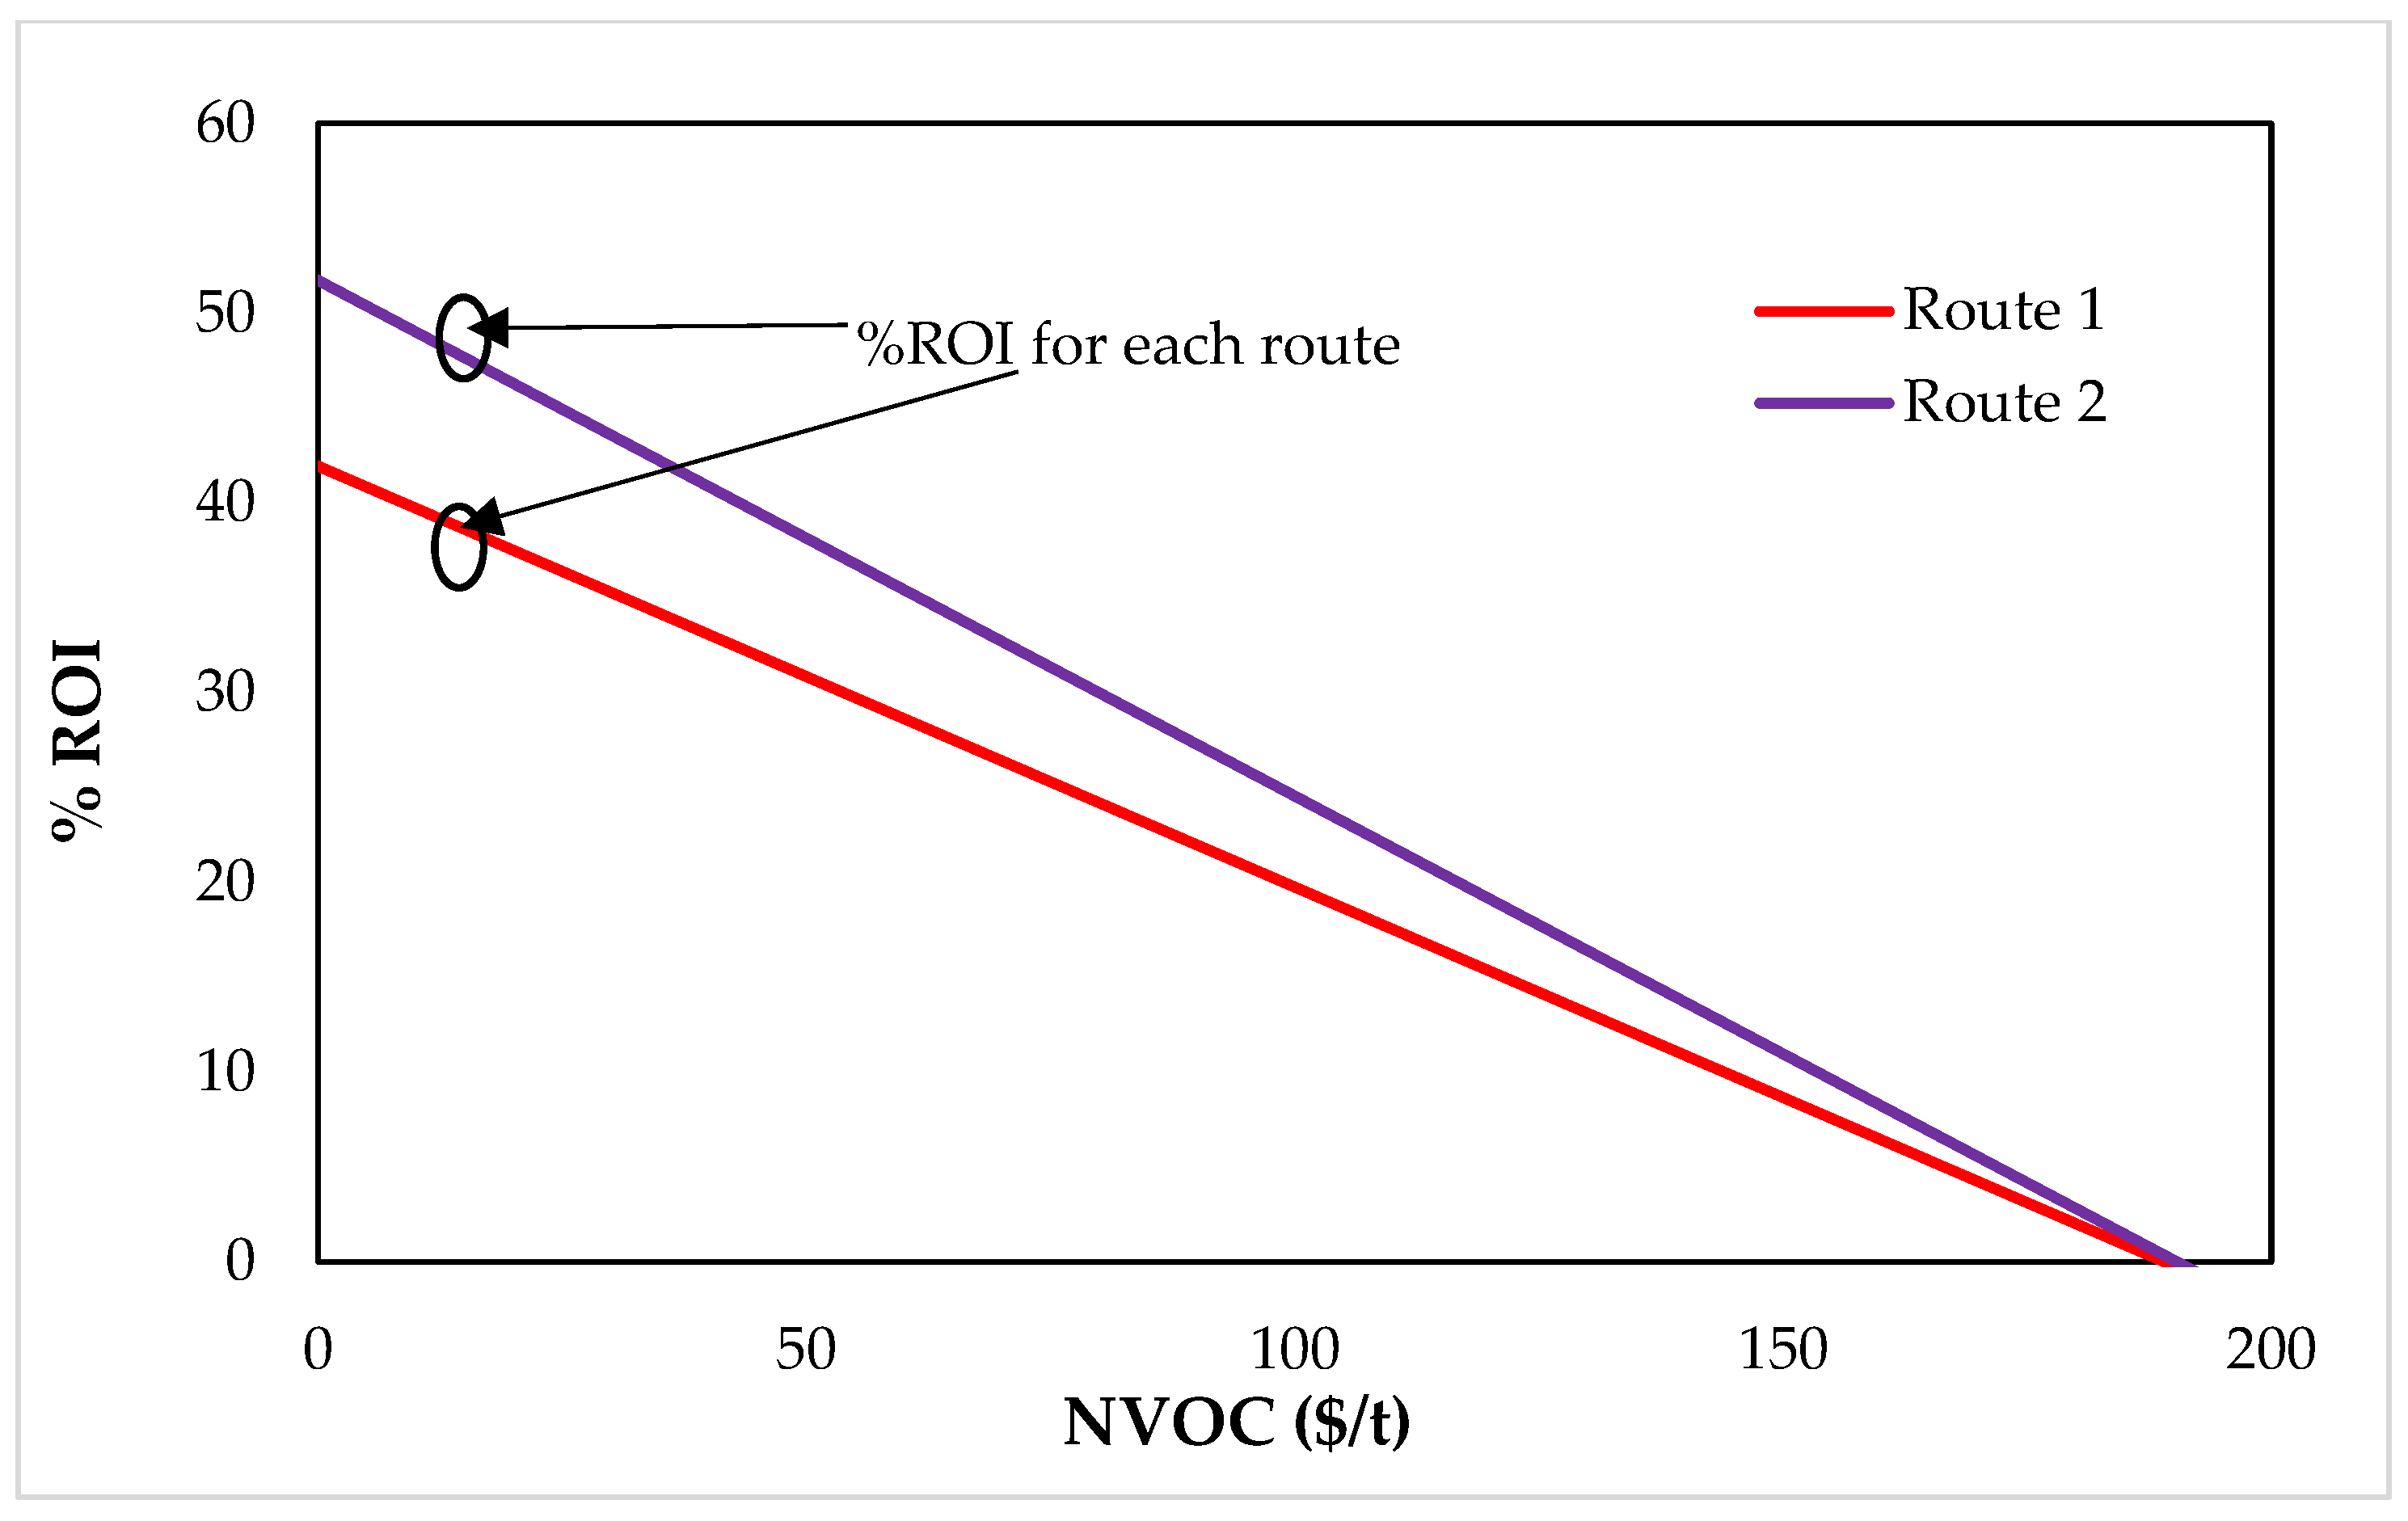
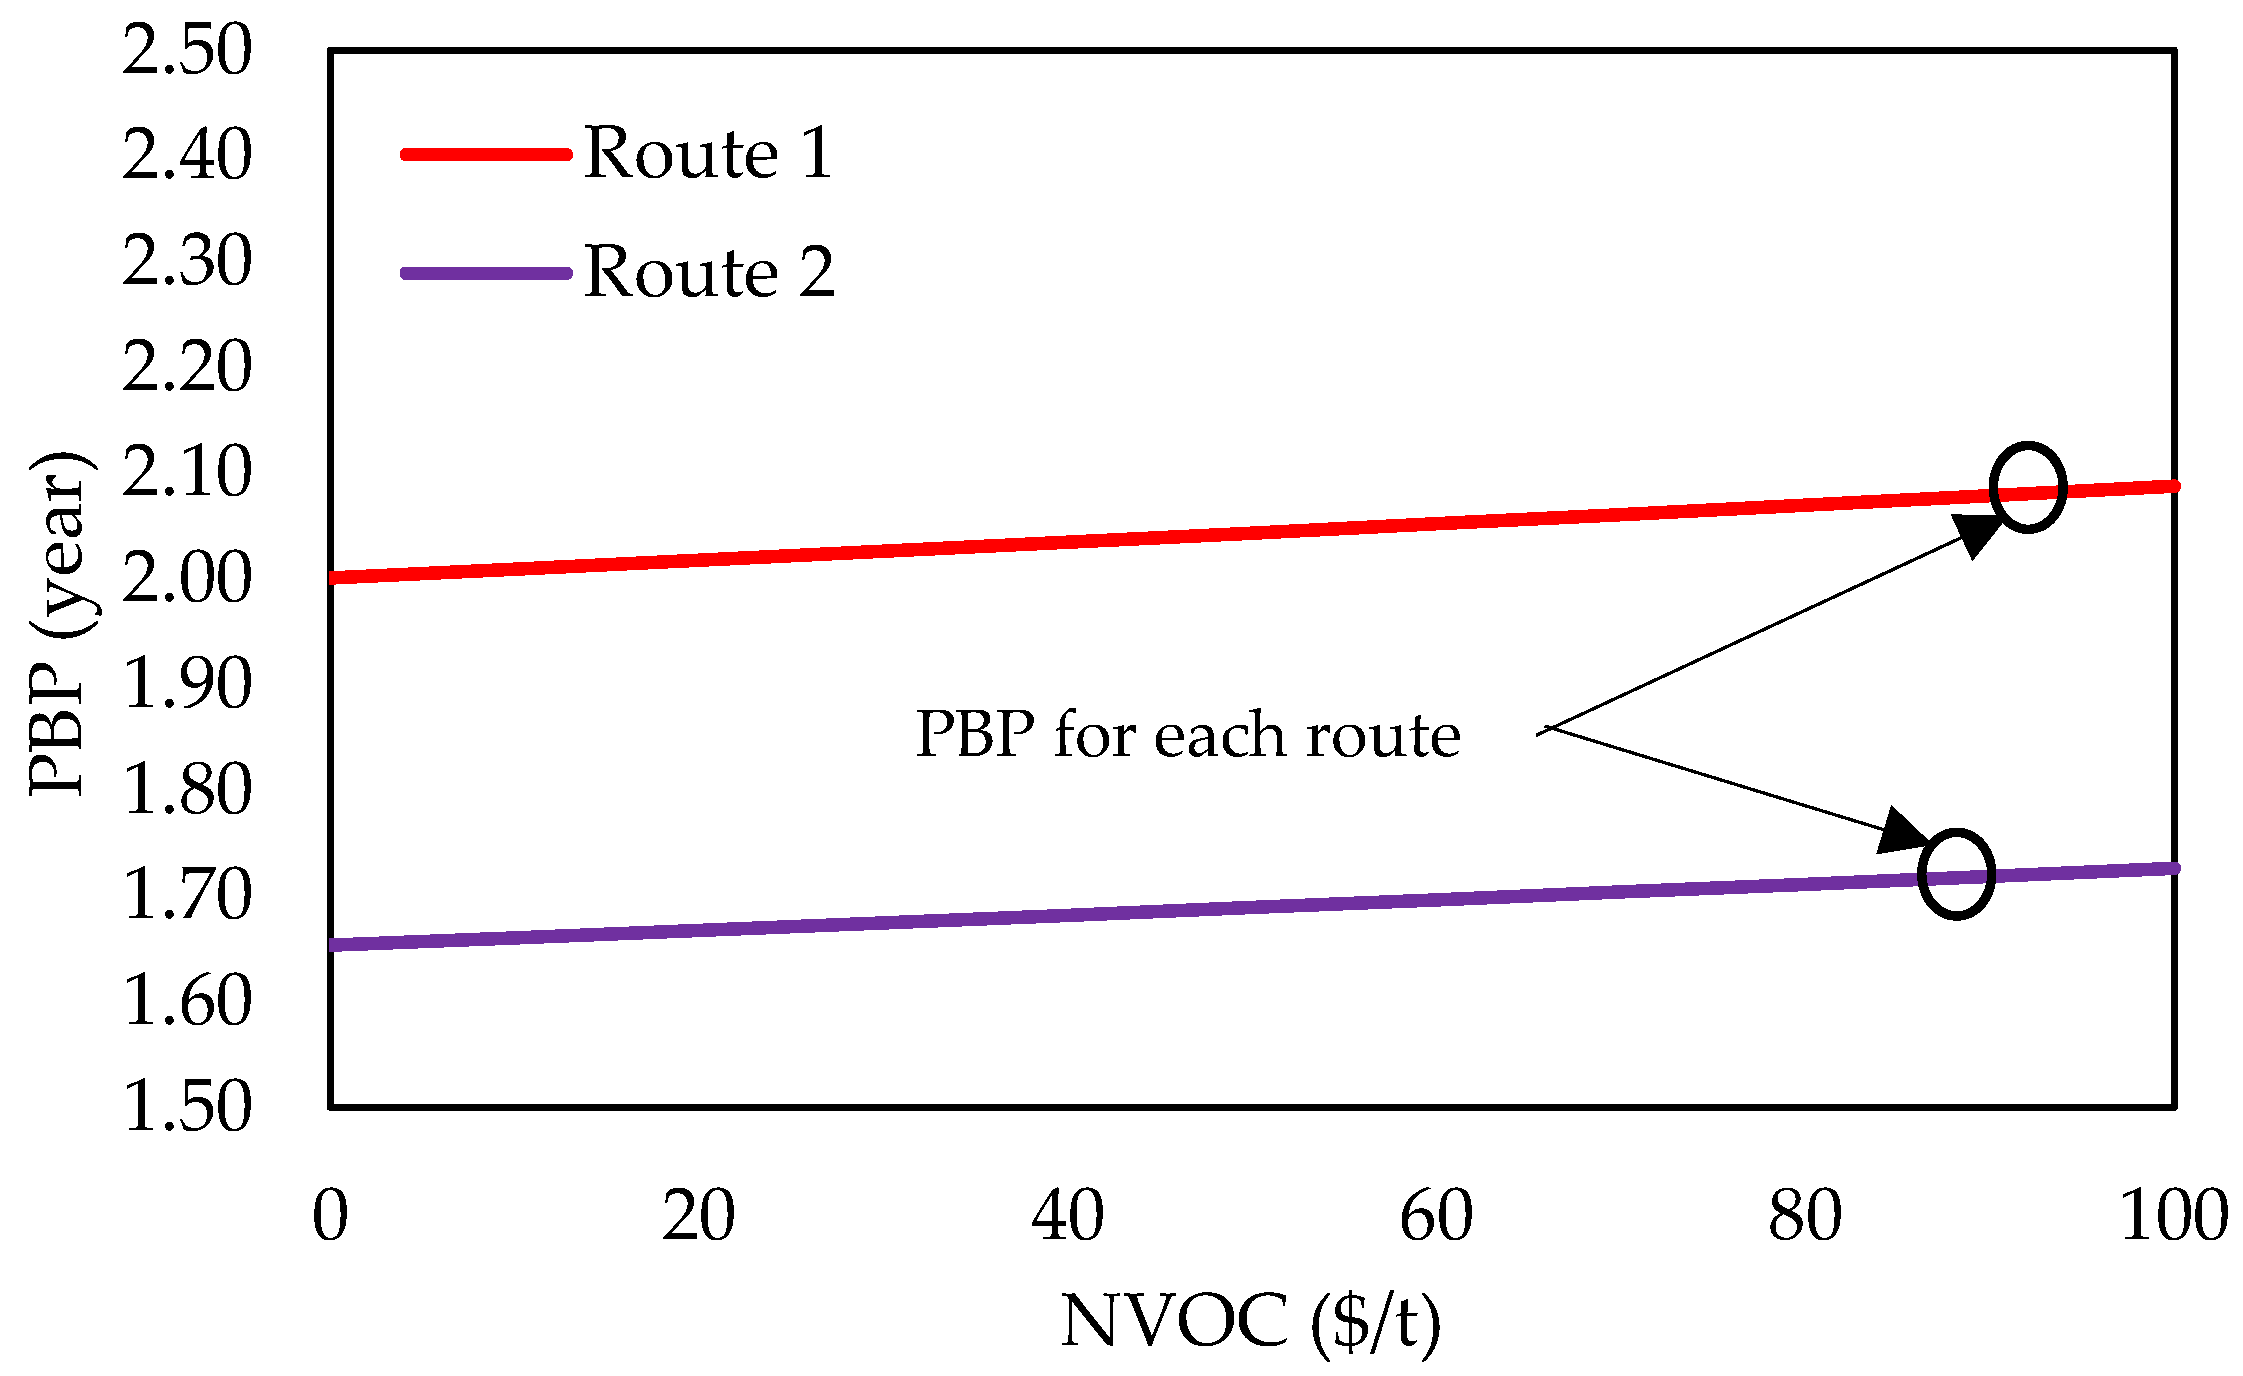
2.3. Technoeconomic Resilience Analysis

An approach to technoeconomic resilience was suggested and performed to study the impact of specific factors that provide insight into the behavior of the process. Among them are the selling price of hydrogen, the production capacity, the cost of raw materials, and normalized variable operating costs (NVOC). NVOC is defined as operating costs given per raw material unit, for its calculation takes into account the AOC, FCH, and flow of raw material and is calculated by Equation (9). In addition, the operational break-even point (BEP) was calculated, which takes into account the biomass processing capacity and changes in the price of biomass and raw materials with production when this is less than the maximum capacity of the plant with respect to time. The above parameters were calculated using Equations (10) and (11). Economic indicators of the process, such as the gross profit including depreciation (DGP), were calculated using Equation (12); the profit of the plant after paying taxes (PAT), interest, and loans were obtained using Equation (13). The ratio between the benefits of the process and the capital investment (CCF) was taken into account by applying Equation (14), where for a process to be attractive, this ratio must be less than 1 [16].
N V O C = V O C m R M = A O C F C H m R M
m R M B E P = A F C + F C H C i V θ i N V O C θ i = m R M m i
ƞ O n s t r e a m B E P = m B E P m m a x
D G P = i m i C i v T A C
P A T = D G P 1 i t r
C C F = i m i C i v A O C T C I
where C i v and m i are the selling price of the product (USD/y) and the mass flow of the product (t/y), respectively.
This analysis also considers other crucial factors. The amortization period, or payback period (PBP), considering the time value of money, is calculated using Equation (15). The project’s profitability is determined by Equation (16), and the cumulative sum of all profits over the periods of operation of the plant is calculated using the net present value (NPV), expressed in Equation (17) [14]. Finally, the economic potentials are obtained using Equations (18)–(20), respectively. The first potential represents the profit obtained by subtracting the sales revenues from the expenses associated with the purchase of raw materials. The second potential is obtained by subtracting the costs of industrial process services (U) from the first potential, and the third potential is calculated by subtracting sales revenues from annualized operating costs.
P B P = F C I P A T
% R O I = P A T T C I   ×   100 %
N P V = n A C F n 1 + i n
E P 1 = i m i C i v j m J C j R M
E P 2 = i m i C i v j m J C j R M U
E P 3 = i m i C i v A O C
Table 1 presents the technoeconomic factors considered in the analysis. The total capital investment (TCI) was measured based on the cost of equipment and its installation, land and its improvement, electrical installations, instrumentation, buildings, service facilities, engineering and supervision, construction, legal, contractors’ fees, contingencies, working capital investment, and start-up investment. Calculations were made according to El-Halwagi [14], implementing the methodology proposed by Peters et al. [15].

3. Results and Discussion

Parameters for the economic evaluation, including land costs, pipeline expenses, contractor fees, and construction costs, among others, as well as equipment prices essential for plant operation and assembly in Colombia, facilitated the generation of outcomes for technoeconomic resilience.

3.1. Economic Assessment

Table 2 lists all the equipment necessary for the operation of the routes studied, along with their power, energy cost, modular cost, or cost per piece of equipment, and the number of pieces of equipment required. This information allows us to identify the equipment with the highest energy requirements and costs. All costs calculated are given in dollars for the year 2022.
According to the energy and modular cost analyses, Route 1 with the PSA adsorption system shows an increase, reaching a total of USD 27,610,208. In contrast, Route 2 with the Selexol absorption system recorded an expenditure of USD 26,606,782, which represents a difference of approximately 1.04%. For the production process of different biomasses, it was found that the gasification unit has the highest contribution to the total capital cost of the plants. The above is associated with the higher temperature and pressure of the gasifiers [32].
Table 3 shows the contribution of each item to the total product cost of hydrogen production.
The ensuing section presents the outcomes of the economic evaluation associated with the different routes evaluated, including the initial investment required to acquire the essential assets and the costs related to land development and civil works required. Table 4 allows a direct comparison to be made between the different routes evaluated in terms of these criteria, considering the cost per piece of equipment and the number of pieces of equipment presented in Table 2.
Based on the data presented in Table 4, it is evident that Route 1 demands a more considerable TCI compared to Route 2. This implies that the implementation of Route 1 requires a more substantial initial investment in terms of financial resources. As a result, Route 1 can be considered comparatively less attractive in economic terms. Finally, the results of the calculated economic indicators for hydrogen production from empty African palm fruit bunches under specific assumptions are presented in Table 5 in order to evaluate the feasibility of each of the analyzed routes. The payback period in the present study was 2.03 and 1.67 years for routes 1 and 2, respectively. It has been reported payback periods of 4.72 y [33] and 5–6 y [34].
It can be observed that the return on investment (ROI) rate and the annual cost income were calculated for Route 1 at 29% and 57.57, respectively, while for Route 2, a return on investment of 35% and an annual cost income of 68.62 were obtained. Since the cash flow is less than 1 in both cases, it can be considered an attractive project, despite the fact that it presents a not very high return rate. It is also reflected that Route 1, coupled with a PSA adsorption system, generates an income of USD 492.73 MM/y, while Route 2, coupled with a Selexol solvent absorption system, is USD 587.33 MM/y, demonstrating the added value that the application of Route 2 provides. Furthermore, the PBP for Route 2 is lower, supporting an increase in the NVOC.

3.2. Technoeconomic Resilience Analysis

Figure 2 shows the behavior of the annualized operating costs (AOC) for the two evaluated routes.
The interception illustrates the break-even point for Route 1 and Route 2 in terms of sales and plant production capacity. For Route 2, the break-even point is reached when production is 61,148.2 tons per year, while for Route 1, it is achieved with a production of 68,411.15 tons per year. These values represent only 17% and 19% of the plant’s maximum installed capacity, respectively. The obtained results can be attributed to the higher operating costs and capital investment associated with Route 1 compared to Route 2, which is why its profitability is lower [35].
Figure 3 illustrates the impact of fluctuations in the hydrogen selling price on operational efficiency. Within this graphical representation, three ranges can be distinguished: the first ranging from 0.5 USD/t to 4 USD/t, the second from 4 USD/t to 6 USD/t, and the third encompassing selling prices higher than 6 USD/t. In the first region, even minimal changes in the selling price led to notable alterations in ongoing operational efficiency, while in the second region, substantial variations in the selling price resulted in slight modifications in continuous operational efficiency. Conversely, in the third zone, fluctuations in the selling price do not affect ongoing operational efficiency. If the selling price decreases, the continuous operational efficiency increases, nearing 100% or maximum capacity. However, this scenario is less favorable. The established selling price is USD 4 (situated in the second region), and the market price range fluctuates between USD 3 and USD 6. This implies that both routes fall outside the critical zone, indicating their competitiveness in this aspect and allowing for potential adjustments to the selling price.
Figure 4 shows the profitability capacity between earnings and raw material costs, and the break-even point is plotted accordingly. It can be observed that as the raw material cost increases to around 155 USD/t, the profits turn negative, indicating losses. This implies that, in order to achieve profits, the raw material cost should not exceed this value. This leads us to conclude that the process exhibits low resistance to increases in raw material costs. Given that the base cost is 50 USD/t, both Route 1 and Route 2 can withstand an increase of up to 300% in raw material cost without affecting the economic stability of the process. It has been reported that production costs were most sensitive to biomass costs, between 77 USD/t and 96 USD/t [36], as reported in the present study.
Figure 5 shows the range within which the plant may face increases in operating costs per ton of processed raw material. For Route 1, the maximum tolerance limit is 190 USD/t. The normalized variable operating cost (NVOC) for Route 1 is 80.82 USD/t, providing a margin of up to 42% before the return becomes zero. On the other hand, for Route 2, the NVOC is 79.57 USD/t, allowing for a margin that can withstand increases of up to 62%. Moreover, the slope of Route 2 indicates it is more resilient to fluctuations in NVOC, and at all points, it shows higher return on investment (ROI) values than Route 1. This result means that Route 1 can resist increases in operating costs up to 35%, while Route 2 can resist 38.78%, showing both routes a positive %ROI. We can note that the results obtained in the present study are higher than the 21% reported for topology 2 of a biorefinery based on acetone–butanol–ethanol fermentation, reported by Meramo-Hurtado et al. [37].
Figure 6 depicts the relationship between normalized total costs and the payback period (PBP) for routes 1 and 2. The figure showcases how the time it takes to recover the investment changes as operating costs increase. Both routes exhibit a similar pattern of behavior up to USD 80/t. Beyond that point, Route 1 demonstrates more pronounced extensions in the payback period. The critical zone initiates at USD 130/t, underscoring the significance of maintaining operating costs below this threshold to ensure a reasonable payback period. Both Route 1 and Route 2, which are indirect gasification plants, exhibit a tolerance margin of 62% and 61%, respectively, in NVOC increase before the payback time experiences a significant impact.
Figure 7 shows the variation in the net present value (NPV) as a function of the selling price per kilogram of product. A more favorable behavior is observed for Route 1 since, within the range of values studied, a minimum price of USD 3 per kilogram is required to obtain a positive NPV. This minimum price is even lower than the price reported in the market, which indicates the plant’s high competitiveness in this aspect. On the other hand, for Route 2, a positive NPV is achieved when the selling price reaches USD 3.5 per kilogram. Although these values are lower, Route 2 also shows good competitiveness in the market.
In Figure 8, it can be appreciated that the comparison of NPVs for each route shows that Route 2 not only presents positive values more rapidly but also surpasses Route 1 in 15 years of operation. This allows us to assert that it will yield greater present-value profits than the initial investment.

4. Conclusions

In this study, a technoeconomic resilience analysis of a hydrogen production plant from empty palm fruit bunch biomass in Colombia was conducted. For a flow of 19,908 t/year of empty palm fruit bunches, it was found that the plant following Route 2 can operate at maximum production capacity with acceptable economic indicators, such as a net present value of USD 169.55 MM and an internal rate of return of 35%. It was observed that the raw material purchase cost is the variable that has the greatest impact on the two studied routes. However, the raw material cost accounts for only 1.25% of the product selling price in both cases, thereby allowing for a substantial profit margin. In combination with the product selling price, it determines the viability of each route. Both Route 1 and Route 2 were found to be viable at a raw material purchase cost of USD 4/kg of hydrogen, indicating a lack of flexibility in the face of variations in this cost.
The total capital investment and total product cost for Route 1 were USD 99,006,790 and 35,153,578 USD/y, respectively, while for Route 2, they were 80,805,887 and 33,590,856 USD/y, respectively. The return on investment reached 35% for Route 2, while Route 1 was slightly below 29%. The payback period for both cases was 2 years for Route 1 and 1.65 years for Route 2. The production capacity at the break-even point of the plant was 18,937,882 t/y for Route 1 and 14,633,256 t/y for Route 2. Additionally, it was found that the routes are not significantly affected by worker wages, making them less vulnerable to changes in employment policies. It is recommended to seek ways to reduce production costs or increase the selling price of the obtained product, although the latter is subject to market dynamics.

Author Contributions

Conceptualization, Á.D.G.-D.; methodology, A.V.-M., C.Z.-G., and Á.D.G.-D.; software, A.V.-M. and C.Z.-G.; validation, Á.D.G.-D.; formal analysis, A.V.-M., C.Z.-G., and Á.D.G.-D.; investigation, A.V.-M., C.Z.-G., and Á.D.G.-D.; resources, A.V.-M., C.Z.-G., and Á.D.G.-D.; data curation, A.V.-M., C.Z.-G., and Á.D.G.-D.; writing—original draft preparation, A.V.-M., C.Z.-G., and Á.D.G.-D.; writing—review and editing, A.V.-M., C.Z.-G., and Á.D.G.-D.; visualization, Á.D.G.-D.; supervision, Á.D.G.-D.; project administration, Á.D.G.-D.; funding acquisition, Á.D.G.-D. All authors have read and agreed to the published version of the manuscript.

Funding

This research was funded by the Universidad de Cartagena throughout commitment act No. 121 of 2019.

Institutional Review Board Statement

Not applicable.

Informed Consent Statement

Not applicable.

Data Availability Statement

The data used in this study are available on request to the corresponding author.

Acknowledgments

The authors thank the Uiversidad de Cartagena for for funding this research through the entitled project “Comparative Environmental Assessment of Hydrogen Production from Renewable, Conventional Fossil, and Unconventional Fossil Sources Using LCA, WAR, TRACI, and Hybrid Methods”.

Conflicts of Interest

The authors declare no conflict of interest.

Nomenclature

Symbols
m R M Mass flow of raw material (t/y)
θ i Ratio between the quantity of product i obtained per unit of raw material
ƞ O n s t r e a m B E P Efficiency on-stream (%)
Abbreviations
ACFNet profit for year n (USD)
ACRAnnual cost/benefit ratio
AFCAnnualized fixed costs (USD/y)
AOCAnnualized operating costs (USD/y)
BEPBreak-even point
COperating costs (USD)
CCFCumulative cash flow (1/y)
DFCIDirect fixed capital investment (USD)
DPCDirect production costs (USD/y)
DGPGross profit (depreciation included) (USD MM/y)
EPEconomic potentials
FCHFixed charges (USD/y)
FCIFixed capital investment (USD)
FCI0Initial value of depreciable fixed capital investment (USD)
FCIsSalvage value of fixed capital investment (USD)
FOBFree on board
GEGeneral expenses (USD/y)
GHGaseous hydrocarbons
HTSHigh-temperature stage
IInflation rate (%)
ItrTax rate set by the government for income derived from the process (%)
IFCIIndirect fixed capital investment (USD)
LHLiquid hydrocarbons
LTSLow-temperature stage
MRMaintenance and repairs
NYears
NOCNormalized operating costs (USD/y)
NPVNet present value (USD MM)
NVOCNormalized variable operating cost (USD/t-rm)
OLOperating labor
PATProfit after taxes (USD/y)
PBPPayback period (y)
POHPlant overhead (USD/y)
PSAPressure swing adsorption
RMRaw material
ROIReturn on investment (%)
SUCStart-up costs
TACTotal annualized process costs (USD/y)
TCITotal capital investment (USD)
UUtilities
WCIWork capital investment (USD)
WGSWater gas shift

References

  1. Okolie, J.A.; Patra, B.R.; Mukherjee, A.; Nanda, S.; Dalai, A.K.; Kozinski, J.A. Futuristic applications of hydrogen in energy, biorefining, aerospace, pharmaceuticals and metallurgy. Int. J. Hydrogen Energy 2021, 46, 8885–8905. [Google Scholar] [CrossRef]
  2. Berry, G.D.; Aceves, S.M. La Economía del Hidrógeno como Solución al Problema de la Estabilización del Clima Mundial. Acta Univ. 2006, 16, 5–14. [Google Scholar] [CrossRef]
  3. Brijaldo, M.H.; Castillo, C.; Pérez, G. Principales Rutas en la Producción de Hidrógeno. Ing. Y Compet. 2021, 23, e30211155. [Google Scholar] [CrossRef]
  4. Lamb, J.J.; Hillestad, M.; Rytter, E.; Bock, R.; Nordgård, A.S.R.; Lien, K.M.; Burheim, O.S.; Pollet, B.G. Traditional Routes for Hydrogen Production and Carbon Conversion. In Hydrogen, Biomass and Bioenergy; Academic Press: Cambridge, MA, USA, 2020; pp. 21–53. [Google Scholar] [CrossRef]
  5. Penner, S.S. Steps toward the hydrogen economy. Energy 2006, 31, 33–43. [Google Scholar] [CrossRef]
  6. Mansilla, C.; Bourasseau, C.; Cany, C.; Guinot, B.; Le Duigou, A.; Lucchese, P. Hydrogen Applications: Overview of the Key Economic Issues and Perspectives. In Hydrogen Supply Chain: Design, Deployment and Operation; Academic Press: Cambridge, MA, USA, 2018; pp. 271–292. [Google Scholar] [CrossRef]
  7. Heidenreich, S.; Foscolo, P.U. New concepts in biomass gasification. Prog. Energy Combust. Sci. 2015, 46, 72–95. [Google Scholar] [CrossRef]
  8. Ministerio de Ambiente y Energtía-Minenergia Colombia’s Hydrogen Roadmap (In Spanish). August 2021. Available online: https://www.minenergia.gov.co/es/servicio-al-ciudadano/foros/hoja-de-ruta-del-hidrógeno-en-colombia/ (accessed on 3 June 2021).
  9. Revista, R. Colombia will have the Fourth Lowest Green Hydrogen Price in the World by 2050 (In Spanish). Rev. Sem. 2022. Available online: https://www.semana.com/economia/macroeconomia/articulo/colombia-tendra-el-cuarto-precio-mas-bajo-de-hidrogeno-verde-en-el-mundo-en-2050/202208/ (accessed on 3 June 2023).
  10. González-Delgado, Á.D.; Moreno-Sader, K.A.; Martínez-Consuegra, J.D. Sustainable Biorefining of shrimp: Developments from Computer Aided Process Engineering; Corporación Universitaria Minuto de Dios–UNIMINUTO: Bogotá, Colombia, 2022; (In Spanish). [Google Scholar] [CrossRef]
  11. Gondal, I.A.; Masood, S.A.; Khan, R. Green hydrogen production potential for developing a hydrogen economy in Pakistan. Int. J. Hydrogen Energy 2018, 43, 6011–6039. [Google Scholar] [CrossRef]
  12. Hamedani, S.R.; Villarini, M.; Colantoni, A.; Moretti, M.; Bocci, E. Life Cycle Performance of Hydrogen Production via Agro-Industrial Residue Gasification—A Small Scale Power Plant Study. Energies 2018, 11, 675. [Google Scholar] [CrossRef]
  13. Spath, P.; Aden, A.; Eggeman, T.; Ringer, M.; Wallace, B.; Jechura, J. Biomass to Hydrogen Production Detailed Design and Economics Utilizing the Battelle Columbus Laboratory Indirectly-Heated Gasifier; National Renewable Energy Laboratory (NREL): Springfield, QLD, Australia, 2005. Available online: http://www.osti.gov/bridge (accessed on 23 August 2023).
  14. El-Halwagi, M.M. A return on investment metric for incorporating sustainability in process integration and improvement projects. Clean Technol. Environ. Policy 2016, 19, 611–617. [Google Scholar] [CrossRef]
  15. Peters, M.; Timmerhaus, K.D.; West, R. Plant Design and Economics for Chemical Engineers, 5th ed.; McGraw-Hill Education: New York, NY, USA, 2003. [Google Scholar]
  16. El-Halwagi, M.M. Sustainable Design through Process Integration: Fundamentals and Applications to Industrial Pollution Prevention, Resource Conservation, and Profitability Enhancement, 2nd ed.; Butterworth-Heinemann: Oxford, UK, 2017. [Google Scholar]
  17. Jha, S.; Nanda, S.; Acharya, B.; Dalai, A.K. A Review of Thermochemical Conversion of Waste Biomass to Biofuels. Energies 2022, 15, 6352. [Google Scholar] [CrossRef]
  18. Heidenreich, S.; Müller, M.; Foscolo, P.U. Advanced Biomass Gasification and Product Flexibility; Elsevier: Amsterdam, The Netherlands, 2016; Available online: http://www.sciencedirect.com:5070/book/9780128042960/advanced-biomass-gasification (accessed on 3 November 2023).
  19. Mohammed, M.A.A.; Salmiaton, A.; Wan Azlina, W.A.K.G.; Mohammad Amran, M.S.; Fakhru’L-Razi, A. Air gasification of empty fruit bunch for hydrogen-rich gas production in a fluidized-bed reactor. Energy Convers. Manag. 2011, 52, 1555–1561. [Google Scholar] [CrossRef]
  20. D’Orazio, A.; Rapagnà, S.; Foscolo, P.U.; Gallucci, K.; Nacken, M.; Heidenreich, S.; Di Carlo, A.; Dell’Era, A. Gas conditioning in H2 rich syngas production by biomass steam gasification: Experimental comparison between three innovative ceramic filter candles. Int. J. Hydrogen Energy 2015, 40, 7282–7290. [Google Scholar] [CrossRef]
  21. Rauch, R.; Hrbek, J.; Hofbauer, H. Biomass gasification for synthesis gas production and applications of the syngas. Wiley Interdiscip. Rev. Energy Environ. 2014, 3, 343–362. [Google Scholar] [CrossRef]
  22. Cheng, Y.W.; Lee, Z.S.; Chong, C.C.; Khan, M.R.; Cheng, C.K.; Ng, K.H.; Hossain, S.S. Hydrogen-rich syngas production via steam reforming of palm oil mill effluent (POME)–A thermodynamics analysis. Int. J. Hydrogen Energy 2019, 44, 20711–20724. [Google Scholar] [CrossRef]
  23. Arregi, A.; Amutio, M.; Lopez, G.; Bilbao, J.; Olazar, M. Evaluation of thermochemical routes for hydrogen production from biomass: A review. Energy Convers. Manag. 2018, 165, 696–719. [Google Scholar] [CrossRef]
  24. Barisano, D.; Canneto, G.; Nanna, F.; Villone, A.; Fanelli, E.; Freda, C.; Grieco, M.; Lotierz, A.; Cornacchia, G.; Braccio, G.; et al. Investigation of an Intensified Thermo-Chemical Experimental Set-Up for Hydrogen Production from Biomass: Gasification Process Integrated to a Portable Purification System—Part II. Energies 2022, 15, 4580. [Google Scholar] [CrossRef]
  25. Marcantonio, V.; Bocci, E.; Monarca, D. Development of a Chemical Quasi-Equilibrium Model of Biomass Waste Gasification in a Fluidized-Bed Reactor by Using Aspen Plus. Energies 2019, 13, 53. [Google Scholar] [CrossRef]
  26. Barisano, D.; Canneto, G.; Nanna, F.; Alvino, E.; Pinto, G.; Villone, A.; Carnevale, M.; Valerio, V.; Battafarano, A.; Braccio, G. Steam/oxygen biomass gasification at pilot scale in an internally circulating bubbling fluidized bed reactor. Fuel Process. Technol. 2016, 141, 74–81. [Google Scholar] [CrossRef]
  27. Keskin, T.; Arslan, K.; Nalakth Abubackar, H.; Vural, C.; Eroglu, D.; Karaalp, D.; Yanik, J.; Ozdemir, G.; Azbar, N. Determining the effect of trace elements on biohydrogen production from fruit and vegetable wastes. Int. J. Hydrogen Energy 2018, 43, 10666–10677. [Google Scholar] [CrossRef]
  28. Motta, I.L.; Miranda, N.T.; Maciel Filho, R.; Wolf Maciel, M.R. Biomass gasification in fluidized beds: A review of biomass moisture content and operating pressure effects. Renew. Sustain. Energy Rev. 2018, 94, 998–1023. [Google Scholar] [CrossRef]
  29. Barisano, D.; Canneto, G.; Nanna, F.; Villone, A.; Fanelli, E.; Freda, C.; Grieco, M.; Cornacchia, G.; Braccio, G.; Marcantonio, V.; et al. Investigation of an Intensified Thermo-Chemical Experimental Set-Up for Hydrogen Production from Biomass: Gasification Process Performance—Part I. Processes 2021, 9, 1104. [Google Scholar] [CrossRef]
  30. Tuna, C.E.; Silveira, J.L.; da Silva, M.E.; Boloy, R.M.; Braga, L.B.; Pérez, N.P. Biogas steam reformer for hydrogen production: Evaluation of the reformer prototype and catalysts. Int. J. Hydrogen Energy 2018, 43, 2108–2120. [Google Scholar] [CrossRef]
  31. Pacheco-Pérez, K.; Baia-Olivares, M.; Meza-González, D.; González-Delgado, A.D. Exergy analysis of hydrogen production from palm oil solid wastes using indirect gasification. Indian J. Sci. Technol. 2018, 11, 1–6. [Google Scholar] [CrossRef]
  32. Salkuyeh, Y.K.; Saville, B.A.; MacLean, H.L. Techno-economic analysis and life cycle assessment of hydrogen production from different biomass gasification processes. Int. J. Hydrogen Energy 2018, 43, 9514–9528. [Google Scholar] [CrossRef]
  33. Li, G.; Wang, S.; Zhao, J.; Qi, H.; Ma, Z.; Cui, P.; Zhu, Z.; Gao, J.; Wang, Y. Life cycle assessment and techno-economic analysis of biomass-to-hydrogen production with methane tri-reforming. Energy 2020, 199, 117488. [Google Scholar] [CrossRef]
  34. Ma, Z.; Liu, X.; Li, G.; Qiu, X.; Yao, D.; Zhu, Z.; Wang, Y.; Gao, J.; Cui, P. Energy consumption, environmental performance, and techno-economic feasibility analysis of the biomass-to-hydrogen process with and without carbon capture and storage. J. Environ. Chem. Eng. 2021, 9, 106752. [Google Scholar] [CrossRef]
  35. Yukesh Kannah, R.; Kavitha, S.; Preethi; Parthiba Karthikeyan, O.; Kumar, G.; Dai-Viet, N.V.; Rajesh Banu, J. Techno-economic assessment of various hydrogen production methods–A review. Bioresour. Technol. 2021, 319, 124175. [Google Scholar] [CrossRef]
  36. Cook, B.; Hagen, C. Techno-economic analysis of biomass gasification for hydrogen production in three US-based case studies. Int. J. Hydrogen Energy 2023, in press, corrected proof. [Google Scholar] [CrossRef]
  37. Meramo-Hurtado, S.I.; González-Delgado, Á.; Rehmann, L.; Quinones-Bolanos, E.; Mehvar, M. Comparative analysis of biorefinery designs based on acetone-butanol-ethanol fermentation under exergetic, techno-economic, and sensitivity analyses towards a sustainability perspective. J. Clean. Prod. 2021, 298, 126761. [Google Scholar] [CrossRef]
Figure 1. (a) Process diagram of hydrogen production by indirect gasification Route 1 (PSA); (b) Process diagram of hydrogen production by indirect gasification Route 2 (Selexol).
Sustainability 15 16371 g001aSustainability 15 16371 g001b
Figure 2. Plant resilience to hydrogen processing capacity through indirect gasification.
Sustainability 15 16371 g002
Figure 3. Resilience of the selling price of hydrogen production through indirect gasification with respect to on-stream efficiency at the break-even point.
Sustainability 15 16371 g003
Figure 4. Resilience of profitability based on raw material costs for hydrogen production through indirect gasification.
Sustainability 15 16371 g004
Figure 5. Resilience of return on investment based on the operating costs of hydrogen production through indirect gasification.
Sustainability 15 16371 g005
Figure 6. Resilience of the payback period with respect to normalized variable operating costs of hydrogen production through indirect gasification.
Sustainability 15 16371 g006
Figure 7. Resilience of the product selling price with respect to the normalized net present value of hydrogen production through indirect gasification.
Sustainability 15 16371 g007
Figure 8. Resilience of the net present value of hydrogen production through indirect gasification.
Sustainability 15 16371 g008
Table 1. Considerations for each route for the technoeconomic resilience analysis.
ItemValue
Processing capacity (t/year)360.000
Main product flow (t/year)19.080
Raw material cost (USD/t)50
Final product cost (USD/kg)4
Plant life (years)15
Salvage value10% of depreciable FCI
Construction time3 years
LocationColombia
Tax rate 39%
Discount rate8%
Capacity operated50% the first year, 70% the second year, 100% from the third year onwards
Subsidies (USD/year)0
Process typeNew and unproven process
Process controlDigital
Type of projectPlant on unconstructed land
Type of soilSoft clay
Contingency percentage (%)20
Tank design codeASME
Vessel diameter specificationInternal diameter
Operator hour cost (USD/h)20
Supervisor hourly cost (USD/h)35
Salaries per year15
UtilitiesGas, water, steam, electricity
Process fluidsSolid–liquid–gas
Depreciation methodLinear
Table 2. Energy costs, modular costs, and power of the main equipment used.
EquipmentPower (kW)Energy Cost (USD/Year)Modular Cost (USD)Number of Equipment
Route
12
Rotary dryer130150,90942,15511
Hammer mill250290,21012,80011
O2 compressor100116,08423,13411
Gasifier50005,804,1962,988,22411
Air compressor8598,671173,13411
Cyclone8092,867103,42211
Syngas clean heat exchanger210243,776122,58211
RadFrac tower100116,084871,39011
Pump7587,063345011
Shift reactor35004,062,9373,650,87311
Steam compressor350406,29464,40711
LTS outlet heat exchanger175203,147143,93311
Flash drum90104,47672,35212
PSA tower25002,902,0984,659,54010
Absorption tower 28203,273,5661,572,15301
CO2 compressor103119,79968,34201
Cooling exchangers372431,832241,93002
Table 3. Total product cost for the hydrogen production plant.
Total Product Cost (TPC)Total (USD/y)
Route 1Route 2
Raw materials18,000,00018,000,000
Utilities (U)532,224957,600
Maintenance and repairs (MR)2,911,9642,376,644
Operating supplies145,598118,832
Operating labor (OL)257,400
Direct supervision and clerical labor38,610
Laboratory charges25,740
Patents and royalties0
Direct production cost (DPC)21,911,53621,774,826
Depreciation (D)4,076,7503,327,301
Local taxes1,164,785950,657
Insurance232,957190,131
Interest/rent582,392475,329
Fixed charges (FCH)6,056,8854,943,419
Plant overhead (POH)154,440
Total manufacturing cost (TMC)28,122,86226,872,685
General expenses (GE)7,030,7156,718,171
Total product cost (TPC)35,153,57833,590,856
Table 4. Capital costs for each hydrogen production route.
Capital CostsRoute 1Route 2
Cost of equipment14,894,95912,156,745
Equipment purchased (installed)2,978,9922,431,349
Instrumentation (installed)1,191,597972,540
Piping (installed)2,978,9922,431,349
Electrical network (installed)1,936,3451,580,377
Buildings (including services)5,957,9834,862,698
Services (installed)4,468,4883,647,024
Total DFCI34,407,35428,082,082
Land893,698729,405
Land improvements5,957,9834,862,698
Engineering and supervision4,766,3873,890,159
Equipment (R&D)1,489,4961,215,675
Construction costs5,064,2864,133,293
Legal expenses148,950121,567
Contractors’ fees1,042,647850,972
Contingency4,468,4883,647,024
Total IFCI23,831,93419,450,793
Fixed capital investment (FCI)58,239,28847,532,874
Working capital (WCI)34,943,57328,519,725
Start-up (SUC)5,823,9294,753,287
Total capital investment (TCI)99,006,79080,805,887
Salvage value FCI5,823,9294,753,287
Annualized fixed costs (AFC; USD/y)3,494,3572,851,972
Table 5. Economic indicators for the routes evaluated potential.
IndicatorRoute 1Route 2
Gross profit (depreciation not included) (GP) 43,044,81443,204,472
Gross profit (depreciation included) (DGP)47,121,56446,531,773
Profit after tax (PAT)28,744,15428,384,382
Profitability (gross income)77,616,00077,616,000
EP1 [USD/year]59,616,00058,320,000
EP2 [USD/year] 59,083,77657,362,400
EP3 [USD/year]42,462,42142,729,143
Cumulative cash flow (CCF) (1/y)0.430.53
Return on investment (% ROI)2935
Net present value (NPV; USD MM)492.73587.33
Annual cost/benefit ratio57.5768.62
Normalized variable operating costs (NVOC; USD/t-rm)80.8279.58
Annualized total operating costs (AOC; USD/year)35,153,57833,590,856
Disclaimer/Publisher’s Note: The statements, opinions and data contained in all publications are solely those of the individual author(s) and contributor(s) and not of MDPI and/or the editor(s). MDPI and/or the editor(s) disclaim responsibility for any injury to people or property resulting from any ideas, methods, instructions or products referred to in the content.

