Abstract
Urban parks can be critical components of city landscapes. In the wake of COVID-19, understanding the role of urban parks in helping to elicit positive sentiment and improve the overall well-being of visitors has gained new traction in the literature. This research distinctively investigates whether the COVID-19 pandemic altered preferences regarding urban parks and identifies the key landscape attributes and environmental factors that influenced positive visitor sentiment, thereby addressing a critical gap in understanding the evolving dynamics of urban green spaces in the post-pandemic era. We use a mixed methods approach that includes natural language processing techniques to analyze crowd sourced data across more than 100 urban parks in Shanghai, China. Not surprisingly, our results highlight a post-pandemic rise in preferences for neighborhood parks and features typically associated with neighborhood parks, such as walking accessibility and surrounding residential densities. In addition, we found six park features, the presence of grasslands, water bodies, walking paths, and proximity to shopping facilities, significantly impacted the ways in which people perceived their park experience. These insights can guide urban park planning, design, and management in our evolving post-pandemic landscape to help ensure that urban parks continue to serve as essential urban spaces.
1. Introduction
Urban parks can be critical components of city landscapes [1]. In an increasingly fast-paced and stressful urban living environment, urban parks serve a vital role in promoting positivity [2], human health [3,4], well-being [5], sentiment [6], and happiness [7,8]. They can also offer recreational opportunities [9], foster community interaction [10], and contribute to local climate regulation by mitigating urban heat island effects [11]. The recent COVID-19 pandemic catalyzed substantial changes in public life, including how urban green spaces are perceived and utilized [12,13]. With its attendant social distancing measures and lockdowns, the pandemic fundamentally disrupted the regular patterns of park use [14,15]. Are there long-term implications to this disruption? Has it also impacted the way people are affected by their parks?
Research is emerging on questions of how COVID-19 disruptions have impacted our relationship with urban green spaces [16] including the increased reliance on local parks during lockdowns [17], and the therapeutic role of green spaces in pandemic-induced mental health challenges [18]. According to [19], what is missing is the influence of diverse park features—from natural landscapes to recreational facilities—on visitor sentiment within the context of post-pandemic urban life. The pandemic has served as a crucial catalyst for re-evaluating the role of urban parks, highlighting their value not only as recreational spaces but also as essential components of urban resilience [20]. City planners, equipped with insights into how park features influence visitor sentiment, can better design green spaces that address the evolving needs of urban populations, particularly in response to crises. Furthermore, incorporating these insights into urban planning can facilitate the development of green spaces that actively contribute to public health, social cohesion, and the sustainable development of cities.
One reason for this gap is that a large-scale spatial-temporal analysis of visitor sentiment can be difficult to conduct using traditional survey and interview methods [21]. The process can be both time-consuming and expensive [22]. Alternative approaches are beginning to show promise for faster turnaround and easier data collection for analysis [23]. One such approach uses geo-referenced social media posts to study sentiment about specific geographic locations [15,24,25]. These studies have demonstrated that social media data can be effectively used to quantify positive sentiment connected to specific places [2,26]. The process is attractive due to the speed at which data can be collected and analyzed, making fine temporal analysis possible [27]. The method, however, also comes with several drawbacks. For example, social media users are predominantly younger and may not represent a general population, and although smartphones are becoming endemic to most societies worldwide there is still the potential for technological exclusion [28,29,30]. In addition, it is important to consider the reliability of social media data in representing emotion—social media posts may be more outward facing declarations rather than inward facing expressions [31,32]. Most park visitor perception research is still using traditional survey and interview methods, suggesting the application of social media data is still in its early stages [33].
This study aims to delve deeper into the dynamics of urban park use and sentiment in the face of the seismic shifts brought by the COVID-19 pandemic. The primary objectives of this research are as follows: first, to discern whether the COVID-19 pandemic has brought about changes in preferences towards urban parks, and second, to identify the key urban park landscape attributes and environmental factors that influence visitor sentiment. In pursuit of these objectives, we are guided by two critical research questions: (1) Did the COVID-19 pandemic alter preferences regarding urban parks?; and (2) What are the primary urban park landscape attributes and environmental factors that influenced positive visitor sentiment? The answers to these questions will provide valuable insights, informing future urban design, planning, and policymaking, and ensuring urban parks continue to serve as essential urban spaces. We hypothesize that there have been significant changes in public preferences regarding urban parks. Specifically, we propose that the pandemic has altered the attributes and environmental factors of urban parks that contribute most significantly to positive visitor sentiment.
We adopt a mixed-methods approach to study these questions, combining sentiment analysis of social media data with quantitative modeling. We do this using data collected in Shanghai, China pre and post pandemic. According to existing research, we identified factors that may influence positive visitor sentiment, including park landscape characteristics [24,34,35,36], park service facilities [37,38,39], traffic accessibility [15,38,39,40], and surrounding environments [37,41,42]. The contributions of this work lie in two primary areas. First, it addresses an underexplored area in the current literature around urban park utilization and public sentiment in the context of the pandemic. Second, it carries significant practical implications for urban park planning and management by elucidating the evolving needs and sentiments of park visitors. Findings from this study can inform the design and administration of urban parks in the post-pandemic era, supporting the goal of urban resilience and the enhancement of public well-being.
This paper is structured as follows. Section 1 (Introduction) sets the context, establishing the significance of urban parks, especially in the post-pandemic era, and highlighting the research gap this study aims to address. Section 2 (Study Area and Data) offers details about the geographical focus of the research and the data sources utilized, ensuring clarity on the empirical foundation of the analysis. In Section 3 (Methods), we elucidate the mixed-methods approach we adopted, detailing our sentiment analysis procedure and the random forest regression model employed to discern the nonlinear relationships between the variables. Section 4 (Results) presents the outcomes of our analysis, laying out the data in a coherent manner to facilitate subsequent interpretation. Finally, in Section 5 (Discussion) we will delve into the findings of our analysis, highlight the implications of our results for urban park design and planning, and offer recommendations for enhancing the appeal of urban parks.
2. Study Area and Data
The city of Shanghai is one of the most densely populated metropolitan areas in China, with a population of 24,894,300 in 2021. There are 670 parks in Shanghai, covering a total area of 6340 km. For the purpose of this study, we selectively focus on 118 of these parks. The criterion for their selection was based on the availability of adequate data points, ensuring a comprehensive analysis. Figure 1 illustrates the distribution of these selected urban parks across Shanghai.
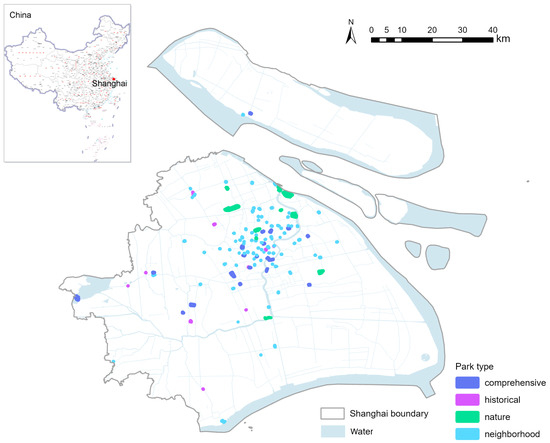
Figure 1.
The distribution Shanghai urban greenspaces used in this study.
Considering the availability and robustness of data within urban parks, the parks were classified into four categories based on the Urban Green Space Classification Standard (CJJT 85-2017) [43]: neighborhood parks, comprehensive parks, historical gardens, and nature parks (Table 1).

Table 1.
Urban park categories.
Data
Social media data came from Sina Weibo, China’s most popular social media site (aka ‘Chinese Twitter’) [15]. Geo-referenced Sina Weibo post data were accessed through its application programming interface (API). We scraped all Weibo posts containing park geotags, along with their time and content for the period July 2018 to March 2022. A totla of 40,523 pieces of raw data were retrieved. Duplicate posts, ads, polls, image sharing, @someone, retweets, and other spurious texts were discarded. After cleaning, the number available for analysis was 39,731. To ensure the reliability of the visitor sentiments derived from the Weibo data, we employed a validation step using ratings from prominent review platforms, Dazhongdianping (http://www.dianping.com/ (accessed on 1 May 2022)) and Ctrip (http://you.ctrip.com/ (accessed on 5 May 2022)).
An urban park inventory and their locational IDs came from the Shanghai Landscaping and City Appearance Administrative Bureau, 2023. To measure landscape patterns, we collected land use data with a spatial resolution of 10 m from Esri (https://livingatlas.arcgis.com/ (accessed on 10 May 2022)). There were four categories of land cover: forests, grasslands, water bodies, and built areas. We also collected other points of interest (POIs) [44], roads, nearby resident density, and house prices to learn which factors influence positive sentiment. We gathered data on POIs from Baidu maps (https://map.baiduv.com/ (accessed on 10 May 2022)), categorizing them into dining establishments, transportation hubs, and retail outlets to provide insights into the amenities available within and around the park. Road data comes from Open Street Map (https://www.openstreetmap.org/ (accessed on 11 May 2022)). The accessibility of parks was reflected by road data. Data on household prices and residents were obtained from Lianjia (http://m.lianjia.com/ (accessed on 12 May 2022)). The data on house prices around parks reflects the economic situation and the data on resident population reflects the population density around parks.
3. Methods
Sentiment analysis was conducted using a machine learning-based approach, specifically leveraging Long Short-Term Memory (LSTM) neural networks [45], a type of recurrent neural network well-suited to sequential data like text. This method provides a sophisticated understanding of visitor sentiments by capturing patterns and dependencies in the sequence of words in the comments [46]. The LSTM model was trained and validated based on labeled sentiment datasets and fine-tuned to ensure accurate sentiment classification for our specific context. Natural Language Processing (NLP) is a field of artificial intelligence that enables computers to understand, interpret, and generate human language [47]. It plays a pivotal role in sentiment analysis, which involves determining the emotional tone behind a series of words to understand the attitudes and opinions being conveyed. For our study, we utilized two prominent NLP platforms, Tencent and Baidu, to validate the precision of our analysis models [48]. These platforms employ deep learning techniques to process Chinese text, subsequently classifying the sentiments into positive, negative, or neutral categories. The use of two platforms enhanced the robustness and reliability of our sentiment classification. To dampen the influence of extreme values, we calculated the Positive Sentiment Ratio as the ratio of the number of positive emotion posts to the total number of posts. We divided this positive sentiment ratio into two categories: Pre-pandemic and Post-pandemic.
We conducted a Pearson correlation analysis between the sentiments from Weibo and the ratings from Dazhongdianping and Ctrip platforms. A high Pearson correlation coefficient (r) would indicate that our visitor sentiment results from Weibo were indeed trustworthy and aligned with broader public opinion (Table 2). The two NLP platforms had significant correlation results, and both had high model accuracy of 95% and 92%, respectively. In addition, Dazhongdianping rating data and Ctrip rating data of urban parks confirmed the results based on Weibo data. Positive sentiment ratios originating from different data sources were significantly correlated. The Pearson correlation analysis results confirmed that the positive sentiment ratio has high reliability and consistency.
Table 2.
Urban park categories.
3.1. Differences in Positive Sentiment in Different Types of Park
We quantified differences in positive visitor sentiment in different urban parks, first using descriptive statistics [49] to describe positive visitor sentiment at each park, and then created a box plot to compare the results pre- and post-COVID-19. Since the data on parks showed a normal distribution with homogeneous variance, which satisfied the prerequisites for analysis of paired t-test [50], this statistical method was then used to analyze whether there were significant differences in positive sentiments in urban parks. The null hypothesis (H0) was that there is no significant difference between the means of parks.
3.2. Relationships between Positive Visitor Sentiment and Urban Park Characteristics
Table 3 shows the factors that may influence positive visitor sentiment. Landscape indices that reflect park features and are ecologically meaningful were chosen. Fragstats v4.2 software was used to calculate these landscape indices. Additionally, some metrics were used to reflect the park service facilities, including the density of restaurants, non-motorized lanes, and parking lots. The indicators selected to reflect park accessibility were the density of bus stations, density of subway stations, density of driving roads, walking accessibility, and distance to the urban center. The indicators selected to describe the environment surrounding a park were resident density, average house price, density of various types of POI, density of shopping facility POI, and density of restaurant POI.
First, we conducted a correlation analysis with 36 potential influencing factors and positive visitor sentiment to identify the factors significantly correlated with positive sentiment. Then, we built a random forest regression model [51] to analyze the nonlinear relationship between positive visitor sentiment and the influencing factors.
Table 3.
Factors that potentially influence positive visitor sentiment.
Table 3.
Factors that potentially influence positive visitor sentiment.
| Categories | Variables | Descriptions |
|---|---|---|
| Park landscape | Park size (AREA) | Size of the park. |
| characteristics | Park perimeter (PERIM) | Perimeter of the park. |
| Landscape Shape Index (LSI) | Measured by the park perimeter divided by the square root of the park area adjusted by a constant. The higher the LSI, the more complex the landscape. | |
| Patch Density (PD_total) | Measured by the number of patches in the park divided by the park area. The higher patch density, the greater heterogeneity and fragmentation of the landscape. | |
| Patch Density (PD_category) | This variable is measured by the number of different categories of land cover patches (forest, grassland, water bodies, and impervious surface) in the park divided by the park area. | |
| Shannon’s Diversity Index (SHDI) | The higher SHDI, the more diverse the land cover type of a park. | |
| Shannon’s Evenness Index (SHEI) | The closer the SHEI value is to 1, the more uniform the land cover type of the park is. | |
| Largest Patch Index (LPI) | Measured by the ratio of the largest patch area of different land cover types to the park area. The higher the LPI, the lower the heterogeneity of a given type of land cover in the park. | |
| Landscape percentage (PLAND) | Ratio of the area of different land cover types to the park area. | |
| Park service facility | Restaurant density | Ratio of the number of POI of restaurants in the park to the park area. |
| Walking path density | Ratio of total length of the walking paths to the park area. | |
| Traffic accessibility | Walking accessibility | Measured by the improved Gaussian two-step floating catchment area method (G2SFCA) with Baidu map API. |
| Bus station density | Ratio of the intersection area of an 800-m buffer of the bus station with the park buffer to the area of the buffer of a park. | |
| Subway station density | Ratio of the intersection area of a 1200-m buffer of the bus station with the park buffer to the area of the buffer of a park. | |
| Driving road density | Ratio of total length of the driving road to the area of buffer zone. | |
| Distance to the city center | Distance of a park center to the city center, calculated by Euclidean distances. | |
| Surrounding | Surrounding resident density | Ratio of the resident population to the area of the buffer of a park. |
| environment | Housing price | Average housing price within the buffer of a park. |
| Surrounding shopping | Ratio of the number of shopping POI (malls, supermarkets, etc.) to | |
| facility density | the area of the buffer of a park. |
1 The radius of buffer zones of bus stations and subway stations are 800 m and 1200 m, respectively, following the Code for Transport Planning on Urban Roads (GB50220–95 [52]). 2 The buffer zones of surrounding environment of parks are 500 m and 1000 m, respectively, following the Shanghai planning guidance of a 15-min community life circle (2016).
4. Results
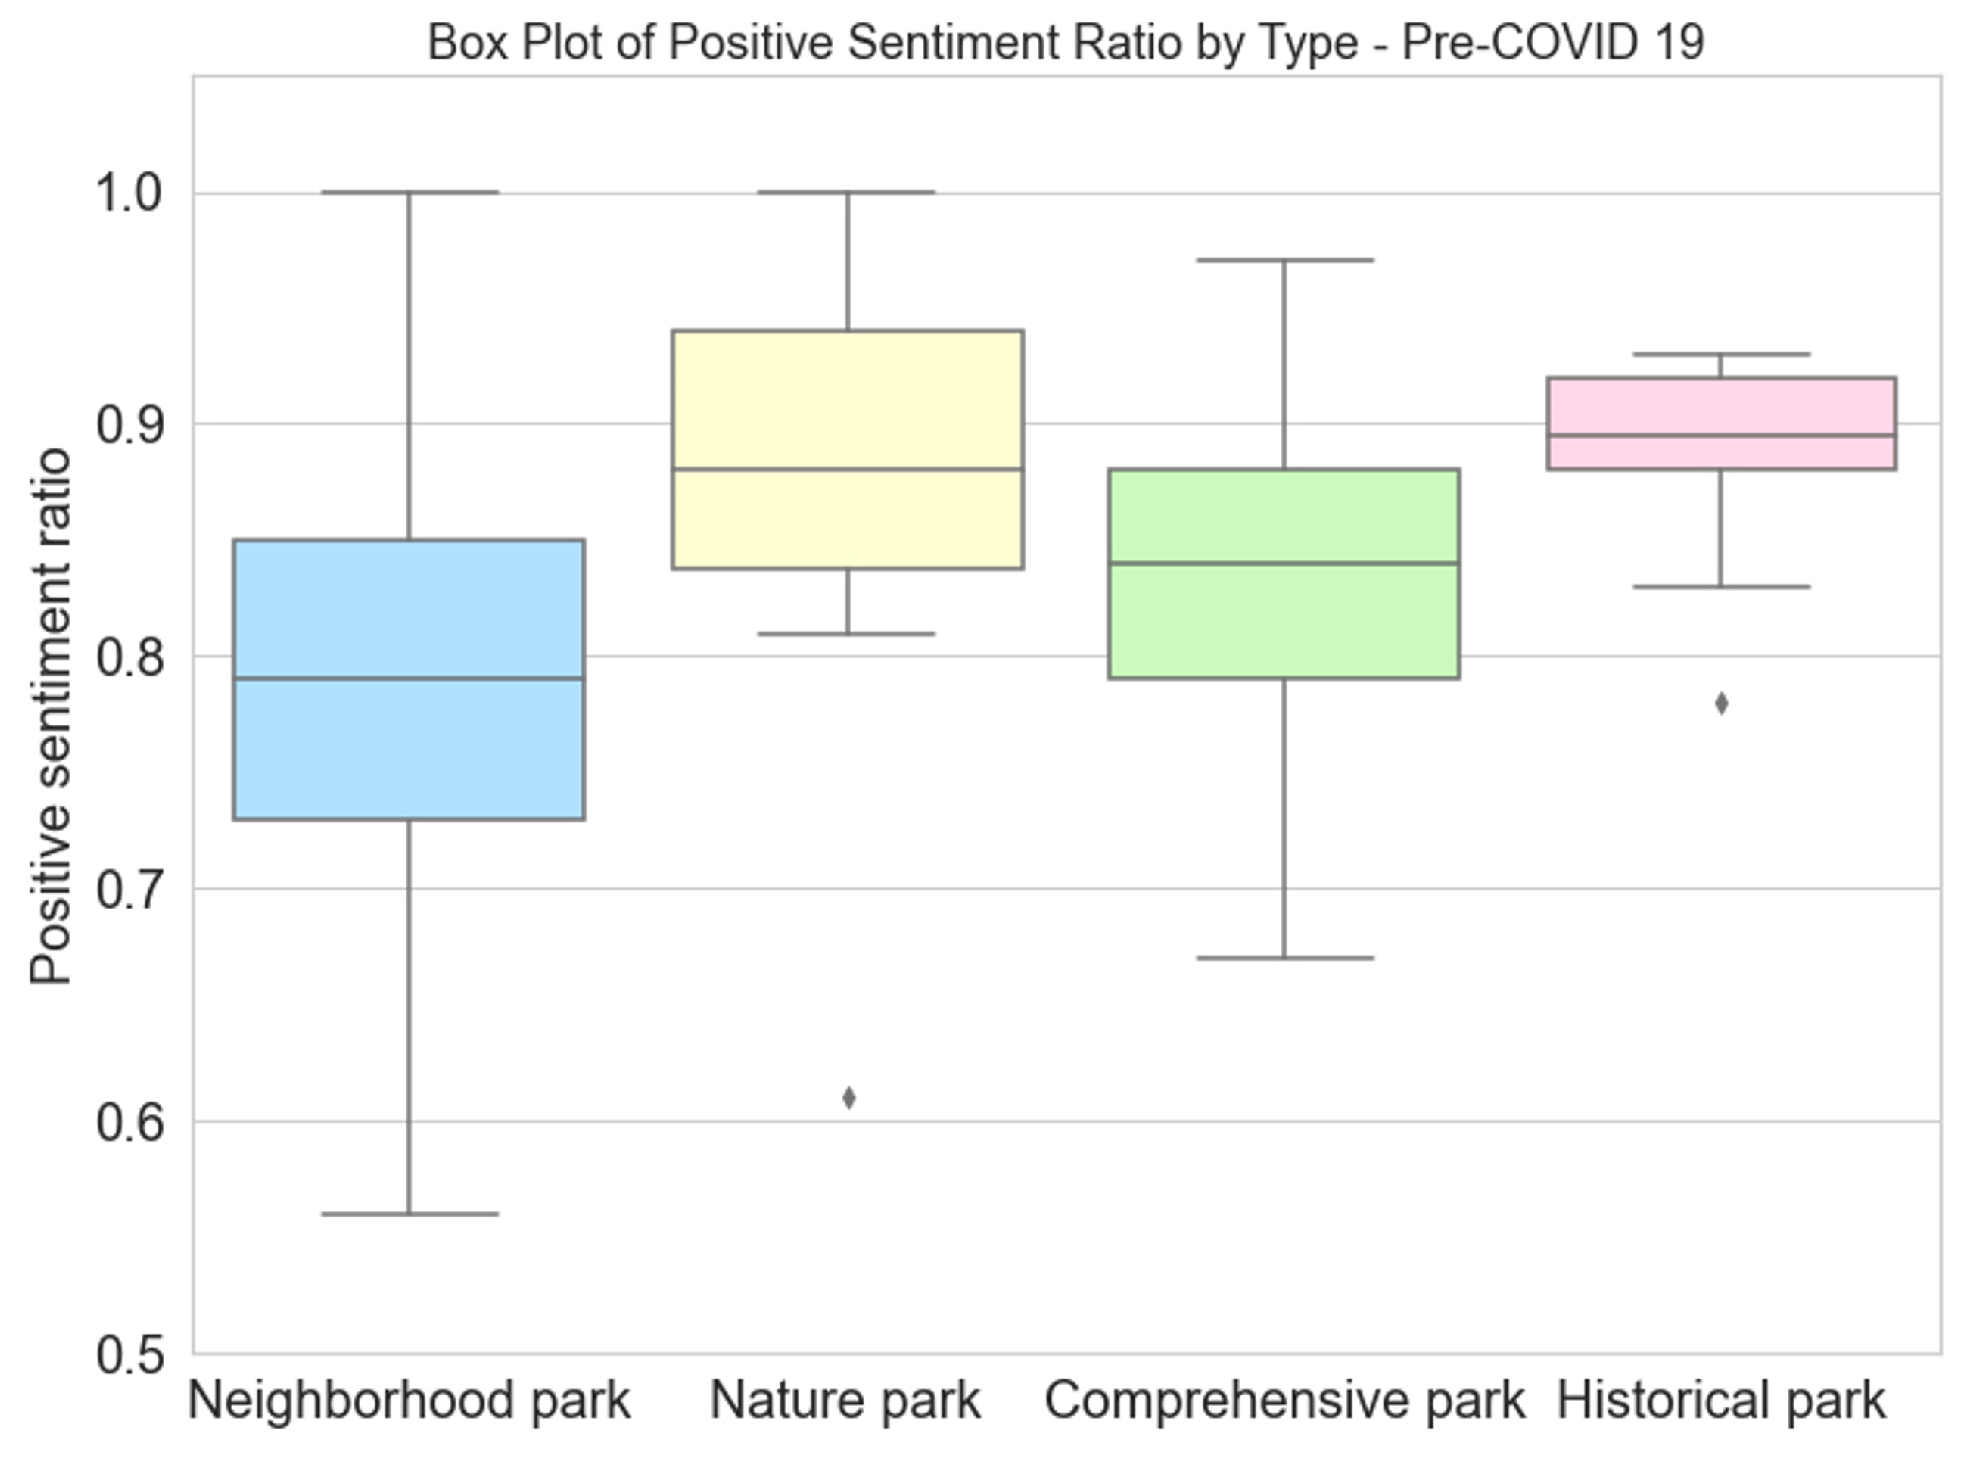
The box plot displays the distribution of positive sentiment ratios across four different types of urban park before the COVID-19 pandemic (Figure 2). The median score for neighborhood parks is the lowest among the four groups, at 0.78, suggesting that these parks, on average, receive lower scores compared with the other types. Nature parks exhibit the highest median score of 0.87, indicating a generally higher performance. Interestingly, despite having the lowest median score, neighborhood parks display the widest range of variation, with scores ranging from 0.55 to 1.00. This variability suggests a high degree of heterogeneity in the quality or characteristics of neighborhood parks. In contrast, historical parks exhibited a narrow range of scores (from 0.83 to 0.91) implying a more consistent quality or characteristics among the group.
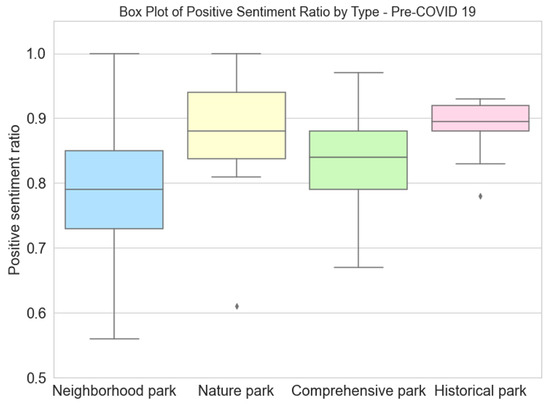
Figure 2.
Box plots of positive sentiment ratios by types before COVID-19. The diamond symbol refers to outliers.
4.1. Differences in the Positive Visitor Sentiments Pre- and Post-COVID-19
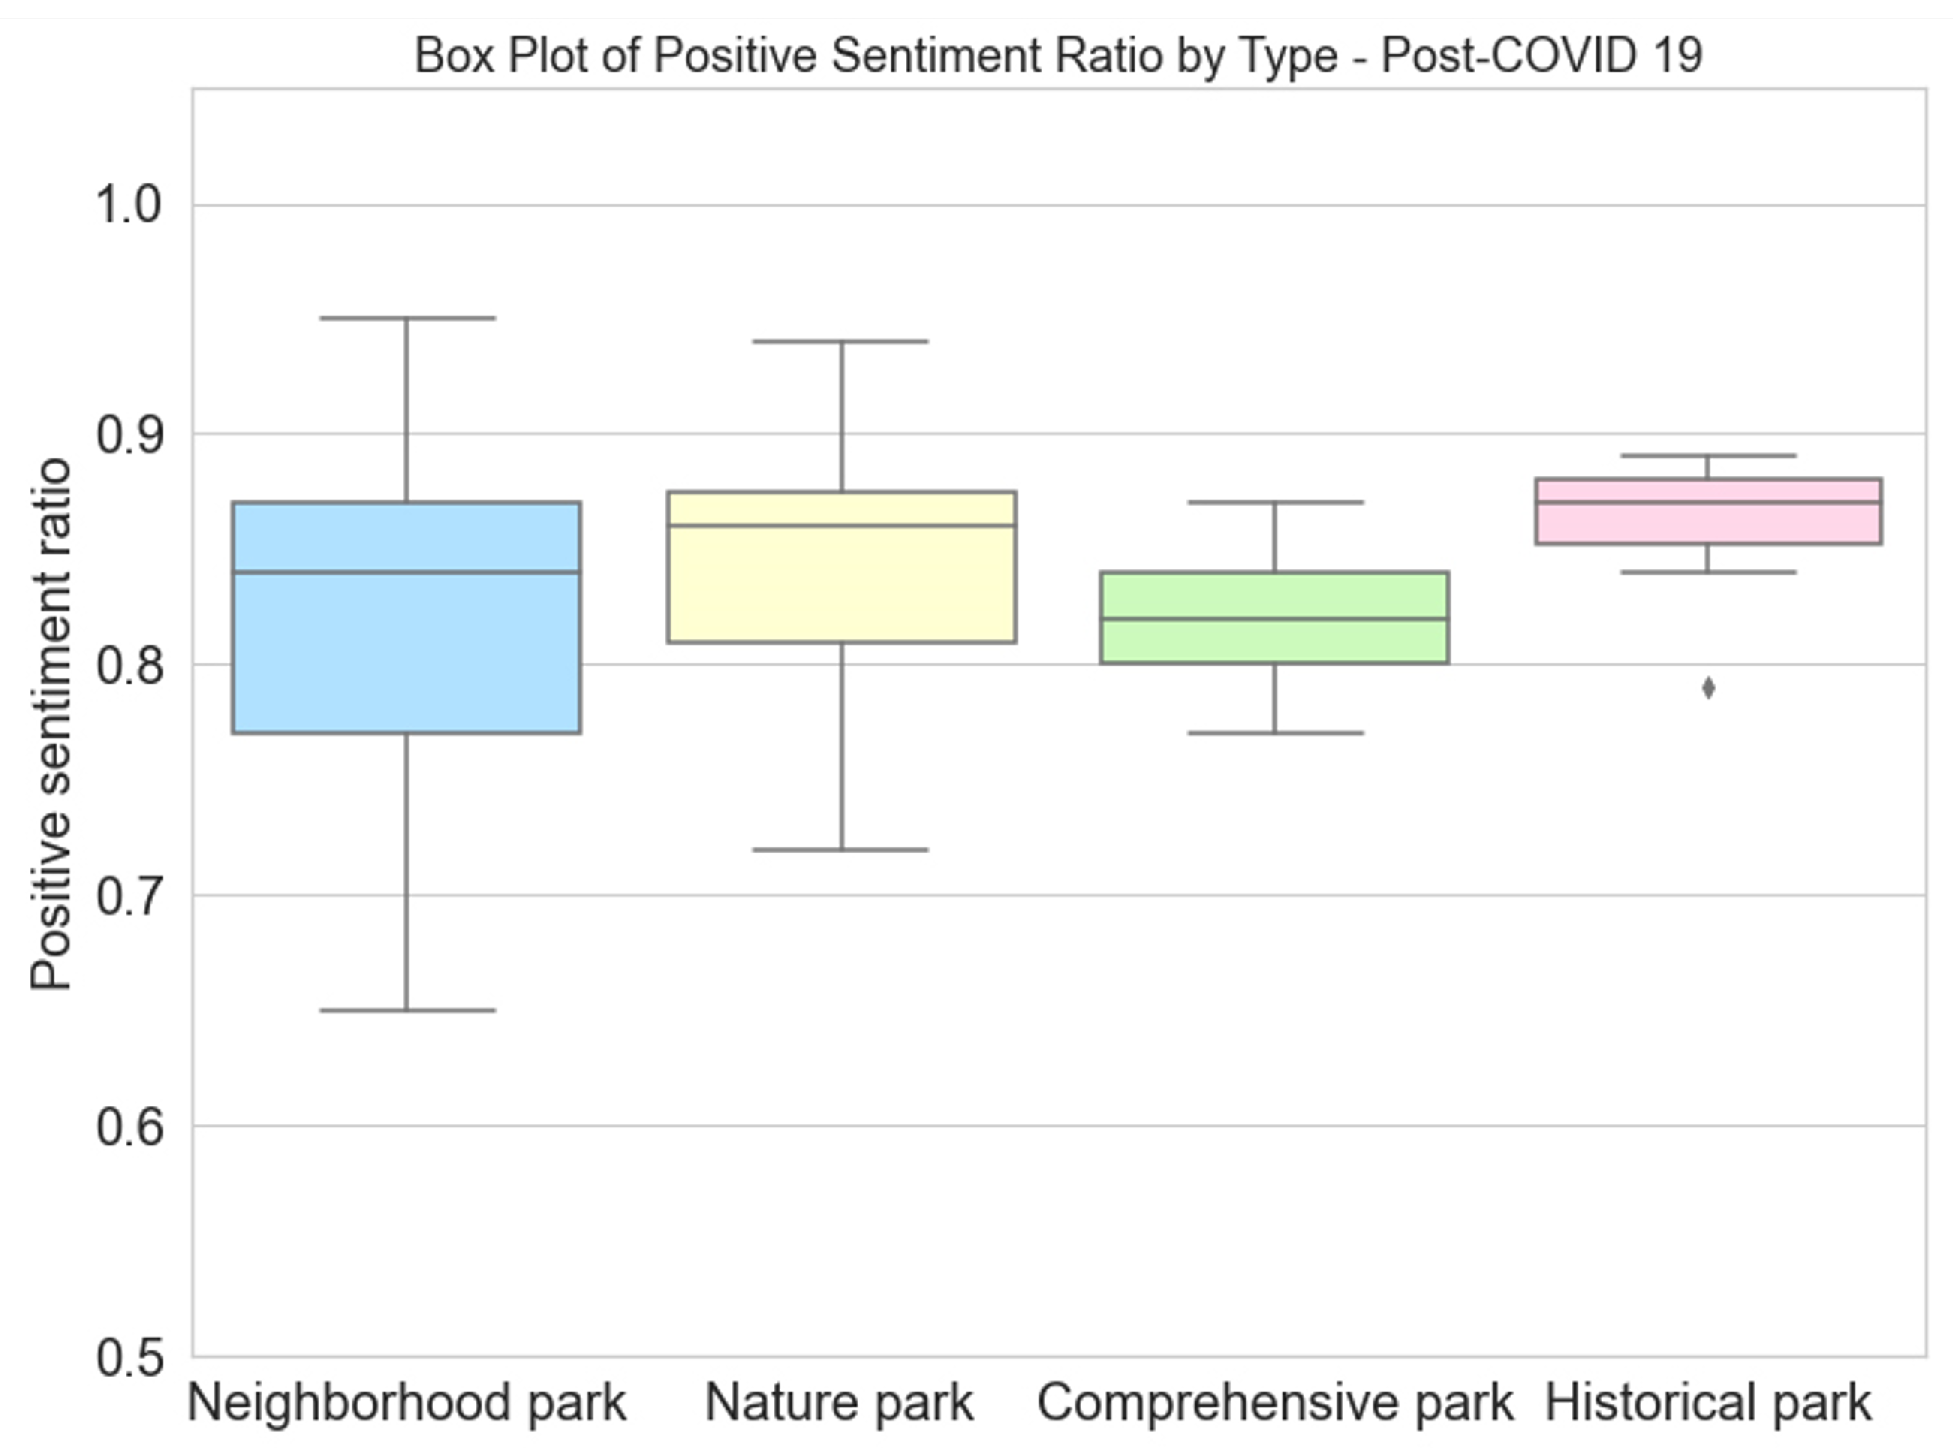
Figure 3 displays the distribution of positive sentiment ratios across the four types of urban park after the COVID-19 pandemic. The median values for neighborhood and comprehensive parks increased and decreased, respectively, while those for historical parks remained relatively stable. Nature parks saw a slight decrease in both median value and the interquartile range (IQR).
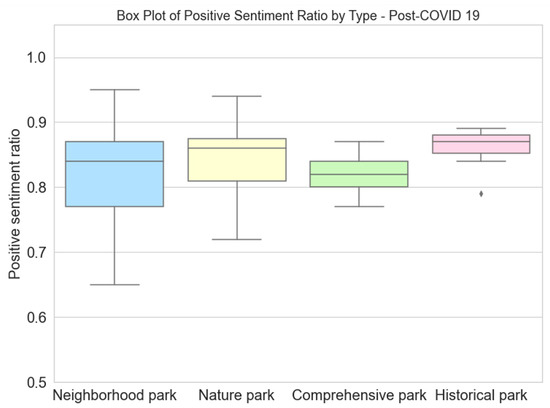
Figure 3.
Box plots of positive sentiment ratios by type after COVID-19. The diamond symbol refers to outliers.
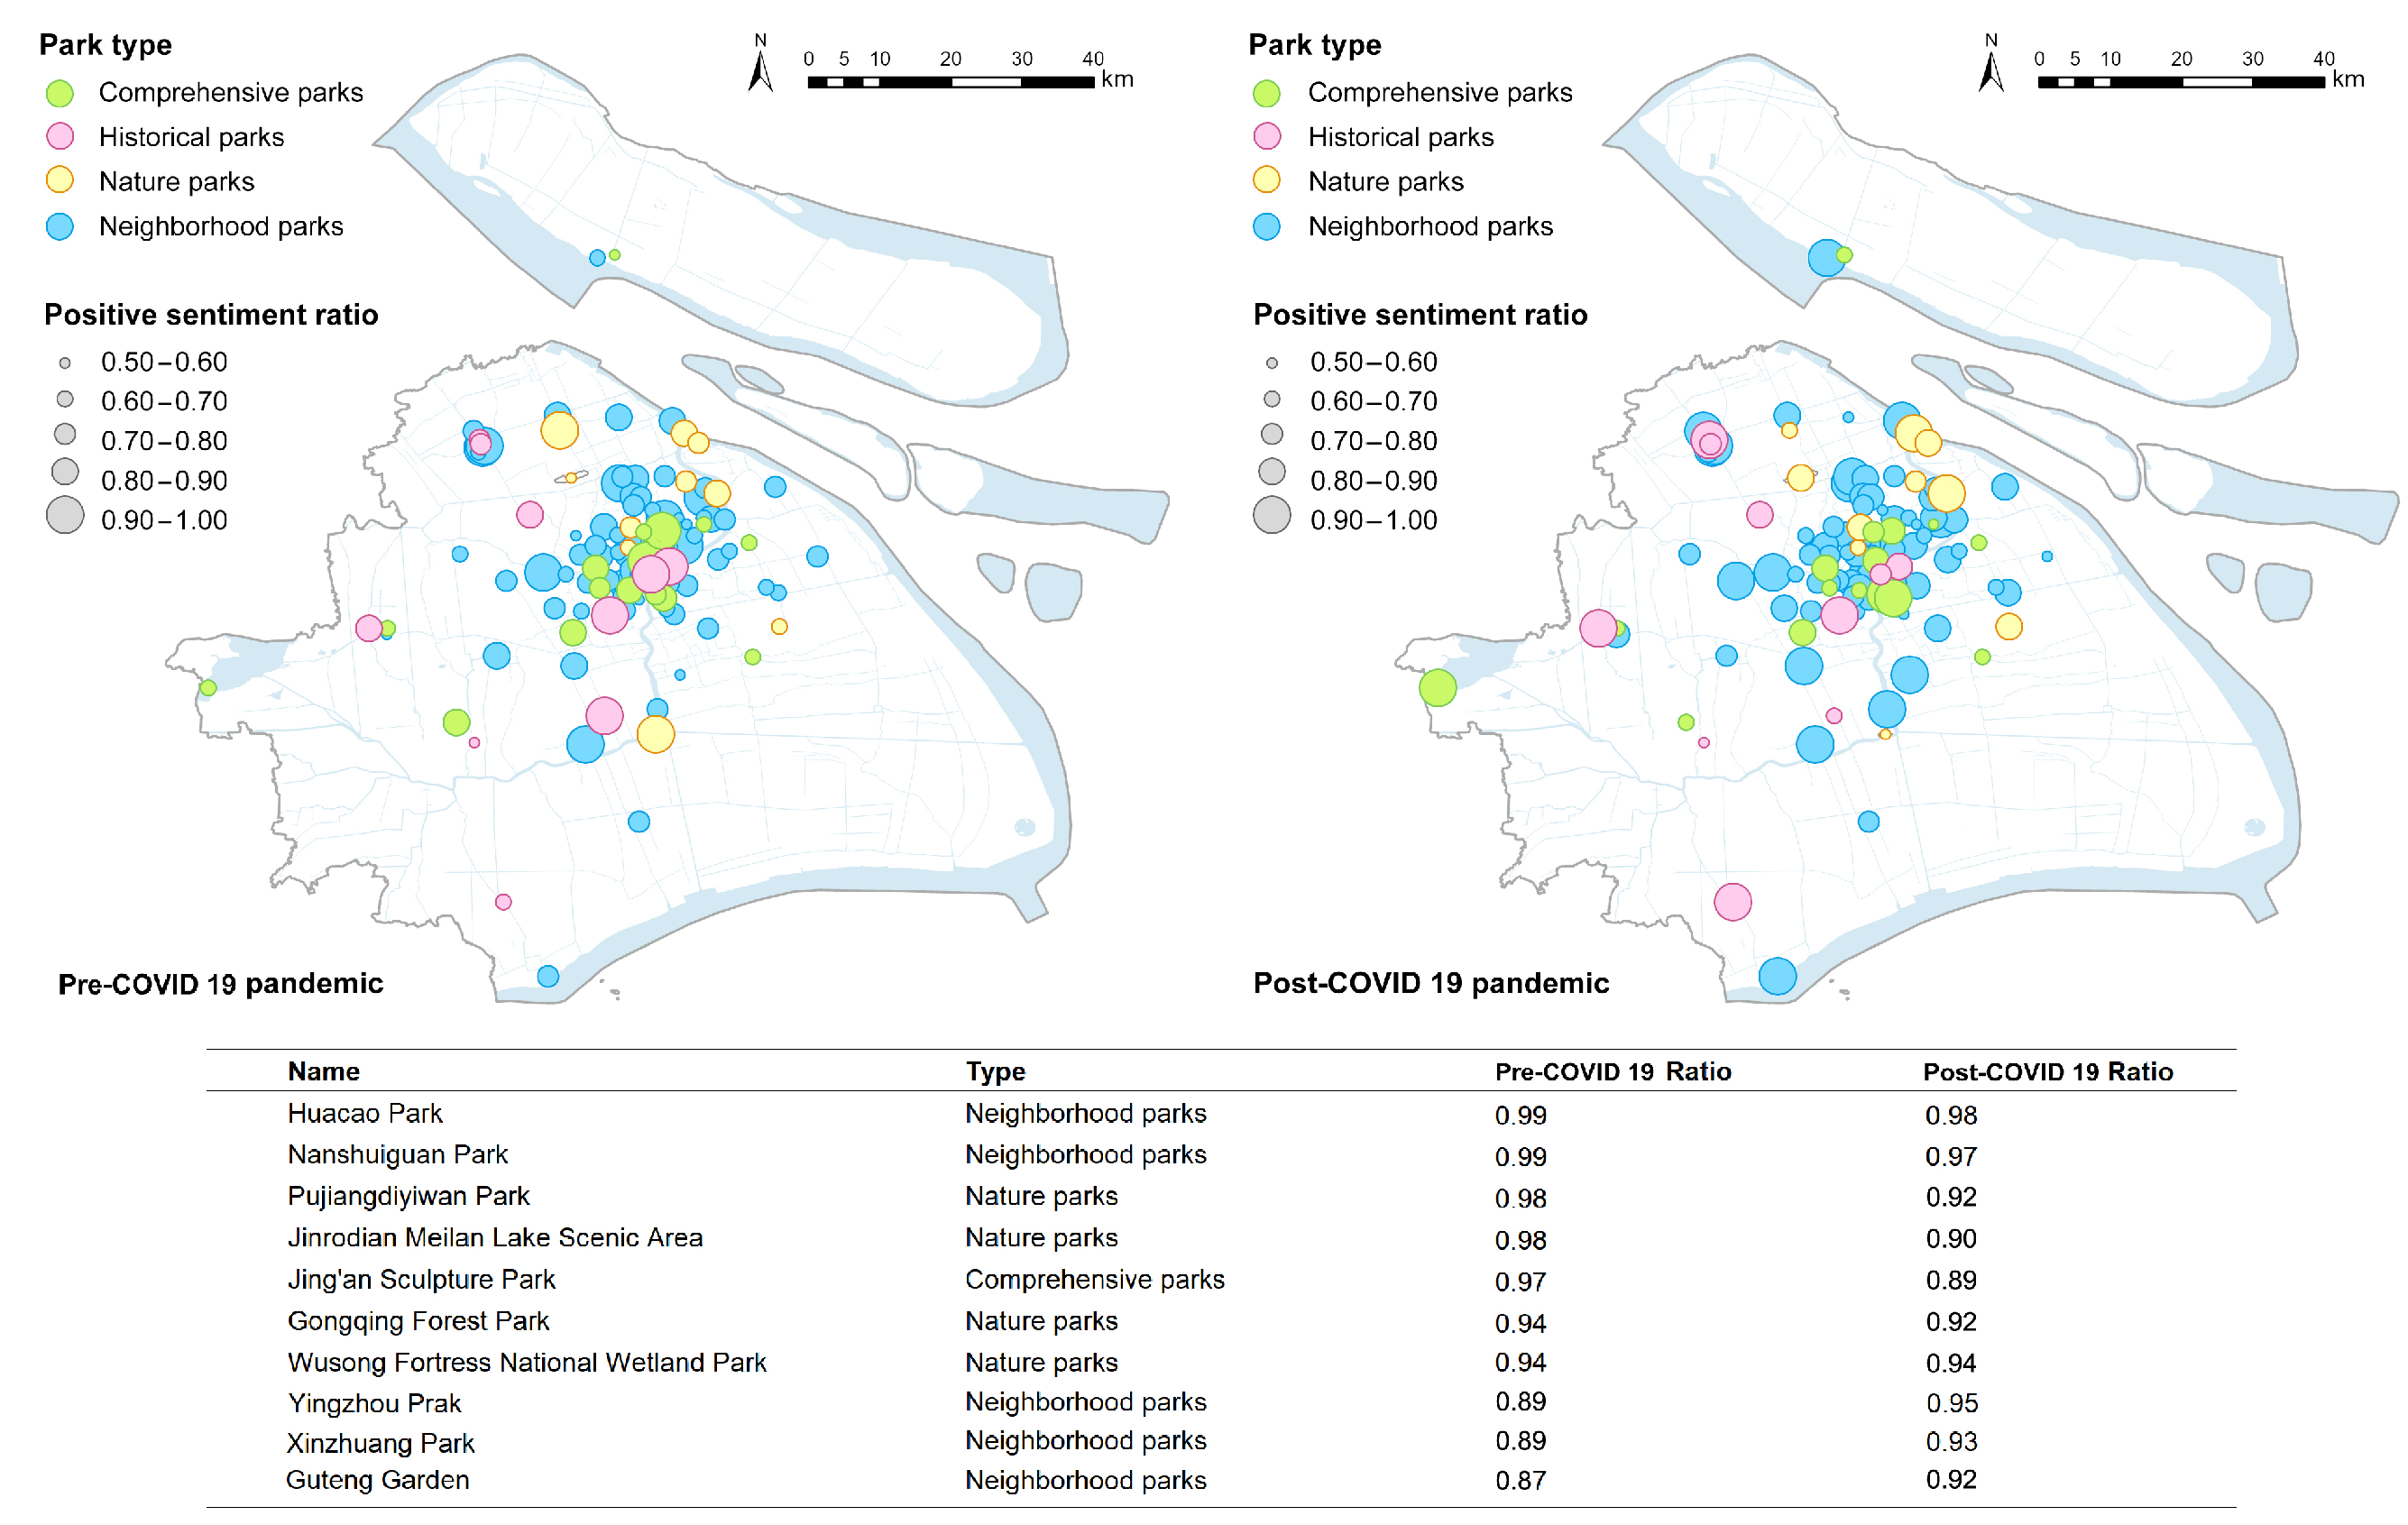
The changes in the top-ranking parks and their positive sentiment ratios before and after COVID-19 suggest that the pandemic may have influenced people’s preferences for different park types, with an increased preference for neighborhood parks (Figure 4). Additionally, Gongqing Forest Park and Wusong Forestry National Wetland Park were among the top 7 parks both before and after COVID-19. This suggests that nature parks consistently maintained their appeal and positive sentiment among visitors, even after the pandemic. The paired t-test results suggest that there was a significant increase in positive sentiment ratios for neighborhood parks before and after the COVID-19 pandemic (t-value is and p-value is smaller than 0.001). However, the remaining three types did not show a significant difference.
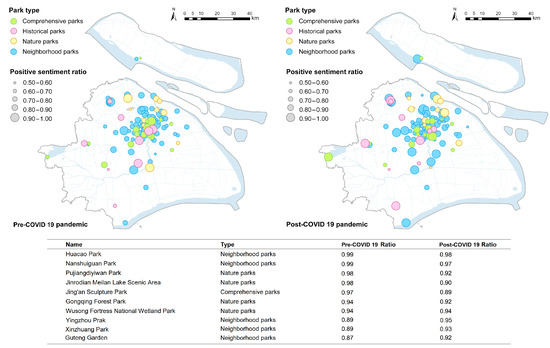
Figure 4.
Comparison of the distribution of positive sentiment ratios of the four types of park pre- and post-COVID-19.
4.2. The Relationship between Positive Sentiment Ratio and Park Attributes
Before the COVID-19 pandemic, the Pearson correlation analysis revealed several significant relationships between park characteristics, service facilities, traffic accessibility, surrounding environment, and positive sentiment ratio (Table 4). The area ratio of grassland (0.331, p < 0.01) and the area ratio of water bodies (0.592, p < 0.001) both showed positive correlations, indicating that larger proportions of these features in parks were associated with higher positive sentiment. The largest patch index of water bodies also had a strong positive correlation (0.527, p < 0.001), suggesting that larger contiguous areas of water were particularly appreciated. Walking path density (0.252, p < 0.001) and walking accessibility (0.336, p < 0.001) were positively correlated with positive sentiment, indicating that parks with more walking paths and better accessibility were more positively perceived. Surrounding shopping facility density also showed a significant positive correlation (0.331, p < 0.001), suggesting that parks surrounded by more shopping facilities were associated with higher positive sentiment.
Table 4.
Results of the Pearson correlation analysis between factors and positive sentiment ratio.
In the post-COVID-19 period, the Pearson correlation analysis showed some changes in the relationships between park characteristics, service facilities, traffic accessibility, surrounding environment, and positive sentiment ratio (Table 4). The area ratio of grassland showed a decreased but still significant correlation (0.163, p < 0.001), while the area ratio of water bodies remained strongly correlated (0.561, p < 0.001). The largest patch index of water bodies continued to show a strong positive correlation (0.513, p < 0.001). Walking path density saw a substantial increase in its correlation (0.583, p < 0.001), possibly reflecting increased importance of outdoor exercise. Walking accessibility also saw a significant increase in its correlation (0.645, p < 0.001), indicating its increased importance after the pandemic. Surrounding shopping facility density also increased in its correlation (0.524, p < 0.001), possibly reflecting the increased value of having amenities nearby after lockdowns and social distancing measures.
4.3. Differences Pre- and Post-COVID-19
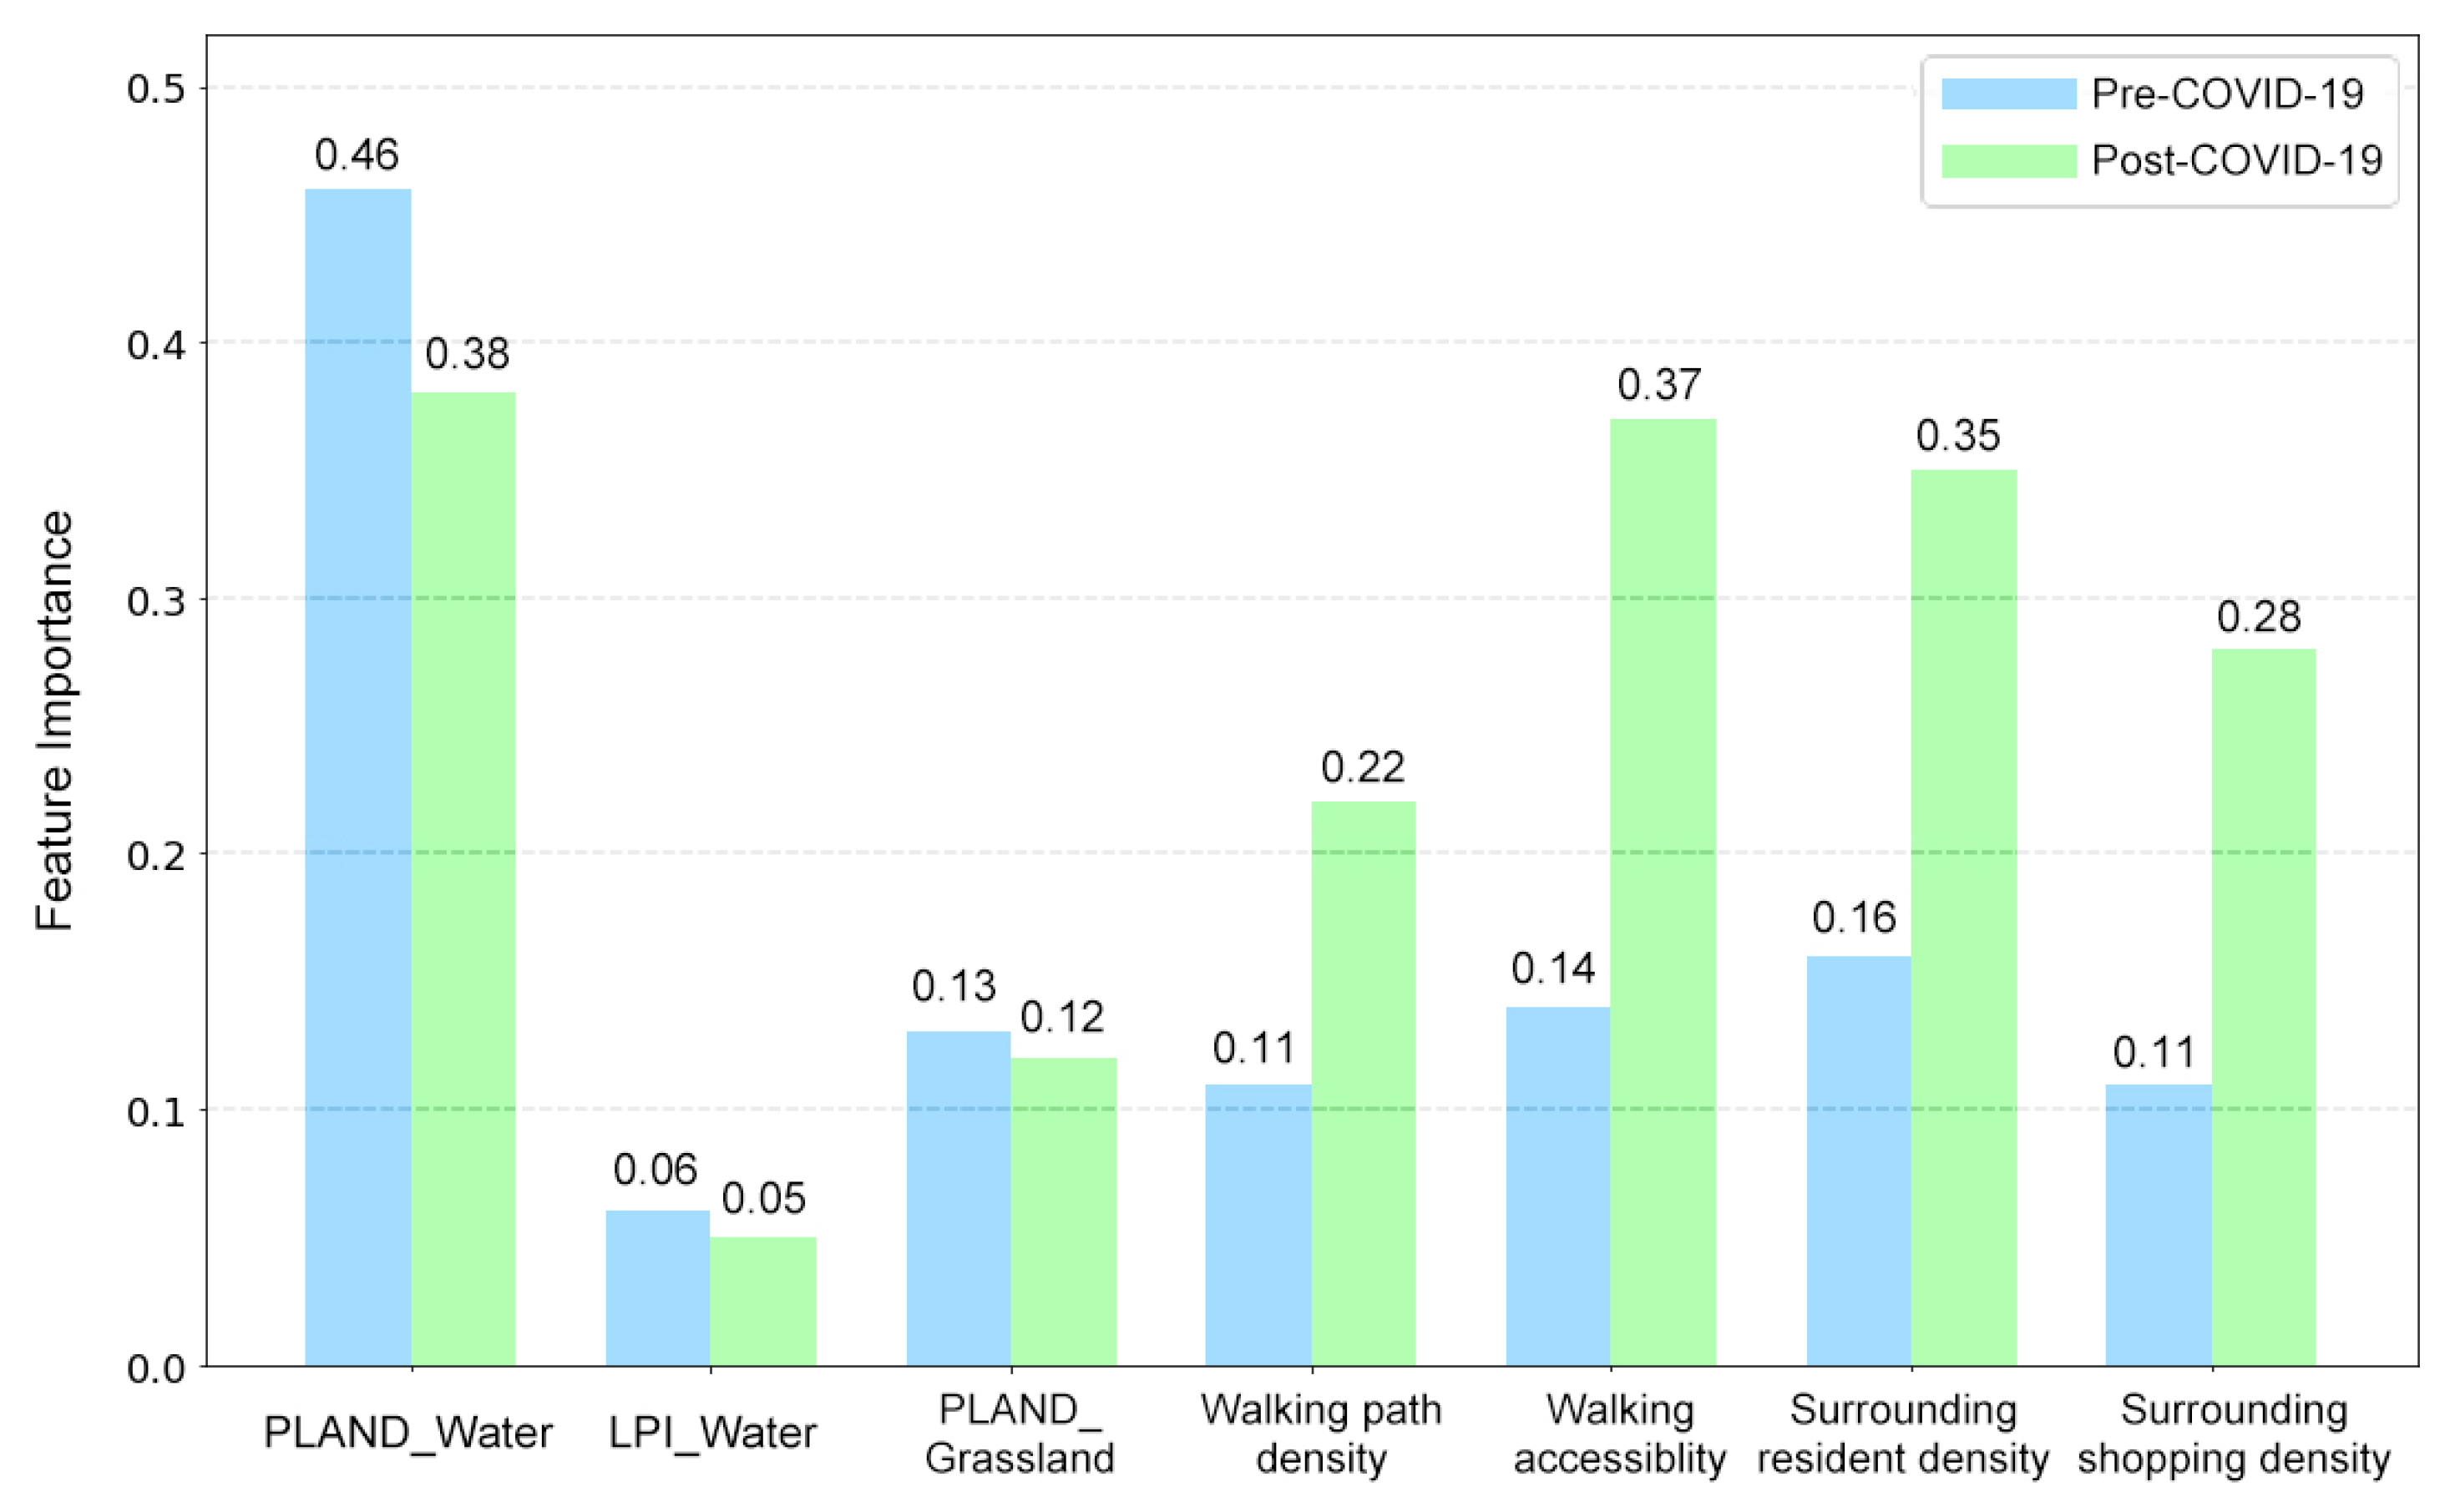
Based on random forest regression, there were six attributes of urban parks significantly correlated with the positive sentiment ratio before COVID-19: the area ratio of grassland, the area ratio of water bodies, the largest patch index of water bodies, walking path density, walking accessibility, and surrounding shopping facility density. After COVID-19, the indicators significantly associated with positive sentiment ratios were the same as before COVID-19, but the magnitude of feature importance changed significantly (Figure 5). The Adjusted R square values were 0.572 and 0.583 respectively, indicating that the independent variables explained 57.2% and 58.3% of the variation in the positive sentiment ratio before and after the COVID-19 pandemic.
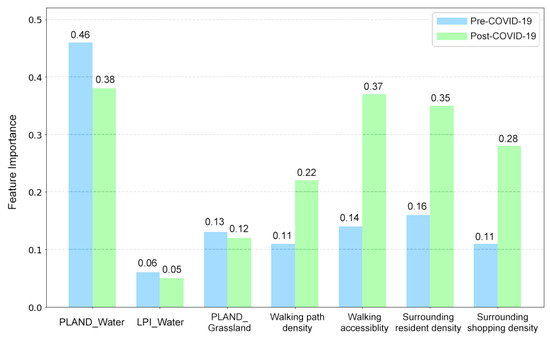
Figure 5.
Feature importance of urban park attributes.
5. Discussion
This discussion section will delve into the findings of our analysis, highlight the implications of our results for urban park design and planning, and offer recommendations for enhancing the appeal of urban parks.
5.1. Difference in Visitor Positive Sentiments Pre- and Post-COVID-19
Prior to the start of the COVID-19 pandemic, our analysis revealed a significantly higher positive sentiment ratio among visitors to natural and historic parks than among visitors to neighborhood parks. The primary determinant of this discrepancy may lie in the functional variations between these park types. The unique attributes and ecological qualities of each park type can differentially impact the degree of positive sentiment experienced by visitors [53]. Nature parks, abundant in biodiversity, offer a serene setting for leisure activities and a reprieve from urban stressors, thereby promoting positive sentiments. They also play an educational role, fostering environmental awareness and appreciation through exposure to diverse flora, fauna, and ecological processes [54,55,56], which cannot be replaced by the other three types of park. Historical parks, often characterized by a rich past and abundant cultural monuments, play a dual role for visitors. They not only provide recreational opportunities but also cater to the cultural interests of the visitors, thus addressing a wider spectrum of needs [57,58]. As a result, these parks cater to a broad spectrum of visitor needs, providing multifaceted services that appeal to diverse interests and preferences. In contrast, neighborhood parks, with their smaller scale and fewer ecological features, mainly cater to local needs such as fitness and play spaces. However, the lack of varied landscapes or natural features [59], such as water bodies or diverse vegetation, might limit the range of recreational activities available, thereby influencing visitor satisfaction and emotional responses.
After COVID-19, the results revealed a statistically significant surge in the positive sentiment ratios for neighborhood parks. Conversely, no significant variation was observed in the sentiment ratios for the other three park types across the same temporal comparison. This result can be attributed to a constellation of factors: (1) The imposition of lockdown measures and travel restrictions during the pandemic likely rendered larger nature, comprehensive, and historical parks less accessible, enhancing the appeal of neighborhood parks due to their proximity to residential areas [60]. These local parks served as vital outlets for outdoor activities, exercise, and relaxation, all within the confines of home-centered lifestyles that the pandemic necessitated [61]. The allure of these spaces appears to have remained even after the lockdown, suggesting a lasting influence of the pandemic on people’s interaction with their nearby urban settings. (2) Neighborhood parks may have fostered a heightened sense of community during these challenging times, contributing to the uplift in positive sentiment [62]. Regular exposure to these local green spaces, recognized for their mental health benefits [63], may have also played a role, particularly given the increased stressors associated with the pandemic. In contrast, the absence of substantial sentiment changes in other types of park could be attributed to their limited accessibility, public apprehension towards populated areas, or modifications in park management in adherence to COVID-19 safety protocols. In the post-COVID-19 era, these factors may evolve. For instance, lingering concerns about virus transmission might continue to deter some from visiting crowded park spaces [64]. Also, changes made to park operations during the pandemic, such as altered opening hours or capacity restrictions [65], might become normalized and persist. Additionally, people may have developed new habits or preferences for less crowded, more localized green spaces, reducing the demand for other park types. Finally, the pandemic may have exposed and emphasized existing issues of accessibility, prompting a broader discussion about urban planning and equitable access to public green spaces.
On the other hand, the observed narrowing of the range for the positive sentiment ratio in relation to neighborhood parks post-COVID-19, as evidenced by the box plots (Figure 2 and Figure 3), suggests a decrease in sentiment variability among park visitors. The reason might be that neighborhood parks became important places for community connection during lockdown, and these connections were maintained after restrictions were lifted, and this could contribute to sustained positive sentiment. Further research would be needed to corroborate these potential explanations.
5.2. The Relationship between Positive Visitor Sentiment and Park Features Pre- and Post-COVID-19
Before COVID-19, we found that the positive sentiment of visitors was positively associated with urban park landscape attributes (Table 4 and Figure 5). The ranking by feature importance is as follows: the ratio of water bodies > surrounding resident density > walking accessibility > the ratio of grassland > walking path density = surrounding shopping facility density > large areas of water bodies.
This could be attributed to several factors. First, the ratio of water bodies, being the most impactful feature (0.46), resonates with the fact that water elements are often considered central to aesthetic appeal and tranquility in parks [66,67]. Water bodies can also provide important ecosystem services such as habitat for local fauna and temperature regulation, thereby increasing the perceived value of the park for visitors [68]. This is consistent with the finding in [69] that water bodies are significant positive predictors of park perceptions in Shanghai. Surrounding resident density (0.16) might signal the degree of community engagement with the park. Higher residential densities could lead to more social interactions and a sense of community in the park, enhancing the positive sentiment among visitors [70]. High walking accessibility (0.14) encourages more regular visits, enhancing physical and mental well-being [71]. Additionally, parks that are easily accessible by foot can be particularly important in urban environments, providing essential havens of tranquility amidst bustling city life, which could enhance positive sentiments among visitors [72]. The ratio of grassland (0.13) likely represents the availability of open space for various recreational activities, contributing to visitors’ enjoyment and the overall versatility of the park’s ecosystem services [73]. Walking path density (0.11) and surrounding shopping facility density (0.11) both contribute to the convenience and recreational diversity of the park. Non-motorized lanes support health-promoting activities like cycling or walking [74], while nearby shopping facilities allow visitors to combine their park visit with other errands or activities [75]. Lastly, large areas of water bodies (0.06), while less influential, still add to the natural aesthetic and offer additional ecosystem services, potentially contributing to the positive sentiment among park-goers [76].
After the COVID-19 pandemic, the feature importance of six variables changed significantly (Figure 3 and Table 4): the ratio of water bodies > walking accessibility > surrounding resident density > surrounding shopping facility density > walking path density > the ratio of grassland > large areas of water bodies. The shift in feature importance following the COVID-19 pandemic likely reflects changes in visitor preferences and behaviors after pandemic conditions.
The shifting importance of certain park features post-lockdown reflects evolving visitor priorities and behaviors. Although the ratio of water bodies’ importance slightly decreased from 0.46 to 0.38, their aesthetic appeal and tranquility remain appreciated. However, other park attributes, such as walking accessibility and convenience—especially in neighborhood parks—gained prominence. The importance of walking accessibility significantly increased from 0.14 to 0.37, indicating a potential lasting change in visitor preferences. During the lockdown, easily accessible local parks became essential refuges [77]. Their appeal seems to have persisted post-lockdown, pointing towards an enduring impact of the pandemic on how people engage with their local urban environments.
In addition to accessibility, surrounding resident density, which jumped from 0.16 to 0.35 post-lockdown, underscores local parks’ role as community hubs. As people spent more time in their immediate neighborhoods during the pandemic [78], they likely developed stronger connections with local parks and residents. This sense of community might persist even as restrictions ease, reinforcing the importance of resident density in shaping positive park sentiment [79]. Simultaneously, the convenience of combining park visits with shopping became more integral to visitors’ experiences, as evidenced by the increased importance of surrounding shopping facility density (rising from 0.11 to 0.28). The pandemic might have encouraged more efficient trip planning, which means people prefer combining multiple activities into one trip. This is because of the traffic restrictions during the lockdown whereby most transportation was suspended, including buses and metros, and people had to choose walking. This habit is likely to persist post-lockdown [80]. Similarly, the increased importance of walking path density from 0.11 to 0.22 suggests a continued interest in activities such as walking, cycling, or jogging in local parks—a trend that has seemingly outlasted the lockdowns.
Lastly, the enduring allure of open green spaces and large water bodies, indicated by a minor decrease in their importance (from 0.13 to 0.12 for the ratio of grassland, and from 0.06 to 0.05 for large areas of water bodies), reaffirms their perennial significance in urban parks. While the focus might have slightly shifted towards the more accessible features of neighborhood parks in the post-lockdown environment, these natural elements continue to attract visitors, underscoring the complex interplay of park attributes that shape visitor experiences [73].
5.3. Implications for Urban Park Design and Planning
Our research has several key implications for urban park design and planning. First, the amplified importance of walkability and accessibility post-COVID-19 underscores the necessity to design parks that are easily accessible on foot, especially from nearby residential areas. Second, the enduring appeal of water bodies, irrespective of the pandemic, calls for integrating these aesthetic and ecologically valuable features into urban park design, subject to feasibility. Third, maintaining a balance between open grasslands for recreational activities and diverse landscapes to cater to broader visitor interests is crucial. This balance ensures that parks remain versatile spaces, accommodating various visitor preferences and activities [81]. Furthermore, the increased emphasis on walking path density and surrounding shopping facility density suggests that urban planners should consider parks not in isolation but as integral components of the larger urban ecosystem. Strategies that facilitate the integration of recreational, transportation, and commercial elements can enhance the overall appeal and functionality of parks [79]. Lastly, the heightened significance of resident density post-pandemic indicates that parks, particularly neighborhood parks, play a crucial role in fostering community engagement. Design features that encourage social interactions and cultivate a sense of community should be prioritized. This includes creating comfortable, shared spaces that facilitate social events, and ensuring safety and inclusivity in park design [82]. In sum, the findings from our study provide valuable insights that can inform evidence-based urban park design and planning, ultimately fostering healthier, more resilient, and livable cities in a post-COVID-19 world.
6. Conclusions
In this study, we utilize social media data to investigate the impact of the COVID-19 pandemic on urban park preferences and to explore the potential relationships between positive sentiment expressed by visitors and the features of these parks. As the pandemic has led to significant shifts in human behavior, including an increased emphasis on outdoor activities and safe social distancing practices, it is crucial to understand how these changes may have influenced the popularity and perception of urban parks. By examining visitor sentiments and their correlation with specific park features, we aim to identify key factors that contribute to a positive park experience during these unprecedented times.
Before the pandemic, nature parks, especially those like Gongqing Forest Park, attracted the highest positive sentiments. However, the pandemic saw a shift in preferences, with an increased appreciation for neighborhood parks. This change was statistically significant for neighborhood parks, but not for others. Analyzing parks’ attributes revealed that before the pandemic, visitors were drawn to parks with larger grassland and water body areas, extensive walking paths, and proximity to shopping facilities. Post-pandemic, while water bodies remained a significant attractor, the emphasis shifted towards better walking accessibility and the proximity of amenities, likely due to the pandemic’s influence on outdoor activities and the value of nearby conveniences after lockdowns.
In light of these findings, it becomes evident that strategic interventions can enhance user experience and positive sentiment in urban parks, particularly in a post-COVID-19 context. Emphasis should be placed on the development and maintenance of neighborhood parks, which saw a significant surge in positive sentiment during the pandemic. Key attributes that correlate with positive sentiment, including the presence of grasslands and water bodies, walking path density, walking accessibility, and proximate shopping facilities, should be integrated and optimized in park designs. The utility of social media data for sentiment analysis also underscores the potential for its use in active park management, visitor engagement, and feedback collection. In the post-COVID-19 era, ongoing research and monitoring of visitor sentiment remain critical. This will ensure urban parks continue to be responsive to user needs, thus contributing to urban resilience amidst ongoing and future challenges.
The unprecedented experiences of the COVID-19 pandemic have been indelibly imprinted on the collective memory of our society, influencing behaviors and preferences in the use of urban green spaces. Our research indicates that the pandemic has not only altered current preferences but is likely to have a lasting impact on future generations, who have witnessed a significant shift in the role of urban parks. As new generations grow up with the collective memory of the pandemic’s challenges, the emphasis on accessible, multifunctional, and health-promoting green spaces is expected to persist. Long-term city planning must, therefore, anticipate these enduring shifts, integrating the lessons learned from the pandemic to create urban parks that are adaptable, resilient, and capable of meeting the needs of a society that values green spaces for their role in enhancing quality of life, promoting well-being, and fostering community resilience.>
While this study has yielded significant findings about the relationship between urban park characteristics and visitor sentiment, particularly in the context of the COVID-19 pandemic, there are certain limitations that future research could address. For one, our sentiment analysis was based on Sina Weibo data, which, though rich in content, may not fully encapsulate the range of visitor sentiment as it excludes those who do not use this social media platform [83]. Future studies could incorporate additional data sources or employ mixed methods research to capture a more comprehensive picture of visitor sentiment. Moreover, our study primarily focused on Shanghai’s parks, limiting the generalizability of our findings to other urban contexts in China or globally. Future research could consider comparative studies across different cities or countries to account for variations in park infrastructure, cultural preferences, and social behaviors. Additionally, the impact of the COVID-19 pandemic on visitor sentiment and preferences for park types is an emerging area of inquiry that deserves further exploration [84]. As we move further from the immediate effects of the pandemic, it will be crucial to investigate whether the trends identified in this study persist, intensify, or reverse over time. Finally, we identified several park attributes significantly correlated with the positive sentiment ratio. However, there may be other attributes not considered in this study that could influence visitor sentiment, such as park maintenance, safety, and programming. Future work could delve into these factors to provide a more nuanced understanding of what makes urban parks appealing to visitors in different circumstances. This research could help inform urban planning strategies and park design to enhance their value for urban residents in the post-pandemic era.
Author Contributions
Conceptualization, B.D. and S.L.; methodology, S.L.; software, S.L. and Y.Z.; validation, S.L. and B.D.; formal analysis, S.L.; investigation, S.L.; resources, S.L.; data curation, S.L.; writing—original draft preparation, S.L.; writing—review and editing, B.D.; visualization, S.L.; supervision, B.D.; project administration, B.D.; funding acquisition, B.D. All authors have read and agreed to the published version of the manuscript.
Funding
This research received no external funding.
Institutional Review Board Statement
Not applicable.
Informed Consent Statement
Not applicable.
Data Availability Statement
The data presented in this study are available on request from the corresponding author.
Acknowledgments
We appreciate the constructive suggestions from the anonymous reviewers.
Conflicts of Interest
The authors declare no conflict of interest.
References
- Rigolon, A. A complex landscape of inequity in access to urban parks: A literature review. Landsc. Urban Plan. 2016, 153, 160–169. [Google Scholar] [CrossRef]
- Cheng, Y.; Zhang, J.; Wei, W.; Zhao, B. Effects of urban parks on residents’ expressed happiness before and during the COVID-19 pandemic. Landsc. Urban Plan. 2021, 212, 104118. [Google Scholar] [CrossRef] [PubMed]
- Dizdaroğlu, D. Developing Design Criteria for Sustainable Urban Parks: Sustainable Urban Parks. Alanya Hamdullah Emin Pasa Univ. 2021, 6, 69–81. [Google Scholar]
- Sullivan, W.C.; Chang, C.Y. Landscapes and human health. Int. J. Environ. Res. Public Health 2017, 14, 1212. [Google Scholar] [CrossRef] [PubMed]
- Samus, A.; Freeman, C.; Van Heezik, Y.; Krumme, K.; Dickinson, K.J. How do urban green spaces increase well-being? The role of perceived wildness and nature connectedness. J. Environ. Psychol. 2022, 82, 101850. [Google Scholar] [CrossRef]
- Lai, S.; Deal, B. Parks, Green Space, and Happiness: A Spatially Specific Sentiment Analysis Using Microblogs in Shanghai, China. Sustainability 2022, 15, 146. [Google Scholar] [CrossRef]
- Diener, E.; Chan, M.Y. Happy people live longer: Subjective well-being contributes to health and longevity. Appl. Psychol. Health Well-Being 2011, 3, 1–43. [Google Scholar] [CrossRef]
- Iacus, S.M.; Porro, G.; Salini, S.; Siletti, E. Social networks, happiness and health: From sentiment analysis to a multidimensional indicator of subjective well-being. arXiv 2015, arXiv:1512.01569. [Google Scholar]
- Shuib, K.B.; Hashim, H.; Nasir, N.A.M. Community participation strategies in planning for urban parks. Procedia-Soc. Behav. Sci. 2015, 168, 311–320. [Google Scholar] [CrossRef]
- Mullenbach, L.E.; Baker, B.L.; Benfield, J.; Hickerson, B.; Mowen, A.J. Assessing the relationship between community engagement and perceived ownership of an urban park in Philadelphia. J. Leis. Res. 2019, 50, 201–219. [Google Scholar] [CrossRef]
- Li, Y.; Fan, S.; Li, K.; Zhang, Y.; Kong, L.; Xie, Y.; Dong, L. Large urban parks summertime cool and wet island intensity and its influencing factors in Beijing, China. Urban For. Urban Green. 2021, 65, 127375. [Google Scholar] [CrossRef]
- Poortinga, W.; Bird, N.; Hallingberg, B.; Phillips, R.; Williams, D. The role of perceived public and private green space in subjective health and wellbeing during and after the first peak of the COVID-19 outbreak. Landsc. Urban Plan. 2021, 211, 104092. [Google Scholar] [CrossRef] [PubMed]
- Ugolini, F.; Massetti, L.; Calaza-Martínez, P.; Cariñanos, P.; Dobbs, C.; Ostoić, S.K.; Marin, A.M.; Pearlmutter, D.; Saaroni, H.; Šaulienė, I.; et al. Effects of the COVID-19 pandemic on the use and perceptions of urban green space: An international exploratory study. Urban For. Urban Green. 2020, 56, 126888. [Google Scholar] [CrossRef] [PubMed]
- Ugolini, F.; Massetti, L.; Pearlmutter, D.; Sanesi, G. Usage of urban green space and related feelings of deprivation during the COVID-19 lockdown: Lessons learned from an Italian case study. Land Use Policy 2021, 105, 105437. [Google Scholar] [CrossRef] [PubMed]
- Zhu, J.; Xu, C. Sina microblog sentiment in Beijing city parks as measure of demand for urban green space during the COVID-19. Urban For. Urban Green. 2021, 58, 126913. [Google Scholar] [CrossRef]
- Venter, Z.S.; Barton, D.N.; Gundersen, V.; Figari, H.; Nowell, M.S. Back to nature: Norwegians sustain increased recreational use of urban green space months after the COVID-19 outbreak. Landsc. Urban Plan. 2021, 214, 104175. [Google Scholar] [CrossRef]
- Kadiwar, S.; Smith, J.J.; Ledot, S.; Johnson, M.; Bianchi, P.; Singh, N.; Montanaro, C.; Gatzoulis, M.; Shah, N.; Ukor, E.F. Were pregnant women more affected by COVID-19 in the second wave of the pandemic? Lancet 2021, 397, 1539–1540. [Google Scholar] [CrossRef]
- Maury-Mora, M.; Gómez-Villarino, M.T.; Varela-Martínez, C. Urban green spaces and stress during COVID-19 lockdown: A case study for the city of Madrid. Urban For. Urban Green. 2022, 69, 127492. [Google Scholar] [CrossRef]
- Yao, Y.; Lu, Y.; Guan, Q.; Wang, R. Can parkland mitigate mental health burden imposed by the COVID-19? A national study in China. Urban For. Urban Green. 2022, 67, 127451. [Google Scholar] [CrossRef]
- Meerow, S.; Newell, J.P.; Stults, M. Defining urban resilience: A review. Landsc. Urban Plan. 2016, 147, 38–49. [Google Scholar] [CrossRef]
- Bubalo, M.; van Zanten, B.T.; Verburg, P.H. Crowdsourcing geo-information on landscape perceptions and preferences: A review. Landsc. Urban Plan. 2019, 184, 101–111. [Google Scholar] [CrossRef]
- Lu, J.; Huang, X.; Kupfer, J.A.; Xiao, X.; Li, Z.; Wei, H.; Wang, S.; Zhu, L. Spatial, temporal, and social dynamics in visitation to US national parks: A big data approach. Tour. Manag. Perspect. 2023, 48, 101143. [Google Scholar]
- Fernandez, J.; Song, Y.; Padua, M.; Liu, P. A framework for urban parks: Using social media data to assess Bryant Park, New York. Landsc. J. 2022, 41, 15–29. [Google Scholar] [CrossRef]
- Kong, L.; Liu, Z.; Pan, X.; Wang, Y.; Guo, X.; Wu, J. How do different types and landscape attributes of urban parks affect visitors’ positive emotions? Landsc. Urban Plan. 2022, 226, 104482. [Google Scholar] [CrossRef]
- Plunz, R.A.; Zhou, Y.; Vintimilla, M.I.C.; Mckeown, K.; Yu, T.; Uguccioni, L.; Sutto, M.P. Twitter sentiment in New York City parks as measure of well-being. Landsc. Urban Plan. 2019, 189, 235–246. [Google Scholar] [CrossRef]
- Huang, Y.; Li, Z.; Huang, Y. User perception of public parks: A pilot study integrating spatial social media data with park management in the City of Chicago. Land 2022, 11, 211. [Google Scholar] [CrossRef]
- Nemes, L.; Kiss, A. Social media sentiment analysis based on COVID-19. J. Inf. Telecommun. 2021, 5, 1–15. [Google Scholar] [CrossRef]
- Johnson, M.L.; Campbell, L.K.; Svendsen, E.S.; McMillen, H.L. Mapping urban park cultural ecosystem services: A comparison of twitter and semi-structured interview methods. Sustainability 2019, 11, 6137. [Google Scholar] [CrossRef]
- Martí, P.; Serrano-Estrada, L.; Nolasco-Cirugeda, A. Social media data: Challenges, opportunities and limitations in urban studies. Comput. Environ. Urban Syst. 2019, 74, 161–174. [Google Scholar] [CrossRef]
- Zabelskyte, G.; Kabisch, N.; Stasiskiene, Z. Patterns of urban green space use applying social media data: A systematic literature review. Land 2022, 11, 238. [Google Scholar] [CrossRef]
- Huai, S.; Liu, S.; Zheng, T.; de Voorde, T.V. Are social media data and survey data consistent in measuring park visitation, park satisfaction, and their influencing factors? A case study in Shanghai. Urban For. Urban Green. 2023, 81, 127869. [Google Scholar] [CrossRef]
- Sim, J.; Miller, P. Understanding an urban park through big data. Int. J. Environ. Res. Public Health 2019, 16, 3816. [Google Scholar] [CrossRef]
- Shi, Q.; Zhuo, L.; Tao, H.; Li, Q. Mining hourly population dynamics by activity type based on decomposition of sequential snapshot data. Int. J. Digit. Earth 2022, 15, 1395–1416. [Google Scholar] [CrossRef]
- Gungor, S.; Polat, A.T. Relationship between visual quality and landscape characteristics in urban parks. J. Environ. Prot. Ecol. 2018, 19, 939–948. [Google Scholar]
- Hull, R.B., IV; Harvey, A. Explaining the emotion people experience in suburban parks. Environ. Behav. 1989, 21, 323–345. [Google Scholar] [CrossRef]
- Methorst, J.; Rehdanz, K.; Mueller, T.; Hansjürgens, B.; Bonn, A.; Böhning-Gaese, K. The importance of species diversity for human well-being in Europe. Ecol. Econ. 2021, 181, 106917. [Google Scholar] [CrossRef]
- Lee, S.; Jin, N.; Lee, H. The moderating role of water park service quality, environment, image, and food quality on perceived value and customer loyalty: A South Korean case study. J. Qual. Assur. Hosp. Tour. 2014, 15, 19–43. [Google Scholar] [CrossRef]
- Liu, S.; Lai, S.Q.; Liu, C.; Jiang, L. What influenced the vitality of the waterfront open space? A case study of Huangpu River in Shanghai, China. Cities 2021, 114, 103197. [Google Scholar] [CrossRef]
- Tema, S.K.T. Examining the impact of visitors’ emotions and perceived quality towards satisfaction and revisit intention to theme parks. J. Pengur. 2012, 35, 97–109. [Google Scholar]
- Li, N.; Zhou, S.; Margenot, A.J. From prairie to crop: Spatiotemporal dynamics of surface soil organic carbon stocks over 167 years in Illinois, U.S.A. Sci. Total Environ. 2023, 857, 159038. [Google Scholar] [CrossRef]
- Masullo, M.; Cioffi, F.; Li, J.; Maffei, L.; Scorpio, M.; Iachini, T.; Ruggiero, G.; Malferà, A.; Ruotolo, F. An Investigation of the Influence of the Night Lighting in a Urban Park on Individuals’ Emotions. Sustainability 2022, 14, 8556. [Google Scholar] [CrossRef]
- Zhou, Y.; Dai, P.; Zhao, Z.; Hao, C.; Wen, Y. The Influence of Urban Green Space Soundscape on the Changes of Citizens’ Emotion: A Case Study of Beijing Urban Parks. Forests 2022, 13, 1928. [Google Scholar] [CrossRef]
- CJJ/T 85-2017; Standard for Classification of Urban Green Space. People’s Republic of China National Standard: Beijing, China, 2017.
- Chen, Y.; Liu, X.; Gao, W.; Wang, R.Y.; Li, Y.; Tu, W. Emerging social media data on measuring urban park use. Urban For. Urban Green. 2018, 31, 130–141. [Google Scholar] [CrossRef]
- Gers, F.A.; Schmidhuber, J.J.U.; Cummins, F. Learning to Forget: Continual Prediction with LSTM. Neural Comput. 1999, 12, 2451–2471. [Google Scholar] [CrossRef] [PubMed]
- Minaee, S.; Azimi, E.; Abdolrashidi, A. Deep-Sentiment: Sentiment Analysis Using Ensemble of CNN and Bi-LSTM Models. arXiv 2019, arXiv:1904.04206. [Google Scholar]
- Nadkarni, P.M.; Ohno-Machado, L.; Chapman, W.W. Natural language processing: An introduction. J. Am. Med. Inform. Assoc. 2011, 18, 544–551. [Google Scholar] [CrossRef] [PubMed]
- Yang, Y.; Lu, Y.; Yang, L.; Gou, Z.; Liu, Y. Urban greenery cushions the decrease in leisure-time physical activity during the COVID-19 pandemic: A natural experimental study. Urban For. Urban Green. 2021, 62, 127136. [Google Scholar] [CrossRef]
- Fisher, M.J.; Marshall, A.P. Understanding descriptive statistics. Aust. Crit. Care 2009, 22, 93–97. [Google Scholar] [CrossRef]
- Hsu, H.; Lachenbruch, P.A. Paired t test. In Wiley StatsRef: Statistics Reference Online; Wiley: Hoboken, NJ, USA, 2014. [Google Scholar]
- Segal, M.R. Machine Learning Benchmarks and Random Forest Regression; University of California: San Francisco, CA, USA, 2004. [Google Scholar]
- GB50220–95; Urban Traffic Planning and Design Specifications Applicable to the Various Types of an Urban Road Traffic Planning and Design. People’s Republic of China National Standard: Beijing, China, 1995.
- De Vries, S.; Nieuwenhuizen, W.; Farjon, H.; Van Hinsberg, A.; Dirkx, J. In which natural environments are people happiest? Large-scale experience sampling in the Netherlands. Landsc. Urban Plan. 2021, 205, 103972. [Google Scholar] [CrossRef]
- Baur, J.W.R.; Tynon, J.F. Small-scale urban nature parks: Why should we care? Leis. Sci. 2010, 32, 195–200. [Google Scholar] [CrossRef]
- Johns, R.A.; Pontes, R. Parks, rhetoric and environmental education: Challenges and opportunities for enhancing ecoliteracy. J. Outdoor Environ. Educ. 2019, 22, 1–19. [Google Scholar] [CrossRef]
- Morag, O.; Tal, T.; Rotem-Keren, T. Long-term educational programs in nature parks: Characteristics, outcomes and challenges. Int. J. Environ. Sci. Educ. 2013, 8, 427–449. [Google Scholar]
- Kümmerling, M.; Müller, N. The relationship between landscape design style and the conservation value of parks: A case study of a historical park in Weimar, Germany. Landsc. Urban Plan. 2012, 107, 111–117. [Google Scholar] [CrossRef]
- Säumel, I.; Kowarik, I.; Butenschön, S. Green traces from past to future: The interplay of culture and ecological processes in European historical parks. In Proceedings of the II International Conference on Landscape and Urban Horticulture 881, Bologna, Italy, 9–13 June 2009; pp. 933–938. [Google Scholar]
- Willemse, L. Some perceptions and preferences of residents’ use of community neighbourhood parks in Mitchells Plain, Cape Town. Town Reg. Plan. 2015, 66, 15–30. [Google Scholar]
- Sung, H.; Kim, W.R.; Oh, J.; Lee, S.; Lee, P.S.H. Are All Urban Parks Robust to the COVID-19 Pandemic? Focusing on Type, Functionality, and Accessibility. Int. J. Environ. Res. Public Health 2022, 19, 6062. [Google Scholar] [CrossRef] [PubMed]
- Kaźmierczak, A. The contribution of local parks to neighbourhood social ties. Landsc. Urban Plan. 2013, 109, 31–44. [Google Scholar] [CrossRef]
- Gomez, E.; Baur, J.W.R.; Hill, E.; Georgiev, S. Urban parks and psychological sense of community. J. Leis. Res. 2015, 47, 388–398. [Google Scholar] [CrossRef]
- Sturm, R.; Cohen, D. Proximity to urban parks and mental health. J. Ment. Health Policy Econ. 2014, 17, 19. [Google Scholar]
- Honey-Rosés, J.; Anguelovski, I.; Chireh, V.K.; Daher, C.; Konijnendijk van den Bosch, C.; Litt, J.S.; Mawani, V.; McCall, M.K.; Orellana, A.; Oscilowicz, E.; et al. The impact of COVID-19 on public space: An early review of the emerging questions–design, perceptions and inequities. Cities Health 2021, 5, S263–S279. [Google Scholar] [CrossRef]
- Hugelius, K.; Harada, N.; Marutani, M. Consequences of visiting restrictions during the COVID-19 pandemic: An integrative review. Int. J. Nurs. Stud. 2021, 121, 104000. [Google Scholar] [CrossRef]
- Deng, L.; Li, X.; Luo, H.; Fu, E.K.; Ma, J.; Sun, L.X.; Huang, Z.; Cai, S.Z.; Jia, Y. Empirical study of landscape types, landscape elements and landscape components of the urban park promoting physiological and psychological restoration. Urban For. Urban Green. 2020, 48, 126488. [Google Scholar] [CrossRef]
- Manteghi, G.; bin Limit, H.; Remaz, D. Water bodies an urban microclimate: A review. Mod. Appl. Sci. 2015, 9, 1. [Google Scholar] [CrossRef]
- Setälä, H.; Francini, G.; Allen, J.; Jumpponen, A.; Hui, N.; Kotze, D.J. Urban parks provide ecosystem services by retaining metals and nutrients in soils. Environ. Pollut. 2017, 231, 451–461. [Google Scholar] [CrossRef] [PubMed]
- Huai, S.; de Voorde, T.V. Which environmental features contribute to positive and negative perceptions of urban parks? A cross-cultural comparison using online reviews and Natural Language Processing methods. Landsc. Urban Plan. 2022, 218, 104307. [Google Scholar] [CrossRef]
- Lo, A.Y.H.; Jim, C.Y. Differential community effects on perception and use of urban greenspaces. Cities 2010, 27, 430–442. [Google Scholar] [CrossRef]
- Liang, H.; Chen, D.; Zhang, Q. Walking accessibility of urban parks in a compact megacity. Proc. Inst. Civ. Eng.-Urban Des. Plan. 2017, 170, 59–71. [Google Scholar] [CrossRef]
- Ayala-Azcárraga, C.; Diaz, D.; Zambrano, L. Characteristics of urban parks and their relation to user well-being. Landsc. Urban Plan. 2019, 189, 27–35. [Google Scholar] [CrossRef]
- Palliwoda, J.; Kowarik, I.; von der Lippe, M. Human-biodiversity interactions in urban parks: The species level matters. Landsc. Urban Plan. 2017, 157, 394–406. [Google Scholar] [CrossRef]
- Santos, T.; Mendes, R.N.; Vasco, A. Recreational activities in urban parks: Spatial interactions among users. J. Outdoor Recreat. Tour. 2016, 15, 1–9. [Google Scholar] [CrossRef]
- Witten, K.; Exeter, D.; Field, A. The quality of urban environments: Mapping variation in access to community resources. Urban Stud. 2003, 40, 161–177. [Google Scholar] [CrossRef]
- Zhang, S.; Yu, P.; Chen, Y.; Jing, Y.; Zeng, F. Accessibility of Park Green Space in Wuhan, China: Implications for Spatial Equity in the Post-COVID-19 Era. Int. J. Environ. Res. Public Health 2022, 19, 5440. [Google Scholar] [CrossRef] [PubMed]
- Kang, N.; Bell, S.; Thompson, C.W.; Zheng, M.; Xu, Z.; Sun, Z. Use of urban residential community parks for stress management during the COVID-19 lockdown period in China. Front. Psychol. 2022, 13, 915. [Google Scholar] [CrossRef] [PubMed]
- Ren, X. Pandemic and lockdown: A territorial approach to COVID-19 in China, Italy and the United States. Eurasian Geogr. Econ. 2020, 61, 423–434. [Google Scholar] [CrossRef]
- Peters, K.; Elands, B.; Buijs, A. Social interactions in urban parks: Stimulating social cohesion? Urban For. Urban Green. 2010, 9, 93–100. [Google Scholar] [CrossRef]
- De Haas, M.; Faber, R.; Hamersma, M. How COVID-19 and the Dutch ‘intelligent lockdown’change activities, work and travel behaviour: Evidence from longitudinal data in the Netherlands. Transp. Res. Interdiscip. Perspect. 2020, 6, 100150. [Google Scholar]
- Voigt, A.; Kabisch, N.; Wurster, D.; Haase, D.; Breuste, J. Structural diversity: A multi-Dimensional approach to assess recreational services in urban parks. Ambio 2014, 43, 480–491. [Google Scholar] [CrossRef] [PubMed]
- Parente, G.; Bovolenta, S. The role of grassland in rural tourism and recreation in Europe. Grassland Sci. Eur. 2012, 17, 733–743. [Google Scholar]
- Wang, J.; Zhou, Y.; Zhang, W.; Evans, R.; Zhu, C. Concerns expressed by Chinese social media users during the COVID-19 pandemic: Content analysis of sina weibo microblogging data. J. Med. Internet Res. 2020, 22, e22152. [Google Scholar] [CrossRef]
- Park, I.J.; Kim, J.; Kim, S.S.; Lee, J.C.; Giroux, M. Impact of the COVID-19 pandemic on travelers’ preference for crowded versus non-crowded options. Tour. Manag. 2021, 87, 104398. [Google Scholar] [CrossRef]


Disclaimer/Publisher’s Note: The statements, opinions and data contained in all publications are solely those of the individual author(s) and contributor(s) and not of MDPI and/or the editor(s). MDPI and/or the editor(s) disclaim responsibility for any injury to people or property resulting from any ideas, methods, instructions or products referred to in the content. |
© 2023 by the authors. Licensee MDPI, Basel, Switzerland. This article is an open access article distributed under the terms and conditions of the Creative Commons Attribution (CC BY) license (https://creativecommons.org/licenses/by/4.0/).