Article

Effect of the Cultivation Method and the Distance from a Steel Mill on the Content of Heavy Metals in Bell Pepper Fruit

Department of Ecology, Climatology and Air Pollution, University of Agriculture in Krakow, Mickiewicz Av. 24/28, 30-059 Krakow, Poland
*
Author to whom correspondence should be addressed.
Sustainability 2023, 15(23), 16400; https://doi.org/10.3390/su152316400
Submission received: 3 October 2023 / Revised: 21 November 2023 / Accepted: 22 November 2023 / Published: 29 November 2023

Abstract

:
Vegetables grown in areas affected by industrial emissions may be subject to contamination with heavy metals. In the present study, this issue was investigated in sweet pepper grown using two different methods and at various distances from a steel mill. Four sites, designated Ko, Po, Wa, and Ru, located at distances of 3.5, 6, 11, and 18 km from a steel mill, were selected for the study. The contents of zinc, copper, nickel, manganese, cadmium, chromium, and lead were determined in the pepper fruits and in the soil. Peppers grown in the vicinity of a steel mill had acceptable contents of all the elements analysed; only cadmium concentrations were excessive for food plants. The study confirmed the effect of a plastic greenhouse on the concentrations of metals in the analysed pepper fruits, whereas the cultivation method had no statistically significant effect on the levels of the elements in the soil. The distance factor also affected the concentrations of metals in the peppers and soil, but to a lesser extent than the cultivation method. The combined effect of both factors was the least pronounced, for all elements in the fruits and in the soil.

Graphical Abstract

1. Introduction

Vegetables and fruit occupy an important position in human nutrition and are included among the basic recommended components of our diet. They generally have low caloric value but contain large amounts of vitamins, minerals, pectin, dietary fibre, organic acids, and simple sugars, as well as various compounds—tertiary metabolites—which are of medicinal use for humans or may prove to be in the future [1,2,3,4,5]. In this regard, there are two situations that can pose a threat to human health and life. The first is a deficiency of vegetables and fruit in the contemporary diet, and the second is the potential contamination of this food. In this case, fruit and vegetables do not nourish the human body but become a source of toxins for it, such as heavy metals [6,7], pesticide residues [8], or nitrates [9,10]. For this reason, it is essential to monitor the quantity and quality of vegetables and fruit used for human consumption. With respect to metals, this monitoring takes into account the presence of both nutrient elements such as Fe, Mn, Cu, Zn, Cr, and Ni, which, however, can become toxic in excessive amounts, and metals, which are toxic in any amount, such as Pb, Cd, or Hg [11,12]. In past centuries, with the development of cities, the production of fruits and vegetables developed in their vicinity. This was due to simple economic profitability; the neighbouring city was a large market for these products, which were picked early in the morning and reached the consumer’s table in time for breakfast. Another factor was the freshness of locally produced fruits and vegetables. However, together with the industrialization of the metropolis, in many cases, suburban areas of vegetable and fruit cultivation were in the vicinity of industrial plants. This meant that in addition to emissions associated with the functioning of cities (waste, wastewater, and transport), they became exposed to industrial pollution and thus the currently observed problem of contamination of the air, soil, water, and, ultimately, the crops themselves [13,14,15]. One of the areas affected by intensive industrialization in the 20th century was the Nowa Huta region in Krakow (southern Poland). In the 1950s, a steel mill was built on typical agricultural land. In this region, due to the presence of fertile soils and a local heat island, ground vegetables have been cultivated for a great many years. One of the most commonly grown vegetables, both in the ground and under cover, is the bell pepper.
Plastic greenhouses were first applied in agriculture in the 1960s, just after chemists managed to control polymerization in line with plastic production. The first research publications were dedicated to creating conditions friendly to the chosen plant. They belonged to agronomy, agrometeorology, and agroengineering [16,17,18]. After forty or fifty years of plastic greenhouse use, studies started to be published that were dedicated to greenhouse soil degradation, stress on microbial communities, and cultivated plant contamination [19,20]. The studies were dedicated to long-term, permanent greenhouse cultivation, with high fertiliser and pesticide use.
The aim of this study was to assess the effects of the cultivation method and the distance from a source of emissions on the content of heavy metals in bell pepper fruits.
The following scientific questions were put forward:
-
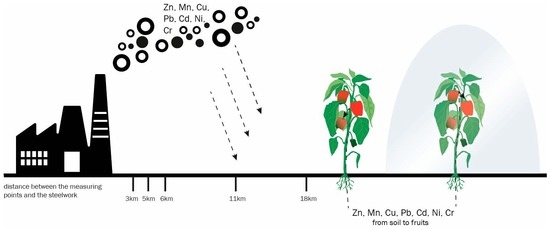
Does the cultivation method (ground and plastic greenhouses) influence the content of heavy metals in pepper fruits and in the soil? Acronyms: q.cultvat. and q.soil.cultivat. Does the location of the cultivation (the distance from the steel mill) influence the content of heavy metals in pepper fruits and in the soil? Acronyms: q.locat. and q.soil.locat.
-
Is there a combined effect of both of these factors on bell pepper fruits and on the soil? Acronyms: q.interact. and q.soil.interact.
-
Does the date of the harvest of the bell peppers influence the content of heavy metals in the fruits? The shorter the time it takes for the fruit to grow and ripen, the lower the level of accumulation of metals. Acronyms: q.harvest.date.
Apart from the scientific consideration of these questions, there is also a utilitarian aspect to the polygon where the research was carried out. It is connected to agronomy, food supply (including storage and transport), food quality and quality, and, finally, the economy of all of the previously mentioned chains. Sustainability is both an idea and a way of acting supported by three pillars: social, economic, and environmental [21]. The utilitarian question can therefore be asked: is sustainability a tool able to maintain a friendly balance and manage the above-mentioned aspects?

2. Materials and Methods

2.1. Study Area

The study area was located in southern Poland (European Union), east of the city of Krakow, in the valley of the River Vistula. It is a typical area of agricultural production, which is carried out at an advanced level. The soils are of high valuation classes (I–IIIa)—chernozem and alluvial soils on loess and alluvial soils. The microclimate is favourable for crops because the growing season is several days longer than in other parts of Poland, reaching 230 days. Natural irrigation is provided by the River Vistula and loess rock. Under these conditions, the region has been used for agricultural purposes for at least a thousand years. The traditional cultivation of nightshades, leafy cruciferous vegetables, root vegetables of the family Apiaceae, and fruits of the rose family in this region dates back at least two centuries [22,23,24,25]. For centuries, the area has fed the inhabitants of Krakow and contributed to the city’s economic development. Today, the population of the city exceeds 1 million. In the 1950s, a steel mill was built here. Its construction, subsequent expansion, and operation took place in violation of all principles later named within the parameters of sustainability. The peak annual steel production at the mill was 6,600,000 t, and dust emissions amounted to 100,000 t, including around 39 t Pb and 2 t Cd. These levels of production and pollution were reached in the year 1975. The final average annual production emissions during the period 1975 to 1999 were as follows: steel production 3,210,000 t; dust emission 26,846 t; lead emission 11.663 t, and cadmium emission 0.606 t [23,24]. Following a period of democratic changes in Europe in the late 1980s, a number of pro-environmental changes were undertaken at the plant. As a result, production, i.e., the assortment and quantity of steel, was adjusted to the needs of the Polish market [26,27,28]. This caused a significant decrease in production and an even greater decrease in pollution emissions [27,29,30,31]. In the 1970s, 1980s, and 1990s, vegetable production in the area was significantly superregional. Vegetable sales encompassed not only the Krakow metropolitan area, but also the nearby Upper Silesia and even the capital, Warsaw. In the last two decades of the 20th century, the scope of vegetable sales changed, but their production did not decline. Tourists have become an important group as consumers of fruit and vegetables. More than 14 million tourists arrive in Krakow every year (data from prior to the COVID-19 pandemic), spending nearly 1.8 billion euros [32].

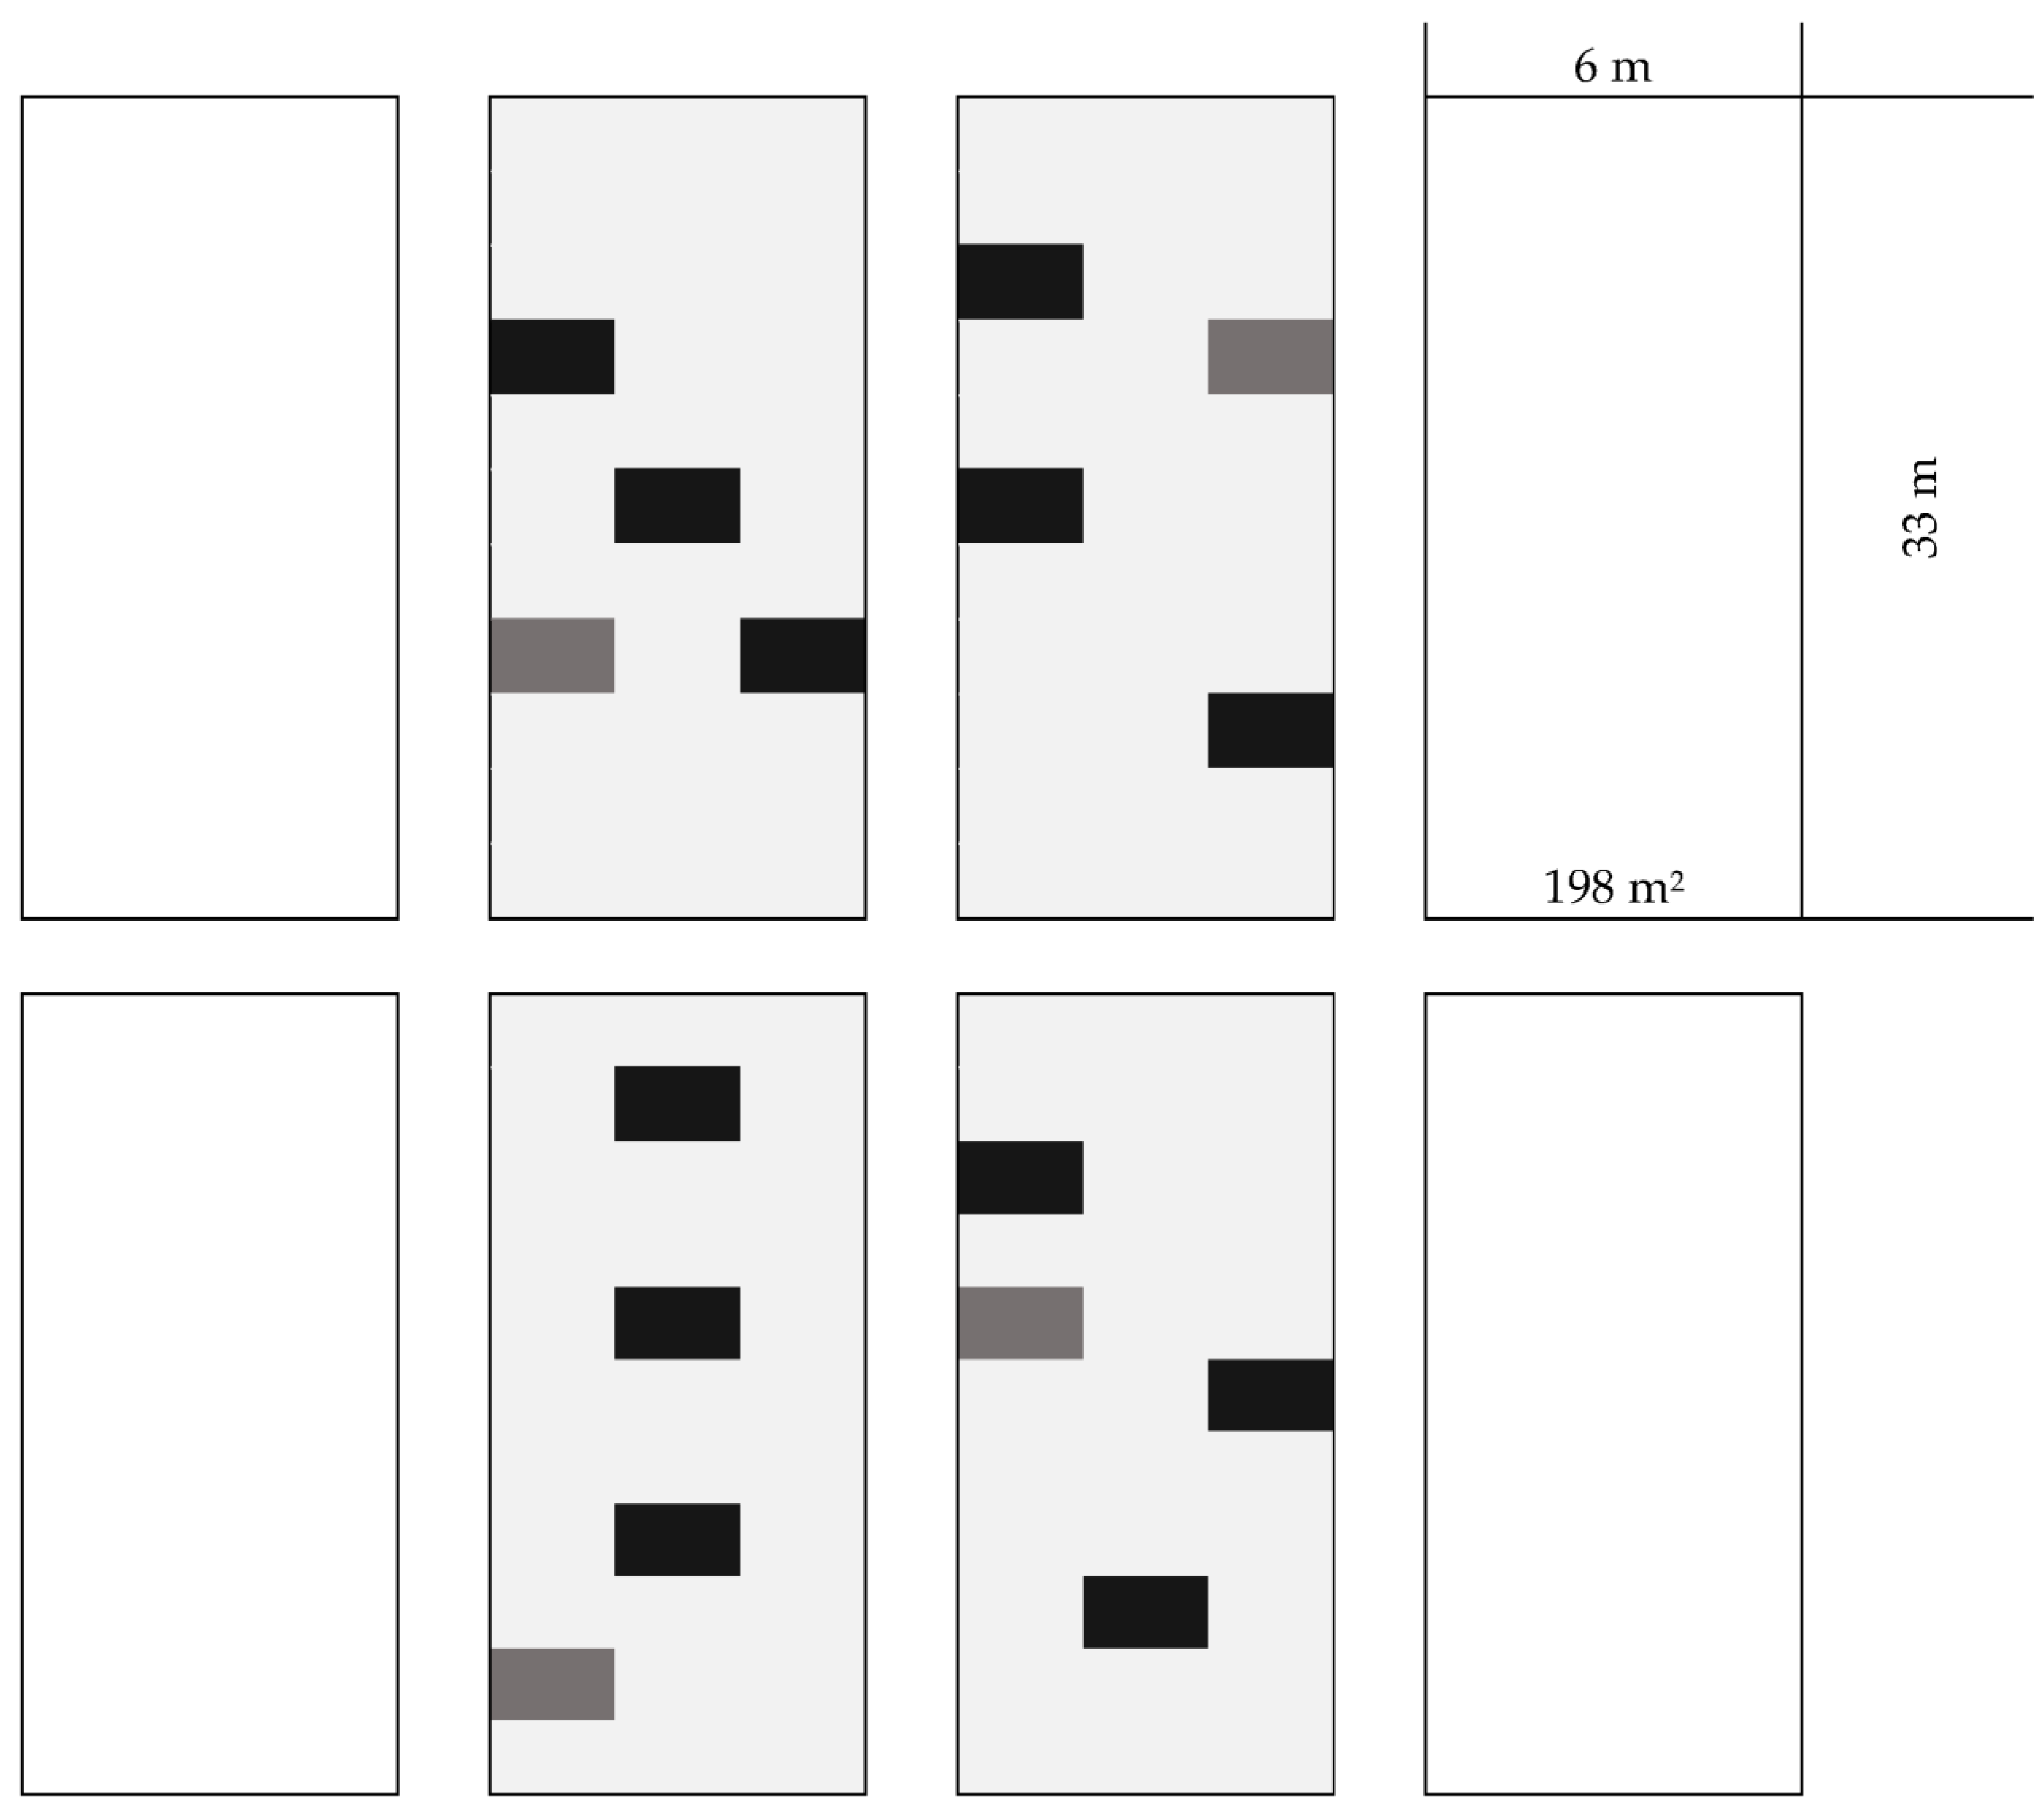
2.2. Field Experiment and Sampling

The study was carried out in the form of a field experiment, as part of the annual commercial cultivation of bell peppers (Capsicum annuum cv. Sprinter F1). The horticultural farms were located east of the steel mill, in the direction of the prevailing winds. Four locations were selected for the study. The first was located in the Kościelniki housing estate in Krakow (site abbreviation Ko), 3.5 km from the boundary of the steel mill; the second in the village of Pobiednik Wielki (site Po), at a distance of 6 km; the third in the village of Wawrzeńczyce (site Wa), at a distance of 11 km; and the fourth in the village of Rudno Wielkie (site Ru), 18 km from the steelworks. To facilitate a simple reading of the text, two-letter designations (one consonant and one vowel) are used in place of the Polish names of the study sites. To minimize the effect of motor vehicle pollution on the vegetables, crops situated no less than 100 m from the main thoroughfares were selected [33]. At each site, bell peppers were grown in the ground and in plastic greenhouses. Pepper cultivation under cover predominated on the farms, occupying 2–3 ha, while ground crops occupied 0.5–0.8 ha. Each farm had a greenhouse propagator in which pepper seedlings were produced. A locally modified plastic greenhouse of the type predominant in this area was used in the experiment. It consists of steel hoops covered with PE (polyethylene) sheeting. The greenhouses are 6 m wide, 33 m long, and only 1.6 m high. They are dismantled in winter and set up in the spring on a piece of arable field. During spring cold spells, adjacent greenhouses are often joined so that the length of the construction increases to 66 m or even 99 m. The plastic greenhouses used here had the task of increasing the temperature at the start of cultivation and thereby enabling the earlier planting of pepper seedlings and protecting them against spring ground frosts. The greenhouses were not heated. Mineral fertilization, soil cultivation, irrigation, and plant protection were standardized on all farms [34]. On each farm, two 792-m2 surfaces were selected—one for greenhouse cultivation and one for field cultivation. The 792-m2 area corresponds to the area occupied by four plastic greenhouses (Figure 1). Three sampling plots were randomly selected in each greenhouse, with 6 pepper plants growing on each plot (1.68 m2). To minimize the effect of ‘boundary conditions’ (differences in humidity, soil moisture, and temperature), the plots were located more than 3 m from the entrance to the greenhouse. Analogous to the greenhouse cultivation, a 792-m2 area was selected from each field crop and divided into four surfaces (198 m2 each), corresponding to the area of the greenhouse. On each of these, three plots (1.68 m2 each) with six pepper plants on each were randomly selected. The fruits were collected at three different times: first—the second 10-day period in July; second—the second 10-day period in August; third—the first 10-day period in September, determined by the stage of ripeness. Samples were taken in the evening, one day before commercial harvest. One fruit was taken from each of the six pepper plants, and the samples were placed in paper bags. The fruit sample weighed about 1300 g. Soil samples were taken with a soil sampler probe from the topsoil (0–20 cm) in each of the sampling plots from which pepper fruits were collected. In addition, a fourth soil sample was taken from both the greenhouse and the field, but from outside the sampling plots. The soil samples were taken as averaged samples, each of which consisted of 10 homogenized primary samples (insertions of the probe).

2.3. Laboratory Analyses

Soil and plant samples were placed in paper bags and transported to the laboratory, where the soil samples were air-dried, crushed in an agate mortar, and sieved through a polyethylene sieve with a 2-mm mesh size. A 10-g sample was weighed into a quartz evaporating dish. The weight of the sample was recorded to four decimal places and used to calculate the content of metal in the sample. The soil samples were then dissolved in a mixture of concentrated HNO3 and HClO4 (3:1), and HCl was used to extract the metal. The samples of pepper fruit were thoroughly washed under lukewarm running water and then rinsed with distilled water. Once the fruits had air-dried (on a cardboard tray), the sample was cut, the seed pod was removed, and the fruit was weighed for the determination of dry matter content. Then, the sample was dried in a forced air drying oven, at 45 °C for the first few hours and then at 80 °C. Once the sample had cooled, it was weighed again and then ground in a high-speed mill. A 4-g sample of plant material was weighed into a quartz evaporating dish for mineralization. The weight was recorded to four decimal places and used to calculate the content of metal in the sample. The pepper sample was incinerated in a muffle furnace at a temperature below 500 °C for about 6 h and then oxidized by adding 5 cm3 of concentrated nitric acid (HNO3). After the remainder of the acid had evaporated, the sample was again incinerated in the muffle furnace for about 4 h. When the sample had cooled, metals were extracted using concentrated HCl. The mineralized soil and pepper samples were quantitatively transferred through a medium filter to quartz glass volumetric flasks. Concentrations close to the total amounts of cadmium, chromium, manganese, nickel, lead, and zinc were determined in the samples of soil and pepper fruit. In addition, the soil pH was determined in water and in KCl using the potentiometric method, the particle size distribution was determined using the Casagrande method as modified by Prószyński, and organic matter content was determined using the Tyurin method. All samples were analysed for concentrations of heavy metals by atomic absorption spectroscopy (FASA) using a Unicam Solaar M6 spectrometer, with deuterium background correction and parameters according to the manufacturer’s guidelines. For quality control of the analyses, mineralization of each soil and pepper sample was performed in duplicate. When the relative standard deviation for the metal concentrations in the replicates was greater than 5%, the sample was mineralized for a third time. For each series of 18 samples, the metal content was analysed in a blank sample. The spectrophotometer was calibrated using Merck standards, and certified Merck materials were used for control of the analyses. Analytical-grade chemicals and reagents were used throughout the analyses. Only double-distilled water was used to prepare and dilute the reagents.

2.4. Statistical Analysis of the Data

The Shapiro–Wilk test was used to assess the normality of distributions. The research questions were transformed into hypotheses and they were tested by analysis of variance (F-test for acceptance or rejection of hypotheses and Tukey’s post hoc test for calculation of HSD). A two-way analysis of variance (distance and cultivation method) was performed. The level of significance of alpha = 0.05 was adopted. In addition, regression analysis was performed for the effect of distance on the content of heavy metals in the fruits and the effect of harvest date on the content of metals in the fruits.

3. Results and Discussion

3.1. Content of Heavy Metals in Soil

All four farms are situated on chernozem soils formed on loess rock. This is a loess belt extending from southern Russia westward through central Ukraine and southern Poland, including the Krakow area, up to south-eastern Germany [35]. The authors cited determined biogeochemical background values for cadmium in chernozem soils used for agriculture in Poland. The average content was determined to be 0.26 mg·kg−1 d.w., while the allowable limit is 0.48 mg·kg−1 d.w. The average cadmium content determined in the present study was in the range of 0.55–0.92 mg·kg−1 d.w. (Table 1). All of these concentrations were higher than the allowable limit, and the maximum content of 0.92 mg·kg−1 d.w. (Ko, greenhouse) was more than twice this value. These concentrations were also higher than the content of this metal (0.15 to 0.35 mg·kg−1 d.m.) reported by Lukin et al. for chernozem topsoil in southern Russia [36].
The average lead concentrations in the soils were in the range of 22.15–35.65 mg·kg−1 d.w. (Table 1). The average lead concentration in chernozem soils of southern Poland reported by Labaz et al. is 17.3 mg·kg−1 d.w., while the allowable limit is 20.9 mg·kg−1 d.w. [28]. Bezuglova et al. reported a similar value (20 mg·kg−1 d.w.) for the geochemical background for lead content in chernozem soils in Russia [37]. As in the case of cadmium, all concentrations of this metal in the study area exceeded the acceptable limits. The highest average Pb concentration in the soil from the plastic greenhouse in Ko was 1.7 times the limit. The average zinc concentrations were in the range of 47.07–91.49 mg·kg−1 d.w. According to Labaz et al., the average zinc content for uncontaminated chernozem soils in Poland is 47.6 mg·kg−1 d.w. [35]. This value is comparable to the average concentration of this metal in the soil of the village of Ru, used in both field cultivation and under cover (Table 1). The acceptable limit given by Labaz et al. for this element (57.7 mg·kg−1 d.w.) is similar to the zinc concentrations found in the present study at site Wa (both greenhouse and field) [28]. According to Bezuglova et al., the background value for zinc in chernozem soils is 60 mg·kg−1 d.w. [37]. The concentrations of this metal in the soils of sites Po and Ko exceed this value, even by 50%. The average copper concentrations in the soils of all study locations were very similar. The difference between the minimum and the maximum (for averages) was only 3.11 of a unit; i.e., 11% of the minimum value. Similarly, the coefficient of variation calculated for all single measurements was less than 8%. According to Labaz et al., the natural copper content of chernozem soils used for agriculture in southern Poland is 14.3 mg·kg−1 d.w., and the acceptable limit is 18.2 mg·kg−1 d.w. [35]. In the present study, the concentrations of this element were more than double the biogeochemical background value given by the authors. On the other hand, these concentrations are comparable to the background value of 30 mg·kg−1 d.w. adopted for Cu by Russian researchers for steppe soils in their country [37]. The average nickel concentrations ranged from 24.15 mg·kg−1 d.w. (Ru greenhouse) to 28.49 mg·kg−1 d.w. (Po greenhouse). The concentrations of this metal were significantly lower than the background value (45 mg·kg−1 d.w.) reported by Bezuglova et al. [37]. As in the case of copper, the coefficient of variation for all results was low, at 9%. The concentrations of this element were similar to the natural concentrations of Ni (24.1 mg·kg−1 d.w.) reported for Polish chernozem soils by Labaz et al. [35], and well below the acceptable limit (37.6 mg·kg−1 d.w.) reported by the authors. The average manganese concentrations ranged from 545.9 (Po, f) to 582.3 mg·kg−1 d.w. (Wa, pg). The minimum values were similar to the average manganese concentrations (541 mg·kg−1 d.w.) determined for chernozem soils by Labaz et al. [35], while the maximum concentrations were below the acceptable limit (741 mg·kg−1 d.w.) given by the same authors. However, the Mn concentrations in the soil were more than 30% higher than the values reported by Novykh et al. for the geochemical background (416 mg·kg−1) of chernozem soils of the Kursk region [38]. The average chromium concentrations in the soil in the study areas ranged from 23.8 mg·kg−1 d.w. to 31.91 mg·kg−1 d.w. The background concentrations for chernozem soils of Eastern Europe have been determined to be 100 mg·kg−1 d.w. [37]. This concentration is more than three times the maximum value determined in the present study (31.91 mg·kg−1 d.w.). The geochemical background value for chromium in chernozem soils of southern Poland has not been defined [35].
Two-way analysis of variance (ANOVA) was performed for the concentrations of heavy metals in the soil (separately for each metal) to verify whether the distance from the steel mill influenced the content of the metals in the soil (q.soil.locat.), whether the soil at the locations selected for field and greenhouse cultivation differed in the content of metals (q.soil.cultivat.), and whether the effect of the distance from the steel mill was modified by the cultivation method (interaction between the two factors—q.soil.interact.). Table 1 presents the probabilities for hypothesis stated to q.soil.interact., which is the most interesting for us in terms of the content of metals in the peppers; i.e., the interaction of cultivation method and distance in the bell pepper fruits (q.interact.). It must be strongly emphasized that no interaction was obtained for the most important elements in the assessment of the impact of the steel mill on the environment; i.e., cadmium, lead, and zinc. An interaction was only found for chromium and nickel, which are usually not included in assessments of the impact of a steel mill on the environment [29,39,40]. For hypothesis (effect of cultivation method, q.soil.cultivat.), statistically significant differences were obtained for chromium, p = 3.43 × 10⁻⁸, and copper, p = 0.0151. No statistically significant differences were obtained for the remaining metals (Ni, Cd, Mn, Pb, and Zn), which suggests that the locations of the study sites were well selected. For the hypothesis effect of distance (q.soil.locat.), the content of heavy metals was found to change according to three patterns as the distance from the steel mill increased:
-
It decreased or remained unchanged. This pattern was identified for cadmium, lead, chromium, and zinc. For the first three of these metals, the concentrations at the second farthest (Wa) and farthest (Ru) distance did not statistically differ, while for zinc there were no differences between the second (Po) and third (Wa) distances. Thus, it can be assumed that Ru and perhaps even Wa were the boundaries of the effect of the steel mill. This corresponds to research by Topolska et al., who reported a similar range of impact for this site (about 20 km) for cadmium and zinc in a study of the spleens of bank voles (Clethrionomys glareolus) [41]. González-Miqueo et al. studied the impact of iron works on mosses in the Basque Country, within a range of 2 km. However, they found that this was not the range of their strongest impact [40]. In the vicinity of the industrial centre of Portoscuso in Sardinia, elevated concentrations of metals in the moss Bryum radiculosum were noted at distances of 13 km [42].
-
In the second pattern, the distance from the steel mill had no effect on the content of manganese, with a probability of 0.097.
-
In the third pattern, the distance from the steel mill did not affect the concentrations of copper and nickel. For Cu, a significant difference was only shown between the concentrations determined at sites Ru and Wa (farthest and second farthest). For nickel, only the concentration in Po (second distance) was statistically significantly different.
Regression analysis was used for the mathematical verification of the relationship between distance and the content of cadmium, lead, and zinc in the soil; i.e., the elements the concentrations of which decrease or remain unchanged as the distance from the steel mill increases. Two functions were verified: exponential according to Schintu et al. [42] and Jankaitė et al. [43] and quadratic according to [33]. The latter function, with a higher square of the correlation coefficient, better describes the changes in the content of metals with increasing distance, both in the case of all measurements and for the mean and extreme values. For all data, R2 is about 0.5, whereas for the means and extremes, it is above 0.90.
The main environmental factors fundamentally influencing the concentrations of heavy metals in vegetables (besides the content of metals in the soil) include soil pH, organic matter content, and content of clay minerals [44,45,46,47]. The differences between pH values (separately for water and KCl) were small, and the relative standard deviation did not exceed 5%. The same applied to the particle size distribution and the organic matter content. Therefore, it was concluded that these physicochemical properties of the soil did not affect the content of metals in the fruits.

3.2. Content of Heavy Metals in Bell Pepper Fruits

The results for the content of metals in pepper fruits without regard to the harvest date (Table 2) and for three harvest dates at four localisations (Tables S1–S4 in Supplementary Materials).
The average concentrations of cadmium in the plants grown in the greenhouse ranged from 0.222 mg·kg−1 d.w. (site Ru) to 0.366 mg·kg−1 d.w. (site Ko), while in the field they ranged from 0.262 mg·kg−1 d.w. (site Ru) to 0.384 mg·kg−1 d.w. mg kg−1 d.w. (site Ko) (Table 2). A comparable range of concentrations of this metal (0.25–0.43 mg·kg−1 d.w.) was obtained for pepper fruits purchased from local producers in the Rafha region of Saudi Arabia [48]. Similar cadmium concentrations in pepper grown in the Istanbul region were reported by Osma et al. [49]. Extremely high cadmium concentrations in the fruits of this vegetable (4.30 mg·kg−1 d.w.) grown in an industrial region of China were reported by Wang et al. [39]. The average cadmium concentration in the plants ranged from 0.03 to 0.70 mg·kg−1 d.w. Symptoms of toxicity appear in sensitive plants at 5–10 mg·kg−1 d.w., but are not manifested in resistant plants until the concentration reaches 10–20 mg·kg−1 [50]. In the present study, the concentrations of this metal in the peppers can be observed to be within the average range for plants.
The average lead concentrations in the plants grown in the greenhouse ranged from 0.08 mg·kg−1 d.w. (sites Po and Wa) to 0.11 mg·kg−1 d.w. (sites Ko and Ru). Similarly, the concentrations obtained in the field ranged from 0.08 mg·kg−1 d.w. (sites Po and Wa) to 0.12 mg·kg−1 d.w. (sites Ko and Ru; Table 2). A comparable range of lead concentrations (0.08–0.2 mg·kg−1 d.w.) was reported for chili peppers grown in the Amritsar region in an area exposed to discharge of industrial and domestic wastewater [51]. Ahmad and Goni recorded extremely high lead concentrations (9.12–18.55 mg·kg−1 d.w.) in the fruits of peppers grown in the industrial district of Dhaka in Bangladesh [52]. Lead, as a typical trace element, is found in all abiotic and biotic components of the environment and is part of the phytomass of all plant species, with an average content of 2.5 mg·kg−1 in air-dry matter of terrestrial vegetation and 1.0 mg·kg−1 in living phytomass. A lead concentration of 5–10 mg·kg does not disturb the normal functioning of most plant species, but 30–300 mg·kg is toxic [52]. The average zinc concentrations in the fruits of greenhouse-grown peppers ranged from 18.31 (site Ru) to 27.39 mg·kg−1 d.w. (site Ko), while in the case of field cultivation they ranged from 22.03 mg·kg−1 d.w. (site Wa) to 31.61 mg·kg−1 d.w. (site Ko; Table 2). The concentrations obtained for this metal are comparable to values given for peppers by Ahmad and Goni, who studied vegetables grown in the industrial district of Dhaka in Bangladesh [53]. A similar range of zinc concentrations in vegetables grown in the province of Nevşeihr in Turkey was reported by Leblebici et al. [54]. Latif et al. reported similar concentrations of this element in cucurbits and leafy vegetables in the Indus Valley (Dera Ghazi Khan district in Pakistan) [55]. Such low concentrations, however, should be regarded as a deficiency of this element in the vegetables [50], as zinc is also an essential microelement for the development of plants (20–60 mg·kg−1), people (2–3 g per a human being), and animals [50,56]. The average copper concentrations ranged from 4.64 mg·kg−1 d.w. (site Wa) to 8.24 mg·kg−1 d.w. (site Po) in the pepper fruits from greenhouse cultivation, and from 9.11 mg·kg−1 d.w. (site Wa) to 10.19 mg·kg−1 d.w. (site Ko) in field cultivation (Table 2). Similar concentrations of this element in vegetables grown in agricultural areas of Sanandaj in Iran were reported by Maleki and Zarasvand [57]. As in the case of zinc, comparable copper concentrations in pepper fruits were obtained by Ahmad and Goni [53]. Higher concentrations of this element (2–86 mg·kg−1 d.w.) in vegetables grown in a polluted area in Bangladesh arewere reported by Rahman et al. (2013) [58]. Rahmdel et al. reported lower ranges of mean concentrations of this metal (2.48–6.24 mg·kg−1 d.w.) in leafy vegetables grown in the city of Shiraz in Iran [15]. Copper, like zinc, is an essential microelement for the development of plants, for which a concentration in the range of 5–30 mg·kg−1 d.w. is considered favourable (Kumar et al. 2021) [59]. The average nickel concentrations in plants from greenhouse cultivation ranged from 2.65 mg·kg−1 d.w. (site Wa) to 4.13 mg·kg−1 d.w. (site Ko), while in field cultivation they ranged from 4.25 mg·kg−1 d.w. (site Ko) to 7.0 mg·kg−1 d.w. (site Wa; Table 2). Matloob reported even lower concentrations of this metal (0.897 mg·kg−1 d.w.) in chili peppers purchased in shops in Babil in Iraq [53]. Very low nickel concentrations (0.23 mg·kg−1 d.w.) in red hot pepper fruit were reported by Mohammed et al. [60], while Ahmad and Goni reported a similar range of concentrations of this metal (7.44–14.29 mg·kg−1 d.w.) to those obtained in the present study [45]. Nickel is an essential element for plants. Nickel deficiencies in plants are very rare, and its average concentrations generally range from 0.05 to 10 mg·kg−1 d.w. In general, the critical levels of toxicity are >10 µg ∙ g−1 d.w. for sensitive species and >50 µg ∙ g−1 d.w. for moderately tolerant species [61]. The average manganese concentrations in the greenhouse plants ranged from 2.35 (site Ko) to 7.63 mg·kg−1 d.w. (site Ru), while in field cultivation they ranged from 6.59 mg·kg−1 d.w. (site Ko) to 9.94 mg·kg−1 d.w. (site Wa; Table 2). A comparable range of concentrations of this metal was obtained for chili pepper fruits purchased in shops in Babil in Iraq [62]. Manganese, like Zn and Cu, is an important microelement for plant growth and development, and concentrations of 10–20 mg·kg−1 d.w. indicate a deficiency [63,64]. Thus, all the pepper fruits analysed in the present study can be said to be deficient in this element. Manganese is also an essential microelement for the development of the human body, including the maintenance of nerve and immune cell functions [56]. The average chromium concentrations in the plants from greenhouse cultivation ranged from 0.17 mg·kg−1 d.w. (site Wa) to 0.26 mg·kg−1 d.w. (site Ko), while in field cultivation they ranged from 0.17 mg·kg−1 d.w. (site Po) to 0.22 mg Cr mg·kg−1 d.w. (site Ru; Table 2). Matloob obtained a similar range of concentrations of this element for chili peppers purchased in shops in Babil in Iraq [62]. Extremely high concentrations of this metal (25–54 mg·kg−1 d.w.) were obtained by Islam et al. in vegetables grown in the Dhaka region in Bangladesh [65]. Chromium toxicity for plants depends on its valence state, with Cr(VI) being more toxic and mobile than Cr(III). Hexavalent chromium is toxic for crop plants at concentrations of about 0.5–5.0 mg·ml−1 in a medium and 5–100 mg· g−1 in soil. In physiological conditions, the concentration of chromium ions in plants is less than 1 mg· kg−1 [66].

Verification of the Hypotheses Regarding the Effect of Cultivation Method and Distance

Plastic greenhouses are used in agriculture in varied climatic, soil, and economic conditions. They are constructed according to various technologies and from various materials. The greenhouse construction can be permanent (used for many years), temporary (two or three years), or single-season. However, they are always used to improve a minimum factor for crop conditions, chosen by the farmer. At the same time, against the farmer’s will, new factors that can negatively affect the crop are created. Depending on the part of the world and the farmer’s needs, the factors that can be improved include temperature, humidity, light conditions, CO2 concentration, the health of the crop, nutrient availability (fertilizers and cultivation without soil), water availability for the plants, and soil protection (against erosion) [67,68,69,70]. In the climate conditions of 50° north latitude, modified by 20° east longitude, a plastic greenhouse is used to raise the spring temperature and the soil moisture level and to improve the health of plants (eliminating the spraying of leaves and fruits), which moves up harvest time and increases yields.
Hypotheses (q.cultivat., q.locat., and q.interact.) were tested with omission (‘without date’) and inclusion of the harvest date (first, second, and third date) in the analysis (Table 3).
The cultivation method (q.cultivat.) affected the concentrations of metals in the pepper fruit in 75% of cases. For the concentrations of zinc, copper, and nickel, this relationship was significant for each harvest date. For the concentrations of cadmium and manganese, significant differences were only not observed for the third harvest date. For lead concentrations, the effect of the cultivation method was significant for all samples (without taking into account the harvest date). However, this effect was not confirmed for the individual dates (first, second, and third). For chromium concentrations, the cultivation method was significant for the second and third harvest date, but this effect was not observed for the first date or for all samples considered without the date. It should be strongly emphasized that for the ‘sister’ hypothesis (concentrations of metals in soils (q.soil.cultivat.)), a statistically significant effect of the cultivation method was obtained only for concentrations of copper and chromium. Table 4 shows the strength of this effect. The concentrations of cadmium, lead (in this case only for ‘without data’, whereas excluding the first, the second, and the third harvests), and manganese in peppers grown in a greenhouse were statistically significantly lower than their content in fruit grown in the field (first and second dates and without date). For the second harvest date, no statistically significant differences were confirmed for these elements. For zinc, copper, and nickel (for all dates), the concentrations in the greenhouse pepper were statistically significantly lower than in peppers grown in the field. In contrast, chromium concentrations were not statistically significantly different for the analyses without a harvest date or for the first and second dates. A statistically significant difference was only noted for the third harvest date; in this case, the content of this element was higher in the greenhouse.
Thus, it can be concluded that a plastic greenhouse to some extent protects plants against the deposition of pollutants. This type of protective effect of a plastic greenhouse was also described by Li et al., Cao et al., and Song et al. [71,72,73]. Mateos et al. [74] also emphasized the vast differences in cultivars of the species Capsicum annuum, and thus differences in metabolic processes and reactions to biotic and abiotic stress; e.g., associated with the production of antioxidants. This is a group of varied compounds that help the plant to cope with stress, including by immobilizing heavy metals and reducing or even eliminating their ability to enter into any kind of metabolic processes [74,75,76]. Guo et al. pointed out that physiological mechanisms can have a decisive effect on the bioaccumulation of metals in pepper fruits, while environmental factors may only be important in certain cases [77]. Similarly, López et al. concluded that the cultivation method influences the content of these compounds in pepper fruits [78]. Li et al. noted higher concentrations of zinc, manganese, and cadmium in the greenhouse cultivation of tomatoes and cucumbers than in field cultivation. However, the authors clarified that the soil pH and content of organic matter were decreased in the greenhouse [71]. Thus, the inferior quality of the crop was due to the negative environmental effects of greenhouse cultivation. In the conditions of our study, i.e., east of Krakow (southern Poland), cultivation in greenhouses dates back about 50 years. This is a long enough time for this type of negative environmental effect to have manifested, but in our case, they were not observed (Section 3.1). After the final harvest, the plastic greenhouse is taken down, the crop residues are removed, and the field is again used for ground crops. This eliminates the problem of degradation appearing in soils remaining under cover for many years.
Cultivation in a plastic greenhouse caused differences in the cadmium concentrations at the four study sites (Ko, Po, Wa, and Ru) depending on the harvest date (q.harvest.date). One-way analysis of variance with the harvest date as the differentiating factor showed that for Ko the concentration of this metal in peppers harvested on the second date (0.338 mg·kg−1) statistically significantly differed from the concentration in fruit harvested on the third date (0.414 mg kg−1); HSD 0.055 mg·kg−1. Statistically significant differences in the concentration of this element were also noted in fruit harvested on the first (0.346 mg kg−1) and third dates. Pepper harvested on the third date had the highest content of cadmium. The same pattern was shown for location Po; here too the highest content of Cd (0.385 mg·kg−1) was recorded in the fruit harvested on the third date. At site Wa, the highest concentrations were noted in peppers harvested on the third (0.252 mg·kg−1) and first (0.268 mg·kg−1) dates; HSD 0.069 mg kg−1. The same relationship as in Wa was observed at the farthest location, Ru. Here, similarly, the lowest content (0.182 mg· kg−1) was obtained in the pepper harvested on the second date, and the highest in the fruit harvested on the first (0.249 mg kg−1) and third dates (0.235 mg·kg−1; HSD 0.064 mg·kg−1). For nickel content, this pattern was only observed at location Ko in peppers grown in a greenhouse. For the other locations and for cultivation in the field, the harvest date had no effect on the concentration of this metal in the fruit. For the concentrations of lead, zinc, and copper in the pepper fruits, the harvest date was a factor with no statistically significant effect in either greenhouse or field cultivation. In southern Poland, the maximum air temperatures in the summer months (July and August) reach 30 °C and higher [79,80,81]. In a low and relatively long plastic greenhouse, the maximum air temperature can reach and remain above 50 °C. Such heat stress is not found in field production in this region. This may have been a factor influencing the differences in cadmium content in the pepper fruits grown in the greenhouse, which was also confirmed by the highest bioaccumulation factors (BCF) calculated for this element (BCFCd, dla Ko = 0.398, Po = 0.431, Wa = 0.392, Ru = 0.404). This question should be followed by another: why did the plants respond to potential heat stress with changes in this element alone? An interesting hypothesis regarding copper was put forth by Li et al.: its content in plants is less variable than that of heavy metals, which are micronutrients, because the plant controls the content of elements essential to it [71]. This may explain why, despite the high bioaccumulation factors of copper (Ko 0.235, Po 0.274, Wa 0.166, Ru 0.159) and zinc (Ko 0.314, Po 0.370, Wa 0.331 and Ru 0.389) in the pepper fruits, the content of these metals did not differ depending on the harvest date.
In the case of the effect of distance (q.locat.), its significance was confirmed in nearly all (96%) of the F-tests. This means that the distance from the steel mill influenced the content of heavy metals in the pepper fruits. Only one test, for chromium content at the second harvest date, did not reveal this effect (Table 3 and Table 5).
Apart from wind directions, the range of the impact of the emitter is influenced by the shape of the terrain and by vegetation (especially forests). The study area is located in the direction of the prevailing winds, on undulating terrain with no forests. Statistically significant differences in cadmium content were confirmed between the peppers grown at shorter distances from the steel mill, i.e., Ko (3.5 km) and Po (6 km), and those grown at farther distances—Wa (11 km) and Ru (16 km) for without date and the second date harvests. However, such differences were not shown between the first two or between the last two locations (Table 5 (the first and the third date of harvest). The Pb concentrations were highest in the fruit harvested at Ko and Ru (with no statistically significant differences between the two sites) and were (statistically significantly) lower at Po and Wa, but as in the case of cadmium concentrations, without statistically significant differences between the two sites. The zinc concentrations in the peppers statistically significantly varied together with distance. The concentrations of this element were highest in the peppers from Ko, lower in Po, and lowest in Wa and Ru, with no statistically significant differences between the last two sites. The copper concentrations in the pepper fruits were influenced by the distance, cultivation method, and interaction of these two factors. This occurred for the third harvest date and for all data (with harvest dates omitted from the analysis). The interaction had no effect on the first and second harvest dates, but the concentrations were affected by the distance and cultivation method. The lowest nickel concentrations were found in the peppers grown in Po. This content did not statistically differ from the level in Ko, but statistically significantly differed from the level in the peppers from Wa and Ru, with no statistically significant differences between these two locations. The manganese concentrations were highest in the pepper grown in Ru and Wa, with no statistical difference between the two sites. They were lower in Po and the lowest in Ko. The trend of changes in the concentration of this metal is in contrast to that of all the others—the further from the steel mill, the higher the content of manganese in the fruit.
The arable land we sampled has been under cultivation for more than a thousand years. The seventy-year period of steel milling and its impact has been a part of social, economic, and environmental processes. Sustainability is a tool able to manage the place and processes connected to the area under research [82].

4. Conclusions

The present study confirmed the effect of a plastic greenhouse on the concentrations of metals in the analysed pepper fruits. However, the cultivation method had no statistically significant effect on the concentrations of the elements in soils at each of the study sites. In addition, the lack of differences in soil pH, organic matter content, and content of clay minerals suggests the occurrence of an additional factor, apart from the cultivation method, influencing the concentrations of metals in the pepper. We hypothesize that one of these factors may be the temperature (which was increased in the greenhouse in spring and autumn), shortening the time of ontogenesis and thus decreasing the metal concentrations. Another factor is the size of the yield, which is always greater in greenhouse cultivation than in field cultivation in the study area. Distance was another factor influencing the concentrations of the metals analysed in the pepper fruits and soil, but to a lesser extent than the cultivation method. The interaction of the two factors had the least pronounced effect for all elements in both the fruits and the soil. Thus, it appears that a plastic greenhouse can protect crop plants against the deposition of pollutants carried in atmospheric air to some extent. To confirm this, however, we want to expand our subsequent research to include analysis of environmental and physiological factors and to investigate the relationships between them and the effect of the greenhouse. We are aware that all of these factors may affect the transfer of metals to pepper fruits.

Supplementary Materials

The following supporting information can be downloaded at: https://www.mdpi.com/article/10.3390/su152316400/s1, Table S1: Content of heavy metals and water in pepper fruits harvested on three harvest dates in Ko; Table S2: Content of heavy metals and water in pepper fruits harvested on three harvest dates in the village of Po; Table S3: Content of heavy metals and water in pepper fruits harvested on three harvest dates in the village of Wa; Table S4: Content of heavy metals and water in pepper fruits harvested on three harvest dates in the village Ru.

Author Contributions

Conceptualization, P.M. and A.S.; Methodology, P.M. and A.S.; Software, P.M.; Validation, A.S.; Formal Analysis, P.M. and A.S.; Investigation, P.M. and A.S.; Resources, P.M. and A.S.; Data Curation, P.M.; Writing—Original Draft Preparation, P.M. and A.S.; Writing—Review & Editing, A.S. and P.M.; Visualization, A.S.; Supervision, P.M. All authors have read and agreed to the published version of the manuscript.

Funding

The study was conducted with a subsidy of the Ministry of Science and Higher Education in Poland for University of Agriculture in Krakow in 2023.

Institutional Review Board Statement

Not applicable.

Data Availability Statement

The data are available at [email protected] upon a request.

Conflicts of Interest

The authors declare no conflict of interest.

References

  1. Wiesner-Reinhold, M.; Schreiner, M.; Baldermann, S.; Schwarz, D.; Hanschen, F.S.; Kipp, A.P.; Rowan, D.D.; Bentley-Hewitt, K.L.; McKenzie, M.J. Mechanisms of selenium enrichment and measurement in Brassicaceous vegetables and their application to human health. Front. Plant Sci. 2017, 8, 1365. [Google Scholar] [CrossRef] [PubMed]
  2. Bvenura, C.; Sivakumar, D. The role of wild fruits and vegetables in delivering a balanced and healthy diet. Food Res. Int. 2017, 99, 15–30. [Google Scholar] [CrossRef] [PubMed]
  3. Mokganya, M.G.; Tshisikhawe, M.P. Medicinal uses of selected wild edible vegetables consumed by Vhavenda of the Vhembe District Municipality, South Africa. S. Afr. J. Bot. 2019, 122, 184–188. [Google Scholar] [CrossRef]
  4. Olas, B. Anti-aggregatory potential of selected vegetables-promising dietary components for the prevention and treatment of cardiovascular disease. Adv. Nutr. 2019, 10, 280–290. [Google Scholar] [CrossRef]
  5. Rolnik, A.; Olas, B. Vegetables from the Cucurbitaceae family and their products: Positive effect on human health. Nutrition 2020, 78, 110788. [Google Scholar] [CrossRef] [PubMed]
  6. Li, Y.; Wang, Y.-B.; Xin, G.; Su, Y.-B.; Wang, G. Risk assessment of heavy metals in soils and vegetables around non-ferrous metals mining and smelting sites, Baiyin, China. J. Environ. Sci. 2006, 18, 1124–1134. [Google Scholar] [CrossRef]
  7. Zhong, T.; Xue, D.; Zhao, L.; Zhang, X. Concentration of heavy metals in vegetables and potential health risk assessment in China. Environ. Geochem. Health 2018, 40, 313–322. [Google Scholar] [CrossRef]
  8. Qin, G.; Chen, Y.; He, H.; Yang, B.; Zou, K.; Shen, N.; Zuo, B.; Liu, R.; Zhang, W.; Li, Y. Risk assessment of fungicide pesticide residues in vegetables and fruits in the mid-western region of China. J. Food Compos. Anal. 2021, 95, 103663. [Google Scholar] [CrossRef]
  9. Almasi, A.; Mohammadi, M.; Dargahi, A.; Amirian, F.; Motlagh, Z.J.; Ahmadidoust, G.; Noori, M. Nitrogenous contamination in Iranian vegetables: A review. Pol. J. Environ. Stud. 2018, 27, 2405–2416. [Google Scholar] [CrossRef]
  10. Elrys, A.S.; Abdo, A.I.E.; Desoky, E.-S.M. Potato tubers contamination with nitrate under the influence of nitrogen fertilizers and spray with molybdenum and salicylic acid. Environ. Sci. Pollut. Res. 2018, 25, 7076–7089. [Google Scholar] [CrossRef]
  11. Ghasemidehkordi, B.; Malekirad, A.A.; Nazem, H.; Fazilati, M.; Salavati, H.; Shariatifar, N.; Rezaei, M.; Fakhri, Y.; Khaneghah, A.M. Concentration of lead and mercury in collected vegetables and herbs from Markazi province, Iran: A non-carcinogenic risk assessment. Food Chem. Toxicol. 2018, 113, 204–210. [Google Scholar] [CrossRef] [PubMed]
  12. Manzoor, J.; Sharma, M.; Wani, K.A. Heavy metals in vegetables and their impact on the nutrient quality of vegetables: A review. J. Plant Nutr. 2018, 113, 204–210. [Google Scholar] [CrossRef]
  13. Chrysikou, L.; Gemenetzis, G.; Kouras, A.; Manoli, E.; Terzi, E.; Sama, C. Distribution of persistent organic pollutants, polycyclic aromatic hydrocarbons and trace elements in soil and vegetation following a large scale landfill fire in northern Greece. Environ. Int. 2008, 34, 210–225. [Google Scholar] [CrossRef] [PubMed]
  14. Säumel, I.; Kotsyuk, I.; Hölscher, M.; Lenkereit, C.; Weber, F.; Kowarik, I. How healthy is urban horticulture in high traffic areas? Trace metal concentrations in vegetable crops from plantings within inner city neighbourhoods in Berlin, Germany. Environ. Pollut. 2012, 165, 124–132. [Google Scholar] [CrossRef] [PubMed]
  15. Rahmdel, S.; Rezaei, M.; Ekhlasi, J.; Zarei, S.H.; Akhlaghi, M.; Abdollahzadeh, S.M.; Sefidkar, R.; Mazloomi, S.M. Heavy metals (Pb, Cd, Cu, Zn, Ni, Co) in leafy vegetables collected from production sites: Their potential health risk to the general population in Shiraz, Iran. Environ. Monit. Assess. 2018, 190, 650. [Google Scholar] [CrossRef] [PubMed]
  16. Courter, J.W. Plastic greenhouses. Circular 1962, 857, 4–32. [Google Scholar]
  17. Courter, J.W.; Vandemark, J.S.; Hinton, R.A. The feasibility of growing greenhouse tomatoes in southern Illinois. Circular 1965, 914, 5–23. [Google Scholar]
  18. Seginer, I.; Kantz, D.; Peiper, U.M.; Levav, N. Transfer coefficient of several polyethylene greenhouse covers. J. Agric. Eng. Res. 1988, 39, 19–37. [Google Scholar] [CrossRef]
  19. Gil, C.; Boluda, R.; Martin, J.A.R.; Guzmán, M.; del Moral, F.; Ramos-Miras, J. Assessing soil contamination and temporal trends of heavy metal contents in greenhouses on semiarid soil. Land Degrad. Dev. 2018, 29, 3344–3354. [Google Scholar] [CrossRef]
  20. Sun, J.; Pan, L.; Li, Z.; Zeng, Q.; Wang, L.; Zhu, L. Comparison of greenhouse and open field cultivations across China: Soil characteristics, contamination and microbial diversity. Environ. Pollut. 2018, 243, 1509–1516. [Google Scholar] [CrossRef]
  21. Purvis, B.; Mao, Y.; Robinson, D. Three pillars of sustainability: In search of conceptual origins. Sustain. Sci. 2019, 14, 681–695. [Google Scholar] [CrossRef]
  22. Kubiak, R.; Rudek, Z.; Cieszkowski, J.; Garlicki, S. Cytogenetic examinations in biomonitoring residents residing closest to the area near the Sendzimir metallurgy plant in Krakow exposed to environmental pollution. Folia Med. Cracov. 1993, 34, 187–198. [Google Scholar] [PubMed]
  23. Curzydło, J.; Gambuś, F.; Mundała, P.; Szwalec, A. Zmiany zawartości metali ciężkich w roślinach uprawianych w latach 1983–1994 w sąsiedztwie Kombinatu Metalurgicznego w Nowej Hucie. Zesz. Nauk. AR Krakowie Rol. 1997, 34, 93–103. (In Polish) [Google Scholar]
  24. Mundała, P.; Szwalec, A.; Petryk, A. Zawartość wybranych pierwiastków śladowych w glebach położonych w sąsiedztwie Kombinatu Metalurgicznego w Nowej Hucie. Inż. Ekol. 2013, 33, 67–76. (In Polish) [Google Scholar] [CrossRef]
  25. Kicińska, A.; Wikar, J. Ecological risk associated with agricultural production in soils contaminated by the activities of the metal ore and processing industry–example from southern Poland. Soil Tillage Res. 2021, 205, 104817. [Google Scholar] [CrossRef]
  26. Bieda, B. Life cycle inventory processes of the Mittal Steel Poland (MSP) S.A. in Krakow, Poland-blast furnace pig iron production-a case study. Int. J. Life Cycle Assess. 2012, 17, 787–794. [Google Scholar] [CrossRef]
  27. Gajdzik, B. The road of Polish steelworks towards market success–changes after restricting process. Metalurgija 2013, 3, 421–424. [Google Scholar]
  28. Burchart-Korol, D. Life cycle assessment of steel production in Poland: A case study. J. Clean. Prod. 2013, 54, 235–243. [Google Scholar] [CrossRef]
  29. Damek-Poprawa, M.; Sawicka-Kapusta, K. Damage to the liver, kidney, and testis with reference to burden of heavy metals in yellow-necked mice from areas around steelworks and zinc smelters in Poland. Toxicology 2003, 186, 1–10. [Google Scholar] [CrossRef]
  30. Gajdzik, B.; Sroka, W. Analytic study of the capital restructuring processes in metallurgical enterprises around the world and in Poland. Metalurgija 2012, 51, 265–268. [Google Scholar]
  31. Mundała, P.; Szwalec, A.; Siejka, Z.; Kędzior, R.; Lipka, K. Zanieczyszczenie wybranymi metalami ciężkimi osadów dennych Zalewu Nowohuckiego. Acta Agrophys. 2016, 23, 455–465. [Google Scholar]
  32. Kruczek, Z.; Mazanek, L. Krakow as a tourist metropolitan area. Inpact of turism on the economof the city. Stud. Perieget. 2019, 2, 25–41. [Google Scholar]
  33. Szwalec, A.; Mundała, P.; Kędzior, R.; Pawlik, J. Monitoring and assessment of cadmium, lead, zinc and copper concentrations in arable roadside soils in terms of different traffic conditions. Environ. Monit. Assess. 2020, 192, 155. [Google Scholar] [CrossRef] [PubMed]
  34. Adamicki, F.; Nawrocka, B.; Dobrzański, A.; Kosson, R.; Pałczyński, J.; Stepowska, A.; Szwjda, J.; Ślusarski, C. Metodyka Integrowanej Produkcj Papryki; Opracowanie Zbiorowe Zespołu Instytutu Ogrodnictwa w Skierniecicach: Warszawa, Poland, 2020. (In Polish) [Google Scholar]
  35. Labaz, B.; Kabala, C.; Waroszewski, J. Ambient geochemical baselines for trace elements in Chernozems–approximation of geochemical soil transformation in an agricultural area. Environ. Monit. Assess. 2019, 191, 19. [Google Scholar]
  36. Lukin, S.V.; Selyukova, S.V.; Chernikov, V.A.; Gaitova, N.A. Ecological estimation of cadmium content in agricultural cenosis of the Central Chernozem Region of Russia. Pollut. Res. 2020, 39, 196–201. [Google Scholar]
  37. Bezuglova, O.S.; Gorbov, S.N.; Tischenko, S.A.; Aleksikova, A.S.; Tagiverdiev, S.S.; Sherstnev, A.K.; Dubinina, M.N. Accumulation and migration of heavy metals in soils of the Rostov region, south of Russia. J. Soil Sediments 2016, 16, 1203–1213. [Google Scholar] [CrossRef]
  38. Novykh, L.; Solovyov, A.; Novykh, I.; Chuikova, E.; Tricula, L. Ecological and geochemical features of the distribution of trace elements in virgin and arable Chernozems. In Proceedings of the 18th International Multidisciplinary Scientific Geo Conferences (SGEM 2018): Conference Proceedings, Albena, Bulgaria, 2–8 July 2018. [Google Scholar]
  39. Wang, J.; Wang, L.; Wang, Y.; Tsang, D.C.W.; Yang, X.; Beiyuan, J.; Yin, M.; Xiao, T.; Jiang, Y.; Lin, W.; et al. Emerging risks of toxic metal(loids)s in soil-vegetables influenced by steel-making activities and isotopic source apportionment. Environ. Int. 2021, 146, 106207. [Google Scholar] [CrossRef]
  40. González-Miqueo, L.; Elustondo, D.; Lasheras, E.; Santamaría, J.M. Use of native mosses as biomonitors of heavy metals and nitrogen deposition in the surroundings of two steel works. Chemosphere 2010, 78, 965–971. [Google Scholar] [CrossRef]
  41. Topolska, K.; Sawicka-Kapusta, K.; Cieślik, E. The effect of contamination of the Kraków region on heavy metals content in the organs of bank voles (Clethrionomys glareolus, Schreber, 1780). Pol. J. Environ. Stud. 2004, 13, 103–109. [Google Scholar]
  42. Schintu, M.; Cogoni, A.; Durante, L.; Cantaluppi, C.; Contu, A. Moss (Bryum radiculosum) as a bioindicator of trace metal deposition around an industrialised area in Sardinia (Italy). Chemosphere 2005, 60, 610–618. [Google Scholar] [CrossRef]
  43. Jankaitė, A.; Baltrėnas, P.; Kazlauskienė, A. Heavy metal concentrations in roadside soils of Lithuania’s highways. Geologija 2008, 50, 237–245. [Google Scholar] [CrossRef]
  44. Stefanowicz, A.M.; Kapusta, P.; Zubek, S.; Stanek, M.; Woch, M.W. Soil organic matter prevails over heavy metal pollution and vegetation as a factor shaping soil microbial communities at historical Zn–Pb mining sites. Chemosphere 2020, 240, 124922. [Google Scholar] [CrossRef] [PubMed]
  45. Yin, Y.; Impellitteri, C.A.; You, S.-J.; Allen, H.E. The importance of organic matter distribution and extract soil: Solution ratio on the desorption of heavy metals from soils. Sci. Total Environ. 2002, 287, 107–119. [Google Scholar] [CrossRef] [PubMed]
  46. Gerritse, R.G.; van Driel, W.; Smidle, K.W.; van Luit, B. Uptake of heavy metals by crops in relation to their concentrations in the soil solution. Plant Soil 1983, 75, 393–405. [Google Scholar] [CrossRef]
  47. Knight, B.; Zaho, F.J.; McGrath, S.P.; Shen, Z.G. Zinc and cadmium uptake by the hyperaccumulator Thlaspi caerulescens in contaminated soils and its effects on the concentration and chemical speciation of metals in soil solution. Plant Soil 1997, 197, 71–78. [Google Scholar] [CrossRef]
  48. Nassar, O.; Nasr, H.; El-Sayed, M.; Kobisi, A. Heavy metal levels in some popular vegetables from some selected markets in Saudi Arabia. Egypt. J. Bot. 2018, 58, 627–638. [Google Scholar] [CrossRef]
  49. Osma, E.; Serin, M.; Leblebici, Z.; Aksoy, A. Assessment of heavy metal accumulations (Cd, Cr, Cu, Ni, Pb, and Zn) in vegetables and soils. Pol. J. Environ. Stud. 2013, 22, 1449–1455. [Google Scholar]
  50. Kabata-Pendias, A. Trace Elements in Soils and Plants, 4th ed.; CRC Press: Boca Raton, FL, USA, 2010. [Google Scholar]
  51. Sharma, A.; Katnoria, J.K.; Nagpal, A.K. Heavy metals in vegetables: Screening health risks involved in cultivation along wastewater drain and irrigating with wastewater. SpringerPlus 2016, 5, 488. [Google Scholar] [CrossRef]
  52. Shikhova, N.S. Some regularities in the accumulation of lead in urban plants (by example of Vladivostok). Contemp. Prob. Ecol. 2012, 5, 285–294. [Google Scholar] [CrossRef]
  53. Ahmad, J.U.; Goni, M.A. Heavy metal contamination in water, soil, and vegetables of the industrial areas in Dhaka, Bangladesh. Environ. Monit. Assess. 2010, 166, 347–357. [Google Scholar] [CrossRef]
  54. Leblebici, Z.; Kar, M.; Başaran, L. Assessment of the heavy metal accumulation of various green vegetables grown in Nevşehir and their risks human health. Environ. Monit. Assess. 2020, 192, 483. [Google Scholar] [CrossRef] [PubMed]
  55. Latif, A.; Bilal, M.; Asghar, W.; Azeem, M.; Ahmad, M.I.; Abbas, A.; Ahmad, M.Z.; Shahzad, T. Heavy metal accumulation in vegetables and assessment of their potential health risk. J. Environ. Anal. Chem. 2018, 5, 2380–2391. [Google Scholar] [CrossRef]
  56. Chasapis, C.T.; Ntoupa, P.A.; Spiliopoulou, C.A.; Stefanidou, M.E. Recent aspects of the effects of zinc on human health. Arch. Toxicol. 2020, 945, 1443–1460. [Google Scholar] [CrossRef] [PubMed]
  57. Maleki, A.; Zarasvand, M.A. Heavy metals in selected edible vegetables and estimation of their daily intake in Sanandaj, Iran. Southeast Asian J. Trop. Med. Public Health 2008, 39, 335–340. [Google Scholar] [PubMed]
  58. Rahman, M.M.; Asaduzzaman, M.; Naidu, R. Consumption of arsenic and other elements from vegetables and drinking water from an arsenic-contaminated area of Bangladesh. J. Hazard. Mater. 2013, 262, 1056–1063. [Google Scholar] [CrossRef] [PubMed]
  59. Kumar, V.; Pandita, S.; Sidhu, G.P.S.; Sharma, A.; Khanna, K.; Kaur, P.; Bali, A.S.; Setia, R. Copper bioavailability, uptake, toxicity and tolerance in plants: A comprehensive review. Chemosphere 2021, 262, 127810. [Google Scholar] [CrossRef]
  60. Mohammed, G.A.; Edet, B.E.; Badawi, H.L.; Bala, H.M.; Marte, M.U.; Mohammed, A.; Dauda, A. Appraisal of some heavy metals and elements in irrigated vegetables and fruit cultivated in College Farm, Maiduguri, Nigeria. Int. J. Appl. Agric. Sci. 2017, 3, 78–86. [Google Scholar] [CrossRef]
  61. Alloway, B.J. (Ed.) Heavy Metals in Soils: Trace Metals and Metalloids in Soils and Their Bioavailability; Springer: Dordrecht, The Netherland, 2013; Volume 22. [Google Scholar]
  62. Matloob, M.H. Using stripping voltammetry to determine heavy metals in cooking spices used in Iraq. Pol. J. Environ. Stud. 2016, 25, 2057–2070. [Google Scholar] [CrossRef]
  63. Alejandro, S.; Höller, S.; Meier, B.; Peiter, E. Manganese in plants: From acquisition to subcellular allocation. Front. Plant Sci. 2020, 26, 300. [Google Scholar] [CrossRef]
  64. O’Neal, S.L.; Zheng, W. Manganese toxicity upon overexposure: A decade in review. Curr. Environ. Health Rep. 2015, 2, 315–328. [Google Scholar] [CrossRef]
  65. Islam, M.D.; Hasan, M.M.; Rahaman, A.; Hauge, P.; Islam, M.S.; Rahman, M.M. Translocation and bioaccumulation of trace metals from industrial effluent to locally grown vegetables and assessment of human health risk in Bangladesh. SN Appl. Sci. 2020, 2, 1315. [Google Scholar] [CrossRef]
  66. Stambulska, U.Y.; Bayliak, M.M.; Lushchak, V.I. Chromium (VI) toxicity in legume plants: Modulation effects of Rhizobial symbiosis. BioMed Res. Int. 2018, 2018, 8031213. [Google Scholar] [CrossRef] [PubMed]
  67. Martín, R.J.A.; Ramos-Miras, J.J.; Boluda, R.; Gil, C. Spatial relations of heavy metals in arable and greenhouse soils of a Mediterranean environment region (Spain). Geoderma 2013, 200, 180–188. [Google Scholar] [CrossRef]
  68. Kalkhajeh, K.Y.; Huang, B.; Hu, W.; Ma, C.; Gao, H.; Thompson, M.L.; Hansen, H.C.B. Environmental soil quality and vegetable safety under current greenhouse vegetable production management in China. Agric. Ecosyst. Environ. 2021, 307, 107230. [Google Scholar] [CrossRef]
  69. Gruda, N. Impact of environmental factors on product quality of greenhouse vegetables for fresh consumption. Crit. Rev. Plant Sci. 2005, 24, 227–247. [Google Scholar] [CrossRef]
  70. Jalali, M.; Mojahed, J.K. Assessment of the health risks of heavy metals in soils and vegetables from greenhouse production systems in Iran. Int. J. Phytorem. 2020, 22, 834–848. [Google Scholar] [CrossRef] [PubMed]
  71. Li, F.; Shi, W.; Jin, Z.; Wu, H.; Sheng, G.D. Excessive uptake of heavy metals by greenhouse vegetables. J. Geochem. Explor. 2017, 173, 76–84. [Google Scholar] [CrossRef]
  72. Cao, C.; Chen, X.-P.; Ma, Z.-B.; Jia, H.-H.; Wang, J.-J. Greenhouse cultivation mitigates metal-ingestion-associated health risk from vegetables in wastewater-irrigated agroecosystems. Sci. Total Environ. 2016, 560, 204–211. [Google Scholar] [CrossRef]
  73. Song, B.; Lei, M.; Chen, T.; Zheng, Y.; Xie, Y.; Li, X.; Gao, D. Assessing the health risk of heavy metals in vegetables to the general population in Beijing, China. J. Environ. Sci. 2009, 21, 1702–1709. [Google Scholar] [CrossRef]
  74. Mateos, R.M.; Jiménez, A.; Román, P.; Romojaro, F.; Bacarizo, S.; Leterrier, M.; Gómez, M.; Sevilla, F.; del Rio, L.A.; Corpas, F.J.; et al. Antioxidant systems from pepper (Capsicum annuum L.): Involvement in the response to temperature changes in ripe fruits. Int. J. Mol. Sci. 2013, 14, 9556–9580. [Google Scholar] [CrossRef]
  75. Emamverdian, A.; Ding, Y.; Mokhberdoran, F.; Xie, Y. Heavy metal stress and some mechanisms of plant defence response. A review. Sci. World J. 2015, 2015, 756120. [Google Scholar] [CrossRef] [PubMed]
  76. Gratão, P.L.; Polle, A.; Lea, P.J.; Azevedo, R.A. Making the life of heavy metal-stressed plants a little easier. A review. Funct. Plant Biol. 2005, 32, 481–494. [Google Scholar] [CrossRef] [PubMed]
  77. Guo, Y.; Fu, Y.; Yan, S.; Yang, Y.; Guo, Y.; Bao, Z. Heavy metal distribution between parent soil an pepper in an unpolluted area, Hainan Island, China. Environ. Earth Sci. 2012, 66, 1083–1089. [Google Scholar] [CrossRef]
  78. López, A.; Fenoll, J.; Hellín, P.; Flores, P. Cultivation approach for comparing the nutritional quality of two pepper cultivars grown under different agricultural regimes. LWT-Food Sci. Technol. 2014, 58, 299–305. [Google Scholar] [CrossRef]
  79. Ziernicka-Wojtaszek, A. Summer drought in 2019 on Polish territory—A case study. Atmosphere 2021, 12, 1475. [Google Scholar] [CrossRef]
  80. Ziernicka-Wojtaszek, A. Pluviothermal regionalization of Poland in light of present-day climate change. Pol. J. Environ. Stud. 2020, 29, 989–996. [Google Scholar] [CrossRef]
  81. Ziernicka-Wojtaszek, A.; Krużel, J. The diversification of air temperature trends in Poland (1981–2010). Pol. J. Environ. Stud. 2016, 25, 2205–2209. [Google Scholar] [CrossRef]
  82. Yu, J.; Wu, J. The sustainability of agricultural development in China. The agriculture-environment nexus. Sustainability 2018, 10, 1776. [Google Scholar] [CrossRef]
Figure 1. Experiment design. Diagram of eight plastic greenhouses. Large shaded rectangles represent the greenhouses selected for the experiment (792 m2), black rectangles (1.68 m2) are plots from which pepper fruits and soil were sampled, and the grey rectangle in each greenhouse is the site where the fourth (additional) soil sample was taken. This design was copied for the ground cultivation.
Sustainability 15 16400 g001
Table 1. Averaged concentrations close to the totals for Cd, Cr, Cu, Mn, Ni, Pb, and Zn in soil together with the relative standard deviation RSD for four sites (Ko, Po, Wa, and Ru) and two cultivation methods (f = field, pg = plastic greenhouse), probabilities and HSD for site x cultivation method interactions; n.a.—no basis for calculation of HSD.
Metal, Site, Unit, Mean ± RSD, HSDKoPoWaRu
mg·kg−1 d.w. ± %
Cdpgn.a.0.92 ± 110.77 ± 160.61 ± 150.55 ± 15
f0.3530.89 ± 180.83 ± 230.64 ± 110.60 ± 10
Pbpgn.a.35.65 ± 1632.08 ± 1222.88 ± 1222.15 ± 9
f0.08833.23 ± 1530.83 ± 1725.09 ± 1423.08 ± 12
Znpgn.a.87.10 ± 1562.09 ± 1457.20 ± 1847.07 ± 9
f0.83891.49 ± 1064.89 ± 1957.94 ± 1747.72 ± 12
Cupg n.a.29.51 ± 930.05 ± 627.96 ± 1130.28 ± 8
f0.23330.43 ± 730.00 ± 730.21 ± 731.07 ± 6
Nipg 0.00524.47 ± 6 a28.49 ± 11 d24.69 ± 7 a24.15 ± 6 a
f0.6824.42 ± 6 a26.38 ± 6 c24.71 ± 7 a25.54 ± 4 b
Mnpgn.a.564.80 ± 6566.60 ± 5582.30 ± 10573.60 ± 6
f0.704551.70 ± 6545.90 ± 7566.30 ± 5574.00 ± 4
Crpg0.7525.62 ± 9 a27.57 ± 10 c25.16 ± 8 a23.80 ± 5 e
f0.001328.53 ± 10 b31.91 ± 10 d25.40 ± 6 a25.32 ± 4 a
a, b, c, d, e—letters indicating statistical significance between means.
Table 2. Averaged contents of metals and water content in samples of pepper fruits grown in a greenhouse and in a field in Ko, Po, Wa, and Ru, independent of the harvest date.
Site, Cultivation, Statistics, Metal, and Water Contentmg·kg−1 d.w. + %%
CdPbZnCuNiMnCr%H2O
Komean0.3660.1127.396.944.132.350.2691.84
GreenhouseRSD171818353432420.9
min0.2110.0717.893.691.891.250.1190.48
max0.5540.1537.4312.037.234.110.5694.64
Komean0.3840.1231.6110.194.256.590.2089.78
FieldRSD191722151018301.1
min0.2740.0720.656.943.474.840.1088.21
max0.5260.1645.9513.345.348.270.3092.3
Pomean0.3320.0822.978.242.694.840.2292.37
GreenhouseRSD202520214428451.1
min0.1690.0514.092.930.722.420.1090.5
max0.5380.1236.3412.396.697.540.4594.7
Pomean0.3460.0826.3610.014.266.760.1790.14
FieldRSD182520161018241.1
min0.2610.0516.656.553.504.990.1088.29
max0.4590.1233.6913.075.398.250.2492.8
Wamean0.2390.0818.964.642.656.920.1791.49
GreenhouseRSD311323395747531.1
min0.0280.0512.492.410.973.270.1089.3
max0.4080.1128.199.286.3418.880.5394
Wamean0.2930.0822.039.117.009.940.1890.23
FieldRSD11251426393022.20.9
min0.2220.0514.374.523.604.360.1188.9
max0.3560.1226.9912.3412.3514.260.2792.2
Rumean0.2220.1118.314.812.847.630.1891.53
GreenhouseRSD311823385458562.3
min0.0260.0711.742.491.083.250.0988.27
max0.3710.1627.349.766.8620.460.5896.92
mean0.2620.1222.539.316.969.690.2289.78
FieldRSD121718263830271.1
min0.2150.0714.104.383.514.320.1188.21
max0.3440.1630.0512.3712.2313.690.3492.3
Table 3. Verification of the hypotheses regarding the effect of the cultivation method (q.cultivat.), distance (q.locat.), and the combined effect of the two factors (q.interact.) on the content of heavy metals in pepper fruit, with and without consideration of the harvest date. Probabilities for two-way analysis of variance (F-test), significance level alpha = 0.05.
MetalDateCultivationLocationInteraction
Cdwithout dateyes1.61102 × 10−5yes2.69543 × 10−35no0.166127179
firstyes0.001057297yes1.51436 × 10−10no0.447972664
secondyes1.4973 × 10−7 yes6.03749 × 10−15no0.195601826
thirdno0.573449124yes2.77247 × 10−13yes0.011140489
Pbwithout dateyes0.005778259yes4.53459 × 10−32no0.377992523
firstno0.077739309yes7.70073 × 10−8no0.969154031
secondno0.137281884yes6.57555 × 10−11no0.488248034
thirdno0.114373794yes8.51547 × 10−14no0.642761923
Znwithout dateyes2.2587 × 10−10yes3.49283 × 10−29no0.849134489
firstyes4.0469 × 10−7yes3.95237 × 10−10no0.70077181
secondyes0.013566398yes1.52903 × 10−11no0.9615407
thirdyes0.001260023yes7.16335 × 10−8no0.79998615
Cuwithout dateyes3.64205 × 10−37yes6.48875 × 10−13yes7.30079 × 10−5
firstyes1.11915 × 10−13yes8.25647 × 10−5no0.112520737
secondyes1.62725 × 10−14yes3.73758 × 10−5no0.23146229
thirdyes9.54922 × 10−11yes0.002608164yes0.010834713
Niwithout dateyes7.12524 × 10−30yes5.40517 × 10−7yes3.46854 × 10−15
firstyes1.01104 × 10−11yes0.046182502yes0.003484608
secondyes1.01846 × 10−13yes0.005144557yes3.01505 × 10−6
thirdyes1.22667 × 10−7yes0.008438733yes1.68976 × 10−6
Mnwithout dateyes5.33308 × 10−18yes6.75671 × 10−24yes0.026878579
firstyes3.4776 × 10−18yes2.10097 × 10−7no0.601630132
secondyes6.74274 × 10−11yes3.19018 × 10−9no0.160592215
thirdno0.050745839yes1.36384 × 10−12yes0.036573495
Crwithout dateno0.175542097yes0.000755465yes0.000118379
firstno0.053384005yes0.031748219no0.498843733
secondyes0.445841227no0.139288076yes0.001191324
thirdyes0.00689218yes0.011037716yes0.011062122
Table 4. Average concentrations of metals in pepper fruits from greenhouse and field cultivation with statistical significance of differences (without taking into account the distance hypothesis (q.cultivat.).
Cd [mg·kg −1 d.m.]
Cult./HSDWithout DateDiff.First Diff.Second Diff.Third Diff.
Greenhouse0.290a0.294a0.254a0.321a
Field0.321b0.334b0.316b0.314a
HSD0.010 0.017 0.015
Pb
Greenhouse0.094a0.089a0.094a0.098a
Field0.100b0.095a0.101a0.104a
HSD0.003 n.i. n.i. n.i.
Zn
Greenhouse21.91a21.26a23.33a21.14a
Field25.63b26.53b25.55b24.82b
HSD0.79 1.35 1.24 1.55
Cu
Greenhouse6.16a5.85a6.11a6.53a
Field9.66b9.54b9.69b9.74b
HSD0.33 0.59 0.55 0.62
Ni
Greenhouse3.08a2.73a2.83a3.67a
Field5.62b5.48b5.57b5.80b
HSD0.28 0.49 0.44 0.52
Mn
Greenhouse5.43a3.69a5.09a7.52a
Field8.24b7.85b8.26b8.63a
HSD0.42 0.53 0.60 n.i.
Cr
Greenhouse0.204a0.157a0.208a0.248a
Field0.192a0.179a0.197a0.201b
HSDn.i. n.i. 0.023 0.024
H2O content [%]
Greenhouse91.8a91.5a91.6a92.3a
Field90.0b89.8b90.2b90.0b
HSD0.2 0.3 0.3 0.4
a, b—letters indicating statistical significance between means.
Table 5. Effect of distance from the steel mill on the content of heavy metals in the pepper fruits and comparison of statistical significance of distances in the tests without harvest date and for the first, second, and third harvest date; a, b, c—significant differences, α = 0.05, HSD, honest significant difference (Tukey test).
Cd mg·kg −1 d.m.
Site/HSDAllDiff.FirstDiff.SecondDiff.ThirdDiff.
Ko0.375a0.378a0.359a0.389a
Po0.339b0.339a0.317b0.361a
Wa0.266c0.281b0.243c0.275b
Ru0.242c0.257b0.221c0.247b
HSD0.026 0.044 0.040 0.046
Pb
Ko0.114a0.105a0.115a0.121a
Po0.079b0.076b0.082b0.079b
Wa0.082b0.084b0.079b0.084b
Ru0.112a0.103a0.114a0.120a
HSD0.008 0.014 0.015 0.015
Zn
Ko29.50a29.87a30.11a28.53a
Po24.66b24.36b25.56b24.07b
Wa20.49c20.58c21.16c19.74c
Ru20.42c20.78c20.92c19.56c
HSD2.07 3.57 3.27 4.10
Cu
Ko8.57a8.39a8.72a8.59a.b
Po9.13a9.01a9.07a9.31a.b
Wa6.88b6.60b6.82b7.21c
Ru7.06b6.76b7.00b7.43a.c
HSD0.86 1.56 1.45 1.62
Ni
Ko4.19a.b3.92a4.15a.b4.50a.b
Po3.47a.b3.37a3.28a.b3.78a.b
Wa4.83a4.55a4.67a5.26a
Ru4.90a4.60a4.70a5.41a
HSD0.73 1.30 1.15 1.37
Mn
Ko4.47a4.18a4.43a4.79a
Po5.80b5.00a5.97a6.43a
Wa8.43c7.00b8.12b10.17b
Ru8.66c6.89b8.18b10.90b
HSD1.11 1.40 1.58 2.08
Cr
Ko0.23a0.19a0.22a0.27a
Po0.19b0.15b0.22a0.20b
Wa0.18b0.16a.b0.17a0.20b.c
Ru0.20a.b0.17b0.20a0.22a.b
HSD0.03 0.04 n.i. 0.06
H2O content [%]
Ko90.8a.b90.5a91.0a.b90.9a
Po91.3a.b90.9a91.4a.b91.5a
Wa90.9a.b90.7a90.6a.b91.2a
Ru90.7a90.3a90.6a91.0a
HSD0.5 n.i. 0.8 n.i.
a, b, c—letters indicating statistical significance between means.
Disclaimer/Publisher’s Note: The statements, opinions and data contained in all publications are solely those of the individual author(s) and contributor(s) and not of MDPI and/or the editor(s). MDPI and/or the editor(s) disclaim responsibility for any injury to people or property resulting from any ideas, methods, instructions or products referred to in the content.

