
Characterization and Methanogenic Potential Evaluation of Faecal Sludge: Case of the Kossodo Biogas Plant in Ouagadougou

 , , ,
, , ,
Abstract
:
1. Introduction
2. Materials and Methods
2.1. Faecal Sludge Characterization
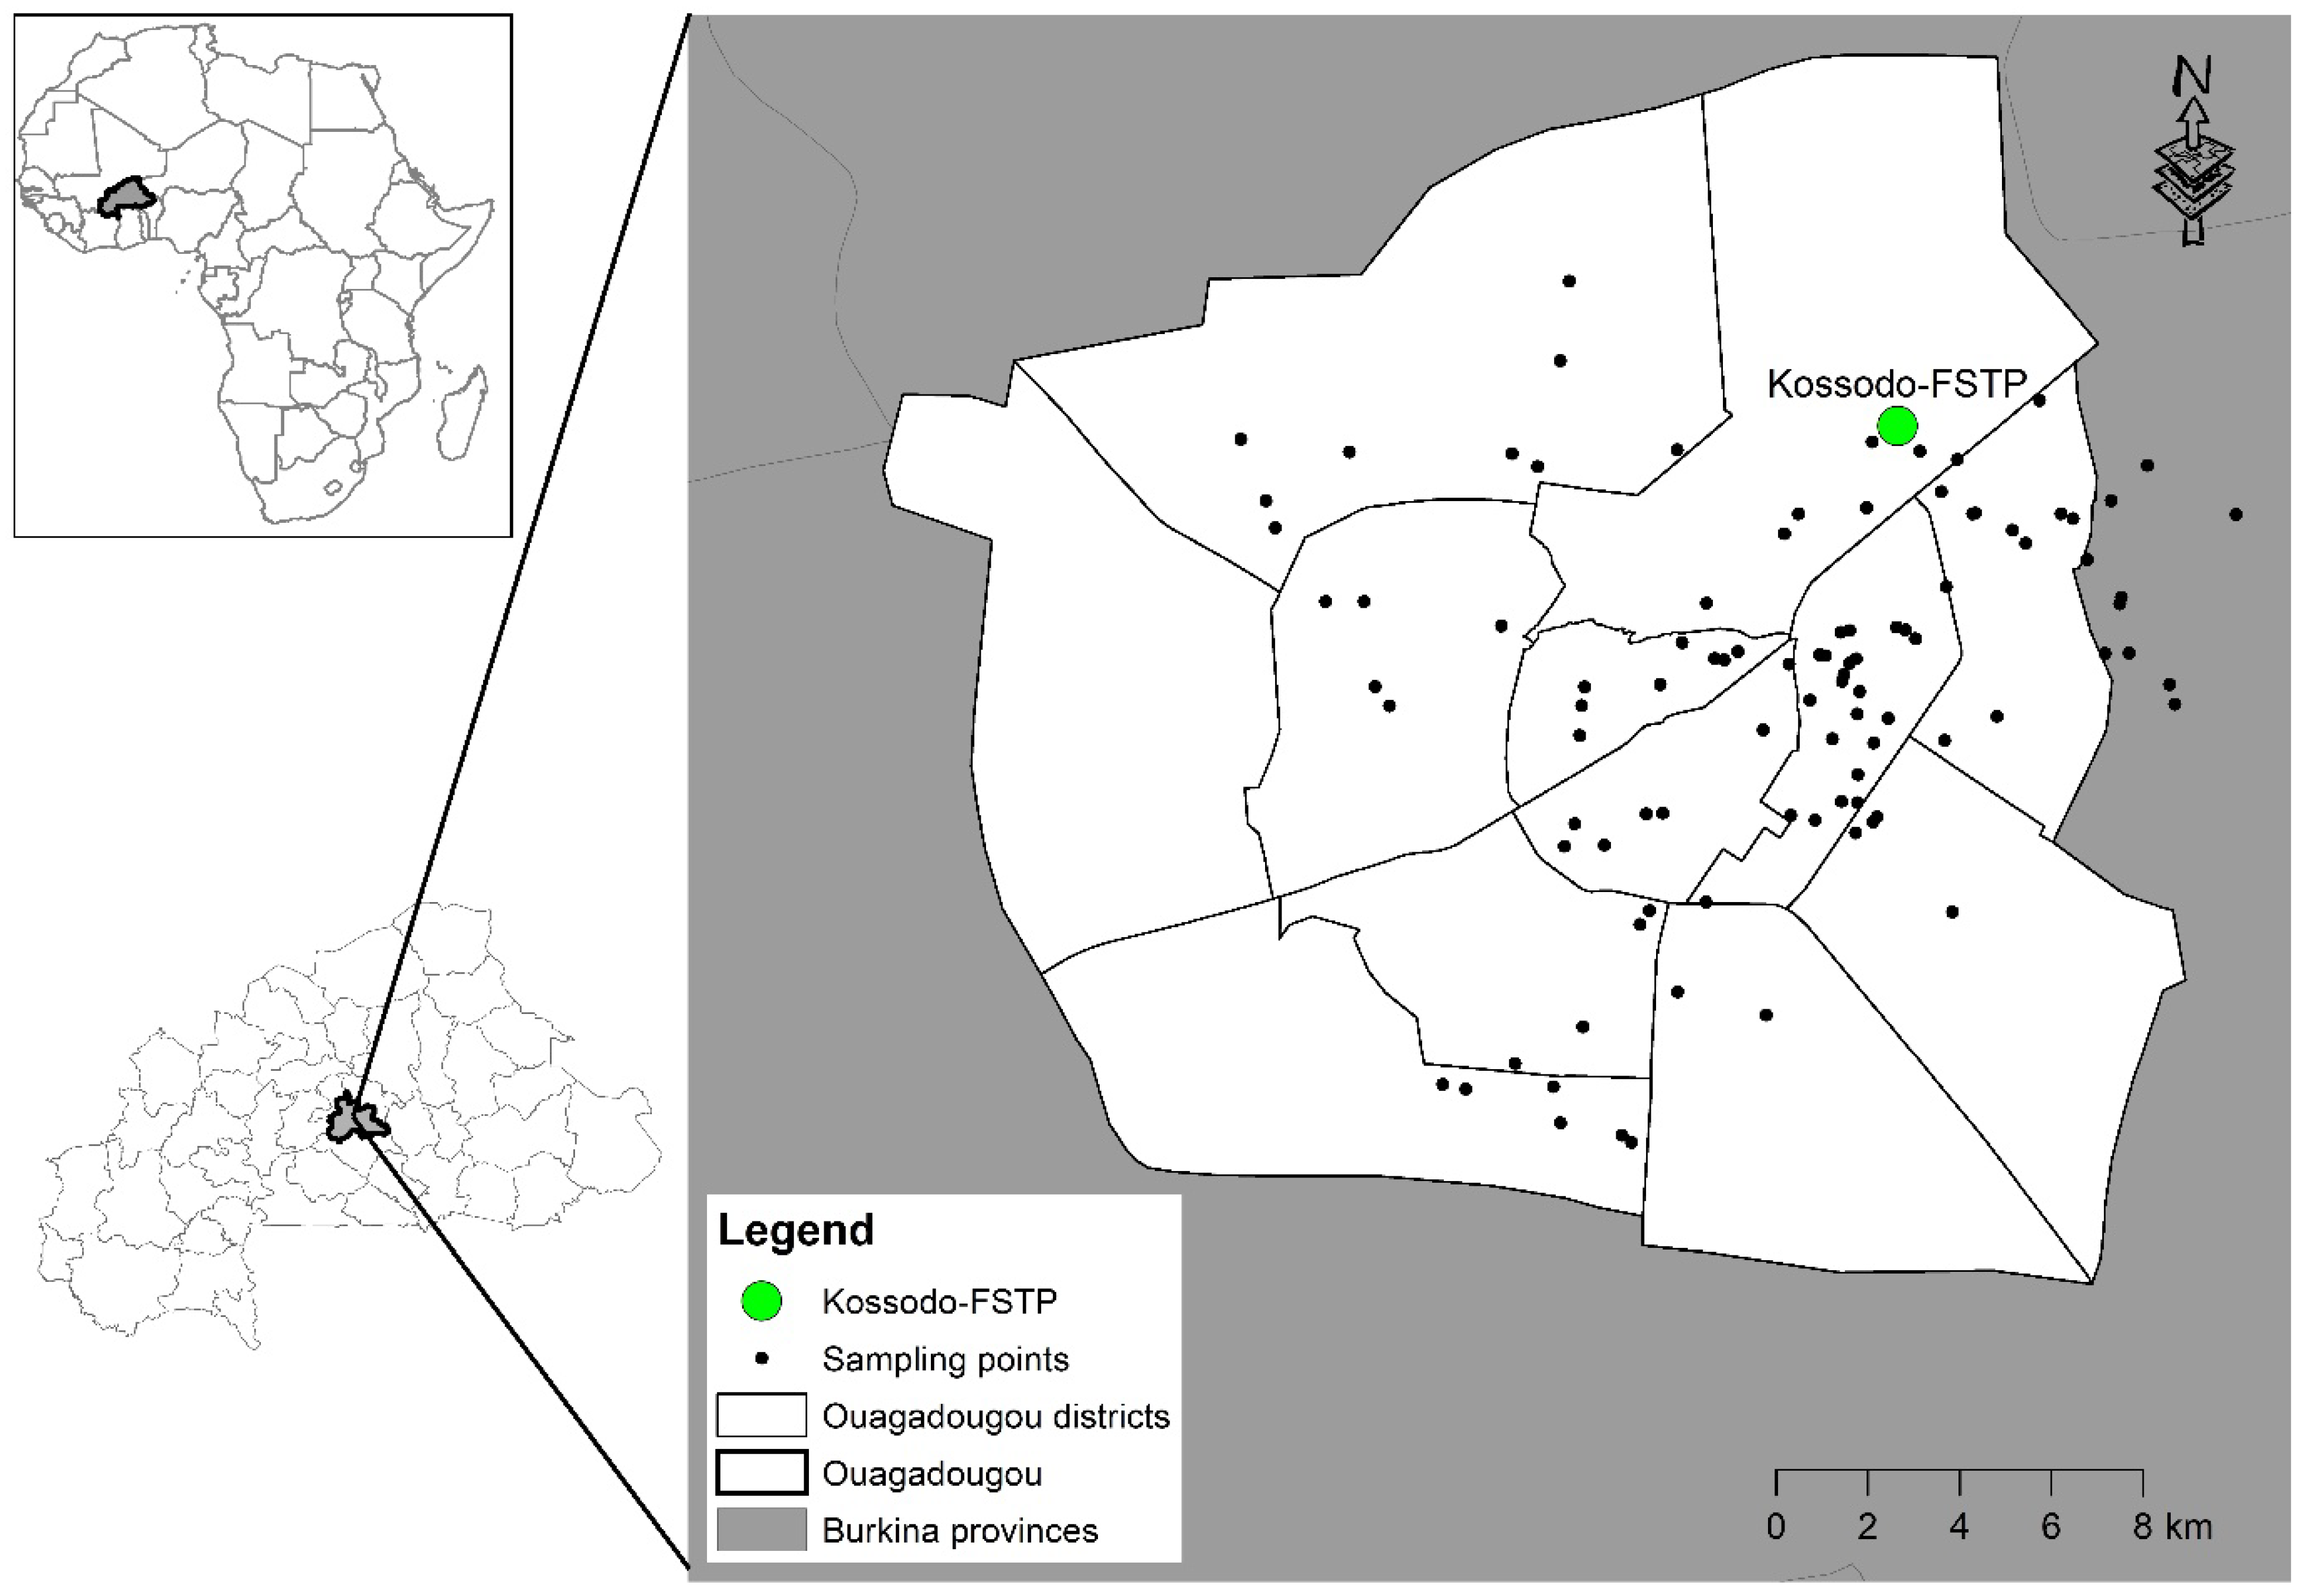
2.1.1. Study Area
2.1.2. Kossodo Treatment Plant
2.1.3. Sampling Design
2.1.4. Interview Guide
2.1.5. Sampling Method
2.1.6. Analytical Parameters
Physico-Chemical Parameters
Microbiological Parameters
Heavy Metals
Settling Test
2.2. Methanogenic Potential Evaluation
2.2.1. Experimental Procedure
Evaluation of the Methanogenic Potential of Sludge
Batch Testing
2.3. Data Analysis
3. Results and Discussion
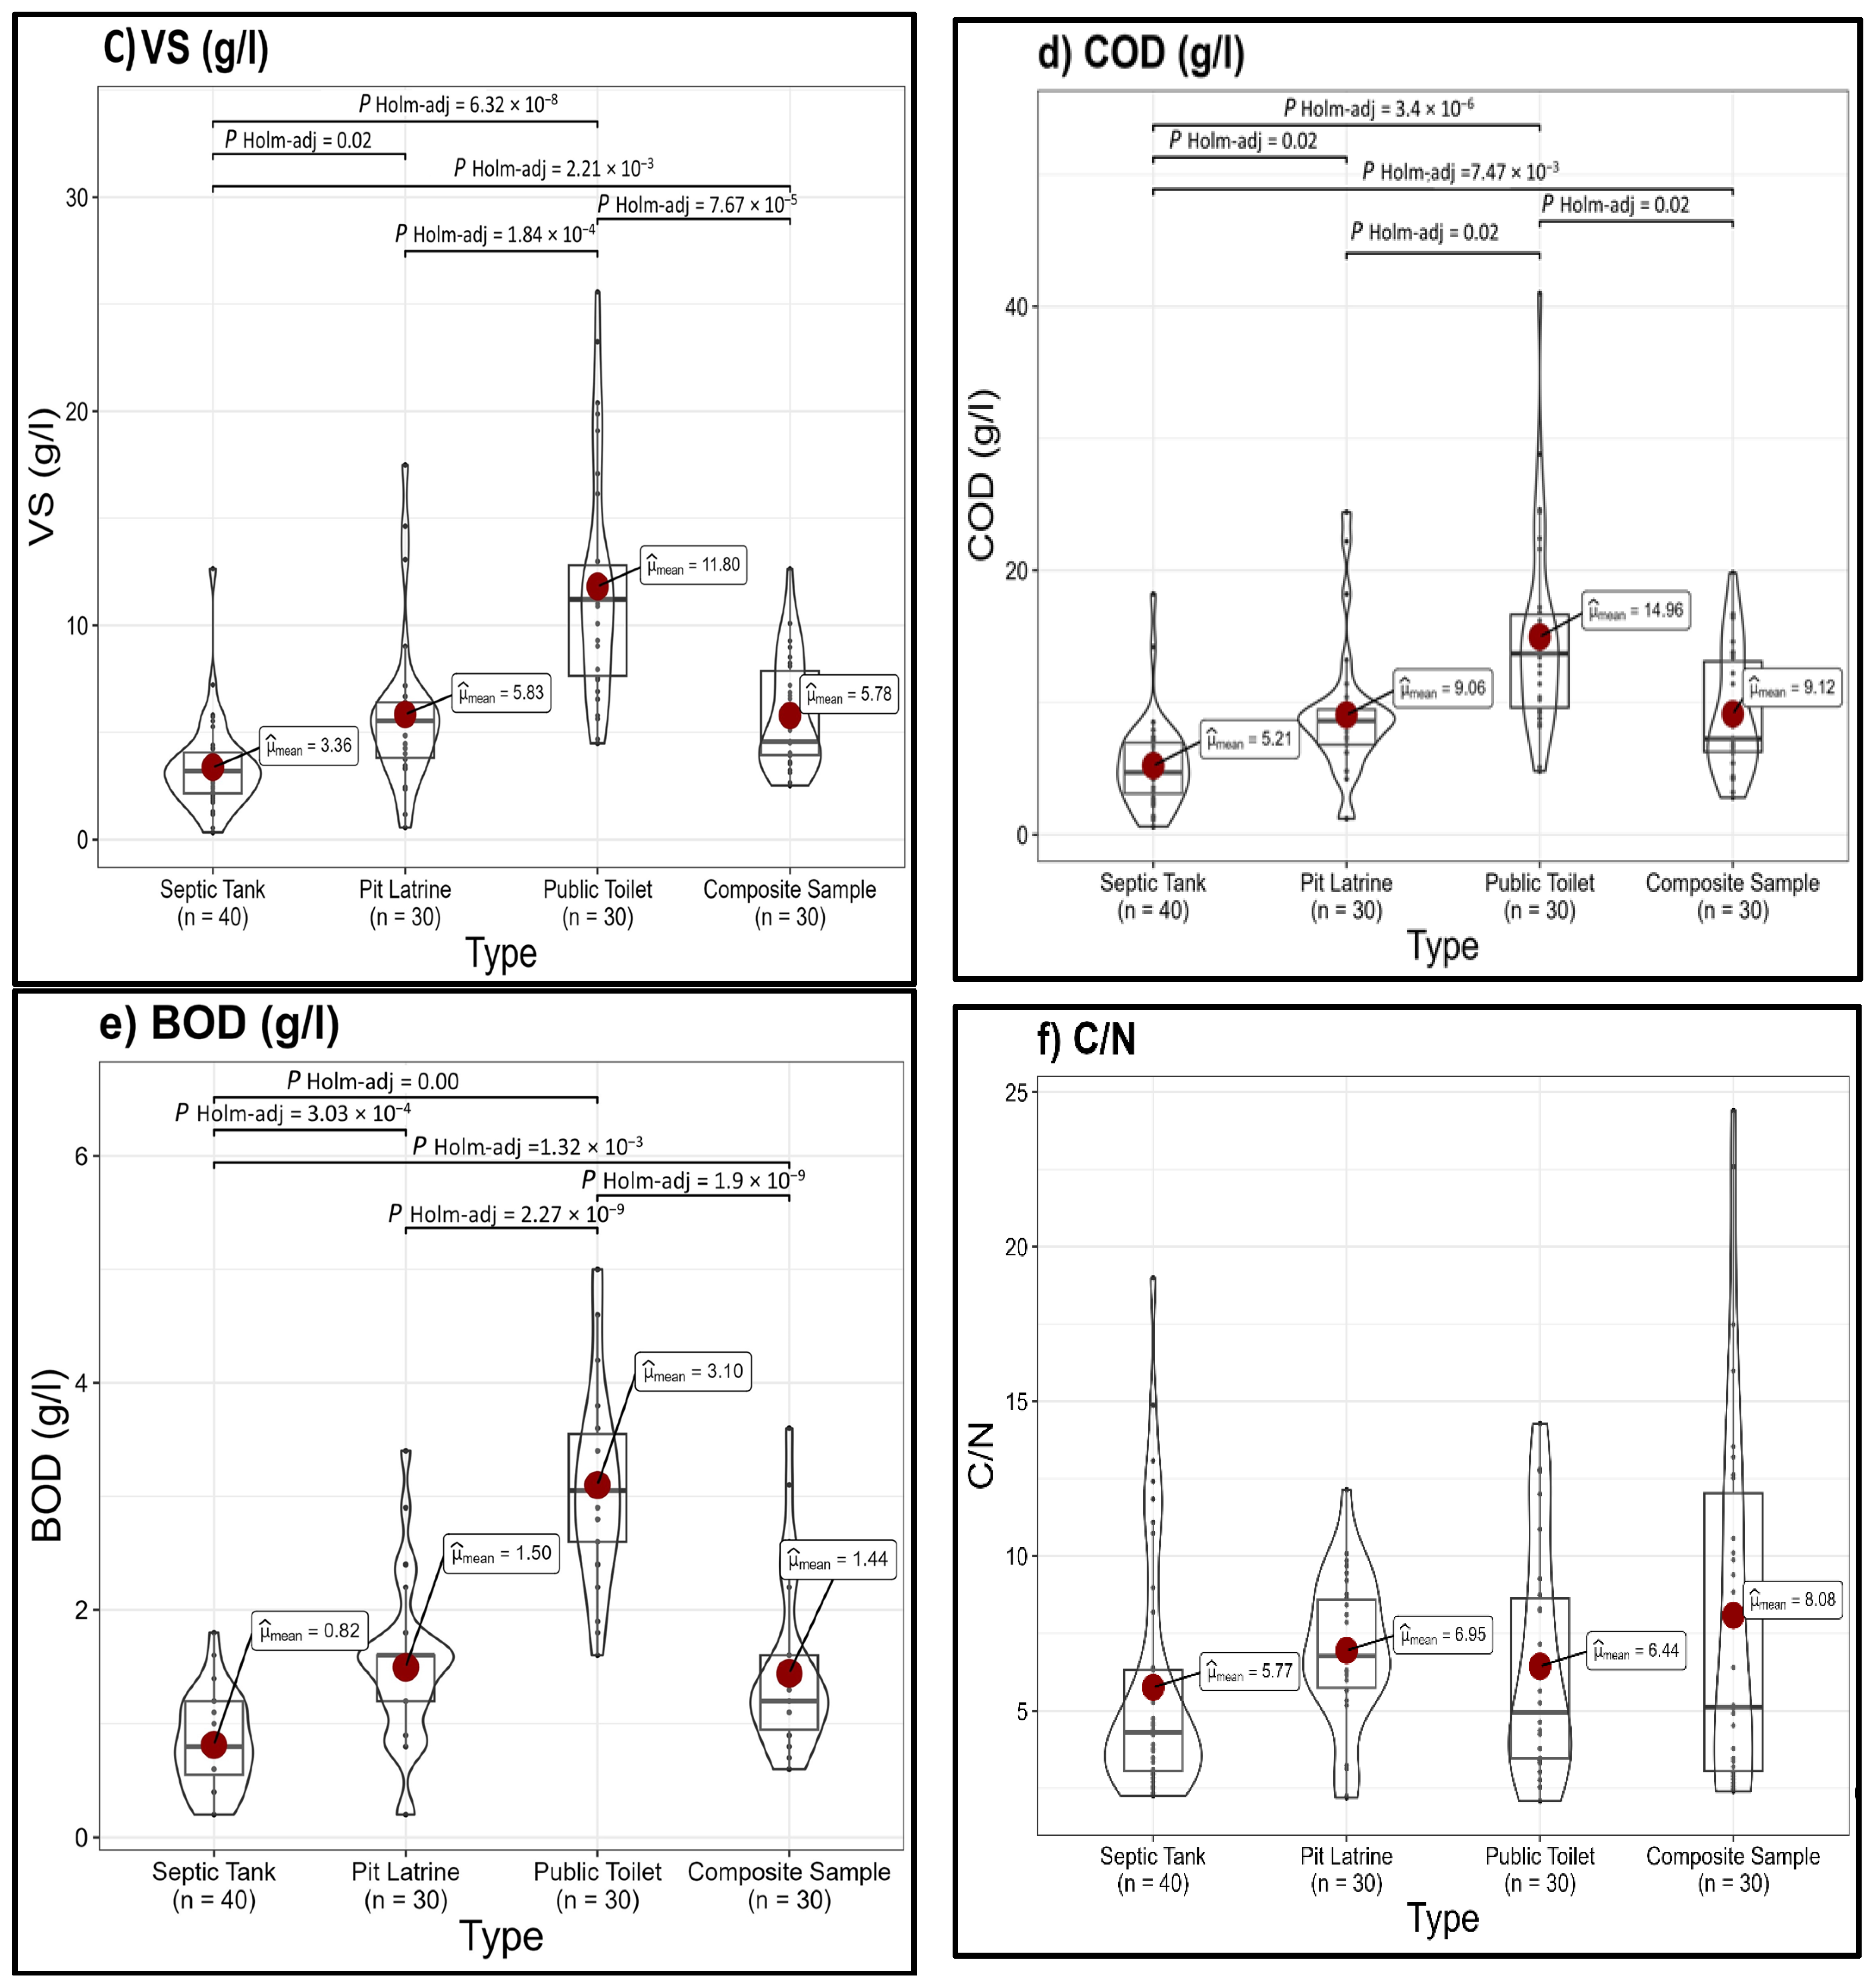
3.1. Raw Sludge Quality
3.1.1. pH

| Results of Laboratory-Based Analysis Grouped by Septic Tank, Pit Latrine and Public Toilet | Mean and Range Values Reported in Litteraure | |||||||||
|---|---|---|---|---|---|---|---|---|---|---|
| Septic Tank (ST) n = 40 | Pit Latrine (PL) n = 30 | Public Toilet (PT) n = 30 | Composite Sample (CS) n = 30 | All Samples (130) | Discharge Threshold (BF *) | Septic Tank | Latrine Pit | Public Toilet | ||
| Parameters | Unit | Mean ± SD | Mean ± SD | Mean ± SD | Mean ± SD | Mean ± SD | ||||
| Temperature | °C | 31.3 ± 1.4 | 30.9 ± 1.2 | 31.1 ± 1.2 | 31.1 ± 0.8 | 31.1 ± 1.2 | 18–40 | |||
| pH | 7.62 ± 0.41 | 7.72 ± 0.22 | 7.56 ± 0.25 | 7.94 ± 0.29 | 7.70 ± 0.34 | 6.5–9 | 6.9–7.9 b,c,d,e,f,k,m,t | 7.1–8.2 d,h,k | 7.48–7.9 a,l | |
| Moisture | (%) | 99.32 ± 0.38 | 98.90 ± 0.58 | 98.27 ± 0.74 | 98.89 ± 0.51 | 98.88 ± 0.66 | ||||
| TS | (%) | 0.68 ± 0.38 | 1.10 ± 0.58 | 1.72 ± 0.74 | 1.11 ± 0.51 | 1.12 ± 0.66 | 50 | 0.19–7.2 b,c,d,p,t | 0.64–19 b,c,d,e,h,i,j,k,p | 1.59–5.25 b,o,s |
| TS | g/L | 6.83 ± 3.78 | 10.95 ± 5.8 | 17.47 ± 7.82 | 11.13 ± 5.05 | 11.23 ± 6.81 | 1.92–72 b,c,d,k,p,t | 6.4–190 b,c,d,e,h,i,j,k,p | 15.9–52.5 b,o,s | |
| VS | (% MS) | 49.42 ± 7.79 | 51.62 ± 10.20 | 67.66 ± 7.43 | 52.03 ± 7.20 | 54.74 ± 10.83 | 45–76 b,c,d,e,k,r,t | 43.2–77.2 b,c,d,h,i,k,p,t | 56.9–84.92 a,g | |
| VS | g/L | 3.36 ± 2.11 | 5.82 ± 3.65 | 11.80 ± 5.5 | 5.77 ± 2.65 | 6.43 ± 4.74 | ||||
| TSS | g/L | 3.87 ± 2.38 | 7.26 ± 4.15 | 12.77 ± 5.3 | 8.15 ± 4.23 | 7.69 ± 5.15 | ||||
| TC | (% MS) | 29.6 ± 5.0 | 30.8 ± 5.7 | 39.24 ± 6.6 | 30.5 ± 4.4 | 32 ± 6.0 | 10.9 c | 10.9 c | ||
| SVI | (mL/g) | 23 ± 13 | 30 ± 15 | 55 ± 39 | 36 ± 20 | 35 ± 26 | ||||
| TP | mg/L | 85 ± 46 | 125 ± 74 | 207 ± 73 | 148 ± 67 | 137 ± 78 | 89.5–150 g,l,n,q,r | 450–521 l,n | 110.8–450 g,l,r | |
| -P | mg/L | 13.9 ± 10.8 | 15.7 ± 9.5 | 44.8 ± 15.4 | 19.43 ± 6.9 | 22.7 ± 16.5 | 0.8 | |||
| TN | mg/L | 431 ± 254 | 494 ± 220 | 1308 ± 847 | 532 ± 240 | 677 ± 572 | 190–1200 l,q,r,s | 1397–1550 g,s | ||
| TKN | mg/L | 405 ± 250 | 470 ± 216 | 1300 ± 845 | 421 ± 154 | 659 ± 574 | ||||
| -N | mg/L | 255 ± 170 | 296 ± 168 | 592 ± 371 | 289 ± 136 | 350 ± 261 | 120–1200 r,s,t | 140–3200 d,k | 566–5000 a,r,t | |
| -N | mg/L | 23.5 ± 12.4 | 22.38 ± 7.4 | 8.3 ± 3.7 | 22 ± 11 | 15.9± 11.6 | 11.4 | |||
| -N | mg/L | 1.6 ± 1.1 | 1.5 ± 1.0 | 0.5 ± 0.3 | 2.1 ± 1.5 | 1.4 ± 1.2 | 0.9 | |||
| C/N (ratio) | - | 5.7 ± 3.9 | 6.9 ± 2.3 | 6.4 ± 3.6 | 8.1 ± 6.2 | 6.7 ± 4.3 | 1.2–3.7 u | 3.2 u | ||
| COD | g/L | 5.21 ± 3.3 | 9.06 ± 5.04 | 14.96 ± 6.4 | 9.12 ± 4.62 | 9.25 ± 6 | 150 | 1.8–43 b,d,f,k,p,t | 6.4–129 b,d,h,i,k,p | 15.5–49 b,s |
| BOD5 | g/L | 0.82 ± 0.39 | 1.5 ± 0.69 | 3.1 ± 0.85 | 1.44 ± 0.73 | 1.64 ± 1.08 | 40 | 0.84–3.9 g,t | 4.3–7.6 b,g,s | |
| COD/BOD5 | 6.2 ± 1.6 | 6.1 ± 1.7 | 4.7 ± 1.2 | 6.5 ± 2.1 | 5.89 ± 1.80 | 5–10 s | 2.4–5.8 b,l | 2.- 5.89 b,g,t | ||
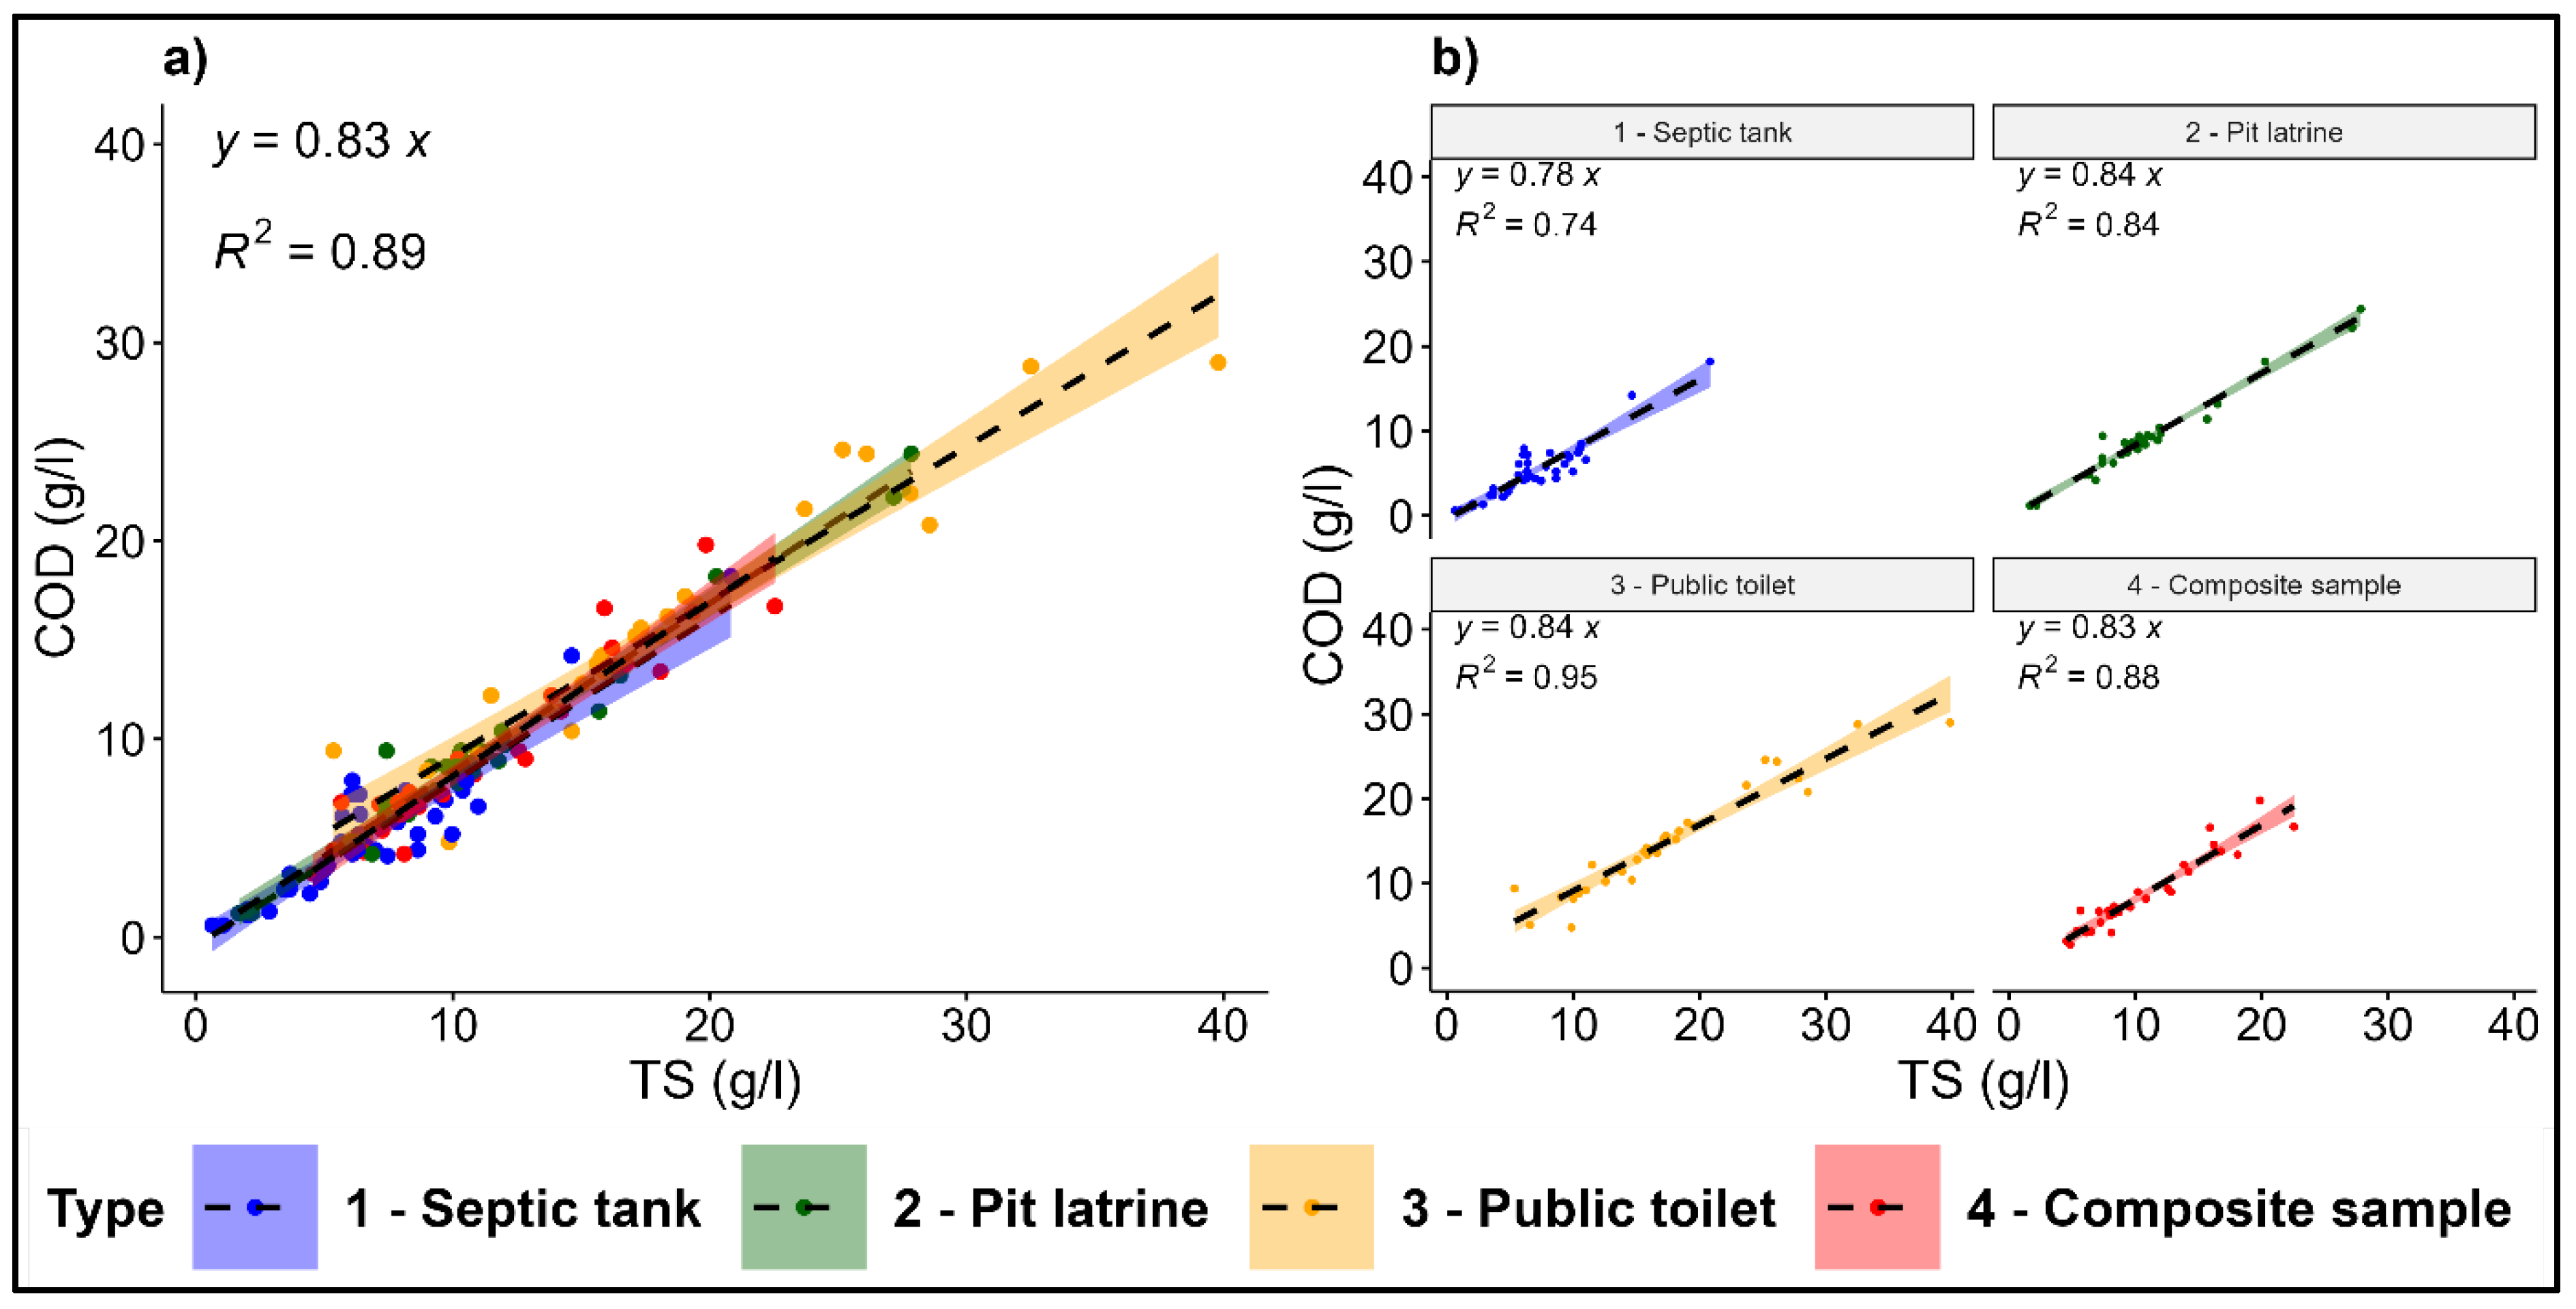
| TS/COD | 1.41 ± 0.33 | 1.25 ± 0.18 | 1.18 ± 0.22 | 1.27 ± 0.21 | 1.29 ± 0.26 | |||||
3.1.2. Total Solid Content (TS)
3.1.3. Volatile Solid (VS)
3.1.4. Biodegradability
3.1.5. The C/N Ratio
3.2. Influence of Season on Faecal Sludge Characteristics
3.3. Statistical Relationships of Measured Parameters
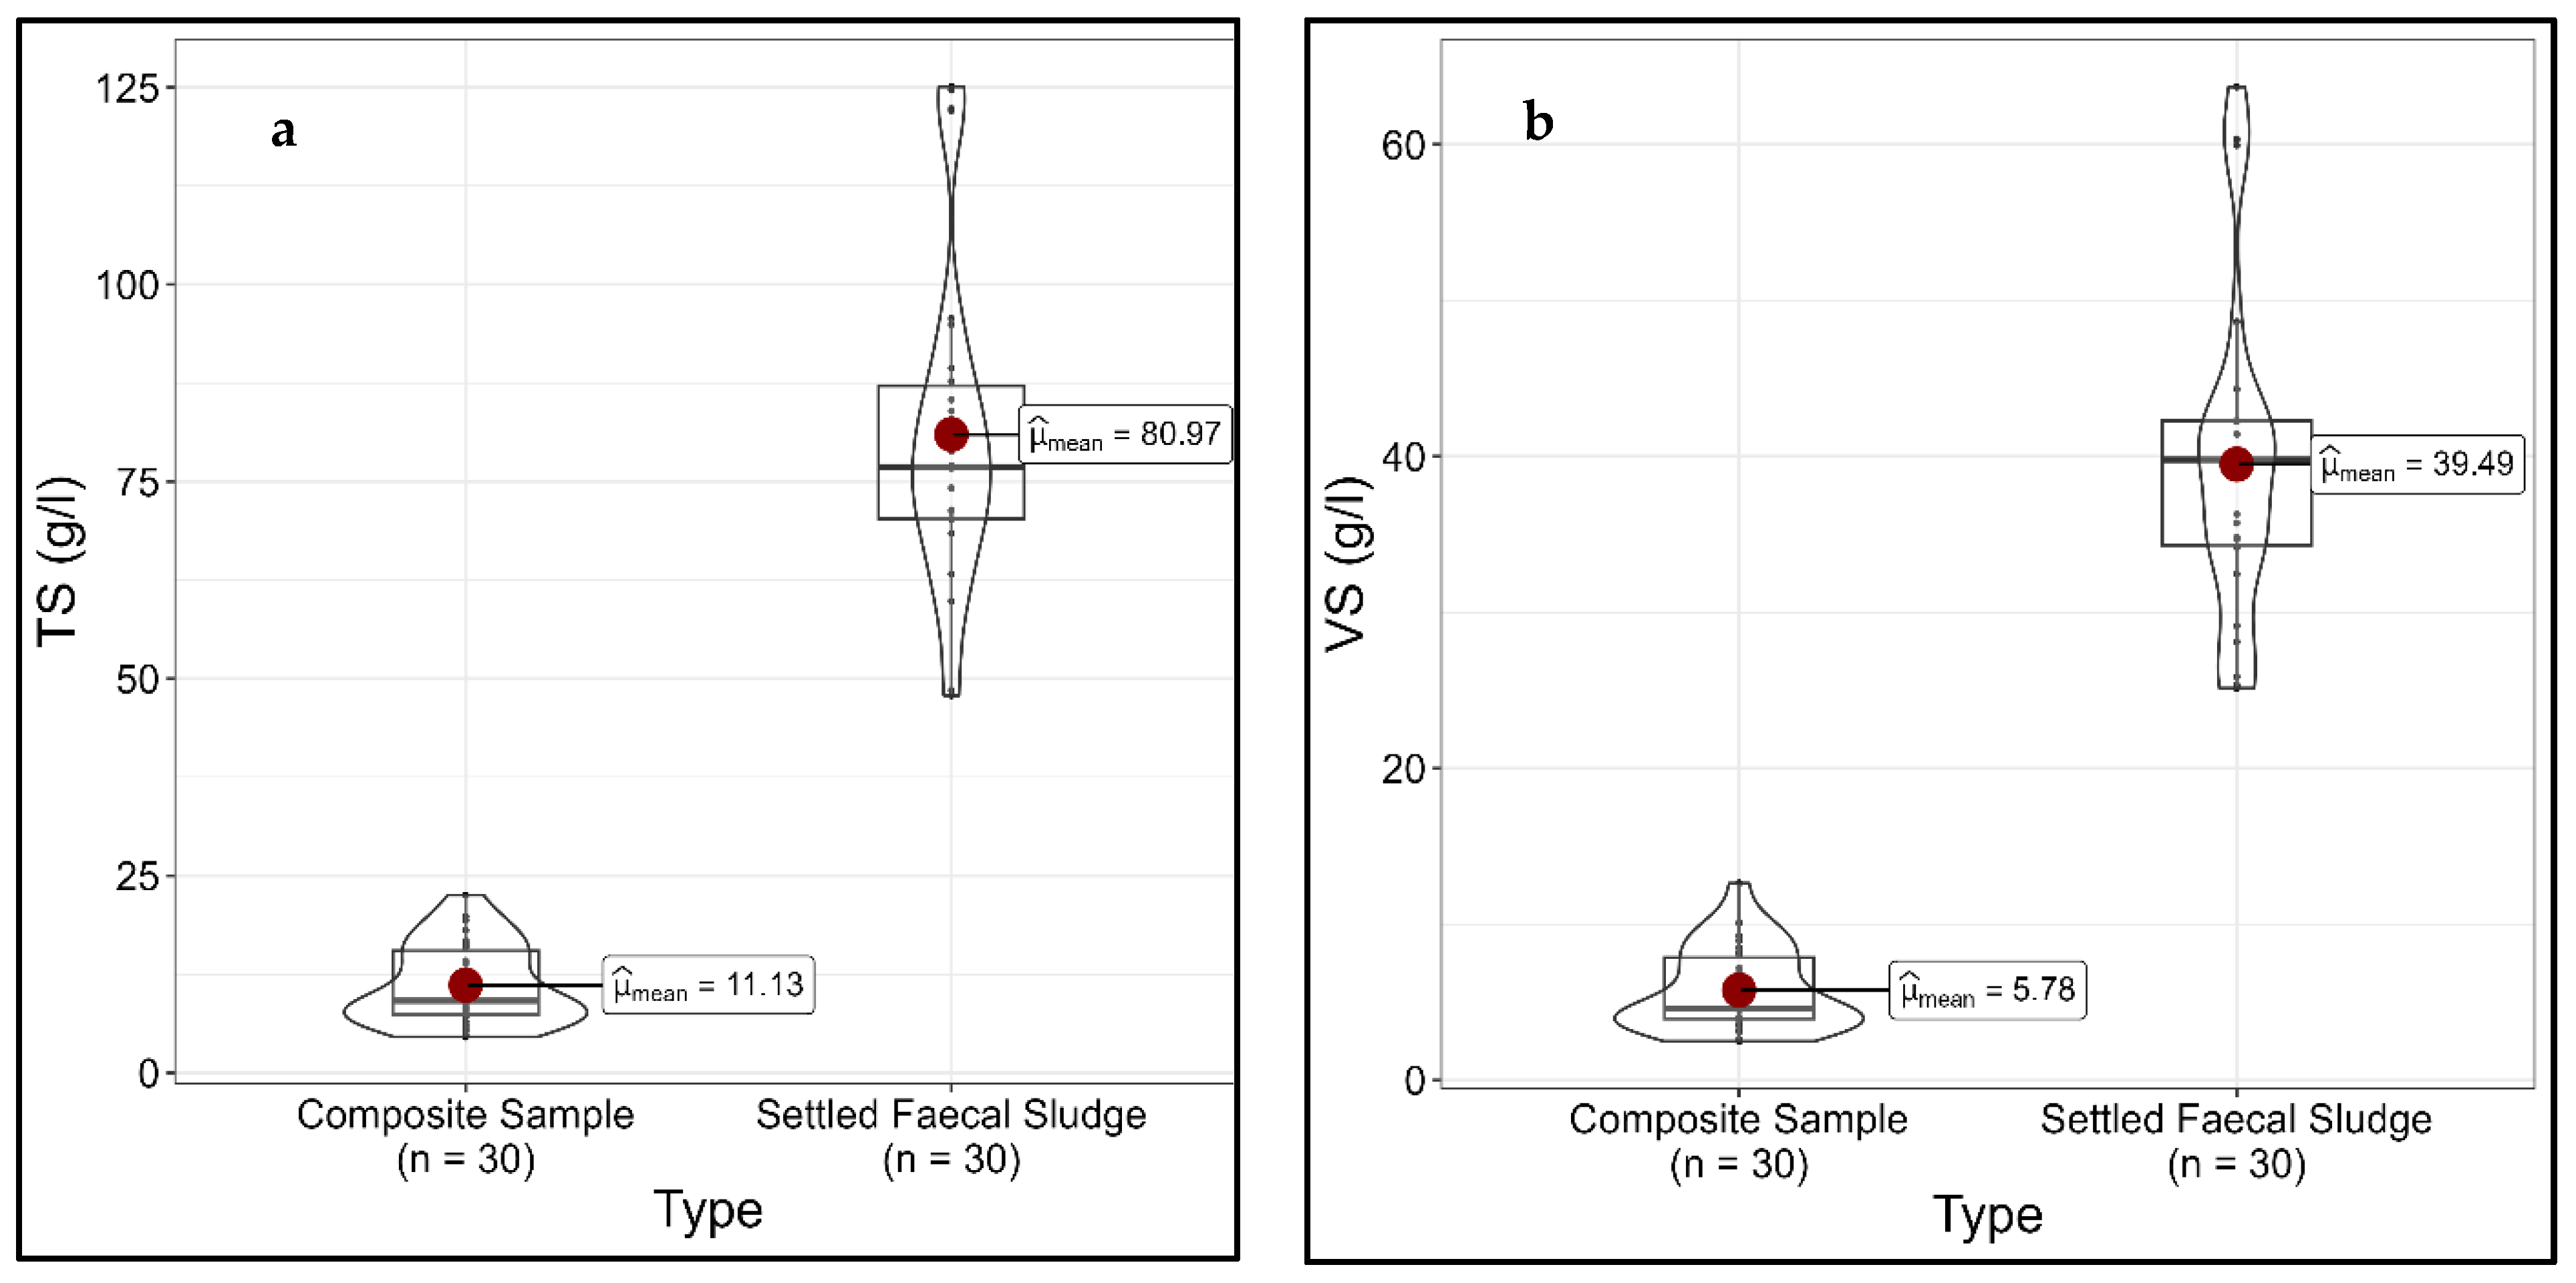
3.4. Characteristics of Settled Faecal Sludge
3.4.1. Total Solid and Volatile Content
3.4.2. Carbon/Nitrogen/Phosphorus Ratio
3.4.3. Content of Microorganisms and Heavy Metals
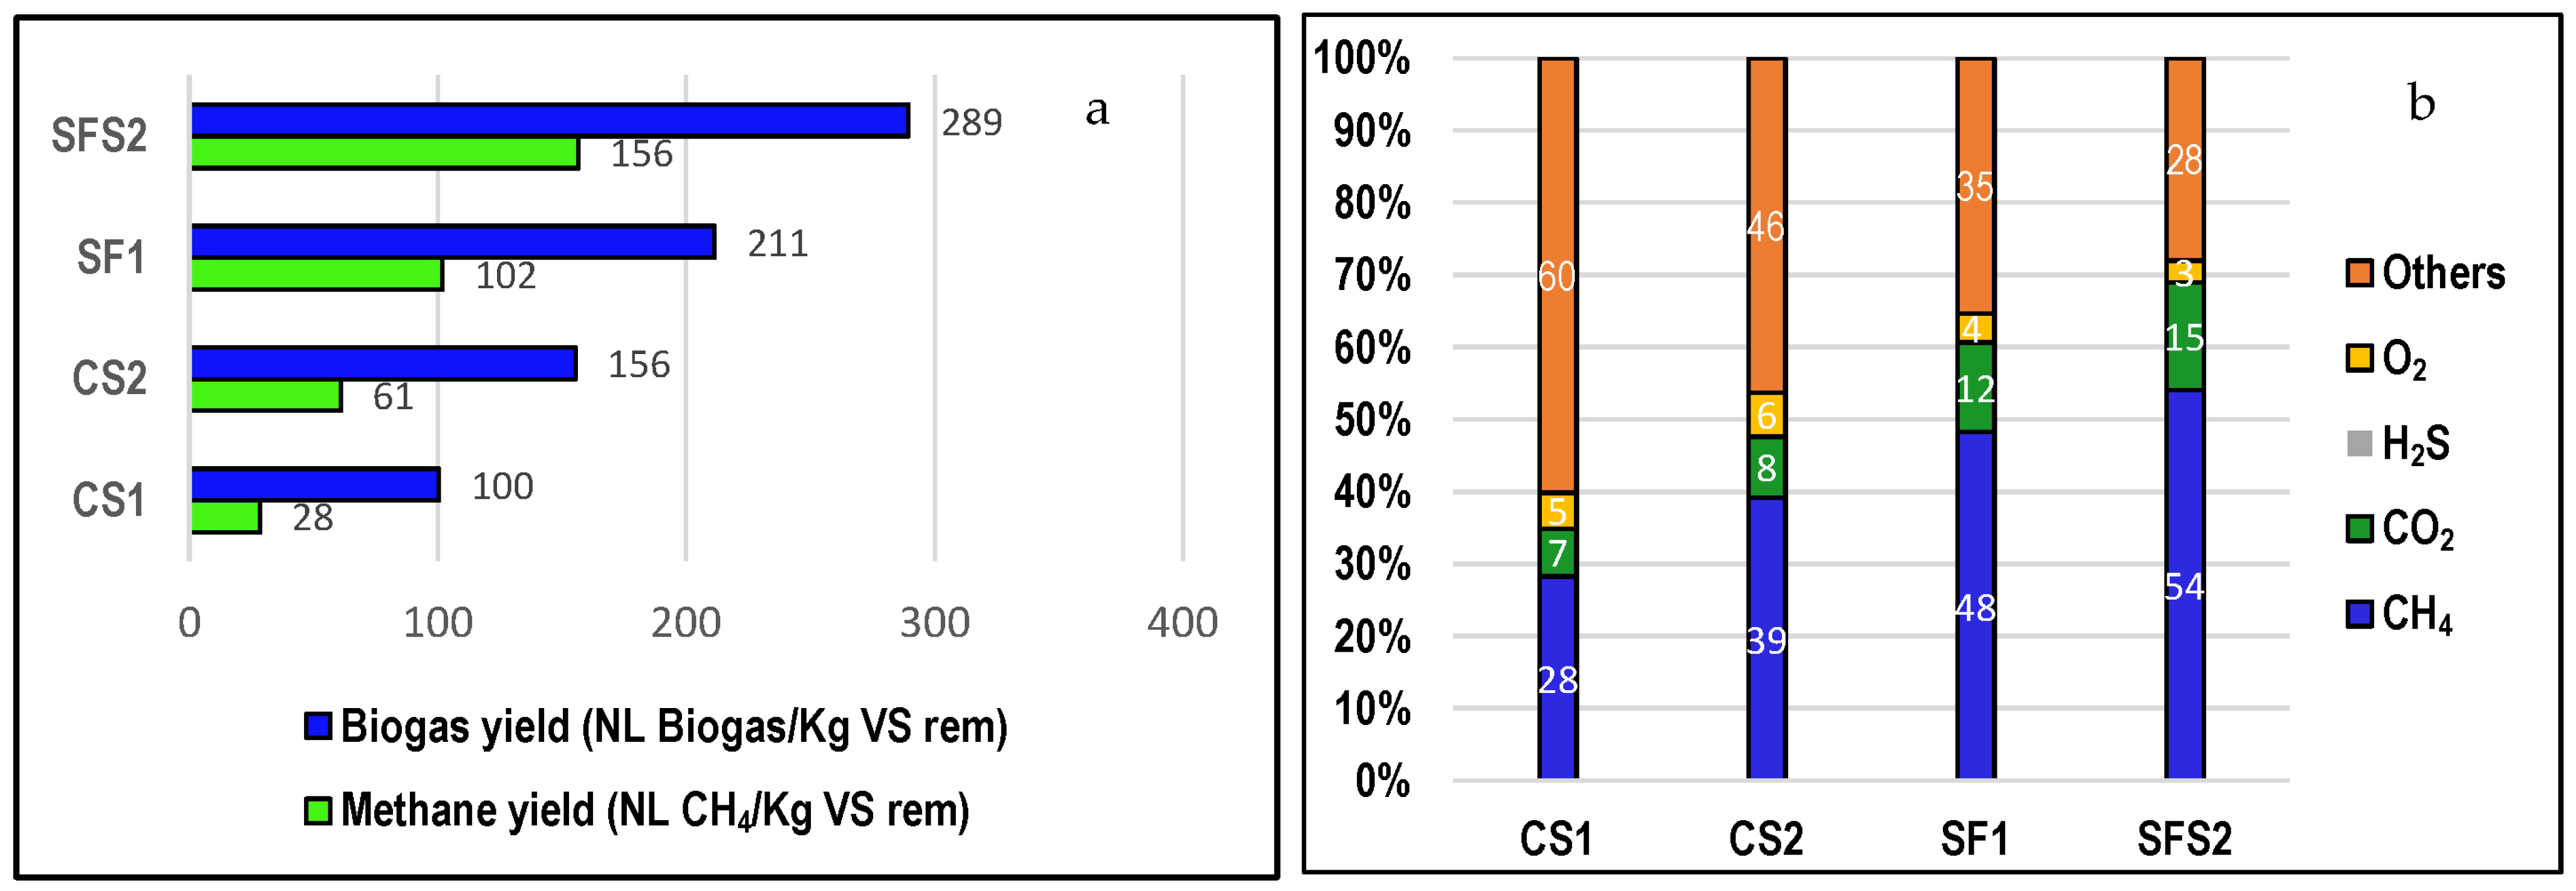
3.5. Methanogenic Potential of Faecal Sludge
4. Conclusions
- -
- Kossodo’s plant FS characteristics show a high heterogeneity according to the origin of the sludge.
- -
- Public toilets’ sludge is most suitable for energy recovery because it has volatile solids ≥ 60% and TS content around 2%. This study highlighted the contrast between sludge characteristics in the pits and the emptying methods that have an impact on the quality of the sludge discharged in the plant.
- -
- For energy recovery, sludge concentration is an alternative to increase the total solid and solid volatile content of sludge.
- -
- Settled faecal sludge have a better C/N ratio, which is an advantage for large scale AD.
Author Contributions
Funding
Institutional Review Board Statement
Informed Consent Statement
Data Availability Statement
Acknowledgments
Conflicts of Interest
References
- Strande, L.; Brdjanovic, D. Faecal Sludge Management: Systems Approach for Implementation and Operation; IWA Publishing: London, UK, 2014; ISBN 1-78040-473-5. [Google Scholar]
- JICA. Data Collection Survey Onurban Sanitation, Sewerage and Faecal Sludge Management in Africa; Final Report; Japan International Cooperation Agency: Tokyo, Japan, 2022.
- Peal, A.; Evans, B.; Blackett, I.; Hawkins, P.; Heymans, C. A Review of Fecal Sludge Management in 12 Cities. In World Bank Final Report; World Bank: Washington, DC, USA, 2015. [Google Scholar]
- Ahmed, I.; Ofori-Amanfo, D.; Awuah, E.; Cobbold, F. A Comprehensive Study on the Physicochemical Characteristics of Faecal Sludge in Greater Accra Region and Analysis of Its Potential Use as Feedstock for Green Energy. J. Renew. Energy 2019, 2019, e8696058. [Google Scholar] [CrossRef]
- Bassan, M.; Tchonda, T.; Yiougo, L.; Zoellig, H.; Mahamane, I.; Mbéguéré, M.; Strande, L. Characterization of Faecal Sludge during Dry and Rainy Seasons in Ouagadougou, Burkina Faso. In Proceedings of the 36th WEDC International Conference, Nakuru, Kenya, 1–5 July 2013. [Google Scholar]
- Blunier, P.; Koanda, H.; Koné, D.; Strauss, M.; Klutsé, A.; Tarradellas, J. Quantification Des Boues de Vidange. Exemple de La Ville de Ouahigouya, Burkina Faso. In Proceedings of the Forum de Recherche en Eau et Assainissement, CrePa, Ouagadougou, Burkina Faso, 6–10 December 2004. [Google Scholar]
- Bourgault, C. Characterization and Quantification of Faecal Sludge from Pit Latrines. Ph.D. Dissertation, Université Laval, Québec, QC, Canada, 2019. [Google Scholar]
- Eliyan, C.; McConville, J.R.; Zurbrügg, C.; Koottatep, T.; Sothea, K.; Vinnerås, B. Generation and Management of Faecal Sludge Quantities and Potential for Resource Recovery in Phnom Penh, Cambodia. Front. Environ. Sci. 2022, 10, 443. [Google Scholar] [CrossRef]
- Englund, M.; Carbajal, J.P.; Ferré, A.; Bassan, M.; Hoai Vu, A.T.; Nguyen, V.-A.; Strande, L. Modelling Quantities and Qualities (Q&Q) of Faecal Sludge in Hanoi, Vietnam and Kampala, Uganda for Improved Management Solutions. J. Environ. Manag. 2020, 261, 110202. [Google Scholar] [CrossRef]
- Junglen, K.; Rhodes-Dicker, L.; Ward, B.J.; Gitau, E.; Mwalugongo, W.; Stradley, L.; Thomas, E. Characterization and Prediction of Fecal Sludge Parameters and Settling Behavior in Informal Settlements in Nairobi, Kenya. Sustainability 2020, 12, 9040. [Google Scholar] [CrossRef]
- Maffo, P.D.; Kengne, E.S.; Wafo, G.V.D.; Nzouebet, W.A.L.; Zuitchou, M.N.; Liegui, G.S.; Wanda, C.; Fotso, F.; Noumsi, I.M.K. Quantification and Characterization of Faecal Sludge from a Tropical Urban Area: The Case Study of Douala, Cameroon. Int. J. Biol. Chem. Sci. 2019, 13, 105–113. [Google Scholar] [CrossRef]
- Strande, L.; Schoebitz, L.; Bischoff, F.; Ddiba, D.; Okello, F.; Englund, M.; Ward, B.J.; Niwagaba, C.B. Methods to Reliably Estimate Faecal Sludge Quantities and Qualities for the Design of Treatment Technologies and Management Solutions. J. Environ. Manag. 2018, 223, 898–907. [Google Scholar] [CrossRef] [PubMed]
- Wanda, C.; Kengne, E.S.; Wafo, G.V.D.; Nzouebet, W.A.L.; Nbendah, P.; Ngandjui, Y.A.T.; Zapfack, L.; Noumsi, I.M.K. Quantification and Characterisation of Faecal Sludge from On-Site Sanitation Systems Prior the Design of a Treatment Plant in Bangangte, West Region of Cameroon. Environ. Chall. 2021, 5, 100236. [Google Scholar] [CrossRef]
- Tayler, K. Faecal Sludge and Septage Treatment; Practical Action Publishing: Rugby, UK, 2018; pp. 1–250. ISBN 978-1-78044-986-9. [Google Scholar]
- Bassan, M.; Koné, D.; Mbéguéré, M.; Holliger, C.; Strande, L. Success and Failure Assessment Methodology for Wastewater and Faecal Sludge Treatment Projects in Low-Income Countries. J. Environ. Plan. Manag. 2015, 58, 1690–1710. [Google Scholar] [CrossRef]
- UNEP & IWMI. Faecal Sludge Management in Africa: Socioeconomic Aspects and Human and Environmental Health Implications International; United Nations Environment Programme & Water Management Institute (IWMI): Colombo, Sri Lanka, 2020. [Google Scholar]
- Coalition, T.B. Sanitation in the Circular Economy—Transformation to a Commercially Valuable, Self-Sustaining, Biological System. In A Thought Piece from the Toilet Board Coalition; The Toilet Board Coalition (TCB): Geneva, Switzerland, 2016. [Google Scholar]
- MacArthur, E. Towards the Circular Economy. J. Ind. Ecol. 2013, 2, 23–44. [Google Scholar]
- Coleman, A.; Sadare, O.O.; Aklin, M.; Daramola, M.O. Social-Economic Assessment of Valorization of Faecal Sludge into Value-Added Products: Case Study of Selected Products in Johannesburg Metropolis. In Proceedings of the AIP Conference Proceedings; AIP Publishing LLC: Melville, NY, USA, 2022; Volume 2437, p. 020125. [Google Scholar]
- INSD. Cinquième Recensement Général de La Population et de l’Habitation Du Burkina Faso/Rapport Définitif; Institut National de la Statistique et de la Démographie: Montrouge, France, 2020. [Google Scholar]
- Krueger, B.C.; Fowler, G.D.; Templeton, M.R. Critical Analytical Parameters for Faecal Sludge Characterisation Informing the Application of Thermal Treatment Processes. J. Environ. Manag. 2021, 280, 111658. [Google Scholar] [CrossRef]
- Niwagaba, C.; Mbéguéré, M.; Strande, L. Faecal Sludge Quantification, Characterisation and Treatment Objectives. In Faecal Sludge Management—Systems Approach Implementation and Operation; IWA Publishing: London, UK, 2014; pp. 15–42. [Google Scholar]
- Bigumandondera, P. Etude de l’assainissement Non Collectif En Afrique Subsaharienne: Application à La Ville de Bujumbura. Ph.D. Thesis, Université de Liège, Liège, Belgium, 2014; p. 227. [Google Scholar]
- Akpaki, O.; Baba, G.; Koledzi, K.E.; Segbeaya, K.N. Quantification et Valorisation En Biogaz Des Boues de Vidange Du Site d’Attidjin à Lomé. J. Soc. Ouest-Afr. Chim. 2016, 42, 30–35. [Google Scholar]
- Krou, N.M.; Baba, G.; Segbeaya, K.N.; Akpaki, O. Energy Recovery from Sewage Sludge and Fermentable Fractions of Solid Waste from the City of Sokode by Co-Digestion. In Proceedings of the Conference Proceedings: 1st German-West African Conference on Sustainable, Renewable Energy Systems SusRes, Kara, Togo, 1 July 2020; pp. 94–101. [Google Scholar]
- Nsavyimana, G. Modélisation Des Processus Physiques et Biologiques Dans Des Fosses Septiques et Voies de Valorisation Des Boues de Vidange: Application à Bujumbura-Burundi. Ph.D. Thesis, Université de Liège, Liège, Belgique, 2014; p. 269. [Google Scholar]
- Afifah, U.; Priadi, C. Biogas Potential from Anaerobic Co-Digestion of Faecal Sludge with Food Waste and Garden Waste; AIP Publishing: Melville, NY, USA, 2017; Volume 1826. [Google Scholar]
- Karne, H.U.; Bhatkhande, D.; Jabade, S. Mesophilic and Thermophilic Anaerobic Digestion of Faecal Sludge in a Pilot Plant Digester. Int. J. Environ. Stud. 2018, 75, 484–495. [Google Scholar] [CrossRef]
- Tazen, F.; Diarra, A.; Kabore, R.F.W.; Ibrahim, B.; Bologo/Traoré, M.; Traoré, K.; Karambiri, H. Trends in Flood Events and Their Relationship to Extreme Rainfall in an Urban Area of Sahelian West Africa: The Case Study of Ouagadougou, Burkina Faso. J. Flood Risk Manag. 2019, 12, e1250. [Google Scholar] [CrossRef]
- Mouhouyouddine, A.H. Analyse Piézométrique et Modélisation Des Signaux Hydrologiques et Gravimétriques Dans Les Aquifères Du Socle En Région Soudano-Sahélienne: Cas de Ouagadougou. Ph.D. Thesis, Université de Ouagadougou, Montpellier, France, 2015. [Google Scholar]
- Koanda, H.; Bassan, M.; Mbéguéré, M. Rapport d’analyse Institutionnelle de La Gestion Des Boues de Vidange Dans La Ville de Ouagadougou; Eawag: Dübendorf, Switzerland, 2010. [Google Scholar]
- Bassan, M.; Tchonda, T.; Mbeguere, M.; Strande, L. Optimizing the Faecal Sludge Management Scheme in Ouagadougou. Sustain. Sanit. Pract. 2012, 13, 22–24. [Google Scholar]
- Klingel, F.; Montangero, A.; Koné, D.; Strauss, M. Fecal Sludge Management in Developing Countries. In A Planning Manual. EAWAG: Swiss Federal Institute for Environmental Science and Technology SANDEC: Department for Water and Sanitation in Developing Countries; Eawag: Dübendorf, Switzerland, 2002. [Google Scholar]
- Klingel, F.; Montangero, A.; Koné, D.; Strauss, M. Gestion Des Boues de Vidange Dans Les Pays En Développement Manuel de Planification; Eawag: Dübendorf, Switzerland, 2002. [Google Scholar]
- APHA. Standard Methods for the Examination of Water and Wastewater, 21st ed.; American Public Health Association: Washington, DC, USA; American Water Works Association: Washington, DC, USA; Water Environment Federation: Washington, DC, USA, 2012. [Google Scholar]
- NF, T.-101 NF T90-101. Available online: https://www.boutique.afnor.org/fr-fr/norme/nf-t90101/qualite-de-leau-determination-de-la-demande-chimique-en-oxygene-dco/fa111555/18144 (accessed on 16 March 2023).
- Walkley, A.; Black, I.A. An Examination of the Degtjareff Method for Determining Soil Organic Matter, and a Proposed Modification of the Chromic Acid Titration Method. Soil Sci. 1934, 37, 29–38. [Google Scholar] [CrossRef]
- Hillebrand, W.F.; Lundell, G.E.F.; Bright, H.A.; Hoffman, J.I. Applied Inorganic Analysis; John Willey & Sons Inc.: New York, NY, USA, 1953. [Google Scholar]
- Nordmann, W. Die Überwachung Der Schlammfaulung. Eine Einfache Methode Zur Bestimmung Der Organischen Säuren Und Der Kalkreserve Im Faulwasser. Korresp. Abwasser Beil. KA-Informationen Fuer Das Betriebspersonal Von Abwasseranlagen 1977, 3, 1977. [Google Scholar]
- Ayres, R.M.; Mara, D.D.; World Health Organization. Analysis of Wastewater for Use in Agriculture: A Laboratory Manual of Parasitological and Bacteriological Techniques; World Health Organization: Geneva, Switzerland, 1996; ISBN 92-4-154484-8. [Google Scholar]
- Martin, T.D.; Brockhoff, C.A.; Creed, J.T.; Group, E.M.W. Method 200.7: Determination of Metals and Trace Elements in Water and Wastes by Inductively-Coupled Plasma-Atomic Emission Spectrometry; US Environmental Protection Agency, Office of Research and Development, Environmental Monitoring Systems Laboratory: Cincinnati, OH, USA, 1994; pp. 1–58.
- Holliger, C.; Alves, M.; Andrade, D.; Angelidaki, I.; Astals, S.; Baier, U.; Bougrier, C.; Buffière, P.; Carballa, M.; de Wilde, V.; et al. Towards a Standardization of Biomethane Potential Tests. Water Sci. Technol. 2016, 74, 2515–2522. [Google Scholar] [CrossRef]
- Angelidaki, I.; Alves, M.; Bolzonella, D.; Borzacconi, L.; Campos, J.L.; Guwy, A.J.; Kalyuzhnyi, S.; Jenicek, P.; Van Lier, J.B. Defining the Biomethane Potential (BMP) of Solid Organic Wastes and Energy Crops: A Proposed Protocol for Batch Assays. Water Sci. Technol. 2009, 59, 927–934. [Google Scholar] [CrossRef]
- Pham, C.H.; Triolo, J.M.; Cu, T.T.T.; Pedersen, L.; Sommer, S.G. Validation and Recommendation of Methods to Measure Biogas Production Potential of Animal Manure. Asian-Australas. J. Anim. Sci. 2013, 26, 864–873. [Google Scholar] [CrossRef]
- Zhou, H.; Li, X.; Xu, G.; Yu, H. Overview of Strategies for Enhanced Treatment of Municipal/Domestic Wastewater at Low Temperature. Sci. Total Environ. 2018, 643, 225–237. [Google Scholar] [CrossRef]
- Sawadogo, B.; Konatéa, Y.; Lesage, G.; Djanni, H.M.; Zaviska, F.; Heran, M.; Karambiri, H. Beer and Soft Drinks Industry Wastewater Treatment Using an Anoxic-Aerobic Membrane Bioreactor (MBR) Coupling with Nanofiltration in Sahelian Context. Desalination Water Treat. 2018, 126, 32–39. [Google Scholar] [CrossRef]
- Kodukula, P.S.; Prakasam TB, S.; Anthonisen, A.C. Role of pH in Biological Wastewater Treatment Processes. In Physiological Models in Microbiology; CRC Press: Boca Raton, FL, USA, 1988; ISBN 978-1-351-07565-7. [Google Scholar]
- Egle, L.; Rechberger, H.; Krampe, J.; Zessner, M. Phosphorus Recovery from Municipal Wastewater: An Integrated Comparative Technological, Environmental and Economic Assessment of P Recovery Technologies. Sci. Total Environ. 2016, 571, 522–542. [Google Scholar] [CrossRef] [PubMed]
- Cioabla, A.E.; Ionel, I.; Dumitrel, G.-A.; Popescu, F. Comparative Study on Factors Affecting Anaerobic Digestion of Agricultural Vegetal Residues. Biotechnol. Biofuels 2012, 5, 39. [Google Scholar] [CrossRef] [PubMed]
- Ward, B.J. Settling and Dewatering of Fecal Sludge: Building Fundamental Knowledge for Improved Global Sanitation. Ph.D. Thesis, ETH Zurich, Zürich, Switzerland, 2022. [Google Scholar]
- Ward, B.J.; Andriessen, N.; Tembo, J.M.; Kabika, J.; Grau, M.; Scheidegger, A.; Morgenroth, E.; Strande, L. Predictive models using “cheap and easy” field measurements: Can they fill a gap in planning, monitoring, and implementing fecal sludge management solutions? Water Res. 2021, 196, 116997. [Google Scholar] [CrossRef] [PubMed]
- Gold, M.; Harada, H.; Therrien, J.-D.; Nishida, T.; Cunningham, M.; Semiyaga, S.; Fujii, S.; Dorea, C.; Nguyen, V.-A.; Strande, L. Cross-Country Analysis of Faecal Sludge Dewatering. Environ. Technol. 2018, 39, 3077–3087. [Google Scholar] [CrossRef]
- Ward, B.J.; Traber, J.; Gueye, A.; Diop, B.; Morgenroth, E.; Strande, L. Evaluation of conceptual model and predictors of faecal sludge dewatering performance in Senegal and Tanzania. Water Res. 2019, 167, 115101. [Google Scholar] [CrossRef]
- Tembo, J. Faecal Sludge Characterisation for Enhanced Sanitation Provision in Peri-Urban Areas of Lusaka University of Zambia. Ph.D. Dissertaton, University of Zambia, Lusaka, Zambia, 2019. [Google Scholar]
- Tembo, J.M.; Matanda, R.; Banda, I.N.; Mwanaumo, E.; Nyirenda, E.; Mambwe, M.; Nyambe, I.A. Pit Latrine Faecal Sludge Solid Waste Quantification and Characterization to Inform the Design of Treatment Facilities in Peri-Urban Areas: A Case Study of Kanyama. AJEST 2019, 13, 260–272. [Google Scholar] [CrossRef]
- Fanyin-Martin, A.; Tamakloe, W.; Antwi, E.; Ami, J.; Awarikabey, E.; Apatti, J.; Mensah, M.; Chandran, K. Chemical Characterization of Faecal Sludge in the Kumasi Metropolis, Ghana. Gates Open Res. 2017, 1, 12. [Google Scholar] [CrossRef]
- Gold, M.; Dayer, P.; Faye, M.C.A.S.; Clair, G.; Seck, A.; Niang, S.; Morgenroth, E.; Strande, L. Locally Produced Natural Conditioners for Dewatering of Faecal Sludge. Environ. Technol. 2016, 37, 2802–2814. [Google Scholar] [CrossRef]
- Semiyaga, S.; Okure, M.A.E.; Niwagaba, C.B.; Katukiza, A.Y.; Kansiime, F. Decentralized Options for Faecal Sludge Management in Urban Slum Areas of Sub-Saharan Africa: A Review of Technologies, Practices and End-Uses. Resour. Conserv. Recycl. 2015, 104, 109–119. [Google Scholar] [CrossRef]
- Appiah-Effah, E.; Kwabena, B. Characterization of public toilet sludge from peri-urban and rural areas of ashanti region of ghana. Mental 2014, 9, 175–184. [Google Scholar]
- Katukiza, A.Y.; Ronteltap, M.; Niwagaba, C.B.; Foppen, J.W.A.; Kansiime, F.; Lens, P.N.L. Sustainable Sanitation Technology Options for Urban Slums. Biotechnol. Adv. 2012, 30, 964–978. [Google Scholar] [CrossRef] [PubMed]
- NWSC NWSC (National Water and Sewerage Corporation). Kampala Sanitation Program (KSP)—Feasibility Study for Sanitation Master in Kampala, Uganda 2008. 2008. Available online: www.afdb.org/sites/default/files/documents/projects-and-operations/uganda_-_program_kampala_sanitation_program_-_phase_i_-_program_appraisal_report.pdf (accessed on 16 March 2023).
- Koné, D.; Strauss, M. Low-Cost Options for Treating Faecal Sludges (FS) in Developing Countries–Challenges and Performance. In Proceedings of the 9th International IWA Specialist Group Conference on Wetlands Systems for Water Pollution Control and to the 6th International IWA Specialist Group Conference on Waste Stabilisation Ponds, Avignon, France, 27 September–1 October 2004; Volume 27, p. 3. [Google Scholar]
- Heinss, U.; Larmie, S.A.; Strauss, M. Solids Separation and Pond Systems. In For the Treatment of Faecal Sludges in the Tropics. Lessons Learnt and Recommendations for Preliminary Design; Swiss Federal Institute for Environmental Science and Technology: Duebendorf, Switzerland, 1998. [Google Scholar]
- Strauss, M.; Larmie, S.A.; Heinss, U. Treatment of Sludges from On-Site Sanitation—Low-Cost Options. Water Sci. Technol. 1997, 35, 129–136. [Google Scholar] [CrossRef]
- Kouawa, T. Traitement des Boues de Vidange par Lits de Séchage Sous Climat Soudano-Sahélien. Ph.D. Thesis, Université de Strasbourg, Strasbourg, France, 2016. [Google Scholar]
- Moletta, R. La Méthanisation; Lavoisier: Paris, France, 2008; ISBN 978-2-7430-1036-2. [Google Scholar]
- Burton, F.L.; Pfrang, W.; Stensel, H.D.; Tchobanoglous, G.; Tsuchihashi, R.; AECOM (Firm); Eddy, M.; Abu-Orf, M.; Bowden, G. Wastewater Engineering: Treatment and Resource Recovery; McGraw Hill Education: New York, NY, USA, 2014; ISBN 1-259-01079-1. [Google Scholar]
- Khanal, S.K.; Nindhia, T.G.T.; Nitayavardhana, S. Biogas from Wastes: Processes and Applications. In Sustainable Resource Recovery and Zero Waste Approaches; Elsevier: Amsterdam, The Netherlands, 2019; pp. 165–174. [Google Scholar]
- Wilkie, A.C. Anaerobic Digestion of Dairy Manure: Design and Process Considerations. Dairy Manure Manag. Treat. Handl. Community Relat. 2005, 301, 301–312. [Google Scholar]
- Boutayeb, M.; Bouzidi, A.; Fekhaoui, M. Study of the physical-chemical quality of bulk waste waters of five cities of the Chaouia-Ouardigha region, Morocco. Bull. L’institut Sci. Sect. Sci. Vie 2012, 34, 145–150. [Google Scholar]
- ADEME La Méthanisation: Comment Se Fait La Transformation de La Matière Organique En Énergie. Available online: https://bourgogne-franche-comte.ademe.fr/sites/default/files/comment-se-transforme-la-matiere-organique-en-energie.pdf (accessed on 16 March 2023).
- Bouallagui, H.; Touhami, Y.; Cheikh, R.B.; Hamdi, M. Bioreactor Performance in Anaerobic Digestion of Fruit and Vegetable Wastes. Process Biochem. 2005, 40, 989–995. [Google Scholar] [CrossRef]
- Colón, J.; Forbis-Stokes, A.A.; Deshusses, M.A. Anaerobic Digestion of Undiluted Simulant Human Excreta for Sanitation and Energy Recovery in Less-Developed Countries. Energy Sustain. Dev. 2015, 29, 57–64. [Google Scholar] [CrossRef]
- Strande, L.; Englund, M.; Andriessen, N.; Carbajal, J.P.; Scheidegger, A.; Velkushanova, K.; Ronteltap, M.; Koottatep, T.; Brdjanovic, D. Estimating Quantities and Qualities (Q&Q) of Faecal Sludge at Community to Citywide Scales; IWA Publishing: London, UK, 2021. [Google Scholar]
- Vögeli, Y.; Lohri, R.; Gallardo, A.; Diener, S.; Zurbrugg, C. Anaerobic Digestion of Biowaste in Developing Countries: Practical Information and Case Studies; Eawag—Swiss Federal Institute of Aquatic Science and Technology: Dübendorf, Switzerland, 2014; ISBN 978-3-906484-58-7. [Google Scholar]
- Schnaars, K. What Every Operator Should Know about Anaerobic Digestion. Available online: https://www.wef.org/globalassets/assets-wef/direct-download-library/public/operator-essentials/wet-operator-essentials---anaerobic-digestion---dec12.pdf (accessed on 16 March 2023).
- Corse, M. Méthanisation Des Boues de Stations: Règle de l’art et État Des Lieux Sur Les Bassins Rhône-Méditerranée et Corse. 2012. Available online: www.graie.org/graie/graiedoc/reseaux/depotage/depot-biblio-rapport-aermc-methanisation-dec12.pdf (accessed on 16 March 2023).
- Deublein, D.; Steinhauser, A. Biogas from Waste and Renewable Resources: An Introduction; John Wiley & Sons: Hoboken, NJ, USA, 2011; ISBN 3-527-64371-0. [Google Scholar]
- Haque, M.S.; Haque, N.N. Studies on the Effect of Urine on Biogas Production. Bangladesh J. Sci. Ind. Res. 2006, 41, 25. [Google Scholar] [CrossRef]
- Alrawashdeh, K.A.b.; Gul, E.; Yang, Q.; Yang, H.; Bartocci, P.; Fantozzi, F. Effect of Heavy Metals in the Performance of Anaerobic Digestion of Olive Mill Waste. Processes 2020, 8, 1146. [Google Scholar] [CrossRef]
- Abdel-Shafy, H.I.; Mansour, M.S.M. Biogas Production as Affected by Heavy Metals in the Anaerobic Digestion of Sludge. Egypt. J. Pet. 2014, 23, 409–417. [Google Scholar] [CrossRef]
- Guo, Q.; Majeed, S.; Xu, R.; Zhang, K.; Kakade, A.; Khan, A.; Hafeez, F.Y.; Mao, C.; Liu, P.; Li, X. Heavy Metals Interact with the Microbial Community and Affect Biogas Production in Anaerobic Digestion: A Review. J. Environ. Manag. 2019, 240, 266–272. [Google Scholar] [CrossRef] [PubMed]
- Selling, R.; Håkansson, T.; Björnsson, L. Two-Stage Anaerobic Digestion Enables Heavy Metal Removal. Water Sci. Technol. 2008, 57, 553–558. [Google Scholar] [CrossRef] [PubMed]
- Christiane, Q.N.; Amankwah, E.; Awafo, E.A.; Sodre, S. Valorization of Faecal Sludge and Organic Waste in Bobo-Dioulasso, Burkina Faso to Improve Sanitation, Enhance Soil and Improve Agricultural Productivity. Energy Rep. 2023, 9, 4951–4959. [Google Scholar] [CrossRef]
- Velkushanova, K.; Brdjanovic, D.; Koottatep, T.; Strande, L.; Buckley, C.; Ronteltap, M. Methods for Faecal Sludge Analysis; IWA Publishing: London, UK, 2021. [Google Scholar]
- Haq, P.S.E.; Soedjnon, E.S. Potensi Lumpur Tinja Sebagai Penghasil Biogas Institut Teknologi Sepuluh November 1–13. Available online: https://docplayer.info/30359483-Potensi-lumpur-tinja-manusia-sebagai-penghasil-biogas.html (accessed on 18 March 2023).
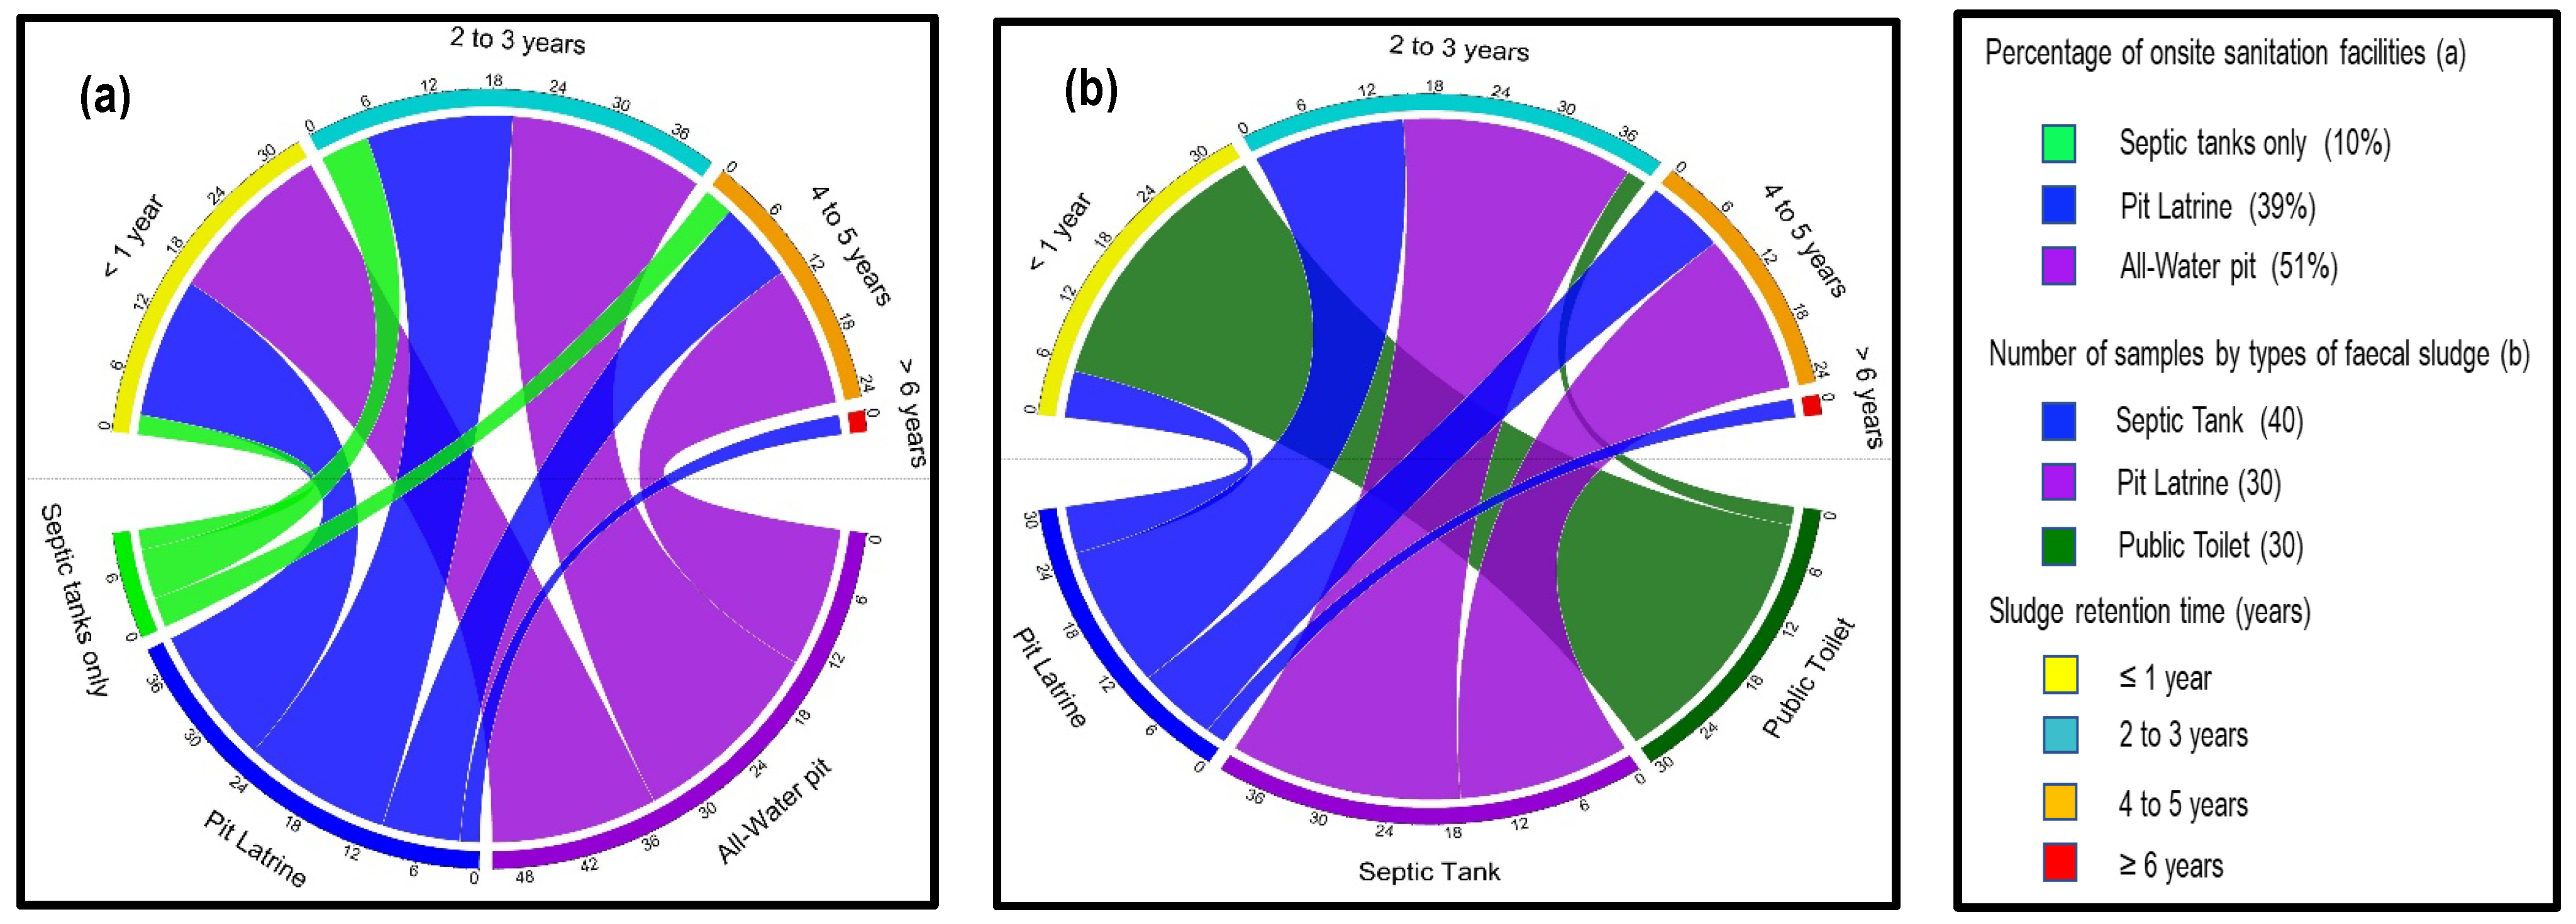


| Designation | Onsite Sanitation Type | Description | Percentage | |
|---|---|---|---|---|
| Septic tank (40) | Family cesspool connected to a septic tank and associated works | All water pits (34) | Modern toilet with manual connected to black and grey water | 85% |
| Septic tank only (6) | Modern toilet with manual flush siphon without connexion to black and grey water | 15% | ||
| Pit Latrine (30) | Sludge from private latrines (traditional latrines, improved pit latrines) | Traditional latrine (30) | Excreta and anal cleansing materials (water or solids) are deposited in a pit | 100% |
| Public Toilet (30) | Works with a large number of users. Collects sludge from restaurants, mosques, churches, and public services. | Septic tank only (4) | Modern toilet with manual flush siphon without connexion to black and grey water | 13% |
| Traditional latrine (9) | Excreta and anal cleansing materials (water or solids) are deposited in a pit | 30% | ||
| All water pits (17) | Modern toilet with manual connected to black and grey water come from restaurants, drinking establishment, and health centers | 57% | ||
| Composite samples (30) | Mixture of sludge from two or three onsite sanitation systems | (latrine + septic tank + all-water tank, (30) | Mixtures of sludge from two or three on-site wastewater treatment plants | 100% |
| Dry Season (65) | Wet Season (65) | ||||
|---|---|---|---|---|---|
| Parameters | Unit | Mean | SD | Mean | SD |
| Temperature | °C | 31.12 | 1.14 | 31.09 | 1.23 |
| pH | 7.7 | 0.34 | 7.71 | 0.33 | |
| Moisture | (%) | 98.7 | 0.7 | 99.01 | 0.60 |
| TS | (%) | 1.24 | 0.7 | 0.98 | 0.60 |
| TS | g/L | 12.3 | 7.1 | 10.14 | 6.40 |
| VS | (% TS) | 53.3 | 10.6 | 56.1 | 10.9 |
| VS | g/L | 7 | 4.9 | 6 | 4.6 |
| TC | (% TS) | 31.1 | 6.1 | 32.9 | 6.14 |
| TN | mg/L | 577 | 455 | 776 | 658 |
| C/N | 7.78 | 4.35 | 5.65 | 3.94 | |
| COD | g/L | 10.10 | 6.15 | 8.39 | 5.73 |
| BOD5 | g/L | 1.73 | 1.03 | 1.55 | 1.12 |
| COD/BOD5 | 6.04 | 1.84 | 5.75 | 1.75 | |
| Composite Sample (n = 30) | Settled Faecal Sludge (n = 30) | |||||
|---|---|---|---|---|---|---|
| Parameters | Unit | Mean ± SD | Mean ± SD | Range | Start of Inhibition | Reference |
| pH | 7.94 ± 0.3 | 7.52 ±0.4 | 6.5–8.0 | [48] | ||
| TS | (g/L) | 11± 5 | 80.9 ± 20 | (2–5)–(15–20) | [66] | |
| VS | (g/L) | 5.8 ± 2.6 | 39.5 ± 10.5 | ≥60 | [75] | |
| TAC | (mg CaCO3/L) | 1603 ± 408 | 2973 ± 748 | 1500–5000 | [76] | |
| VFA | (mg/L CH3COOH) | 72 ± 31 | 254 ± 32 | --- | ||
| -N | (mg/L) | 289 ± 136 | 976 ± 161 | ≤1500 | 1500–3000 | [77,78] |
| TC | (%TS) | 30.5 ± 4.4 | 35.3±6.5 | |||
| TN | (%TS) | 4.9 ± 3.87 | 3.1 ± 1 | |||
| C/N | 8.1 ± 6.2 | 11.7 ± 2.7 | 20–30 | [79] | ||
| FC | CFU/100 mL | 1.5 × 10⁶ ± 1.3 × 10⁶ | 7.5 × 10⁶ ± 6 × 10⁶ | |||
| E-coli | CFU/100 mL | 8.1 × 10⁵ ± 7 × 10⁵ | 2.1 × 10⁶ ± 1.7 × 10⁶ | |||
| Helminthes | œufs/L | 1.2 × 10⁴ ± 1.5 × 10² | 1.7 × 10⁴ ± 3.8 × 10² | |||
| As | mg/L | 0.016 ± 0.013 | 0.03 ± 0.01 | - | ||
| Cr | mg/L | 0.043 ± 0.041 | 0.76 ± 0.83 | 0.005–50 | 28–300 | [78] |
| Cu | mg/L | 0.45 ± 0.24 | 2.06 ± 2.20 | - | 5–300 | |
| Hg | mg/L | ˂*DL | 0.03 ± 0.01 | - | ||
| Mn | mg/L | 1.21 ± 1.32 | 5.76 ± 6.99 | 0.005–50 | 1500 | |
| Ni | mg/L | 0.02 ± 0.005 | 0.47 ± 0.1 | 0.005–0.5 | 10–300 | |
| Pb | mg/L | 0.20 ± 0.18 | 0.45 ± 0.1 | 0.02–200 | 8–340 | |
| Zn | mg/L | 1.71 ± 1.65 | 9.67 ± 12.1 | - | 3–400 | |
| Season | Designation | pH | TS | VS | TA | VFA | NT | TP | COD | BOD5 | COD/BOD5 | C/N |
|---|---|---|---|---|---|---|---|---|---|---|---|---|
| Unit | % | % | mg/L | mg/L | mg/L | mg/L | mg/L | mg/L | ||||
| CS1 | 8.1 | 1.68 | 48.1 | 1206 | 89 | 1322 | 232 | 7800 | 1200 | 6.5 | 4.2 | |
| Dry | SFS1 | 7.8 | 7.95 | 49.3 | 1814 | 386 | 2160 | 426 | 38,200 | 5000 | 7.6 | 11.2 |
| CS2 | 7.6 | 1.82 | 55.4 | 1020 | 92 | 864 | 182 | 12,400 | 3400 | 3.6 | 7.2 | |
| Wet | SFS2 | 7.4 | 7.52 | 54.2 | 2010 | 620 | 2082 | 787 | 42,400 | 9000 | 4.7 | 12.3 |
| FS Volume | OLR | Abatement Rate | Digestate | Methane Yield (NL CH4/Kg) | ||||
|---|---|---|---|---|---|---|---|---|
| Unit | L | gVSL−1 | % (VS) | % (TS) | TS (%) | VS (%TS) | of VS Rem | of TS Add |
| CS1 | 2 | 8.08 | 46.8 | 39.9 | 1.01 | 42.6 | 28 | 6.4 |
| SFS1 | 2 | 39.2 | 52.3 | 42 | 4.61 | 40.5 | 102 | 26.3 |
| CS2 | 2 | 10.08 | 54.2 | 47.8 | 0.95 | 48.6 | 61 | 18.3 |
| SFS2 | 2 | 40.75 | 56.2 | 44 | 4.21 | 42.4 | 156 | 47.5 |
Disclaimer/Publisher’s Note: The statements, opinions and data contained in all publications are solely those of the individual author(s) and contributor(s) and not of MDPI and/or the editor(s). MDPI and/or the editor(s) disclaim responsibility for any injury to people or property resulting from any ideas, methods, instructions or products referred to in the content. |
© 2023 by the authors. Licensee MDPI, Basel, Switzerland. This article is an open access article distributed under the terms and conditions of the Creative Commons Attribution (CC BY) license (https://creativecommons.org/licenses/by/4.0/).
Share and Cite
Ouedraogo, N.I.G.; Konaté, Y.; Sawadogo, B.; Beré, E.; Sodré, S.; Karambiri, H. Characterization and Methanogenic Potential Evaluation of Faecal Sludge: Case of the Kossodo Biogas Plant in Ouagadougou. Sustainability 2023, 15, 16401. https://doi.org/10.3390/su152316401
Ouedraogo NIG, Konaté Y, Sawadogo B, Beré E, Sodré S, Karambiri H. Characterization and Methanogenic Potential Evaluation of Faecal Sludge: Case of the Kossodo Biogas Plant in Ouagadougou. Sustainability. 2023; 15(23):16401. https://doi.org/10.3390/su152316401
Chicago/Turabian StyleOuedraogo, Noaga Inès Gwladys, Yacouba Konaté, Boukary Sawadogo, Elfried Beré, Soumaila Sodré, and Harouna Karambiri. 2023. "Characterization and Methanogenic Potential Evaluation of Faecal Sludge: Case of the Kossodo Biogas Plant in Ouagadougou" Sustainability 15, no. 23: 16401. https://doi.org/10.3390/su152316401