Article

Assessing the Durability and Acoustic Performance of a Novel Two-Layer Pavement System

1
Institute of Highway Engineering, RWTH Aachen University, 52074 Aachen, Germany
2
Federal Highway Institute, 51427 Bergisch Gladbach, Germany
*
Author to whom correspondence should be addressed.
Sustainability 2023, 15(23), 16475; https://doi.org/10.3390/su152316475
Submission received: 29 October 2023 / Revised: 28 November 2023 / Accepted: 29 November 2023 / Published: 30 November 2023
(This article belongs to the Special Issue Sustainable Pavement Materials)

Abstract

:
In the quest for more sustainable pavement solutions, this study demonstrates the successful strengthening of a unique noise-reducing two-layer road surface. While existing noise-reducing pavements reveal high acoustic efficiency, they lack mechanical strength, and earlier research efforts addressed the optimization of the individual components of this system, and a comprehensive perspective on its integrated performance remained elusive. Therefore, this research bridges this knowledge gap through an in-depth laboratory evaluation, in which the requirements for the realization of a full-scale demonstrator were defined, followed by a comprehensive performance assessment in terms of acoustic and mechanical strength. The post-construction assessment reveals the system’s multifaceted strengths, considering noise reduction, resilience under heavy traffic, pavement deflections, and skid resistance, assessed by CPX measurements, accelerated pavement tests using the MLS 30, skid resistance tests employing the pendulum test, as well as the slow-moving longitudinal friction test (MicroGriptester) and falling weight deflectometer (FWD) measurements. Although the optimized system implies lower noise-reduction potential, it exhibits great strength compared to previous noise-reducing pavements. In general, the system offers viable noise mitigation solutions for urban highways, particularly in settings where traditional noise abatement measures are constrained by space. The insights from this study serve as a valuable reference for the development and evaluation of innovative road engineering materials and technologies.

1. Introduction

Noise originating from road traffic has been a persistent companion for many residents for years, a phenomenon that continues to escalate due to the increasing volume of traffic [1]. It significantly affects the population residing in close proximity to roads in a predominantly adverse manner and can potentially lead to long-term health impairments [2]. To mitigate road traffic noise, noise-reducing road surfaces are currently being employed. These surfaces aim to diminish the noise generated by tire–road interaction during vehicle movement. This strategy enables a partial reduction of traffic noise, which encompasses propulsion, aerodynamic, and tire–road noise, through the design of the road surface. Among the existing noise-reducing road surfaces are noise-optimized bituminous asphalt [3], porous asphalt [4], poro-elastic road surfaces (PERS) [5,6], polyurethane-asphalt (PU-asphalt) [7], and the two-layered noise-reducing surface system known as LIDAK [8].
Noise reduction functionalities of road surfaces can be categorized into three primary mechanisms. Open-pore surfaces with an extensively branched cavity system exhibit high absorption capacity, capable of capturing and absorbing aerodynamic noise. Additionally, they diminish compression and decompression noises (i.e., air-pumping) [5,9]. Another noise-reducing function involves a flat road texture (‘plateau with grooves’) that reduces tire vibration excitation [4,9]. Furthermore, there exists the function of elasticity within a layer, causing the layer to yield upon tire impact, absorbing structure-borne noise from the tire and thereby reducing tire vibrations resulting from the impact. Furthermore, a frequency dependency of road-tire noises was observed. Airborne road noise, such as air pumping, pipe, and Helmholtz resonances, is perceptible in the higher frequency range above 1000 Hz. In contrast, structure-borne noise, like tire vibrations, stick-slip, and stick-snap sounds, tends to generate road noise in the lower frequency range below 1000 Hz.
Establishing a new pavement, in reality, requires the application of principles of pavement design, aiming to develop roads free from failures and with consistent functionality throughout their life cycle. Dimensioning focuses on avoiding structural and functional failures. Structural failures encompass damages leading to pavement collapse, rendering them incapable of withstanding traffic loads. On the other hand, functional failures result in significantly compromised comfort or safety for road users. These damages occur when traffic loads or environmental influences were inadequately considered during road design or have significantly changed over time. They may also stem from the failure of the materials used (surface fatigue, consolidation, or shear). Many damages can be attributed to the quality of the bound and unbound subgrade. However, some relate to failures within the wear layer. For instance, in flexible pavements, failure of the top layers might emanate from underdesigning regarding layer thickness, inadequate compaction, or poor internal friction, causing structural damages like cracking, rutting, or shear failure. Functional damage, for instance, can arise from an excessive use of bitumen leading to the phenomenon of bleeding, significantly diminishing skid resistance [10].
Merely possessing maximum acoustic noise-reducing effects does not suffice for the practical implementation of noise-reducing road surfaces. They must also adhere to the mentioned design principles and withstand the loads from traffic and the environment.
In the literature, it is evident that noise-reducing road systems, despite exhibiting high noise reduction efficacy, tend to experience structural failures under real loads. Porous asphalts carry a high risk of ravelling over their service life [4]. Poro-elastic road surfaces (PERS) have been observed to detach from the base layer or suffer aggregate breakage [6]. LIDAK demonstrates significantly low mechanical strength in the texture layer, since assessments using the Aachen ravelling tester (ARTe) revealed considerable surface wear after just 30 min of shear stress [8].
In previous studies by Refs. [11,12], the LIDAK system underwent optimization in its individual components. The concept of the optimized LIDAK system is depicted in Figure 1. This illustration portrays a texture layer comprising numerous texture elements. A textile mesh ensures interconnection among the texture layer elements, facilitating airflow through the apertures into the underlying absorption layer. The dual-layered system significantly diminishes the generation of tire–road noise owing to the unique texture of the texture layer. Simultaneously, any resulting aerodynamic noise (including environmental sources) can be absorbed by the absorption layer beneath.
The individual layers of LIDAK (texture layer and absorption layer) have been further developed in terms of their stability. The composition of the absorption layer from LIDAK, consisting of a high proportion of crump rubber, aggregates, and polyurethane binder, was modified to enhance its mechanical stability. This was achieved through a substantial reduction in the rubber content, which decreases the elasticity of the layer and the use of a high strength polyurethane (Elastan® 6568/103, BASF Polyurethanes GmbH, Lemförde, Germany). Through the remaining proportion of crump rubber, it still enables a certain elasticity, which should lead to low mechanical tire vibrations. In the study by [11], the absorption layer was comprehensively examined and enhanced in terms of its performance characteristics: deformation behavior, low-temperature behavior, and fatigue behavior, showing high resistance to deformation and fatigue, and reasonable resistance to low-temperature. The absorption behavior reached an absorption coefficient ( α ) of nearly 1.0. The textured top layer, consisting of cold plastic, was mechanically optimized as well to enhance its resistance to ravelling. This involved a new material definition, geometric adjustment, and the integration of a textile, resulting in increased resistance to ravelling and no visible wear of the texture layer during shear stress tests in the ARTe. With this optimization, the texture layer could withstand forces from heavy truck loads (such as an overloaded full-breaking truck) [12].
Based on insights from the literature, there is a necessity to optimize noise-reducing systems concerning their structural integrity. This study aims to leverage the optimizations conducted by [11,12] regarding the LIDAK system to integrate its individual components into a comprehensive system. A holistic examination of distress prevention cannot be conducted due to insufficient knowledge about the subgrade of the demonstration area. However, there is an opportunity to determine the strength of the evolved surface layer system. In this case, overall strength comprises the individual strengths of the layers (previously investigated in [11,12]) and the bond between these layers. This can be further examined through bond strength and accelerated pavement tests that will be evaluated by visual assessment as well as skid resistance and load-bearing tests. Additionally, it is possible to assess the functional condition of the surface layer system, characterized by its skid resistance and noise-reducing effectiveness, which can be achieved through skid resistance and acoustic measurements.

2. Materials and Methods

A polymethyl methacrylate*1 (PMMA) binder is the binding agent of the texture layer. PMMA is the basic component of road markings, which is already used in road infrastructure and it is characterized as a brittle material with high strength, a high modulus of elasticity, and a high surface hardness (scratch-resistant). It can be polished, is weather-resistant without stabilization, and resistant to weak acids, alkalis, non-polar solvents, greases, oils, and water [13]. Due to its mentioned durable properties, it is suitable for use as a texture layer. The specific methyl methacrylate used in this study retains its mechanical properties in the temperature range from −20 °C up to + 50 °C. A fine-grained (≤1 mm max. grain size) mineral filler*2 is added to the polymer binder, to receive a rough and strong surface. The final mixture consists of 75 wt.-% mineral filler and 25 wt.-% PMMA binder. 1% of hardener powder*3 (as a proportion of total formulation) is finally added to initiate the reaction [12]. The texture layer is applied to an absorption layer composed of 7.5 vol.-% crump rubber*4 and 92.5 vol.-% mineral aggregates*5,*6, and 13 vol.-% polyurethane binder*7 (PU) is added to the aggregate mix. More information about the material composition and the origin of the materials are available in the Appendix A, Table A1 and Table A2.

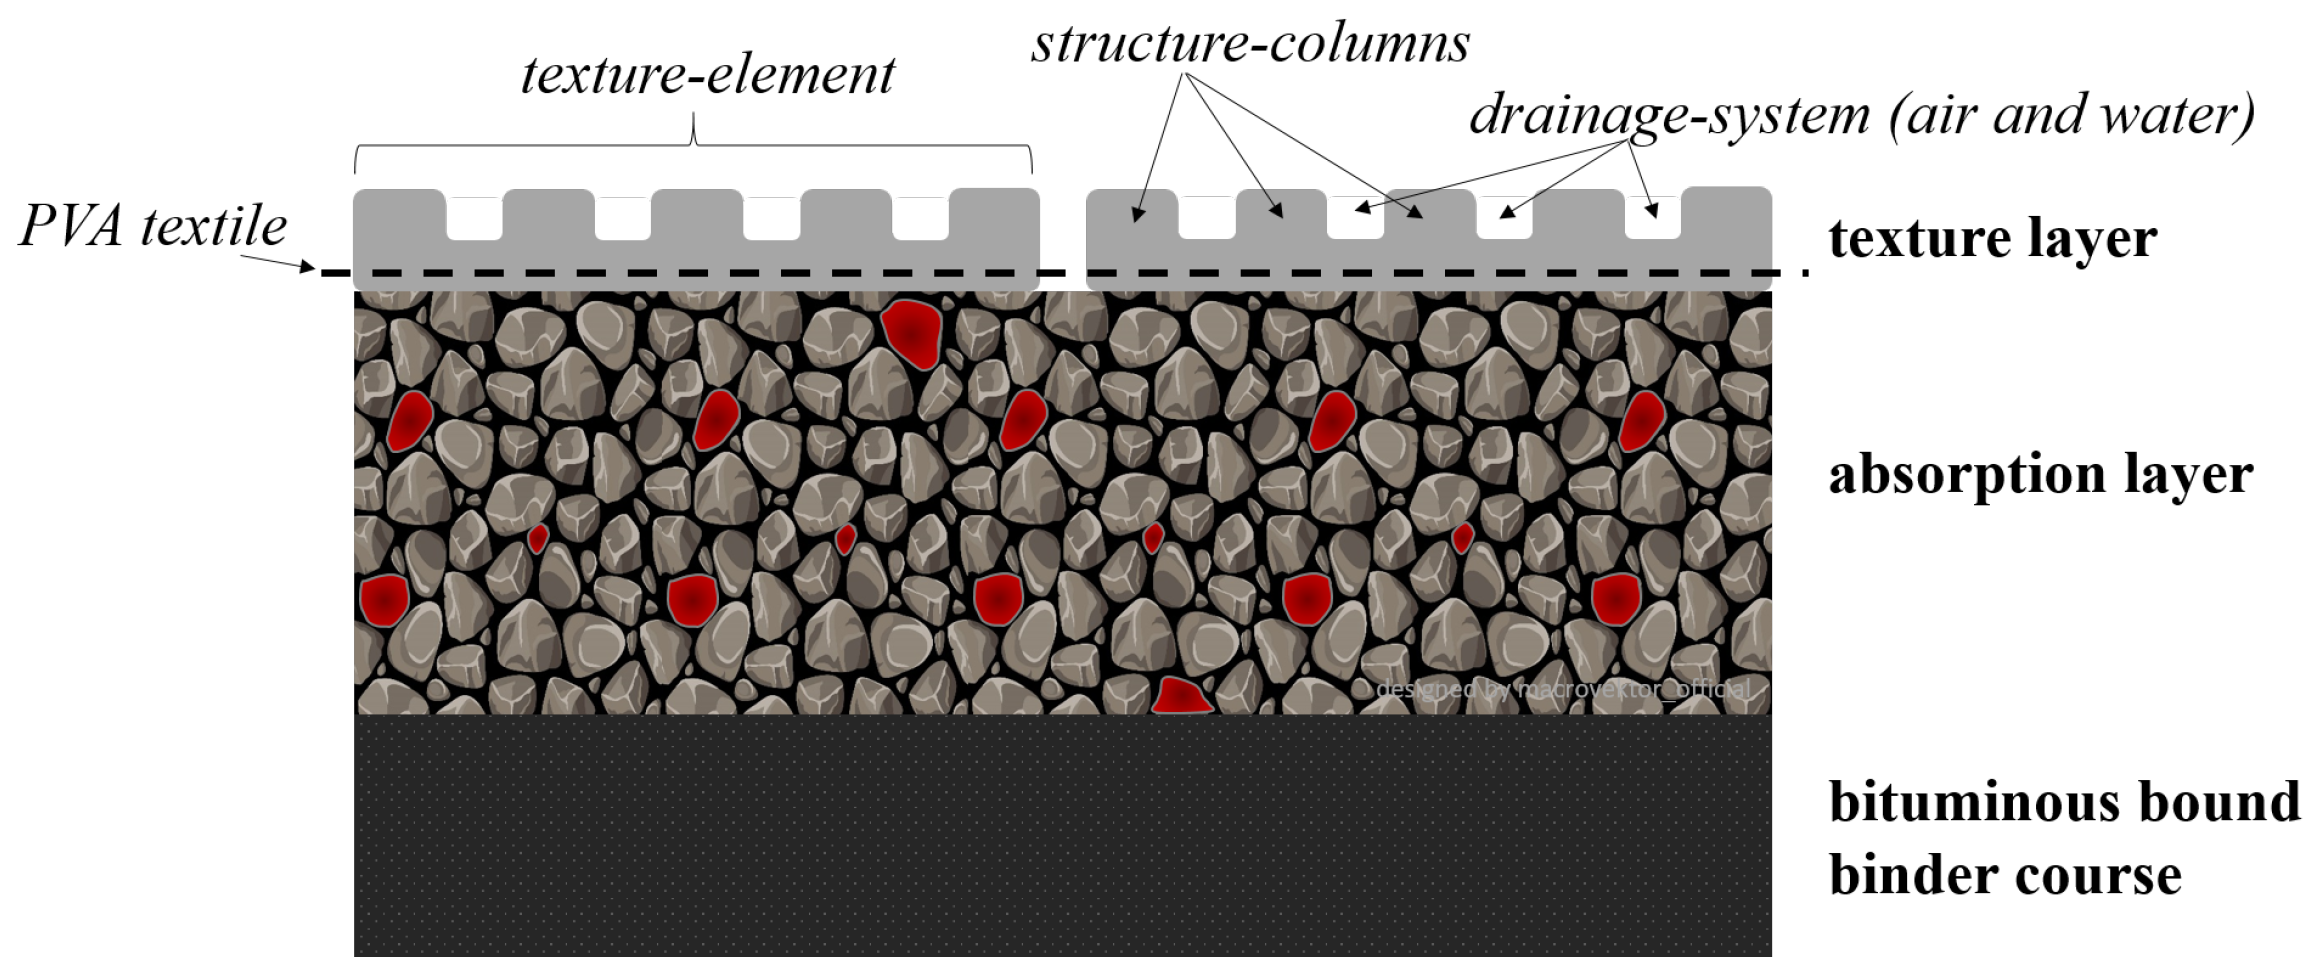
2.1. Production of the Absorption and Texture Layer

According to [11], the absorption layer will be mixed batch-wise. For this purpose, crumb rubber, mineral aggregates, and mineral filler are pre-mixed in a mixer. After a short pre-mixing, the homogenized polyurethane binder is added and the mixing continues until all components are completely wetted with polyurethane. After that, the mix is filled and spread into molds with a size of 32 × 26 × 4 cm3 (W × L × H) and compacted with a static hand compaction roller to receive plates with an even surface. The polyurethane in the mixture forms a thin layer around the rubber and aggregate particles and bonds the contact points, leading to a high tensile strength. The production method delivers a strong grain structure and a target void content of 35 vol.-% (Figure 2).

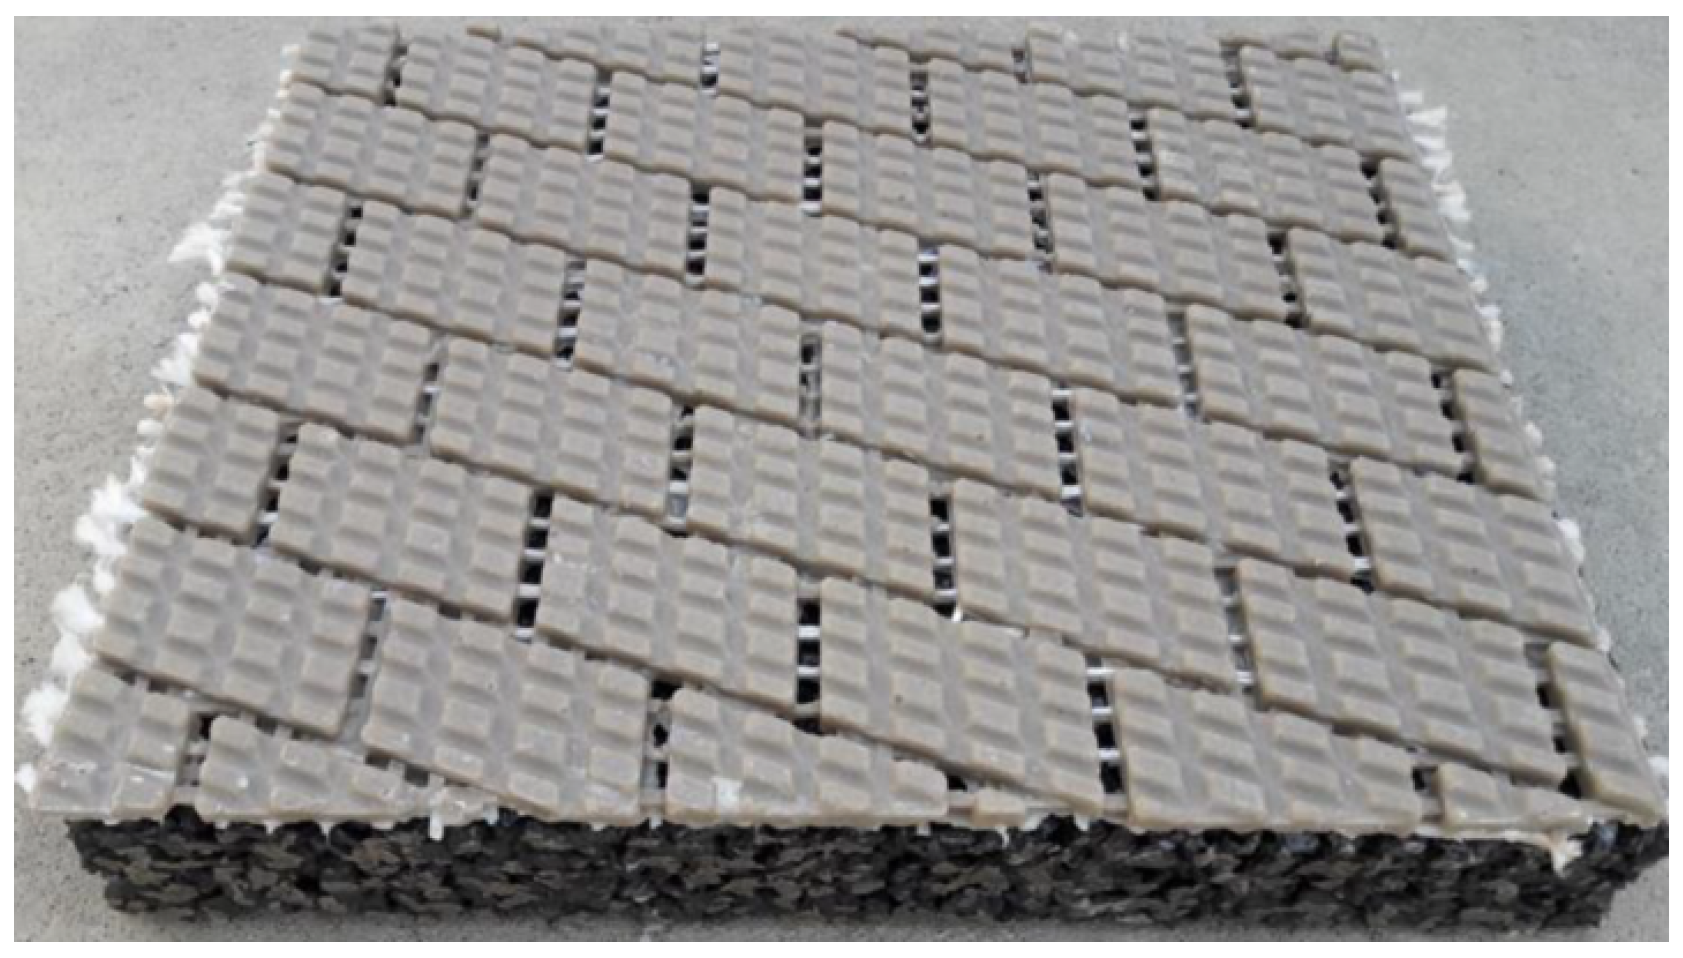
2.2. Preparation of the Texture Layer Plates

To produce a texture layer with the special geometry, a silicone mold was used with the designed geometry presented in [12]. It was found that the strength of the cured layer was best when the mold was filled with the compound first and the PVA-textile placed into the fresh compound afterwards. This process allowed a processing time of around 10 min, which required fast and careful handling. To receive an even surface layer, during curing a heavy plate and a foil used as an intermediate were placed on the fresh-filled silicone mold. After a full chemical reaction time of 20–25 min, the finished layer could be released from the mold (Figure 3).
After the completion of both layers, the texture layer was applied to the absorption layer, which is shown in Figure 4.

2.3. Methodology

The objective of this study was to first develop the strength of the entire system through experimental tests on a laboratory scale. After the successful implementation of a real-scale demonstrator, the actual effectiveness was to be verified through a full-scale analysis.
The investigation of the system on a laboratory scale was necessary to obtain insights into the functionality of the system, which can be recognized at a small scale, such as the skid resistance and the interaction between the individual layers. Therefore, fundamental laboratory tests were initially employed to generate information for the upscaling process and the effectiveness of the system. In detail, the first part of this study examined the skid resistance, the bonding between the texture and absorption layers, and rutting behavior using the SRT pendulum [14], the shear bond strength test [15], and the rutting test [16]. From these tests, the bonding requirements between the texture and absorption layers were derived to prevent delamination of the layers. After this, an investigation was carried out to determine to what extent and under which conditions a strong bond can be established between the permeable open-porous absorption layer and conventional bitumen-bound binder layers. This involved not only preventing delamination between the absorption and binder layers but also ensures the sealing of the bituminous binder layer to prevent water ingress into the asphalt layers and potential damage from water ingress. In the second part of the study, the system was investigated on a large scale in terms of acoustical and mechanical performance. For this purpose, acoustic measurements, such as the CPX procedure [17], were employed to generate an overall noise level of the system. Additionally, mechanical durability was a focus of this study, which is why a heavy load test was conducted using the MLS 30 [18] to demonstrate that the system can withstand high stresses. To further evaluate the system’s performance, a visual failure assessment combined with falling weight deflectometer (FWD) measurements, as well as skid resistance tests with the micro GripTester, were conducted, which were intended to show the impact of the heavy load on these properties.

2.4. Laboratory Study

2.4.1. Skid Resistance Test

According to [14], the pendulum test (skid resistance test—SRT), which is a stationary measuring instrument, was used for the localized determination of the surface grip. The pendulum device consists of a spring-loaded sliding body made from standardized rubber, which is attached at the end of a pendulum arm. Upon releasing the pendulum arm from a horizontal position, the sliding body swings over the test surface, causing a decrease in its rise height and the energy loss is measured using a calibrated scale. The results are output under a “skid-resistance test value” (SRT value).

2.4.2. Aachen Ravelling Test

The Aachen ravelling test (ARTe) is used to assess the resistance to wear on asphalt surfaces. The ARTe applies shear stresses to the asphalt surfaces, which are encountered in real-world scenarios during cornering when the tire contacts the road, often leading to material loss on the road surface. During the ARTe test, a dual-wheel setup with a defined axle load rotates around its own axis, exerting force on a sled. The sled accommodates two test specimens with dimensions of 32 × 26 × 4 cm3 and performs a horizontal motion. The superimposed rotational and translational movements induce shear stresses that replicate realistic road conditions [19,20]. In the testing device, the weight of the axle load is adjustable to a wheel load from 250 kg (basic load) up to 450 kg and the number of tire loads is adjustable as well. The test is merely used as a load-bearing device.

2.4.3. Wheel Tracking Test

The rutting test with the wheel tracking test (WTT) according to [16] is employed to assess the susceptibility to deformation of asphalt materials. The criterion for evaluation is the rut depth formed during the test, which is generated by repeated passes of a loaded wheel at a constant temperature. In this study, a solid rubber-tired wheel applied a load to a test specimen plate for 20,000 wheel passes in an air bath at 60 °C. The derived parameters from this are the rutting depth and the proportional rutting depth.

2.4.4. Shear Bond Strength Test

The shear bond strength test (SBST) according to [15] is conducted to assess the resistance to horizontal shear stresses in the interlayer of two pavement layers. In this test, cylindrical test specimens are subjected to controlled temperature and constant shear loading. In detail, the sample core with a diameter of 150 mm is placed within four clamps. The clamps encompass the two layers of the core sample while leaving the layer boundary free. Then a static load is applied on the upper layer until the interlayer bond fails. During the test, the evolution of shear deformation and shear force is recorded, and the shear strength (in MPa) at the interface between the layers is determined as the highest recorded shear stress.

2.4.5. Tensile Bond Strength Test

The tensile adhesion test (TAT) by [15] is used to assess the tensile bond strength between two pavement layers. The test method is generally applicable to thin surface layers and can be used to evaluate the interlayer adhesion quality of adhesive or binder films and the internal cohesion between two pavement layers. Within the test, the upper layer from a cylindrical asphalt test specimen consisting of two asphalt layers is pulled apart with a test stamp attached vertically to its surface with a constant speed of 200 N/s until it fractures. Consequently, the adhesion strength is determined, which represents the maximum force applied relative to the cross-sectional area of the specimen.

2.4.6. Permeability Test

According to [21], the method for determining the vertical permeability of cylindrical asphalt specimens with interconnected voids involves applying a water column of constant height to a cylindrical test specimen, allowing the water to flow through the specimen in the vertical direction for a specified duration. The resulting water flow rate, denoted as Qv, is a calculated measure of the permeability value kv. The test is conducted at ambient temperature.

2.5. Large Scale Study

2.5.1. Sound Absorption Measurements

To determine tire–road noise, the near-field method, as outlined in the European standard [17], is employed. This method, also known as the closed proximity method (CPX), allows for the measurement of sound pressure levels in close proximity to the tires within a sound-insulated trailer towed by a vehicle. This measurement allows most noises to be eliminated outside the tire–road noise since the microphones are oriented to record the tire–road noise. The sound pressure level coming from the tire road noise is continuously recorded and averaged over the traveled distance. The measurement can be conducted at speeds of 50, 80, or 110 km/h and is applicable to both truck and passenger car tires. In this case, Uniroyal Tigerpaw (SRTT) Car tires were used.

2.5.2. Accelerated Pavement Testing

To investigate the long-term effects of traffic volume on road construction, accelerated pavement testing (APT) is employed. In this context, the Mobile Load Simulator (MLS 30), available in Germany, was utilized to assess the functionality and durability of the noise-reducing road pavement. This simulator is capable of applying uniaxial loading to a 3.5-m road section with a constant wheel load (super-single tires). The road section was subjected to loading at the maximum tire speed of 21 km/h, equivalent to 6000 tire passes per hour, with a wheel load of 45 kN (approx. 5 tons of wheel load) [22].
The analysis of the results from the accelerated pavement testing using the MLS 30 is conducted through the examination of surface images. These surface images provide the opportunity to depict the test section before and after loading, allowing for the detection of differences caused by the loading. As per Wacker [18], a cross-sectional area of 0.5 m2 (1.0 m × 0.5 m) is always considered. A high-resolution camera is positioned with a defined camera angle above the area of interest, ensuring directly comparable and analyzable images. Within this study, images were captured both before (0 passes) and after loading (after 160,000 passes).

2.5.3. Deflection Measurements

To provide insight into the load-bearing capacity of the two-layer surface system, falling weight deflectometer (FWD) measurements according to [23] were conducted. The resulting load-bearing capacity obtained from these measurements offers insights into the deformation resistance of road construction under short-term loading conditions, yielding a deformation basin. The deformation basin consists of deformations within the substrate induced by an impulse load (50 kN) at a load application point, which has a diameter of 300 mm. This impulse load simulates the rolling over of a heavy truck at the measurement point. As the distance from the load application point increases, the localized deformation, detected using nine geophones, decreases.
To evaluate the results, this study employs the calculation of the radius of curvature R 0 and the bearing capacity number T Z , determined directly from the normalized deflection curve (“Jendia method” [24]). The radius of curvature at the load center can be determined based on a regression equation from the deformations w 0 [mm] (directly at the load center) and w 210 [mm] (at a distance of 210 mm from the load center). The curvature radius is thus obtained according to Equation (1) [23].
R 0 = 24.494 · ( w 0 w 210 ) ( 0.899 ) .
And from this, the bearing capacity number TZ [−] is determined according to Equation (2) [23].
T Z = ( R 0 · 1000 w 0 ) 0.5 .
As per [25], the deflection w 0 indicates the load-bearing behavior of the unbound layers in the asphalt structure at the load application point. The curvature radius R 0 , on the other hand, describes the deformation behavior of all bound layers in the asphalt structure at the load center. Since both parameters contribute to the determination of the bearing capacity number T Z , it is a measure of the comprehensive load-bearing behavior of the asphalt pavement structure at the load center. This means that the higher the bearing capacity number, the higher the load-bearing capacity of the road pavement.
In use is an FWD measurement instrument provided by the Federal Highway Research Institute. The FWD measures the load-bearing capacity before and after the MLS 30 loading.

2.5.4. Skid Resistance Measurements

To measure the skid resistance of the overall surface, a portable friction tester (PFT), the microGripTester by the company Mastrad Ltd., was used. In contrast to the measurement with the SRT pendulum, the GripTester uses the method based on the slow-moving longitudinal friction coefficient (LFC) [26] recorded in walking pace [27].
According to the British standard BS 7941-2:2000 [28], the GripTester measures the LFC under wet conditions with a small test wheel operating at a fixed slip ratio of 15%. The testing wheel is attached to a stub axle and is mechanically braked through a fixed gear and chain system connected to the drive wheel axle. As the wheel is pulled along the wet pavement surface at a consistent speed, it experiences slippage, and both the slipping force and the vertical load are measured. During the measurement, the data are collected and the resulting friction coefficient across the measured distance, called Grip Number (GN), is recorded.

3. Results and Discussion

3.1. Results of the Experimental Study on a Laboratory Scale

The test results from the explained experiments will be presented, analyzed, and discussed in the following section. This will be presented in a sequence where fundamental manufacturing processes and laboratory tests are considered first, as they provide essential insights necessary for the implementation at full scale. Following this, an explanation of how the full-scale demonstrator is constructed will be provided. After this, the presentation, analysis, and evaluation of the full-scale experiments will be addressed.

3.1.1. Skid Resistance of the Texture Layer

To ensure that the adapted geometry by [12] provides sufficient skid resistance, the skid resistance was examined using the SRT pendulum [14] in combination with the ARTe test [19]. The study investigated the initial skid resistance and how it changes over a short loading period of 600 cycles at two different axle loads. This is meant to determine whether the layer has high or low resistance to wear.
A total of five SRT values, following the loading cycles of 0, 200, 400, and 600 cycles, were determined in accordance with [14], and their mean value was calculated. Since two plates were tested for each loading weight, the values from both plates were also averaged. Figure 5 presents the results in a bar chart, depicting the mean SRT values as a function of the number of load cycles.
Figure 5 shows the mean initial skid resistance of the texture layer, which is at a value of 76 SRT units. After loading 200, 400, and 600 tire passes, the SRT units reduce to a mean value of around 68 SRT units. We can observe that the magnitude of the wheel load (250 kg (light grey) or 450 kg (dark grey)) has little influence on the SRT value and that the loading shows no significant signs of wear and tear. Since the SRT measurement results on the 250 kg plates have emerged as exactly the same, no standard deviation exists. A comparison to [8] reveals that the SRT values of the texture layer in this study are superior. Reference [8] obtained SRT values for his material, ranging between 50 and 65 SRT values. Also, [6] tested the friction indexes using the SRT pendulum on their developed PERS layers, which yielded values ranging between 48 and 64 SRT values and one deviating value of 78 SRT values. The German standard [29] suggests a method to categorize the SRT values into friction classes. Within this method, the SRT values will be associated with values that describe the condition of the surface with regard to friction. In reference to the method, the initial SRT value of 76 describes a very well condition of the surface, because it is classified as higher than an SRT value of 65, which is a target SRT value when installing a new asphalt top layer in Germany. The following SRT-values loaded by 200, 400, and 600 load cycles still achieve a mean SRT value of 68, which is still higher than an SRT value of 65 and therefore is classified as a good condition as well. The number of chosen load cycles only represents a short usage of the texture layer, which might not deliver a long-term declaration of the surface condition yet. However, it shows that the surface structure is able to fulfill the required road administration conditions, which ensure traffic security in terms of friction. Nevertheless, the SRT pendulum is a tool, which merely conducts a stationary measurement of the friction. It can certainly indicate the road’s level of grip, but cannot continuously assess skid resistance across a whole road section area. This is why a large-scale demonstrator skid resistance test with the micro GripTester will follow.

3.1.2. Analysis of the Interlayer Bond of the Texture Layer and the Absorption Layer

The texture layer is applied to the absorption layer, using the binding agent polyurethane which is used as a binder in the absorption course. To assess an adequate bond between the layers, the shear bond strength test (SBST) [15] in conjunction with the load from the Aachen Ravelling Test (ARTe) [19] were applied.
Within this experiment, three variants were tested to determine the best option. In order to produce the composite test specimens, the texture layer material was prefabricated as cylinders (Ø = 150 mm) for all variants. In the production of variant 1 (Var 1), the absorption layer was freshly prepared with a binder content of 6.3 wt.-%, poured into the mold and compacted. Immediately after that, the texture layer, which was roughened on the bottom side by sandblasting, was applied to the absorption layer. The aim was for the fresh binder to simultaneously act as a binder and adhesive. For the second variant (Var 2), the production process was similar, but the binder content was increased to 8.3 wt.-%. In contrast, for the production of variant 3 (Var 3), the texture layer and the absorption layer were prefabricated and cured independently. Later, the absorption layer was flatly ground to ensure the largest possible net contact area with the layer above it, because the grinding of the absorption layer ensures the removal of stone peaks, thus providing a larger bonding area between the two layers. The contact areas of both layers (0.0177 m2) were then thinly coated with polyurethane (15 g each = 30 g in total) using a coating roller, followed by the application of the sandblasted underside of the texture layer.
It turned out that variant 3 (Var 3) exhibits the best layer bond. Therefore, the amount of polyurethane adhesive in between the layers was varied again, in order to detect whether even higher maximum shear forces can be achieved. Table 1 gives an overview of the composition of the tested variants.
In Germany, the bonding strength between an asphalt surface layer and an asphalt binder layer is considered sufficient when the maximum shear force is at least 15 kN [30]. However, this method cannot be used as a condition for the bonding system investigated in this study, as it involves entirely different materials. Nevertheless, this minimum threshold can serve as a reference point and is thus included in the analysis. Furthermore, there are currently no comparable systems for direct comparison of shear forces related to bonding between existing layers, as [8] did not investigate the bonding effectiveness of his development.
Figure 6 depicts the maximum shear forces of the different variants in a bar chart. It can be observed that the variants, which exhibit meager shear forces, are those where the texture layer is applied on the fresh absorption layer (Var 1 and Var 2). The fresh binder in the absorption layer should ideally act as an adhesive, but it is presumed that the contact points between the texture and binder layers are not sufficiently coated. Additionally, in these variants, the peaks of the stones were not eliminated, resulting in a reduced net contact area between the layers. Using the approach where both layers are manufactured separately and then bonded, all variants (Var 3, Var 3.1, Var 3.2) can achieve high shear stiffness values. It can be observed that the more binder is applied as an adhesive between the layers, the higher the maximum shear stiffness becomes. Taking into account the minimum shear strength proposed in Germany, these variants would meet the requirements. Variant 3 (Var 3), which had a mean maximum shear force of 23.2 kN is defined as the best and safest option.
Since the best option variant from the shear bond strength experiment was selected, a test to ensure that the variant withstands real-scale conditions was carried out. For this purpose, it was subjected to load in the Aachen ravelling tester (ARTe) to determine the influence of shear forces on the layer bond. Two samples were loaded with rotating tires 1200 times with a wheel load of 450 kg without using water and a polishing agent. In contrast to the experiments in the shear bond strength test device, the bottom of the texture surface could not easily be ground for the ARTe test and was therefore applied on the prefabricated absorption layer without treatment. We found, that the tested samples of Var 3 withstand the shear loads, indicating that the interlayer bond is at a high level.

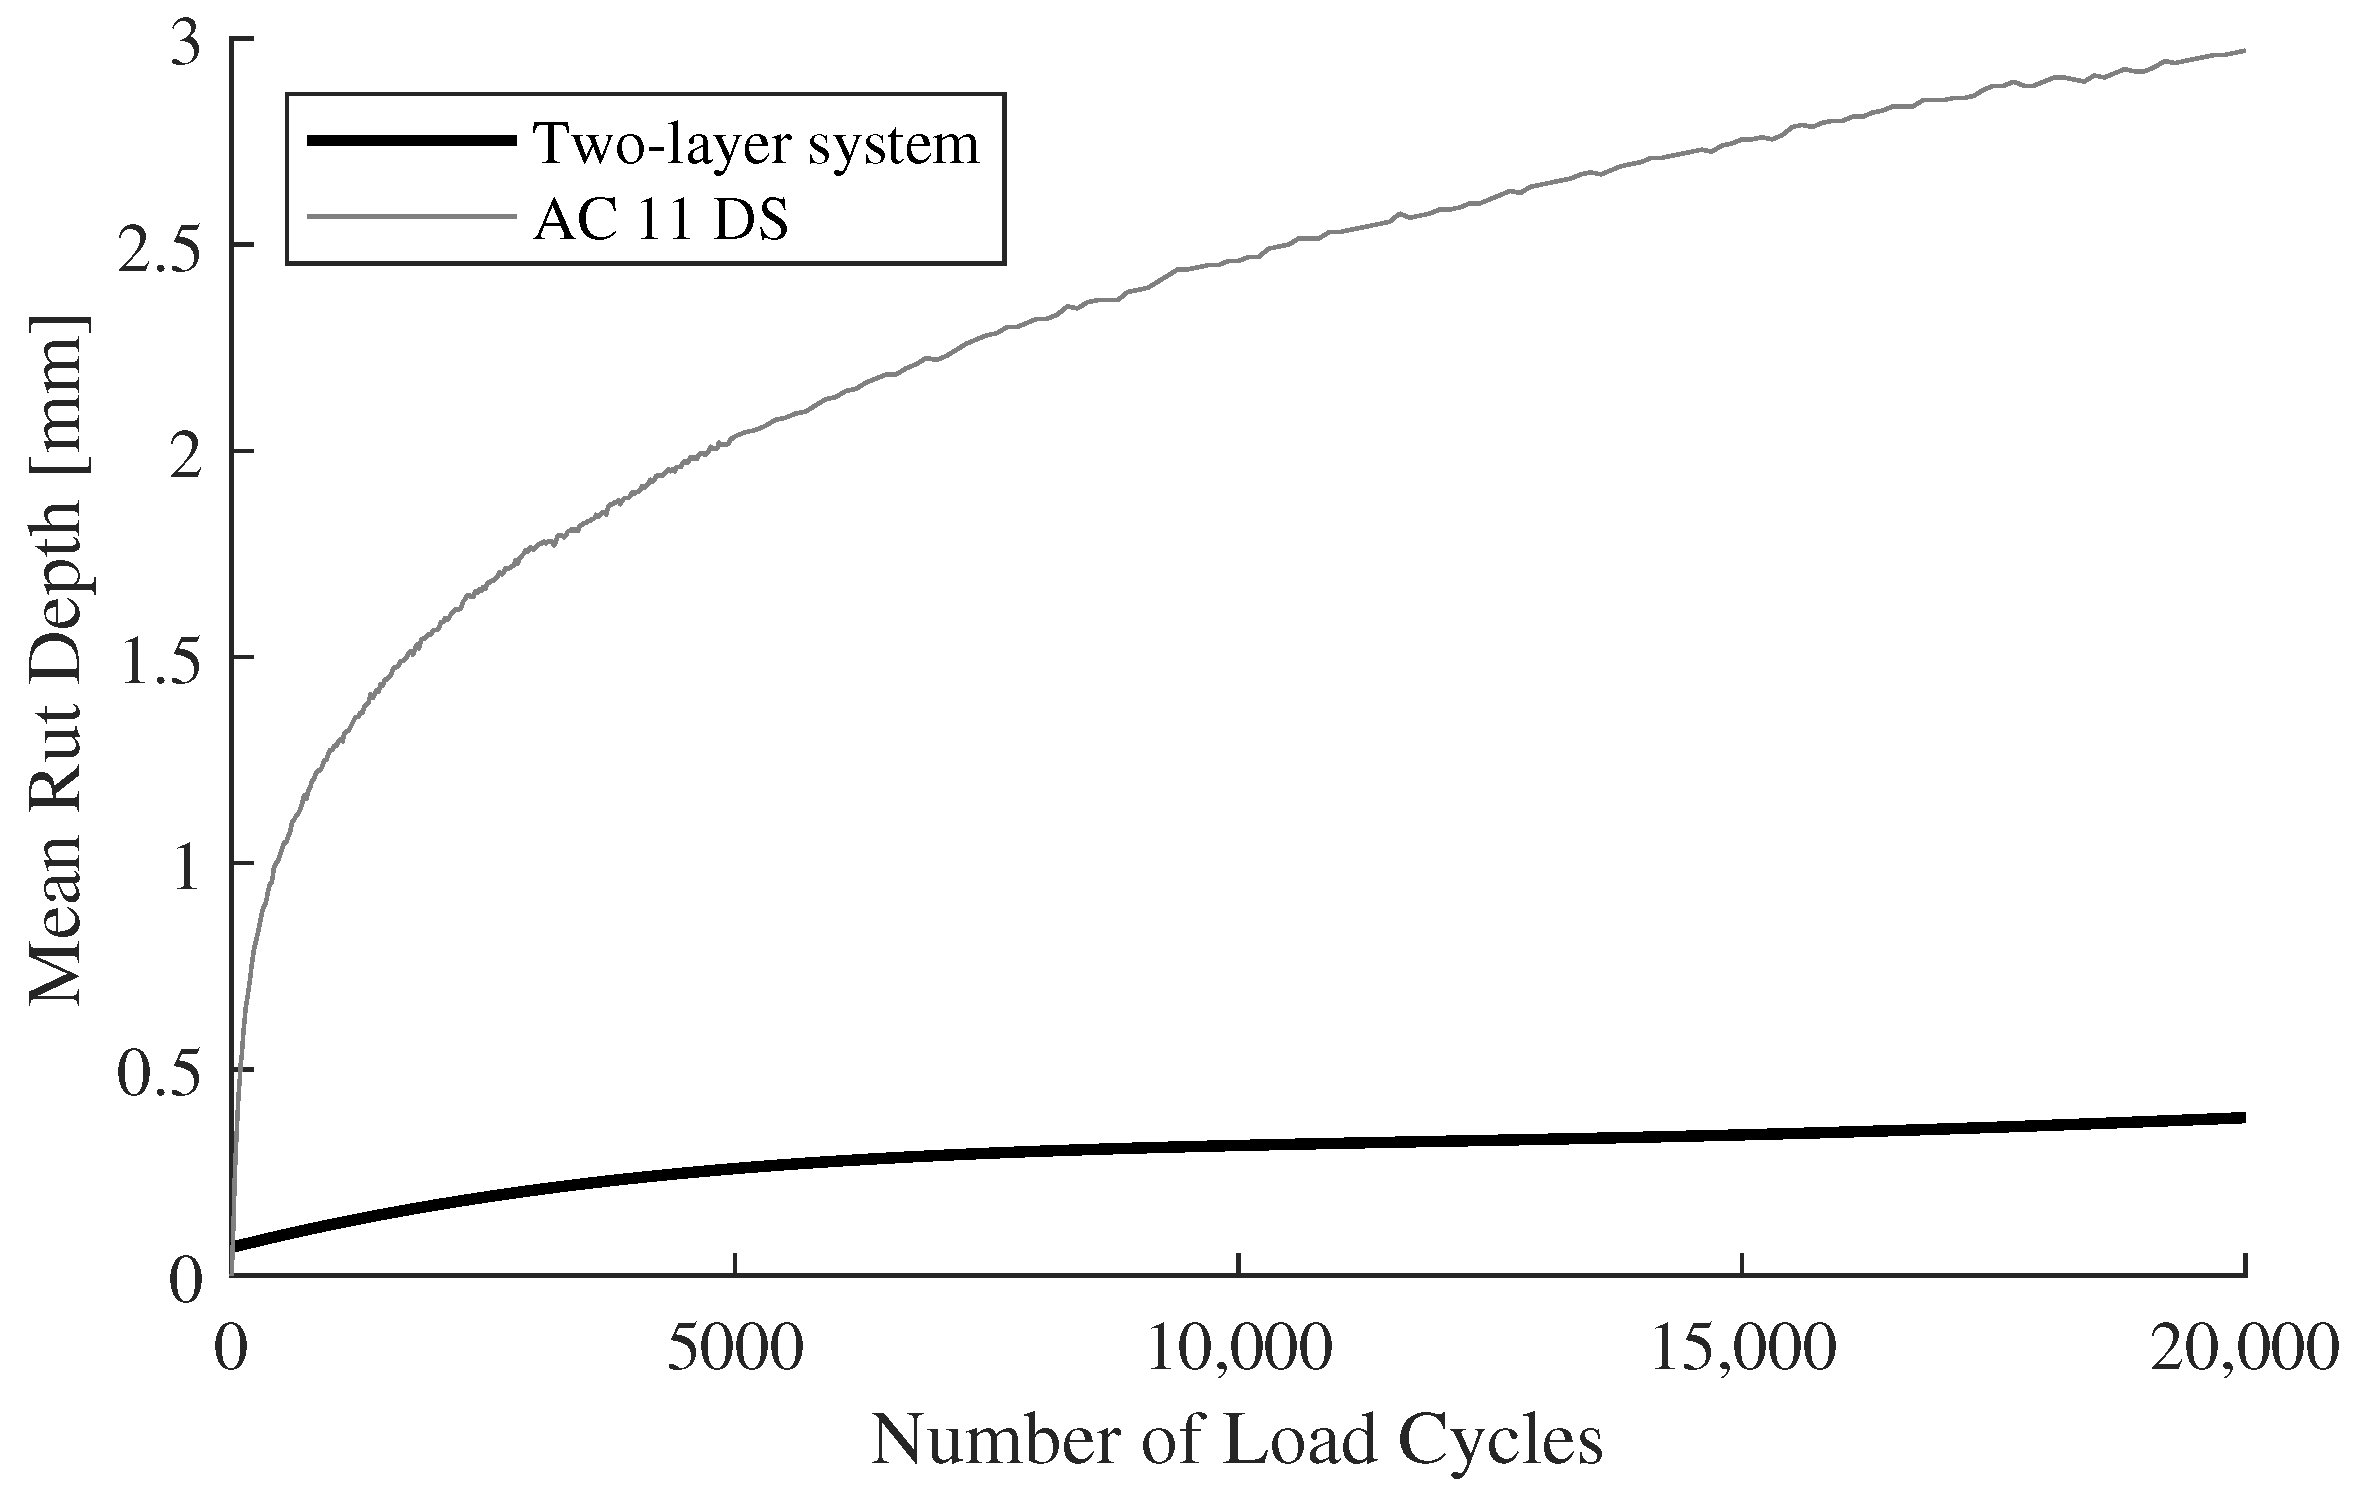
3.1.3. Rutting Behavior of the Noise-Reducing Two-Layer System

After conducting the wheel tracking test (WTT), it was found, that the rutting depth of the two-layer system is very low, almost negligible. The final absolute rut depth after 20,000 wheel passes was found to be 0.3 mm and the proportional rut depth, which includes the proportion to the specimen height, is 0.6%. Figure 7 shows the course of the rutting depth across the number of wheel passes. The rutting phenomenon of the two-layer system is much lower compared to a conventional Hot Mix Asphalt (HMA), such as the German asphalt surface mix (AC 11 DS). The high resistance to rutting can be attributed to the high strengths of the two polymer-based layers. After the curing process, these layers maintain consistent strength even at elevated temperatures, in contrast to asphalt, which exhibits temperature-dependent viscosity and, therefore, deforms at higher temperatures under constant load. Accordingly, it can be concluded that the two-layer system exhibits high resistance to rutting.
Ref. [8] did not cover the performance of the entire two-layer system in terms of the rutting phenomenon, so no direct comparison can be made to his experiments. However, in general, in [31] researchers defined, that a maximum permissible permanent deformation of 6 mm after 20,000 tire passes considers an asphalt sample to be resistant against rutting. The research focused on the evaluation of the American standard AASHTO T324 [32], which differs from the German standard [16] in terms of a 10 C lower air temperature during testing (50 C ). Both in Figure 7 compared layers meet the specified requirements from [31], with it being evident that the two-layer system exhibits minimal rutting.

3.1.4. Testing the Application of the Two-Layer System on Conventional Bituminous Bottom Layers

To promote the sustainability of the noise-reducing system, it should be integrated into the existing infrastructure. This means that new road structures based on polymer materials should not be constructed from scratch; instead, the polymer system should be applied to existing bituminous layers, such as replacing worn-out asphalt surface layers. In this context, it is necessary to verify whether an adequate bond can be achieved between the polyurethane-bound absorption layer and conventional bitumen-bound binder layers. Additionally, it is essential to protect the dense layers in the asphalt structure from water ingress to prevent damage, since the noise-reducing surface layer system is characterized by a highly porous and permeable structure, which on the one hand enables noise absorption, but on the other hand, leads to effective water drainage. Therefore, this study examines how sealing of the bituminous substrate can be achieved.
To find out more about a sealing medium, that meets the requirements of an adequate interlayer bond, a study with three different sealing mediums was carried out. In detail, three tests, such as the shear bond strength test [15], the tensile bond test [15] and the permeability test [21], were conducted. The aim of this experiment was to determine which sealing medium successfully passed all three tests with good results, thus making it a suitable interlayer between the two-layer system and a bituminous binder course. The following layers were investigated: a thin polyurethane layer (Elastan 6568/120) (BASF GmbH, Lemförde, Germany) (PU), a thin bitumen emulsion layer (C60BP4-S) (BE), and a 20 mm mastic asphalt layer (MA 11 N) (MA). During the preparation of three test samples for each variant, the polyurethane layer and the bitumen emulsion layer were applied with a painting roller. With this method, thin layers of polyurethane of 10 g and thin layers of bitumen emulsion of 20 g could be realized. The selection of the adhesive quantities and the layer thickness was made in accordance with the recommendations from German regulations. The 20 mm mastic asphalt layer was applied by hand, coated with scattering material (aggregates 2–5 mm), and compacted with a roller compactor.
Figure 8a shows the results of the maximum shear force test according to [15]. It can be observed that the bond between the absorption layer with the PU and the BE medium is noticeably weaker compared to the bond between the absorption layer and the MA medium. With regard to the suggested minimum shear force from the German regulations, both mediums, PU and BE, would not meet the requirements [30]. The 20 mm thick mastic asphalt medium MA 11 N achieves a mean maximum shear force of F s h e a r , m a x = 19.6 kN, which passes the 15 kN minimum shear force from the standard. The reason for the significantly higher shear strength between the absorption layer and MA is likely due to the scattering of the mastic layer with basalt aggregate, which forms a strong bond with the bitumen on the bottom and the polyurethane on the top. In contrast, in the PU and BE variants, there is a polyurethane or bitumen layer as an intermediate layer. It appears that the bonding behavior between bitumen and polyurethane, which accumulates at the layer boundary, is very low. The illustrated standard deviation of the variant MA in Figure 8a is caused by a high deviation of one of three measured values, which was very low. It may influence the interpretation of the behavior of this variant. The other two values of MA exceed the minimum suggested requirement, though. [6] tested the bond between their developed PERS layer with various adhesive quantities and a conventional sub-layer as well. They obtained significantly lower maximum shear forces ranging from 2.3 to 6.6 kN, which could be a reason for the reduced durability and stability of their system compared to the implemented noise-reducing two-layer system of this study.
Beyond that, Figure 8b shows the maximum adhesion forces between the absorption layer and the asphalt binder course yielded by the tensile bond strength test (TAT). All tested samples with the bitumen emulsion medium (BE) collapsed during the drilling of the test cores, which is why only PU and MA test samples are illustrated in the figure. Due to the collapse during preparation, it is assumed, that the bond of the BE samples is fragile and therefore can be represented with 0 N/mm2. Compared to this, the mean maximum adhesion force value of PU is at 0.0936 N/mm2, and of MA is at 0.7491 N/mm2, which is, in comparison, much higher. In general, the bond strength between MA and the absorption layer is the highest and can therefore be considered as the decisive factor. However, the large standard deviation suggests that the mean adhesion force may not necessarily be representative. Since the German regulations suggest that an adhesion value of 0.5 N/mm2 would be a minimum qualification to yield adequate adhesion resistance [15] between asphalt layers, only the MA medium would meet the requirement.
At the end of the laboratory study, the permeability values of the sealing mediums are examined, which were determined using the permeability test according to [21], and are shown in Figure 8c. Considering the figure, a clear imbalance among the tested variants is evident. The PU and MA variants seem to exhibit minimal to no permeability ( k P U = 2.1915 e 11 m/s and k M A = 0 m/s), whereas, in contrast, the BE variant appears to be more permeable ( k B E = 9.9589 e 11 m/s). In general, it can be stated that all variants provide effective sealing, since a permeability coefficient of around 1.0 e 10 m/s is still almost waterproof. This phenomenon is likely influenced by the density of the bituminous binder layer beneath, which is inherently hardly permeable to water. Nevertheless, the goal is to achieve maximum sealing to the bituminous asphalt layers beneath the permeable layer to mitigate potential risks of water ingress and allow water to drain above the binder layer into the subsequent drainage systems, which can be achieved with the construction of a non-permeable MA sealing.
In summary, considering all tested tests and variants, it can be concluded, that the use of a 20 mm mastic asphalt layer (MA 11 N) in between the two-layer system and a bituminous bound binder course is the optimum solution to yield interlayer bond, adhesion, and a full sealing at the same time. The PU and BE variants are not suitable for use in this construction due to their respective deficiencies.

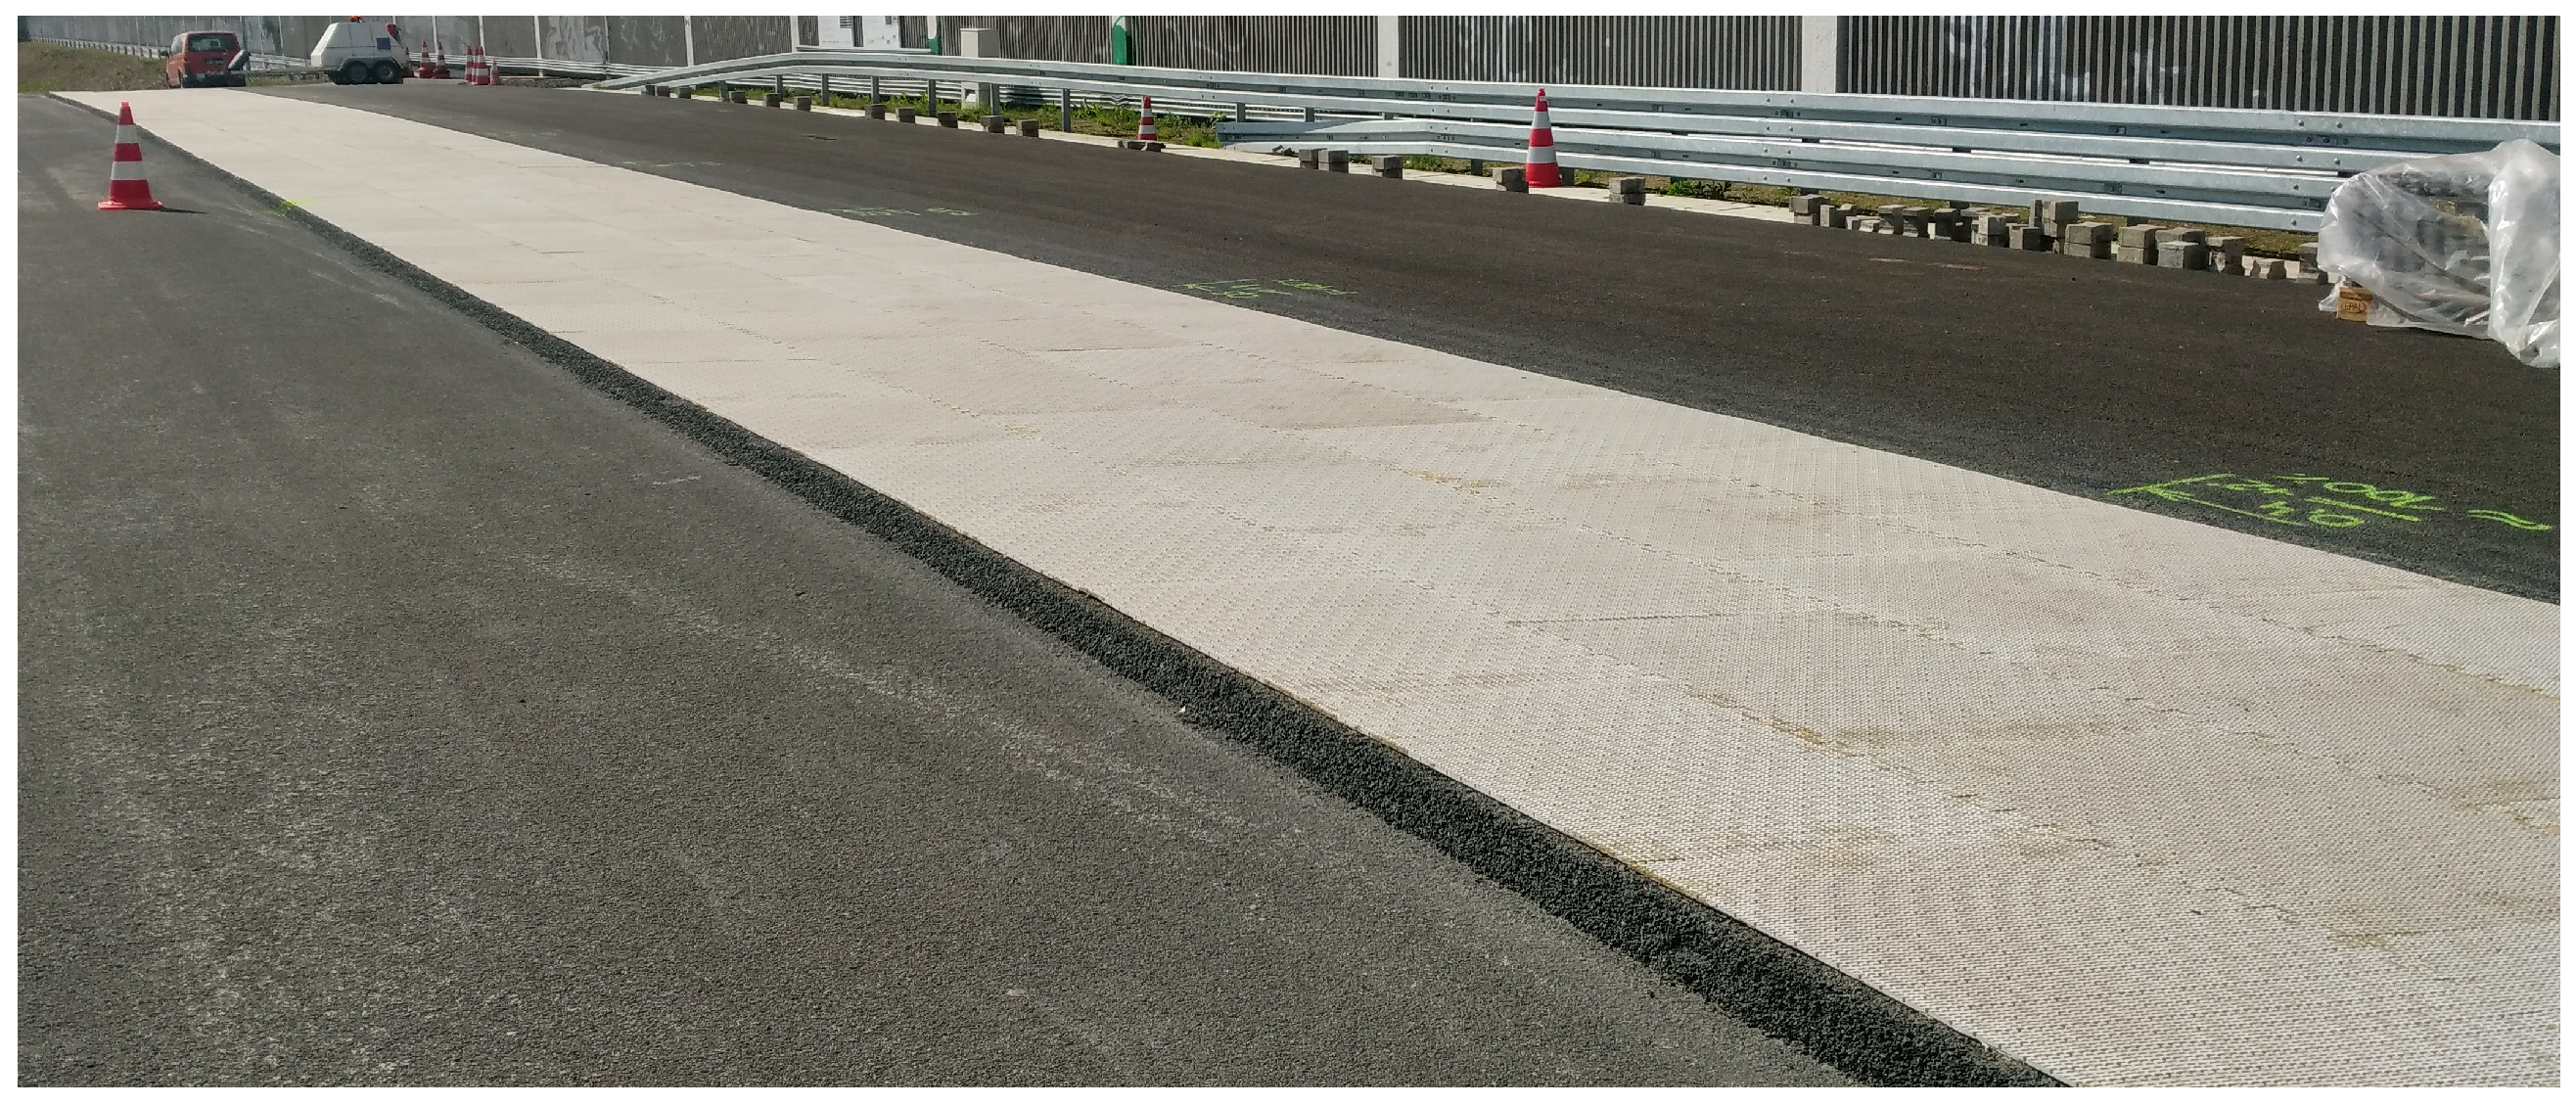
3.2. Implementation of the Large Scale Demonstrator

In order to carry out the implementation of the full-scale demonstrator, the findings from the laboratory study must be taken into account. Accordingly, the absorption layer should be mixed and installed on-site to prevent premature hardening of the layer. On the other hand, the texture layer is pre-produced in a binder-to-filler ratio of 25/75% and then applied to the absorption layer as panels. The bonding is performed using the polyurethane binder from the absorption layer at a rate of approximately 1700 g/m2 on a previously abraded absorption layer surface.

3.2.1. Location and Conditions of the Test Section

The Federal Highway Research Institute provides a test area for research projects involving large-scale research conducted under real-world conditions. This test area, known as duraBASt, is a non-publicly accessible site located within the Cologne-East motorway interchange in Germany. This means that the test site is not subject to actual traffic but provides the opportunity to implement demonstrators on road sections measuring 100 × 3 m2, exposing them to real environmental conditions such as weather. The loading is performed through the accelerated pavement testing facility MLS 30.
On this test site, the two-layer noise-reducing system was implemented in full-scale. The substructure consisted of a 300 m2 area with an asphalt structure composed of a rigid gravel subbase layer on the bottom and a combined base-surface-layer (AC 16 TD) above, on which, the two-layer surface system consisting of the texture and the absorption layer could be applied on an area of 50 × 3 m2 (length × width). The sealing medium evaluated in the laboratory study, which was based on mastic asphalt, was not implemented in full-scale for cost reasons.

3.2.2. Paving of the Absorption Layer

Using a dosing system specifically designed for rock-polymer mixtures according to [33], the mix for the absorption layer was prepared on-site and placed in front of the paver. The dosing system combines the individual components in proportions according to the mix composition, illustrated in Table A2. To distribute and compact the absorption layer material, a concrete paver suitable for PU asphalt installation was used. Within this compactor, the modified compaction unit consists of panels that smooth the laid mix to a preset height on the layer. The material is compacted with the panels into a denser arrangement, as the compaction panels press the absorption layer material at a constant force, causing it to interlock and form a solid particle structure. Consequently, an even surface of the absorption layer can be achieved in-situ. The polyurethane binder reacts after the layer’s completion, allowing the contact areas of the aggregates to form a strong bond, ultimately creating a quasi-monolithic body, which was found by [7] as well.

3.2.3. Grinding of the Absorption Layer

After the chemical reaction of the absorption layer, its surface was ground, using concrete grinding machines, and cleaned to create a maximum net contact area between the grains and the texture layer plates.

3.2.4. Prefabrication of the Texture Layer Plates

The large-scale texture layer was produced in a technical center. For practical reasons, it was previously found to manufacture texture layer panels with dimensions of 0.75 × 1.0 m2 [33]. To ensure a pourable compound an extruder machine was used for the mixing of the compound, consisting of 75% filler and 25% binder. This offers the possibility to produce an ideally composed homogeneous compound from all individual ingredients, which could be poured directly into the prepared molds through a hose. Then, a silicone mold was filled with the extrudate and the PVA-textile was applied to the compound. For the chemical reaction, the silicone mold was completely closed by a steel mold in order to exclude possible deformations, prevent floating of the textile, and smoothen the bottom of the texture layer [33]. After a reaction time of approximately 25 min, the texture layer panel could be removed from the mold for post-processing. Unfortunately, it was not possible to create the texture layer plates as fully permeable, as proven to be a very time-consuming process and, therefore, could not be carried out within the intended time frame. Consequently, there were no open gaps between the texture layer elements; instead, only parts of the texture layer plates were cut in transverse direction to enable the partial transfer of the resulting noise from tire–road noise to the absorption layer.

3.2.5. Application of the Texture Layer on the Absorption Layer

The application of the texture layer on the absorption layer was adopted from the laboratory study. For this purpose, the prefabricated texture layer plates and the absorption layer were spread with the polyurethane binder and then applied to each other (Figure 9).

3.3. Results of the Full-Scale Experiments

After the completion of the full-scale two-layer noise-reducing system, the second study was conducted to determine the acoustic and mechanical performance of the system. In this context, the experiments presented in the methodology were carried out. These experiments involve the determination of road-tire noise using the CPX method and the assessment of mechanical resistance against heavy traffic using the MLS 30. Subsequently, the system’s load-bearing capacity and skid resistance are tested and evaluated, with changes induced by the influence of the MLS 30 load.

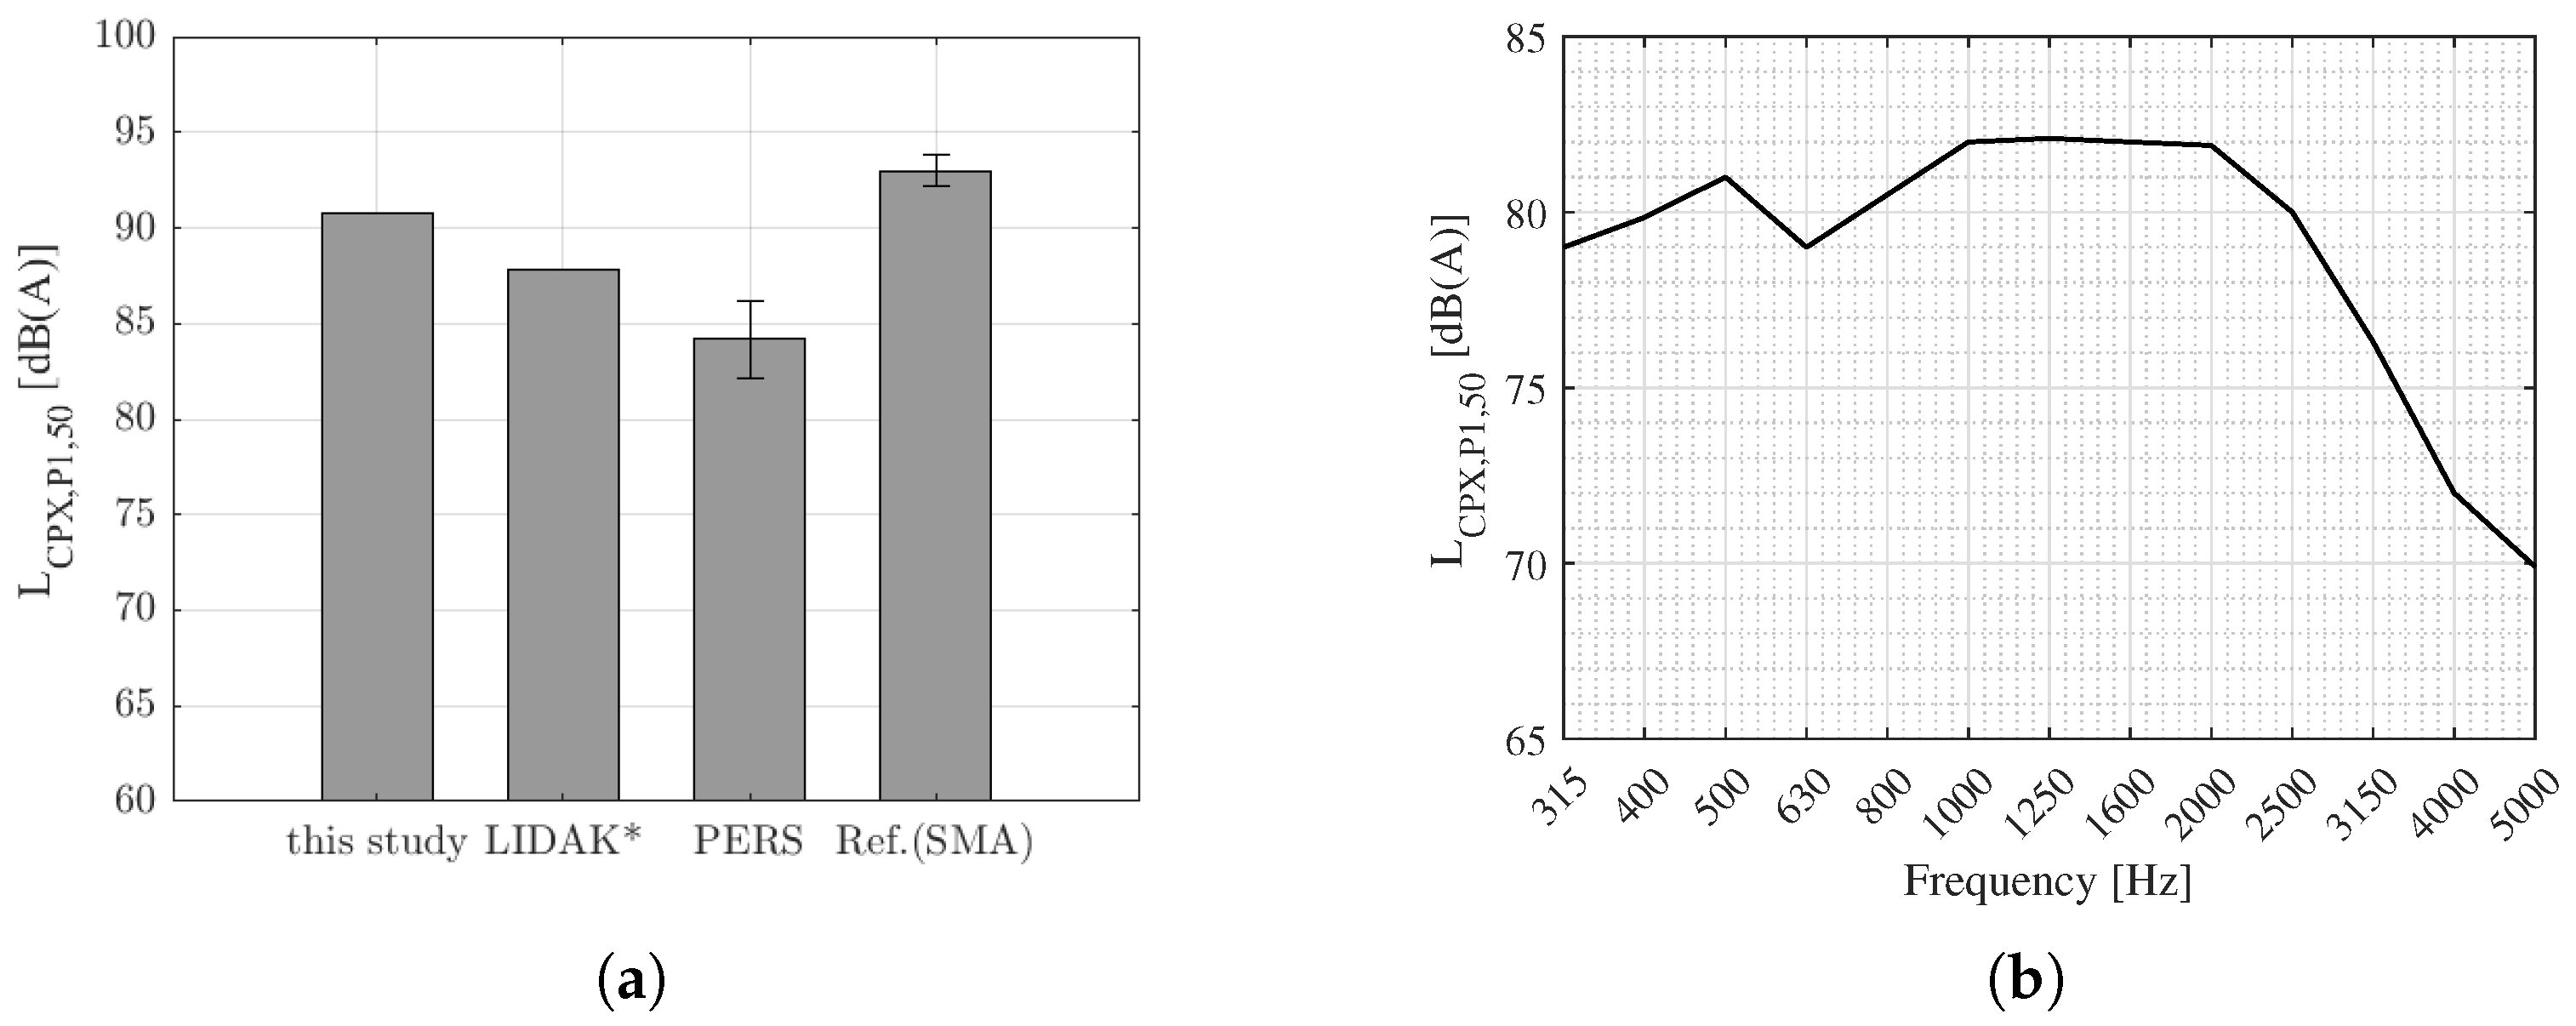
3.3.1. Analysis of the Acoustic Performance

To determine tire–road noise, the closed proximity method (CPX) is applied in this experiment. On the duraBast site, the maximum driving speed is limited to 50 km/h, which limited the maximum speed within the test. By performing three measurements with passenger car tires (SRTT), the averaged sound pressure level over a total of six 20-m sections was determined to be 90.7 dB(A), taking into account the temperature correction. Ref. [8] tested his development in a full-scale demonstrator as well and evaluated the sound pressure level with the CPX method. In his study, he was able to test higher car speeds of 60, 80, 100, and 120 km/h with an SRTT tire. However, at a speed of 60 km/h, he observed a sound level of 90 dB(A) [8], which rises in dependence on the speed. In comparison to the result of this study, the value by [8] of 90 dB(A) is roughly at the same level. However, it can be assumed that the CPX value from [8] at 50 km/h would be approximately 2–3 dB(A) lower. A linear interpolation of his noise level at 50 km/h yields a noise level of 87.8 dB(A), which is 2.9 dB(A) lower compared to the noise level from this study (Figure 10a). Further comparison with PERS pavements developed by [6] indicate that the PERS pavements have a higher noise-reducing effect (LCPX,50, PERS = 82–87 dB) compared to the two-layer pavement evaluated here (Figure 10a). But taking into account conventional asphalt reference values from [6] (SMA 0/16 and SMA 0/11), they indicate noise levels up to 3.1 dB(A) higher compared to the two-layer system from this study, which leads to the statement, that the developed two-layer system causes a noise reduction compared to conventional asphalt pavements.
In addition to providing the CPX level, the third-octave spectrum of the measurement results is presented (see Figure 10b). The CPX value (50 km/h) as a function of frequency starts at a level of approximately 80 dB(A) in the low-frequency range, then decreases in the frequency range between 500 and 630 Hz. Subsequently, it rises to 82.5 dB(A) (at 1000 Hz) before remaining there up to a frequency of 2000 Hz, after which it decreases to 70 dB(A). The sound level depicted in Figure 10b is on the same level of sound pressure coming from loud music within the auditory range of the human ear [34]. Upon closer inspection of the sound level curve, a discontinuity can be observed in the range between 500 Hz and 1000 Hz, evident as a downward inflection. From the literature, it is known that specifically, tire–road noises arising from structural factors constitute the noise in the frequency range < 1000 Hz [9]. By combining this assertion with the present sound pressure level curve, it can be inferred that the distinctive texture layer of the system being tested here is the reason for this inflection. Therefore, it can be concluded that the texture layer induces lower structurally related noise (e.g., tire vibrations).
A comparison to the Literature is shown in Figure 11. Ref. [35] conducted assessments of two noise-reducing asphalt pavements (P and PCR) and a reference asphalt (E1) using the CPX method at 50 km/h. The corrected sound pressure levels obtained were 88.5 dB(A) (P) and 87.8 dB(A) (PCR) with an SRTT P225/60 R16 tire. Considering the third-octave-curves, it is observed that the sound levels of [35] (grey lines) are at a similar level compared to this study (black line). However, the two-layer surface system from this study exhibits lower sound pressure levels in the frequency range between 500 and 800 Hz. Given that the pavements discussed by [35] are modified asphalt pavements with a typical asphalt surface texture, the deviation in the curves here can also be attributed to the unique geometry of the texture layer within the two-layer system. Additionally, the figure includes the third-octave band from [8] (represented by the black dashed line), recorded at a speed of 60 km/h. Direct comparison with data from [8] is not feasible due to the difference in measurement speeds. The band would register at a lower level for a measurement speed of 50 km/h. However, it can be observed that the data from [8] also exhibits an inflection in the third-octave band in the frequency range of 400 to 800 Hz, which can also be attributed to the defined geometry of the texture layer.
Considering the entire frequency range, the third-octave band of the two-layer system in the range > 1000 Hz is above the comparison values from the literature, indicating that the current construction of the system does not mitigate aerodynamic noises through vehicular passage. As mentioned earlier, due to resource constraints, the texture layer could not be created as maximally permeable for the experiments. This might be the cause for higher noise levels occurring in the frequency range > 1000 Hz. Consequently, the generated noise could not be directed into the underlying absorption layer for absorption, resulting in the absence of detectable aerodynamically induced noise reduction in the measurement results.

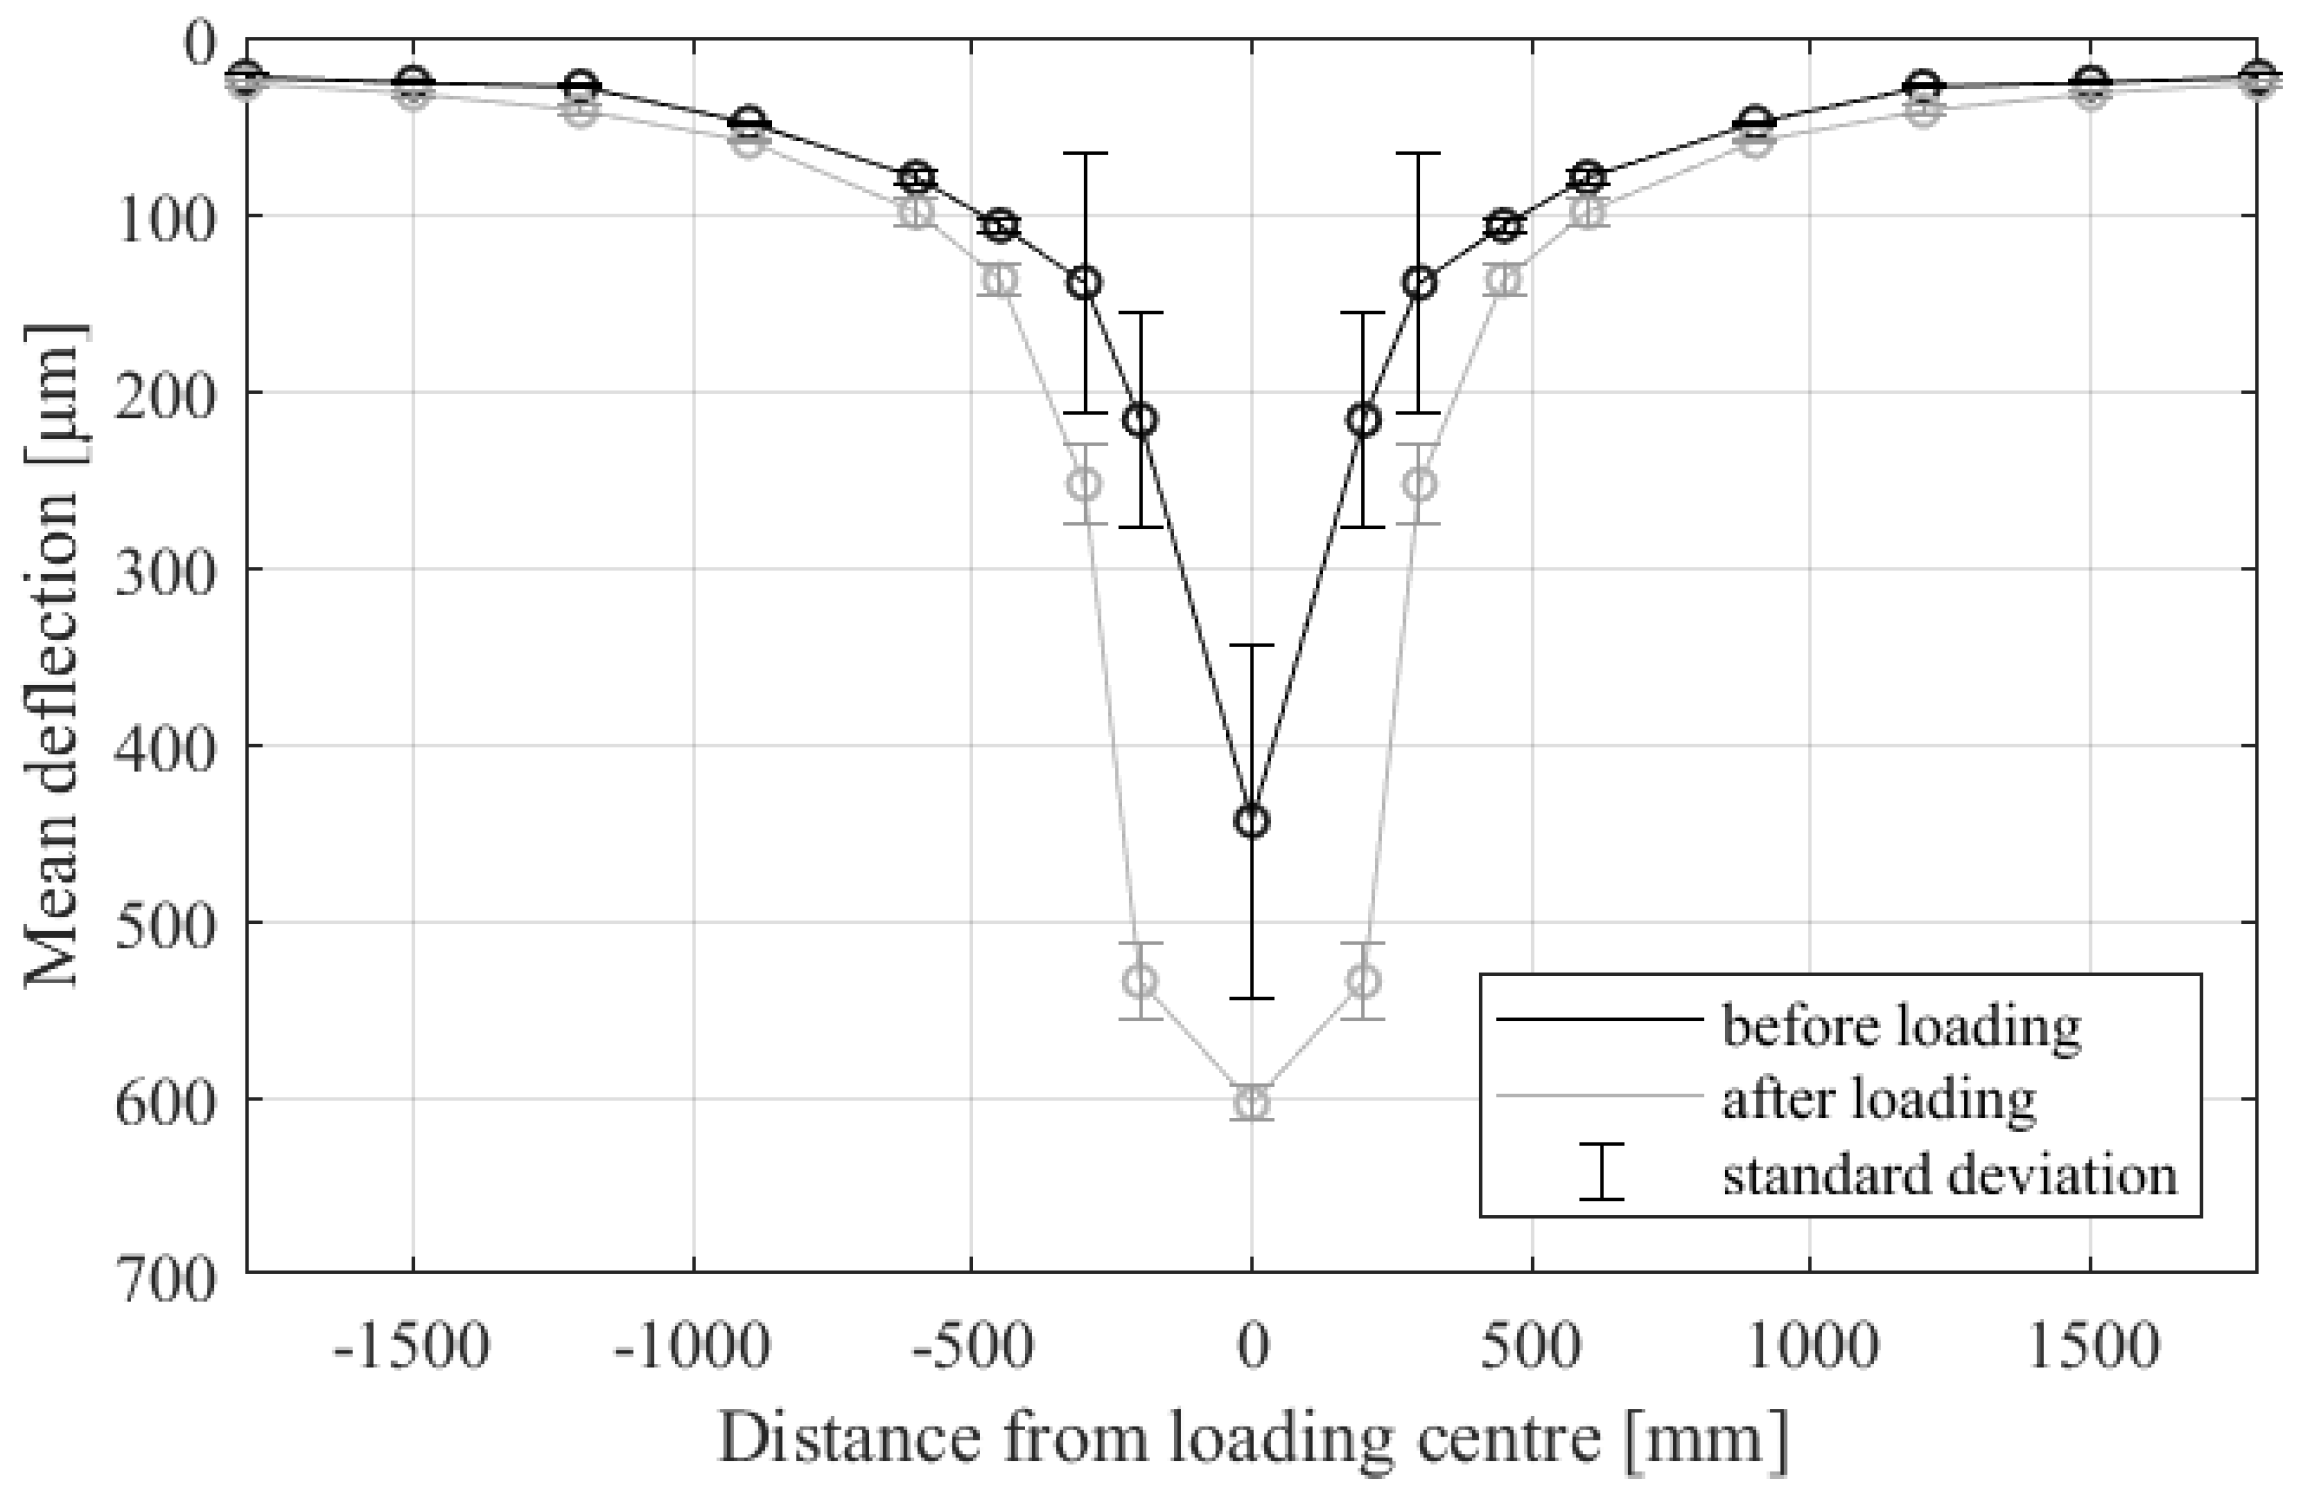
3.3.2. Analysis of Accelerated Pavement Testing

To assess the damage to the surface layer system due to heavy load stress with the accelerated loading facility MLS 30, a visual examination of the degree of damage and potential ravelling is conducted. This is complemented by an analysis of skid resistance, directly associated with surface wear of the texture layer. To determine the level of damage occurring at the material level within the surface layer system, the deflections obtained from the falling weight deflectometer (FWD) measurements are also subjected to closer inspection.
The literature analysis provided information about pavement distress, which can be categorized into functional and structural failures often occurring in pavements due to inadequate design. To verify if the design and implementation of the two-layer system were compliant with requirements, a visual inspection is conducted to identify the occurrence of these failures. Expected indications would include cracks or material breakage, texture column collapse, or the breaking out of individual texture layer elements, which are both types of ravelling. Delamination of the texture layer from the absorption layer, rutting deformation, and material abrasion could appear as well.
Figure 12 presents a comparison of a detailed section of the texture layer in the unloaded state (Figure 12a) and under load (Figure 12b). This section was selected as representative of the entire loaded area to illustrate structural changes. A direct comparison reveals marking abrasion from the pavement and rubber abrasion from the tire. The wear of the marking paint is attributed to repeated wheel loading and the limited bonding of the ordinary marking paint to the texture layer material. However, this paint was solely used for positioning the MLS 30 and is irrelevant for assessing the strength of the surface. Rubber abrasion, akin to conventional road surfaces such as asphalt or concrete, results from the frictional interaction between the tire and the pavement. When the tire rolls, there is both slippage at the tire interface causing mechanical abrasion of the tire material and the generation of thermal energy. At a certain tire temperature, this thermal energy softens the tire material, leading to material transfer onto the road surface [36]. However, the phenomenon of tire abrasion is not further explored in this study.
Figure 12a exhibits production-related imperfections in certain areas, such as the rounded edges of the texture columns. These arose during the texture layer production, where the material inadequately filled the silicone mold corners. Upon reevaluation of these defects after loading (Figure 12b), it is evident that there is no continuation of damage; the flaws remain unaltered and stable. This indicates that the texture layer material exhibits high resistance against horizontal and vertical forces from the heavy truck load. The other potential damages mentioned (i.e., cracking, rutting deformation, inadequate layer bonding) cannot be visually induced by the MLS 30 load. Material abrasion resulting from the MLS 30 load also remains visually unnoticeable. However, the assessment of skid resistance tests indirectly provides insight into any potential degradation of the surface’s skid resistance due to loading. Thus, the micro-Griptester was utilized to determine the skid resistance changes.
The entire skid resistance assessment covered a section of the texture layer surface of a length of around 40 m. The mean walking pace was 0.76 m/s. To account for the influence of the MLS 30’s passage, the measurement area was selected in such a way that both an unloaded section and the section loaded by the MLS 30 could be included in the grip measurement analysis. Figure 13a shows a measurement record of one run from the distance of 15 m to 41 m, which illustrates the influence of the MLS 30 loading in the height of the Grip Number.
In general, it could be observed that on the new texture layer surface, an average texture value GN of approximately 0.73 exists. This value is derived from the mean of all micro GripTester passes over the unloaded surface. After the heavy load stress, it is reduced on average to GN = 0.6 (Figure 13b).
Through the accurate tracking load of the 5-ton wheel load, there is a presumed removal of texture layer material on the surface, which explains the decreasing frictional coefficient. This phenomenon becomes evident only under the heavy load, which was not predicted in the laboratory study. It could be attributed, for instance, to the use of different tires and the number of wheel loads in this setting or due to the texture layer being affected by environmental factors for the weeks between installation and testing. A comparison with the laboratory study is somewhat limited here since the results are obtained from different measurement methods. However, the decrease in grip values over the load cycles can be determined proportionally. During the laboratory study, there is a 10% decrease in skid resistance concerning the SRT value after 600 passes, while in-situ, concerning the GN values, there is an 18% decrease after 160,000 passes. To determine the long-term skid resistance behavior, a targeted study should be conducted in the ARTe, where the material removal is determined, the duration of loading is significantly increased, and environmental influences are tested.
Ref. [6] provided measurements for the use of a portable friction tester (PFT) for PERS as well. The measurements yielded friction indexes (PFT) that are comparable to the Grip Number ranging from 0.62 to 0.78, some of which could only be achieved through additional grinding of the surface. A comparison to the values determined here (0.73 in the initial state and 0.6 after loading) indicates that the skid resistance values are at a similar level, meeting the administrative requirements.
The heavy load stress leads to a reduction in skid resistance values, indicating material abrasion and alterations in the texture’s surface. These changes represent a functional failure, which could potentially reduce skid resistance and consequently affect road safety in the long term. However, the current tests do not reveal a drastic decline in skid resistance values, suggesting that a functional failure of the surface layer system in this regard is not anticipated.
To ascertain the strength and stability of a pavement, the deflections generated from falling weight deflectometer (FWD) measurements are analyzed. FWD measurement is a non-destructive testing method that provides an impression of the structural capacity of a multilayer pavement. In the development of the absorption layer’s performance, a maximum deflection of the absorption layer of 0.5 mm was defined in [11] to mitigate the generation of high mechanical stress peaks. When the two-layer system is subjected to loading, the texture layer deforms and pushes the corners of its texture layer elements, which are connected by the textile, into the absorption layer. The reduction of these stress peaks can be achieved by reducing the deflection of the absorption layer (lower elastic modulus), which therefore was defined as a maximum of 0.5 mm (equivalent to 500 micrometers). This led to the target elastic modulus of 300 MPa for the absorption layer composition [11].
By conducting FWD measurements, the surface deflections from the full-scale implemented two-layer system were determined and are shown in Figure 14 and Figure 15. Figure 14 shows a comparison between the maximum assumed deflection from [11] and the maximum deflections that are yielded from this study and it demonstrates that the measured deflections at the load application point (±450 µm) within the real-scale two-layer demonstrator confirm the previously assumed deflections. This allows the statement, that the full-scale implementation of the two-layer system achieves the target layer elasticity. Additionally, Figure 14 reveals a change in the mean maximum deflections in dependence of the heavy truck load. Because after MLS 30 loading, the maximum deflection in the load center increases. According to [37], the deflections at the loading point serve as an indicator for pavement stiffness, rather than providing an assessment of the pavement’s condition or its projected lifespan. A comparison to the deflections investigated by [37] on various asphalt structures, reveals that the present two-layer system can be classified under a flexible pavement category, as it exhibits similar high deflections (ranging between 400 to 1000 µm) as the flexible pavement in their study. This is further corroborated by a direct comparison to the deflections of asphalt pavements from [37], where the use of stiffer base courses resulted in maximum deflections of only up to 180 µm, indicating a significantly stiffer pavement.
The utilization of the MLS 30 allowed for the consideration of changes in the load-bearing capacity of the examined system in the analysis. The deformation curves, which result from the localized load applied by the FWD before and after the MLS 30 loading, are illustrated in Figure 15. In detail, the average deformations of the measurements are depicted as a function of the distance from the load application point. More precisely, two average deformation basins are illustrated for measurements before (black) and after (gray) MLS 30 loading. It is evident that the deformation basin before loading is not as pronounced as the one after loading, indicating that the MLS 30 loading with 160,000 wheel passes has an impact on the load-bearing capacity of the layer system. In particular, the deformations in the immediate vicinity of the load application point up to approximately 500 mm distance reveal the influence of the heavy load, since the curves in this region vary significantly. For example, compared to before loading, the deformation basin after loading exhibits approximately 1.7 times higher deformation at the load center and nearly 2 times higher deformation at a distance of 200 mm from the load center. All measurement points located further away converge and are therefore negligible for the assessment.
To facilitate a comparison with conventional asphalt road construction, key performance indicators for assessing load-bearing capacity, as per [38], will be employed in Germany. This allows for the determination of a load-bearing capacity index, denoted as TZ, based on the deformation basins. Before the MLS 30 loading, an average TZ value of 0.6 (according to Equations (1) and (2)) is obtained, which reduces to 0.4 after heavy wheel loading. Considering the reference values from [38], the two-layer system can be classified into a load class Bk0.3 (according to [39]), which represents the lowest pavement class in Germany. Taking this classification into account, it is evident that the existing surface layer system can be categorized as flexible, being assigned to a lower construction class. When calculating R0 and TZ according to the German guideline, the maximum deflection at the load point and its immediate vicinity are significantly considered, implying that, as per the assertion by [37], the focus primarily involves an assessment of the surface stiffness rather than a comprehensive evaluation of the pavement as a whole.
Although the MLS 30 load seems not to visibly affect the resilience of the two-layer system, its impact can be observed through FWD measurements, revealing higher deflections and thus reduced bearing capacity values. The heavy load could potentially cause damage within the elastic absorption layer. Considering the assumption by [7] that the tensile and compressive strengths of PU-asphalt are very high, the amount of rubber particles integrated within this layer could potentially lead to the behavior that results in the decrease of the bearing capacity parameters. The use of these rubber particles induces an elastic behavior in the material due to the rubber’s elastic properties. However, this phenomenon provides an initial glimpse into the load-bearing capacity potential of this two-layer surface system, which warrants further in-depth investigation.
In summary, a comparison with traditional asphalt road construction led to the statement that this surface layer system acts more flexibly than conventional bituminous bound pavements, to ensure a higher noise reduction, which was the aim of this study. However, whether this measurement method provides informative data in this context remains unclear, as it does not allow for an assessment of the overall pavement structure, and stiffness can also be calculated through laboratory experiments.

4. Conclusions

The aim of this study was the realization and examination of a two-layer noise-reducing polymer-based road surface in terms of its performance characteristics. The challenge arising from the findings from the literature was to address the conflict of targets between acoustic and mechanical effectiveness because many studies have shown that noise-reducing road surfaces could be highly effective acoustically but lacked mechanical strength.
Through a comprehensive laboratory study, it was possible to implement a real-scale demonstrator, which could be evaluated in terms of acoustic efficacy and durability. Therefore, the laboratory study concluded skid resistance tests, ravelling tests, wheel tracking tests, layer bond tests, and permeability tests, to define the required steps for the realization of the full-scale demonstrator. After completion of the real-scale two-layer pavement, an assessment of the noise reduction potential through CPX measurements and the evaluation of the strength and durability of the system using accelerated pavement testing in combination with skid resistance and falling weight deflectometer tests were conducted.
In the context of this study, it has been demonstrated that the two-layer system can be implemented stably. However, the stabilization of the system results in a lesser noise reduction compared to the noise-reducing pavements from the literature. Although the changes in the geometry and composition of the layers indicate minimal tire vibrations, which reduces structure-based noise emission, aerodynamically generated noise cannot be significantly reduced. Sufficient strength of the two-layer system was evidenced through the execution of accelerated pavement tests, because no visual damages to the system, such as ravelling, material breakage, or layer delamination, occurred following the MLS 30 loading. The system appears to be more stable compared to other noise-reducing systems where these failures have been observed. Additionally, falling weight deflectometer (FWD) measurements allow the determination of deflections, categorizing the system as flexible. The heavy wheel loading results in increased deflections, which could indicate material damage and should therefore be further investigated in the future.
This study provides an outline of the analysis of the short-term impact of the system, highlighting the need for further research. Specifically, long-term monitoring would be a valuable addition to assess, for instance, the influence of the environment and increased load numbers, as well as to evaluate the driving experience of road users. As polymeric materials are being used as an alternative to conventional pavements, it is recommended to conduct a Life Cycle Analysis (cradle-to-cradle) of the system to verify its suitability in terms of functionality and sustainability.
On the whole, stabilization compromises the acoustic effectiveness of the two-layer system, although there is still a noise reduction of 3.1 dB(A) compared to conventional bitumen-bound pavements. The current research stage of the stabilized system allows the system to be utilized as a prototype in road traffic, aiming to mitigate the noise disturbance caused by road traffic for the population.

Author Contributions

Conceptualization, S.T. and M.O.; methodology, S.T.; validation, S.T.; formal analysis, S.T.; investigation, S.T.; resources, S.T.; data curation, S.T.; writing—original draft preparation, S.T.; writing—review and editing, M.O.; visualization, S.T.; supervision, M.O.; project administration, S.T.; funding acquisition, M.O. All authors have read and agreed to the published version of the manuscript.

Funding

This research was funded by the Federal Ministry of Education and Research; 13XP5001F.

Institutional Review Board Statement

Not applicable.

Informed Consent Statement

Not applicable.

Data Availability Statement

Data are contained within the article.

Acknowledgments

Thank you to our master and bachelor students Martin, Lea, Jule, and Jonas, who helped us generating the research results. We also thank the team of the Federal Highway Institute (BASt), who gave us the possibility to use the demonstration area duraBASt and the testing facilities.

Conflicts of Interest

The authors declare no conflict of interest.

Abbreviations

The following abbreviations are used in this manuscript:
ARTeAachen Ravelling Tester
BEBitumen emulsion
CPXClose Proximity Method
FWDfalling weight deflectometer
GNGrip Number
HMAHot Mix Asphalt
kpermeability coefficient
MAMastic asphalt
MLS 30Mobile Load Simulator
PUPolyurethane
PVAPoly-Vinyl-Alcohol
SBSTShear Bond Strength Test
SRTSkid Resistance Tester
TATTensile Bond Strength Test
WTTwheel tracking test

Appendix A

Table A1. Composition of texture layer.
ComponentProportionCompany, Location, Country
*1methyl methacrylate (PMMA)25%Röhm GmbH, Darmstadt, Germany
*2silica sand filler (< 1 mm) (MinMix AT530)75%Quarzwerke GmbH, Frechen, Germany
*3add. of 1% dibenzoyl peroxide (Swarco Limburger Lackfabrik GmbH, Diez, Germany)
*1–3 Explanations referring to Section 2.
Table A2. Composition of absorption layer.
ComponentProportionCompany, Location, Country
*4crump rubber super grob (2–6 mm)7.5 vol.-%Genan GmbH, Dorsten, Germany
*5basalt aggregates (2–5 mm)85.5 vol.-%Basalt Quarry Hühnerberg, Königswinter, Germany
*5basalt sand (0–2 mm)3 vol.-%Basalt Quarry Hühnerberg, Königswinter, Germany
*6limestone filler4 vol-%Kalkwerk-Natursteinwerke GmbH und Co. KG, Üxheim-Ahütte, Germany
*7addition of 13 vol.-% of polyurethane binder (Elastan 3538/103)
*4–7 Explanations referring to Section 2.

References

  1. Straßen in Deutschland. Available online: https://de.statista.com/statistik/studie/id/12547/dokument/strassen-in-deutschland-statista-dossier/ (accessed on 31 October 2023).
  2. Wothge, J. Die Körperlichen und Psychischen Wirkungen von Lärm. UMID 01/2016 2016, 38–43. Available online: https://www.umweltbundesamt.de/sites/default/files/medien/2218/publikationen/umid_1_2016_uba_laerm.pdf (accessed on 4 November 2023).
  3. Gogolin, D. Rheologische Kennwerte Bitumenhaltiger Bindemittel zur Charakterisierung Akustischer Eigenschaften von Asphaltdeckschichten. Ph.D. Thesis, Ruhr University Bochum, Bochum, Germany, 2012. [Google Scholar]
  4. Peschel, U.; Reichart, U.; Bartholomaeus, W.; Ripke, O.; Stöckert, U.; Zöller, M. Lärmmindernde Fahrbahnbeläge. Ein Überblick über den Stand der Technik; Umweltbundesamt: Dessau-Roßlau, Germany, 2014; pp. 18–32. [Google Scholar]
  5. Sandberg, U.; Ejsmont, J.A. Tyre/Road Noise Reference Book, 1st ed.; INFORMEX: Kisa, Sweden, 2002. [Google Scholar]
  6. Goubert, L.; Sandberg, U. Construction and Performance of Poroelastic Road Surfaces Offering 10 dB of Noise Reduction—PERSUADE Final Technical Report; Belgian Road Research Centre (BRRC) and Swedish National Road and Transport Research Institute (VTI): Woluwe-Saint-Lambert, Belgium, 2016. [Google Scholar]
  7. Renken, L. Development of PU-Asphalt: From the Concept to the Practical Implementation. Ph.D. Thesis, RWTH Aachen University, Aachen, Germany, 2019. [Google Scholar]
  8. Schacht, A. Entwicklung Künstlicher Straßendeckschichtsysteme auf Kunststoffbasis zur Geräuschreduzierung mit Numerischen und Empirischen Verfahren. Ph.D. Thesis, RWTH Aachen University, Aachen, Germany, 2015. [Google Scholar]
  9. Beckenbauer, T. Physik der Reifen-Fahrbahn-Geräusche—Geräuschentstehung, Wirkungsmechanismen und Akustische Wirkung unter dem Einfluss von Bautechnik und Straßenbetrieb. In Proceedings of the 4. Informationstage—Geräuschmindernde Fahrbahnbeläge in der Praxis-Lärmaktionsplanung, Planegg, Germany, 11–12 June 2008. [Google Scholar]
  10. Yoder, E.J.; Witczak, M.W. Principles of Pavement Design, 2nd ed.; John Wiley & Sons, Inc.: Hoboken, NJ, USA, 1975. [Google Scholar]
  11. Faßbender, S.; Oeser, M. Investigation on an Absorbing Layer Suitable for a Noise-Reducing Two-Layer Pavement. Materials 2020, 13, 1235. [Google Scholar] [CrossRef] [PubMed]
  12. Faßbender, S.; Oeser, M.; Eggersmann, R.; Reese, S.; Koch, A.; Gries, T.; Pieroth, M.; Klein, A. Development of 843 a novel polymer-based road surface layer with focus on noise reduction and durability. Bauingenieur 2022, 10, 323–330. [Google Scholar] [CrossRef]
  13. Baur, E.; Brinkmann, S.; Osswald, T.; Rudolph, N.; Schmachtenberg, E. Saechtling Kunststoff Taschenbuch, 31st ed.; Carl Hanser Verlag: Munich, Germany, 2013. [Google Scholar]
  14. DIN EN 13036-4:2011; Road and Airfield Surface Characteristics—Test Methods—Part 4: Method for Measurement of Slip/Skid Resistance of a Surface—The Pendulum Test. Beuth Verlag GmbH: Berlin, Germany, 2011.
  15. DIN EN 12697-48:2021; Bituminous Mixtures—Test Methods—Part 48: Interlayer Bonding. Beuth Verlag GmbH: Berlin, Germany, 2021.
  16. DIN EN 12697-22:2020; Bituminous Mixtures—Test Methods—Part 22: Wheel Tracking. Beuth Verlag GmbH: Berlin, Germany, 2022.
  17. DIN EN ISO 11819-2:2017-10; Acoustics—Measurement of the Influence of Road Surfaces on Traffic Noise—Part 2: The Close-Proximity Method. Beuth Verlag GmbH: Berlin, Germany, 2017.
  18. Wacker, B. Zeitraffende Belastungsversuche mit Integriertem Einsatz zerstöRungsfreier Messverfahren—Entwicklung eines Kontinuierlich Messenden Structure Measurement Systems zur Detektion von Veränderungen im Aufbau. Ph.D. Thesis, Ruhr University Bochum, Bochum, Germany, 2020. [Google Scholar]
  19. DIN EN 12697-50:2018; Bituminous Mixtures—Test Methods—Part 50: Resistance to Scuffing. Beuth Verlag GmbH: Berlin, Germany, 2018.
  20. Wang, D. Schaffung des Bewertungshintergrunds zur Charakterisierung des Polierverhaltens der Einzelnen, Gesteinsbildenden Minerale und zur Untersuchung des Griffigkeitsverhaltens der Mineralaggregate in Abhängigkeit von den Polierbedingungen. Ph.D. Thesis, RWTH Aachen University, Aachen, Germany, 2011. [Google Scholar]
  21. DIN EN 12697-19:2020; Bituminous Mixtures—Test Methods—Part 19: Permeability of Specimen. Beuth Verlag GmbH: Berlin, Germany, 2018.
  22. Wacker, B.; Scherkenbach, M.; Rabe, R.; Golkowski, G. Belastungseinrichtung Mobile Load Simulator MLS30—Sensorik zur Beanspruchungsdetektion im Ersten Gemeinsamen Versuchsbetrieb. In Reports of the Federal Highway Institute; Fachverlag NW in der Carl Schuenemann Verlag GmbH: Bremen, Germany, 2016; Volume S101. [Google Scholar]
  23. Forschungsgesellschaft für Straßen- und Verkehrswesen (FGSV). Arbeitspapier Tragfähigkeit von Verkehrsflächenbefestigungen Teil A: Messsysteme (AP Trag Teil A) (FGSV 433 A); FGSV Verlag: Köln, Germany, 2020. [Google Scholar]
  24. Jendia, S. Bewertung der Tragfähigkeit von Bituminösen Straßenbefestigungen. Ph.D. Thesis, University of Karlsruhe, Karlsruhe, Germany, 1995. [Google Scholar]
  25. Wolf, A.; Schickl, W. Restnutzungsdauer von Asphaltschichten—Prüfung der Grundlagen zu ihrer Berechnung. In Reports of the Federal Highway Institute; Fachverlag NW in der Carl Schuenemann Verlag GmbH: Bremen, Germany, 1998; Volume S17. [Google Scholar]
  26. Rasol, M.; Schmidt, F.; Ientile, S.; Adelaide, L.; Nedjar, B.; Kane, M.; Chevalier, C. Progess and Monitoring Opportunities of Skied Resistance on Road Transport: A Critical Review and Road Sensors. Remote Sens. 2021, 13, 3729. [Google Scholar] [CrossRef]
  27. Managing Your Network for Skid Resistance Micro GripTester (µGT)—Data Sheet. Available online: https://www.mastrad.com/microgt.pdf (accessed on 2 October 2023).
  28. BS 7941-2:2000; Methods for Measuring the Skid Resistance of Pavement Surfaces—Test Method for Measurement of Surface Skid Resistance Using the GripTester Braked Wheel Fixed Slip Device. BSI Group: London, UK, 2000.
  29. Forschungsgesellschaft für Straßen- und Verkehrswesen (FGSV). Merkblatt zur Bewertung der Straßengriffigkeit bei Nässe (M BGriff) (FGSV 401); FGSV Verlag: Köln, Germany, 2012. [Google Scholar]
  30. Forschungsgesellschaft für Straßen- und Verkehrswesen (FGSV). Technische Prüfvorschriften für Asphalt (TP Asphalt-StB) Teil 80: Abscherversuch (FGSV 756/80); FGSV Verlag: Köln, Germany, 2012. [Google Scholar]
  31. Tsai, B.-W.; Coleri, E.; Harvey, J.T.; Monismith, C.L. Evaluation of AASHTO T 324 Hamburg-Wheel Track Device test. Constr. Build. Mater. 2016, 114, 248–260. [Google Scholar] [CrossRef]
  32. T 324; Standard Method of Test for Hamburg Wheel-Track Testing of Compacted Hot-Mix Asphalt (HMA). AASHTO: Washington, DC, USA, 2023.
  33. Oeser, M.; Faßbender, S.; Reese, S.; Eggersmann, R.; Gries, T.; Koch, A. Grundlagen der konstruktiven Gestaltung, Struktur sowie neuer polymerer Werkstoffe für Straßendeckschichtsysteme. In Grundlegende Erforschung Polymerer Werkstoffe Sowie Innovativer Herstellungs- und Einbautechnologien für Straßendeckschichtsysteme; RWTH Aachen University: Aachen, Germany, 2019. [Google Scholar]
  34. Varallyay, G.; Legarth, S.V.; Ramirez, T. Music Lovers and Hearing Aids. Available online: https://www.audiologyonline.com/articles/music-lovers-and-hearing-aids-16478 (accessed on 21 November 2023).
  35. Cesbron, J.; Bianchetti, S.; Pallas, M.A.; Pratico, F.G.; Fedele, R.; Pellicano, G.; Moro, A.; Bianco, F. Acoustical characterization of low-noise prototype asphalt concretes for electric vehicles. In Proceedings of the Euronoise 2021, Madere, Portugal, 25–27 October 2021. [Google Scholar]
  36. Seipel, G. Analyse der Einflussgrößen auf die Entstehung und Intensität von Reifenspuren. Ph.D. Thesis, Technical University of Darmstadt, Darmstadt, Germany, 2013. [Google Scholar]
  37. Rodrigues de Andrade, L.; Bessa, I.S.; Vasconcelos, K.L.; Bariani Bernucci, L.L.; Suzuki, C.Y. Structural Performance Using Deflection Basin Parameters of Asphalt Pavements with Different Base Materials Under Heavy Traffic. Int. J. Pavement Res. Technol. 2023, 1–14. [Google Scholar] [CrossRef]
  38. Forschungsgesellschaft für Straßen- und Verkehrswesen (FGSV). Arbeitspapier—Tragfähigkeit für Verkehrsflächenbefestigungen Teil C 2.1 Falling Weight Deflectometer (FWD): Auswertung und Bewertung—Asphaltbauweise (AP Trag Teil C 2.1) (FGSV 433 C 2.1); FGSV Verlag: Köln, Germany, 2014. [Google Scholar]
  39. Forschungsgesellschaft für Straßen- und Verkehrswesen (FGSV). Richtlinien für die Standardisierung des Oberbaus von Verkehrsflächen (RStO) (FGSV 499); FGSV Verlag: Köln, Germany, 2012. [Google Scholar]
Figure 1. Concept of the optimized noise-reducing two layer system by [11,12].
Sustainability 15 16475 g001
Figure 2. Production process of the absorption layer: (a) aggregates, (b) mixing tool, and (c) compacted mixture in mold.
Sustainability 15 16475 g002
Figure 3. Production process of the texture layer: (a) silicone mold, (b) filling the mold and placing textile, and (c) releasing texture layer from mold.
Sustainability 15 16475 g003
Figure 4. Combination of texture and absorption layer.
Sustainability 15 16475 g004
Figure 5. Development of the skid resistance of the texture layer.
Sustainability 15 16475 g005
Figure 6. Maximum shear forces yielded from the shear bond strength test (SBST).
Sustainability 15 16475 g006
Figure 7. Rut depths of the two-layer system compared to an HMA AC 11 DS.
Sustainability 15 16475 g007
Figure 8. Results of interlayer (a) and adhesion (b) bond and permeability (c) tests.
Sustainability 15 16475 g008
Figure 9. Full-scale two-layer pavement system after construction.
Sustainability 15 16475 g009
Figure 10. Comparison of the maximum sound pressure levels of LIDAK (*linear interpolated) [6,8] (a) and result of third-octave spectrum of the two-layer system (b).
Sustainability 15 16475 g010
Figure 11. Comparison of third-octave-band to LIDAK [8] and literature from [35].
Sustainability 15 16475 g011
Figure 12. Comparison of unloaded (a) and loaded (b) section.
Sustainability 15 16475 g012
Figure 13. Grip Number (GN) across the measurement distance (a) and Grip Numbers of loaded and unloaded sections of the top layer system (b).
Sustainability 15 16475 g013
Figure 14. Comparison of the target deflections from [11] to the deflection results from this study before and after MLS 30 loading.
Sustainability 15 16475 g014
Figure 15. Deformation basins before and after loading with the MLS 30.
Sustainability 15 16475 g015
Table 1. Overview of tested variants for the layer bond of the texture and absorption layer.
VariantVar 1Var 2Var 3Var 3.1Var 3.2
absorption layerfreshfreshprefab.prefab.prefab.
binder content [wt.-%]6.38.36.36.36.3
top layerprefab.prefab.prefab.prefab.prefab.
adhesive [g]00302010
adhesive [g/m2]0016951130565
Disclaimer/Publisher’s Note: The statements, opinions and data contained in all publications are solely those of the individual author(s) and contributor(s) and not of MDPI and/or the editor(s). MDPI and/or the editor(s) disclaim responsibility for any injury to people or property resulting from any ideas, methods, instructions or products referred to in the content.

