Article

Enhancing Coffee Quality in Rwanda: A Cost Benefit Analysis of Government Policies

1
Department of Economics, Queen’s University, Kingston, ON K7L 3N6, Canada
2
Department of Economics, Eastern Mediterranean University Famagusta, North Cyprus via Mersin 10, Famagusta 99628, Turkey
3
Cambridge Resources International Inc., Cambridge, MA 02140, USA
*
Author to whom correspondence should be addressed.
Sustainability 2023, 15(23), 16513; https://doi.org/10.3390/su152316513
Submission received: 14 September 2023 / Revised: 22 November 2023 / Accepted: 29 November 2023 / Published: 3 December 2023
(This article belongs to the Section Economic and Business Aspects of Sustainability)

Abstract

:
Over the past two decades, Rwanda has positioned itself as a leading producer of specialty coffee. The strategic move from ordinary to specialty coffee has overall been economically beneficial to the country. However, the multitude of incentives provided by both the Government and international donors spawned a rush to build a large number of coffee washing stations (CWS) throughout Rwanda. This trend gave rise to an oversupply of these plants, with most operating below their processing capacity. Our study uses cost benefit analysis to estimate the economic welfare loss that Rwanda has suffered owing to the combined effect of the oversupply of CWS, the coffee zoning policy, and the government regulated cherry coffee prices. Our results reveal that, if the coffee industry were rendered more competitive by dint of a reduction in the number of CWS, then the annual savings to Rwanda would be substantial. Furthermore, farmers could potentially receive prices that are 150% higher than the mandated fixed prices they are currently been paid. Our analysis could potentially be beneficial to Rwandese policy makers in devising fairer incentives to keep farmers interested in coffee farming, thus ensuring the sustainability of the coffee value chain in the long term.

1. Introduction

Rwandese coffee is acclaimed on the international market for its high quality. Although a small landlocked country, Rwanda nonetheless has ideal growing conditions for coffee farming due to its rich volcanic soil, high altitude, and ample rainfall. However, land is a scarce resource and coffee is in competition with other crops for the limited space available. Furthermore, many of Rwanda’s coffee trees are older than 30 years, consequently, their yield is low. Since 2002, Rwanda has adopted a policy of encouraging the production of specialty coffee, or fully washed coffee, rather than ordinary coffee. Specialty coffee fetches much higher prices in contrast to ordinary coffee. Prior to 2002, Rwanda was mainly known as a producer of low-quality ordinary coffee and thus it did not attract any particular interest from specialty coffee importers or consumers [1]. The trend of emphasizing and bolstering the production of specialty coffee has been observed in other coffee producing nations such as Ethiopia, as mentioned by [2,3,4,5].
The main difference between the two types of coffee stems from the fact that ordinary coffee is unwashed and it is processed by farmers themselves at home using rudimentary equipment. The production of fully washed coffee, on the other hand, as its name implies, requires coffee to be washed intensively. This is done in wet mills or coffee washing stations (CWS). Producing and exporting fully washed coffee therefore entails a sophisticated process and requires that investments be made in the processing segment of the value chain for coffee.
The potential for Rwanda to be a major player in the specialty coffee niche market was recognized in the early 2000s by international development agencies and the Government of Rwanda (GoR). This led to an outpouring of financial and technical assistance from those various agencies into investments in the coffee value chain, most specifically into opening CWS throughout the country. The USAID was the pioneer behind the new trend of supporting the nascent specialty coffee industry. Case in point, by the year 2006, out of the 46 CWS operating in the country 38 had been funded by the USAID [6,7,8]. In the year 2002, Rwanda only had two CWS.
According to official figures, the number of registered CWS in 2022 stood at 300 [9]. The spread of CWS has contributed immensely to raising Rwanda’s reputation in the global coffee marketplace, as illustrated by the number of international competitions and awards that Rwandese coffee has won. More importantly, the export of higher-quality coffee has been very beneficial economically for Rwanda given that coffee is an important source of foreign exchange earnings to the country. As an illustration, for the 2021–2022 fiscal year, Rwanda’s total agricultural exports were estimated at USD 640,952,296, out of which coffee exports accounted for USD 75,571,428. According to the 2021 to 2022 annual report [10] of the National Agricultural Export Development Board (NAEB), this amount represented approximately 11.8% of the total value of agricultural exports from Rwanda.
Although the decision of upgrading the quality of coffee was a compelling one at its inception, the government’s policies surrounding the licensing and price margins received by CWS has created suboptimal outcomes. These policies have led to a situation where there is currently an oversupply of CWS in Rwanda, in large part due to the financial support granted for the initial investment but also sustained and exacerbated by the subsequent adoption of the zoning policy and the fixed pricing of cherry coffee. Given that the supply of cherries in any given year is limited, and there is a large number of competing CWS, the vast majority of CWS in Rwanda operate far below their built-in processing capacity. The Rwandan government, however, decided to tackle the scarcity of cherry by implementing a zoning policy consisting of limiting the geographic area in which a specific coffee washing station was allowed to purchase cherries. Farmers were also required to sell their cherry to CWS within their zone at a fixed price mandated and enforced by the government. From our discussions with CWS owners in Rwanda, we learned that failure to abide by these rules is a punishable offence. A coffee washing station can lose its license if it violates those rules.
The zoning policy has had the adverse effect of artificially keeping in business inefficient washing stations while capping the revenues farmers could receive from the sale of their cherries. The policy of restricting cherry sales to CWS within their designated zones was negatively perceived by farmers as having an adverse impact on their livelihood. In a survey by [11], it was reported that 61.9% believed that the zoning policy has resulted in them getting lower prices for cherry coffee than they would have otherwise received. As of the year 2022, Rwanda had a little over 300 CWS and a total export volume of fully washed coffee of approximately 15,000 tons for the same year. This implies that a coffee washing station produces on average only 50 tons of parchment coffee per year. Most of the washing stations were built with the capacity to process a much larger volume of cherry since they were built during the period when there were many incentives to open CWS. It has been pointed out by [12] that, of the 214 washing stations that were installed in Rwanda in 2012, one in four washing station processed only 25% of their capacity and the median washing station processed only 53% of their capacity.
This paper conducts an analysis that is retrospective in focus. We are trying to answer the question, what could have been the size of the allocation of the net benefits of the coffee upgrading policy if the government had implemented a policy of increasing the minimum price paid to farmers for cherries while restricting the number of CWS licensed to operate in Rwanda? The paper also estimates the potential economic resource cost savings that would have been realized if there were fewer CWS in the country, which in turn would mean lower capital and operating costs spent on processing parchment coffee.
In the quantitative analysis, it is postulated that the policies could have been formulated in such a manner that coffee farmers would receive all the net benefits from this policy redesign. However, in reality, the allocation of the net benefits in excess of the required rate of return that would be generated from a potential improvement in the policies would normally be allocated partially between coffee farmers, owners of the CWS, and the government.
From the analysis that follows, it appears not only that there is a considerable potential for coffee farmers to be paid higher prices for cherry coffee, but also to have a lower number of CWS and still have enough capacity to maintain the annual production of parchment coffee at its current level of 15,000 tons. Such policies would also provide the farmers with a strong incentive to replant coffee trees and hence expand the overall output of high-grade parchment coffee over time.
The innovation of our research lies in the fact that we compute and present in numerical terms the combined adverse impact that the oversupply of CWS, the zoning policy, and the government regulated cherry coffee prices has had on the income of Rwandan coffee farmers, and on the broad economy of Rwanda. An integrated cost benefit analysis framework is used to trace quantitatively the impact of government policies on each of the main stakeholders in the sector. Such an analysis has never been done before. The analysis presented in this paper is a critical input to decision making in designing much needed policies aimed at offering better prices incentives to coffee farmers to entice them not to switch from coffee to other crops. If a large proportion of farmers continue ditching coffee farming, then there would eventually be very little specialty coffee to be exported. Therefore, improving price incentives to farmers is essential for the long-run sustainability of the coffee sector in Rwanda. Furthermore, our work can similarly be helpful in devising a regulatory framework that ensures that CWS operate in a competitive market.

Literature Review

The improvement of the coffee value chain in Rwanda has attracted interest from many researchers whose studies are closely related to our work including:
Church (2018) [13] used as benchmark for her analysis the Government’s stated goal of exporting 80% of its total coffee production as fully washed by 2018. Her article quantifies in monetary terms the negative impact of missing this target from the perspective of three major actors of the coffee value chain in Rwanda namely: coffee farmers, coffee exporters, and lastly the Government of Rwanda. The results indicated that the losses to coffee farmers were estimated at 125 RWF/kg of cherry sold for the period under consideration. Exporters realized a profit 43% lower than the profit they would have achieved if the government target of 80% fully washed coffee exports were met and, finally, the losses in terms of foreign exchange to Rwanda were evaluated at USD 2.6 million solely for the year 2016.
Clay et al. (2016) [14] estimate the cost of production of cherry to Rwandese coffee farmers. Their work reveals that the true cost of production of cherry for farmers in Rwanda is 177 RWF/kg, which is far above the yardstick of 80 RWF/kg commonly used by the Government of Rwanda to determine the mandated price of cherry coffee during a season. As a negative corollary of this underestimation of the production costs, a large proportion of coffee farmers in Rwanda are operating at loss or have very little margins and they would be better off being employed as workers on someone else farm rather than owning and operating their own coffee plantation. The article further observes that the processing tranche of the Rwandan coffee value chain, namely exporters and coffee washing stations, have been flourishing, but the benefits from this improvement have not trickled down to coffee farmers. The failure to incorporate farmers as full partners in their view is the reason behind the stagnation of the production level in Rwanda. The conclusions of Clay et al. are strongly supported by the findings of this study.
Gerard et al. (2017) [11] investigate the perceptions that the main stakeholders of the coffee value chain in Rwanda had of the zoning policy implemented in 2016. The result from their survey reveals some important points; 75% of the stakeholders believed that the zoning policy was mainly beneficial to coffee washing stations and cooperatives to the detriment of coffee farmers. A total of 69.6% of stakeholders surveyed believe that the zoning policy resulted in increased cherry sales to CWS. Overall, the article demonstrates that most stakeholders of the value chain consider the zoning policy to be advantageous only to CWS and to a lesser extent to cooperatives.
Clay and Bizoza (2018) [15] investigate ways to ensure the long-run sustainability and growth in the coffee sector of Rwanda. The article finds that coffee farmers have very little incentive to remain in the coffee business due to the high production costs they incur and the very low margins they achieve. Consequently, farmers are uprooting their trees in favor of other crops. Consequently, the necessary critical investments that are needed in order to boost coffee production yields are not being made. Given that the long-term targets of the Government in terms of the performance of the coffee industry hinges on the availability of an ample supply of cherry coffee, the article recommends that all stakeholders of the value chain commit to ensuring that farmers be compensated fairly, and that coffee be given more precedence over other crops since Rwanda has a comparative advantage in the production of specialty coffee on the world stage.
Other articles that are similar or related to our work include; Behuria (2019) [16], who studies the evolution of the coffee value chain over the years in Rwanda. Murekezi (2003) [17], who used cost benefit analysis to conduct a financial feasibility of an earlier investment in the production of specialty coffee by a cooperative in Rwanda. Fitriani et al. (2020) [18], who employed cost benefit analysis to evaluate the economic viability of coffee farming in agroforestry systems in Indonesia. In the same vein, Karim et al. (2019) [19] make a comparison between different methods of coffee processing using the cost benefit methodology to ascertain the most suitable processing methods for a rural community. To the best of our knowledge, despite the vast interest that the coffee industry in Rwanda has generated from researchers, our article is the first of its kind to undertake both a financial and economic analysis of government policies pertaining to the move to the production of specialty coffee.

2. The CWS Zoning Policy in Rwanda

The coffee zoning policy was first put into effect in 2016. It constrained the sale of cherry coffee by farmers to CWS within the confines of a pre-established zone. The trade of cherry coffee between CWS and farmers belonging to different zones was prohibited. The government stated goals of this policy, as enumerated by the NAEB, were to enhance traceability in the Rwanda coffee sector, to cut out the middlemen, to bolster relationships between farmers and CWS, to increase the availability of coffee supply to struggling CWS, to increase farmers income, and lastly to improve the quality of coffee [20].
The zoning policy, however, has been an impediment to market efficiency and to increasing the income of coffee farmers. By preventing buyers and sellers to freely choose with which counterparts to trade, the zoning policy has led to a situation where some CWS that would have gone out of business continue to operate, given that they are guaranteed access to a certain volume of cherry coffee for their operations. The zoning policy seems to have been designed with the aim of protecting the owners of washing stations rather than to promote the welfare of farmers. The zoning policy further forced the government to intervene in the coffee market in order to enforce its mandated price for cherry coffee. If market forces were left to operate more freely, or if the government mandated price for cherry coffee were increased, then the poorly managed or underfinanced washing stations would exit the market as the remaining washing stations could operate more efficiently. The coffee farmers would be better off since they would receive higher prices for their coffee. In the long run, the zoning policy posed a threat to the sustainability of the coffee sector. The lower prices for cherries have resulted in the erasure of incentives for farmers to make the necessary investments in replanting coffee trees that would eventually expand the country’s coffee production in the long term.
Another major flaw in the design and implementation of the zoning policy stemmed from the fact that it did not prevent owners and businesses from operating many stations across different zones. It means that, in order to obtain a larger volume of cherry coffee, CWS owners were in some instances forced to build washing stations in many zones instead of having one or two CWS that could have processed the same volume of cherry coffee. Opening small CWS in multiple zones represents very substantial unnecessary capital expenditures. This further exacerbated the issue of overcapacity, as many washing stations have been built for the sole purpose of processing smaller quantities of cherry coffee. As an illustration to the previous point, there are several companies in Rwanda that own and operate many washing stations across the country. For example, Rwacof owns and operates 30 CWS while the Rwanda Trading Company owns and operates 18 CWS [21]. The zoning policy therefore contributed heavily to the waste of economic resources that could have been injected into the improvement of the coffee plantations. Following intense pressures from coffee farmers, the zoning policy was repealed by the Ministry of Agriculture and Animal Resources of Rwanda in June, 2023. However, the National Agricultural Export Development Board (NAEB) will continue to set and publish a fixed purchase price per kg for coffee cherries each season. Whether NAEB can force all the cherries to be purchased at this official price is still an open question.

3. Data and Methodology

Our paper is based on a cost benefit analysis methodology, which is referred to as an integrated investment appraisal [22,23,24,25]. This approach allows us to gauge the financial viability of investment projects, as well as their impacts on the affected stakeholders. We conduct a financial, an economic, and a stakeholder analysis of a generic coffee washing station characterized by four different annual production scales of parchment coffee. The objective behind this methodology is to use the results from our model to assess the degree to which the policies geared at incentivizing the production of specialty coffee have resulted in an over expansion of the number of washing stations beyond what would have been economically efficient. This analysis is undertaken with a clear appreciation of the underlying constraints facing the supply of cherry coffee production in the country.

3.1. Financial Analysis

3.1.1. Cost Structures of a Washing Station

A typical coffee washing station purchases freshly harvested cherry coffee from farmers. At the station site, cherry coffee undergoes four main processing phases which involve sorting, soaking fermentation, and finally the coffee beans are thoroughly washed after being left to be fermented for about 30 h [26,27]. The final product resulting from this process is called fully washed coffee, or parchment coffee. In our analysis, we focus mainly on the cost of processing or transforming cherry coffee into parchment coffee at CWS. A typical coffee washing station is fully operational only during the portion of the year that coincides with the coffee harvest season in Rwanda. The season usually lasts three months, or approximately 78 operating days. The costs structure of a CWS includes seasonal variable costs and fixed costs, including the initial investment cost.
The main components of the investment capital needed to open a coffee washing station are (among others) the land on which the site is built, coffee pulping machines, electricity generators, recycling pumps, drying tables, and the construction and engineering costs. Using 2022 prices levels, the estimated total investment cost of a mid-range coffee washing station was approximately USD 200,000. The data on the initial capital cost, operating costs, and other important characteristics of a prototypical washing station were obtained from a past feasibility study commissioned by the Agribusiness Development Assistance to Rwanda (ADAR) [6]. Investment costs values were adjusted to the price level of 2022. The information on the investment and operating costs of a typical coffee washing station were further corroborated in 2023 through interviews with the owners of washing stations in Rwanda. The detailed breakdown of our estimates of these costs is reported in the Appendix A Table A1.
When it comes to fixed costs, a distinction is made between seasonal and non-seasonal fixed costs. Seasonal fixed costs are made up of costs that occur only during the operating season and they do not fluctuate according to the volume of coffee processed during that season. Those costs include the permanent staff the coffee washing station employs, other examples of seasonal fixed costs are commonly incurred expenses such as offices supplies. The sole non-seasonal fixed cost is the initial capital investment cost.
Seasonal variable costs, on the other hand, are costs that are incurred solely during the coffee harvest season and those vary in proportion to the volume of cherry coffee that the coffee washing station processes. Examples of seasonal variable costs are the workers that the station employs only during the harvest season. These workers are paid a wage for each day of work. The bulk of the employment of labor is of this type. Other examples of seasonal variable costs include transportation costs, fuel, and jute bags etc. The list of variable and fixed costs is reported in the Appendix A Table A2, Table A3 and Table A4.
For the purpose of our analysis, four scales of annual production of parchment coffee by a coffee washing station are chosen, namely: 25 tons, 50 tons, 100 tons, and 200 tons. Fixed costs are the same for each of these levels of production given that most CWS were built with a capacity to produce 200 tons or more parchment coffee per season, even though their actual output is much lower [28]. Since the current number of CWS stands at 300, the average annual production volume of a coffee washing station in Rwanda is approximately 50 tons of parchment coffee. However, the range of production varies, with many CWS operating below this average level and producing as little as 25 tons per year, while other CWS are producing substantially larger volume of parchment coffee.
This paper makes a comparison between the total annual costs of producing parchment coffee or fully washed coffee in Rwanda when the average level of production of CWS ranges from 25 tons to 200 tons of parchment coffee per year. The lower the processing cost of parchment coffee at a coffee washing station, the greater is the financial surplus available for other participants in the sector. If every coffee washing station produces a larger volume of specialty coffee, then the number of stations required to process the entire crop of Rwandan cherry coffee would correspondently be lower. The main determinants of the quantity of parchment coffee that can be produced by a typical coffee washing station are, first and foremost, the amount of financing that the CWS owner is able to obtain for the purchase of the required volume of cherry coffee from farmers within its zone. Secondly, the number of laborers employed to process the cherries at the station.

3.1.2. Total Seasonal Variable Costs

For the sake of simplicity, we divided our seasonal variable costs into three categories: seasonal labor, transportation, and other variable costs. The total seasonal financial variable cost of a coffee washing station for a single year is represented by the variable T V Q ~ J . t ^ F , where the superscript F refers to financial costs as opposed to economic costs, and it is computed using (1).
T V Q ~ J . t ^ F = [ ( n Q ~ t × D o p × D l a b ^ q ~ F ) + ( Q ~ t × 1000 × c t r a n s ^ q ~ F + T Q ~ t ) F o t h ^
where Q ~ t denotes the total output of parchment coffee produced in tons by a coffee washing station during a season. n Q ~ t is the number of seasonal workers the station needs to employ in a season. n Q ~ t is a positive function of the total volume processed. D o p represents the number of working days during the season. Seasonal staff typically work 26 days each month during the 3 months of the season, for a total of 78 days. D l a b ^ q ~ is the daily wage rate of seasonal labor. The transportation cost per kg of parchment produced is denoted by c t r a n s ^ q ~ F . T ( Q ~ t ) F o t h ^ is the total sum of other variable costs that the coffee washing station incurs during a season. Lastly, one ton is equivalent to 1000 kg. Appendix A Table A5 contains the definitions of all the symbols used in the article.

3.1.3. The Total Seasonal Fixed Cost

The seasonal fixed cost is the sum of seasonal fixed labor and other fixed costs incurred during a season. The total seasonal financial fixed cost of a coffee washing station is represented by the variable T F C f . t ¯ F and it is given by Equation (2)
T F C f . t ¯ F = n t × T M t h s × w i F + F C o . t ¯ F
where n t represents the number of workers that must be employed for a period of T M t h s months during a year. Given the critical nature of their work, some staff members would have to be employed throughout the whole year (such as the station manager), others would be employed for a shorter period of time, but the minimum of months those workers are employed is three months. These permanent workers are paid a monthly wage of w i F ,   where the wage amount differs depending on the position held by the employee. F C o . t ¯ F represents the sum of other fixed seasonal costs incurred by the CWS. The details of the seasonal fixed inputs for these four different scales of CWS are presented in Appendix A Table A4.

3.1.4. Working Capital

Working capital funding is a critical component of the success of a coffee washing station during the coffee season. Before the beginning of each harvest season, the coffee washing station decides on the volume of parchment coffee it wishes to produce over the season. This volume is determined by the size of the export contracts that the coffee washing station has concluded with its customers overseas. The coffee washing station would consequently seek financing enough to cover, not only the purchase of the cherry coffee, but also to cover the entirety of its operating expenses for the season. Those costs include labor costs, both variable and fixed, as well as other operating expenses. The failure to obtain an export contract and financing would most likely result in the station not being able to purchase cherry coffee from farmers and hence not being able to operate independently from other producers.
The amount of working capital to be financed is found using Equation (3) and is represented by the variable W C p . t . Where C Q ~ F is the total cost of cherry coffee purchased per season. The production of a kg of parchment coffee requires approximately 5 kg of cherry coffee as inputs.
W C p . t =   C Q ~ F + T V Q ~ J . t ^ F +   T F C f . t ¯ F
The price of a kg of cherry coffee in 2022 was fixed by the government at 410 RwF per kg. This capped cherry price has followed a slow progression in nominal prices over the years. It moved from 145 RwF per kg in 2010 to 248 RwF in 2021. The most substantial increase in the cherry price occurred only recently, in the year 2022, when it jumped to the current price of 410 RwF per kg. CWS are prohibited from offering higher prices than this stipulated price and violating this rule constitutes a punishable offence. Hence, all the CWS are in theory paying the same price per kg of cherries, the only difference occurs in terms of the volume of cherries they purchase from farmers. Only a handful of large companies operating many CWS across Rwanda have the ability to self-finance or borrow internationally to finance their operations. Access to finance by CWS from local financial institutions is an arduous process as most CWS are perceived as risky [12].
Table 1 shows an estimation of the seasonal amount of working capital that a typical coffee washing station would require for the four chosen production scales of parchment coffee. The results in row 2 and row 3 of Table 1 are computed using Equation (1) while row 4 was found using (2). Row 5 is found using Equation (3). From the results in Table 1 row 5, we observe that the amount of working capital to be financed is a function of the volume of the cherries purchased, the mandated cherry price per kilo, and the number of staff employed and their respective salaries. Any change in these variables would result in either an increase or decrease in the amount of working capital required for the season. As the volume of cherries purchased increases, the working capital requirements will also increase.
As reported in row 1 and illustrated by Figure 1, we observe that, for a coffee washing station, the most substantial and crucial determinant of the size of the working capital is the total cost of purchasing cherry coffee. From row 5 of Table 1, we notice, for example, that a coffee washing station producing 200 tons would require a seasonal working capital that is twice the value of the initial capital investment in the facility. This gives a glimpse of the critical importance of the working capital for a coffee washing station.
This working capital can be financed either via loans or by equity. Given that CWS are relatively small firms, we assume that the cost of financing, whether debt or equity, is a required real rate of return of 13%. We are thus able to capture the cost of financing in the estimation of the net present values of the investment and operation of the CWS by applying a 13% discount rate to the net cash flows. In the construction of the net cash flows, sales receipts of the outputs occur one period after the expenditures on the purchase of cherries and the operating costs are incurred. The inflows of cash begin two periods after the initial investment in the facility is made. Lastly, the annual costs of financing of both fixed investment and working capital are assumed to have an opportunity cost of 13% a year.

3.1.5. The Total Operating Cost

The total financial operating cost of processing Q ~ t   tons of parchment coffee per season   T C o p . t ^ F is given by the sum of the seasonal variable costs, T V Q ~ J . t ^ F , excluding the cost of cherries, and the seasonal fixed costs, T F C f ¯ , F as shown in Equation (4)
T C o p . t ^ F =   T V Q ~ J . t ^ F + T F C f . t ¯ F

3.1.6. Present Value of Costs

Equations (1)–(4) are used to compute the total costs that a coffee washing station incurs just over a single season, which is a limited time frame to gauge the worthiness of an investment in a coffee washing station. In order to have measure the suitability of an investment in the long run, we need to use a holistic metric such as the present value (PV). The PV provides a measure of the discounted aggregate costs that the coffee washing station will incur over the course of its entire operating life. Our analysis assumes that the CWS is operational for a period of 10 years, excluding the first year during which the construction of the plant occurs. We use a real financial discount rate (r) of 13%. The discount rate represents the minimum rate of return that an investor would want to obtain as compensation for taking the risk of investing in a coffee washing station. Given the riskiness of this type of business, we posit that this rate would be appropriate to attract investors. Equation (5) describes the PV of the total volume of parchment coffee in kg produced by a coffee washing station over a period of 10 years.
P V ( Q ~ t ) F = t = 0 T = 11 Q ~ t × 1000 1 + r t  

3.1.7. The PV of Total Processing Cost of Parchment Coffee

Equation (6) shows the formula for the PV of the total financial cost of processing parchment coffee at a coffee washing station over a period of 10 years. Since there is only one coffee season per year in Rwanda, the number of operating years thus corresponds exactly to the discounting period. The PV of the total financial cost of processing parchment is represented by the variable P V T C q ~ F ,   which comes from the summation of the PV for seasonal variable costs T V Q ~ J . t ^ , the PV of seasonal fixed cost T F C f . t ¯ F , and lastly the PV of the initial investment cost I k ¯ t .
P V T C q ~ F = t = 0 T = 10 T V Q ~ J . t ^ F + T F C f . t ¯ F + I k ¯ t 1 + r t
Table 2 contains the present value of the total volume of parchment coffee and the present value of each component of the total costs of processing parchment coffee for the four chosen production scales of parchment coffee. These costs (capital investment in year zero and operating costs from year 1 to 10) occur over a period of 11 years and are expressed in 2022 prices. While Table 2 shows the present value of the total costs of processing parchment coffee, the results in Table 4, on the other hand, are the average costs of processing a kg of parchment coffee. We obtained the results of Table 2 by applying Equations (5) and (6). In row 1 of Table 2, we report the PV of the total volume of parchment coffee produced in kg. Those are obtained by applying Equation (5).
From the results of the PV of total seasonal processing costs (Table 2, row 6), we observe that there are substantial economies of scale between a coffee washing station producing 50 tons of parchment coffee and a coffee washing station producing 200 tons. For example, the PV of total seasonal processing costs for a 200 tons station is USD 315,919 while the total seasonal processing costs of a 50 tons level of operation is USD 201,943. While the total production of the 200 ton coffee washing station is 4 times larger than the production of the 50 ton coffee washing station, its total seasonal cost, on the other hand, is only 56.44% higher than that of the 50 ton coffee washing station.
When fixed costs are included (Table 2 row 8), we find that the present value of total processing costs over 10 years for the larger station (200 tons) is USD 515,953. This amount is only greater by a factor of 1.28 than USD 401,977, which is the PV of total processing costs for the station processing 50 tons. A coffee washing station processing 200 tons then incurs total costs that are only 1.28 times bigger while producing a quadruple volume of parchment coffee.

3.1.8. The Financial Net Present Value of an Investment in a CWS

We now turn to examining the overall profitability of the operations of a coffee washing station as measured by the financial net present value (NPV) and the internal rate of return (IRR) of an investment in a generic coffee washing station.
The NPV of a coffee washing station is obtained by deducting from the present values of parchment coffee sale revenues the present values of the total cost incurred over a period of 10 years, including the initial investment cost. We compute the NPV under the four production scales of parchment using Equation (7), where P i F is the per kg net export price of parchment coffee sold internationally.
N P V q ~ F = t = 0 T = 10 P i F × Q ~ t × 1000 T C o p . t ^ F I k ¯ t 1 + r t
The NPV results are reported in Table 3. In the computation of the NPV for these different production scales of a coffee washing station, an average export price FOB of USD 6 per kg was applied. USD 6/kg was the average gross export price of coffee obtained by Rwanda during the 2021–2022 fiscal year according to [10]. This price may be a rather conservative assumption, as it is pointed out by [29] that, as far back as 2008, there were some specialty coffee lots that could be sold at USD 8/kg. From our discussions with coffee washing station operators, we gleaned that it was possible for them to obtain higher prices than USD 6 per kg, depending on the nature of contract they obtained from their overseas customers. An estimated average export cost of USD 0.5 per kg reduces the net export price   P i F obtained by the CWS for parchment coffee to USD 5.5 per kg.
The previous results reveal that, even if a washing station could only produce 25 tons of parchment coffee per year, it would still be able to realize a positive financial NPV of USD 24,981 over its 10-year lifetime (row 4 Table 3). The positive NPV and the internal rate of return of 14.80% obtained under a production level of 25 tons are consistent with field observations. In fact, several CWS in Rwanda operate at a capacity of only 25 tons of parchment per year [12]. As the level of parchment outputs increases, we observe that the NPV rises to USD 398,764 for a production of 50 tons and finally reaches USD 2,687,016 for an output level of 200 tons per season.
Those positive NPV results indicate that, under the current operating regulations, an investment in a coffee washing station is potentially a very lucrative endeavor. However, this profitability is contingent on three important conditions: Firstly, the CWS must be able to secure financing to cover its working capital needs prior to the beginning of the harvest season. Secondly, the station must be able to find within its zone enough cherries to cover its operating needs. Finally, the coffee washing station must have secured a contract with one or many oversea customers for the purchase of its parchment coffee. In the event the contract is not secured in a timely manner or not at all, then the owner of the coffee washing station would be forced to sell its output domestically to another exporter for a much lower per kg price.

3.1.9. Average Variable and Long-Run Costs

The PV of processing costs and the PV of the outputs of parchment produced as reported in Table 2 will be used to compute the average short-run costs and average long-run costs per kg of parchment coffee. We will maintain the same four assumptions in terms of production scales as previously used. In our analysis, the term short-run average cost is used to refer to the seasonal cost of processing a kg of parchment. This short-run average cost excludes from its computation the initial investment cost needed to open a coffee washing station. Those average total seasonal costs per kg of parchment are found in row 5 of Table 4.
Table 4. Financial average short-run and long-run unit processing costs in USD per kg of parchment coffee.
RowAverage Short-Run and Long-Run Unit Processing Costs25 Tons50 Tons100 Tons200 Tons
1Average seasonal variable labor production costs per kg0.400.280.180.15
2Average transportation costs and others costs per kg0.060.060.060.06
3Average seasonal variable costs per kg0.450.340.240.20
4Average seasonal fixed labor costs and others per kg1.010.500.250.13
5Average total seasonal costs per kg (r3 + r4)1.460.840.490.33
6Average total investment costs per kg1.670.830.420.21
7Average total cost of processing/kg of parchment (r7 + r8)3.131.670.910.54
The long-term total cost, on the other hand, takes into account the initial investment cost as reported in row 8 of Table 2. Therefore, the average total financial cost of processing a kg of parchment coffee must likewise include the average initial investment cost of processing a kg of parchment. The long-run perspective is that of an investor who is considering making the initial investment in order to enter the coffee washing station sector. However, short-run costs are the relevant costs when making the day-to-day operating decisions during the season. After the coffee washing station has made the initial investment (which represents a sunk cost), then it would normally continue operating its existing plant as long as the price of parchment coffee is at least equal to its average seasonal variable cost per kg of parchment.
The results in Table 4 from row 1 to row 7 report the various average costs per kg of parchment coffee produced by a coffee washing station. They are obtained by dividing the PV of the total costs of each cost subcategory (Table 2, row 2 to 8) by the PV of the total volume of parchment produced from row 1 of Table 2. Row 5 of Table 4 reports the estimated average total seasonal costs of processing a kg of parchment coffee by a station. Those costs also include the financing costs of cherries which are purchased at 410 RwF/kg.
The seasonal processing cost is a gauge of the cost efficiency of the coffee washing station during a season. As shown in row 5 of Table 4, the average total seasonal cost falls from USD 1.46/kg when we assume a production scale of 25 tons, to USD 0.33/kg when the coffee washing station processes 200 tons of parchment coffee. We note that, as the production scale of the coffee washing station increases, the average seasonal processing cost decreases.
The per kg seasonal processing cost is a key parameter in determining the size of the financial incentives a coffee washing station owner faces to expand production within a season given the purchasing price of cherry coffee and the selling price of parchment coffee. In a competitive situation where the coffee washing station owner could purchase cherry coffee outside of its designated zone, it would naturally be expected that transportation costs would increase and perhaps the price of cherries would be bid up. In such a scenario, the marginal costs and average variable costs (including the purchasing costs of cherry input) would be expected to eventually increase as the production scale of the coffee washing station has increased.
The average fixed investment cost reported in row 6 of Table 4 includes a real rate of return to the investor of 13%. It is estimated as the ratio of the initial investment costs divided by the present value of the quantity of parchment produced over the lifetime of the coffee washing station. When the average fixed cost of the initial investment reported in row 6 is added to seasonal costs of row 5 of Table 4, one obtains the estimated long-run average total financial cost of processing a kg of parchment coffee at the coffee washing station. Those costs are found in row 7 of Table 4.
From Table 4 row 7, for a coffee washing station that produces only 25 tons of parchment coffee, the long-run average total cost is USD 3.13 per kg. If a coffee washing station produces 50 tons of parchment coffee each season, its average total cost falls to USD 1.67 per kg of parchment coffee produced. When the coffee washing station produces 100 tons of parchment coffee, its long-run average total cost per kg further declines to USD 0.91 per kg and is reduced further to USD 0.54 per kg when the coffee washing station achieves a production level of 200 tons. The fall in the average total processing cost arises because both the average fixed capital cost as well as the average fixed seasonal cost both decrease as the volume of parchment coffee produced by a coffee washing station increases. There are also some economies of scale with respect to the seasonal variable costs.

3.1.10. Producer Surplus and Profit Margins with Regulated Cherry Prices

The short-run and long-run average costs computed in Table 4 can now be used to evaluate the producer surplus and profit margins when the net export price of parchment coffee is set at 5.50 USD per kg. Table 5 row 6 shows the profit margins per kg that a typical coffee washing station would achieve under the respective production scales. In these calculations, the current price of cherries of 410 RwF/kg is used. We notice that, when the station processes 25 tons of parchment coffee, it enjoys a net profit of USD 0.46 per kg. If, on the other hand, the coffee washing station achieves a production volume of 100 tons, then the profit margin climbs to 2.69 USD per kg, finally, its profit per kg soars to 3.05 kg if the coffee washing station can produce 200 tons of parchment coffee per season. Those significant profit margins unveil one of the reasons why investments in CWS were attractive to investors and why there has been a surge of investments in CWS in Rwanda since 2002. However, the results also attest to the fact that the ability to purchase larger volumes of cherry coffee from farmers is of critical importance to a coffee washing station owner.
When one considers the situation where a coffee washing station owner has already made an investment in a coffee washing station, then the short-run surplus to be gained from obtaining additional cherries is even greater. Table 5, row 4 reports the margins or contribution to producer surplus. For the existing owners of CWS who are operating below their capacity, the incentive for them to purchase cherries at a higher price is much greater than it would be for someone who is contemplating investing in a new coffee washing station. The margin of producer surplus per kg of additional parchment production starts at USD 2.12/kg for a coffee washing station now producing 25 tons per season to USD 2.74/kg, USD 3.09/kg, and USD 3.25/kg for CWS producing 50, 100, and 200 tons of parchment coffee per season, respectively.
If the industry were allowed to operate and to purchase cherry coffee competitively, then these very large margins would result in the individual coffee washing station being willing to pay higher prices for cherries with the goal of expanding their production. As a tree crop, the supply response of cherry supply is smaller to the short-run increases in its price. Without the zoning policy, the competition for cherries would likely be more intense. It would be expected that only those firms that are financially secure enough to obtain financing for their working capital would remain in business over time.

3.1.11. Equilibrium Cherry Prices in a Competitive Industry

The next step in our analysis involves estimating what would be the price of cherries if it were increased to the point where the industry would just earn a rate of return sufficient to attract investors into the coffee washing station sector. In other words, what should the cherry coffee price be in order for each coffee washing station in the industry to make a zero economic profit. We refer to this price as the break-even price of cherry coffee. For the purpose of this estimation, we are assuming that a 13% real rate of return would be sufficient to attract investors into the coffee washing station sector.
This analysis will be carried out under two sets of scenarios: Firstly, under the long-run case, where the equilibrium price of cherries is estimated for various net selling prices per kg of parchment coffee ranging from USD 5 to USD 7. This analysis is characteristic of a situation where firms are making investments to enter the sector and, at the same time, the supply of inputs, which is cherry coffee in our case, is inelastic. The second scenario deals with the short-term situation where a surplus of processing capacity has been made in CWS. In this case, it is assumed that the current investment in the coffee washing stations is a sunk cost. Furthermore, it was assumed that the supply of cherries in the short run is inelastic. In each of these two cases the analysis is carried out under the same production scales of parchment as previously employed.
In order to find the break-even price of cherry coffee in (RwF/kg) as shown in Table 6 and Table 7, one first needs to determine the per kg margin available to the coffee washing station for the purchase of cherries under these respective time horizons. The margin per kg is the amount of money that a coffee washing station would have left at its disposal for the purchase of each kg of cherries after covering the entirety of its costs, except for the cost of purchasing cherries. The margin available for the purchase of cherries in the long run M L B ~ is found using Equation (8), where a p M B ~ denotes the average total seasonal costs per kg found in row 5 of Table 4 (excluding the financing costs associated with the purchase of cherries). The long-run margin is further reduced by deducting the average per kg fixed investment costs denoted by   a p I k ¯ t as reported in row 6 of Table 4.
M L B ~ = P i F a p M B ~   a p I k ¯ t
The margin available for the purchase of cherries in the short run M S B ~ treats the initial investment cost in a coffee washing station as a sunk cost, it is thus estimated using Equation (9),
M S B ~ = P i F a p M B ~    
Given the margins available for cherry purchase, the maximum price   P L B ~ that could be paid for each kg of cherries in the long-run analysis is given by Equation (10). This is the maximum price of cherry coffee that the CWS could potentially offer to farmers. P L B ~ is estimated under the assumption that the export price of parchment coffee P i F ranges from USD 5/kg to USD 7/kg. E x ~   is the exchange rate between RWF and the USD. The variable q   ̿ is the number of kg of cherry coffee needed to obtain a kg of parchment coffee.
P L B ~ = M L B ~ q   ̿ × E x ~
The estimates of the competitive prices of cherries that could potentially be paid to farmers in the long run are presented in Table 6. Those results still involve cases where the industry was characterized by firms having an average production of 25, 50, 100, and 200 tons of parchment coffee and facing average long-run net export prices ranging from USD 5.00 to USD 7.00.
The analysis is carried out still under the assumption that the operational life of a generic coffee washing station is 10 years. At each of the sets of parchment export prices in Table 6, the prices per kg of cherry coffee that are obtained are those that would cause the CWS to just break even. In such a case, the coffee washing station would achieve a zero economic profit each year and subsequently an NPV of zero over its entire lifetime. However, at each of these sets of parchment and cherry prices, the owner of the CWS is earning a competitive real rate of return on its investment of 13 percent.
Currently, in Rwanda, the average annual production of a coffee washing station is 50 tons/year and the average net output price during the last coffee season was USD 5.50/kg. At an output price of USD 5.50/kg, a coffee washing station producing 50 tons could potentially pay up to 820 RwF/kg (Table 6, row 2) for cherry coffee. This price is double the prevailing regulated cherry coffee price set at 410 RwF/kg by the government.
If the industry were operating efficiently, with all CWS operating with an annual production of 200 tons/year or more, then the long-run equilibrium price of cherries earned by the farmers could be as high as 1061 RwF/kg (row 2, last column of Table 6). A price of 1061 RwF/kg is 158.78% higher than the current regulated price of 410 RwF/kg. The long-run effects of the combination of coffee zoning policy and a regulated price of cherries have clearly resulted in the creation of an inefficient industry with overinvestment in CWS. In addition, those two policies have not provided sufficient incentives to Rwandan farmers to replant their coffee trees and expand production.
In order to find the maximum per kg price that a coffee washing station owner would be willing pay for cherry coffee during a given season, we need to compare the short-run average cost with the selling price of parchment. In the short run, the capital investments in the CWS can be considered a sunk cost. The per kg price of cherry that would result in a zero profit, is found by replacing the numerator of Equation (10) with M S B ~ . The maximum cherry prices in the short run are presented in Table 7. In a short-run scenario, the CWS would be willing to pay a price for cherry up to the point where the marginal producer surplus is zero. When the output price is USD 5.50/kg, the reported maximum price a coffee washing station processing 50 tons of parchment would be willing to pay is 997 RwF/kg. This price for a kg of cherries is 143.2% greater than the prevailing price of 410 RwF/kg being paid to farmers. For a coffee washing station operator who wishes to get its production to a level of 200 tons/year, they would be willing to pay up to 1106 RwF/kg for cherries, or a price that is 169.8%, above the current regulated cherry price.
From the previous analysis, it is clear why it is important for owners of CWS to seek expansion of their production volume of parchment coffee by purchasing additional quantity of cherry coffee. With the government mandated cherry price of 410 RwF/kg, there is a high incentive to engage in the illicit purchase of cherry coffee by offering higher per kg prices despite the threats of punishment from authorities. Some unofficial reports indicate there have been instances where some CWS offered prices as high as 800 RwF/kg to farmers, despite the threat of sanction from authorities. It should also not be a surprise then that the government has been forced to abandon its zoning policy restricting the aera in which individual CWS can legally buy cherry coffee.

3.1.12. Lost to Farmers as a Result of Government Pricing Policy and Excess Investment in CWS

According to the latest figures from the national agriculture export board of Rwanda annual report (2021–2022) [10,30,31], the country exported around 15,000 tons of fully washed coffee in 2022. Coffee exports from Rwanda usually oscillate between 18,000 tons to 23,000 tons per year. We will therefore use the figure of 15,000 tons or 15 million kg of parchment as the production benchmark level for Rwanda used to evaluate the cost of the inefficiencies of the coffee washing station sector in the country. The difference between the government-imposed price of 410 RwF per kg and the long-run break-even price of row 2 of Table 6 represents the average loss incurred by farmers for every kilo of parchment processed at the CWS. These are the losses imposed on the farmers from the cherry pricing and regulatory zoning policy designed by the government for this sector. In Table 8, estimates of these annual losses are presented for the case where with an annual quantity of exports of processed coffee exported of 15,000 tons, and the average long-run price of parchment coffee is USD 5.50/kg.
Table 8 row 1 and column 3 reports that, in order for an investor in a coffee washing station producing 50 tons of parchment coffee a year to earn a real rate of return of 13 percent, the breakeven price for cherry coffee should be set at 820 RwF/kg. This implies that farmers are potentially losing 410 RwF/kg of cherry coffee they sell to CWS (Table 8 row 3). Taking into account the fact that 15,000 tons of parchment coffee are exported, the financial loss to the Rwandan coffee farmers is estimated at 30.75 billion RwF or USD 28,738,318 per year. This is the financial loss resulting from the restriction on the selling price of cherry. This is essentially the amount of income that is being transferred from the farmers to the owners of the CWS over and above the amount received by the coffee washing station owners to compensate them for the higher costs they incur due to the inefficient investments and operating costs of the CWS.
From Table 8 row 5 column 5, we observe that, if the coffee industry had been more efficient, with only 25% as many CWS built and each producing on average 200 tons of parchment coffee per year, then the annual loss to the coffee growers would have been USD 45,630,841. The difference between the annual loss of USD 45,630,841 and USD 28,738,318 or USD 16,892,523 is the excess financial costs created by the greater investment and operating costs incurred by the owners and operators of CWS because of excess number of CWS that has emerged as a response to the policy framework.
This analysis is being carried out in a static framework where the amount of parchment coffee exported is fixed at 15,000 tons/year. A major current problem with the sector is the fact that, with the existing price structure, farmers have been unwilling to invest in replanting and expanding their coffee trees [14,15,32,33]. There is little doubt that, by receiving much higher prices, farmers would be much more inclined to make the necessary investments in the rejuvenation and expansion of their coffee plantations.

3.2. Economic Analysis

The financial analysis estimates how much it costs private owners of a washing station to produce parchment coffee. It focuses on profitability of a project from the viewpoint of private investors and bankers. An economic analysis, on the other hand, focuses on whether a particular project will have a positive or negative impact on the entire society. The economics analysis is based on economic costs rather than financial ones. When a project has a positive economics NPV, the project is deemed to have been beneficial to the society in which it was implemented. We proceed by repeating the same equations we previously used, however, this time, we use economic prices and economic costs instead of financial ones. Economic prices and costs are obtained by multiplying the financial values by commodity specific economic conversion factors [34] that correct the financial prices for market distortions such as tax, import duties, subsidies, and foreign exchange premiums.
The divergences between the economic analysis and the financial evaluation are referred to as externalities. Externalities can be either positive or negative. The economic analysis uses as discount rate an economic opportunity cost of capital ( E O C K ) of 13%. This EOCK is the discount rate recommended by the Government of Rwanda to conduct an economic appraisal for projects in Rwanda [34,35]. Equation (11) describes the calculation of the present value of the quantity of parchment coffee in kg produced by CWS over a period of 10 years.
P V Q ~ t E = t = 0 T = 11 ( Q ~ t × 1000 ) 1 + E O C K t
The total economic variable costs for a season T V Q ~ J . t ^ E are given by Equation (12)
T V Q ~ J . t ^ E     = [ ( n Q ~ t × D o p × D l a b ^ q ~ E ) + ( Q ~ t × 1000 × c t r a n s ^ q ~ E   + T Q ~ t ) E o t h ^
where the variables of the right-hand side of Equations (12) and (13) have the same interpretation as in the financial analysis case. The Total Economic Seasonal Fixed Cost ( T F C f . t ¯ E ) is given by:
T F C f . t ¯ E = n t × T M t h s × w i E + F C o . t ¯ E

3.2.1. The Economic Present Values of Total Costs of Processing Parchment

The present value of the total economic costs of processing parchment coffee is the sum of the economic PV of Seasonal Variable Costs T V Q ~ J . t ^ E , the economic PV of total seasonal fixed cost T F C f . t ¯ E , and the initial investment cost I k . t ¯ E . The total economic cost of processing is expressed by Equation (14).
P V T C q ~ E = t = 0 T = 10 T V Q ~ J . t ^ E + T F C f . t ¯ E + I k . t ¯ E 1 + E O C K t
The average economic cost of processing a kg a p c q ~ E of parchment coffee is given by (15). It is the ratio of the PV of Total Economic Processing Costs of parchment coffee   P V T C q ~ E to the PV of the total volume of parchment P V Q ~ t E .
a p c q ~ E = P V T C q ~ E P V Q ~ t E
The results from the economic analysis for the present values of costs and outputs at a coffee washing station are reported in the Table 9 for the four scales of parchment production volumes.
Table 9, row 9 shows the estimated average long-run total economic costs required to process 1 kg of parchment coffee at washing stations under the same four assumed processing scales. These long-run average economic costs are estimated by taking the ratio of the values of the PV of total economic costs found in row 8 of Table 9, to the PVs of quantities produced over the lifetime of the CWS as reported in row 1 of Table 9.
We note that, when a washing station produces 50 tons of parchment coffee annually, then the long-run average economic cost per kg of parchment to Rwanda is USD 1.51 per kg. Similarly, the total the long-run average economic cost of a CWS processing 100 of parchment coffee a year is USD 0.82 per kg. Finally, the long-run average economic cost per kg falls to USD 0.49 per kg when the coffee washing station achieves an annual production level of 200 tons of parchment coffee. As was the case for the financial analysis, we observe that, as the volume of parchments processed increases, the cost per unit decreases.
The long-run average total economic costs are lower than financial costs for all four production levels. The financial costs were USD 3.11/kg, USD 1.73/kg, USD 1.01, and USD 0.69/kg, respectively, for production levels of 25 tons, 50 tons, 100 tons, and 200 tons. This downward adjustment of the financial costs to their economic value arises primarily because there are several taxes on such items as fuel that are included in the financial costs but are not counted as economic costs.

3.2.2. Estimation of Economic Loss to Rwanda from Excess Capacity of Coffee Washing Stations

The following analysis estimates the economic loss to Rwanda. We will compare the total economic costs borne by the current number of CWS in Rwanda which stands at 300 to what would the total economic costs have been if the number of CWS were reduced respectively to 150 CWS and 75 CWS. The difference between the total cost currently incurred by the 300 CWS during a season and the total economic costs borne by 150 CWS producing on average 100 tons and 75 CWS producing on average 200 tons per year represents the losses Rwanda suffers during a coffee season as a result of overinvestments in the coffee washing station sector.

Rwanda’s Potential Yearly Economic Costs Saving

In Table 9, we found that the average total long-run average economic cost of producing parchment coffee by a coffee washing station processing 50 tons a year ( a p c 50 t ~ E ) is USD 1.51/kg. When we take into account the country’s assumed annual production of parchment coffee as noted by Q ~ A G G , then the total annual production costs are estimated to be USD 19,987,109. On the other hand, for a coffee washing station producing 100 tons, the average total long-run economic cost of processing parchment coffee ( a p c 100 t ~ E ) is USD 0.82/kg. The total annual production costs estimated in this case would then be USD 10,869,885 and 150 CWS would be needed to maintain the country’s annual production volume of washed coffee. The amount of annual savings on economic costs that Rwanda would realize if the number of CWS were reduced from 300 CWS to 150 CWS is given by Equation (16)
Q ~ A G G × a p c 50 t ~ E a p c 100 t ~ E
Likewise, the annual saving on economic costs Rwanda would achieve if the number of CWS reduces from 300 CWS to 75 CWS is given by Equation (17).
Q ~ A G G × a p c 50 t ~ E a p c 200 t ~ E
while the amount of parchment coffee produced is assumed to be 15 million kg in a year, the value of Q ~ A G G used in the calculation of (16) and (17) is discounted by one year at 13% to be consistent with the way the average costs in both situations were estimated.
If the number of washing stations is greater than what would be optimal, it implies that the industry has wasted economic resources that could have been better employed elsewhere. From row 1 of Table 10, we observe that a reduction of the number of CWS by half would result in a total economic welfare saving estimated at USD 9,117,224 per year to Rwanda. This is a substantial amount which could potentially be used to offer higher prices to farmers for their cherry coffee instead of mandating a fixed price.
If the number of CWS were reduced further to 75 CWS, by having each producing on average 200 tons of parchment coffee/year, then the total economic resource savings as compared to the current situation would be estimated at USD 13,484,295 per year. From the results of Table 8, we found that the annual financial cost caused by the inefficiencies of overinvestment was USD 16,892,523. The difference between these two values is due to the fact that the economic costs resulting from the oversupply of CWS are slightly lower than financial costs. Economic costs are lower due to the fact that taxes are included in financial costs but are not incorporated in the computation of economic costs.

Total Economics Welfare Loss to Rwanda Due to the Oversupply of CWS

In order to evaluate the overall economic losses created by the excessive number of CWS, we need to compute these costs over the 10 year lifetime of a generic coffee washing station. In the current state of affairs, we have 300 CWS each processing parchment coffee at a present value of economics cost ( P V T C 300 ~ E ) of USD 361,516 (row 8 of Table 9). Over a period of 10 years, the total economic cost incurred by those 300 CWS amounts therefore to USD 108,454,800.
The estimated present values of the economic costs of processing are likewise also estimated for the case where all the parchment coffee would be produced by plants producing on average 100 tons per year and 200 tons per year. These estimates of PV of costs are reported in rows 1 to rows 3 of Table 11, column 2. The total economic welfare Rwanda could have saved if only 150 CWS were operating instead of 300 is given by Equation (18).
300 c w s × P V T C 300 ~ E 150 c w s × P V T C 150 ~ E
Similarly, the total economic welfare Rwanda could have saved if only 75 CWS were operating is given by Equation (19):
[ ( 300 c w s × P V T C 300 ~ E ) 75 c w s × P V T C 75 ~ E ) ]
The combined results of the welfare loss to Rwanda are presented in Table 11, column 2, rows 4 and 5.
These estimates indicate that Rwanda would have saved over USD 49,472,100 over a period of 10 years (Table 11 row 4 col 2) if only 150 CWS had been built instead of 300 CWS. Furthermore, if only 75 CWS had been built to produce annually the 15,000 tons of parchment coffee, then Rwanda could have saved up to approximately USD 73,168,950 over a 10-year period (Table 11, row 5 col 2). Those figures further substantiate the fact that the oversupply of CWS in Rwanda has come in at a large economic cost to the country.

3.2.3. Stakeholder Analysis of Policies Reforms

With the results of the financial analysis from Table 8 and the economic analysis reported in Table 10 and Table 11, one can assess the impacts that the policy of switching to the production of specialty coffee has had on the various affected stakeholders in the economy. In the next analysis, a comparison is carried out between the current situation where we have 300 washing stations producing 15,000 tons of parchment per year and a situation where there would be only 75 CWS with each producing on average 200 tons per year.
We report in Table 12 column 2 the annual economic losses and PV of economic losses over a period of 10 years caused by the excessive investment and operating costs in CWS to the overall Rwandan society. The annual losses to the economy are estimated at USD 13,484,295, cumulating to a PV of economic losses over 10 years of USD 73,168,950. When we break down those economic losses into their various components, it is evident that coffee farmers are the ones who are bearing the brunt of these inefficiencies. From column 3 of Table 12, we observe that farmers collectively suffer an annual financial loss estimated at USD 45,630,841 or a PV of financial losses of USD 247,604,053 over a 10 year period.
As a consequence of the increased investments and operating costs, the government is receiving more sale taxes and excise tax revenues than it would have otherwise received. As shown in Table 12, column 4, the amount the government receives annually is estimated at USD 3,408,228, which amounts to a PV over 10 years of USD 18,493,874. Finally, it is the owners of the existing CWS who are the main beneficiaries of the current policies, even if they are operating inefficiently. As shown in column 5 of Table 12, on an annual basis, coffee washing station owners have been gaining an annual basis an income of USD 28,738,318 in excess of the real rate of return of 13%. When this figure is evaluated as a PV over a period of 10 years, the amount of financial income (rents) gained by CWS is equal to USD 155,941,111.
The stakeholder analysis consists in investigating how the costs of inefficiencies found from all the previous computations are shared among the main actors of the coffee value chain. The stakeholder analysis reconciles the financial analysis with the economic outcomes. The loss to the economy is exactly equal to the sum of the stakeholder impacts on the affected groups in society. The loss to the farmers, less the gain to the government in taxes and the excess profits of the CWS, is exactly equal to the overall economic cost of this policy to the economy of Rwanda.
The results we obtained in this section allow us to draw a number of important observations: Firstly, producing specialty coffee is potentially a lucrative venture in Rwanda especially for CWS that are able to process a large volume of coffee, as demonstrated by the high NPV and IRR of Table 3 and the results in Table 5. Secondly, as demonstrated in Table 6, imposing a fixed per kg price of cherry coffee is detrimental to farmers. Under the current state of affairs, where each coffee washing station processes on average only 50 tons of parchment coffee, farmers could be paid double the prices they receive. If a reduction in the number of CWS could come about, then the farmers might be able to receive cherry prices that are 150% higher than the current ones. Lastly, as shown in Table 12, the combined effect of the fixed cherry prices policy, the oversupply of CWS, and the later adoption of the zoning policy has resulted in an annual loss to the farmers estimated at −USD 45,630,841 while the annual loss to the Rwandan economy sits at −USD 13,484,295. The CWS are the main beneficiaries of the regulatory framework in Rwanda since they realize an annual net income of +USD 28,738,318 above the real rate of return of 13%.

4. Discussion and Conclusions

Rwanda is facing serious threats to the long-term sustainability of its coffee industry stemming from two main factors: Firstly, a large proportion of its coffee plants are older than 30 years, consequently, their production yields are low and stagnant. There is therefore a pressing need for large scale investments in new coffee plants. Secondly, a large number of farmers are leaving coffee farming for other crops that are deemed more profitable due to the low revenues they obtain from the sale of their harvest to CWS. The shift from ordinary coffee to specialty coffee was initially a sound decision from an economic perspective and it has overall been beneficial to Rwanda. The country has unarguably reaped a lot of benefits from the production of specialty coffee. Nowadays, Rwanda has become an important player in the specialty coffee niche and coffee is one Rwanda’s main sources of foreign exchange.
On the flip side, however, once Rwanda opted to produce specialty coffee, there was a rush to build a large number washing stations throughout the country, largely spurred by the eagerness of international donors and the Government to support the nascent niche with easy financing and technical assistance. As the number of washing stations continued to increase, a large share of them also went out of business either due to their inability to survive the stiff competition and/or to fund their activities.
To tackle this growing issue, the Rwandese Government implemented a zoning policy in 2016 that was effective until June 2023. The zoning policy restricted the trade of cherry coffee within the confines of a specific geographic area, thereby guaranteeing to some extent the availability of cherry coffee to washing stations within that zone. The government also maintained the long-standing policy of setting a fixed per kg price for cherry coffee at the beginning of each harvest season. The consolidated effect of the oversupply of CWS, the zoning policy, and the fixed per kg cherry coffee price gave rise to substantial inefficiencies. Coffee farmers are left bearing the brunt of the costs from these inefficiencies as they are paid a lower price for cherries than what would be justified under existing or optimal market conditions. It is unfortunate that the same eagerness to promote and maintain an excessive number CWS was not extended to supporting farmers growing cherry coffee. The welfare of farmers has not been keeping pace with the rush to invest in CWS and farmers who are the weakest link of the value chain have benefited the least from the improvements in the value chain [36].
The policy of upgrading the quality of coffee is not sustainable if investments in coffee cherry production at farms level do not contend with investments made in the processing segment of the value chain. The analysis presented in this paper indicates that, if the number of CWS were shrunk from 300 to 75, then CWS would be willing to pay up to 1061 RWF/kg for cherry coffee, which is a price 150% higher than the current fixed price. Moreover, under a competitive system, even if the number of CWS remained at the current level of 300, CWS would likely be willing to pay farmers up to 820 RwF/kg instead of 410 RwF/kg. In other words, farmers could be paid double the current price for a kg of cherry coffee and the owners of washing stations would receive a real rate of return of 13%. The combined impact of the coffee price suppression, the oversupply of CWS, and the zoning policy leads to loss of income estimated at USD 45,630,841 per year to Rwandese coffee farmers. While CWS on the other hand, are earning an income estimated at USD 28,738,318 per annum above a real rate of return of 13%. The oversupply of CWS and the resulting cost inefficiencies amount to an annual loss to the Rwandan economy estimated at USD 13,484,295. If the profits that the CWS are making above the real rate of return of 13% were paid out to the farmers through higher cherry prices, there would be a powerful incentive for farmers to replant and upgrade their coffee trees and make other necessary investments in their plantations.
This article presents a good illustration of the unintended consequences that occur when governments want to prop up and protect one component of the value chain of a sector by adopting ill-designed policies that end up restricting competition. This situation more often than not is a detriment to the earnings of the primary producers. For a small economy such as Rwanda, the annual amounts of economic wastes are substantial. The welfare savings resulting from the improvement in efficiency of washing stations would be beneficial first and foremost to coffee farmers. Furthermore, if the prices of cherry coffee were allowed to rise, then farmers would have more of an incentive to remain in coffee farming. This would ultimately boost the coffee production volume of the country in the long run and allow the country to sustain its exports of specialty coffee and grow economically.
The government of Rwanda repealed the zoning policy in June 2023, thereby allowing CWS and farmers to trade without geographic restrictions. One caveat, however, is the fact that the Government is committed to continuing the policy of setting a fixed price for cherry coffee moving forward. Rescinding the zoning policies will not be enough to correct the inefficiencies of the coffee value chain. For the coffee value chain to expand, the farmers should be protected from the risk of sudden negative price shocks and should be assured of a minimum price for their cherry sales that should reflect the state of the world price of coffee for the period. As a minimum price, the actual price should be allowed to rise above that floor price if international market conditions warrant higher prices [37]. A regulated floor price for cherry should never be viewed as a ceiling price. The equilibrium price of a kg of cherry coffee price should be the result of market competition between CWS and bargaining between farmers and CWS.
There is a great need to have a set of policies that will promote the replanting of the coffee trees. This may take the form of subsidies for replanting, perhaps financed by a modest export tax on parchment coffee sold on the world market. By letting competition for cherries take place, this will likely result in farmers either officially or unofficially receiving higher prices and making the required investments in their plantations to increase their production of cherry coffee. It will take time for coffee washing station owners to optimize their segment of the coffee supply chain. However, over time, the market forces, if allowed to operate, will likely significantly improve the livelihood of coffee farmers in Rwanda.

Author Contributions

Conceptualization: G.P.J., L.M. and M.M.; methodology: L.M. and G.P.J.; formal analysis: L.M.; writing—original draft preparation: L.M. and G.P.J.; writing—review and editing: L.M., G.P.J. and M.M.; supervision: G.P.J. All authors have read and agreed to the published version of the manuscript.

Funding

This study was funded by Cambridge Resources International (CRI).

Institutional Review Board Statement

Not applicable.

Informed Consent Statement

Not applicable.

Data Availability Statement

The data used to build the financial and economic model on Excel will be made available to other researchers upon request to the corresponding author.

Acknowledgments

The authors wish to express their gratitude to Octave Semwaga, Daniel Komezusenge, and Noel Ujene who took the time to provide us with important insights and valuable information on the coffee value chain in Rwanda. Their comments greatly contributed to the production of this article.

Conflicts of Interest

Author Mikhail Miklyaev was employed by the company Cambridge Resources International Inc. The remaining authors declare that the research was conducted in the absence of any commercial or financial relationships that could be construed as a potential conflict of interest.

Appendix A

Table A1. Initial investment costs for a coffee washing station in Rwanda with a capacity of 200 tons of parchment coffee a season.
ItemsQuantityUnit Prices
USD
2022 Price Level
Total in
USD
2022 Price Level
Land Acquisition140004000
Capitalized Cost180008000
Coffee Pulper Machine169,395.369,395
Generator 10 KW120,00020,000
Moisture Meter110001000
Loading Scales1500500
Dial Scales270140
Drying tables and accessories8630025,800
Recycling Pumps2500010,000
Motorcycle150005000
Total Expenditures Land and Equip 143,835
Construction and Engineering 56,165
Total Initial Investment Cost 200,000
Table A2. Variable and fixed costs of a standard coffee washing station.
Seasonal Variable CostsSeasonal Fixed Costs
Cherry transportation cost—farm gate to the CWSPermanent Workers
Washed coffee transportation costStation manager
FuelAgronomist
Purchase of bagsProduction head
Loading and offloading feesMachine operator
Hulling costsQuality head
InsurancesCashier
ElectricityScale operator
Water costsAccountant and administrative head
Materials costsSecurity during the season
Seasonal WorkersSecurity for the rest of the year
Cherry selection-reception-floatationOperating Costs
Tank—fermentation—gradingOffice supplies
Drying teamCommunication expenses
Seasonal variable cost without financingPrinting expenses
Mechanic repair and maintenance
Spare parts
Interest on working capitalAdvertising
Lubricants and greases
Insurances
Table A3. Seasonal variable labor assumptions.
Permanent LaborEmployees
for a 200
Outputs Station
Employees
for a 100
Outputs Station
Employees
for a 50
Outputs Station
Daily Salary Rate in
Rwandan Francs 2022
Cherries Selection-Reception-Floatation6225000
Tank—Fermentation—Grading5225000
Drying Team6040305000
Table A4. Seasonal fixed labor assumptions based on a station producing 200 tons of parchment coffee.
Permanent Labor# of Employees# of MonthsMonthly Salary in
RwF 2022
Station manager112630,000
Agronomist112250,000
Production head15310,000
Machine operator13310,000
Quality head13190,000
Cashier13200,000
Scale Operator13190,000
Accountant and administrative head13310,000
Security during the season43180,000
Security for the rest of the year212180,000
Table A5. List of symbols used in equations.
ParametersDefinition
Financial Analysis
N P V q ~ F Financial net present value, as of year t = 0 (2022) for a production level of Q ~ metrics tons of parchment.
P i F Parchment coffee financial selling price per kg
Q ~ t Production scales in metrics tons of parchment (25 tons, 50 tons, 100 tons, 200 tons) at year t
P V T C q ~ F PV of total processing cost of parchment coffee for a production scale of q ~
T V Q ~ J . t ^ F Total financial variable cost of processing parchment for a season
rReal financial discount rate
r s The real interest rate on the working capital loan
T F C f . t ¯ F Total financial seasonal fixed cost of a CWS for a season
a p c q ~ F Average financial cost of processing a kg of parchment coffee for production scale of q ~
P C F Financial fixed price for 1 kg of cherry set by Government at the beginning of each season
W C p . t Working capital per season
c q F Average financial cherry cost per kg of parchment coffee produced
M B ~ The total margin in USD available to the CWS for the purchase of cherry
i b ~ The interest paid on the working capital excluding on in the interest paid on the cost of cherry purchase
q   ̿ The conversion ratio between cherry coffee and parchment coffee (It is set at 5 kg of cherry = 1 kg of parchment)
I k ¯ t Total financial initial capital cost for a washing station
Economic Analysis
EOCKEconomics opportunity cost of capital
N P V q ~ E Economics net present value, as of year t = 0 (2022)
P V T C q ~ E PV of total economic processing cost of parchment coffee
a p c q ~ E The average economic cost of processing a kg of parchment coffee
a p c 100 t ~ E The average total long-run economics cost of producing parchment coffee by a coffee washing station producing 100 tons
a p c 200 t ~ E The average total long-run economics cost of producing parchment coffee by a coffee washing station producing 200 tons
P i E Parchment coffee economic selling price per kg
T V Q ~ J . t ^ E Total economics variable cost
T F C f . t ¯ E Total economic seasonal fixed cost
P C E Economics floor price for 1 kg of cherry set by Government at the beginning of each season
P V T C 150 ~ PV of total economic cost of processing by 150 CWS each processing 100 tons on average
P V T C 300 ~ PV of total economic cost of processing by 300 CWS each processing 50 tons on average
I k . t ¯ E Total economic initial capital cost for a washing station

References

  1. Boudreaux, K. Economic Liberalization in Rwanda’s Coffee Sector: A Better Brew for Success. In Yes Africa Can: Success Stories from a Dynamic Continent; Chunan-Pole, P., Angwafo, M., Eds.; The World Bank: Washington, DC, USA, 2011. [Google Scholar]
  2. Bart, M.; Dereje, M.; Engida, E.; Tamru, S. Tracking the Quality Premium of Certified Coffee: Evidence from Ethiopia. World Dev. 2018, 101, 119–132. [Google Scholar] [CrossRef]
  3. Tamru, S.; Minten, B. Investing in Wet Mills and Washed Coffee in Ethiopia: Benefits and Constraints; ESSP Working Papers 121; International Food Policy Research Institute (IFPRI): Washington, DC, USA, 2018; Available online: https://ebrary.ifpri.org/digital/collection/p15738coll2/id/132772/rec/110 (accessed on 6 November 2023).
  4. Mbakop, L.; Jenkins, G.P.; Leung, L.; Sertoglu, K. Traceability, Value, and Trust in the Coffee Market: A Natural Experiment in Ethiopia. Agriculture 2023, 13, 368. [Google Scholar] [CrossRef]
  5. Minten, B.; Tamru, S.; Kuma, T.; Nyarko, Y. Structure and Performance of Ethiopia’s Coffee Export Sector; ESSP Working Papers 66; International Food Policy Research Institute (IFPRI): Washington, DC, USA, 2014; Available online: https://ebrary.ifpri.org/digital/collection/p15738coll2/id/128188/rec/176 (accessed on 6 November 2023).
  6. USAID. Assessing USAID’s Investments in Rwanda’s Coffee Sector, Best Practices and Lessons Learned to Consolidate Results and Expands Impacts. 2006. Available online: https://pdf.usaid.gov/pdf_docs/Pnadt522.pdf (accessed on 5 July 2023).
  7. USAID. Rwanda Bank of Kigali DCA Guarantee. 2009. Available online: https://2012-2017.usaid.gov/sites/default/files/documents/2155/DCA_Rwanda_Report_6_23_10.pdf (accessed on 5 July 2023).
  8. Easterly, W.; Reshef, A. African Export Successes: Surprises, Stylized Facts and Explanations. NBER Working Paper No. 16597. 2010. Available online: https://www.nber.org/system/files/working_papers/w16597/w16597.pdf (accessed on 6 November 2023).
  9. National Agricultural Export Development Board. Annual NAEB 2017–2018 Agricultural Export Performance Annual Report 2017–2018. 2018. Available online: https://naeb.gov.rw/fileadmin/Reports-Annual/Annual%20report%202017-2018.pdf (accessed on 1 February 2023).
  10. National Agricultural Export Development Board. Annual NAEB 2021–2022 Agriculture Export Performance 2021–2022. 2023. Available online: https://naeb.gov.rw/fileadmin/Reports-Annual/ANNUAL_REPORT_2021-2022.pdf (accessed on 1 February 2023).
  11. Gerard, A.; Clay, D.C.; Claudia Lopez, M. Stakeholder Perceptions on Geographic Zoning in Rwanda’s Coffee Sector Feed the Future Innovation Lab for Food Security Policy Research Brief 42. East Lansing: Michigan State University. 2017. Available online: https://www.canr.msu.edu/fsp/publications/policy-research-briefs/policy_brief_42.pdf (accessed on 4 January 2023).
  12. Macciavello, R.; Morjaria, A. Coffee Washing Stations in Rwanda Policy Memo. 2015. Available online: https://www.theigc.org/sites/default/files/2015/02/Macciavello-and-Morjaria-2015-Project-Memo.pdf (accessed on 8 February 2023).
  13. Church, R.A. Understanding and Improving the Price-Quality Relationship in Rwanda’s Coffee Sector. 2018. Available online: https://www.canr.msu.edu/resources/understanding-and-improving-the-price-quality-relationship-in-rwanda-s-coffee-sector (accessed on 1 March 2023).
  14. Clay, D.C.; Bro, A.S.; Church, R.A.; Bizoza, A.; Ortega, D.L. Determinants of Farmer Investment in Coffee Production: Finding a Path to Sustainable Growth in Rwanda’s Coffee Sector. Feed the Future Innovation Lab for Food Security Research Paper #32. 2016. Available online: http://fsg.afre.msu.edu/fsp/glc/FSP_RP_32_rev.pdf (accessed on 15 March 2023).
  15. Clay, D.C.; Bizoza, A. The Challenge of Sustainable Growth in Rwanda’s Coffee Sector. 2018. Available online: https://www.canr.msu.edu/fsp/publications/research-papers/fsp%20research%20paper%20100.pdf (accessed on 11 January 2023).
  16. Behuria, P. The domestic political economy of upgrading in global value chains: How politics shapes pathways for upgrading in Rwanda’s coffee sector. Rev. Int. Political Econ. 2019, 27, 348–376. [Google Scholar] [CrossRef]
  17. Murekezi, A.K. Profitability Analysis and Strategic Planning of Coffee Processing and Marketing in Rwanda: A Case Study of a Coffee Grower Association. Master’s Thesis, Michigan State University, East Lansing, MI, USA, 2003. Available online: https://ageconsearch.umn.edu/record/11195 (accessed on 23 October 2023). [CrossRef]
  18. Fritriani, F.; Arifin, B.; Zakaria, W.A.; Ismono, R.H. Sustainable Production of Lampung Robusta Coffee: A Cost-Benefit Analysis. Int. J. Ecol. Dev. 2020, 35, 44–58. [Google Scholar]
  19. Karim, M.A.; Wijayanti, F.; Sudaryanto, A. Comparative studies of coffee processing methods for decision making in appropriate technology implementation. AIP Conf. Proc. 2019, 2114, 020015. [Google Scholar] [CrossRef]
  20. Feed the Future Africa Great Lakes Region Coffee Support Program (AGLC) Policy Roundtable (March 2017). Available online: https://www.canr.msu.edu/fsp/outreach/presentations/17.03.02_aglc_y2_zoning_rt_updated.pdf (accessed on 7 May 2023).
  21. AGRI LOGIC. Value Chain Analysis for the Coffee Sector in Rwanda. 2018. Available online: https://www.cbi.eu/sites/default/files/cbi_vca_rwanda_coffee.pdf (accessed on 14 July 2023).
  22. Asian Development Bank. Cost-Benefit Analysis for Development: A Practical Guide; Asian Development Bank: Mandaluyong, PH, USA, 2013; Available online: https://www.adb.org/sites/default/files/institutional-document/33788/cost-benefit-analysis-development_0.pdf (accessed on 13 September 2023).
  23. Boardman, A.E.; Greenberg, D.H.; Vining, A.R.; Weimer, D.L. Cost-Benefit Analysis: Concepts and Practice, 1st ed.; Prentice Hall: Upper Saddle River, NJ, USA, 1996. [Google Scholar]
  24. Quah, E.; Mishan, E.J. Cost-Benefit Analysis, 5th ed.; Routledge: London, UK, 2007. [Google Scholar]
  25. Gittinger, J.P. Economic Analysis of Agricultural Projects, 2nd ed.; Johns Hopkins University Press: Baltimore, MD, USA, 1982. [Google Scholar]
  26. Macchiavello, R.; Morjaria, A. Competition and Relational Contracts in the Rwanda Coffee Chain. Q. J. Econ. 2021, 136, 1089–1143. [Google Scholar] [CrossRef]
  27. TechnoServe. Coffee Wet Mill Processing Guide. 2022. Available online: https://www.technoserve.org/wp-content/uploads/2022/03/TechnoServe-Wet-Mill-Processing-Guide.pdf (accessed on 14 July 2023).
  28. Rocco, M.; Ameet, M. Acquisitions, Management, and Efficiency in Rwanda’s Coffee Industry. NBER Working Paper No. 30230. 2022. Available online: https://www.nber.org/system/files/working_papers/w30230/w30230.pdf (accessed on 13 September 2023).
  29. Guariso, A.; Verpoorten, M. Aid, Trade, and Post-War Recovery of the Rwandan Coffee Sector. J. East. Afr. Stud. 2018, 12, 552–574. [Google Scholar] [CrossRef]
  30. National Agricultural Export Development Board. Annual NAEB 2018–2019 Annual Report. 2019. Available online: https://naeb.gov.rw/fileadmin/Reports-Annual/ANNUAL%20REPORT%202018-2019.pdf (accessed on 5 April 2023).
  31. National Agricultural Export Development Board. Annual NAEB 2019–2020 Annual Report. 2019. Available online: https://naeb.gov.rw/fileadmin/Reports-Annual/ANNUAL_REPORT_2019-2020.pdf (accessed on 5 April 2023).
  32. Miklyaev, M.; Jenkins, G.; Shobowale, D. Sustainability of Agricultural Crop Policies in Rwanda: An Integrated Cost–Benefit Analysis. Sustainability 2021, 13, 48. [Google Scholar] [CrossRef]
  33. Guariso, A.; Ngabitsinze, C.J.; Verpoorten, M. The Rwandan Coffee Sector: Out of the Ordinary. In L’Afrique des Grands Lacs; Reyntjens, F., Vandeginste, S., et Verpoorten, M., Eds.; Annuaire 2011–2012; L’Harmattan: Paris, France, 2012; pp. 397–426. [Google Scholar]
  34. Commodity-Specific Economic Conversion Factors Database for the Republic of Rwanda. Available online: https://rwanda-cscf.cri-world.com/ (accessed on 13 September 2023).
  35. Zhuang, J.; Liang, Z.; Lin, T.; De Guzman, F. Theory and Practice in the Choice of Social Discount Rate for Cost–Benefit Analysis: A Survey. ERD Working Paper. No. 94. ADB. 2007. Available online: https://www.adb.org/sites/default/files/institutional-document/32256/economic-analysis-projects.pdf (accessed on 13 September 2023).
  36. Ponte, S. The ‘latte revolution’? Regulation, markets and consumption in the global coffee chain. World Dev. 2002, 30, 1099–1122. [Google Scholar] [CrossRef]
  37. AGLC. Pricing Coffee Cherry to Incentivize Farmers and Improve Quality. Feed the Future Innovation Lab for Food Security Policy Research Brief 43. East Lansing: Michigan State University. 2017. Available online: https://www.canr.msu.edu/fsp/publications/policy-research-briefs/policy_brief_43.pdf (accessed on 5 November 2023).
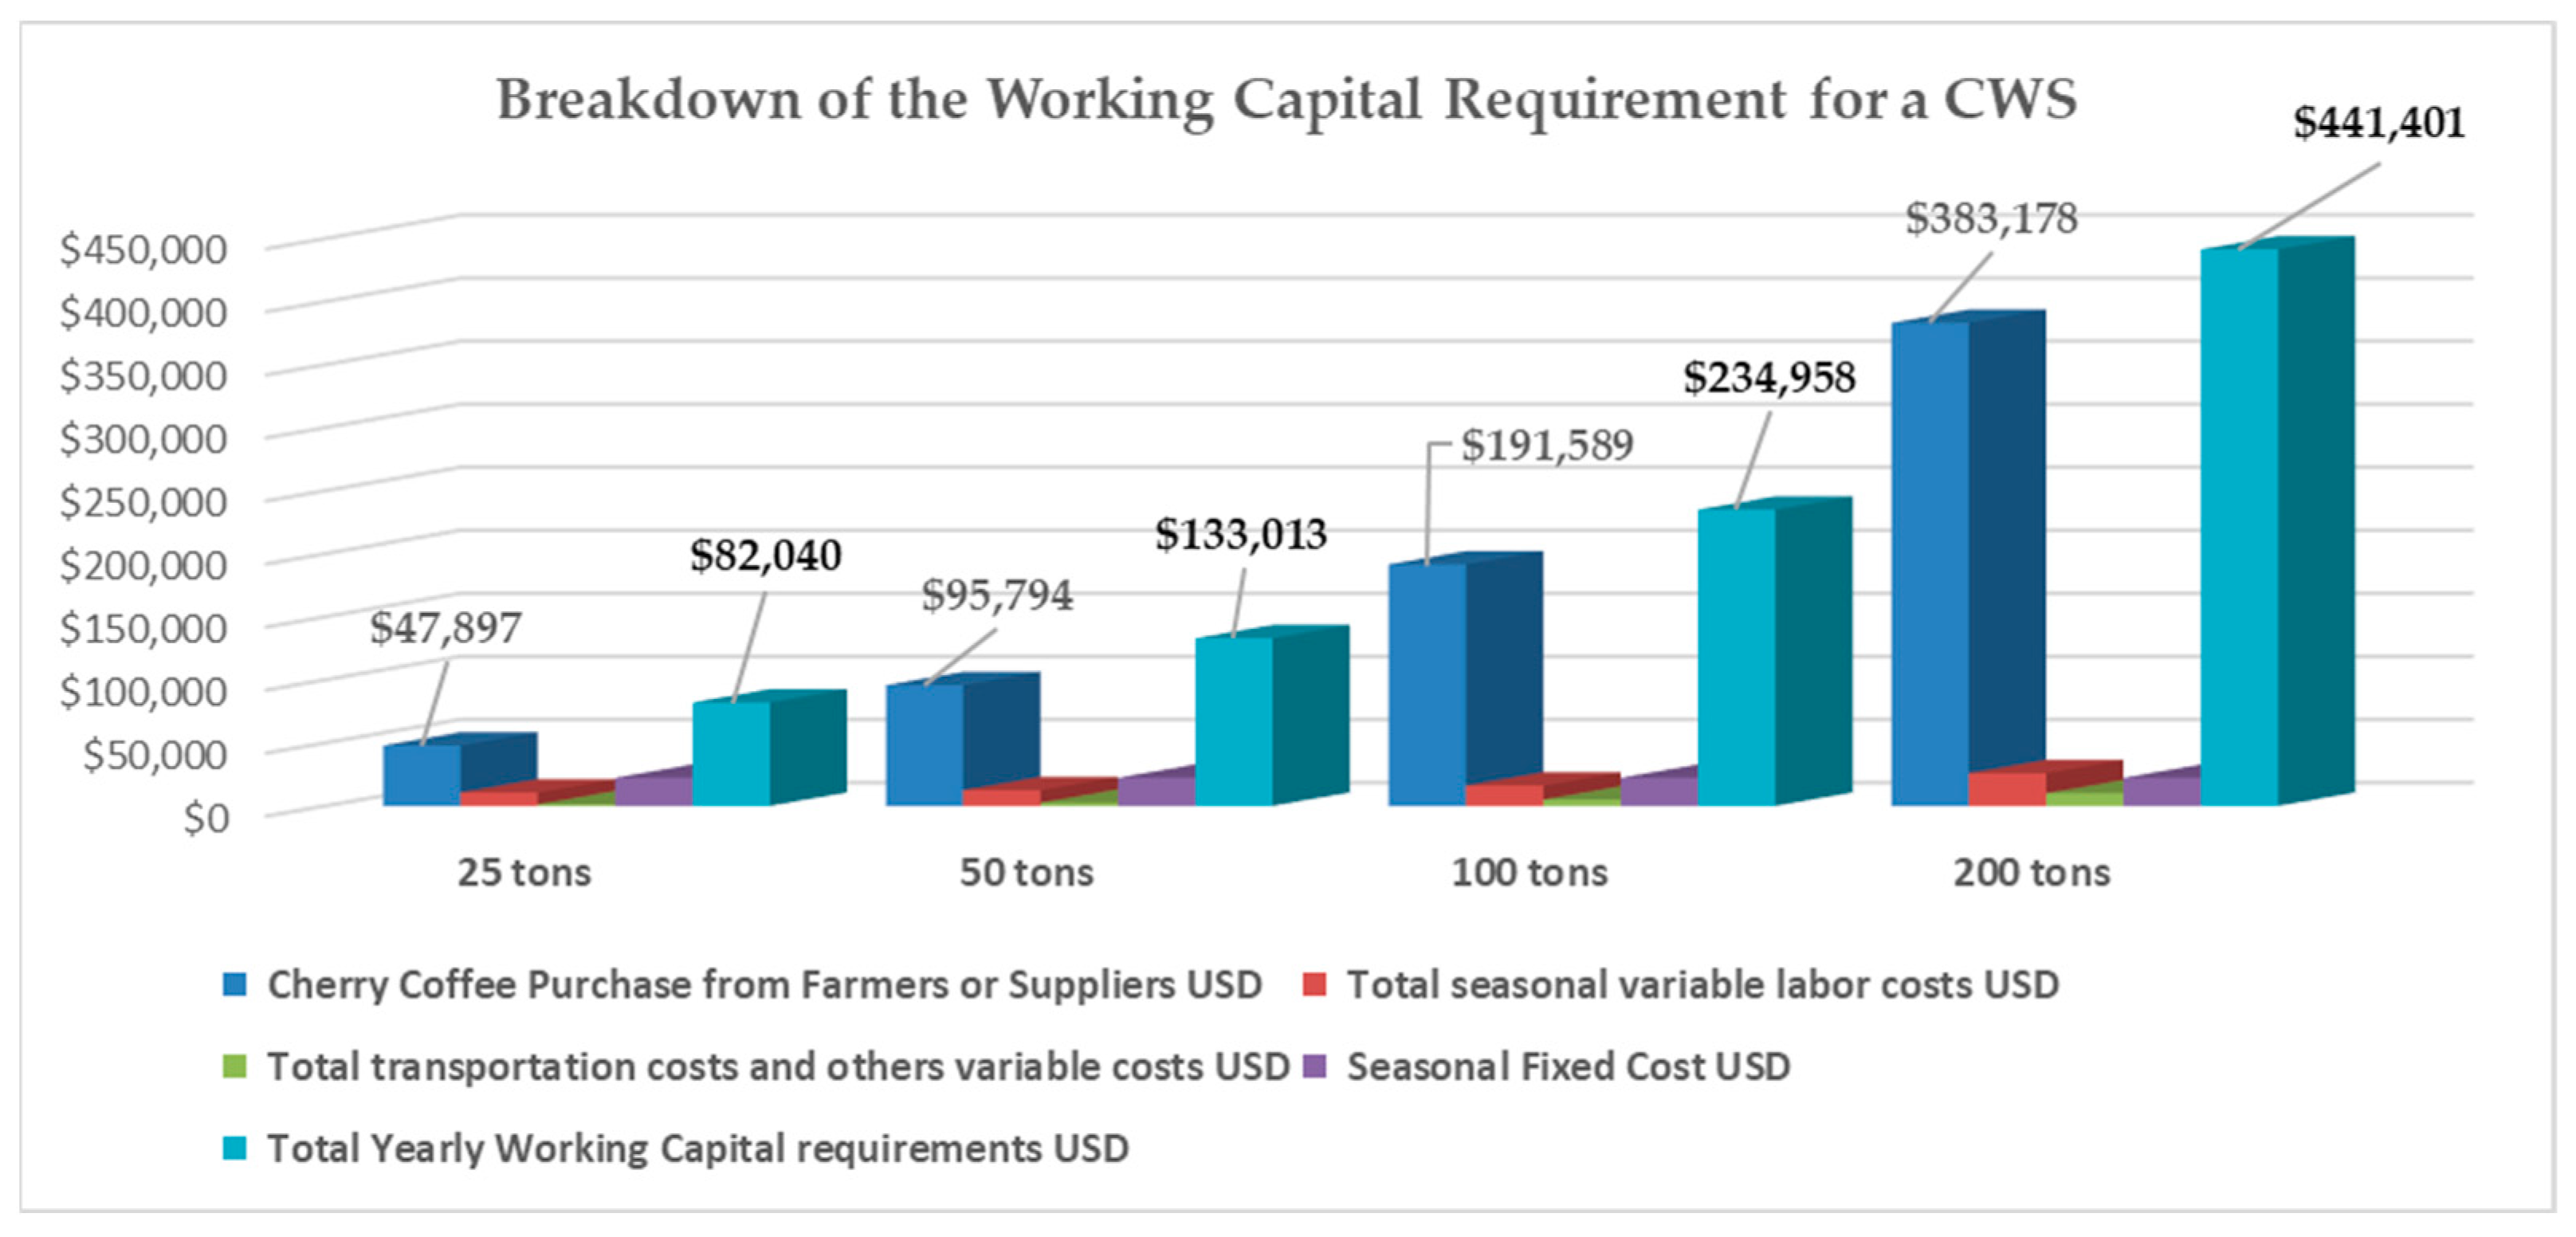
Figure 1. The total working capital requirement for CWS of different processing capacity. Source: Authors.
Sustainability 15 16513 g001
Table 1. Estimation of the yearly working capital requirements for a typical coffee washing station USD 2022 prices.
RowOutput Production Levels25 Tons50 Tons100 Tons200 Tons
1Cherry coffee purchased from farmers or suppliers USD47,89795,794191,589383,178
2Total seasonal variable labor costs USD10,57912,40316,05125,900
3Total transportation costs and others variable costs USD12522504500610,011
4Seasonal Fixed Cost USD22,31222,31222,31222,312
5Yearly Working Capital requirements USD (r1 + r2 + r3 + r4)82,040133,013234,958441,401
Table 2. Financial present value at 13% of the outputs and costs of CWS with four different production scales (in USD 2022 price).
Row 25 Tons50 Tons100 Tons200 Tons
1PV of parchment coffee produced in kg.120,050240,099480,199960,397
2PV of total seasonal variable labor.47,50667,30187,095140,540
3PV of total transportation costs and others variable costs.679613,58627,16554,323
4PV of total seasonal variable costs (r2 + r3)54,30280,887114,260194,863
5PV of total seasonal fixed labor costs and other fixed seasonal costs.121,056121,056121,056121,056
6PV of total seasonal costs in USD (r4 + r5)175,358201,943235,316315,919
7PV of total investment costs in USD200,034200,034200,034200,034
8PV of total cost of processing at CWS in USD (r6 + r7)375,392401,977435,350515,953
Table 3. Financial net present values for a CWS for a 10 years period and 13% discount rate.
Row No. 25 Tons50 Tons100 Tons200 Tons
1PV of parchment revenues in USD660,2751,320,5452,641,0955,282,184
2PV cherry coffee purchased in USD259,902519,8041,039,6072,079,215
3PV of total cost of processing parchment at CWS in USD375,392401,977435,350515,953
4Net present value in USD24,981398,7641,166,1382,687,016
5Internal rate of return14.80%34.11%57.02%81.73%
Table 5. Financial profits per kg of parchment produced in (USD per kg).
RowAverage Profit per kg25 Tons50 Tons100 Tons200 Tons
1Net export price5.55.55.55.5
2Cost of cherry input per kg of parchment if cherry price is 410 RwF/kg1.921.921.921.92
3Average total seasonal production costs per kg1.460.840.490.33
4Producer surplus (USD/kg) (r1 − r2 − r3)2.122.743.093.25
5Average total financial cost of processing a kg of parchment3.131.670.910.54
6Profit (USD/kg) of parchment coffee if cherry is 410 RwF/kg (r1 − r2 − r5)0.451.912.673.04
Table 6. Long-run break-even price of cherry coffee (RwF/kg).
RowNet Export Price (USD per kg)
Parchment Coffee
Annual Production
25 Tons50 Tons100 Tons200 Tons
15.00400713875954
25.505078209821061
36.0061492710891168
46.50721103411961275
57.00828114113031382
Table 7. Short-run break-even price of cherry coffee (RwF/kg).
RowNet Export Price (USD per kg)
Parchment Coffee
Annual Production
25 Tons50 Tons100 Tons200 Tons
15.00758890965999
25.5086599710721106
36.00972110411791213
46.501079121112861320
57.001186131813931427
Table 8. Annual aggregate long-run losses to Rwandese farmers due to low regulated cherry price.
Col 1Col 2Col 3Col 4Col 5
Row 25 Tons50 Tons100 Tons200 Tons
1Long run of cherry price if parchment price at USD 5.50/kg5078209821061
2Fixed cherry price 410 RwF/kg410410410410
3Difference per RwF/kg97410572651
4Annual loss to coffee growers in million RwF727530,75042,90048,825
5Annual loss to coffee growers in USD6,799,06528,738,31840,093,45845,630,841
6PV of aggregate loss over 10 years in USD36,893,382155,941,111217,556,865247,604,053
Table 9. Economic present value at EOCK 13% of the outputs and costs for the 04 production levels of a single coffee washing station for 10 years.
Row 25 Tons50 Tons100 Tons200 Tons
1PV of parchment coffee produced in kg120,050240,099480,199960,397
2PV of total seasonal variable labor in USD47,50667,30187,095140,540
3PV of total transportation costs and others costs in USD595411,90723,81547,630
4PV of total seasonal variable costs in USD53,46079,208110,910188,170
5PV of total seasonal fixed labor costs and others in USD105,829105,829105,829105,829
6PV of total seasonal costs (r4 + r5)159,289 185,037 216,739 293,999
7PV of total investment costs in USD176,479176,479176,479176,479
8PV of total economic cost of processing at CWS in USD (r7 + r8)335,768 361,516 393,218 470,478
9Average total long-run economic cost of processing a kg of parchment2.801.510.820.49
Table 10. Rwanda’s potential yearly economic costs savings.
RowCol 1Col 2
1Yearly saving on economic costs to Rwanda from 300 CWS to 150 CWSUSD 9,117,224
2Yearly saving on economic costs to Rwanda from 300 CWS to 75 CWSUSD 13,484,295
Table 11. Total economic welfare loss to Rwanda due to the oversupply of CWS.
RowCol 1Col 2
1PV of total economic processing costs of 15,000 tons by 300 CWSUSD 108,454,800
2PV of total economic processing costs of 15,000 tons by 150 CWSUSD 58,982,700
3PV of total economic processing costs of 15,000 tons by 75 CWSUSD 35,285,850
4Economic costs saved if 150 CWS rather than 300 CWSUSD 49,472,100
5Economic costs saved if 75 CWS rather than 300 CWSUSD 73,168,950
Table 12. Stakeholder analysis of impacts of policies leading to excessive investments in CWS in Rwanda.
Col 1Col 2Col 3Col 4Col 5
Row Rwandan EconomyFarmersGovernmentCWS Owners
1Potential annual Impacts USD−USD 13,484,295−USD 45,630,841+USD 3,408,228+USD 28,738,318
2PV potential impacts over 10 years USD−USD 73,168,950−USD 247,604,053+USD 18,493,874+USD 155,941,111
Disclaimer/Publisher’s Note: The statements, opinions and data contained in all publications are solely those of the individual author(s) and contributor(s) and not of MDPI and/or the editor(s). MDPI and/or the editor(s) disclaim responsibility for any injury to people or property resulting from any ideas, methods, instructions or products referred to in the content.

