
Effects of Silicon Application on Nitrogen Migration in Soil–Rice Systems under Cadmium Stress


Abstract
:1. Introduction
2. Materials and Methods
2.1. Materials
2.2. Lysimeter Experiment
2.2.1. Experimental Design and Sample Collection
2.2.2. Water, Plant, and Soil Sample Analysis
2.3. Calculation of Nitrogen Mass Balance
2.4. Translocation Index of Cadmium in Plants
2.5. Data Analysis
3. Results
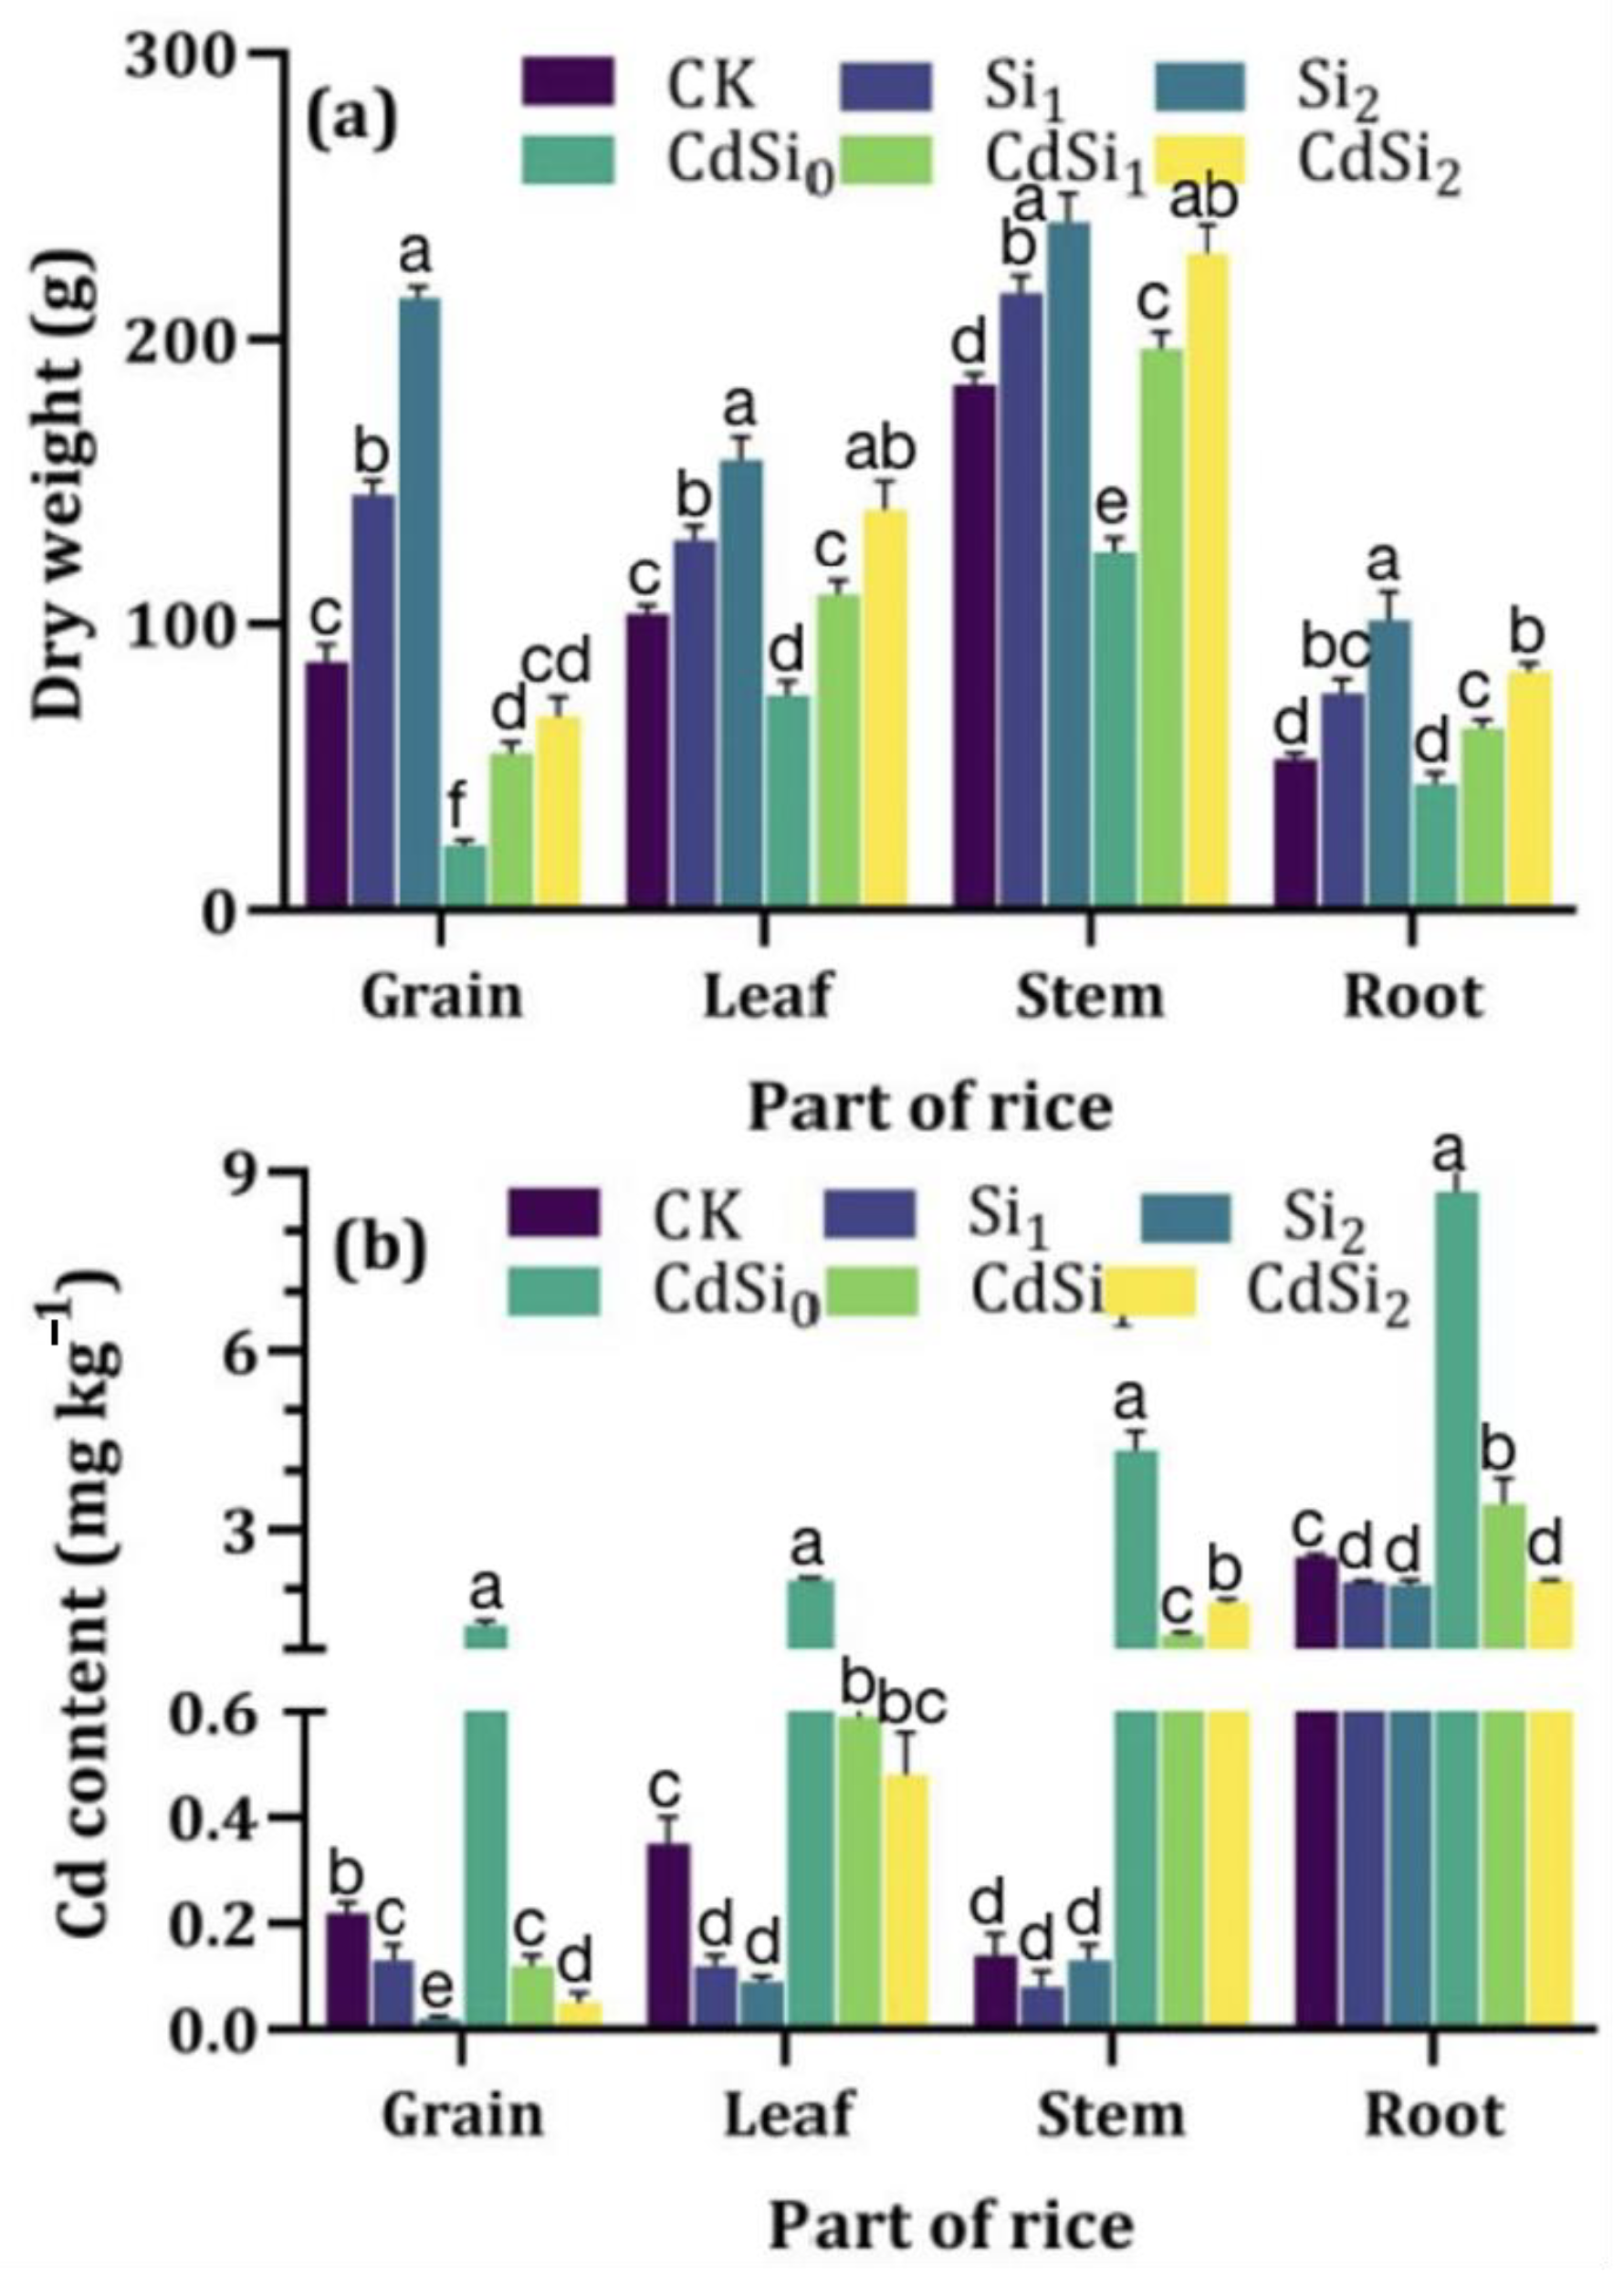
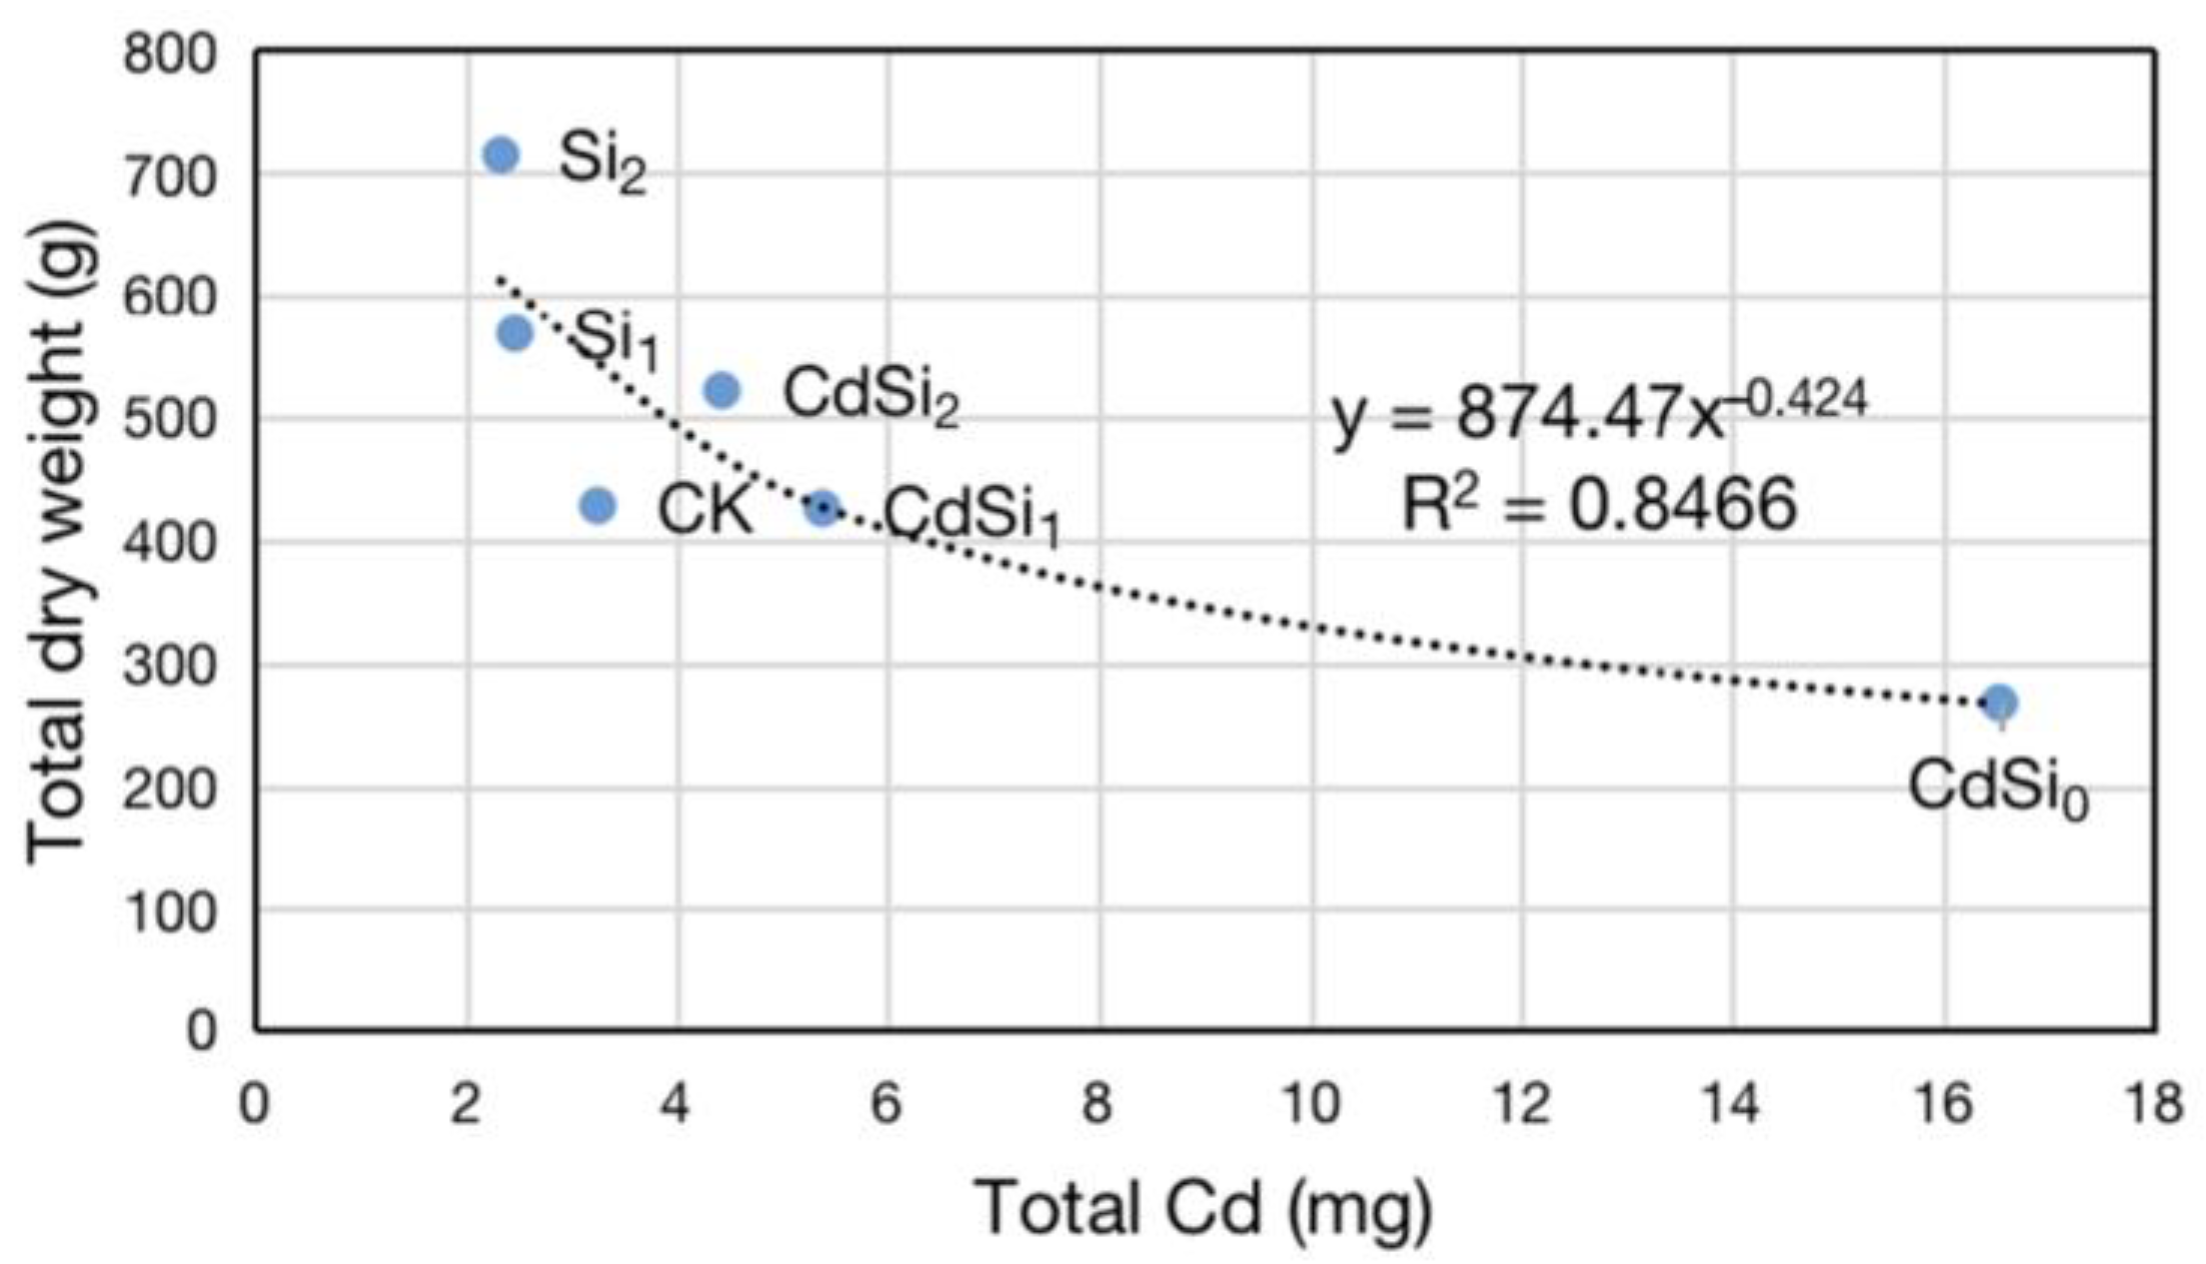
3.1. Rice Yield
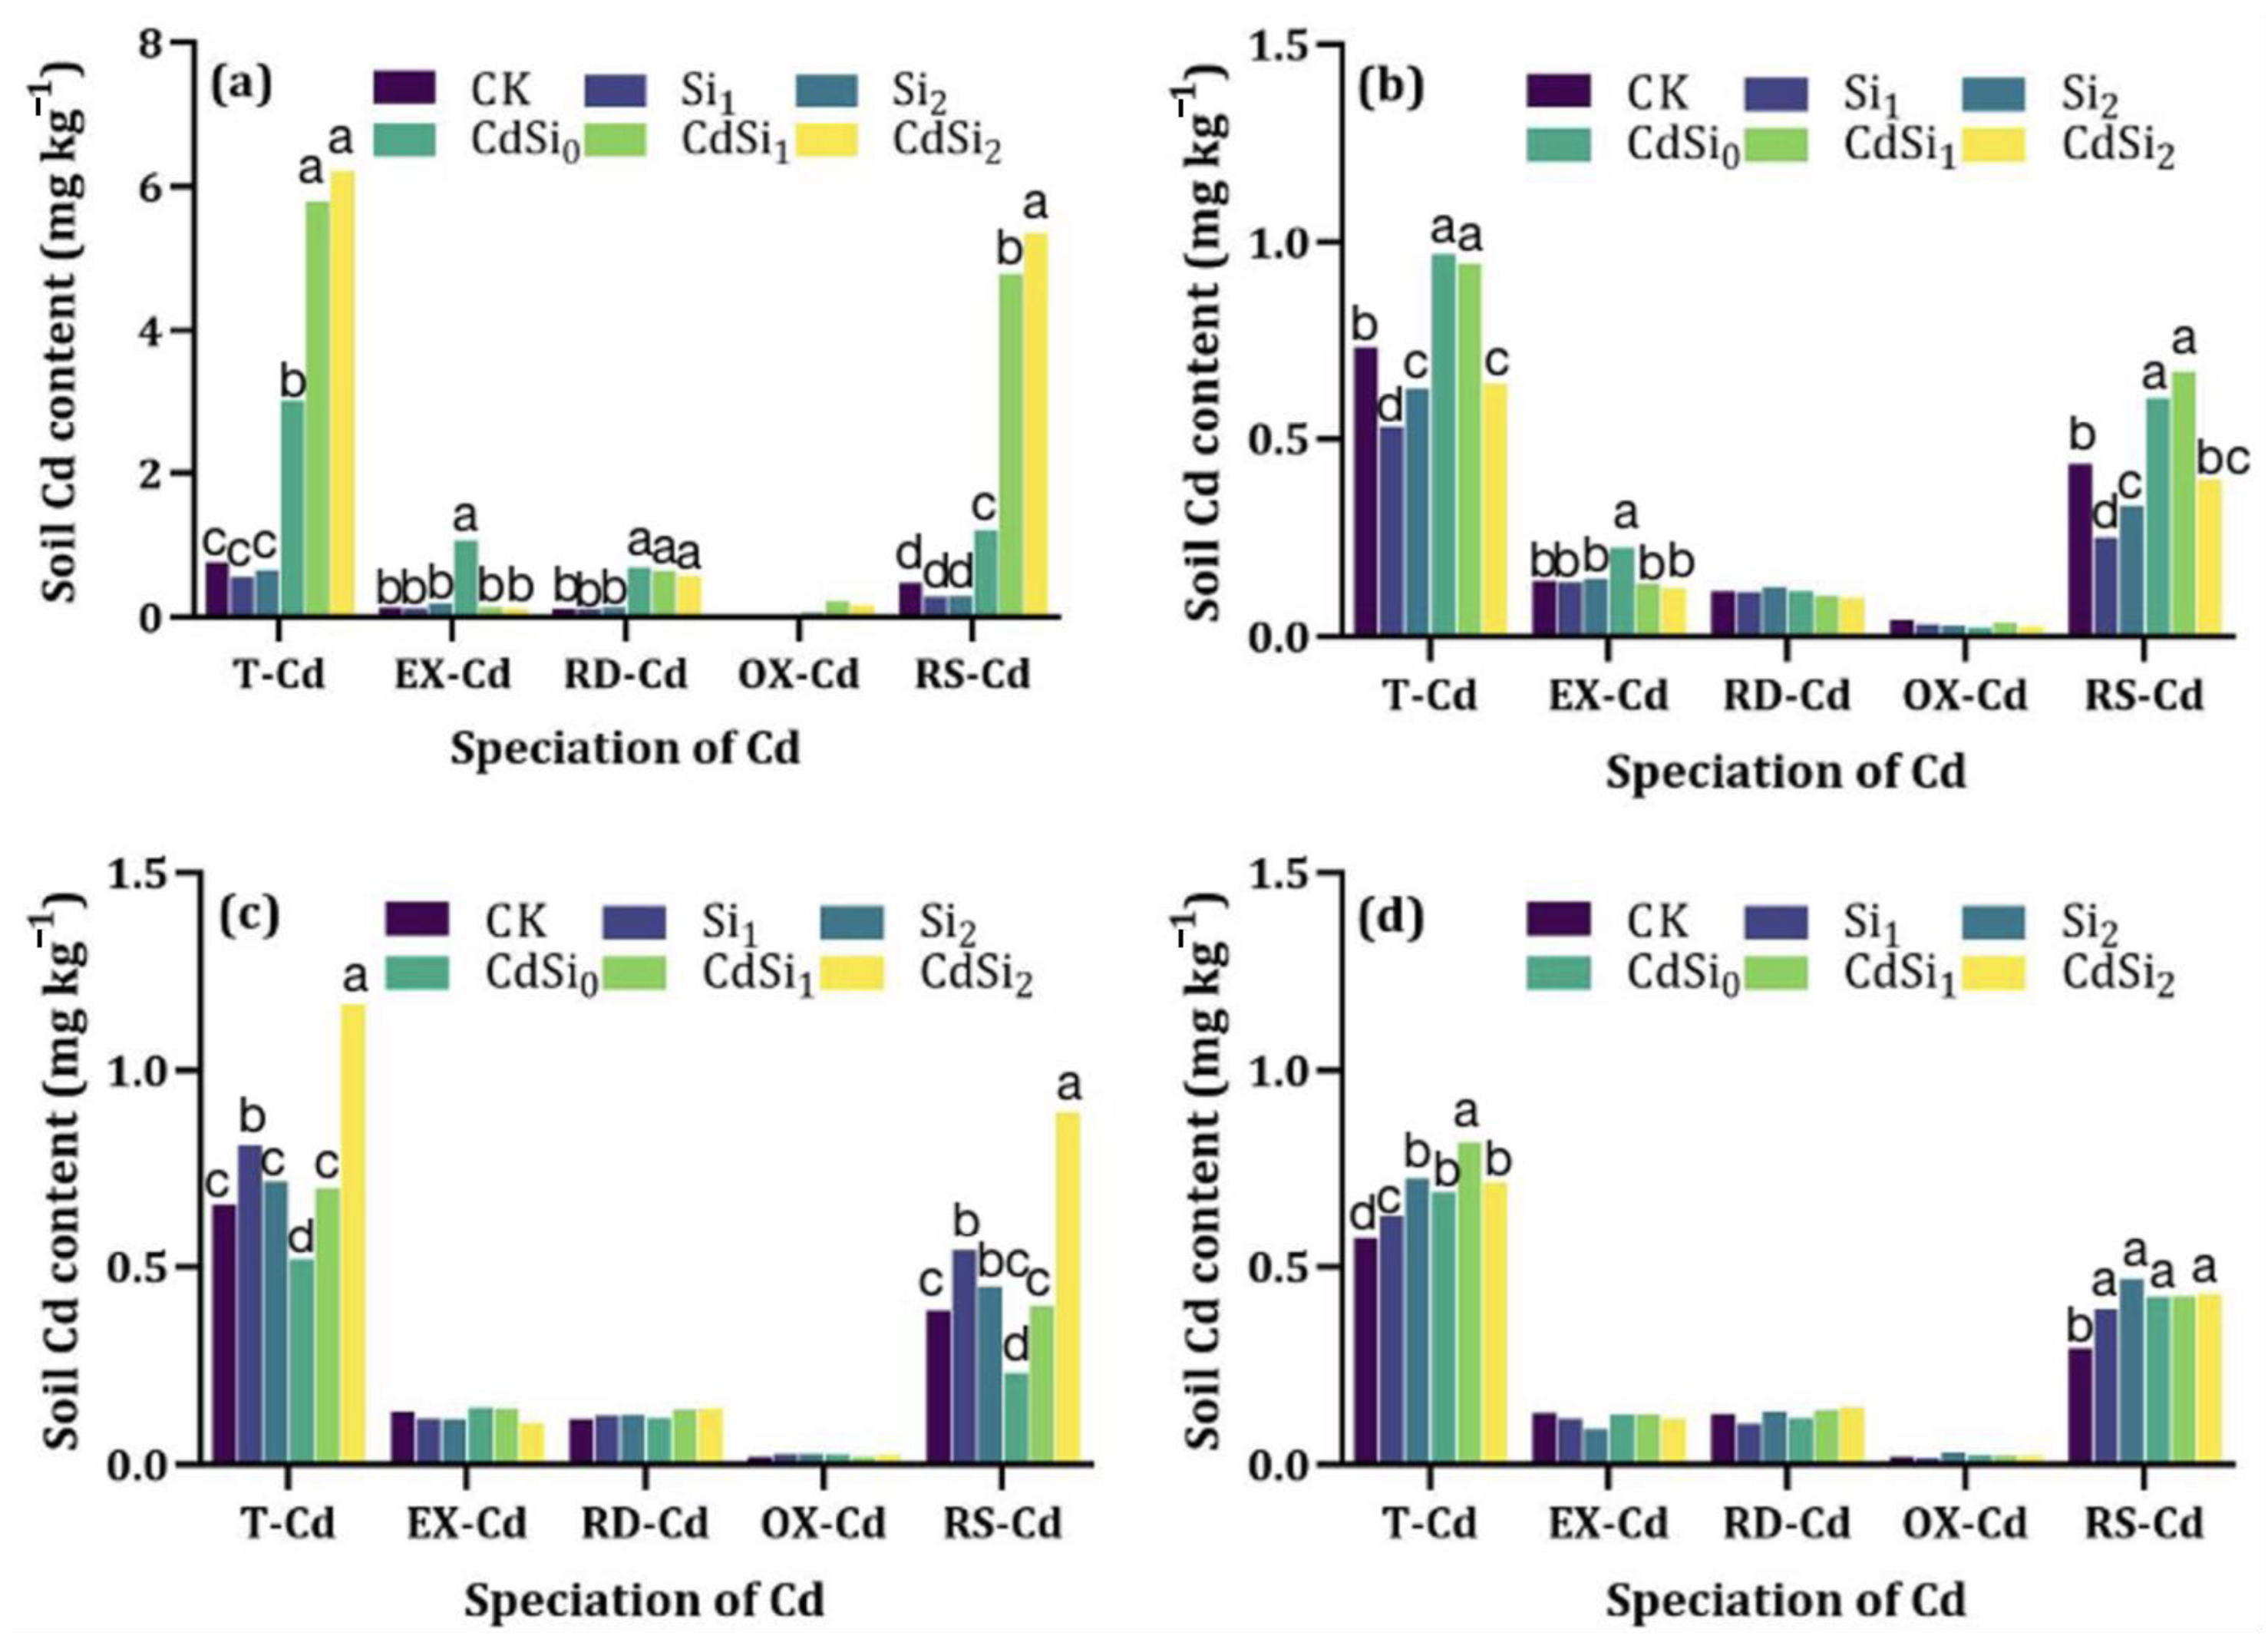
3.2. Cadmium in Rice and Soil
3.3. Nitrogen in Soil–Rice System
3.3.1. Total Nitrogen in Rice
3.3.2. NH4+-N and NO3−-N in Soils
3.3.3. Nitrogen Migration on Different Pathways
4. Discussion
4.1. Effects of Si on Plant Growth and N Content
4.2. Effects of Si on N Migration and Transformation in Soils
4.3. Effects of Si on the Interactions of Nitrogen between Different Pathways
5. Conclusions
Author Contributions
Funding
Institutional Review Board Statement
Informed Consent Statement
Data Availability Statement
Conflicts of Interest
References
- Liu, X.; Zhong, L.; Meng, J.; Wang, F.; Zhang, J.; Zhi, Y.; Zeng, L.; Tang, X.; Xu, J. A Multi-Medium Chain Modeling Approach to Estimate the Cumulative Effects of Cadmium Pollution on Human Health. Environ. Pollut. 2018, 239, 308–317. [Google Scholar] [CrossRef]
- Hu, J.; Wu, F.; Wu, S.; Cao, Z.; Lin, X.; Wong, M.H. Bioaccessibility, Dietary Exposure and Human Risk Assessment of Heavy Metals from Market Vegetables in Hong Kong Revealed with an in Vitro Gastrointestinal Model. Chemosphere 2013, 91, 455–461. [Google Scholar] [CrossRef]
- Riaz, M.; Kamran, M.; Rizwan, M.; Ali, S.; Parveen, A.; Malik, Z.; Wang, X. Cadmium Uptake and Translocation: Selenium and Silicon Roles in Cd Detoxification for the Production of Low Cd Crops: A Critical Review. Chemosphere 2021, 273, 129690. [Google Scholar] [CrossRef] [PubMed]
- Meharg, A.A.; Norton, G.; Deacon, C.; Williams, P.; Adomako, E.E.; Price, A.; Zhu, Y.; Li, G.; Zhao, F.-J.; McGrath, S.; et al. Variation in Rice Cadmium Related to Human Exposure. Environ. Sci. Technol. 2013, 47, 5613–5618. [Google Scholar] [CrossRef] [PubMed]
- Ma, C.; Ci, K.; Zhu, J.; Sun, Z.; Liu, Z.; Li, X.; Zhu, Y.; Tang, C.; Wang, P.; Liu, Z. Impacts of Exogenous Mineral Silicon on Cadmium Migration and Transformation in the Soil-Rice System and on Soil Health. Sci. Total Environ. 2021, 759, 143501. [Google Scholar] [CrossRef] [PubMed]
- Cui, J.; Li, Y.; Jin, Q.; Li, F. Silica Nanoparticles Inhibit Arsenic Uptake into Rice Suspension Cells via Improving Pectin Synthesis and the Mechanical Force of the Cell Wall. Environ. Sci. Nano 2020, 7, 162–171. [Google Scholar] [CrossRef]
- Deng, S.; Li, P.; Li, Y.; Ran, Z.; Peng, Y.; Yang, S.; He, H.; Zhou, K.; Yu, J. Alleviating Cd Translocation and Accumulation in Soil–Rice Systems: Combination of Foliar Spraying of Nano-Si or Nano-Se and Soil Application of Nano-Humus. Soil Use Manag. 2021, 37, 319–329. [Google Scholar] [CrossRef]
- Gao, M.; Zhou, J.; Liu, H.; Zhang, W.; Hu, Y.; Liang, J.; Zhou, J. Foliar Spraying with Silicon and Selenium Reduces Cadmium Uptake and Mitigates Cadmium Toxicity in Rice. Sci. Total Environ. 2018, 631–632, 1100–1108. [Google Scholar] [CrossRef]
- Huang, H.; Li, M.; Rizwan, M.; Dai, Z.; Yuan, Y.; Hossain, M.M.; Cao, M.; Xiong, S.; Tu, S. Synergistic Effect of Silicon and Selenium on the Alleviation of Cadmium Toxicity in Rice Plants. J. Hazard. Mater. 2021, 401, 123393. [Google Scholar] [CrossRef]
- Ren, M.; Qin, Z.; Li, X.; Wang, L.; Wang, Y.; Zhang, J.; Huang, Y.; Yang, S. Selenite Antagonizes the Phytotoxicity of Cd in the Cattail Typha Angustifolia. Ecotoxicol. Environ. Saf. 2020, 189, 109959. [Google Scholar] [CrossRef]
- Ullah, H.; Luc, P.D.; Gautam, A.; Datta, A. Growth, Yield and Silicon Uptake of Rice (Oryza sativa) as Influenced by Dose and Timing of Silicon Application under Water-Deficit Stress. Arch. Agron. Soil Sci. 2018, 64, 318–330. [Google Scholar] [CrossRef]
- Wu, J.; Mock, H.-P.; Giehl, R.F.H.; Pitann, B.; Mühling, K.H. Silicon Decreases Cadmium Concentrations by Modulating Root Endodermal Suberin Development in Wheat Plants. J. Hazard. Mater. 2019, 364, 581–590. [Google Scholar] [CrossRef] [PubMed]
- Gu, J.; Zou, G.; Su, S.; Li, S.; Liu, W.; Zhao, H.; Liu, L.; Jin, L.; Tian, Y.; Zhang, X.; et al. Effects of pH on Available Cadmium in Calcareous Soils and Culture Substrates. Eurasian Soil Sci. 2022, 55, 1714–1719. [Google Scholar] [CrossRef]
- Paulose, B.; Datta, S.P.; Rattan, R.K.; Chhonkar, P.K. Effect of Amendments on the Extractability, Retention and Plant Uptake of Metals on a Sewage-Irrigated Soil. Environ. Pollut. 2007, 146, 19–24. [Google Scholar] [CrossRef] [PubMed]
- Bhat, J.A.; Shivaraj, S.M.; Singh, P.; Navadagi, D.B.; Tripathi, D.K.; Dash, P.K.; Solanke, A.U.; Sonah, H.; Deshmukh, R. Role of Silicon in Mitigation of Heavy Metal Stresses in Crop Plants. Plants 2019, 8, 71. [Google Scholar] [CrossRef] [PubMed]
- Cuong, T.X.; Ullah, H.; Datta, A.; Hanh, T.C. Effects of Silicon-Based Fertilizer on Growth, Yield and Nutrient Uptake of Rice in Tropical Zone of Vietnam. Rice Sci. 2017, 24, 283–290. [Google Scholar] [CrossRef]
- Reithmaier, G.-M.S.; Knorr, K.-H.; Arnhold, S.; Planer-Friedrich, B.; Schaller, J. Enhanced Silicon Availability Leads to Increased Methane Production, Nutrient and Toxicant Mobility in Peatlands. Sci. Rep. 2017, 7, 8728. [Google Scholar] [CrossRef]
- Duan, Z.; Xiao, H. Effects of Soil Properties on Ammonia Volatilization. Soil Sci. Plant Nutr. 2000, 46, 845–852. [Google Scholar] [CrossRef]
- Zhang, J.; He, Y.; Fang, Y.; Zhao, K.; Wang, N.; Zhou, Y.; Luo, L.; Yang, Y. Characteristics and Influencing Factors of Microbial Community in Heavy Metal Contaminated Soil under Silicon Fertilizer and Biochar Remediation. Adsorpt. Sci. Technol. 2021, 2021, 9964562. [Google Scholar] [CrossRef]
- Ling, L.-L.; Liu, W.-J.; Zhang, S.; Jiang, H. Magnesium Oxide Embedded Nitrogen Self-Doped Biochar Composites: Fast and High-Efficiency Adsorption of Heavy Metals in an Aqueous Solution. Environ. Sci. Technol. 2017, 51, 10081–10089. [Google Scholar] [CrossRef]
- Hargreaves, P.R.; Baker, K.L.; Graceson, A.; Bonnett, S.A.F.; Ball, B.C.; Cloy, J.M. Use of a Nitrification Inhibitor Reduces Nitrous Oxide (N2O) Emissions from Compacted Grassland with Different Soil Textures and Climatic Conditions. Agric. Ecosyst. Environ. 2021, 310, 107307. [Google Scholar] [CrossRef]
- Sáez-Plaza, P.; Michałowski, T.; Navas, M.J.; Asuero, A.G.; Wybraniec, S. An Overview of the Kjeldahl Method of Nitrogen Determination. Part I. Early History, Chemistry of the Procedure, and Titrimetric Finish. Crit. Rev. Anal. Chem. 2013, 43, 178–223. [Google Scholar] [CrossRef]
- Kartal, Ş.; Aydın, Z.; Tokalıoğlu, Ş. Fractionation of Metals in Street Sediment Samples by Using the BCR Sequential Extraction Procedure and Multivariate Statistical Elucidation of the Data. Gener. Control Hazard. Dusts Geol. Media 2006, 132, 80–89. [Google Scholar] [CrossRef] [PubMed]
- GB2762-2017; Food Safety National Standard—Contaminant Limits in Food. Chinese Standard: Beijing, China, 2017.
- Shi, X.; Zhang, C.; Wang, H.; Zhang, F. Effect of Si on the Distribution of Cd in Rice Seedlings. Plant Soil 2005, 272, 53–60. [Google Scholar] [CrossRef]
- Detmann, K.C.; Araújo, W.L.; Martins, S.C.V.; Sanglard, L.M.V.P.; Reis, J.V.; Detmann, E.; Rodrigues, F.Á.; Nunes-Nesi, A.; Fernie, A.R.; DaMatta, F.M. Silicon Nutrition Increases Grain Yield, Which, in Turn, Exerts a Feed-Forward Stimulation of Photosynthetic Rates via Enhanced Mesophyll Conductance and Alters Primary Metabolism in Rice. New Phytol. 2012, 196, 752–762. [Google Scholar] [CrossRef] [PubMed]
- Epstein, E. Silicon: Its Manifold Roles in Plants. Ann. Appl. Biol. 2009, 155, 155–160. [Google Scholar] [CrossRef]
- Crooks, R.; Prentice, P. Extensive Investigation Into Field Based Responses to a Silica Fertiliser. Silicon 2017, 9, 301–304. [Google Scholar] [CrossRef]
- Pati, S.; Pal, B.; Badole, S.; Hazra, G.C.; Mandal, B. Effect of Silicon Fertilization on Growth, Yield, and Nutrient Uptake of Rice. Commun. Soil Sci. Plant Anal. 2016, 47, 284–290. [Google Scholar] [CrossRef]
- Riaz, M.; Yan, L.; Wu, X.; Hussain, S.; Aziz, O.; Wang, Y.; Imran, M.; Jiang, C. Boron Alleviates the Aluminum Toxicity in Trifoliate Orange by Regulating Antioxidant Defense System and Reducing Root Cell Injury. J. Environ. Manag. 2018, 208, 149–158. [Google Scholar] [CrossRef]
- Shahid, M.A.; Balal, R.M.; Khan, N.; Zotarelli, L.; Liu, G.D.; Sarkhosh, A.; Fernández-Zapata, J.C.; Martínez Nicolás, J.J.; Garcia-Sanchez, F. Selenium Impedes Cadmium and Arsenic Toxicity in Potato by Modulating Carbohydrate and Nitrogen Metabolism. Ecotoxicol. Environ. Saf. 2019, 180, 588–599. [Google Scholar] [CrossRef]
- Hassan, M.J.; Zhang, G.; Zhu, Z. Influence of Cadmium Toxicity on Plant Growth and Nitrogen Uptake in Rice as Affected by Nitrogen Form. J. Plant Nutr. 2008, 31, 251–262. [Google Scholar] [CrossRef]
- Gouia, H.; Habib Ghorbal, M.; Meyer, C. Effects of Cadmium on Activity of Nitrate Reductase and on Other Enzymes of the Nitrate Assimilation Pathway in Bean. Plant Physiol. Biochem. 2000, 38, 629–638. [Google Scholar] [CrossRef]
- Guo, L.; Chen, A.; He, N.; Yang, D.; Liu, M. Exogenous Silicon Alleviates Cadmium Toxicity in Rice Seedlings in Relation to Cd Distribution and Ultrastructure Changes. J. Soils Sediments 2018, 18, 1691–1700. [Google Scholar] [CrossRef]
- Rizwan, M.; Meunier, J.-D.; Davidian, J.-C.; Pokrovsky, O.S.; Bovet, N.; Keller, C. Silicon Alleviates Cd Stress of Wheat Seedlings (Triticum turgidum L. cv. Claudio) Grown in Hydroponics. Environ. Sci. Pollut. Res. 2016, 23, 1414–1427. [Google Scholar] [CrossRef] [PubMed]
- Yu, H.; Ding, X.; Li, F.; Wang, X.; Zhang, S.; Yi, J.; Liu, C.; Xu, X.; Wang, Q. The Availabilities of Arsenic and Cadmium in Rice Paddy Fields from a Mining Area: The Role of Soil Extractable and Plant Silicon. Environ. Pollut. 2016, 215, 258–265. [Google Scholar] [CrossRef]
- Singh, A.K.; Singh, R.; Singh, K. Growth, Yield and Economics of Rice (Oryza sativa) as Influenced by Level and Time of Silicon Application. Indian J. Agron. 2005, 50, 190–193. [Google Scholar]
- Katz, O.; Puppe, D.; Kaczorek, D.; Prakash, N.B.; Schaller, J. Silicon in the Soil–Plant Continuum: Intricate Feedback Mechanisms within Ecosystems. Plants 2021, 10, 652. [Google Scholar] [CrossRef]
- Afzal, M.; Yu, M.; Tang, C.; Zhang, L.; Muhammad, N.; Zhao, H.; Feng, J.; Yu, L.; Xu, J. The Negative Impact of Cadmium on Nitrogen Transformation Processes in a Paddy Soil Is Greater under Non-Flooding than Flooding Conditions. Environ. Int. 2019, 129, 451–460. [Google Scholar] [CrossRef]
- Smolders, E.; Brans, K.; Coppens, F.; Merckx, R. Potential Nitrification Rate as a Tool for Screening Toxicity in Metal-Contaminated Soils. Environ. Toxicol. Chem. 2001, 20, 2469–2474. [Google Scholar] [CrossRef]
- Morris, R.A.; Furoc, R.R.; Rajbhandari, N.K.; Marqueses, E.P.; Dizon, M.A. Rice Response to Waterlog-Tolerant Green Manures. Agron. J. 1989, 81, 803–809. [Google Scholar] [CrossRef]
- Bouldin, D.R. The Chemistry and Biology of Flooded Soils in Relation to the Nitrogen Economy in Rice Fields. In Nitrogen Economy of Flooded Rice Soils: Proceedings of a Symposium on the Nitrogen Economy of Flooded Rice Soils, Washington DC, 1983; De Datta, S.K., Patrick, W.H., Eds.; Springer: Dordrecht, The Netherlands, 1986; pp. 1–14. ISBN 978-94-009-4428-2. [Google Scholar]
- Devries, J.D.; Bennett, J.M.; Boote, K.J.; Albrecht, S.L.; Maliro, C.E. Nitrogen Accumulation and Partitioning by Three Grain Legumes in Response to Soil Water Deficits. Field Crops Res. 1989, 22, 33–44. [Google Scholar] [CrossRef]
- Buresh, R.J.; Flordelis, E.; Woodhead, T.; Cabangon, R.C.; Shepherd, K.D. Nitrate Accumulation and Loss in a Mungbean/Lowland Rice Cropping System. Soil Sci. Soc. Am. J. 1989, 53, 477–482. [Google Scholar] [CrossRef]


| Soil Texture | pH | Organic Matter mg g−1 | Available Si mg g−1 | NH4+-N mg kg−1 | NO3−-N mg kg−1 | Total Cd mg kg−1 |
|---|---|---|---|---|---|---|
| Silt loam | 6.46 | 47.75 | 68.82 | 9.50 | 65.01 | 0.26 |
| Depth (cm) | Nitrogen Variation in Soil (g) | Plant Total Nitrogen (g) | Soil Nitrogen Flux (mg d−1) | |||||||||||||||
|---|---|---|---|---|---|---|---|---|---|---|---|---|---|---|---|---|---|---|
| CK | CdS0 | S1 | S2 | CdS1 | CdS2 | CK | CdS0 | S1 | S2 | CdS1 | CdS2 | CK | CdS0 | S1 | S2 | CdS1 | CdS2 | |
| 1 July–29 August | ||||||||||||||||||
| 0–20 | −5.37 | −5.62 | −6.02 | −6.40 | −6.02 | −5.92 | 3.02 | 0.65 | 5.78 | 8.13 | 2.22 | 2.79 | 39.13 | 82.80 | 4.08 | −28.97 | 63.25 | 52.21 |
| 20–30 | −0.54 | −0.67 | −0.62 | −0.72 | −0.75 | −0.44 | - | - | - | - | - | - | 48.19 | 93.98 | 14.39 | −17.04 | 75.80 | 59.58 |
| 30–40 | 0.07 | −0.52 | −0.48 | −0.67 | −0.39 | −0.48 | - | - | - | - | - | - | 47.06 | 102.60 | 22.31 | −5.80 | 82.30 | 67.64 |
| 30 August–30 September | ||||||||||||||||||
| 0–20 | −0.44 | −0.39 | −0.30 | −0.19 | −0.24 | −0.38 | 0.88 | 0.71 | 0.69 | 0.46 | 0.53 | 0.71 | −14.68 | −10.65 | −13.22 | −9.14 | −9.69 | −11.08 |
| 20–30 | −0.17 | −0.14 | −0.12 | −0.09 | −0.10 | −0.19 | - | - | - | - | - | - | −8.95 | −5.94 | −9.35 | −6.08 | −6.51 | −4.78 |
| 30–40 | −0.27 | −0.18 | −0.28 | −0.18 | −0.19 | −0.14 | - | - | - | - | - | - | −0.07 | −0.10 | −0.09 | −0.08 | −0.14 | −0.03 |
| 1 July–30 September | ||||||||||||||||||
| 0–20 | −5.81 | −6.00 | −6.32 | −6.58 | −6.26 | −6.30 | 3.90 | 1.35 | 6.47 | 8.60 | 2.75 | 3.50 | 21.20 | 51.65 | −1.69 | −22.36 | 38.94 | 31.11 |
| 20–30 | −0.72 | −0.81 | −0.73 | −0.81 | −0.85 | −0.63 | - | - | - | - | - | - | 29.14 | 60.67 | 6.48 | −13.39 | 48.36 | 38.13 |
| 30–40 | −0.20 | −0.69 | −0.75 | −0.85 | −0.58 | −0.63 | - | - | - | - | - | - | 31.35 | 68.37 | 14.84 | −3.89 | 54.82 | 45.08 |
Disclaimer/Publisher’s Note: The statements, opinions and data contained in all publications are solely those of the individual author(s) and contributor(s) and not of MDPI and/or the editor(s). MDPI and/or the editor(s) disclaim responsibility for any injury to people or property resulting from any ideas, methods, instructions or products referred to in the content. |
© 2023 by the authors. Licensee MDPI, Basel, Switzerland. This article is an open access article distributed under the terms and conditions of the Creative Commons Attribution (CC BY) license (https://creativecommons.org/licenses/by/4.0/).
Share and Cite
Tan, X.; Gao, J.; Li, L.; Yu, J. Effects of Silicon Application on Nitrogen Migration in Soil–Rice Systems under Cadmium Stress. Sustainability 2023, 15, 16552. https://doi.org/10.3390/su152416552
Tan X, Gao J, Li L, Yu J. Effects of Silicon Application on Nitrogen Migration in Soil–Rice Systems under Cadmium Stress. Sustainability. 2023; 15(24):16552. https://doi.org/10.3390/su152416552
Chicago/Turabian StyleTan, Xiao, Jingjing Gao, Longguo Li, and Jin Yu. 2023. "Effects of Silicon Application on Nitrogen Migration in Soil–Rice Systems under Cadmium Stress" Sustainability 15, no. 24: 16552. https://doi.org/10.3390/su152416552
APA StyleTan, X., Gao, J., Li, L., & Yu, J. (2023). Effects of Silicon Application on Nitrogen Migration in Soil–Rice Systems under Cadmium Stress. Sustainability, 15(24), 16552. https://doi.org/10.3390/su152416552