Article

Coupling Coordination Development of the Ecological–Economic System in Hangzhou, China

School of Public Administration, Zhejiang Gongshang University, 18 Xuezheng St., Qiantang District, Hangzhou 314423, China
*
Author to whom correspondence should be addressed.
Sustainability 2023, 15(24), 16570; https://doi.org/10.3390/su152416570
Submission received: 16 October 2023 / Revised: 27 November 2023 / Accepted: 4 December 2023 / Published: 5 December 2023

Abstract

:
The contradiction between China’s urban economic development and the ecological environment has become increasingly prominent. Promoting the coordinated development of the ecological–economic system is an effective way to achieve sustainable development. Based on the analysis of the coupling mechanism of the ecological environment and economic development, the county unit is taken as the research unit to evaluate the coupling coordination degree (CCD) of Hangzhou’s ecological–economic system and analyze the evolution of coupling coordination characteristics and landscape ecological patterns in Hangzhou from 2010 to 2020. The results show that (1) the ecological protection and economic development status of Hangzhou is generally good, but the ecological environment index cannot maintain stable growth; (2) the coupling coordination degree of ecological–economic systems in various regions shows an overall upward trend, and ecological protection and economic development show positive interaction characteristics; (3) the development of CCD between regions is uneven, and the development level of a single subsystem in each region hinders coupling coordination between the two parties; and (4) changes in morphological spatial patterns further prove the coupling relationship between the two systems. Although the regional ecological connectivity has been optimized, the increase in perforations is crowding out the core area, and the regional ecological carrying capacity is facing challenges.

1. Introduction

Against the background of increasingly serious ecological degradation and environmental pollution, sustainable development has become the consensus of the international community. The biggest obstacle to promoting sustainable development is the contradiction between ecological protection and economic development. As global energy consumption increases and urban expansion accelerates, the detrimental effects of economic development on the world’s ecological environment are escalating. This is particularly evident in developing countries, presenting additional challenges to the achievement of the Sustainable Development Goals (SDGs). The key SDGs impacted include SDG11 (Sustainable Cities and Communities), SDG12 (Responsible Consumption and Production), SDG13 (Climate Action), SDG14 (Life Below Water), and SDG15 (Life on Land). The “Evaluation Report on the Sustainable Development of China (2019)” indicates an overall improvement in China’s economic development, yet the outlook for resource and environmental carrying capacity remains concerning. Studies on various developing countries, including India and Brazil, have highlighted analogous challenges, such as significant conflicts between human activities and the land, as well as prevalent ecological pollution [1,2]. Addressing the contradiction between economic development and ecological protection has become a global focal point. In 2022, the United Nations Environment Program introduced an updated version of the “Medium Term Strategy”, underscoring nature’s pivotal role in fostering socially, economically, and environmentally sustainable development. Given the escalating prominence of the negative impact from the traditional extensive economic growth model, it is becoming imperative to incorporate the concept of ecological protection into the economic development process. This integration aims to foster the coordinated development of the ecological–economic system.
The study of the ecological environment and economic development has consistently been a crucial research area. In the initial stage of this research, the discussion primarily centered around individual ecological governance measures; economic development was often viewed as both the cause of environmental pollution and the financial motivation for ecological protection. These included soil and water conservation measures [3], mine ecological management [4], the restoration of industrial wasteland [5], the protection of forest vegetation [6], and safeguarding biodiversity [7]. In recent years, research in this field has increasingly emphasized the coordination and promotion between ecology and the economy [8]. This emphasis involves utilizing various mathematical methods, including the PSR model [9], input–output model [10], and the Environmental Kuznets Curve (EKC) [11]. Among these studies, the EKC hypothesis introduced by Grossman et al. [12] has found extensive application [13,14]. This hypothesis demonstrates that the correlation between economic growth and environmental pollution is not linear but follows an inverted “U” shape. Numerous scholars have employed China’s inter-provincial panel data or provincial and river basin cross-sectional data to validate the EKC hypothesis [15,16].
As research deepens, an increasing number of scholars recognize that the coupling coordination and mutual benefit of the regional economy and natural environment are inherent necessities for sustainable development [17]. Scholars apply the concept of coupling from physics to gauge the coordinated relationship among economic and environmental systems, encompassing ecology, economy, energy, population, resources, and society [18,19,20,21,22]. Regarding research methods, current approaches for analyzing the coordinated development of ecological–economic coupling encompass the entropy method [23], factor contribution analysis method [24], remote sensing quantitative measurement [25], energy value analysis method [26], and system dynamics model [27], among others. In terms of research areas, the majority of studies concentrate on provinces [28] and river basins [29], with limited attention given to cities and counties. Additionally, some scholars have attempted to incorporate land use changes into the examination of the coordination relationship between economic development and the ecological environment [30,31]. However, these efforts have yet to delve into more in-depth landscape analysis. The above analysis reveals the richness of research findings in this field, yet notable shortcomings persist. Firstly, the majority of research is conducted at the macro level [17,18,19,20,21,22,23,26,28,29], with limited attention given to smaller scales such as counties [25]. Secondly, the analysis heavily relies on panel data, diminishing the consideration of spatial influence in the system development process [18,19,20,23,24,25,26,27]. Moreover, there is a lack of in-depth research on the landscape spatial pattern closely linked to the ecosystem.
Based on this, this paper first analyzes the coupling mechanism of the ecological environment and economic development, takes the counties in Hangzhou city as the research unit, evaluates the CCD of ecological environment and economic development in Hangzhou, and finally uses land use data to analyze the landscape ecological pattern. This study aims to furnish sustainable development insights for regions grappling with ecological and economic imbalances. Furthermore, it provides a theoretical and practical basis for other developing countries in their pursuit of the SDGs.
This study aimed to address the following issues:
(1)
To evaluate the spatiotemporal characteristics of economic development system and ecological environment system in the four study areas of Hangzhou from 2010 to 2020;
(2)
To analyze the spatiotemporal evolution characteristics of the coupling coordination relationship between economic development system and ecological environment system in Hangzhou from 2010 to 2020;
(3)
To examine the changes in the spatial pattern of landscape morphology in Hangzhou from 2010 to 2020;
(4)
To investigate whether changes in the coupling coordination degree of Hangzhou’s ecological–economic system from 2010 to 2020 can be reciprocally validated by alterations in the spatial pattern of landscape morphology.

2. Research Theory, Methods and Data

2.1. Coupling Mechanism of Ecological Environment and Economic Development

There is an obvious coupling effect between the ecological environment and economic development, manifested primarily in two dimensions: synergy and antagonism. On the one hand, the ecosystem establishes a conducive investment environment, material foundation, and spatial conditions for economic development, facilitating the flow of capital, labor, land, and other elements across various industries. High-quality economic development not only fosters innovation in environmental protection technologies but also offers financial support for environmental initiatives, contributing to the effective rectification of ecological issues [32]. Simultaneously, high-quality economic development enhances the production process by improving efficiency and adopting clean energy, consequently mitigating the environmental impact of pollutants.
On the other hand, regional economic development requires the consumption of natural resources. The use of energy leads to environmental pollution, and the expansion of construction land encroaches upon ecological space. While ecosystems play a certain role in supporting economic and social development, their purification and regulation capabilities are constrained. When the ecological environment reaches a threshold unable to withstand economic activities, it undergoes continuous deterioration. At this time, companies will opt to relocate, resulting in the loss of talents, capital and technology, posing challenges to the achievement of sustainable development in the regional economy.

2.2. Methods

2.2.1. Comprehensive Level Evaluation Model

In order to avoid errors caused by subjective factors, the entropy weight method was used to calculate the weight of each index.
(1)
The proportion P i j of each standardized index was calculated:
P i j = x i j * i = 1 m x i j *
Among them, i = 1 , 2 , , m , indicates different years; j = 1 , 2 , , n , indicates the type of index data of each system.
(2)
The information entropy E j of the j-th index was calculated:
E j = 1 ln n i = 1 m ( P i j ln P i j )
(3)
The information utility value a j of the j-th index was calculated:
a j = 1 E j
(4)
The weight W j of the j-th index was calculated:
W j = a j j = 1 n a j
Dimensionless values and factor weight values were used to calculate the comprehensive index of the economic development system and ecological environment system; the specific formula is
U j = j = 1 n W j × x i j *

2.2.2. Coupling Coordination Model

The coupling degree (CD) of Hangzhou’s ecological–economic system was calculated:
C = U 1 U 2 U 1 + U 2 2 2
In the formula, U 1 and U 2 represent the comprehensive development index of the economic development system and the ecological environment system, respectively.
While the CD can reflect the degree of interaction between subsystems, it cannot indicate the level of coordinated development among them [33]. Therefore, the CCD model was employed. The coupling coordination degree D signifies the level of mutual influence between the two subsystems. A higher value suggests a more coordinated relationship between the subsystems. On the contrary, the less coordinated the relationship is the lesser the value. Based on research in the literature [34,35], the undetermined coefficient was set to α = β = 0.5. The specific calculation formula is as follows:
T = α U 1 + β U 2
D = C × T
On the basis of referring to the relevant literature [36], combined with actual research, the types of CDD were divided (Table 1).
In the stage of low coupling coordination, the regional economic development level is low, and the ecosystem’s carrying capacity is robust. However, infrastructure construction poses a threat by fragmenting the ecological space. As the region progresses to the stage of moderate coupling coordination, the economy undergoes rapid development, leading to a decline in the ecological carrying capacity, and the negative impact of economic development on ecological space intensifies. Advancing to the high coupling coordination stage, a positive resonance between the economy and ecology emerges; ecological protection measures through artificial intervention become effective. Finally, in the stage of extreme coupling coordination, the mutual promotion of the economy and ecology results in the emergence of a new ecological spatial structure.

2.2.3. Morphological Spatial Pattern Analysis

Morphological Spatial Pattern Analysis (MSPA) is an analysis method used by Vogt et al. to discern the spatial topological relationship between target pixel sets and structural elements based on mathematical morphology principles [37]. This method proves valuable in accurately identifying the types and structures of ecological landscapes. We utilized ArcGIS10.6 software to reclassify the land use data of Hangzhou in 2010 and 2020. Ecological spaces such as forest land and water bodies were designated as the foreground, while other land types like construction land were categorized as background. Following processing with Guidos2.8 software, Hangzhou’s ecological space could be segmented into seven non-overlapping categories based on their forms: Core, Islet, Loop, Bridge, Performance, Edge, and Branch [38]. From an ecological point of view, the Core is generally a large natural patch or animal and plant reserve, while the Islet is an isolated small patch that is not connected. The Loop and Bridge denote ecological corridors connecting the same and different core areas, respectively. The Branch represents an area with only one end connected to Edge, Bridge or Loop. The Perforation is construction land within the core area, devoid of ecological benefits.

2.3. Index System and Data Sources

2.3.1. Construction of Index System

According to the regional environmental characteristics of Hangzhou City and the consideration of index calculation, this study relied on the ecological and economic conditions of Hangzhou City, incorporating insights from previous relevant research [22,39,40]. System indices were selected from the statistical yearbooks and government bulletins of the study area to construct a three-level hierarchical index system (Table 2), encompassing a total of 17 indices. Notably, water consumption per 10,000 yuan of GDP was regarded as a negative index, while the remaining indices were positive-direction indices.

2.3.2. Data Sources

This study took 2010–2020 as the research period. Primary data sources include the “Hangzhou Statistical Yearbook”, the “Statistical Communiqué on the National Economic and Social Development“, and the “Statistical Yearbook on Environment“ of Tonglu County, Chun’an County, and Jiande each year. Additionally, information was extracted from government work communiques and meeting reports published on local government websites. To address individual missing data, a linear fitting method was employed for estimation. The vector data used in the study predominantly comprise Hangzhou administrative boundaries, internal administrative district boundary data, and 30 m resolution land use data. These datasets are sourced from the Resource and Environment Science and Data Center (http://www.resdc.cn/Default.aspx (accessed on 11 August 2023)).

2.3.3. Descriptive Statistical Analysis

We used the standardized data of each index to draw a box plot (Figure 1). In terms of economic development indices, the GDP per capita and the local fiscal revenue per capita are concentrated at low values. Conversely, the GDP growth rate and the second industry GDP growth rate concentrate at high values, and the other indices are relatively scattered. The GDP per capita and the local fiscal revenue per capita of Hangzhou urban area from 2016 to 2020 are much higher than those of other regions, with outliers surpassing the upper whisker. The GDP growth rate of Chun’an County in 2020 was −4.8%; the second industry GDP growth rate in 2018 and 2020 was 97.8 and 86.9, respectively, which was the lowest observed in the past decade, with outliers below the lower whisker. In terms of ecological environment indices, the green coverage rate of built-up areas and the proportion of environmental protection investment in public budget expenditure are concentrated at low values, while the other indices are relatively scattered. The green coverage rate of Chun’an County’s built-up areas in 2010 was 50.8%, and the ecological environment protection investment accounted for 10.54% of the public budget expenditure in 2014, which was an outlier higher than the upper whisker. However, these two data points in Chun’an County in other years are relatively low, so it is concentrated in the low-value area with other data. In Tonglu County, the proportion of rivers with Class I and II water quality was 65% in 2010, and the number of days with good ambient air in Hangzhou urban area in 2014 was only 228. These figures are significantly lower than the rest of the data, resulting in outliers below the lower whisker.

3. Research Result

3.1. Overview of the Study Area

Hangzhou is the capital of Zhejiang Province and an important central city in East China (Figure 2). It is the economic, political, and educational center of the province, with a total area of 16,850 square kilometers. The research area of this article is Hangzhou urban area, incorporating ten municipal districts, one county-level city, Jiande, and two counties, Chun’an and Tonglu.
Hangzhou’s economy and society have been developing rapidly. As of 2022, it achieved a GDP of CNY 1875.3 billion, a per capita GDP of CNY 152,588, and an urbanization rate of 84.0%. Hangzhou boasts highly favorable ecological conditions. The city’s forest area is 16.3527 million acres, and the forest coverage rate reaches 64.77%. According to the “National Ecological Functional Zoning (Revised Edition)”, Hangzhou exhibits elevated vegetation coverage, ample rainfall, and a lower prevalence of desertification and salinization. However, major problems, such as soil erosion and the geological disasters caused by them, exist. These are ecological issues, so it undertakes important ecological conservation functions such as water source conservation and soil and water conservation [41]. Based on this evidence, it is imperative to select Hangzhou itself as the suitable model to explore the coupling relationship between the ecological and economic systems.

3.2. Subsystem Exponential Spatiotemporal Characteristics

3.2.1. Timing Changes

Through a series of calculation processes, we derived the comprehensive score values for the ecological environment and economic development system evaluations of Hangzhou urban area, Tonglu County, Chun’an County, and Jiande (Table 3).
The economic development index of Hangzhou’s four districts shows an overall upward trajectory (Figure 3), indicating a positive trend in Hangzhou’s overall economic landscape. From 2010 to 2020, the economic score of the Hangzhou urban area steadily rose from 0.503 to 0.914. In contrast, Chun’an County’s overall index dropped from 0.294 to 0.241, primarily attributed to a significant reduction in economic structure indices from 2016 to 2020. The indices of Jiande and Tonglu County increased from 2010 to 2016, demonstrating positive economic development during this period; however, the economic benefits have declined slightly in recent years, resulting in insufficient overall economic development.
From 2010 to 2020, the changes in Hangzhou’s ecological environment index were different from the orderly state of the economic development index, experiencing declines in multiple years. Nonetheless, the overall trend revealed that by 2020, the index for each region surpassed that of 2010 (Figure 4). Notably, Jiande stands out as having a well-maintained ecological environment, as its comprehensive index steadily rose from 0.387 to 0.618. In contrast to the economic system, the ecological environment index of Hangzhou urban area remained at a lower level and declined slightly from 2010 to 2014. However, in recent years, Hangzhou has gradually intensified its commitment to ecological protection and environmental construction, leading to a notable upswing in comprehensive scores across all regions from 2018 to 2020.

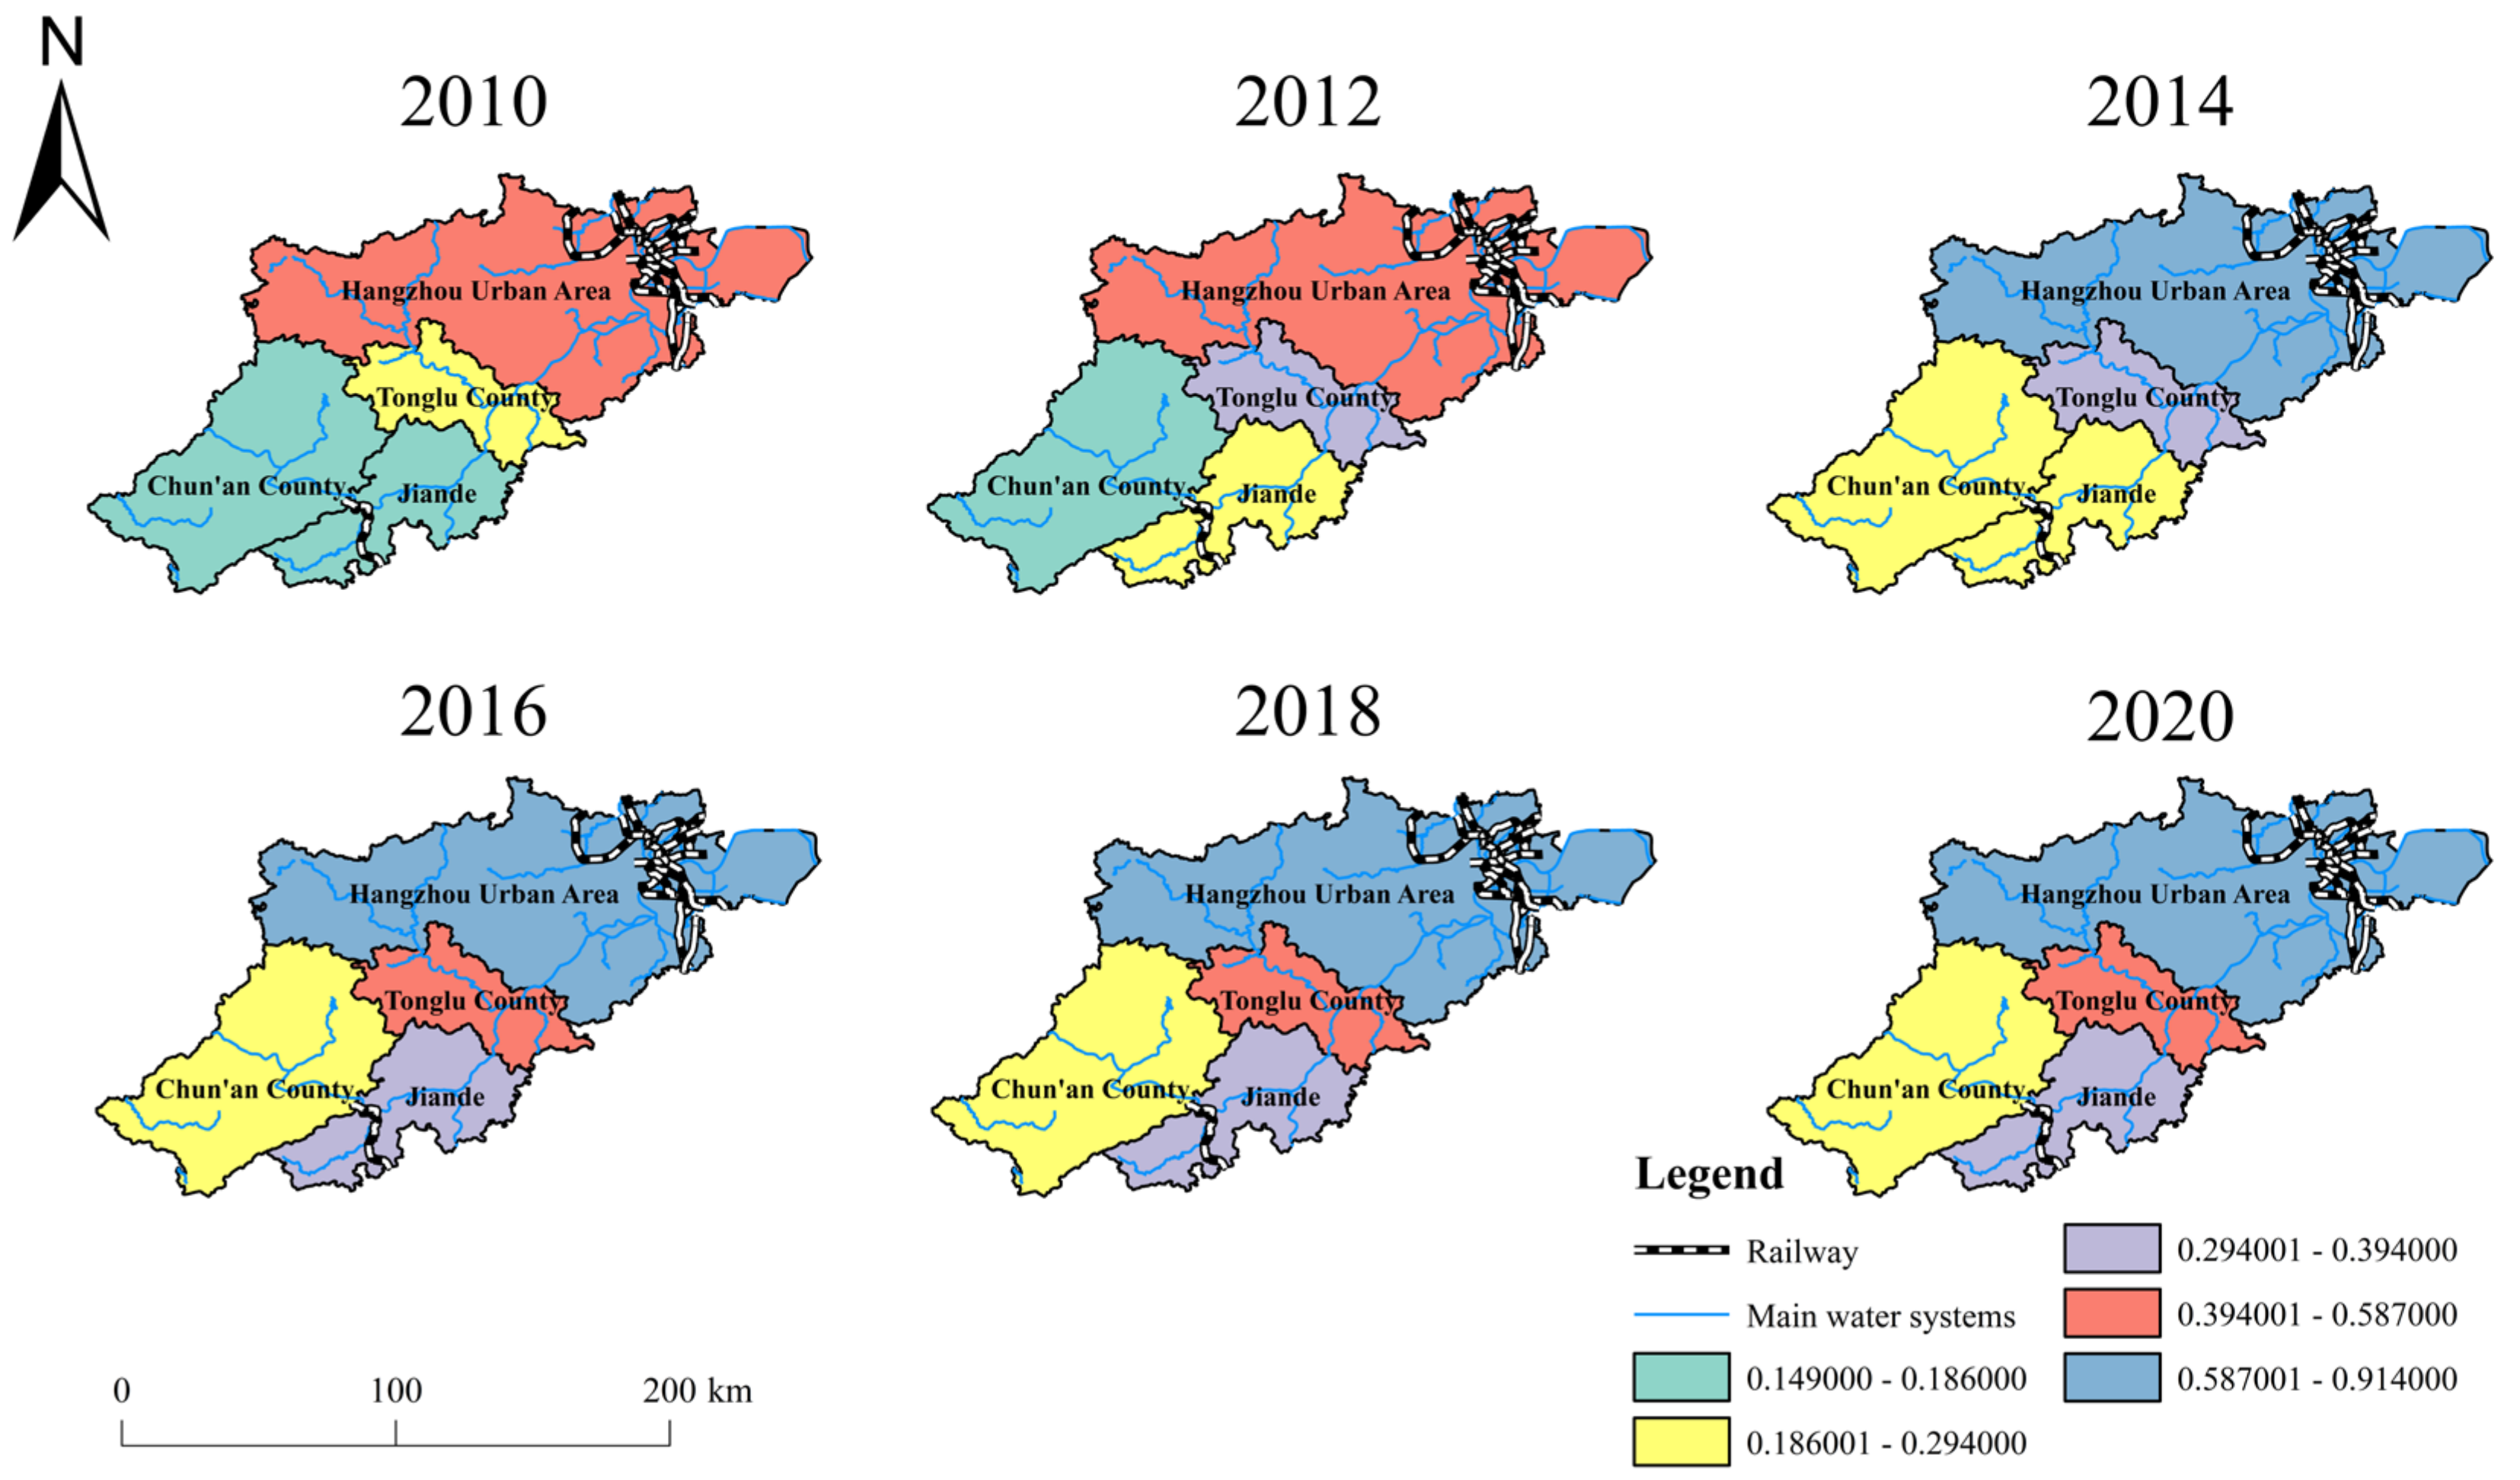
3.2.2. Spatial Features

From a spatial perspective, the economic development index of Hangzhou exhibited a gradual decline from the northeast to the southwest between 2010 and 2020 (Figure 5). Chun’an County and Hangzhou urban area represented the two extremes, situated in the east and west, respectively. As the city’s growth pole, the Northeast region led to the development of the Southwest region from 2010 to 2016. However, from 2016 to 2020, the economic development intensity of the Southwest region dwindled, resulting in a decrease in the economic index. In contrast, the spatial pattern of the ecological environment index diverged significantly from the economic index (Figure 6). Hangzhou urban area ranked at the end of the region in all six periods, belonging to the low-value zone of the ecological environment index. Chun’an County and Jiande are affected by the Qiandao Lake Ecological Zone. The ecological level is much higher than that of the densely populated and environmentally challenged developed areas in the northeast. The ecological environment level exhibits a spatial pattern of gradual decrease from the southwest to the northeast, opposing the economic spatial pattern.

3.3. Spatiotemporal Differentiation Characteristics of CCD

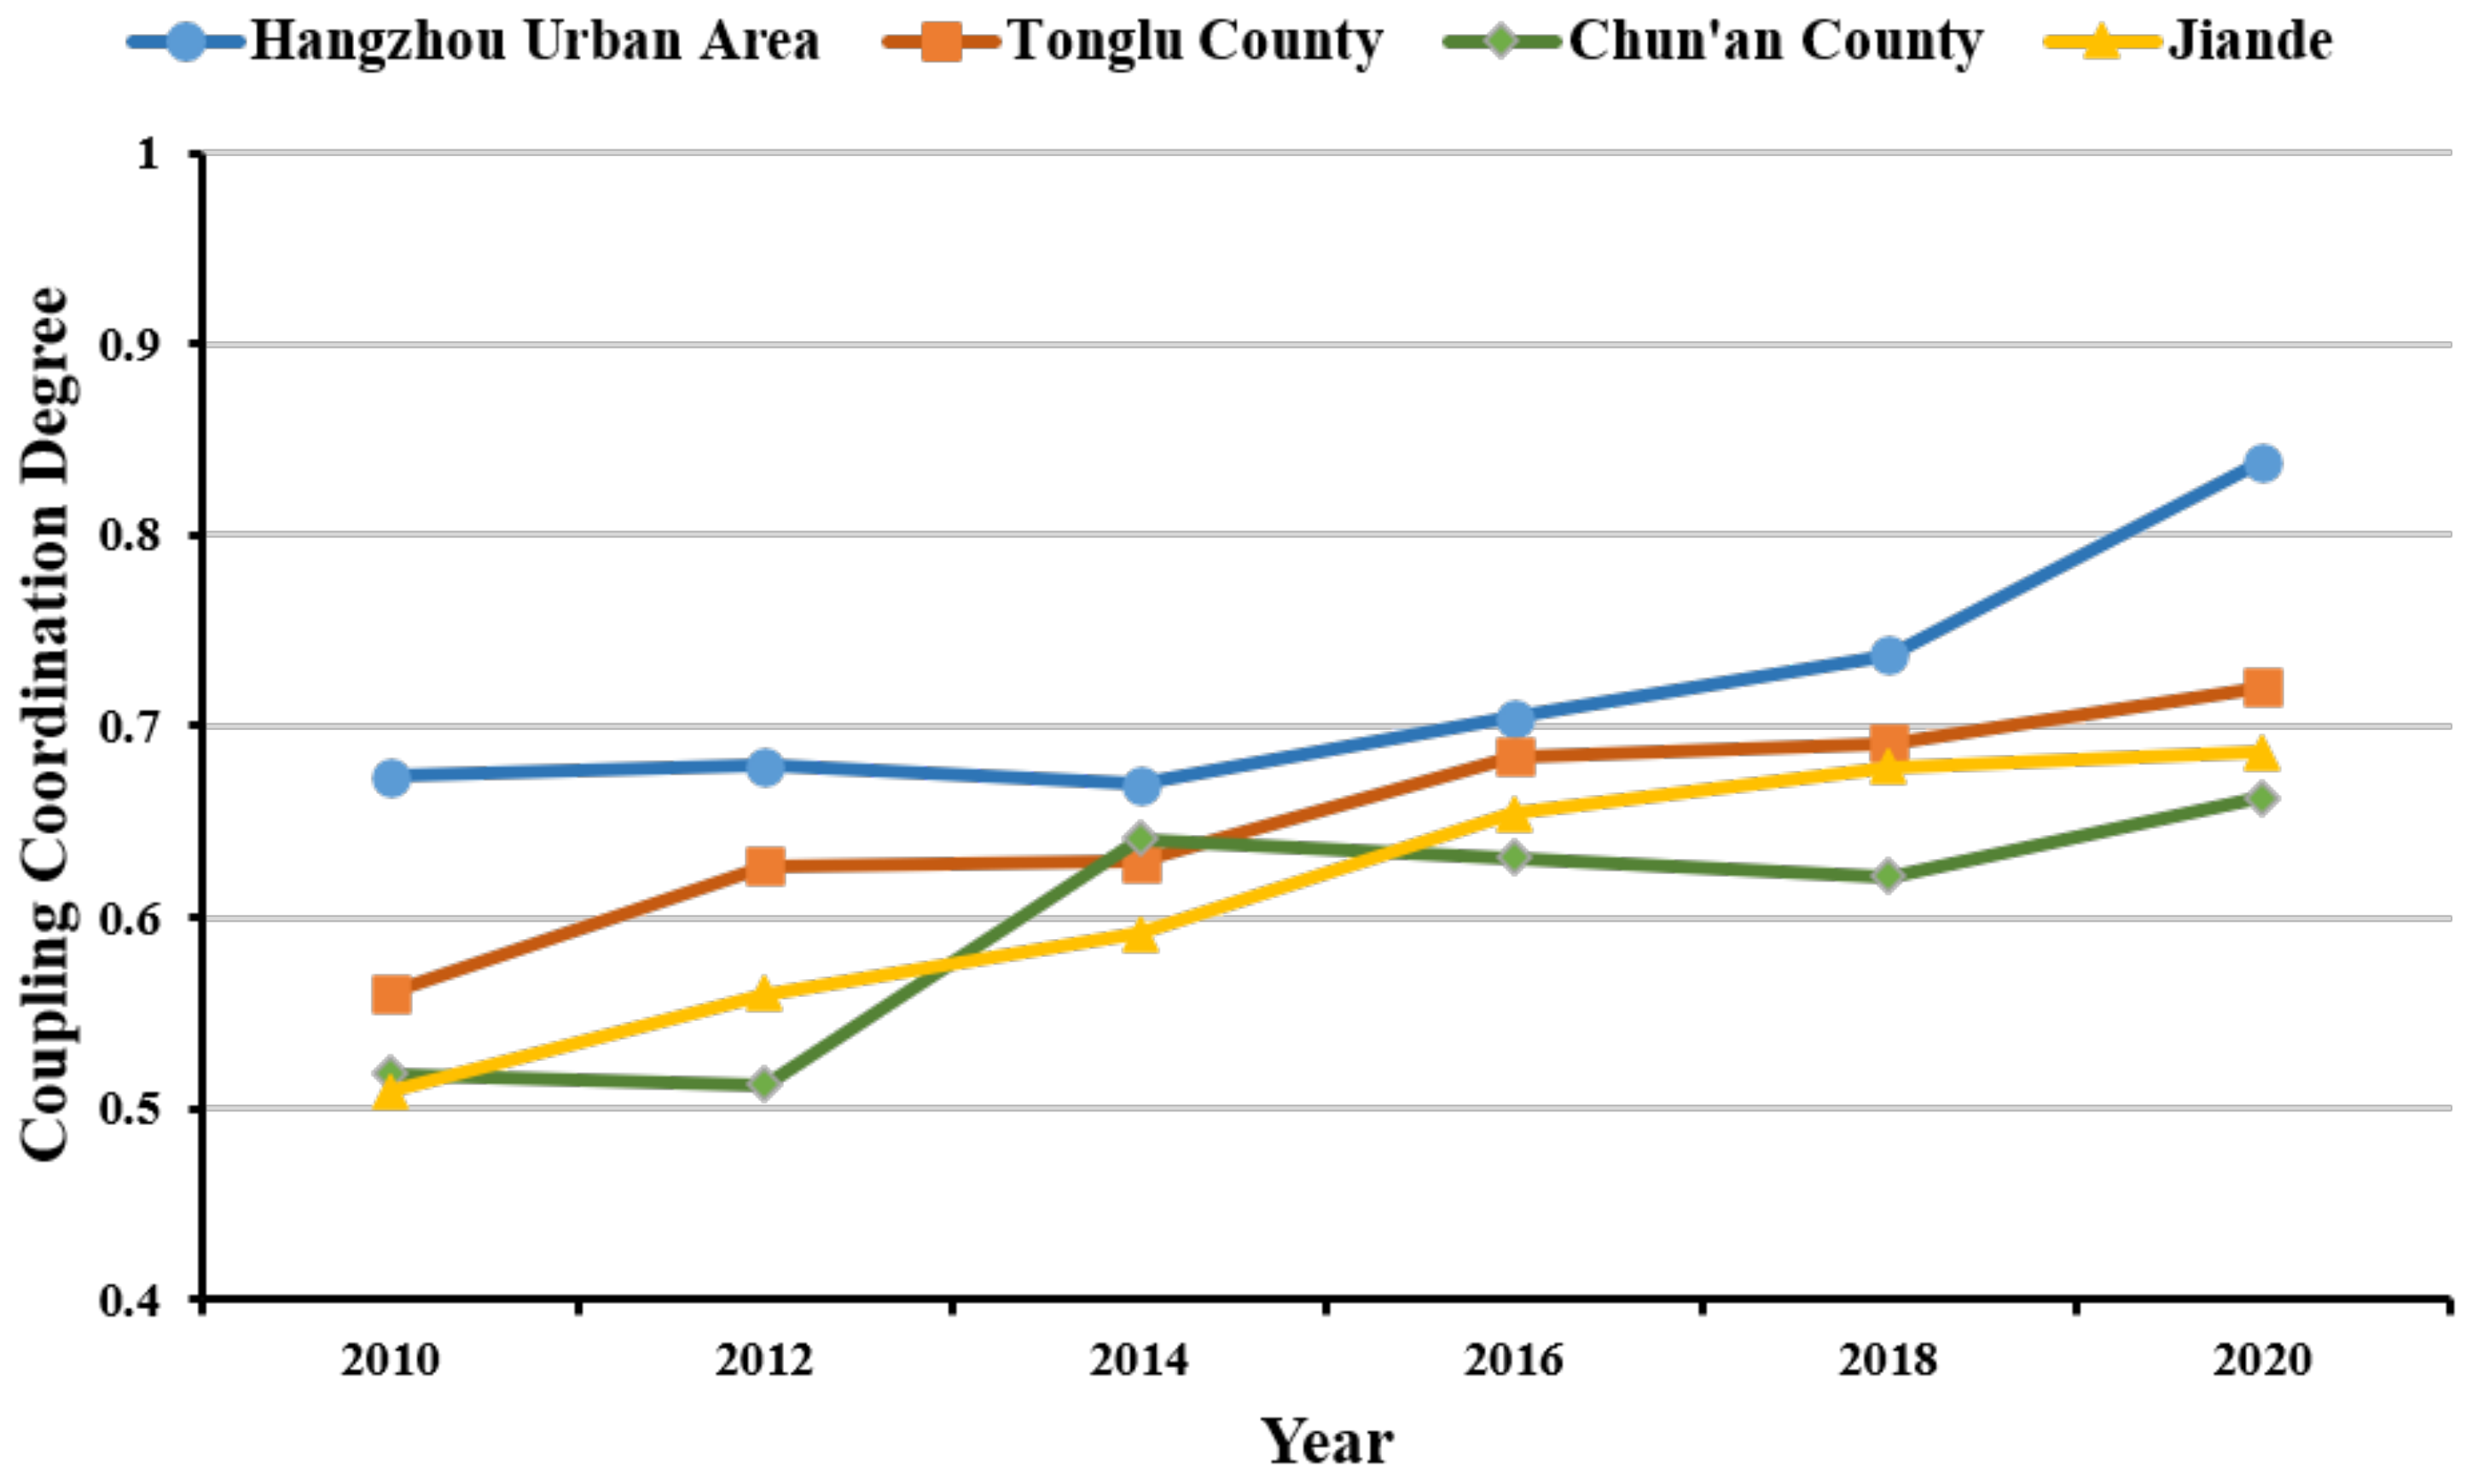
3.3.1. Timing Changes

Based on the comprehensive score value of the subsystem, the CCD of the ecological–economic system of Hangzhou urban area and two counties and one city from 2010 to 2020 was calculated (Table 4).
All four districts of Hangzhou were in the moderate coupling coordination stage in 2010. Despite the lingering environmental pressure, economic development at this time entered a phase of “steady growth and structural adjustment”, which led to an improvement in the coupling state of the ecological–economic system. Fast forward to 2020, Hangzhou urban area progressed from slightly coordinated development to superiorly coordinated development, boasting a CCD of 0.838, significantly surpassing other regions. Tonglu County’s CCD increased by 0.16, transitioning from barely coordinated development to favorably coordinated development but still in the high coupling coordination stage. Chun’an County and Jiande developed from barely coordinated development to slightly coordinated development, with an improvement but not significant. In summary, the CCD of ecological–economic systems across various regions generally exhibited an upward trend over the past decade (Figure 7), signifying a positive interplay between ecological protection and economic development. However, there were instances where the CCD either declined or exhibited slow increments, primarily attributed to the rapid decline in the comprehensive index of regional ecological or economic subsystems during those periods.

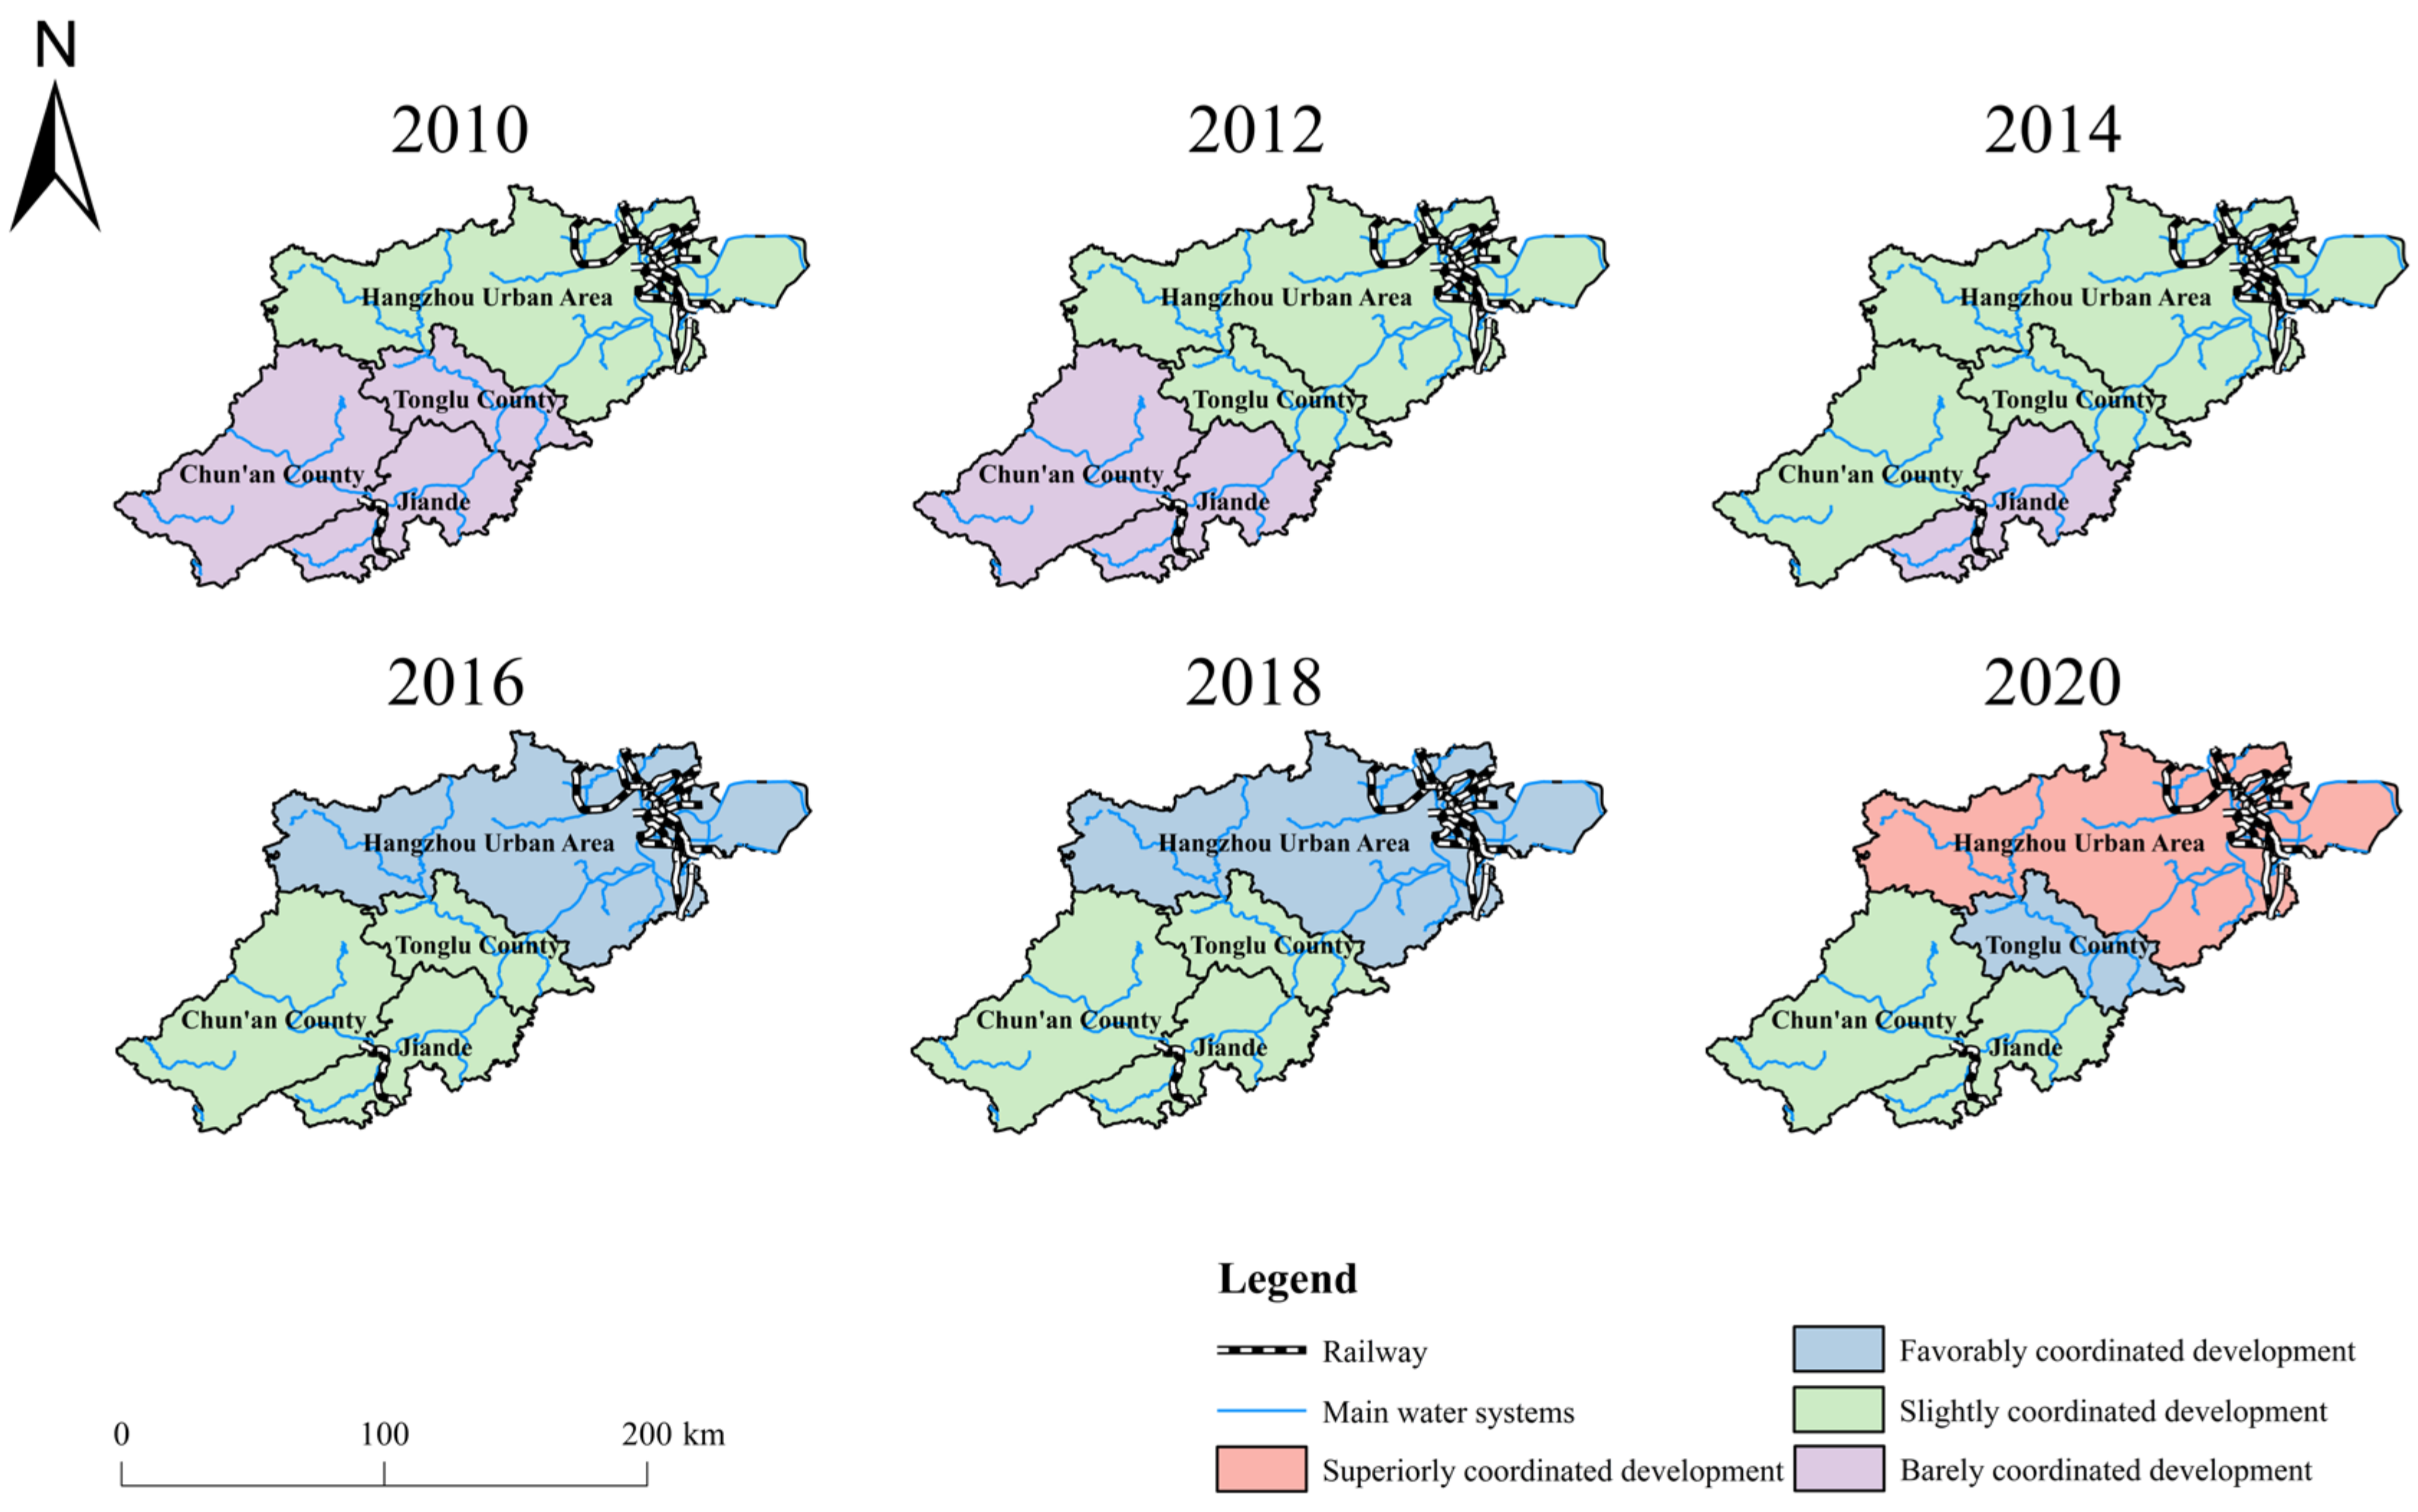
3.3.2. Spatial Differentiation Characteristics

During the study period, areas characterized by high coupling coordination were primarily concentrated in the northeast, gradually extending their influence toward the southwest over time (Figure 8). The CCD in the southwest region increased slowly from 2014 to 2020. This can be attributed to the region’s lower economic development level and heightened pressure on the ecological environment. Despite having a favorable ecological background, the economic lag hindered overall CCD advancement in the southwest region.
While the northeast region eventually demonstrated positive changes in CCD, deficiencies in the ecological development process significantly impeded CCD enhancement. An illustrative example is Tonglu County, which has faced sluggish progress in the ecological environment system in recent years, even encountering ecological lag in 2018. Overall, although Hangzhou boasts relatively favorable ecological conditions, its pace of improvement has lagged behind its economic development system over the past decade, resulting in a slow development of coupling and coordination between the two systems.

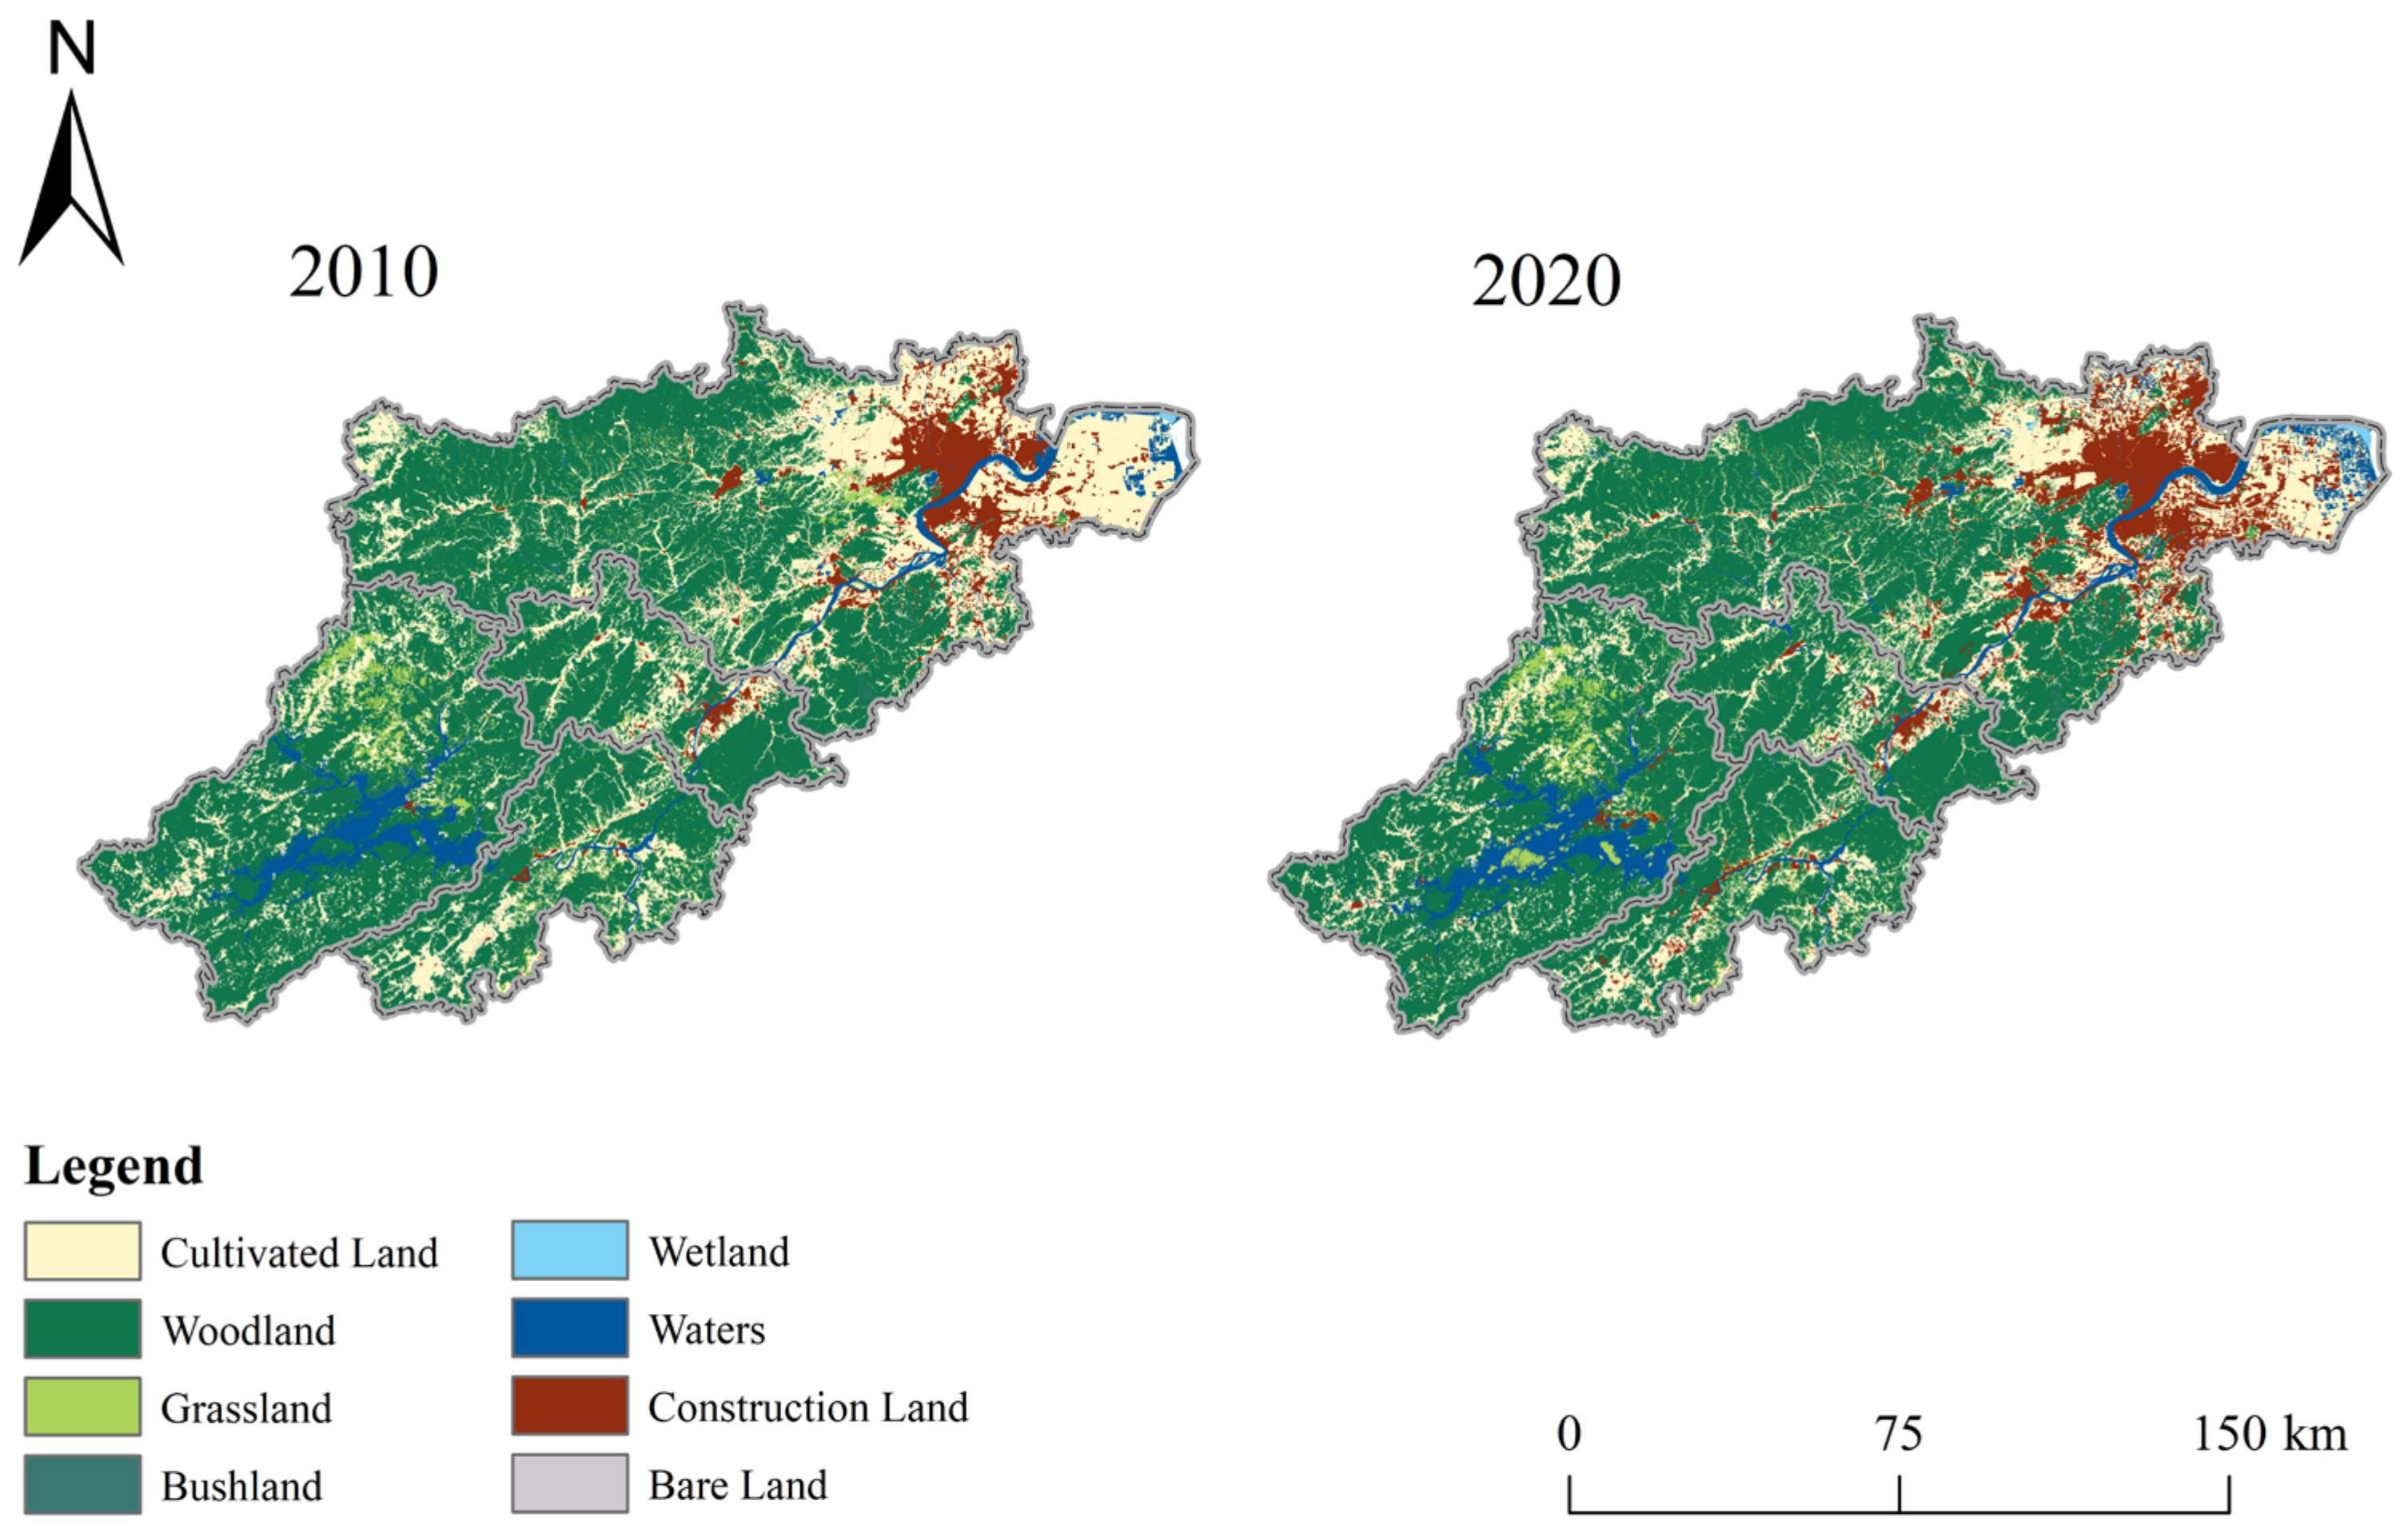
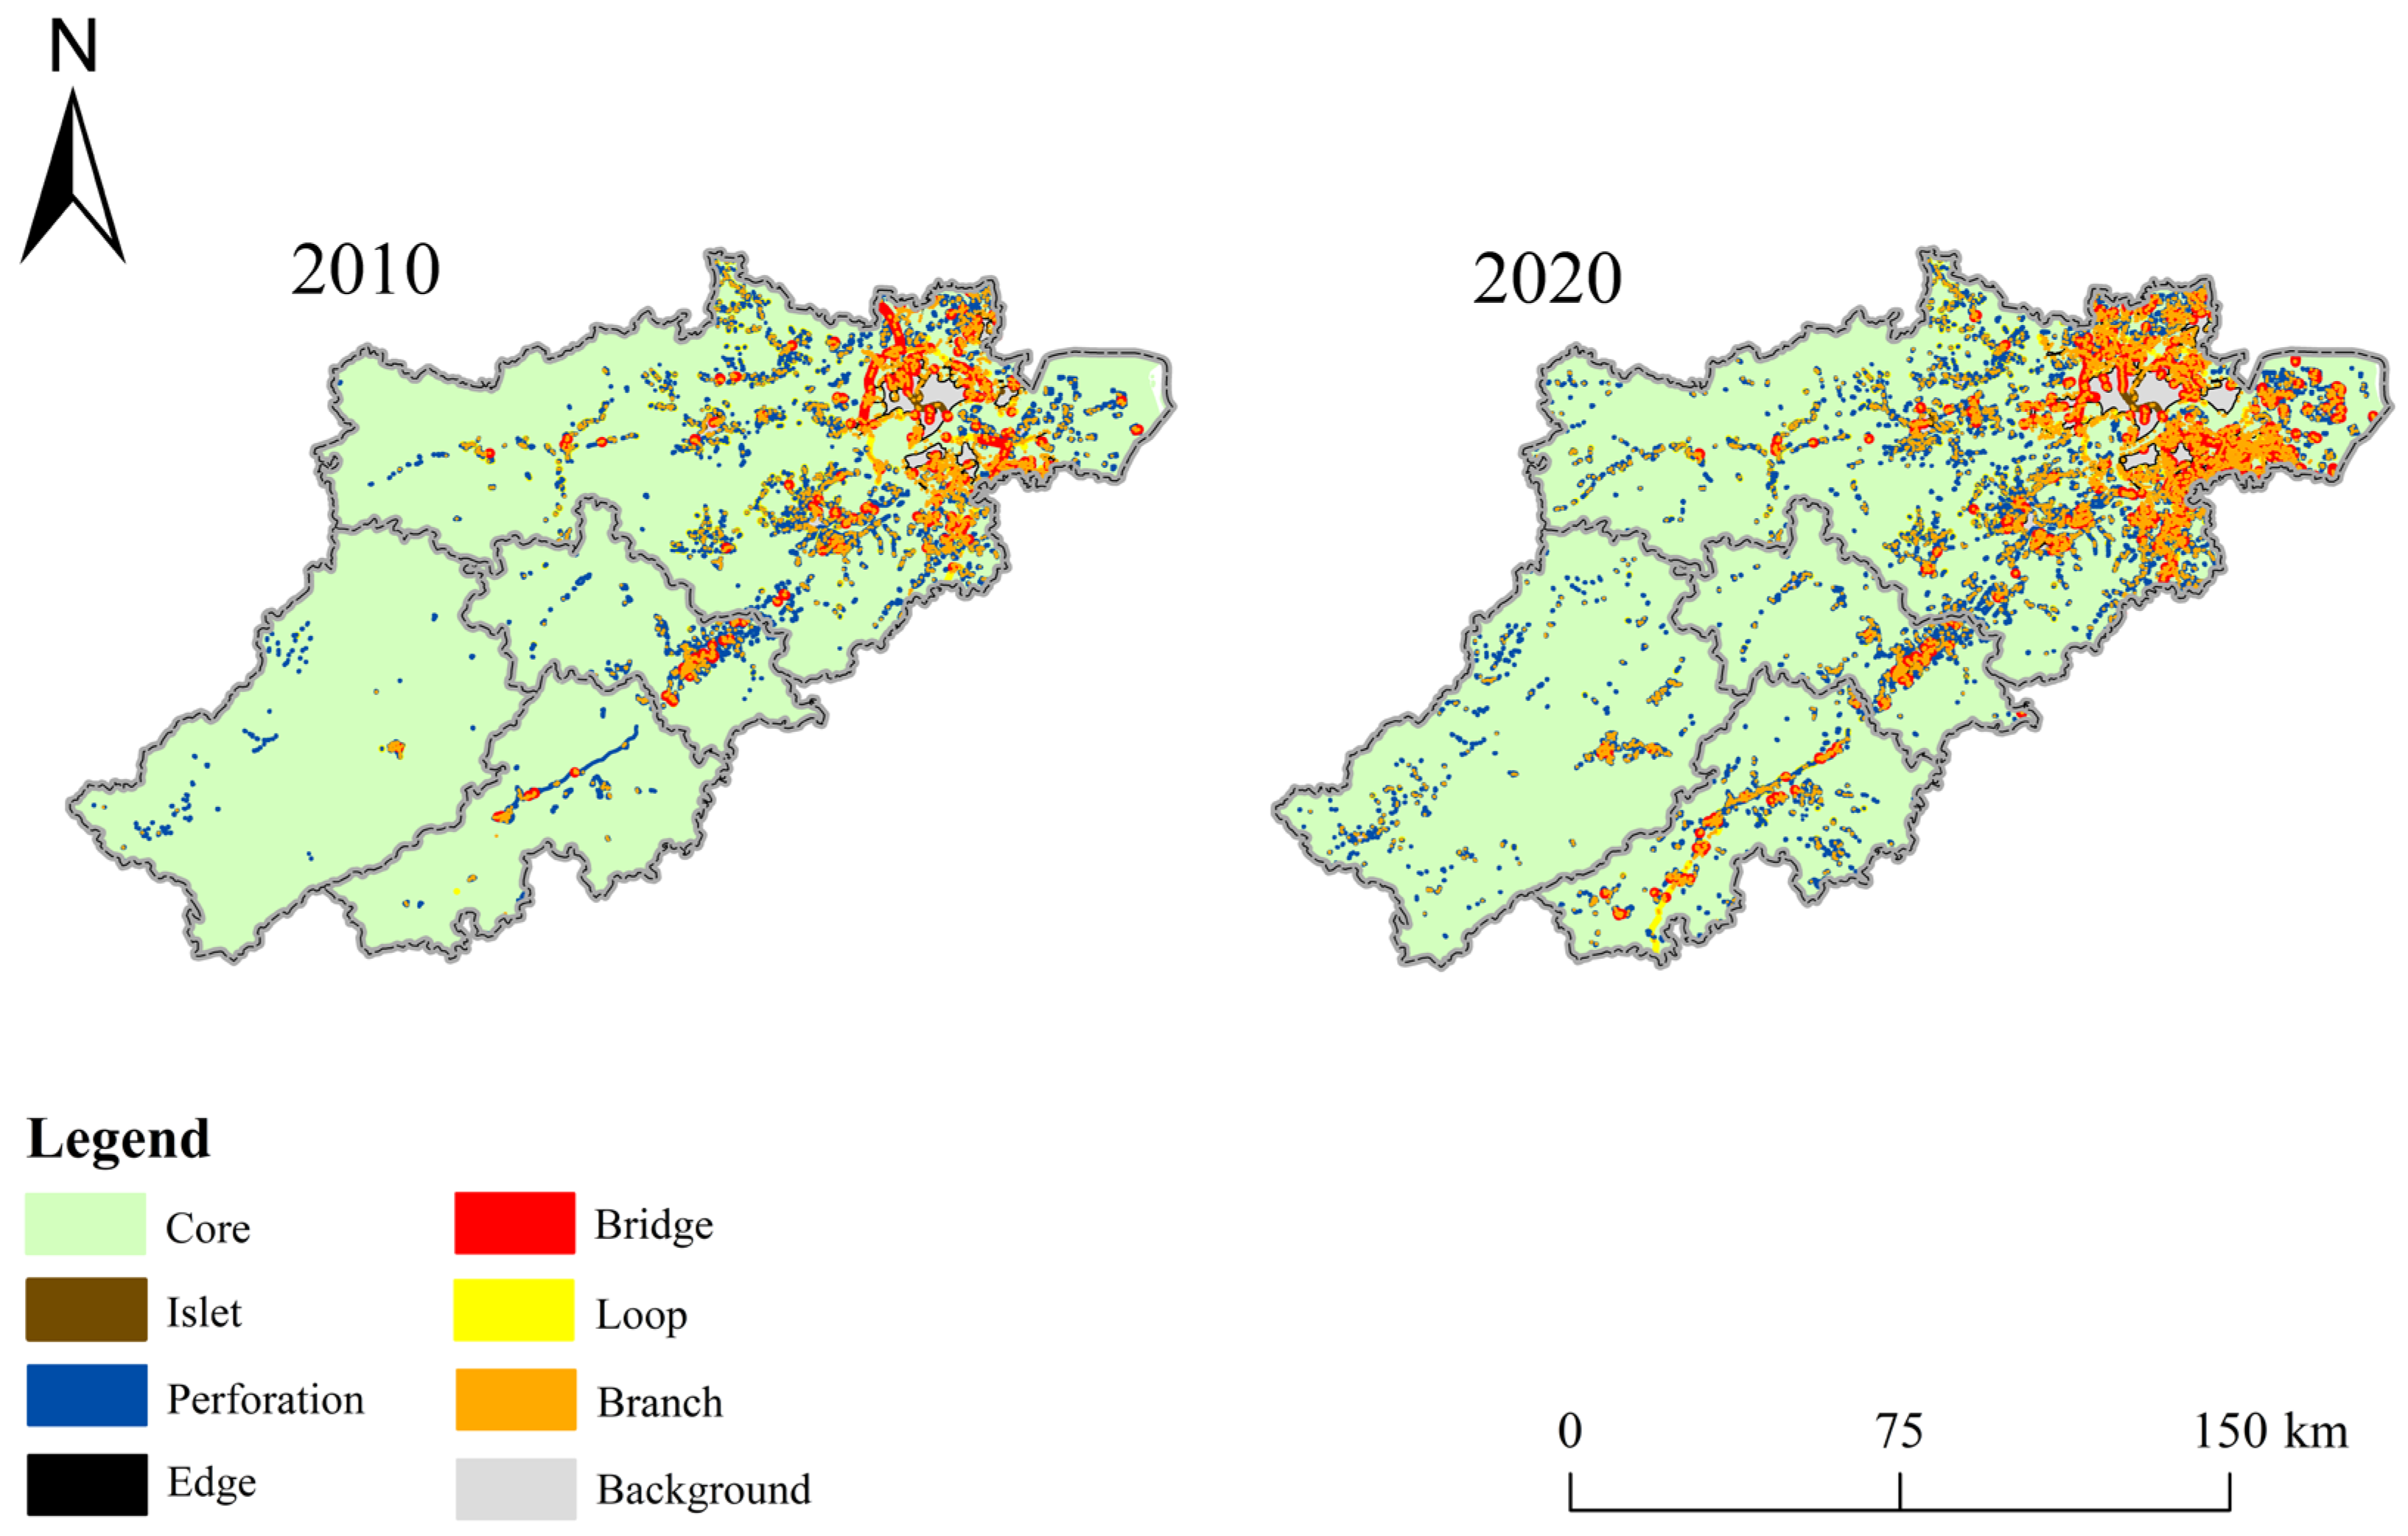
3.4. Changes in the Morphological Spatial Pattern of Hangzhou City

Through the analysis of panel data, we concluded that the coordinated development of Hangzhou’s ecological–economic system increased, but the ecological environment cannot maintain stable development. So, can changes in the ecological spatial pattern support this view? We conducted MSPA analysis on Hangzhou’s land use status data in 2010 and 2020. This analysis unveils both quantitative and spatial changes in landscape elements, offering insights into the impact of the interplay between economic development and the ecological environment on the spatial landscape pattern.
From 2010 to 2020, there was a notable acceleration in the expansion of urban residential and industrial land across various regions, particularly in Hangzhou urban area (Figure 9), with the total area increasing from 90,121.95 hm2 to 144,528.48 hm2. The development space of ecological land such as grassland and woodland was squeezed out, and the encroachment on the overall ecological space of the region was not significantly alleviated. Although the area of woodland and grassland near some water bodies increased due to ecological restoration, the problem of ecological security space construction still exists.
Based on MSPA analysis, Hangzhou’s Core is concentrated in most areas in the southwest and a small part of the northeast. The Background, which has no ecological benefits, is predominantly found in the main urban area in the northeast, while the remainder is distributed within the Perforation (Figure 10). Examining the time series (Table 5), the areas of Bridge and Branch increased from 183.15 hm2 and 1511.73 hm2 in 2010 to 462.78 hm2 and 2684.34 hm2 in 2020. This significant expansion facilitated species migration, energy flow, and network formation within the region. But at the same time, the Background in the northeastern part of Hangzhou City expanded rapidly, resulting in a large number of core areas being replaced, and the total area decreased by 3.939%. Furthermore, there was a notable increase in Perforation in the northern Chun’an County, central Jiande, and other areas, exacerbating the regional ecological pattern of fragmentation.

4. Discussion

The coordinated development of the ecology and economy is a crucial component in achieving sustainable development. Existing research has proven that with the continuous development of China’s economy and society, the coupling coordination between ecology and economy is steadily increasing and showing a gradual mutual promotion [42,43,44]. This paper’s research supports these findings. The average CCD in Hangzhou witnessed an increase from 0.566 to 0.727 between 2010 and 2020, indicating a positive interaction between ecological protection and economic development. On the one hand, since 2010, China’s economic growth has decelerated, prompting a shift from extensive growth to high-quality development. Simultaneously, increased attention has been directed towards the urban ecological environment [45]. On the other hand, regions have successfully integrated economic development with ecological protection. Through eco-tourism, rural complex construction and other means, a development model has emerged, wherein economic benefits are derived from environmental protection [46,47].
Several research outcomes indicate that the socio-economic development speed in most areas of China is much faster than the ecological environment construction speed, and the problem of unbalanced development is still prominent [48,49]. This paper substantiates the presence of this phenomenon in Hangzhou through an examination of its ecological–economic system. Firstly, the CCD in Hangzhou urban area surpasses that of other regions in both value and development speed, indicating a substantial imbalance in regional development. Secondly, the ecological environment system index of each region cannot maintain a stable improvement, and economic development has a certain negative impact on the ecological environment. Especially in the early stages of the study period (2010–2014), the ecological environment index in various locations experienced a decline, primarily attributed to an unreasonable industrial structure and a prioritization of high-input and high-consumption industries. Finally, in various regions, the insufficient development level of individual subsystems leads to a decline or slow improvement in coupling coordination. From the perspective of the subsystem comprehensive index, it becomes apparent that the hindrance to coupling coordination in Hangzhou urban area and Tonglu County stems from an ecological deficit. Conversely, Chun’an County and Jiande face impediments due to a sustained downturn in economic development. Hangzhou urban area, serving as the city’s developmental nucleus, experiences rapid expansion in housing, industry, and other sectors, placing substantial strain on resources and the environment. Tonglu County is adjacent to Hangzhou urban area, but its economic foundation is relatively weak. It faces more prominent contradictions such as structural adjustment and industrial transformation and upgrading. In 2020, the reduction rate of energy consumption per unit GDP was −1.8, resulting in greater environmental pressure. Chun’an County and Jiande are located near the Qiandao Lake Ecological Zone. Affected by the mountainous terrain and ecological protection policies, the urbanization level is difficult to reach the scale of the northeastern region. They are counties with relatively backward economic development in Hangzhou City. In recent years, China’s economic transformation has been marked by a deceleration in the growth rates of the GDP in the secondary and tertiary industries. This economic shift has been particularly impactful on Chun’an and Jiande, resulting in the slow development of coupling coordination. The low degree of regional coupling coordination results from the underdeveloped state of ecological or economic subsystems. This necessitates the implementation of differentiated policy measures across diverse regions.
The changes in Hangzhou’s ecological pattern reflect the impact of coupling coordination features on landscape space. The improvement in the economic level effectively feeds back to the ecological environment. The augmentation and refinement of ecological corridors within the region signify the synchronized development of Hangzhou’s ecological–economic system. However, the decrease in the Core area also elucidates the rationale behind the decline in the ecological environment index within the coupled system. Urban development needs to reduce the pressure brought by urban expansion on the ecological environment while building ecological corridors.
From 2010 to 2020, the CCD in Hangzhou showed an overall upward trend, from running-in to coordinated development, and the interaction between subsystems continued to increase. This evolutionary process is in line with the policy practices of “high-quality development” adopted by the Chinese government, confirming that the index system of this study is effective. Therefore, this study can provide a reference for scholars in similar fields to construct an index system for future research. In addition, the coupling coordination characteristics and landscape pattern mutually confirm each other, proving that the integrated method of coupling coordination model and geospatial analysis is of comprehensive and important significance in revealing the relationship between the two subsystems.
However, this study is not without its shortcomings. The index system construction lacks comprehensiveness, the coupling mechanism between the ecological environment and economic development remains unclear, and certain judgments appear overly subjective. Subsequent research could delve deeper into the following aspects: Firstly, there is a need for refinement in the judgment dimension. While this article establishes a foundation for assessing the coupling status of the ecological environment and economic development, the concept of coupling is nuanced, encompassing changing trends and action paths that are crucial for reflecting the relationship between the ecological environment and economic development. To accurately assess coupling situations in the study area, researchers and decision makers should construct indicators or methods that consider multiple dimensions when judging coupling relationships. Secondly, it should elaborate on the coupling mechanism between the ecological environment and economic development. With the exception of municipal districts, the ecological environment and economic development systems in other areas of Hangzhou exhibit limited resonance. Further research is required to address how to ensure economic development while enhancing ecological levels and achieving coordinated development between the two. Finally, future research endeavors could explore quantifying the impact of ecological–economic system development on landscape spatial changes. Although this article introduces landscape pattern analysis, it predominantly relies on subjective judgments. Employing mathematical methods to derive quantitative results would enhance the reliability of the research.

5. Conclusions and Policy Implications

5.1. Conclusions

Based on the land use data and ecological and economic-related statistical data of four regions in Hangzhou from 2010 to 2020, this article explores the coupling coordination characteristics of Hangzhou and its impact on the ecological spatial pattern. On the one hand, from 2010 to 2020, ecological protection and economic development in Hangzhou showed positive interaction characteristics, and the system developed in a coordinated direction. On the other hand, Hangzhou’s regional development is unbalanced, the ecological level cannot maintain a stable improvement, and the development level of a single subsystem in each region hinders the coupling and coordination of the two parties. The increase in the area in ecological corridors and the decrease in the area of ecological core areas further prove the coexistence of synergy and antagonism between the two major systems in Hangzhou at this stage. Research shows that the lag in either the ecological environment or economic development will affect the CCD. In the process of urban development, developing countries should improve the lagging side of the ecological–economic system and pay more attention to the negative impact of economic development on the ecological environment, which is the key to achieving the SDGs.
This study innovatively established an index system, verified the coupling relationship between the ecological environment and economic development, and introduced landscape pattern changes into the study of the coordinated relationship between economic development and ecological environment, allowing panel data and spatial data analysis results to mutually corroborate each other. These methods can be employed to investigate cities that are also in the process of rapid economic development. By doing so, we can ascertain the coupling coordination status within their ecological–economic systems, and provide help in promoting sustainable urban development.

5.2. Policy Recommendations

First, in areas such as Tonglu, where ecological development lags behind in the coupled system, the government should intensify efforts in ecological protection and environmental management. Furthermore, increased financial support for ecological protection and restoration from economic development is crucial. Urban planning should underscore the significance of ecological restoration, with a particular focus on controlling environmental pollution stemming from urban expansion. Addressing highly polluting enterprises, promoting the development of clean energy, and eliminating industries with adverse effects on the ecological environment are imperative steps. Rigorous adherence to ecological protection red lines and urban development boundaries, coupled with measures to control population and construction density, is essential. Additionally, the suspension of the unnecessary construction of man-made attractions is advised.
Second, in areas such as Chun’an and Jiande, experiencing economic development lag in the coupled system, a different approach is warranted. The emphasis should be on concurrently enhancing the value of cultural landscapes and promoting economic development. This can be achieved by establishing an interconnected network encompassing wetlands, woodlands, greenways, and transportation to form a comprehensive tourism pattern. The quality of tourism can be significantly elevated through the cultivation of distinctive ecological tourism, which, in turn, generates ecological and environmental economic benefits.
Finally, we must ensure the natural connectivity of ecological resources during the urbanization process. On the one hand, we must focus on delineating the urban boundaries by strictly adhering to ecological protection red lines and urban development boundaries. We must implement measures to control population and construction density, and formulate ecological restoration plans covering 5–10 years to maintain and optimize the ecological buffer space around the city. This strategy aims to safeguard natural resources, enhance vegetation coverage, and ensure the ecosystem’s robust self-healing capabilities. On the other hand, we must consider the natural geographical environment of the region comprehensively. We must establish connections between suburban recreational greenways linking towns to construct a landscape axis within the central city area. We must transform roundabouts within each town into ecological corridors to improve connectivity between ecological patches. Ultimately, we must eextend the ecological corridor network to create a comprehensive system of urban green belts. This network can be integrated with existing ecological resources to establish national geological parks, forest parks, and other urban parks.

Author Contributions

Conceptualization, J.N.; Investigation, Y.Z. (Yunhe Zhang); Data curation, J.N. and Y.Z. (Yuman Zheng); Writing—original draft, J.N.; Writing—review & editing, X.Z. and H.L. All authors have read and agreed to the published version of the manuscript.

Funding

This research was funded by the National Social Science Fund of China (No. 19BZZ099).

Institutional Review Board Statement

Not applicable.

Informed Consent Statement

Not applicable.

Data Availability Statement

Data is contained within the article.

Conflicts of Interest

The authors declare no conflict of interest.

References

  1. Anand, J.; Gosain, A.K.; Khosa, R. Prediction of land use changes based on Land Change Modeler and attribution of changes in the water balance of Ganga basin to land use change using the SWAT model. Sci. Total Environ. 2018, 644, 503–519. [Google Scholar] [CrossRef]
  2. Venticinque, E.; Forsberg, B.; Barthem, R.; Petry, P.; Hess, L.; Mercado, A.; Canas, C.; Montoya, M.; Durigan, C.; Goulding, M. An explicit GIS-based river basin framework for aquatic ecosystem conservation in the Amazon. Earth Syst. Sci. Data 2016, 8, 651–661. [Google Scholar] [CrossRef]
  3. De Graaff, J.; Amsalu, A.; Bodnar, F.; Kessler, A.; Posthumus, H.; Tenge, A. Factors influencing adoption and continued use of long-term soil and water conservation measures in five developing countries. Appl. Geogr. 2008, 28, 271–280. [Google Scholar] [CrossRef]
  4. Cooke, J.; Johnson, M. Ecological restoration of land with particular reference to the mining of metals and industrial minerals: A review of theory and practice. Environ. Rev. 2002, 10, 41–71. [Google Scholar] [CrossRef]
  5. Fischer, L.K.; von der Lippe, M.; Rillig, M.C.; Kowarik, I. Creating novel urban grasslands by reintroducing native species in wasteland vegetation. Biol. Conserv. 2013, 159, 119–126. [Google Scholar] [CrossRef]
  6. Thompson, D.G.; Pitt, D.G. A review of Canadian forest vegetation management research and practice. Ann. For. Sci. 2003, 60, 559–572. [Google Scholar] [CrossRef]
  7. Myers, N.; Mittermeier, R.A.; Mittermeier, C.G.; Da Fonseca, G.A.; Kent, J. Biodiversity hotspots for conservation priorities. Nature 2000, 403, 853–858. [Google Scholar] [CrossRef]
  8. Tamayo, U.; Vargas, G. Biomimetic economy: Human ecological-economic systems emulating natural ecological systems. Soc. Responsib. J. 2019, 15, 772–785. [Google Scholar] [CrossRef]
  9. Qiu, M.; Zuo, Q.T.; Wu, Q.S.; Yang, Z.L.; Zhang, J.W. Water ecological security assessment and spatial autocorrelation analysis of prefectural regions involved in the Yellow River Basin. Sci. Rep. 2022, 12, 5105. [Google Scholar] [CrossRef]
  10. Liu, Y.; Zhou, X.; Zhang, Q.Y.; Zeng, L.X.; Kang, Y.; Luo, J.W. Study on sustainable developments in Guangdong Province from 2013 to 2018 based on an improved ecological footprint model. Sci. Rep. 2022, 12, 2310. [Google Scholar] [CrossRef]
  11. Mao, F.; Miller, J.D.; Young, S.L.; Krause, S.; Hannah, D.M. Inequality of household water security follows a Development Kuznets Curve. Nat. Commun. 2022, 13, 4525. [Google Scholar] [CrossRef]
  12. Grossman, G.M.; Krueger, A.B. Environmental Impacts of a North American Free Trade Agreement; National Bureau of Economic Research: Cambridge, MA, USA, 1991. [Google Scholar]
  13. Dogan, E.; Inglesi-Lotz, R. The impact of economic structure to the environmental Kuznets curve (EKC) hypothesis: Evidence from European countries. Environ. Sci. Pollut. Res. 2020, 27, 12717–12724. [Google Scholar] [CrossRef]
  14. Chen, S.; Saleem, N.; Bari, M.W. Financial development and its moderating role in environmental Kuznets curve: Evidence from Pakistan. Environ. Sci. Pollut. Res. 2019, 26, 19305–19319. [Google Scholar]
  15. Yan, G.Q.; He, Y.C.; Zhang, X.H. Green technological progress, agricultural economic growth and pollution space spillovers: Evidence from the use of agricultural water resources in China. Yangtze River Basin Resour. Environ. 2019, 28, 2921–2935. [Google Scholar]
  16. Zhang, Q.Y.; Zhang, Y.L.; Pan, B.B. An analysis of the influencing factors of China’s economic growth and carbon emissions in the 40 years of reform and opening. Arid Area Resour. Environ. 2019, 33, 9–13. [Google Scholar]
  17. Liu, K.; Qiao, Y.R.; Shi, T.; Zhou, Q. Study on coupling coordination and spatiotemporal heterogeneity between economic development and ecological environment of cities along the Yellow River Basin. Environ. Sci. Pollut. Res. 2021, 28, 6898–6912. [Google Scholar] [CrossRef]
  18. Cui, P.P.; Zhao, Y.; Xia, S.Y.; Yan, J.Y. Level measures and temporal and spatial coupling analysis of ecological environment and high quality development in the Yellow River Basin. Econ. Geogr. 2020, 40, 49–57+80. [Google Scholar]
  19. Chu, Y.; Fu, J.B.; Chen, H.J. Temporal and spatial evolution of the coupling coordination of the high-quality development of regional ecological environment and economy: Taking Henan province for example. Ecol. Econ. 2022, 38, 161–168. [Google Scholar]
  20. Feng, Y.J.; Zhu, A.K.; Liu, P.; Liu, Z.L. Coupling and coordinated relationship of water utilization, industrial development and ecological welfare in the Yellow River Basin, China. J. Clean. Prod. 2022, 379, 134824. [Google Scholar] [CrossRef]
  21. Zhang, Z.Q.; Lao, Y.L.; Hu, B.Q.; Wei, J.H. Understanding the coupling coordination mechanism between urbanization and territorial spatial ecological restoration in “revolutionary-minority-border-montanic-poverty” regions. J. Agric. Resour. Environ. 2020, 37, 882–893. [Google Scholar]
  22. Wei, W.; Shi, P.J.; Wei, X.X.; Zhou, J.J.; Xie, B.B. Evaluation of the coordinated development of economy and eco-environmental systems and spatial evolution in China. Acta Ecol. Sin. 2018, 38, 2636–2648. [Google Scholar]
  23. He, W.J.; Yang, M.; Yuan, L.; Lv, Y.Y.; Cui, Y. Ecological and economic evaluation of Wuling Mountain area using the entropy method. Ecol. Sci. 2016, 35, 143–149. [Google Scholar]
  24. Xiang, J.W.; Wan, S.; Hu, S.G. Research on factor contribution degree of coordinated development in Wuhan’s eco-economic system. J. China Univ. Geosci. (Soc. Sci. Ed.) 2015, 15, 30–36+167–168. [Google Scholar]
  25. Wang, Z.; Liu, J.H.; Li, T.S.; Ruan, Z.; Wu, F.Q. Analysis of the coupling relationship between ecological vulnerability and economic poverty in Qinling-Dabashan contiguous poor areas: A case study of Shanyang County in Shaanxi Province, China. Acta Ecol. Sin. 2019, 39, 3908–3917. [Google Scholar]
  26. Sun, Y.; Cheng, Q.G.; Li, Y.; Fu, J. Assessment of eco-economic system sustainable development of Liaoning Province based on emergy analysis. Chin. J. Appl. Ecol. 2014, 25, 188–194. [Google Scholar]
  27. Liu, C.L.; Yan, Q.; Luo, J. System dynamics simulation on the coupling of economy resources environment system in Wuhan Metropolitan Region. Geogr. Res. 2013, 32, 857–869. [Google Scholar]
  28. Zhang, Q.; Shen, J.; Sun, F. Spatiotemporal differentiation of coupling coordination degree between economic development and water environment and its influencing factors using GWR in China’s province. Ecol. Model. 2021, 462, 109794. [Google Scholar] [CrossRef]
  29. Zhang, K.; Dong, Z.; Guo, L.; Boyer, E.W.; Liu, J.; Chen, J.; Fan, B. Coupled coordination spatiotemporal analyses inform sustainable development and environmental protection for the Yellow River Basin of China. Ecol. Indic. 2023, 151, 110283. [Google Scholar] [CrossRef]
  30. Hein, L.; Van Koppen, K.; De Groot, R.S.; Van Ierland, E.C. Spatial scales, stakeholders and the valuation of ecosystem services. Ecol. Econ. 2006, 57, 209–228. [Google Scholar] [CrossRef]
  31. Hein, L.; van Koppen, C.K.; van Ierland, E.C.; Leidekker, J. Temporal scales, ecosystem dynamics, stakeholders and the valuation of ecosystems services. Ecosyst. Serv. 2016, 21, 109–119. [Google Scholar] [CrossRef]
  32. Cisneros-Montemayor, A.M.; Moreno-Báez, M.; Reygondeau, G.; Cheung, W.W.; Crosman, K.M.; González-Espinosa, P.C.; Lam, V.W.; Oyinlola, M.A.; Singh, G.G.; Swartz, W. Enabling conditions for an equitable and sustainable blue economy. Nature 2021, 591, 396–401. [Google Scholar] [CrossRef]
  33. Xiao, L.M.; Zhang, X.P. Spatio-temporal characteristics of coupling coordination between green innovation efficiency and ecological welfare performance under the concept of strong sustainability. J. Nat. Resour. 2019, 34, 312–324. [Google Scholar] [CrossRef]
  34. Shi, T.; Yang, S.Y.; Zhang, W.; Zhou, Q. Coupling coordination degree measurement and spatiotemporal heterogeneity between economic development and ecological environment—Empirical evidence from tropical and subtropical regions of China. J. Clean. Prod. 2020, 244, 118739. [Google Scholar] [CrossRef]
  35. Fang, C.L.; Zhou, C.H.; Gu, C.L.; Chen, L.D.; Li, S.C. Theoretical analysis of interactive coupled effects between urbanization and eco-environment in mega-urban agglomerations. Acta Geogr. Sin. 2016, 71, 531–550. [Google Scholar] [CrossRef]
  36. Wang, S.J.; Kong, W.; Ren, L.; Zhi, D.D.; Dai, B.T. Research on misuses and modification of coupling coordination degree model in China. J. Nat. Resour. 2021, 36, 793–810. [Google Scholar] [CrossRef]
  37. Soille, P.; Vogt, P. Morphological segmentation of binary patterns. Pattern Recognit. Lett. 2009, 30, 456–459. [Google Scholar] [CrossRef]
  38. Iwanowski, M. Morphological classification of binary image pixels. Mach. Graph. Vis. 2009, 18, 155–173. [Google Scholar]
  39. Han, D.; Yu, D.; Qiu, J. Assessing coupling interactions in a safe and just operating space for regional sustainability. Nat. Commun. 2023, 14, 1369. [Google Scholar] [CrossRef] [PubMed]
  40. Yang, P.F.; Jiao, Z.F. Application of coupling method of eco-socioeconomic system in national territory spatial ecological restoration planning system of counties: A case study of Weiyuan county. J. Nat. Resour. 2021, 36, 2308–2319. [Google Scholar]
  41. Gao, Q.; Pan, R.; Yang, Y.D.; Jiang, D.G. Territory space use governance system at city level, Hangzhou. Planners 2021, 37, 49–54. [Google Scholar]
  42. Li, D.L.; Cao, L.J.; Zhou, Z.H.; Zhao, K.K.; Du, Z.N.; Han, K.Q. Coupling coordination degree and driving factors of new-type urbanization and low-carbon development in the Yangtze River Delta: Based on nighttime light data. Environ. Sci. Pollut. Res. 2022, 29, 81636–81657. [Google Scholar] [CrossRef] [PubMed]
  43. Li, T.N.; Li, D.Z.; Liang, D.L.; Huang, S.M. Coupling coordination degree of ecological-economic and its influencing factors in the counties of Yangtze River Economic Belt. Sustainability 2022, 14, 15467. [Google Scholar] [CrossRef]
  44. Li, J.S.; Sun, W.; Li, M.Y.; Meng, L.L. Coupling coordination degree of production, living and ecological spaces and its influencing factors in the Yellow River Basin. J. Clean. Prod. 2021, 298, 126803. [Google Scholar] [CrossRef]
  45. Wu, Y.; Tam, V.W.; Shuai, C.Y.; Shen, L.Y.; Zhang, Y.; Liao, S.J. Decoupling China’s economic growth from carbon emissions: Empirical studies from 30 Chinese provinces (2001–2015). Sci. Total Environ. 2019, 656, 576–588. [Google Scholar] [CrossRef] [PubMed]
  46. Shang, Y.F.; Zhu, L.R.; Qian, F.B.; Xie, Y.N. Role of green finance in renewable energy development in the tourism sector. Renew. Energy 2023, 206, 890–896. [Google Scholar] [CrossRef]
  47. Tao, D.K.; Zhou, W.L. An Evaluation and Optimization of Green Development Strategy for the Nanjing-Hangzhou Eco-Economic Zone in China. Sustainability 2022, 14, 17002. [Google Scholar] [CrossRef]
  48. Zhao, Z.Y.; Wang, H.R.; Zhang, L.; Liu, X. Synergetic Development of “Water Resource-Water Environment-Socioeconomic Development” Coupling System in the Yangtze River Economic Belt. Water 2022, 14, 2851. [Google Scholar] [CrossRef]
  49. Fan, Y.P.; Fang, C.L.; Zhang, Q. Coupling coordinated development between social economy and ecological environment in Chinese provincial capital cities-assessment and policy implications. J. Clean. Prod. 2019, 229, 289–298. [Google Scholar] [CrossRef]
Figure 1. Box plots of data standardization results. The box in the figure represents the interquartile range (IQR) between the first quartile (Q1) and the third quartile (Q3). The continuous line enclosed within the box corresponds to the median, whereas the dash-dotted line represents the mean. The “whiskers” extend from the box to the minimum and maximum values within a defined range. The calculation formula for the lower whiskers is Q1–1.5IQR, and the calculation formula for the upper whiskers is Q3 + 1.5IQR. Data points that markedly exceed the whiskers are considered outliers. The dataset within each box plot comprises all data related to the respective index, spanning across all study years and regions. Detailed specifications for the indices corresponding to the index codes are provided in Table 2. To enhance the intuitive comparison of data distribution characteristics across different indices, the original data underwent a standardization process.
Sustainability 15 16570 g001
Figure 2. Overview of the study area. The Digital Elevation Model (DEM) was employed to depict the topographic surface of the earth’s bare ground within the study area. The terrain is symbolized by a gradient color scale, transitioning from green to red to denote elevational changes from low to high. The figure also delineates the spatial distribution details of various research units and the geographical location of the entire study area in China.
Sustainability 15 16570 g002
Figure 3. Changes in the comprehensive score of economic development subsystem in each region from 2010 to 2020. The bar chart employs distinct colors to signify the total scores of the three first level indices.
Sustainability 15 16570 g003
Figure 4. Changes in the comprehensive score of the ecological environment subsystem in each region from 2010 to 2020. The bar chart employs distinct colors to signify the total scores of the two first level indices.
Sustainability 15 16570 g004
Figure 5. Spatial distribution of economic subsystem scores. Natural breaks (Jenks) are employed to categorize the comprehensive scores of the economic development system for each region across all years into five levels, ranging from small to large. These scores, corresponding to different levels, are then depicted on the administrative division map using distinct colors.
Sustainability 15 16570 g005
Figure 6. Spatial distribution of ecological subsystem scores. Natural breaks (Jenks) are employed to categorize the comprehensive scores of the ecological environment system for each region across all years into five levels, ranging from small to large. These scores, corresponding to different levels, are then depicted on the administrative division map using distinct colors.
Sustainability 15 16570 g006
Figure 7. Variations in CCD in each year. Polylines of distinct colors depict variations in the coupling coordination degree for the respective region from 2010 to 2020.
Sustainability 15 16570 g007
Figure 8. Levels of CCD by region from 2010 to 2020. Aligning the computed coupling coordination degree with the classification standards outlined in Table 1, the coupling coordination degree levels for each region from 2010 to 2020 are derived. These are presented on the administrative division map using distinct colors to elucidate the spatial characteristics of changes in coupling coordination levels. Notably, as uncoordinated development is absent in the study area, the legend encompasses only four types of coordinated development.
Sustainability 15 16570 g008
Figure 9. Changes in land use status in Hangzhou from 2010 to 2020.
Sustainability 15 16570 g009
Figure 10. Changes in Hangzhou’s morphological spatial pattern from 2010 to 2020.
Sustainability 15 16570 g010
Table 1. Classification of coupling coordination level.
First ClassificationSecond Classification
DCoupling Coordination Level
Low coupling coordination[0, 0.3]Seriously uncoordinated development
Moderate coupling coordination(0.3, 0.4]Moderately uncoordinated development
(0.4, 0.5]Slightly uncoordinated development
High coupling coordination(0.5, 0.6]Barely coordinated development
(0.6, 0.7]Slightly coordinated development
(0.7, 0.8]Favorably coordinated development
Extreme coupling coordination(0.8, 1.0]Superiorly coordinated development
Table 2. Ecological–economic system coupling coordination analysis index system.
SystemFirst Level IndicesSecondary Level IndicesUnitIndex CodeWeight
Economic development systemEconomic scaleGDP per capitaCNY/personX10.153
Local fiscal revenue per capitaCNY/personX20.285
GDP growth rate%X30.033
Per capita disposable incomeCNYX40.131
Economic structureSecond industry GDP growth rate%X50.030
Tertiary industry GDP growth rate%X60.050
Economic benefitReduction rate of energy consumption per unit GDP%X70.085
Water consumption per 10,000 yuan of GDPcubic meters/CNY 10,000 X80.071
Urbanization rate%X90.162
Ecological environment systemEcological statusForest cover rate%Y10.127
Centralized treatment rate of urban domestic sewage%Y20.128
Comprehensive utilization rate of general industrial solid waste%Y30.103
Proportion of rivers with Class I and II water quality%Y40.072
Number of days with good ambient airdayY50.056
Environmental constructionGreen coverage rate of built-up areas%Y60.142
Park green space per capitasquare metersY70.140
Proportion of environmental protection investment in public budget expenditure%Y80.232
Table 3. Comprehensive evaluation results of subsystems in each year.
System TypeRegion201020122014201620182020
Economic development SystemHangzhou Urban Area0.5030.5870.6810.7910.8630.914
Tonglu County0.2660.3360.3940.4450.4930.483
Chun’an County0.1490.1860.2640.2940.2670.241
Jiande0.1730.2470.2740.3720.3460.359
Ecological environment SystemHangzhou Urban Area0.4100.3620.2950.3110.3430.540
Tonglu County0.3710.4600.3980.4930.4640.557
Chun’an County0.4840.3730.6390.5410.5580.799
Jiande0.3870.3990.4480.4930.6140.618
Table 4. Coupling coordination evaluation results.
Region201020122014201620182020
Hangzhou Urban Area0.6740.6790.6690.7040.7370.838
Tonglu County0.5600.6270.6290.6840.6910.720
Chun’an County0.5180.5130.6410.6310.6210.662
Jiande0.5090.5600.5920.6540.6790.686
Table 5. Changes in landscape elements of MSPA in Hangzhou.
Landscape Type20102020
Area (hm2)Proportion of Study AreaArea (hm2)Proportion of Study Area
Core1,573,179.3993.485%1,510,266.2489.545%
Islet115.740.007%112.140.007%
Loop416.340.025%496.080.029%
Bridge183.150.011%462.780.027%
Perforation11,342.070.674%18,766.531.113%
Edge5944.680.353%9272.520.550%
Branch1511.730.090%2684.340.159%
Background90,121.955.355%144,530.468.569%
Disclaimer/Publisher’s Note: The statements, opinions and data contained in all publications are solely those of the individual author(s) and contributor(s) and not of MDPI and/or the editor(s). MDPI and/or the editor(s) disclaim responsibility for any injury to people or property resulting from any ideas, methods, instructions or products referred to in the content.

